Embed Size (px)
Citation preview
Pan-Canadian Assessment Program (PCAP)
Mathematics Assessment Framework
Table of Contents
Introduction ........................................................................................................... 1 What is PCAP? .............................................................................................................. 1
PCAP Mathematics Framework ............................................................................... 1 Development of the PCAP Mathematics Framework – Theory and Assumptions ...... 1 Domain Assumptions ................................................................................................... 1 Assessment Assumptions ............................................................................................. 2 Large-Scale Assessment in Mathematics ..................................................................... 2
School Achievement Indicators Program (SAIP)...................................................... 2 Programme for International Student Assessment (PISA) ...................................... 2 Trends in Mathematics and Science Survey (TIMSS) .............................................. 3
Mathematics within the Jurisdictions .......................................................................... 3 National Council of Teachers of Mathematics (NCTM) Standards .............................. 3 Working Definition of Mathematics ............................................................................. 4 Scope, Limitations, and Purposes of the Assessment .................................................. 5
Assessment Design ................................................................................................. 6 General Design of the Assessment............................................................................... 6 Task Characteristics ...................................................................................................... 6 Recommended Item Format and Item Type ................................................................ 7
Selected-Response Items ........................................................................................ 7 Constructed-Response Items .................................................................................. 7
Specific Considerations ................................................................................................ 8 Assessment Standards ................................................................................................. 8
What the Assessment Measures ............................................................................. 9 Specific Conceptual and Procedural Knowledge Being Assessed ................................ 9
Numbers and Operations ........................................................................................ 9 Geometry and Measurement ................................................................................ 10 Patterns and Relationships .................................................................................... 10 Data Management and Probability ....................................................................... 11 Problem Solving ..................................................................................................... 12 Reasoning and Proof.............................................................................................. 12 Communication ..................................................................................................... 12 Connections ........................................................................................................... 13 Representation ...................................................................................................... 13 Cognitive Categories .............................................................................................. 13
Assessment Specifications .................................................................................... 15 Item Type Distribution ............................................................................................... 15 Subdomains ................................................................................................................ 15 Cognitive Demands .................................................................................................... 15 Reporting the Mathematics Assessment Results....................................................... 15 Reporting on Performance Scales .............................................................................. 16 Secondary Analysis ..................................................................................................... 16
Glossary ............................................................................................................... 17 References ............................................................................................................ 19
Introduction
What is PCAP?
The Pan-Canadian Assessment Program (PCAP) is the continuation of CMEC’s commitment to inform Canadians about how well their education systems are meeting the needs of students and society. The information gained from this pan-Canadian assessment provides ministers of education with a basis for examining the curriculum and other aspects of their school systems. School-curriculum programs vary from jurisdiction to jurisdiction across the country, so comparing results from these varied programs is a complex task. However, young Canadians in different jurisdictions learn many similar skills in mathematics, reading, and science. PCAP has been designed to determine whether students across Canada reach similar levels of performance in these core disciplines at about the same age, and to complement existing assessments in each jurisdiction so they have comparative Canada-wide data on the achievement levels attained by Grade 81 students across the country. PCAP, which replaces an earlier assessment called the Student Achievement Indicators Program (SAIP), is coordinated by CMEC.
PCAP Mathematics Framework
The development of a new pan-Canadian assessment of mathematics is a result of the jurisdictions’ desire to gather information that would allow them to evaluate their mathematics programs and curricula in relation to national and international assessment results.
Development of the PCAP Mathematics Framework – Theory and Assumptions
The development of the PCAP Mathematics Framework is informed by a literature review of mathematics assessments and test design (CMEC, 2005) and common pan-Canadian curricular components.2 There are two types of assumptions to be considered in the preparation of this framework: assumptions about the learning of the domain assessed (in this case mathematics) and about the assessment itself.
Domain Assumptions
• The learning of mathematics is a process in which students link and build on previously learned concepts and procedures so that their understanding and knowledge of mathematics become deeper and more refined, as does their ability to apply the mathematics they have learned.
1 Grade 8 refers to Secondary Two in Quebec throughout this document. 2 For updated mathematics curricula, please visit official jurisdictional Web sites.
2
• Students learn more complex concepts and procedures by connecting to existing knowledge through meaningful experiences.
• A well-articulated mathematics curriculum places concepts and procedures along a continuum. Student mastery of these concepts and procedures and the level of development of competencies in them will also be placed along this continuum.
• Although the domain is divided into separate subdomains (strands of the curriculum), the content of the subdomains is often interwoven and dependent, as are associated concepts and procedures. The evaluation of certain content and associated concepts and procedures cannot be done in isolation.
Assessment Assumptions
• Although the assessment is administered to Grade 8 students, it also assesses the concepts and procedures learned in earlier grades.
• The assessment will be administered in all jurisdictions. • PCAP is not a student assessment but a program assessment. • Jurisdictions want enough information at the domain level to reliably identify
strengths and weaknesses in their programs.
Large-Scale Assessment in Mathematics
The mathematics assessment framework is based on three major mathematics assessments, namely the School Achievement Indicators Program (SAIP), the Programme for International Student Assessment (PISA), and the Trends in Mathematics and Science Survey (TIMSS). It is also closely aligned with the jurisdictions’ own curricula which generally have been guided by National Council of Teachers of Mathematics (NCTM) standards as articulated in the Principles and Standards for School Mathematics (NCTM, 2000) and Curriculum Focal Points for Prekindergarten through Grade 8 Mathematics (NCTM, 2006). School Achievement Indicators Program (SAIP) The SAIP mathematics content component was designed to evaluate levels attained by 13- and 16-year-old students on numbers and operations, algebra and functions, measurement and geometry, data management and statistics, and problem solving. SAIP reported on students’ overall performance in mathematics (CMEC, 2002). Programme for International Student Assessment (PISA)
PISA assesses 15-year-old students’ performance in mathematical literacy. It broadly defines mathematical literacy as “an individual’s capacity to identify and understand the role that mathematics plays in the world, to make well-founded judgments, and to use and engage with mathematics in ways that meet the needs of that individual’s life as a constructive, concerned, and reflective citizen” (OECD, 2003, p. 15). PISA reports on the
3
students’ performance in mathematics overall, as well as producing separate scales for space and shape, change and relationships, quantity, and uncertainty. Trends in Mathematics and Science Survey (TIMSS) The TIMSS mathematics assessment framework is structured around mathematical content and cognitive processes. Numbers, algebra, measurement, geometry, and data are the five subdomains covered by the assessment. The four cognitive processes identified are knowing facts and procedures, using concepts, solving routine problems, and reasoning. These subdomains and cognitive processes assess a student’s ability to draw upon relevant mathematical knowledge and efficient and accurate computational skills; link mathematical facts to make extensions beyond current knowledge; use mathematics to solve problems based on familiar settings; and apply logical and systematic thinking to unfamiliar situations. TIMSS reports on the students’ performance overall in mathematics, as well as on each one of the subdomains and cognitive domains. In Canada, TIMSS assesses the performance of students in Grade 4 (9-year-olds) and Grade 8 (13-year-olds) in mathematics and science.
Mathematics within the Jurisdictions
Mathematics curricula within the various jurisdictions in Canada are structured around content strands (referred to as subdomains in the PCAP Mathematics Assessment Framework) that specify the conceptual and procedural knowledge that students should acquire in school mathematics. They provide a comprehensive foundation for all students to reason and communicate mathematically and use mathematics knowledge and skills effectively in postsecondary education, the workplace, and daily life. The content strands are generally defined in the jurisdictions as: number and operations, patterns and relations, shape and space, data management and probability. Each jurisdiction defines a number of mathematical processes deemed to be essential to the effective study of mathematics. These generally include problem solving, reasoning, making connections within and outside the discipline, representing, and communicating. The processes reflect the manner through which students acquire and apply mathematical knowledge and skills and are interwoven throughout the content strands.
National Council of Teachers of Mathematics (NCTM) Standards
Many jurisdictions use the Principles and Standards for School Mathematics (NCTM, 2000) and Curriculum Focal Points for Prekindergarten through Grade 8 Mathematics (NCTM, 2006) as a starting point or guide for the development of their mathematics programs. NCTM presents 10 standards, five of which relate to content and five to process standards. The content standards are numbers and operations, algebra, geometry, measurement, and data analysis, while the five process standards relate to problem solving, reasoning and proof, communication, connections, and representation. Each jurisdiction then defines mathematics to suit the needs of its population and ministerial or departmental philosophy.
4
Working Definition of Mathematics
Mathematics can be defined in a variety of ways. The Report of the Expert Panel on Student Success in Ontario (Ontario Ministry of Education, 2004) states that mathematics “is a fundamental human endeavour that empowers individuals to describe, analyse, and understand the world we live in” (Ontario Ministry of Education, 2004, p. 9). Most dictionaries define mathematics as “the study of the measurement, properties, and relationships of quantities and sets, using numbers and symbols” (The Free Dictionary) or “the abstract science of number, quantity, and space studied in its own right or as applied to other disciplines such as physics, engineering, etc.” (Concise Oxford Dictionary of Current English, 1990). The publication Everybody Counts (National Research Council, 1989) describes mathematics as “the science of pattern and order.” This very simple definition of mathematics challenges a common view of mathematics as a discipline dominated by computation and rules without reasons and instead makes one think of mathematics as a science of things that have a pattern or regularity and logical order. Mathematics is finding and exploring this regularity or order and then making sense of it (Van de walle, 2004). For the purpose of this assessment, mathematics is broadly defined as the study of patterns and relationships and as a discipline involving conceptual understanding, procedural knowledge, and processes. The domain is divided into four strands or subdomains as described below: • numbers and operations (properties, equivalent representations, and magnitude); • geometry and measurement (properties of 2-D figures and 3-D shapes, relative
position, transformations, and measurement); • patterns and relationships (patterns, algebraic equations and expressions, and linear
relations); and • data management and probability (data collection and analysis, experimental and
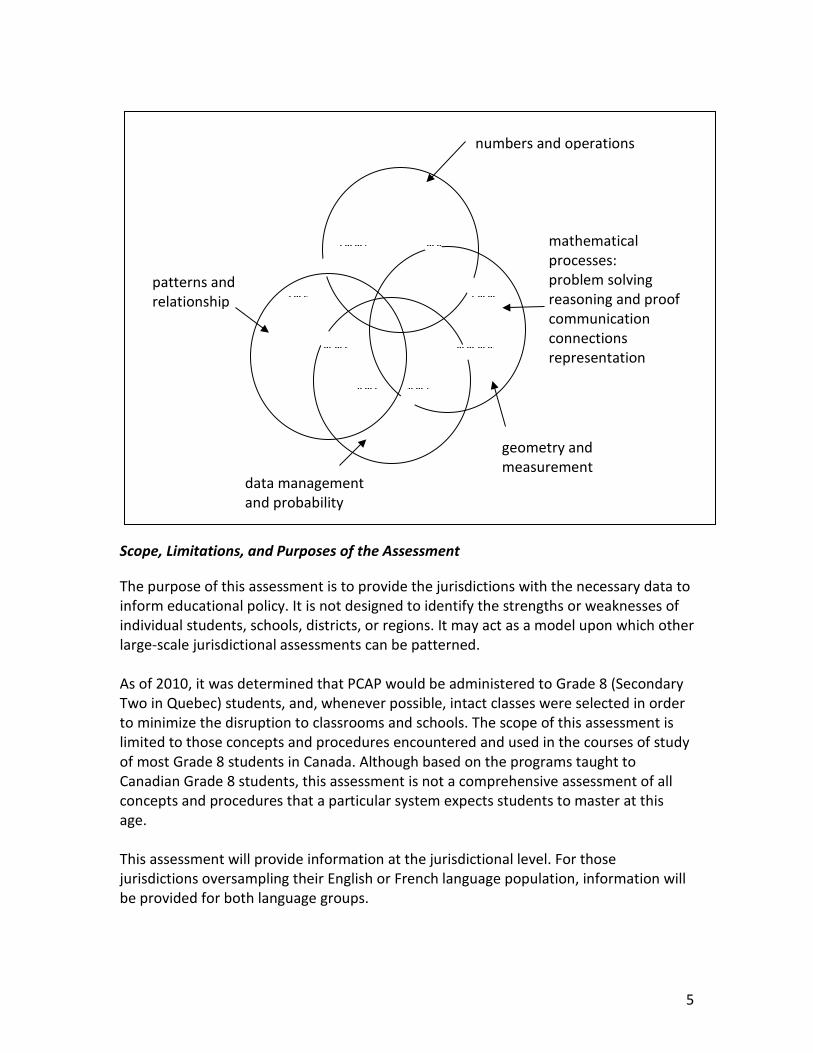
theoretical probability) These subdomains in turn involve the five processes listed below: • problem solving • reasoning and proof • communication • connections • representation The subdomains are traditional groupings of conceptual and procedural knowledge as outlined in this framework, and the processes are present in all subdomains. As illustrated in the diagram below, concepts and procedures of the subdomains intersect, while the processes are interwoven through all subdomains.
5
Scope, Limitations, and Purposes of the Assessment
The purpose of this assessment is to provide the jurisdictions with the necessary data to inform educational policy. It is not designed to identify the strengths or weaknesses of individual students, schools, districts, or regions. It may act as a model upon which other large-scale jurisdictional assessments can be patterned. As of 2010, it was determined that PCAP would be administered to Grade 8 (Secondary Two in Quebec) students, and, whenever possible, intact classes were selected in order to minimize the disruption to classrooms and schools. The scope of this assessment is limited to those concepts and procedures encountered and used in the courses of study of most Grade 8 students in Canada. Although based on the programs taught to Canadian Grade 8 students, this assessment is not a comprehensive assessment of all concepts and procedures that a particular system expects students to master at this age. This assessment will provide information at the jurisdictional level. For those jurisdictions oversampling their English or French language population, information will be provided for both language groups.
mathematical processes: problem solving reasoning and proof communication connections representation
numbers and operations
data management and probability
patterns and relationship
geometry and measurement
6
Assessment Design
General Design of the Assessment
To permit enough data points for secondary analysis, the PCAP Mathematics Assessment will be organized into eight groups or clusters of items. TIMSS has 14 mathematics clusters distributed in seven booklets to assess Grade 8 students’ mathematical knowledge and skills. PISA has nine mathematics clusters in 13 booklets when it is the major component and five clusters in 13 booklets when it is a minor component. Each PCAP mathematics cluster will be made up of items spanning all four subdomains and five processes. Clusters will be designed so that a student would need approximately 30 minutes to complete all of the items in any one cluster. The clusters may contain selected-response items, short-constructed-response items, and extended-constructed-response items. The number of items per cluster may vary slightly, depending on the distribution of item types in the cluster. No cluster would contain only one type of item. When mathematics is the primary domain, the student will complete two of the eight clusters of assessment items with the common items distributed in cluster pairs. When mathematics is a minor domain, selected concepts and procedures in mathematics that cross over all strands — for example, proportionality — will be chosen as the focus of the assessment. Not all eight clusters may be needed to report on the mathematics domain generally. Items common to all clusters will support accurate estimations of students’ performance on those items from the other clusters. The assessment should be accessible to all participating students; therefore, the reading level and vocabulary used will be consistent with what can be expected of Canadian Grade 8 students. As well, information in the items will be represented in a variety of modes (e.g., graphical, tabular, symbolical, written). English and French versions of the assessment will be equivalent.
Task Characteristics
Items will be developed to assess the various concepts and procedures that are taught in mathematics and will focus on those that have relevance for the context of the assessment cluster. Item clusters could include items from all four subdomains. Items related to the processes of problem solving, communication, representation, reasoning and proof, and connections will be present in all item clusters and across all subdomains. One area of concern for any low-stakes, large-scale assessment program is student motivation and engagement in the assessment. The contextualization of assessment items is often used to help encourage this engagement and motivation. Contexts must
7
be drawn from situations that are relevant, appropriate, and sensible for the world in which Grade 8 students live. Possible contexts could be from the students’ personal lives, from school, sports, leisure, or media events, or on a larger scale from the community and society. Contexts must also be sensitive to linguistic and cultural differences. A context should be presented as a brief narrative and could include photos, tables, charts, graphs, or diagrams. The development of contexts should be done in close cooperation with all three PCAP development teams (reading, science, and mathematics) so that most contexts can be shared across domains. In any assessment, while the contexts that students are given may be artificial and attempt to emulate the world outside of the classroom, in reality they must link well with the important mathematical concepts in the assessment. For some items, student engagement may not require any particular context.
Recommended Item Format and Item Type
Selected-Response Items Selected-response (SR) items give the students specific choices from which they must select a response. These items include multiple-choice, check boxes, circling part of the text, true-false statements, yes-no observations, and drawing lines connecting words and statements. Multiple-choice items will include a stem statement with four choices. The stem must be clear, and the wording must let students know exactly what is being asked in a context that precedes the assessment items. The response choices will be independent, and their length should be kept fairly consistent. Plausible distractors will be used, preferably those based on common student errors or misconceptions. This will permit a secondary analysis of the responses to the distractors in order to identify areas of concern. Constructed-Response Items Constructed-response (CR) items require responses ranging from single words or phrases to extended, constructed responses of two to three sentences. For mathematics, these responses can also include symbols, numbers, graphs, diagrams, and calculations. Those items that require one- to three-line responses from students will be used to measure levels of cognitive skills, content knowledge, and processes such as reasoning and communication that selected-response items cannot measure as effectively. Double-digit coding can be used with constructed-response items to collect information about the processes and strategies students apply to problem solving. This value-added information is important in analyses of student responses in order to identify and correct students’ misconceptions or misunderstandings in their mathematical learning.
8
Specific Considerations
a) Use of calculators: This assessment does not focus on students’ ability to perform calculations but rather on their ability to choose the appropriate operation, demonstrate their understandings, and assess the relevance of their answer in a given situation. All students should, therefore, be allowed to use a calculator, preferably of the type they would normally use in their mathematics class. The decision to use or not to use a calculator should be the student’s. Using or not using a calculator should have no effect on the student’s performance on this assessment, and this must be a consideration in item design.
b) Use of computers: Computers will not be permitted for this assessment. Although
computers have become commonplace in all Canadian schools, the large disparity between the types of computers available, their use as a teaching tool, and the students’ familiarity with software could contribute to a biased administration of the assessment if computers were permitted.
c) Use of manipulatives: The use of manipulatives (concrete objects) as teaching tools
is encouraged in all jurisdictions, and they should be found in all schools. They should help and support students in developing a better understanding of concepts as they go from concrete to abstract representations. The assessment will be designed so that manipulatives are not supplied or required to perform the assessment tasks, but they will be permitted if the student requests them. They will be limited to what is normally available to the students in their mathematics class.
Assessment Standards
The assessment standards will be developed after the assessment items have been developed and field tested. This being said, most mathematics programs are designed so as to permit the maximum number of students to be at the middle and high levels of cognition. Therefore, it is felt that most Grade 8 students should perform at these levels.
9
What the Assessment Measures
Specific Conceptual and Procedural Knowledge Being Assessed
Numbers and Operations
The student shows evidence that he or she can: • demonstrate an understanding of the inverse relationship between perfect squares
and square roots, multiplication and division, and addition and subtraction; • find the exact square root of numbers that are perfect squares and the approximate
square root of numbers that are not perfect squares; • demonstrate an understanding of and find factors for numbers less than 100; • find prime factorization of composite numbers and use it to find least common
multiples of numbers less than 100; • order and compare positive fractions and positive and negative decimals; • generate equivalent expressions for percentages, fractions, and decimals; • represent rational numbers with diagrams and on a number line; • explain and apply the order of operations for decimals, fractions, and integers; • demonstrate an understanding of the four operations (+,‒, ×, ÷) on positive fractions,
negative and positive decimals (× and ÷ decimals limited to two-digit multipliers and one-digit divisors);
• demonstrate an understanding of the four operations with integers; • select appropriate operations to solve problems involving rational numbers (except
negative fractions) set in contextual situations; • describe ways to estimate sums, differences, products, and quotients of positive
fractions and decimals; • apply the commutative, associative, and distributive properties, and order of
operations to evaluate mathematical expressions; • demonstrate an understanding of percentages greater than or equal to 0%; • demonstrate understanding of proportional relationships using per cent, ratio, and
rate; • use ratio and proportionality to solve problems involving percentages that arise from
real-life contexts, such as discount, interest, taxes, tips, and per cent increase and decrease;
• recognize a proportional relationship from context, table of values, and graph and use to solve contextual problems;
• solve problems using proportional reasoning in the different subdomains, e.g., numbers and operations, geometry, probability.
10
Geometry and Measurement
The student shows evidence that he or she can: • compare and classify 2-D geometric polygons using appropriate geometric vocabulary
and properties, such as line symmetry, angles, and sides; • apply the relationships for intersecting lines, parallel lines and transversals, and the
sum of the angles of a triangle to find the measures of missing angles and solve other problems;
• demonstrate an understanding of congruence of polygons; • draw and describe the image of a combination of translations, rotations, and/or
reflections on a 2-D shape (not on coordinate plane); • identify and plot points in the four quadrants of a Cartesian plane using integral
ordered pairs; • demonstrate an understanding of the relationships among radii, diameter, and
circumference of circles and use these relationships to solve problems; • calculate the measures of the circumference and area of a circle and use the
calculations to solve contextual problems; • calculate the perimeter and the area of triangles, rectangles, and parallelograms and
use the calculations to solve contextual problems; • calculate the surface area of right prisms and pyramids and use the calculations to
solve contextual problems; • identify, use, and convert among SI units to measure, estimate, and solve problems
that relate to length and area.
Patterns and Relationships
The student shows evidence that he or she can: • represent linear patterns and relationships using words, drawings, tables, graphs,
algebraic expressions, and equations; • make connections among various representations of linear relationships (words,
drawings, tables, graphs, algebraic expressions, and equations); • use different representations of linear patterns and relationships to make
generalizations, predict unknown values, and solve problems; • demonstrate an understanding of the different meanings and uses of variables as a
place holder, in rules, in formulae, as changing quantities, and as dependent and independent variables;
• translate statements describing mathematical relationships into one or more algebraic expressions or equations in a variety of contexts;
• evaluate algebraic expressions given the value of the variable within the set of rational numbers (except negative fractions);
• show that two or more expressions are equivalent by using properties such as commutative, associative, distributive, and order of operations;
• show that two equations are equivalent by using properties of equality; order of operations; and commutative, associative, and distributive properties;
11
• distinguish between algebraic expressions and algebraic equations; • solve linear equations using the most appropriate method (concrete, inspection, trial
and error, and algebraic) involving a one-variable term for integral solutions and to verify solutions;
• use linear equations to solve problems involving proportion and measurement problems (area, perimeter, unknown angles of polygons).
Data Management and Probability The student shows evidence that he or she can: collect data • formulate questions for investigation; • select, justify, and use appropriate methods of collecting data (primary and
secondary data; categorical, discrete, continuous data; sampling); • evaluate issues such as sampling, biased and unbiased sampling, and the validity of
an inference.
organize and display data • organize data into intervals; • select, use, and justify an appropriate representation for displaying relationships
among collected data (including circle, line, and bar graphs). analyze data • make inferences and convincing arguments about a problem being investigated
based on an interpretation and analysis of charts, tables, and graphs used to display given or collected data;
• evaluate data interpretations that are based on graphs, tables, and charts.
understand measures of central tendency • describe a set of data and solve problems using mean and range; • compare different populations using the mean and range; • determine the effects of variation in data on measures of central tendency (outliers,
gaps, clusters).
understand probability concepts • identify all possible outcomes of two independent events using tree diagrams, area
models, tables, or lists;
12
• determine probability of a single or two independent events, and describe using fractions, decimals or percentages;
• use the probability of a single or two independent events to make predictions about a population;
• compare theoretical and experimental probabilities of a single and two independent events in appropriate contexts.
The processes: problem solving, reasoning and proof, communication, connections, and representation highlight ways of acquiring and using the content knowledge outlined above. Problem Solving The student shows evidence that he or she can: • solve multi-step problems presented in context that require using and making
connections among mathematical concepts, procedures, and processes; • solve multi-step problems presented in context that show evidence of understanding
the problem, making a plan, carrying out the plan, and evaluating the solution for reasonableness;
• explain the process used to solve a problem and verify the reasonableness of solutions by using numbers, words, pictures/diagrams, symbols and equations;
• apply a variety of problem-solving strategies to solve problems, such as drawing a picture or diagram, looking for a pattern, using “guess and check,” making a table, working a simpler problem, or working backwards.
Reasoning and Proof The student shows evidence that he or she can: • analyze a problem, make and assess conjectures, justify conclusions, and plan and
construct an organized mathematical argument by applying logical reasoning (inductive, deductive) and mathematical knowledge;
• make and test generalizations from patterns and relationships using logical reasoning;
• use counter-examples to evaluate conjectures; • evaluate mathematical arguments; • select and use appropriately various types of reasoning (algebraic, geometric,
proportional, probabilistic, statistical, quantitative) to solve problems presented in context.
Communication The student shows evidence that he or she can: • communicate mathematical ideas and solutions clearly and precisely to others using
appropriate everyday and mathematical language, units of measurement, and a variety of representations (written, graphical, numerical, and algebraic);
13
• formulate clear and complete arguments using a variety of representations (written, graphical, numerical, and algebraic) to justify conjectures and solutions to problem situations;
• use symbolic language of mathematics correctly.
Connections The student shows evidence that he or she can: • recognize and connect mathematical concepts and procedures to contexts outside of
mathematics, such as other curricular areas, personal life, current events, sports, technology, arts and culture, media;
• make connections between different representations (written, graphical, numerical, and algebraic) of mathematical ideas.
Representation The student shows evidence that he or she can: • create and use a variety of representations (written, graphical, numerical, and
algebraic) to organize, record, and communicate mathematical ideas; • connect, compare, and translate among different mathematical representations; • select and apply the appropriate representations to solve problems. Cognitive Categories The cognitive demands were defined by the reasoning required by the student to correctly answer an item, thus referring to the complexity of mental processing that must occur to answer a question, perform a task, or generate a solution. The three categories of cognitive demands are identified as low, moderate, and high. Cognitive Level I (low) The student can: • recall information (facts, procedures, definitions); • identify properties; • recognize an equivalent representation; • perform a specific or routine procedure; • solve a one-step (word) problem; • retrieve information from a table or graph; • identify a simple number or geometric pattern; • draw or measure simple geometric figures; • recognize an example of a concept; • compute a sum/difference/product/quotient; • convert among different representations of a number (fraction, decimal, per cent).
14
Cognitive Level II (moderate) The student can: • apply properties to evaluate an expression or find a measurement or solve a
problem; • represent a situation mathematically in more than one way; • select, use, and interpret different representations depending on the situation; • solve a contextual problem involving the use of more than one mathematical concept
or procedure; • retrieve information from a graph or table or geometric figure and use this
information to solve a problem requiring multiple steps; • extend a number or geometric pattern; • formulate a routine problem given data and conditions; • compare geometric figures or statements; • compare two sets of data using the mean and range of each set; • organize a set of data and construct an appropriate display; • interpret a simple argument; • justify a solution to a problem with one solution.
Cognitive Level III (high) The student can: • analyze properties; • describe how different representations can be used for different purposes; • perform procedures having multiple steps and multiple decision points; • solve an unfamiliar problem; • generalize a pattern and write the rule algebraically; • formulate an original problem given a situation; • analyze a deductive argument; • justify a solution to a problem with multiple solutions; • analyze similarities and differences between procedures and concepts; • describe, compare, and contrast solution methods; • interpret data from a series of data displays; • formulate a mathematical model for a complex situation; • analyze the assumptions made in a mathematical model.
15
Assessment Specifications
Item Type Distribution
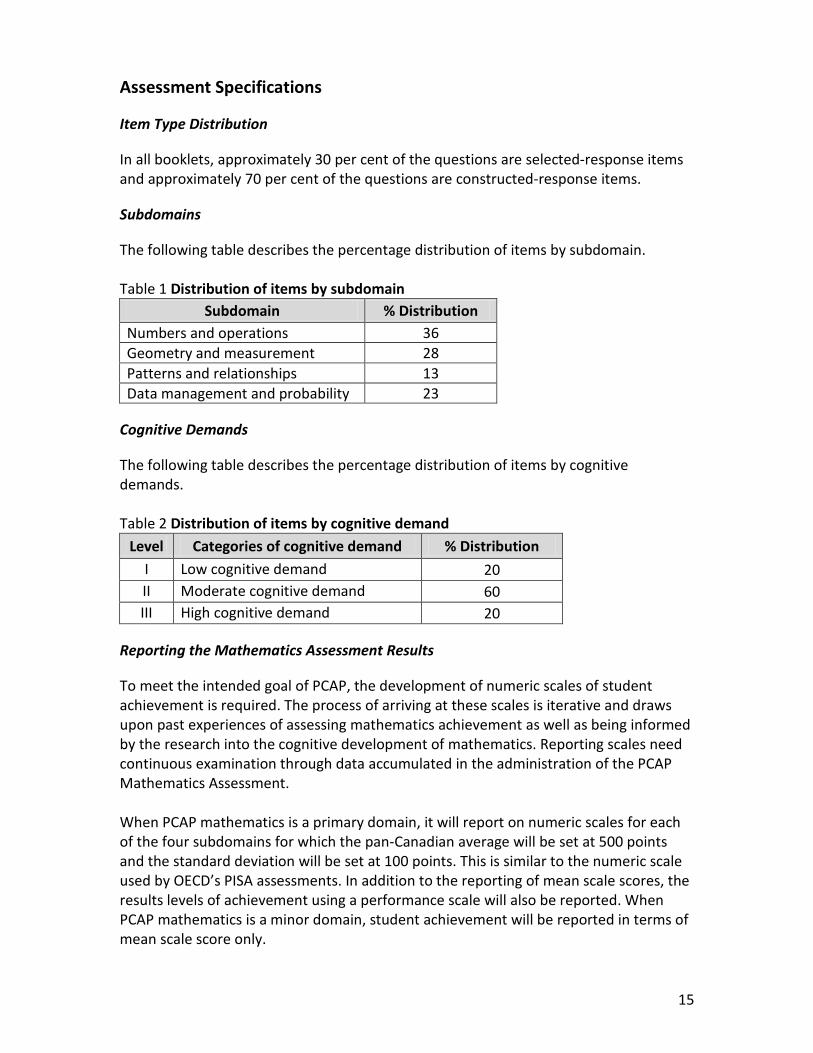
In all booklets, approximately 30 per cent of the questions are selected-response items and approximately 70 per cent of the questions are constructed-response items.
Subdomains
The following table describes the percentage distribution of items by subdomain. Table 1 Distribution of items by subdomain
Subdomain % Distribution Numbers and operations 36 Geometry and measurement 28 Patterns and relationships 13 Data management and probability 23
Cognitive Demands
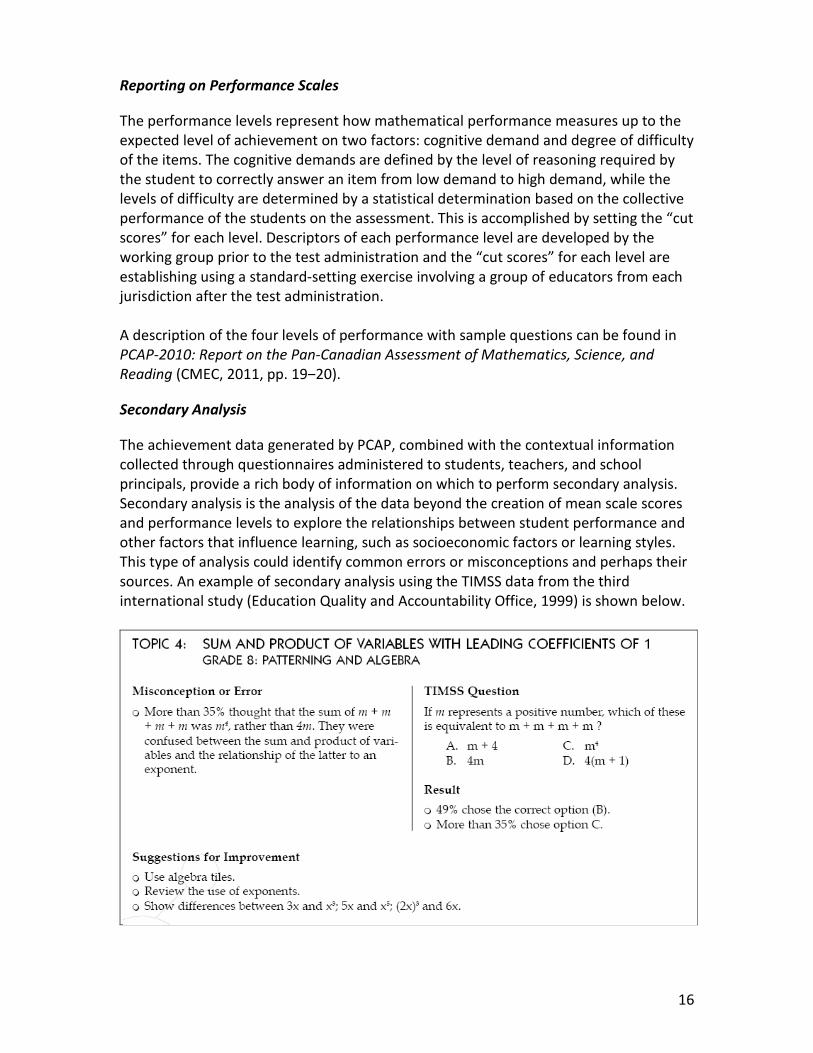
The following table describes the percentage distribution of items by cognitive demands. Table 2 Distribution of items by cognitive demand
Level Categories of cognitive demand % Distribution I Low cognitive demand 20 II Moderate cognitive demand 60 III High cognitive demand 20
Reporting the Mathematics Assessment Results
To meet the intended goal of PCAP, the development of numeric scales of student achievement is required. The process of arriving at these scales is iterative and draws upon past experiences of assessing mathematics achievement as well as being informed by the research into the cognitive development of mathematics. Reporting scales need continuous examination through data accumulated in the administration of the PCAP Mathematics Assessment. When PCAP mathematics is a primary domain, it will report on numeric scales for each of the four subdomains for which the pan-Canadian average will be set at 500 points and the standard deviation will be set at 100 points. This is similar to the numeric scale used by OECD’s PISA assessments. In addition to the reporting of mean scale scores, the results levels of achievement using a performance scale will also be reported. When PCAP mathematics is a minor domain, student achievement will be reported in terms of mean scale score only.
16
Reporting on Performance Scales
The performance levels represent how mathematical performance measures up to the expected level of achievement on two factors: cognitive demand and degree of difficulty of the items. The cognitive demands are defined by the level of reasoning required by the student to correctly answer an item from low demand to high demand, while the levels of difficulty are determined by a statistical determination based on the collective performance of the students on the assessment. This is accomplished by setting the “cut scores” for each level. Descriptors of each performance level are developed by the working group prior to the test administration and the “cut scores” for each level are establishing using a standard-setting exercise involving a group of educators from each jurisdiction after the test administration. A description of the four levels of performance with sample questions can be found in PCAP-2010: Report on the Pan-Canadian Assessment of Mathematics, Science, and Reading (CMEC, 2011, pp. 19‒20).
Secondary Analysis
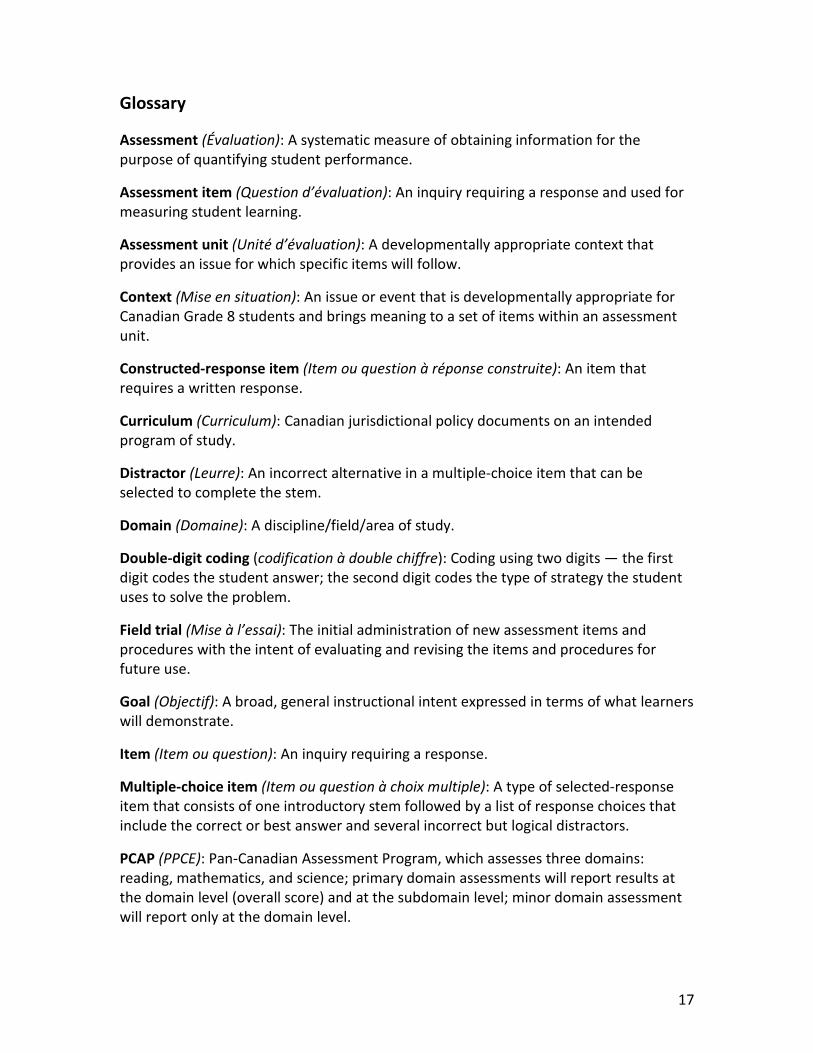
The achievement data generated by PCAP, combined with the contextual information collected through questionnaires administered to students, teachers, and school principals, provide a rich body of information on which to perform secondary analysis. Secondary analysis is the analysis of the data beyond the creation of mean scale scores and performance levels to explore the relationships between student performance and other factors that influence learning, such as socioeconomic factors or learning styles. This type of analysis could identify common errors or misconceptions and perhaps their sources. An example of secondary analysis using the TIMSS data from the third international study (Education Quality and Accountability Office, 1999) is shown below.
17
Glossary
Assessment (Évaluation): A systematic measure of obtaining information for the purpose of quantifying student performance.
Assessment item (Question d’évaluation): An inquiry requiring a response and used for measuring student learning.
Assessment unit (Unité d’évaluation): A developmentally appropriate context that provides an issue for which specific items will follow.
Context (Mise en situation): An issue or event that is developmentally appropriate for Canadian Grade 8 students and brings meaning to a set of items within an assessment unit.
Constructed-response item (Item ou question à réponse construite): An item that requires a written response.
Curriculum (Curriculum): Canadian jurisdictional policy documents on an intended program of study.
Distractor (Leurre): An incorrect alternative in a multiple-choice item that can be selected to complete the stem.
Domain (Domaine): A discipline/field/area of study.
Double-digit coding (codification à double chiffre): Coding using two digits — the first digit codes the student answer; the second digit codes the type of strategy the student uses to solve the problem.
Field trial (Mise à l’essai): The initial administration of new assessment items and procedures with the intent of evaluating and revising the items and procedures for future use.
Goal (Objectif): A broad, general instructional intent expressed in terms of what learners will demonstrate.
Item (Item ou question): An inquiry requiring a response.
Multiple-choice item (Item ou question à choix multiple): A type of selected-response item that consists of one introductory stem followed by a list of response choices that include the correct or best answer and several incorrect but logical distractors.
PCAP (PPCE): Pan-Canadian Assessment Program, which assesses three domains: reading, mathematics, and science; primary domain assessments will report results at the domain level (overall score) and at the subdomain level; minor domain assessment will report only at the domain level.
18
PCAP Mathematics (PPCE Mathématiques): The mathematics assessment of Canadian Grade 8 students (Secondary Two in Quebec) conducted under the Pan-Canadian Assessment Program (PCAP).
PISA 2003: Programme for International Student Assessment that took place in 2003, and in which mathematics was the major focus.
Reporting scale (Échelle de notation): Value assigned to measure students’ performance for assessing subdomains (numbers and operations, geometry and measurement, patterns and relationships, data management and probability) and processes (problem solving, reasoning and proof, communication, connections, and representation) that can be used to summarize levels of mathematical performance.
Response choice (Choix de réponse): An alternative in a multiple-choice item that can be selected to complete the stem.
Secondary analysis (analyse secondaire): Analysis of the data beyond the creation of performance levels to explore the relationships between student performance and other factors taken from the background questionnaires or to identify common errors or misconceptions.
Selected-response item (Item ou question à réponse choisie): An item that presents alternative responses from which the student chooses the correct or preferred answer.
Scoring (Notation): The process of assigning numbers to reflect students’ performance on an assessment item.
Subdomain (Sous-domaine): A component of a domain.
Table of specifications (Tableau de spécifications): A guide for assessment that indicates the emphasis that should be placed on the measurement of students’ understandings within various learning domains.
Validity (Validité): The degree to which items measure what they are intended to measure and the extent to which inferences and actions made on the basis of assessment scores are appropriate and accurate.
19
References
Concise Oxford Dictionary of Current English (8th ed.). (1990). Oxford: Clarendon Press. Council of Ministers of Education, Canada. (2011). PCAP-2010: Report on the pan-Canadian assessment of mathematics, science, and reading. Toronto: Author. Council of Ministers of Education, Canada. (2005). Pan-Canadian assessment program: literature review of mathematics assessment and test design. Toronto: Author. Council of Ministers of Education, Canada. (2002). School achievement indicators program (SAIP) mathematics III assessment (2001). Toronto: Author. Education Quality and Accountability Office. (1999). A focus on effective mathematics and science teaching: Grade 8 mathematics and science. Toronto: Author. National Council of Teachers of Mathematics. (2000). Principles and standards for school mathematics. Reston, VA: Author. National Council of Teachers of Mathematics. (2006). Curriculum focal points for prekindergarten through grade 8 mathematics. Reston, VA: Author. National Research Council. (1989). Everybody counts ‒ A report to the nation on the future of mathematics education. Washington, DC: National Academy Press. Organisation for Economic Co-operation and Development. (2003). PISA 2003 assessment framework: Mathematics, reading, science and problem solving knowledge and skills, 2003. Paris: Author. Ontario Ministry of Education. (2004). Leading math success, mathematical literacy Grades 7–12, The report of the expert panel on student success in Ontario. Toronto: Author. “The Free Dictionary.” Retrieved from www.thefreedictionary.com/mathematics. Van de walle, J.A. (2004). Elementary and middle school mathematics: Teaching developmentally (5th ed.). Boston, MA: Pearson Education Inc.