Embed Size (px)
Citation preview

ICESR2018 International Conference on
Environmental Studies & Research May 7-9, 2018
Abuja FCT, Nigeria
BOOK OF PROCEEDINGS
Vol.1, No.1
Edited by
Professor Jacinta A. Opara

©2018 International Association for Teaching and Learning
All rights reserved
Printed and Published in the Kingdom of Spain
First Published in 2018
Editorial Office
Calle Joan Miro 4 bajo
18140 Granada
Spain
Tel/Fax: 958-59-23-65
The right of the Editor to be identified as the author of this work has been asserted according to relevant EU
laws and regulations. The publication is indexed and registered at Ministry of Culture, Madrid
Typeset and Illustrations by Luis Cabellero(Spain)
Proofreading by Ms Betty Oruhwo and Ozioma Azubuike(Nigeria)
Cover Design by Christophe Guerrero(France)
Project Manager: Dr Joseph Kosu(Ghana)
Project Assistant:Dr Vera Charles-Unadike;Dr Yemisi Olorode and Dr Florence Archibong(Nigeria)
Lithography: Beverly Resources, Spain
Sub-Editing: Dr Dominic Connolly(Ireland)
Media and ICT: Prince Alexis(Ghana)
Project Director : Professor Austin N. Nosike(Spain)
Apart from any fair dealing for the purposes of research or private study, or criticism or review, as
permitted by European Commission, this publication may only be reproduced, stored or transmitted, in
any form or by any means, electronic, mechanical, photocopying, recording or otherwise with the prior
permission in writing of the publishers. The funding of this project and the publication herein is provided
in part by the generous grant from Raphael Nosike Foundation.

President’s Remark
We sincerely welcome you to the International Conference on Environmental Studies and
Research(ICESR2018) holding in Abuja FCT(Nigeria).The conference is organized by African
Association for Teaching and Learning (AATL);African Society for the Scientific
Research(AASR) in cooperation with other institutions.
ICESR2018 provide international forum for those who wish to present their projects and
innovations, having also the opportunity to discuss the main aspects and the latest results. Our
aim is to inspire and provoke crucial discussions and debates. Our event boasts critical thinking
and reconsiders policies and practices.
We seek a diverse and comprehensive program to diffuse interdisciplinary knowledge and
innovations amongst academicians, researchers, policy makers and graduate students covering
several thematic highlights. The program includes a wide range of activities designed to facilitate
the exchange of expertise, experience, and resources amongst colleagues.
The event brought together teachers, scientists, technologists, policy makers and graduate
students from across the globe to promote exchange and discussion of issues relating to the
theme and sub-themes.
We are grateful to our distinguished Keynote Speakers, Special Guests, Programme Committee,
the LOC, delegates for making this event a success.
I on behalf of AATL/ASSR and cooperating partners feel honoured to welcome you all to Abuja,
the Nigerian center of excellence.We wish you all a pleasant stay in Abuja and safe return back
home. We look forward to seeing you again at our next conferences.
Please accept the assurances of our highest regards.
Professor Jacinta A. Opara President, African Association for Teaching and Learning; and
Chairman, Governing Council, Institute of Policy Management Development

International Scientific Commission Professor Richardo R. Saavedra Hidalgo
Universidad Azteca,Chalco-Mexico Professor Jacinta A. Opara
African Association for Teaching and Learning Professor A.O. Akii Ibhadode
Federal University of Petroluem Resources, Effurun-Nigeria Professor M.O.N. Obagah
Ignatius Ajuru University of Education,Port Harcourt, Nigeria Dr Jovan Sopovski
European Scientific Institute, Macedonia Professor Kinikanwo A. Anele
University of Port Harcourt, Nigeria Professor Ugochukwu P.N. Amadi
Michael Okpara University of Agriculture,Umudike-Nigeria Assoc. Professor Asoluka C. Njoku
Alvan Ikoku University of Education, Owerri, Nigeria
Professor Aliyu Yakub Director of Research and Innovation, Federal University, Birnin Kebbi, Nigeria
Professor S.L Kela Deputy Vice Chancellor, Federal University, Kashere-Nigeria
Professor Alice Kagoda Makerere University, Kampala-Uganda.
Professor P. U. Akanwa Dean, College of Business, Imo State University, Owerri-Nigeria
Professor Michael U. Adikwu Vice Chancellor, University of Abuja, Abuja FCT, Nigeria
Professor Cletus Chukwu Moi University, Eldoret-Kenya
Professor M.N. Modebelu Michael Okpara University of Agriculture, Umudike, Nigeria
Associate Prof. Adaku N. Achilike former Deputy Rector, Akanu Ibiam Federal Polytechnic, Afikpo-Nigeria
Professor S.N. Nyakana Makerere University, Kampala-Uganda
Professor Bashir Raji Vice Chancellor, Fountain University, Oshogbo-Nigeria

Associate Prof. S.A. Abere Rivers State University of Science and Technology, Nigeria
Professor Isaac Asuzu former Vice Chancellor, Federal University, Oye-Ekiti, Nigeria
Dr Rose Clarke Nanyonga Vice Chancellor, International Health Sciences University, Kampala-Uganda
Professor Ibrahim A. Njodi Vice Chancellor, University of Maiduguri, Nigeria
Professor Saminu A. Ibrahim Vice Chancellor, Abubakar Tafawa Balewa University, Bauchi-Nigeria
Professor J. Kinanee Ignatius Ajuru University of Education, Port Harcourt, Nigeria
Professor Loveness Kaunda Ag. Vice Chancellor Mzuzu University, Malawi
Professor Friday Okonfua Vice Chancellor, Ondo University of Medical Sciences, Ondo-Nigeria
Professor Oby C. N. Okonkwor Nnamdi Azikiwe University, Awka-Nigeria
Professor Charles Ayo former Vice Chancellor, Covenant University, Ota-Nigeria.
Associate Prof. A.U. Ejifugha Alvan Ikoku Federal College of Education, Owerri-Nigeria
Professor Christine Dranzoa Vice Chancellor, Muni University, Arua-Uganda
Professor I. A. Ajibefun Vice Chancellor, Adekunle Ajasin University, Akungba Akoko, Nigeria
Professor Adamu Balami University of Maiduguri, Nigeria
Professor Chuks Ezedum Vice Chancellor, Madonna University, Okija-Nigeria
Professor Yakubu Ochefu Vice Chancellor, Kwararafa University, Wukari-Nigeria
Professor Francis Lelo Vice Chancellor, Laikipia University, Nyahururu-Kenya
Professor Biyi Daramola former Vice Chancellor, Federal University of Technology, Akure-Nigeria
Professor Stanley Waudo Vice Chancellor, Mount Kenya University, Thika-Kenya

Professor I. A. Adeyemi former Vice Chancellor, Bells University of Technology, Ota, Nigeria
Professor Shehu G. Ado Vice Chancellor, Al-Qalam University, Katsina-Nigeria
Professor E.D. Mbennah Vice Chancellor, St. John’s University of Tanzania, Dodoma-Tanzania
Professor Oladiran Famurewa Vice Chancellor, Kings University,Odeomu, Nigeria.
Prof. B.S. Malami Vice Chancellor, Kebbi State University of Science and Technology, Aliero-Nigeria
Professor Wanjiku Chiuri Deputy Vice Chancellor, Laikipia University, Nyahururu-Kenya
Professor Abdullahi Y. Ribadu Vice Chancellor, Sule Lamido University, Kafin Hausa, Nigeria
Professor A.E Adegbite Ag. Vice Chancellor, Ondo State University of Science and Technology, Nigeria
Professor Austin N. Nosike Director, Business School, Ballsbridge University, Dominican Republic
Professor William. B. Qurix, OFR former Vice Chancellor, Kaduna State University, Nigeria
Professor Shehu Abdul Rahman former Vice Chancellor, Federal University, Gashua-Nigeria
Professor Addison M. Wokocha former Registrar, Teachers Registration Council, Abuja-Nigeria
Professor Olowole O.G. Amusan former Vice Chancellor, Adeleke University, Ede-Nigeria
Professor Francis M.Mathooko Vice Chancellor, Machakos University, Kenya
Professor Hector F. Rucinque University of Cordoba, Columbia
Professor Toader Nicoara Babes-Bolyai University, Cluj-Napoca, Romania
Professor Radoslav Raspopovic University of Monte Negro, Monte Negro
Professor Ljubomir D. Frckoski, Ss. Cyril and Methodius University in Skopje, Macedonia
Professor Sibylle Heilbrunn Ruppin Academic Center, Emek-Efer, Israel

Professor Sule Kut Istanbul Bilgi University, Turkey
Professor Justina Adalikwu-Obisike Canadian University College,Alberta-Canada
Professor Arda Arikan Akdeniz University, Antalya, Turkey
Professor Andrea Carteny Sapienza University of Rome, Italy Professor Maryam Chkhartishvili Tbilisi State University, Georgia
Professor Jozsef Pal University of Szeged, Hungary Professor Godfrey Baldacchino
University of Malta, Malta Professor Dimitri A. Sotiropoulos
University of Athens, Greece Professor Werner J. Patzelt,
Univerisity of Dresden, Germany Professor Vincent Hoffmann-Martinot
University of Bordeaux, France Professor Mohamed Ben Aissa
University of Tunis, Tunisia Professor Marco Cilento
Sapienza University of Rome, Italy Professor Werner J. Patzelt
University of Dresden, Germany Professor Emanuele Santi
African Development Bank, Tunis, Tunisia Professor Kamaruzaman Jusoff
Universiti Putra Malaysia Professor Sokol Pacukaj
Aleksander Moisiu University, Albania Professor Natarajan Gajendran
Indian Society for Education and Environment Prof Yau Yuen Yeung
Hong Kong Institute of Education, Hong Kong Professor A. R. Sayfoo
Vocational Training Institute, Mauritius

Professor Mohammad Nisar University of Malakand,Pakistan
Professor Mahwish Washeed International Islamic University, Pakistan
Professor Raphael C. Njoku University of Louisville, USA
Professor S.S. Lloyd West Coast University, Panama
Professor Timothy A. Falade New York Institute of Technology, Jordan
Professor Pedro Cravo International Association for the Scientific Knowledge, Portugal
Professor Fernando Alberto Ferreira Polytechnic Institute of Santarem, Portugal
Dr John A. Idumange Niger Delta University, Nigeria
Professor Orifjan Namozov Prague Development Centre(PRADEC), Czech Republic
Professor Ivan Genov Science and Education Foundation, Bulgaria
Professor Hassan Danial Aslam Human Resource Management Research Society(HRMARS), Pakistan
Dr Abraham I. Oba Niger Delta Development Commission, Nigeria
Dr Lisa Licata Sapienza University of Rome-Italy
Professor Alberto Becherelli Sapienza University of Rome-Italy
Professor Alessandro Vagnini Sapienza University of Rome-Italy
Professor Giuseppe Motta Sapienza University of Rome-Italy
Professor Alessandro Pistecchia Sapienza University of Rome-Italy
Dr Jovan Sopovski Ss. Cyril and Methodius University in Skopje, Macedonia
Professor Antonello Battaglia Sapienza University of Rome

ADMINISTRATION Professor J.A. Opara(Convenor)
African Association for Teaching and Learning, Accra-Ghana Professor Anele Kinikanwo
University of Port Harcourt, Nigeria Professor S.L Kela
Federal University, Kashere-Nigeria Professor P. U. Akanwa
Imo State University, Owerri-Nigeria Professor M.N. Modebelu
Michael Okpara University of Agriculture, Umudike, Nigeria Assoc. Prof. Adaku N. Achilike
, Akanu Ibiam Federal Polytechnic,Afikpo-Nigeria Professor M.O. N Obagah
Ignatius Ajuru University of Education, Port Harcourt, Nigeria Assoc. Prof. A.C. Njoku
Alvan Ikoku Federal College of Education, Owerri-Nigeria Assoc. Prof. S.A. Abere,
Rivers State University of Science and Technology, Nigeria Professor A. N. Nosike
Ballsbridge University, Dominican Republic Associate Prof. A.U. Ejifugha
Alvan Ikoku Federal College of Education, Owerri-Nigeria
Conference Bureau Bureau Chief
Ms Betty Oruahwo,MBA, Administrative Secretary
African Society for the Scientific Research, Accra-Ghana Co-Bureau Chief
Dr(Mrs) Nnnenna Irem, Federal University, Alike-Ikwo,Ebonyi State, Nigeria Deputy Bureau Chief
Ms Ann Chukwu, Beverly Resources Directorate of Protocol and Accreditation
Dr(Mrs) Vera Charles-Unadike, University of Nigeria, Nsukka-Nigeria Ms Ifeoma Obiajunwa, Development Africa Consortium
Dr(Mrs) Felicia Uwakwe, Federal University of Technology, Owerri-Nigeria
Welfare and Logistics Mrs Ozioma Azubuike,Michael Okpara University of Agriculture, Umudike-Nigeria
Vivian Akujobi, Beverly Resources Frank Chukwu,Beverly Resources SCIENTIFIC BUREAU EXECUTIVE
Dr(Mrs)Nkeiru A. Kamalu, Imo State University, Owerri-Nigeria Dr Jimin Nguuma, Sule Lamido University, Kafin Hausa, Nigeria
Dr(Mrs) Nnenna Irem,Federal University, Alike-Ikwo,Ebonyi State, Nigeria Media and Marketing Bureau
Prince Alexis, Beverly Resources Mary-Ann Amadi, Beverly Resources
Abuja Bureau Chief Fyne C. Nosike, Development Africa Consortium
Editorial Director Dr Lisa Licata, Mediterranean Center of Social and Educational Research
PATRONS Professor S.L Kela, Deputy Vice Chancellor, Federal University, Kashere-Nigeria Professor Michael U. Adikwu, Vice Chancellor, University of Abuja, Abuja FCT, Nigeria Professor Ibrahim A. Njodi, Vice Chancellor, University of Maiduguri, Nigeria Professor Bashir Raji, Vice Chancellor, Fountain University, Oshogbo-Nigeria Dr Rose Clarke Nanyonga, Vice Chancellor, International Health Sciences University, Kampala-Uganda Professor A.O. Akii Ibhadode, Vice Chancellor, Federal University of Petroleum Resources, Effurun-Nigeria Professor Saminu A. Ibrahim, Vice Chancellor, Abubakar Tafawa Balewa University, Bauchi-Nigeria Professor Loveness Kaunda, Ag. Vice Chancellor Mzuzu University, Malawi Professor Christine Dranzoa, Vice Chancellor, Muni University, Arua-Uganda Professor I. A. Ajibefun, Vice Chancellor, Adekunle Ajasin University, Akungba Akoko, Nigeria Professor Chuks Ezedum, Vice Chancellor, Madonna University, Okija-Nigeria Professor Yakubu Ochefu, Vice Chancellor, Kwararafa University, Wukari-Nigeria Professor Francis Lelo, Vice Chancellor, Laikipia University, Nyahururu-Kenya Professor Andrew Haruna, Vice Chancellor, Federal University, Gashua-Nigeria Professor Biyi Daramola, former Vice Chancellor, Federal University of Technology, Akure-Nigeria Professor Stanley Waudo, Vice Chancellor, Mount Kenya University, Thika-Kenya

Professor I. A. Adeyemi, former Vice Chancellor, Bells University of Technology, Ota, Nigeria Professor Shehu G. Ado, Vice Chancellor, Al-Qalam University, Katsina-Nigeria Professor E.D. Mbennah, Vice Chancellor, St. John’s University of Tanzania, Dodoma-Tanzania Professor Oladiran Famurewa, Vice Chancellor, Kings University,Odeomu, Nigeria. Prof. B.S. Malami, Ag. Vice Chancellor, Kebbi State University of Science and Technology, Aliero-Nigeria Professor Abdullahi Y. Ribadu, Vice Chancellor, Sule Lamido University, Kafin Hausa, Nigeria Professor A.E Adegbite, Ag. Vice Chancellor, Ondo State University of Science and Technology, Nigeria Professor William. B. Qurix, OFR, former Vice Chancellor, Kaduna State University, Nigeria Professor Addison M. Wokocha, former Registrar, Teachers Registration Council, Abuja-Nigeria
Collaborating Journals After a rigorous review processes, all selected papers are to be published in any of the collaborating journals. All journals are international peer-reviewed, open access and widely indexed/abstracted. Authors of successful papers would be communicated after the conference. Bulgarian Journal of Science and Education Policy (BJSEP);Science Education Review (SER);Indian Journal of Science and Technology; Academic Research International(ARINT);International Greener Journals (IGJ)

PASTURING AND GRAZING EFFICACY ON THE RIPARIAN GREENERY ALONG RIVER BENUE IN NORTH EAST NIGERIA
Jacinta A. Opara; Madube Tumba Kwabe and Nuwe John Bosco
Department of Biological and Environmental Sciences Kampala International University
Kampala-Uganda ABSTRACT The study investigated into the effect of grazing on the riparian vegetation along river Benue in Adamawa state Nigeria. Survey and observation design method were used to compare vegetation cover, distribution and composition. Study area was categorized into upper and lower section of riparian and was stratified into grazed and nongrazed. The study sites were delineated into fifty-nine (59) quadrats, observation technique was used to collect data on grazing effects on vegetation composition. Descriptive statistics, components analysis and paired T-test were used to analyze data. Study revealed, decrease in plant species productivity, plant vigor/resilience, diversity in native palatable species and increase in plant species extinction, diversity of on non-palatable native species as effects of grazing on vegetation. There is a variation in the distribution, composition diversity of plan species amidst grazed and nongrazed sites at p = 0.05 of the paired T-test result. Decline in plant growth 0.759 and decrease in plant species diversity 0.748 are some of the loaded variable for the enormous change in vegetation structure due to grazing. Themeda triandra and Cynodon dactylon are the most affected plants sensitive to grazing effects, while Aristida mutabilis and imperata cylindra are the friendliest to grazing due to their unpalatable nature. Grazing effects amidst the upper and lower riparian sections is almost some with the effect severe on plant growth in all the sections with 22 percent. Study recommends that; as a matter of policy, governments at and federal level, traditional and community leaders should adopt modern grazing strategies or measure. Should empower and encourage the community base organizations, traditional authorities to participate at the grass root development and implementation of environmental law or policies. Community leaders and government should support a culture of understanding, that will promote ranching science curriculum to educate the adult learners skills of constructing a grazing management disposition.
Keywords: Grazing, Riparian, Flora, Effects River.
1. Introduction
Vegetation of riparian areas plays a significant role in the sustainability of the environment by sunlight conversion into energy; it enriches the composition, abundances and diversity of plant species and promoting the development of biodiversity (Ehrhart and Hansen, 2014; Theobold, et al, 2010). Riparian vegetation is fundamental to the survival of wildlife, and society through its socio-economic values (Morris & Reich, 2013).

However, despite the importance of the vegetation, threats to such environmental resources have become a universal problem. Unsustainable harvests of bio-resources and uncontrolled livestock grazing are some of the threats affecting sustainability and quality of riparian vegetation. Such threats have severe effects on vegetation productivity, composition and regeneration of plant community (Julien, 2014). The conservation of riparian vegetation along river Benue and grazing activities has long been established as conflicting due to their interdependence and vulnerability as resources. The fact is that, both are resources that needed to be managed harmoniously, as both has been critical to the development of biodiversity and the survival of society (Bastin, et al., 2012; Onouha, 2008).
River Benue with its catchments provided the major drainage plains and diverse riparian ecosystem in the North East (Onouha, 2008). The riparian vegetation of Nigeria is in deplorable situation especially that of river Benue in Adamawa north east of Nigeria. The usefulness of the vegetation is being distracted by the intensified uncontrolled grazing along the riparian (Adefioye, 2013; Onouha, 2008). Many decry over the situation, for example Linus. et al., (2014), lamented over vanishing of the vegetation benefits along the riparian areas and the hardship it has on livelihood of households across the communities.
Cattle grazing are the main occupation among the communities in Adamawa area and overgrazing is eminent due to uncontrolled grazing. This phenomenon is usually the result of too large numbers of livestock living foraging intensively in one location, it can also be caused by poorly managed grazing methods causing many effects on vegetation and economy. It reduces edible plant life in an area leading to degradation of vegetation in the riparian and resulting into needs becoming more prevalent. It causes erosion of the soil, stopped fish from migrating and productivity. It causes scarcity of quality and quantity of water downstream, increases temperature, drought and navigability.
It exposes rivers to intrusion of sedimentation and degrade non-farming socio – economic activities including fishing along the river Vegetation is one of the most dynamic and vital components of the riparian ecology, with a diverse, productive biodiversity and numerous benefits that are essential to both human beings and animals. Unfortunately, the profound rate at which the vegetation is degrading is alarming and regrettable. The purpose of this study is to investigate into the effect of grazing on the riparian vegetation along river Benue in Adamawa state, Nigeria. Specifically, the study examined how livestock grazing affects the various vegetation structure in the riparian along the river Benue in Nigeria Literature Review Zoheir, (2011) and Hansen. et al., (2015), explain the effects of grazing on riparian vegetation through defoliation, trampling and browsing processes on plant species. These processes lead to redistribution of nutrients and redistribution of plants by transporting seed and other propagules from one location to another. Mel. et al., (2013) observed adverse effects of grazing on the physical composition of vegetation which can reduce the value of the resource. Clark (2010), reviewed livestock impacts on riparian vegetation quality with special reference to humid temperate regions, and that impact of grazing may vary with climate, landscape level factors. Also, uncontrolled access by cattle in riparian areas can have a devastating effect on riparian ecosystems. Abt. et al., (2014), concur that cattle access to riparian vegetation can and does dislodge vegetation stability and productivity.

Fischer. et al., (2010), explained damage on vegetation physical structure by grazing trampling activities. Fleischner (2014), cites a number of examples where defoliation by grazing herbivores altered plant height and canopy cover, and changed species composition to include structurally different types of plants. According to Walker (2014), overgrazing can significantly reduce biomass production of any environment by an average 52 per cent, reduced aboveground net primary productivity by less than 20 percent (Buckhouse and Gifford, 2010). However, as stocking density increases, cattle are forced to graze the available forage more evenly and be less selective, potentially decreasing the competition for nutrients from less palatable species (Fischer. et al., 2010; Hairsine.et al.,2012). Bohn and Buckhouse (2012), unveiled that grazing remove plants from ground cover more especially grasses and herbaceous species, which are damaged through trampling. This lead to loss of ground cover and biomass of vegetation, through the loss of grazing-sensitive species, that cause declines in native plant diversity. Buckhouse and Gifford (2010) and Fleischner (2014), observed preferentially graze effects on native palatable plant species, which either removing them from a site or reducing them to compact, low tussocks, or rosettes. Trimble and Mendel (2011), explains that trees and shrubs are usually moderately affected by grazing in the short term, but over longer time become increasingly degraded. Overgrazing restricts the recruitments of most plant species particularly overstorey plants, which prevents the replacement of plant species. Pettit (2009), observed that grazing in Australia usually goes hand-in-hand with the clearing of overstorey vegetation and that heavy grazing can result in the development of even-aged stands of vegetation, and reduce species diversity.
Trampling by cattle disturb the plant roots outside soil and in most cases, as it completely destroys the plants species (Bothwell. et al., 2013). However, loss of vegetation can have detrimental long-term effects, Fleischner, (2014) also added that trampling damages plant roots and causes roots to become concentrated near the soil surface. Clary and Booth (2013), argue trampling may prevent plants from acquiring sufficient resources for vigorous growth. Bryant. et al., (2012), found browsing and trampling on Kentucky bluegrass (Poa pratensis) pastures to a l-inch (2.5 cm) stubble height reduced vegetation cover, lowered yields due to continuously grazed season long which has implications.
The impact of livestock grazing in grassland riparian can have a significant effect on vegetation structural characteristics and has been the subject of many reviews (Greenwood and McKenzie, 2011; Bilotta. et al., 2013). The effects of grazing on vegetation characteristics are, in part, dependent on diversity and palatability of species. According to Marlow (,2015), a major vegetation change that has taken place in mountain riparian systems of the Pacific Northwest is replacement of native bunch grass with Kentucky blue grass. It was established as dominant invasive species in native bunch grass meadows due to grazing by herbivores and subsequent site deterioration (Voliand, 2009). Kauffman, et al., (2009) and Scholefield and Hall (2011), found that exotic grasses such as meadow timothy (Phleum pratense) were more attuned to savanna riparian environments which replaced the native sedges and mesic forbs. Cattle grazing were found to be influential on spacing of plants and plant width of the riparian zone. Marcuson (2013), found shrub production to be 13 times greater in an ungrazed area than in severely overgrazed area. Davis (2012; Evenden and Kauffman 2010) and

Kauffman (2012) found alders (Alnus sp.) and willows(Silks.) provided 75 percent shade cover over areas that had been devoid of shrub canopy cover before exclosures.
Methodology
The riparian areas along river Benue starting from Lamurde the areas below the joining of river Gongola a tributary in Adamawa State, extending upstream to Fufore across seven local governments is the study site. The study applied quantitative survey and observational design which were used for data collection. Study site was divided into upper and lower sections of the riparian, and each section was stratified into grazed and non-grazed. A macro plot of 10 m x50 m was delineated along a transit line of 11250 metres in the grazed upper areas and on transit line of 6750 metres of the non-grazed areas. In the upper section, a total of 36 of 10 m x 50 m was delineated. With 22 in the grazed and 14 in the non-grazed site of the section grouped as A.
Similarly, a 10 m x 50m macro plot were delineated along a transect line of 18250 metres in the grazed lower areas and on a transect line of 11250 metres of the non-grazed areas of the lower riparian. In the lower section, the grazed areas of 18250 have 36 macro plot of 10 m x 50 m and the non-grazed areas of 11250 have 23 macro plot of 10 m x50 m grouped as B. Grazed areas of upper section have 22 quadrats and non-grazed have 14 quadrats, upper section has 36 quadrats. Lower sections of the riparian have 36 quadrats in the grazed areas and 23 quadrats in non- grazed. the non-grazed areas of upper and lower sections in total has 37 quadrat plots. In total there were 95 plots observed and study recorded grazing effects on plant community at 60 cm interval transects using the line intercept approach. All data were coded and entered into the computer Special Package for Social Sciences (SPSS23) and Excel were used in data analysis, descriptive statistics such as frequencies, percentages and inferential statistics like Pearson‘s correlation were used to determine relationship. Tables, charts and figures were used in presenting the analysed data.
Research findings The grazing effects on vegetation of riparian area along river Benue
Figure 1; Percentage of grazing effects on plant species along riparian area
Results in Figure 1, indicate the severity of grazing effects on plant species in the riparian. Some of the adversities are: decrease in the growth of plant species 55 percent of the respondents consented
40% 45%
54% 50%
40%
60% 65%
57% 55%
increase innative
unpalatablediversity
increase inplant
diebark
Increased inplant
extinction
decrease inplant vigor
andresilience
Increase inexotic plant
decrease inplant
composition
decrease inproductivity
of plants
decrease indiversity of
nativepalatable
plants
decrease inplant
growth
Percentage

to that. A decrease in the diversity of the native palatable species (e.g. Aristida mutabilis, Themeda triandra and Cynodon dactylon, p, africana) concur by 57 percent of the respondents. Severe decrease in plant species productivity (e, g Celtis Africana) affixed by 65 percent of the respondents. Others include decrease in plant composition (heterogeneity) 60 percent of the respondents‘ assert and an increase in the diversity of exotic weeds in the riparian (e.g. Learsia hexandra, algae) mentioned by 40 percent of the respondents.
A decrease in plant vigor/resilience (e.g. Carissa spinarum(shrub) and Cynodon dactylon (grass) 50 percent of the respondents advanced it. Increase in extinction of sensitive plants to grazing (e.g. vangueria infausta, clausina anisata) was profess by 54 percent of the respondents. There is an increase in the widespread of diebark of plants (e.g. Eucalyptus spp) 45 percent assert to the information and finally increase in the diversity of unpalatable native (e.g. Imperata Cylindrica-Speargrass Aristida mutabilis, Chlorophytum dalziere and Rucinus cominunis) due to ebb of palatable vegetation covered as mentioned by 40 percent of the respondents in the area.
The identified grazing effects on riparian vegetation in Figure 1 above, was subjected to principal components analysis (factor analysis) to determine the true loading of the effects on grazing activities in the riparian as in Table 1 Table 1: Principal components analysis of grazing effect on riparian vegetation
Rotated Component Matrixa
Component
1 2
Decline in plants growth .759 Decrease in diversity of native palatable plants .748 Decrease in productivity of plants .668 Increase in diversity of unpalatable native plant .638 Increase in die bark of plant .583 Decrease in plant composition. .711 Increase in diversity of exotic weeds .629 Increase extinction of plants .594 Decrease in vigor/resilience of plant .584
Total of Eigenvalue 2.910 1.762 % of variance 29.102 17.621 Cumulative % 29.102 46.723
The results in Table 1 indicate the most loaded grazing effect on the riparian vegetation which are; decline in plant growth (0.759), decrease in diversity of native palatable plants (0.748), and decrease in productivity (poor yield) of plant (0.668) have large loadings on factor 1. While decline in plant composition (0.711), and increase diversity of invasive weeds (0.629) had large loadings on factor 2. Factor 1 and factor 2 explain 29.102 percent and 17.621 percent of variation in the data respectively. In other words, it implies that factor 1 and factor 2 are the eminent contributors of grazing effects on the plant community in the riparian area.
However, the variables loaded on the factor 1 and factor 2 are responsible for the enormous ecological changes in the riparian along the river. The eigenvalue of 1.762 for the effect of grazing shows a large difference in plant species growth and diversity decline of palatable native from the rest of the effects. It is sufficient to describe a meaningful control of grazing pressure on the riparian plant community species; this indicate plant species are delicate to upset of grazing activities. The

cumulative Eigenvalue of 46.723 is a strong evidence of livestock influence in the riparian, that grazing of vegetation accounts for 46 percent of vegetation decline in the riparian.
Variation in grazing effects amidst upper and lower riparian sections
Figure 2: Percentage of grazing effects on plant species along riparian area
The results in Figure 2, reveals difference in grazing effects on the plant community amidst the upper and lower section of the riparian. Grazing effects on the vegetation in both sections differed slightly among species categories. Plant growth is most affected with 22 percent decrease severity; follow by a decline in the diversity of native palatable 19 percent, and a decrease in the plant productivity 15 percent. An increase in diversity of invasive species 8 percent. Others are; increase in extinction of grazing –sensitive plants 7 percent, decrease in the vigor and resilience of plants 9 percent. Also an increase in the diebark of plant 4 percent as one of the severe effects and finally increase in the diversity of native unpalatable plants 5 percent.
In the upper section, of the riparian, effects on vegetation has no distinction compared to the lower section. However, little variation exists in the severity on each attribute in same section: decrease in plant growth is more severe with 22 percent. Follow by a decline in vegetation composition 19 percent; diversity decline in the native palatable plant 11 percent; decrease in the productivity of plants 15 percent. While an increase in the diversity of exotic (invasive) species 8 percent and increase in the diversity of unpalatable native 4 percent.
Others are: increase in the diebark of tree plants 7 percent; decrease in the vigor and resilience of species 9 percent; decrease in the composition of plant percent and finally the extinction of grazing sensitive plant 5 percent. Variation in the effects amidst the riparian sections were due to factors like: difference in vegetation type, riparian gradients and width, frequency and intensity of grazing herds.
Table 2: Difference in observed mean density of plant species covers (paired t –test)
0
5
10
15
20
25
Decrease ingrowth
Decreasediversity ofpalatable
Decreaseplant
productivity
Decreaseplant
composition
Increaseexotic plant
Decreaseplant vigor/resilience
Increaseextinction of
plant
Increaseplant
diebark
Increasediversity ofunpalatable
percentage
upper lower

Species life form Non- grazed Grazed P
Canopy cover (trees) 13.20 26.25 0.002
Under storey cover 8.05 31.10 0.003
Tussock grass cover 5.23 14.14 0.002
Shrubs cover 6.01 10.30 0.004
Forb cover 8.21 10.01 0.001
Herbaceous/ cryptogam cover
2.15 7.32 0.004
*significance at p value = 0.05 The results in Table 2 reveals the effects of livestock grazing on the vegetation density. The species life-form covers in the study areas are dominated by Caesalpiniaceae family (e.g. Cynometra) and Sapotaceae family (e.g. Lophira alata) which was observed by study to be greater at (p=0.002) in the non-grazed areas compared to the grazed areas. The small tree/climbers plant life-forms of the understorey cover dominated by Zygophylluaceae (e. g Balanites aegyptiaca) and Epiphytes (e. g Loranthus), were much larger at (p=0.003) in the non-grazed as per what was found in the grazed site. The shrub life-form covers dominated by families of Papilionaceae (e.g. Angylocorlyx oligophyllus) and Sapindaceae (e.g. Chytranthus macrobortys) species was larger at (p=0.026) on the non-grazed area compared to the grazed areas. Herbaceous / cryptogams plant life-form covers dominated by Alectra virgotanherns and Aeschynonse neglectra were much larger at (p=0.004) in the non-grazed compared to the grazed areas The tussock grasses life-form covers of the riparian dominated by Tridx combretum, Helichsysum Cameroonense and Panniiretum purpuseum (Elephant grass) families were much larger (p=0.004) in non-grazed compared to the grazed areas. The forb plant life-forms cover in the riparian dominated by Rytzynica aryantea and Rubiaceae families (e.g. Moralia senegalensis and Apocynceae (e.g. Saba florida) were much larger (p=0.001) in non-grazed area compared to the grazed areas of the riparian. More woody species in the non-grazed compared to the grazed this indicate that, woody species breakthrough very quickly under a riparian condition free from grazing disturbances. The Paired t-test indicated difference in the responses of plant species heterogeneity amidst the non-grazed and the grazed areas of the riparian. The difference was found significant at p=0.05 greater than p=value of each in Table 7, and resultant effect was due to pressures from the grazing processes on the grazed site. Table 3: Observed most affected and resilient species along riparian of river Benue
Riparian plant species affected
Potential effects

Vigor/Resilience Productivity Diversity Extinction Stream bank species
Lophira alata Decrease decrease decrease Increase
Cynometra Ananta Decrease decrease Decrease Increase Diospyris Spp Decrease decreased Decrease Increase
P, africana Decrease decrease Decrease Increase
Celtis africana decrease decrease Decrease Increase
Carissa spinarum Imperata cylindra Aristida mutabilis Themeda triandra
Increase increase Increase Decrease
increase increase increase decrease
Increase increase increase decrease
decrease decrease decrease increase
Cynodon dactylon Increase increase Increase Decrease
Cenhrus cilliaris Increase increase Increase Decrease Hyparrhenia Spp Decrease decrease Decrease Decrease Xanthium Increase increase Increase Decrease Penniseum Increase Increased Increase Decrease Chlorophytum D Increase increase Increase decreased
The study findings in Table 3 indicates the most sensitive and resilient species to grazing in the riparian area along river Benue.
The productivity of the vegetation species in terms of vigor and biomass declined due to grazing effect. plants like Themeda triandra, Cynodon dactylon, Prunus africana and Celtis africana are the most sensitive plants to grazing. Lesser number of such species were found in the grazed site, if grazing persist in the riparian such species will completely disappear or go into extinction. Plant species such as Monocymbium ceresiiforms, Araceae (Pistia stratiles) and other tree species such as Erythrophleum ivorense belongs to the class of most disturbed plant species vulnerable to grazing actions.
Grazing caused a decline in grazing-sensitive plant species like Ctenium newtonii, decline in diversity of native palatable vegetation species like Themeda triandra, Cynodon dactylon grass Chlorophytum dalzieri and pennisetum Spp. Leading to reduction and loss of complex vegetation structure. Selective foraging had improved the diversity and dominance of grazing resistance or resilient of native unpalatable species (imperata cylindrical- spear grass), Aristida mutabilis, Carissa spinerum, Cynodon dactylon and Cenhrus cilliaris). which leads to decrease in the diversity of native palatable species and increase in the dominance of the invasive species. Comparison of Palatable and Non-Palatable Grass Cover

Figure3: Comparison of Palatable and Non-Palatable Grass Cover
Sampling with quadrats plots of a standard size was used for comparison of palatable and non –palatable grass cover in accordance with Cox 1990 method in both the grazed and non-grazed areas. The results of the study as indicated in Figure 3 showed native palatable grasses; Themeda triandra and Cynodon dactylon being decreased or reduced in the overgrazed areas, quadrats group A and native unpalatable grasses; Imperata Cylindra- spear grass and Aristida mutabilis dominate the overgrazed area quadrat group A. The result also indicated that native palatable grasses Themeda triandra and Cynodon dactylon are abundant in the non- grazed areas, quadrats group B and native unpalatable grasses Aristida mutabilis and Imperata cylindra- spear grass are non or fewer in the grazed areas.
Discussion The study findings reveal that grazing was found to negatively affect plant communities along the riparian of river Benue. The study observed larger density and richness of plant life-form species in ungrazed area in the upper and lower section of the riparian compared to the grazed areas in the sections. The ungrazed areas in the sections were distinguished by old growth stands of plants life-form of tree, shrub, forb, tussock grass and cryptogams/herbaceous. On the contrast, the ungrazed areas were deficient in diversity of some plant life-form like the cryptogams and grass. The low diversity was attributed to the dominant tree stands that highjack the largest allotment of sunlight and nutrients. Indeed, numerous research had recorded that, an inconsiderable plant species privileged by absences of grazing could go up against small and juvenile plants (Brinson. et al., 2013; and Dobson, 2013).
On the other hand, lesser density and richness of plant life-form were recorded in the grazed areas of both sections of the riparian. But, a great decrease in the diversity of the palatable native species amidst the plant life-form were recorded in the grazed areas along the riparian. Similarly, a diversity of native unpalatable (e.g. Phonix dactylifera and Cenhrus Cilliaris) and invasive species (e.g. Learsia hexandra) were recorded. This indicate that intensification of grazing in riparian lead to reduction in the palatable native species and promoting the dominance of the native unpalatable and invasive species (Glinski, 2011). Livestock grazing in the riparian had affected the competition ability of the native species among others by way of discriminate foraging as well trampling.
Subsequently, as a result of grazing intensity, a decrease in species growth, decline in heterogeneity, diebark, productivity and diversity in unpalatable were recorded as effects (Figure 1 and Table 1).
0
5
10
15
20
25
Themedatriandra
Cynodondactylon
Imperatacylindrica
Aristidamutabilis
Composition of Palatable and non palatable grass
Qaudrat A Quadrat B
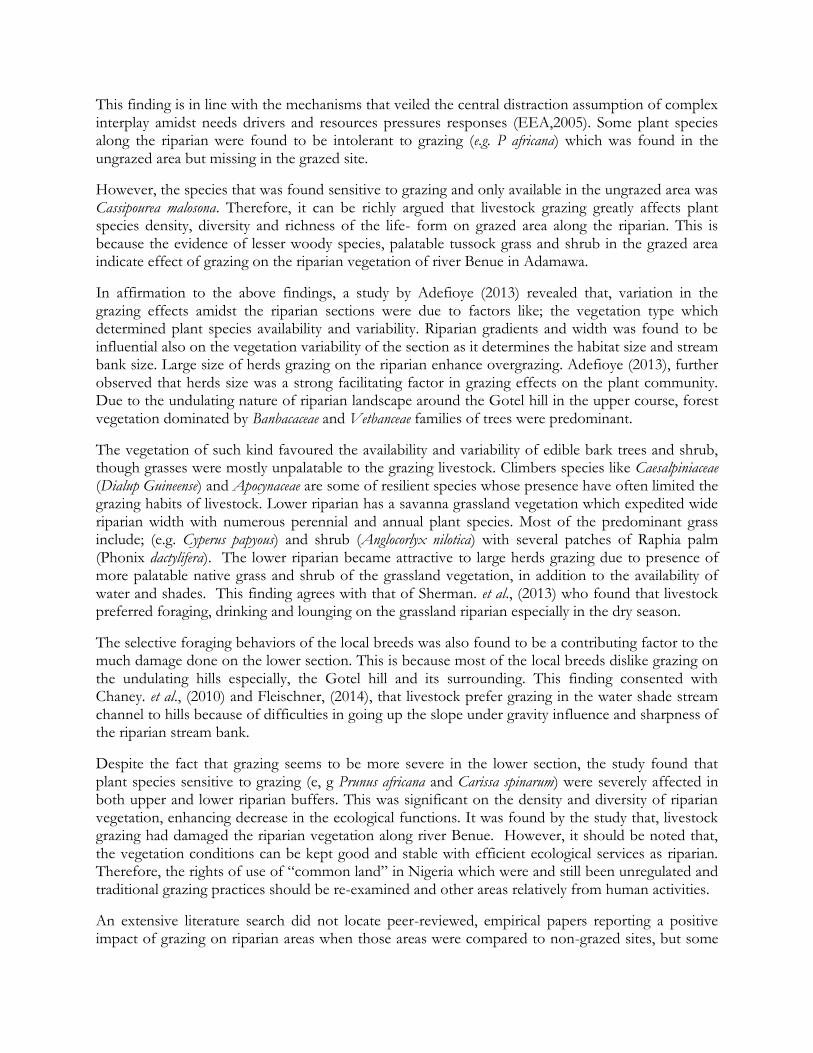
This finding is in line with the mechanisms that veiled the central distraction assumption of complex interplay amidst needs drivers and resources pressures responses (EEA,2005). Some plant species along the riparian were found to be intolerant to grazing (e.g. P africana) which was found in the ungrazed area but missing in the grazed site.
However, the species that was found sensitive to grazing and only available in the ungrazed area was Cassipourea malosona. Therefore, it can be richly argued that livestock grazing greatly affects plant species density, diversity and richness of the life- form on grazed area along the riparian. This is because the evidence of lesser woody species, palatable tussock grass and shrub in the grazed area indicate effect of grazing on the riparian vegetation of river Benue in Adamawa.
In affirmation to the above findings, a study by Adefioye (2013) revealed that, variation in the grazing effects amidst the riparian sections were due to factors like; the vegetation type which determined plant species availability and variability. Riparian gradients and width was found to be influential also on the vegetation variability of the section as it determines the habitat size and stream bank size. Large size of herds grazing on the riparian enhance overgrazing. Adefioye (2013), further observed that herds size was a strong facilitating factor in grazing effects on the plant community. Due to the undulating nature of riparian landscape around the Gotel hill in the upper course, forest vegetation dominated by Banbacaceae and Vetbanceae families of trees were predominant.
The vegetation of such kind favoured the availability and variability of edible bark trees and shrub, though grasses were mostly unpalatable to the grazing livestock. Climbers species like Caesalpiniaceae (Dialup Guineense) and Apocynaceae are some of resilient species whose presence have often limited the grazing habits of livestock. Lower riparian has a savanna grassland vegetation which expedited wide riparian width with numerous perennial and annual plant species. Most of the predominant grass include; (e.g. Cyperus papyous) and shrub (Anglocorlyx nilotica) with several patches of Raphia palm (Phonix dactylifera). The lower riparian became attractive to large herds grazing due to presence of more palatable native grass and shrub of the grassland vegetation, in addition to the availability of water and shades. This finding agrees with that of Sherman. et al., (2013) who found that livestock preferred foraging, drinking and lounging on the grassland riparian especially in the dry season.
The selective foraging behaviors of the local breeds was also found to be a contributing factor to the much damage done on the lower section. This is because most of the local breeds dislike grazing on the undulating hills especially, the Gotel hill and its surrounding. This finding consented with Chaney. et al., (2010) and Fleischner, (2014), that livestock prefer grazing in the water shade stream channel to hills because of difficulties in going up the slope under gravity influence and sharpness of the riparian stream bank.
Despite the fact that grazing seems to be more severe in the lower section, the study found that plant species sensitive to grazing (e, g Prunus africana and Carissa spinarum) were severely affected in both upper and lower riparian buffers. This was significant on the density and diversity of riparian vegetation, enhancing decrease in the ecological functions. It was found by the study that, livestock grazing had damaged the riparian vegetation along river Benue. However, it should be noted that, the vegetation conditions can be kept good and stable with efficient ecological services as riparian. Therefore, the rights of use of ―common land‖ in Nigeria which were and still been unregulated and traditional grazing practices should be re-examined and other areas relatively from human activities.
An extensive literature search did not locate peer-reviewed, empirical papers reporting a positive impact of grazing on riparian areas when those areas were compared to non-grazed sites, but some

studies reported no statistical significant effects due to riparian grazing (Buckhouse and Gifford 2010; Samson. et al., 2012). The authors of these papers usually explain this absence of statistically significant impacts due to stochastic or design problems associated with their research, rather than to grazing having no effect on vegetation, fish, and soil. They described such problems as: i) high variability among treatment plots, which masked treatment effects (Sarr. et al., 2009); ii) insufficient recovery periods after protection from grazing (Sedgwick and Knopf, 2012, Sarr. et al., 2009); iii) heavy browsing and grazing by native herbivores (or trespassing cattle) on supposedly non-grazed sites plots (Clary. et al., 2011); iv) unplanned disturbances such as flooding (Sedgwick and Knopf, 2012, Clary. et al., 2011); iv) the unknown effects of a prior history of heavy grazing, which may have permanently altered stream vegetation function and prevented recovery of control plots (Tiedemann and Higgins, 2013). The absence of significant effects may also be due to investigators setting statistical significance at arbitrarily low levels (i.e. at P<0.05).
Marlow (2015), argues that many studies, such as those with few treatment replications or high spatial variability, have low power (i.e. poor ability) to detect environmental change.
Because of the possibility, that already depleted fish stocks could become endangered or important habitats become permanently altered, he argues that higher probability levels (i.e., P<0.1) are appropriate to test significance of hypotheses.
Authors have also attributed non-significant results to supplemental feeding of livestock (Sedgwick and Knopf, 2012), which resulted in lower forage consumption levels than originally prescribed, and to high recreational fishing, which obscured the negative effects of vegetation degeneration by grazing on fish population and other aquatic life. Therefore, it can be argued that severe vegetation damage such as loss of native plant species or extinction in palatable and medicinal plants cannot be reversed in just a few years of protection. This implies that stream vegetation can recover slowly or only over geological time scales.
In agreement to the findings of this study, the studies by Chaney. et al., (2010); Platts, (2011), Elmore and Kauffman (2011); McIntosh. et al., (2013); Fleischner, (2014); and Oholmart, (2011), all found that livestock grazing in riparian areas affect watershed plant community attributes, stream channel morphology, wildlife, fish and other vegetation-dependent organisms and water quality at both local and large scales through damaging of riparian vegetation.
In addition, Clary. et al., (2011) also found that stock foraging strongly influences the stability and shape of the stream bank vegetation through its influence on ground cover species like cryptogam rates. This is because grazing can detrimentally influence the plant regeneration. They can both accelerate stream bank vegetation degradation, decrease stream bank buffers during flood events, largely due to excessive removal of vegetative ground cover. The consequence of both increase extinction and decreased diversity along the stream bank, can influence water temperature through decrease overhang plants. It can also increase in-channel deposition of sediments due to vegetation heterogeneity fragmentation. Both results can greatly degrade aquatic habitats. Moreover, transport of soils and fine organic materials from the site decreases the fertility of the soils and can reduce capacity to support vegetation of any type.
Furthermore, grazing alters the structure and function of riparian plant communities in several ways. Grazing, browsing, defoliation, and trampling can change the quantity and composition of plant species, as well as the quantity and depth of plant roots. Livestock can also change the vertical structure and distribution of vegetation.

Moreover, selective removal, and/or trampling damage, can alter the age structure of plant communities, this concurred with the observation of Clary, (2010). Therefore, controlling frequency of grazing is an important tool for minimizing the effect of defoliation. Proper frequency of grazing allows for a sufficient rest period for plants to recover from the defoliation event and prevent ‗overgrazing‘. If grazing is too frequent, overgrazing occurs and vigor and abundance of grazed plants can be reduced. If overgrazing persists, desirable forage species could be replaced by weedy annuals that have little or no forage value and the functioning of the plant community may be altered.
From the analysis, the variations in vegetation structure in the non-grazed and grazed sites unveiled a significant difference with Eigenvalue of 1.762 and large cumulative value of 46. 762 loaded on factor 1 and 2, holding grazing accountable. It also differences at P value < 0.05 which is greater than the paired t-test values in Table 1 which affirmed that grazing is strongly responsible for vegetation degradation. Therefore, the null hypothesis is rejected in favor of the alternative hypotheses, and differences in the vegetation structure is not by chance but rather due to grazing. And the little or minimal disturbance in the vegetation of the non-grazed sites was due to other factors like bush fire, drought, dissertation, bio- fuel harvest and others, rather than grazing associated processes in the riparian. Conclusion For the fact that there are environmental laws and policies safe guarding the Nigeria environmental natural resources, riparian resources seemed to have been ignored, as most of the laws focused on petroleum resources utilization and other areas like industries. Due to poor planning, development and implementations of environmental policies, uncontrolled or poor open livestock grazing had degraded riparian vegetation. Such effects of grazing are related primarily to the following processes: plant defoliation, animal traffic and redistribution of nutrients and plant propagules. Altering its structural composition and distribution which diffusely altered other components properties. However, with proper assessment, adequate planning and adoption of rightful grazing management strategies and strong application of environmental laws, the health of riparian areas can be improved and maintained. Finally, despite the policies, grazing in riparian areas have significant effect and include decline in plant community species, water quality, fish productivity and wildlife habitat and population, forage production and overall site ecological value and sustainability,
Recommendations
Based on the findings of the study, author recommends the following to enhance the quality and sustainability of riparian vegetation along river Benue: Federal and State government agencies should support a culture of initiatives in public and private universities and other related research institutes to develop ranch management science curriculum, to teach Adults of nomadic and Agro- pastoralists skills of constructing livestock management disposition.
Professional bodies like Nigeria Environmental Study Team (NEST) and Fisheries Society of Nigeria (FSON) among others to produce plans and empowered to apprehend present degenerating condition of riparian vegetation flawed by grazing through encouraging riparian re-vegetate. Federal and State legislators should as a matter of policy empower and encourage professional and community based organizations‘ like Farmer Development Union (FDU), National Association of

Fishermen (NAOFM), Traditional authorities and community organizations, to participate in policy development and implementation at grass root. Such participatory bodies in policy should also be encourage to embark on tree planting in the riparian, empowered to enhance implementation of grazing management strategies for sustainable riparian.
REFERENCES
Abouguendia, Z. M. (2009). Range land management post of and present a presentation at the Romancing range praise conference, cypress Hills, SK praise conversation action plan Regina. SK.
Abt, S. R., Clary, W.P., &Thornton, C.I. (2014). Sediment deposition and entrapment in vegetated streambeds. Journal of Irrigation and Drainage Engineering 120:1098–1111.
Adefioye S.A. (2013). Analysis of land Use/ Land cover pattern along the River Benue channel in Adamawa State, Nigeria: Academic Journal of interdisciplinary studies, 2(5) MSCER –CEMAS.
Allan, O. J. (2012). Landscapes and River scapes: The influences of land use on stream eco system. Annual review of ecology, Evolution and systematic; 35; 257-284.
Aremu, O.T., Onadeko, S.A., & Inah, E.I. (2010). Impact of Grazing on Forage Quantity and Quality for Ungulates of Kainji Lake National Park Nigeria, Journal of Applied Sciences, (1)-1800-1804.
Bastin, G, Scrarth, P, Chewings, A, Denham. & Abbott, B (2012). Separating Grazing and rainfall effects at Regional Scale Using Remote sensing imagery: A Dynamic Reference-Cover-Method, Journal of Remote sense environment, 21 (2); 11-21.
Bilotta, G. S., Brazier, R.E., &Hogarth, P. M. (2013). The impacts of grazing animals on the quality of soils, vegetation, and surface waters in intensively managed grasslands. Advances in Agronomy. 94:237-280.
Bohn, C.C., & Buckhouse, J.C. (2012). Some responses of riparian soils to grazing management in northeastern Oregon. J. Range Manage. 38:378-381.
Bothwell, M, Sikhalaz, D, Motta, J, & Patrick, M (2013) Seasonal Habitat use and movement patterns of Cattle Grazing Different Rangeland type ‗s pattern in the communal areas of East Cape South Africa. African Journal of Agricultural Research, 7(8): 12-23.
Bryant, F.T., Blazer, R.E., & Peterson, J.R. (2012). Effect of trampling by cattle on bluegrass yield and soil compaction of a Meadowvale Loam. Argon. J. 64 (2), 33l-334.
Buckhouse, J.C., & Gifford, G.F. (2010). Water quality implications of cattle grazing on a semiarid watershed in southeastern Utah. J. Range Manage. 29:109-113.

Campbell, K. (1999). Best management practices for grazing. Montana Department of Natural Resources and Conservation, Conservation Districts Bureau. Helena, Montana. 28 pp.
Charles, K. (2010). A Negotiated Frame works for Rehabilitation of Riparian Zones in
Nairobi City: Available from http:/iso carp net/data/case-studies/1780.Pdf.
Clark, E.A., I., Duncan, P., Keven, D. S. &Whitely. H. (2012). Grazing cattle and riparian ecosystems. Final report to the Ontario Cattlemen‘s Association. 16 pp.
Clary, W.P., & Booth, G.D. (2013). Early season utilization of mountain meadow riparian pastures. Journal of Range Management, 46, 493-497.
Davis, J.W. (2012). Livestock vs. riparian habitat management-there are solutions. p. 175-184. In: Wildlife-Livestock Relationships Symposium: Proc. 10. Univ. of Idaho Forest, Wildlife and Range Exp. Sta. Moscow.
Ehrhart, R.C., & Hansen, P.L. (2014). Successful strategies for grazing cattle in riparian zones. United States Department of Interior, Bureau of Land Management. Missoula, MT. Technical Bulletin No. 4. 48 pp.
Evenden, A., & Kauffman, J.B. (2010). A preliminary investigation of two riparian ecosystems excluded from grazing in the Ochoco Mountains of central Oregon. Unpubl.
Fischer. J. Zerger. A. Gibbons, P, Stott, J., & Law, B.S (2010). Tree decline and the future of Australian farmlands biodiversity, PNAS, 107 (45);19597-19602.
Fleischer, T.L. (2014). Ecological costs of livestock grazing in western North America. Cons. Biol. 8:629-644.
Greenwood, K. L., & McKenzie, B.M. (2011). Grazing effects on soil physical properties and the consequences for pastures: a review. Animal Production Science. 41:1231-1250
Hairsine, P., Bormann, K., & Brophy, J. (2012). Stock tracks and the delivery of pollutants to streams by overland flow‘, in Third Australian Stream Management Conference Proceedings, pp. 253–58.
Hogan C. (2013 Benue River, Retrieved on 29th, December, 2016; from http://www.eoearth.org/view/article/228342.
Julien, F. (2014). Agricultural Riparian Health: Theory, Concepts and Potential indicators, journal of Environmental Management, 8 (56).
Kauffman, J.B., Krueger, W.C., & Vavra. M. (2012). Impacts of late season grazing scheme on nongame wildlife-livestock relationships symposium: Proceedings. University of Idaho. Forest, Wildlife and Range Experiment Station. Moscow, Idaho. PP208-218.
Kidane, Y., Stahmann, R., & Beirkunlen, C. (2015). Vegetation dynamic and land use and land use and Land use and land cover change in the Bale Mountains of Ethiopia. Environmental,

Monitoring Assessment, (5).
Linus B. G., Amos, S. O., Michael, E. T., & Ensenga, G.M. (2014). Fishing Communities and Fishing as livelihoods in Adamawa state. Direct Research. Journal of agriculture and food sciences, 2 (11); 154 -204.
Marcuson, P.E. (2013). The effect of cattle grazing on brown trout in Rock Creek, Montana. Fish and Game Fed. Aid Pro. F-20-R-21-11a.
Marlow, C.B. (2015). Controlling riparian zone damage with little forage loss. Montana AgResearch 2:1-7. Montana State University, Bozeman, MT.
Mel, R. G., Randy, D.J., Chad, S. B., & Tate, K.W. (2013). A Scientific Assessment of the Effectiveness of Riparian Management Practices.
Moen, J. (2008). Managing your native prairie parcels: your guide to caring for native prairie in Saskatchewan. Saskatchewan Wetlands Conservation Corporation. Regina, Saskatchewan. pp.48
Morris, K., & Reich, P. (2013). Understanding the relationship between Livestock Grazing and Wetland condition Arthur Rylah Institute for environmental Research No 1252 Heidelberg Victoria USA.
Nener, J., J., Heinonen, G. D., & John. B. (2006). Watershed stewardship, a guide for agriculture. Department of Fisheries and Oceans, Ottawa, Ontario and the Province of British Columbia, Victoria, British Columbia. 60 pp.
Oholmart R.D. (2011). Historical and present impact of livestock grazing on fish and wildlife resources in Western Riparian Habitats P245-279 L.U.P.R krausman (Ed) range land wildlife The society for Range management, Denver. Co
Onouha F. C. (2008). Saving Africa Shrinking lakes through inter- basin water transfer reflections on the proposal Lake Chad replenishment project. Nigeria journal of international Affairs, 34 (2); 34-45.
Patience, Z. U., Chery, T.M., Olga, L. K., Edsen, G., & Chrispen, M. (2013). Vegetation structure composition across different land uses in a semi- arid savanna of southern Zimbabwe. International Journal of Bio diversity, 692 254-SP, doi.org/10.1155/2013/692 456.
Pettit, N. (2009). Natural regeneration of riparian vegetation in Western Australia‘, in RipRap, edition 14, pp. 8–10.
Roba H. G., & Oba, G. (2013). Understanding the role of local Management in Vegetation Recovery around Pastoral settlement in Northern Kenya, Journal of Environmental Management, 51, 20-13.
Scholefield, D., & Hall, D.M. (2011). A method to measure the susceptibility of pasture soils to poaching by cattle. Soil Use and Management. 1:134-138.

Theobold D, M, Merritt D.M, & Norman H, J. B (2010). Assessment of threats to Riparian ecosystem in Western USA threats assessment centre, Prineville Colorado state university.
Trimble, S.W., & Mendel, A.C. (2011). The cow as a geomorphic agent — A critical review‘, Geomorphology, 13, 233–53.
Todd, G. (2014). Beyond Resilience: managing Towards a higher level of Ranch Performance: across Ranch: Wyoming Quivira Coalition No. 40 www.quicviracoalitain.org
Twaha, A. B., Doreen, T., Anna, T., & and Kassim S. (2016) Impacts of Pastoral Activities on nature Conservation in Western Uganda. International Journal of Ecological Science and Environment Engineering, 3 (2); 42-51.
Von Behren, C., Dietrich, A.E., & Yeakley, J.A. (2013). Riparian Vegetation Assemblages and Associated Landscape Factors Across an Urbanizing Metropolitan Area. Ecoscience, 20(4), 373-382. doi 10.2980/20-4-3635.
Walker, K.F. (2014). Issues in the riparian ecology of large rivers‘, in S.E. Bunn, B.J. Pusey & P. Price (eds), Ecology and Management of Riparian Zones in Australia, pp. 31–40.
Zoheir, A. (2011). Livestock grazing and riparian areas: A Literature Review. Grazing and Pasture Technology Program.
ACCELERATING BIOAEROSOL ASSESSMENT IN NIGERIA
THROUGH MODERN TECHNIQUES
Owoicho, O.; Olumade, T.; Durugbo, E. U.

Department of Biological Sciences, Redeemer’s University, Ede, Osun State, Nigeria
ABSTRACT
Environmental air often contains airborne biological particles which are collectively called bioaerosols. These biological materials are released into the air through various anthropogenic and natural activities, and may contain viable and nonviable microorganisms, their fragments, spores or byproducts. Due to their role as potential sources of toxins, allergens and infectious pathogens, there is need to monitor indoor and outdoor air for potentially harmful bioaerosols. This need is underpinned by the growing threat of engaging airborne microbiological weapons of mass destruction in military expedition or acts of terrorism. In addition, bioaerosols may cause some diseases in crops and farm animals, and account for huge economic loss to farmers. Furthermore, in view of their ability to act as cloud condensation and ice nuclei, airborne microorganisms could influence precipitation and alter the hydrological cycle and the climate. Bioaerosols emission is therefore a factor to consider in the current global drive for sustainable environment in the face of climate change. Although advances in molecular, immunological and optical techniques have paved the way for highly efficient methods for bioaerosols detection, many studies assessing bioaerosols in Nigeria relied on culture techniques which are not only cumbersome and time-consuming but limited to viable and culturable microorganisms. Also, these traditional techniques could barely detect up to 1% of the microbial diversity of the study sites. To accelerate bioaerosols assessment in Nigeria, some modern methods, including molecular techniques, Matrix Assisted Laser Desorption-Ionization Time of Flight (MALDI-TOF), and Light Detection and Ranging (LIDAR) are hereby reviewed and advocated. Key words: Bioaerosols; Polymerase Chain Reaction; Nucleic acid sequencing; MALDI-TOF; LIDAR Introduction Natural and human activities could release liquid and solid materials into the air to form a suspension called aerosol. Aerosols which contain biological particles such as microorganisms (viruses, archaea, bacteria, protozoans and fungi) or microbial products such as spores, hyphae and toxins are referred to as ‗bioaerosols‘ (Georgakopoulos et al., 2009; Polymenakou, 2012). Other biogenic materials which may form part of bioaerosols include those of plant and animal origins (Grinshpun et al., 2007). The size of primary biological aerosols particles (PBAPs) has been estimated to range from 0.001μm to 100μm in diameter (Georgakopoulos et al., 2009). When released into the air, these tiny particles could be transported over a long distance and deposited elsewhere. Consequently, both indoor and outdoor air could be contaminated with bioaerosols, including viable microorganisms and toxins (Xu et al., 2011; Dungan and Leytem, 2009). The composition and concentration of bioaerosols generated in an environment have far-reaching impacts on people‘s well-being (Douwes et al., 2003; Ariya and Amyot, 2004). Airborne biological particles influence the formation of cloud droplets, ice nuclei and precipitation which may alter the hydrological cycle as well as the atmospheric chemical and physical processes of a place (Möhler et al., 2007; Lohmann and Feichter, 2005; Fröhlich-Nowoisky et al., 2016). These effects of PBAPs on the atmosphere suggest they influence climate change, which is of global concern today. These also partly justify the attention being given to Aerobiology in the scientific community since the last two decades (Xu et al., 2011). Apart from their impact on the climate, bioaerosols constitute health hazards (Duncan et al., 2002; Douwes et al., 2003; Searl, 2008; Pearson et al., 2015). Bioaerosol-contaminated air exposes humans to toxins, allergens and infectious pathogens of respiratory tract (Duncan et al., 2002; Lee, 2011). Specifically, many important bacterial diseases of humans, such as tuberculosis, anthrax and legionellosis, as well as many emerging and devastating viral diseases, including Severe Acute Respiratory Syndrome (SARS), Middle East Respiratory Syndrome (MERS) and influenza could be
transmitted through air (Douwes et al., 2003; Brooks et al., 2011; Fletcher and Noakes., 2011). Similarly, some opportunistic fungi, including Aspergillus species, Cryptococcocus neoformans and Pneumocystis jirovecii, which cause highly invasive mycoses in immunocompromised individuals, are basically contracted from contaminated air (Brown et al., 2012). Also, fungal spores and pollens (which are often borne by air) are well known triggers of allergic rhinitis, asthma and sinusitis (Burge and Rogers, 2000; Freye et al., 2001). Furthermore, the need for bioaerosols surveillance, especially, by standoff techniques, is underpinned by the rising threat of biological agents being used as weapons of mass destruction in acts of terrorism or military expedition (Riedel, 2004; Greenwood et al., 2009; Houle, 2010). Some factors which influence the health impact of bioaerosols on humans have been identified. These include the size of the biological particles, their concentration and inherent virulence characteristics, and the immune status of the exposed individuals (Lee et al., 2011; Madigan et al., 2009). Other determinants of bioaerosols health hazard potentials include the respiratory tract morphology and breathing characteristics of individuals, as these factors influence the deposition of inhaled particles in the airway (Hofmann, 2011). The particulate sizes of fungal spore, anemophilous pollen, bacterial cells and viruses commonly found in aerosols have been estimated to be in the range of 1–30μm, 17–58μm, 0.5-2μm and 0.3μm respectively (Georgakopoulos et al., 2009; Fröhlich-Nowoisky et al., 2016). While particles larger than 0.5μm are deposited by sedimentation and impaction, mainly, in the upper respiratory tract, those smaller than 0.5μm can easily reach the lower respiratory tract by diffusion (Fröhlich-Nowoisky et al., 2016). Bioaerosol particles 1–5μm in diameter generally pose more concern for respiratory diseases since they are readily transported into the lungs; however, those 1–2μm have the highest retention rate in the alveoli, and are most potentially harmful when inhaled (Salem and Gardner, 1994). The adverse impact of PBAPS transcend human health hazards as they are also known to cause some important animal and plant diseases which reduce the quantity and quality of food supplies as well as farmers‘ income annually (Artz et al., 2011; Fröhlich-Nowoisky et al., 2016). This is exemplified by the recurrent outbreak of avian influenza virus (Hartung, 1994; FAO, 2017). In respect of plants, diseases such as rusts and mildews, which account for significant economic loss to farmers worldwide, are caused by fungal pathogens that utilize wind as vehicle of transmission (Carvalho et al., 2011). Interestingly, it has been reported that winds can disperse spores of pathogenic fungi from one continent to another (Brown and Hovmøller, 2002). Beyond its agricultural implications, this intercontinental voyage of primary biological particle brings to bare the potential role of bioaerosols in inadvertent transmission of genetically modified plants across international boundaries (Angevin et al., 2008; Prabhu, 2009; Folloni et al., 2012). Although many undesirable effects of bioaerosols have been so far highlighted, it is arguable that the impacts of bioaerosols are not always negative. Quite surprisingly, recent studies have shown some positive effects of certain biological aerosol components on child health, particularly, those re-aerosolized by dust and pets (Maier et al., 2010; Azad et al., 2013). Combining a high-throughput sequencing technology and real-time quantitative polymerase chain reaction (qPCR), Azad et al. (2013) found that infants living with dog and cat pets have more microbiota diversity than their counterparts who do not live with such pets. In view of ‗hygiene theory‘, children who have more exposure to environmental microorganisms early in life tend to have lower risk for allergic diseases when they grow older (Hesselmer et al., 1999; Ownby et al., 2002). Hence, the results of Azad et al. (2013) suggest that early contact with pets improves the health status of children who are genetically predisposed to allergic diseases. Besides lowering the risk for atopy in children, bioaerosols are central elements in the development, evolution and dynamism of ecosystems (Xu et al., 2011). Their crucial role in the dispersal of propagules such as pollens from plants and spores from microbes over long distances, and across

geographical barriers, thereby contributing to geographical shift of biomes and genetic exchange between organisms of different habitats have been observed (Womack et al., 2010; Després et al., 2012). Sources of bioaerosols Many studies aimed at understanding the atmospheric distribution of microorganisms have been conducted (Jaenicke, 2005; Christner, 2012; DeLeon-Rodriguez et al., 2013). Against the earlier assumption that the atmospheric ambience is too inclement and oligotrophic to support the growth of microorganisms, aerobiologists now believe there are evidence that the atmosphere is indeed a habitat for micro-organisms and not a mere conduit for terrestrial and aquatic life (Womack et al., 2010). In a recent study, Amato et al. (2017) examined the microbial communities in cloud water collected at puy de DoÃme Mountain's meteorological station, France (1.465km altitude) using the Illumina MiSeq sequencing platform and found that the communities consisted of ~103−104 bacteria and archaea, and ~102−103 eukaryote cells (mL-1) that appeared extremely rich, with more than 28000 and 26000 distinct species detected in the bacteria and eukaryotes respectively. In an earlier research, Hill et al. (2007) demonstrated nitrogen cycling (including mineralization and nitrification) in the clouds, suggesting a strong chemical footprint of metabolically active microorganisms in the atmosphere. Similarly, there is some evidence for carbon cycling in the clouds, although this is not as clear as the case for nitrogen (Womack et al., 2010; Vaitilingom et al., 2010). How far could microbes go above the land and sea, and still fare well? The ubiquity of microbial communities in the atmosphere is mind-boggling as bacteria and fungi have been isolated from air samples collected from the troposphere, stratosphere and mesosphere (Wainwright et al., 2003; Griffin, 2004; Polymenakou, 2012). The journey of microorganisms to these high altitudes is not inexplicable as bioaerosols including viable microbes are released incessantly into the atmosphere due to natural and human activities. These human (anthropogenic) actions include agricultural activities involving intensive animal husbandry, composting and irrigation (Sánchez-Monedero, 2005; Skyes et al., 2007; Xu et al., 2011); some procedures in healthcare facilities and research centres leading to generation of biological wastes (Augustowska and Dutkiewicz, 2006); and the deliberate release of microorganisms, spores or toxins into the air in acts of biological warfare (Riedel, 2004; Greenwood et al., 2009; Houle, 2010). Natural activities that could generate bioaerosols include the actions of winds, water, animals and plants. Studies have shown that desert dust storms could transport bioaerosols, including microorganisms, over 5000 km away from where they were generated (Prospero et al., 2005; Kellogg and Griffin 2006; Griffin et al., 2007). Similarly, the oceans (which make up 70% of the globe) are laden with decaying organisms, including bacteria, archaea, fungi and algae; these biogenic materials are frequently aerosolized through bubble-bursting mechanisms in the same way sea salt and other particles are emitted from ocean surfaces (O‘Dowd et al., 2004). Plants form another important natural source of bioaerosols emission as they release pollens in the course of reproduction (Freye et al., 2001). Dead plants could release biological particles into the air as they decay. Adding to the emission sources of bioaerosols are microbial surface communities found on plants, soil and rocks (Morris and Kinkel, 2002). The total surface area occupied by these surface microbial communities is about 85 X 106 km2, which is greater than the combined ground surface areas of American and African continents (Elbert et al., 2012; Fröhlich-Nowoisky et al., 2016). Members of cryptogamic covers include varying populations of cyanobacteria, archaea, algae, fungi, lichens and bryophytes (Morris and Kinkel, 2002). Microbial populations vary between different types of built environments such as schools, houses and hospitals (Tringe et al., 2008; Kembel et al., 2012). Adding to this variation is the evidence that different rooms within the same building, for example, bedroom versus bathroom, may have distinct

microbiomes (Dunn et al., 2013). Humans spend more than 90% of their time indoors, and this further highlights the need for assessment of indoor air quality. Recent studies have focussed on characterizing indoor environments using high-throughput sequencing techniques (Smith et al., 2012; DeLeon-Rodriguez et al., 2012). However, while many of these studies have characterized the community composition of airborne microorganisms in various settings, the specific sources of indoor bioaerosols and the rate of their emission remain largely uncharacterized. Prussin and Marr (2015) identified eight major source categories of indoor airborne microorganisms, which were humans, pets, plants, plumbing systems, HVAC (heating, ventilation, and air conditioning) systems, mould, dust re-suspension, and the outdoor environment. This study was, however, limited to only whole microorganisms, leaving out other categories of bioaerosols. A similar study by Adams et al. (2015) concluded that outdoor air and some unidentified sources account most significantly for microorganisms present in indoor air. On the contrary, other studies have implicated humans as major determinants of microorganisms in indoor settings (Hospodsky et al., 2012; Meadow et al., 2014). Although further studies are required for a definitive knowledge on the forgoing, the role of humans in indoor microbial community cannot be simply ignored. One recent study found that a fully grown, healthy adult, weighing 70kg (a ‗reference man‘) harbours as many as 3.8 X 10¹³ bacteria distributed in and on his body (Sender et al., 2016). A greater proportion of this microbiota is found within the gastrointestinal tract and on the superficial and keratinized epidermal layer of the skin. The incessant shedding of these microbes-laden epithelial cells of the skin as well as the numerous organisms aerosolized from exhalation, talking, sneezing, coughing, etc. contribute significantly to airborne microorganisms in indoor environments, especially in buildings poorly ventilated and heavily occupied (Hospodsky et al., 2012). On bioaerosols emission rate from human microbiomes, Qian et al. (2012), using quantitative
molecular technique, observed that 3.7 × 10⁷ and 7.3 × 10⁶ bacterial and fungal genome copies, respectively, were on the average, emitted per person per hour. The corresponding mass emission rate for these values was ~30 mg per person per hour (Qian et al., 2012). More investigations are required to shed more light on this, like many other aspects of indoor bioaerosols studies. Some studies on bioaerosols in Nigeria Bioaerosols studies have been reported in some parts of Nigeria. These include Ogun, Osun and Oyo states in the South-West (Akinbami and Momodu, 2013; Alli and Ana, 2017; Enitan et al., 2017); Akwa-Ibom, Edo and Rivers states in South-South (Ekhaise and Ogboghodo, 2011; Mustapha et al., 2011; Ekpenyong et al., 2012; Agbawa and Onyemaechi, 2014; Ambrose et al., 2014; Omoigberale et al., 2014; Ambrose et al., 2015; Emuren and Ordinioha, 2016); and Nassarawa state in North-Central (Makut et al., 2014). Although these studies are recent, bioaerosols assessment in Nigeria has serious limitations. First, despite the need for frequent surveillance of outdoor and indoor airs, there is poor coverage of bioaerosols assessment in the country and the quality of air in many parts of the country has not been reported. Second, the studies that have been reported within the country so far involved the use of culture techniques which can capture barely 1% of the microbial diversity of environmental samples (Handelsman, 2004). This limitation exists because many microorganisms, including archaea, some viruses, and certain bacteria are not cultivable. Third, culture methods are generally cumbersome and time-consuming as microorganisms require different media and conditions of incubation (Jensen and Schafer, 1998). These limitations together hamper the validity and reliability of bioaerosol assessment in the country creating the need for engaging modern methods which are very sensitive, reliable, and have quick turnaround time. Some of these methods are hereby highlighted.

Polymerase chain reaction (PCR) Invented by Kary Mullis in 1983, PCR is a technique used in molecular biology to amplify any nucleotide sequence selectively across several orders of magnitude, generating thousands to millions copies of the sequence in an entirely in vitro process (Nelson and Cox, 2005). Due to its elegant simplicity, specificity and versatility, the technique is widely used in bioaerosols studies around the world (Summerbell et al., 2011). The PCR process requires a thermostable DNA polymerase (such as the Taq polymerase isolated from Thermus aquaticus), a pair of oligonucleotide primers (forward and reverse primers) specific for a region of the template nucleic acid, magnesium chloride, a buffer, ultrapure water and a thermocycler. Through multiple cycles (usually 20 to 35) of DNA template denaturation (90-94oC), primer annealing (45-65oC), and primer elongation (70-74oC) in the thermal cycler, sufficient copies of the desired sequence of the template DNA are generated (Willey et al., 2012). To visualize these PCR amplified products, the amplicons are stained with a fluorescent dye, for example, ethidium bromide, electrophoresed in agarose gel, and viewed under UV light (Satyanarayana and Chakrapani, 2011). Alternatively, gel documentation box could be used for this purpose. A standard molecular weight marker is usually run alongside the amplicons to enable their sizes to be determined. The amplified DNA can also be processed for downstream reactions such as genetic fingerprinting, clone library analysis, and microarray (Dungan and Leytem, 2009). Some DNA fingerprinting techniques commonly used to identify microbial composition of bioaerosols include restriction fragment length polymorphism (RFLP), terminal restriction fragment length polymorphism (TRFLP), denaturation and temperature gradient gel electrophoresis, and ribosomal intergenic spacer analysis (Nehme et al., 2008; Rasmussen, 2012; Despres et al., 2012; Yoo et al., 2017). Although the conventional PCR technique has been very useful in life sciences, it is limited because the quantity of PCR amplicons present in the reaction mix at each cycle cannot be determined. Rather, the technique is an end point process in which the amplicons are quantified at the end of amplification using other downstream reactions. Apart from being time consuming, such downstream reactions are susceptible to contamination which could reduce the overall performance characteristics of the conventional PCR technique (Seifi et al., 2012). To surmount these limitations, the real-time PCR and droplet digital PCR have been developed, and are currently used for bioaerosols studies (Hospodsky et al., 2010). The merit of PCR techniques in bioaerosols assessment is underpinned by quick turnaround time, high sensitivity and specificity. However, the technique is deemed expensive in resource limited countries such as Nigeria. Nucleic Acid Sequencing Since the invention of the polymerase chain reaction (PCR), nucleic acid-based techniques have been used widely in life sciences, especially in the identification and characterization of microorganisms (Bustin, 2010; Brooks, 2013). While studies in the past focused on a few genes per time, molecular biology has moved from genes to genomes- the total genetic contents of an organism, and this transition is going so fast, changing previous perspectives in biology that it has been dubbed ‗the Genomics Revolution‘ (Cathomen and Ehl, 2014). Aerobiology is not left out in this ‗revolution‘ as cutting-edge genomics techniques are currently being used to determine the microbial diversity of air as far as possible by studying the collective genomes of all members of the microbial community without culturing (Handelsman, 2004; Ni et al., 2013; Mbareche et al., 2017). This approach which obviates culture methods and has made possible, assessment of even uncultivable microorganisms such as members of Archaea and some viruses has been dubbed metagenomics. The first two steps in metagenomics studies are sampling of the environment and extracting the total DNA present in the sample. In every study, the sample should be a true representation of the

environment of interest. For bioaerosols assessment, many sampling methods are available, among which investigators are expected to choose depending on the objectives of their study. These sampling methods and their strengths and limitations are discussed elsewhere (Cartwright et al., 2009). DNA extraction from bioaerosols samples is critical to the quality of the study as poorly extracted or degraded DNA affects all other subsequent steps of the analysis. It involves lysing the microorganisms present in the sample to release their nucleic acids; separation of DNA from proteins, RNA and other cellular materials; and purification of the DNA. Many DNA extraction kits available commercially have been adapted successfully for bioaerosols studies. These include Ultra-Clean plant DNA isolation kit (MoBio Laboratories, Carlsbad, CA) (Bowers et al., 2009), and Qiagen QIAamp DNA extraction kits (Lecours et al., 2012). Investigators are expected to follow the standard protocol of a chosen method as contained in the inserts of the kits. It is also necessary to confirm that the DNA extraction was successful and the DNA is pure enough and sufficient for the analysis. There are two approaches to metagenomics, which are comparative and functional metagenomics. The former provides an overview of what organisms are present in a community. In this approach, certain genes in the total DNA extracted from the community are amplified through PCR and sequenced, and the nucleotide sequences obtained are analysed to identify members of that community and their phylogenetic relationship with members of other communities (Nayfach and Pollard, 2016). The genes selected for this purpose are those with both highly conserved and variable regions. Usually, the 16S rRNA genes and the ribosomal internal transcribed spacer (ITS) are candidates of choice for bacteria and fungi respectively (Zheng, 2014). Concisely, when these genes are amplified and sequenced, overlapping reads or contigs are assembled and binned (clustered), that is, grouped and assigned operational taxonomic units (Grice and Segre, 2012). Each of these steps, beginning from assembly require Bioinformatics tools, which in many cases are hosted online and accessible to the public. Although comparative genomics is fast and useful for a quick survey of microbial communities, including those in aerosols, the approach has a few limitations. These include a possible amplification bias of the selected genes which may affect accuracy of the approach; inability to differentiate between two very similar strains; inflation of operational taxonomic units (OTUs) due to sequencing error; and inability to discriminate variable copy number of 16S rRNA gene in prokaryotes (Saha, 2012). The latter approach provides a picture of the role (the functions) of members of the community. Functional metagenomics does not require amplification of the 16S rRNA/ITS genes, and hence, is immuned to amplification bias. Rather, the genomic DNA extracted from the community is deeply sequenced. The approach involves fragmenting the DNA, construction of paired-end libraries, sequencing of heterogeneous mixture of DNA, and the use of Bioinformatics tools for alignment of sequence reads, identification of metabolic pathways and gene functions (Grice and Segre, 2012; Saha, 2012). The whole genome metagenomics provides a better classification than 16S rRNA/ITS community survey. However, it requires a high depth of sequencing coverage, and an uneven coverage may complicate metagenomes assembly (Ghurye et al., 2016). An overview of current nucleic acid sequencing platforms is given in Table 1. Table 1: Overview of current sequencing technologies (Adapted from Ghurye et al., 2016).
Technology Read Length
Accuracy Time per run
Bases per run

Single Molecule Real-Time Sequencing (Pacific Biosciences)
10 kbp to 15 kbp
87% (Low) 30 minutes to 4 hours
5 – 10 Gb
Oxford Nanopore MinION Sequencing
5 kbp to 10 kbp
70% to 90% (Low)
1 to 2 days 500 Mb
Ion Semiconductor (Ion Torrent sequencing)
Up to 400 bp
98% (Medium)
2 hours 10Gb
Sequencing by synthesis (Illumina)
50 – 300bp 99.9% (High)
1 to 11 days 300 Gb
Sequencing by ligation (SOLiD sequencing)
75 bp 99.9% (High)
1 to 2 weeks 3 Gb
Pyrosequencing (454)
700 bp 98% (Medium)
24 hours 400 Mb
Chain termination sequencing (Sanger sequencing)
400 to 900 bp
99.9% (High)
20 mins to 3 hours
50 – 100 Kb
In Nigeria, where bioaerosols studies have so far relied majorly on settle plates method, engaging metagenomics approach will impact positively on the field of study by enabling researchers within the country to have a full grasp of the microbial communities in the air. Matrix assisted laser desorption/ionization time of flight (MALDI-TOF) MALDI-TOF involves soft ionization of samples, sorting, and detection of ions. This soft ionization is achieved by striking a matrix of small organic molecules (such as 3, 5-dimethoxy-4-hydroxycinnamic acid, 2, 5-dihydroxybenzoic acid (DHB) and α-cyano-4-hydroxycinnamic acid) with a laser beam. The matrix which contains a conjugated pi system of benzene ring absorbs energy in form of UV light, thereby ablating the analyte into plumes (Signor and Boeri, 2013). The ‗time of

flight‘ (TOF) separates the ions by their mass-to-charge ratio which is determined by the time it takes the ions to reach (‗fly to‘) a detector (Emonet et al., 2010). With MALDI-TOF, unique biomarker spectra for specific microorganisms and biogenic substances could be generated and stored in databases to serve as reference for analysis of biological samples (Yerlekar and Kshirsagar, 2014). This affords the method its minimal workload and excellent sensitivity. Earlier application of MALDI-TOF in microbiological studies required prior culturing of the sample on growth media to obtain microbial colonies (Emonet et al., 2010). Obviously, this requirement for isolates made the technique susceptible to the inherent limitations of culture methods, as highlighted earlier. However, a recent study by Druckenmüllera et al. (2017) found this method not only comparable with 16S rRNA sequencing but also suitable for cultivation-independent, routinely applicable approach to identifying microbial fractions in bioaerosol emission samples. MALDI-TOF therefore has the potential to scale up bioaerosols assessment significantly. Real-time bioaerosols surveillance techniques Bioaerosols are important agents of biological warfare. With the growing threat of terrorism and biological attack around the world, the need to constantly monitor indoor and outdoor air is becoming much more obvious (Houle, 2010). Countering airborne biological weapons effectively requires a real-time surveillance of outdoor and indoor air in a way that ensures quick response to the release of harmful bioaerosols. Interestingly, automated bioaerosols sensors are beginning to surface. One of such is the Automated Pathogen Detection System (APDS), a lectern-size machine capable of a continuous, automated, 24-hour surveillance of air for up to 100 pathogens, with results being reported every 30 minutes (Science and Technology Review, 2004). This sensor can be placed in airports, office buildings, performing arts centers, mass transit systems, sporting arenas or anywhere harmful bioaerosol agents might be released. How the APDS works has been described by Science and Technology Review (2004) and Hindson et al. (2004). The machine first collects air samples and quickly runs them through a deeply multiplexed immunoassay detector; if the detector returns a positive signal, a second assay based on quantitative nucleic-acid amplification is performed. Running a sample on two different assay systems increases the machine‘s reliability and minimizes the possibility of giving out false positive results. Other real-time bioaerosols assessment techniques that have been developed include a variety of instruments that work on the principle of auto-fluorescence (Xu et al., 2011). Biological materials contain fluorophores, including NAD(P)H, riboflavin, and amino acids such as lysine, tryptophan and phenylalanine, that could emit unique fluorescence signals when excited with light of appropriate wave length (Pan, 2015). This phenomenon called auto-fluorescence has been harnessed in various instruments to detect and determine the concentration of biological particles in aerosols (Mandal and Brandl, 2011; Despres et al., 2012). One commonly used excitation source is laser (Laser induced fluorescence-LIF) (Houle, 2010). Some studies have shown that bacterial and fungal spores can be differentiated from one another through their different fluorescence spectra, which is a function of the fluorophores which they contain (Saari et al. 2013; Saari et al., 2014). These differences are used to create a library of excitation-emission matrix (EEM) spectra of microorganisms, which could be used to identify the organisms in bioaerosols (Pan, 2015). LIF-based instruments for real-time bioaerosols assessment include the Ultraviolet Aerodynamic Particle Sizer (UV-APS) and Wide Issue Bioaerosol Spectrometer (WIBS) (Agranovski et al., 2003; O‘Connor et al., 2014). Although auto-fluorescence techniques have the potentials to scale up bioaerosols surveillance, their possible limitations include interference by other biogenic fluorescent materials such as chlorophylls (Pohlker et al., 2012). Also, the excitation and emission maxima of a collection of biological materials can be much more complex than the absorption and emission peak wavelength of each primary

fluorophores in the material. This complexity arises because the fluorescence of the primary biological fluorophores is influenced by their local environmental conditions such as pH, concentrations of certain ions, temperature, relative humidity, and the relative connection with other molecules (Pan, 2015). Standoff bioaerosols detection techniques Before the 20th Century, major efforts to detect bioaerosols were based on point biological detectors which must be within a cloud of biological particles to detect them (Simard et al., 2002). In ventilation room of a building and other narrow spaces, this limitation is minimal. However, in a wide-open area where an array of many point detectors is required to effectively monitor a multi-square kilometer, the cost of using many detectors concurrently comes into view (Simard, 2006). To overcome this shortcoming, standoff biodetectors based on Light Detection and Ranging (LIDAR) technologies are being currently used for remote sensing of bioaerosols (Yang et al., 2016). Apart from beating down the cost of bioaerosol monitoring over a wide range of area, these detectors are important for developing Early-Warning System (EWS) against aerosolized biological weapons of mass destruction (Houle, 2010). A typical LIDAR system consists of light emitter, usually composed of a short-pulsed laser source and optics to guide the light energy to the target; a collector composed of optics, which collect the scattered light returned from the probed target, and a detector which measures the scattered-light within nanoseconds time resolution (Houle, 2010; Yang et al., 2016). The set up may also include a spectrometer to measure the scattered signal's spectral properties of the target. The working principle of LIDAR is hinged on many optoelectronic interactions such as Rayleigh scattering, Mie scattering, Raman scattering, resonance scattering, fluorescence as well as differential absorption that are orchestrated when a bioaerosol particle interacts with light (Simard, 2006; Houle, 2010; Yang et al., 2016). In simpler tone, bioaerosols have unique elastic and inelastic light scattering properties which could be collected using sensitive detectors to discriminate harmful biological agents from background noises such as dust, smoke, etc. (Xu et al., 2011; Fröhlich-Nowoisky et al., 2016). Examples of LIDAR systems include Standoff Integrated Bioaerosol Active Hyperspectral Detection (SINBAHD); Biological Agent LIDAR (BALI); BIOLIDAR, and the Frequency Agile LIDAR (FAL) (Rustad and Farsund, 2008; Research and Technology Organization of NATO, 2010). Future perspective Although bioaerosol surveillance in Nigeria has been moving at a snail pace due the shortcomings of culture methods, the future is still bright for bioaerosol scientists in the country. As rightly pointed out by Haddrell and Thomas (2017), multidisciplinary approaches combining existing and novel techniques in atmospheric chemistry, aerobiology and molecular biology are merging to expand our knowledge of microbial communities and other biological particles in the atmosphere. To scale up bioaerosols assessment in Nigeria, scientists within the country need to take advantage of currently available modern techniques. References Adams, R.I., Bhangar, S., Pasut, W., Arens, E.A., Taylor, J.W., Lindow, S.E., Nazaroff, W.W. and
Bruns, D.T. (2015). Chamber bioaerosol study: Outdoor air and human occupants as sources of indoor airborne microbes. PLoS One, 10:e0128022.

Agbagwa, O. E. and Onyemaechi, S. A. (2014). Microbiological quality of indoor air of a general
hospital and a health center in Rivers State, Nigeria. Int J Curr Microbiol Appl Sci, 3: 424‑31.
Agranovski, V., Ristovski, Z., Hargreaves, M., Blackall, P and Morawska, L. (2003). Real-time measurement of bacterial aerosols with the UVAPS: Performance evaluation. Journal of Aerosol Science, 34(3):301-317.
Akinbami, C. A. O. and Momodu, A. S. (2013). Health and Environmental Implications of Rural
Female Entrepreneurship Practices in Osun State Nigeria. Ambio, 42(5): 644–657.
Alli, A. and Ana, G. (2017). Indoor and Outdoor Concentrations of Bioaerosols and Meteorological
Conditions of Selected Salons in Four Areas of Ibadan North Local Government Area,
International Journal of Environmental Monitoring and Analysis, 5(3): 83-90.
Amato, P., Joly, M., Besaury, L., Oudart, A., Taib, N., Mone, A.I., Deguillaume, L., Delort, A.M. and Debroas, D. (2017). Active microorganisms thrive among extremely diverse communities in cloud water. PLoS ONE, 12(8): e0182869.
Ambrose, I. S., Nweke, C. O., Umeh, S. C. I., Essien, J. P. and Akpan, P. (2014). Bioaerosols load, spatial distribution and quality in the outdoor air environment of Uyo urban in Akwa Ibom State, Nigeria. Worl. J. Sci. and Tech, 3: 231 – 238
Ambrose, I., Braid, W. and Essien, J. (2015). Assessment of Air Quality (Bioaerosols) of the
Municipal Waste Dumpsite in Uyo Urban, Akwa Ibom State, Nigeria. International Journal
of Scientific and Research Publications, 5(9): 1-5.
Angevin, F., Klein, E.K., Choimet, C., Gauffreteau, A., Lavigne, C.,Messéan, A.,Meynard, J.M. (2008). Modelling impacts of cropping systems and climate on maize cross pollination in agricultural landscapes: The MAPOD model. European Journal of Agronomy, 28:471–484.
Ariya, P.A. and Amyot, M. (2004). New Directions: The role of bioaerosols in atmospheric chemistry and physics. Atmospheric Environment, 38: 1231–1232.
Arzt, J., Juleff, N., Zhang, Z. and Rodriguez, L.L. (2011). The pathogenesis of foot-and-mouth disease: Viral pathways in cattle. Transboundary Emerging Diseases, 58, 291–304.
Augustowska, M. and Dutkiewicz, J. (2006). Variability of airborne microflora in a hospital ward within a period of one year. Annals of Agriculture, Environment and Medicine, 13:99-106.
Azad, M.B., Konya, T., Maughan, H., Guttman, D.S., Field, C.J., Sears, M.R., Becker, A.B., Scott, J.A. and Lozyrskyi, A.L. (2013). Infant gut microbiota and the hygiene hypothesis of allergic disease: Impact of household pets and siblings on microbiota composition and diversity. Allergy, Asthma and Clinical Immunology, 9:15. Available at: https://doi.org/10.1186/1710-1492-9-15. Accessed 4 October, 2017.
Bowers, R. M., Lauber, C. L., Wiedinmyer, C., Hamady, M., Hallar, A. G., Fall, R., Knight, R. and Fierer, N. (2009). Characterization of airborne microbial communities at a high elevation site and their potential to act as atmospheric ice nuclei. Applied Environmental Microbiology, 75, 5121:5130.
Brooks, F.G., Carrol, C.K., Butel, S.J., Morse, A.S. and Mietzner, A.T. (2011). Jawetz, Melnick&Adelberg’s Medical Microbiology. 25th edition. New York: McGraw-Hill Companies, Inc, pp. 213-219
Brooks, H.J.L. (2013). Modern microbiology-a quiet revolution with many benefits. Australasian Medical Journal, 6(7): 378–381.

Brown, G.D., Denning, D.W., Gow, N.A.R., Levitz, S.M., Netea, M.G., White, T.C., (2012). Hidden killers: Human fungal infections. Science Translational Medicine, 4(165):13.
Brown, J. and Hovmoller, M. Aeriel dispersal of fungi on the global and continent scales and its consequence for plant disease. Science, 297: 537-541
Burge, H.A. and Rogers, C.A. (2000). Outdoors allergens. Health Perspective, 108 (S4):653-659 Bustin, S.A. (2010). The PCR Revolution: Basic Technology and Applications. New York, USA: Cambridge
University Press, p.Xi Cartwright, C., Horrocks, S., Kirton, J. and Crook, B. (2009). Review of Methods to Measure Bioaerosols
from Composting Sites. Bristol, UK: Environmental Agency. Available at: cdn.environment-agency.gov.uk/scho0409bpv-e-epdf. Accessed 3 October, 2017.
Carvalho, C.R., Fernandes, R.C., Carvalho, G.M.A., Barreto, R.W. and Evans, H.C. (2011). Cryptosexuality and the genetic diversity paradox in coffee rust, Hemileia vastatrix. PLoS One, 6:e26387.
Cathomen, T. and Ehl, S. (2014). Translating the genomic revolution — targeted genome editing in primates. The New England Journal of Medicine, 370:2342-2345.
Christner, B.C. (2012). Cloudy with a chance of microbes. Microbe, 7(2):70–74. DeLeon-Rodriguez, N., Lathem, T., Rodriguez-R, L.M., Barazesh, J.E., Anderson, B.E., Beyersdorf,
A., Ziemba, D.L., Bergin, M., Nenes, A. and Konstandrinidis, K.T. (2013). Microbiome of the upper troposphere: Species composition and prevalence, effects of tropical storms, and atmospheric implications. Proceedings of the National Academy of Sciences, 110(7): 2575-2580.
Després, V.R., Huffman, J.A., Burrows, S.M., Hoose, C., Safatov, A.S., Buryak, G., Fröhlich-Nowoisky, J., Elbert, W., Andreae, M.O., Pöschl, U., Jaenicke, R. (2012). Primary biological aerosol particles in the atmosphere: A review. Tellus B: Chemical and Physical Meteorology, 64(1):1-57.
Douwes, J., Thorne, P. and Heederik, D. (2003). Bioaerosol health effects and exposure assessment: Progress and prospects. Annals of Occupational Hygiene, 47(3):187-200.
Druckenmüllera, K., Gärtnerb, B., Jäckelc, Kerstin Klugc, K., Schiffelsa, J., Güntherd, K. and Elbersa, G. (2017). Development of a methodological approach for the characterization of bioaerosols in exhaust air from pig fattening farms with MALDI-TOF mass spectrometry. International Journal of Hygiene and Environmental Health, 220:974–983
Duncan, J.R., Cock, M.L., Scheerlinck, J.P., Westcott, K.T., McLean, C., Harding, R. and Rees, S.M. (2002). White matter injury after repeated endotoxin exposure in the preterm ovine fetus. Pediatrics Research, 52(6):941-9.
Dungan, R.S. and Leytem, A.B. (2009). Qualitative and quantitative methodologies for determination of airborne microorganisms at concentrated animal-feeding operations. World Journal of Microbiology and Biotechnology, 25:1505–1518.
Dunn, R.R., Fierer, N., Henley, J.B., Leff, J.W. and Menninger, H.L. (2013). Home life: Factors structuring the bacterial diversity found within and between homes. PLoS One, 8:e64133.
Ekhaise, F. O. and Ogboghodo, B. F. (2011). Microbiological Indoor and Outdoor Air Quality of
Two Major Hospitals in Benin City, Nigeria. Sierra Leone J of Biomed Res, 3(3): 169-174.
Ekpenyong, C. E., Ettebong, E. O., Akpan, E. E., Samson, T. K. and Daniel, N. E. (2012). Urban
city transportation mode and respiratory health effect of air pollution: a cross-sectional study
among transit and non-transit workers in Nigeria. BMJ Open, 2(5): e001253.

Elbert,W., Weber, B., Burrows, S., Steinkamp, J., Büdel, B., Andreae, M.O., Pöschl, U. (2012). Contribution of cryptogamic covers to the global cycles of carbon and nitrogen. Nature Geoscience, 5:459–462.
Emonet, S., Shah, H.N., Cherkaoui, A. and Schrenzel, J. (2010). Application and use of various mass spectrometry methods in clinical microbiology. Clinical Microbiology and Infection, 16 (11):1604-1613.
Emuren, K. and Ordinioha, B. (2016). Microbiological assessment of indoor air quality at different
sites of a tertiary hospital in South‑South Nigeria. Port Harcourt Medical Journal, 10(2): 79-84.
Enitan, S., Ihongbe, J., Ochei, J., Effedua, H., Adeyemi, O. and Phillips, T. (2017). Microbiological
assessment of indoor air quality of some selected private primary schools in Ilishan- Remo,
Ogun state, Nigeria. International Journal of Medical and Health Research, 3(6): 8-19.
Fletcher L. and Noakes, C. (2011). The importance of bioaerosols in hospital infections and the potential for control using germicidal ultraviolet irradiation. Available at: http://www.efm.leeds.ac.uk/CIVE/aerobiology/PDFs/uv-and-airborne-hospital-infection-fletcher.pdf. Accessed 4 October, 2017.
Folloni, S., Kagkli, D.-M., Rajcevic, B., Guimarães, N.C.C., Van Droogenbroeck, B., Valicente, F.H., Van den Eede, G., Van den Bulcke, M. (2012). Detection of airborne genetically modified maize pollen by real-time PCR. Molecular Ecology Resources, 12:810–821.
Food and Agriculture Organization of the United Nations (2017). Highly pathogenic avian influenza (H5N1 HPAI) spread in the Middle East: Risk assessment. Empress Watch, 36:1-7.
Freye, H.B., King, J. and Litwin, C.M. (2001). Variations of pollen and mold concentrations in 1998 during the strong El Niño event of 1997-1998 and their impact on clinical exacerbations of allergic rhinitis, asthma, and sinusitis. Allergy and Asthma Proceedings, 22:239-247
Fröhlich-Nowoisky, J., Kamp, J.C., Weber, B., Huffman, J.A., Pohlker, C., Andreae, M.O., Lang-Yona, N., Burrows, M.S. and Gunth, S.S (2016). Bioaerosols in the Earth system: Climate, health, and ecosystem interactions. Atmospheric Research, 182:346-376.
Georgakopoulos, D.G., Despres, V., Froehlich-Nowoisky, J., Psenner, R., Ariya, A.A., Posfai, M., Ahern, H.E., Moffett, B.F. and Hill, T.C.J. (2009). Microbiology and atmospheric processes: Biological, physical and chemical characterization of aerosol particles. Biogeosciences, 6:721-737.
Ghurye, J. S., Cepeda-Espinoza, V. and Pop, M. (2016). Metagenomic Assembly: Overview, Challenges and Applications. The Yale Journal of Biology and Medicine, 89(3): 353–362.
Greenwood, D.P., Jeys, T.H., Johnson, B., Richardson, J.M. and Shatz, M.P. (2009). Optical techniques for detecting and identifying biological-warfare agents. Proceedings of the Institute of Electrical and Electronics Engineers, 97(6):971-989.
Grice, E. and Segre, J. (2012). The human microbiome: Our second genome. Annual review of
genomics and human genetics, 13: 151-170.
Griffin, D.W. (2004). Terrestrial microorganisms at an altitude of 20,000 m in Earth‘s atmosphere. Aerobiologia, 20:135–140.
Griffin, D.W., Kubilay, N., Kocak, M., Gray, M.A., Borden, T.C., Shinn, E.A. (2007). Airborne desert dust and aeromicrobiology over the Turkish Mediterranean coastline. Atmospheric Environment, 41:4050–4062.
Grinshpun, S. A., Buttner, M. P. and Willeke, K. (2007). Sampling for airborne microorganisms. In C. J. Hurst, R. L. Crawford, J. L. Garland, D. A. Lipson, A. L. Mills and L. D. Stetzenbach

(Eds.), Manual of Environmental Microbiology. 3rd edition. Washington, D.C: ASM Press, pp. 939-951.
Haddrell, A. E. and Thomas, R. J. (2017). Aerobiology: Experimental considerations, observations and future tools. Appllied Environmental Microbiology, 18(17): e00809-17.
Handelsman, J. (2004). Metagenomics: Application of genomics to uncultured microorganisms. Microbiology and Molecular Biology Review, 68(4): 669–685.
Hartung, J. (1994). The effect of airborne particulates on livestock health and production. In: A.P. Dewi, R.F.E. Axeford, I. Fayez, M. Marai and H. Omed, eds., Pollution in Livestock Production Systems. Wallingford, UK: CAB International, pp. 55-69.
Hesselmar, B., Aberg, N., Aberg, B., Eriksson, B., Bjorksten, B. (1999). Does early exposure to cat or dog protect against later allergy development? Clinical and Experimental Allergy, 29: 611-617.
Hill, K., A., Shepson, P.B., Galbavy, E.S., Anastasio, C., Kourtev, P.S., Konopka A. and Stirm B.H. (2007). Processing of atmospheric nitrogen by clouds above a forest environment. Journal of Geophysical Research, 112, 1–16.
Hindson, B., McBride, M., Makarewicz, A., Henderer, B., Sathyam, S., Nasarabadi, S., Venkateswaran, K., Gutierrez, D., Smith, S., Metz, T. and Colston, B. (2004). Autonomous Pathogen Detection System. Available at: https://www.ncbi.nlm.nih.gov/pubmed/15741059 Accessed 20 November, 2017.
Hofmann, W. (2011). Modelling inhaled particle deposition in the human lung-a review. Journal of Aerosol Science, 42:693–724.
Hospodsky, D., Qian, J., Nazaroff, W.W., Yamamoto, N., Bibby, K., Rismani-Yazdi, H. and Peccia, J. (2012). Human occupancy as a source of indoor airborne bacteria. PLoS One, 7:e34867.
Hospodsky, D., Yamamoto, N. and Peccia, J. (2010). Accuracy, Precision, and Method Detection
Limits of Quantitative PCR for Airborne Bacteria and Fungi. Appl. Environ. Microbiol,
76(21):7004-7012.
Houle, O. (2010). Bioaerosol monitoring using fluorescence-inducing lidar: The effect of the age of bacteria on their fluorescing properties. Available at: https://www.google.com/search?q=Houle,+O.+(2010).+Bioaerosol+monitoring+using+fluorescenceinducing+lidar:+The+effect+of+the+age+of+bacteria+on+their+fluorescing+properties&ie=utf-8&oe=utf-8&client=firefox-b ab&gfe_rd=cr&dcr=0&ei=dT7WWdKYG5Lc8AeJ8bHwBw. Accessed 5 October, 2017.
Jaenicke, R. (2005). Abundance of cellular material and proteins in the atmosphere. Science, 308:73–73.
Jensen, P.A. and Schafer, M.P. (1998). Sampling and characterization of bioaerosols. NIOSH Manual of Analytical Methods, pp. 82-112. Available at: https://www.cdc.gov/niosh/docs/2003-154/pdfs/chapter-j.pdf Accessed 4 October, 2017.
Kellogg, C.A. and Griffin, D.W. (2006). Aerobiology and the global transport of desert dust. Trends in Ecology and Evolution, 21:638–644.
Kembel, S.W., Jones, E., Kline, J., Northcutt, D., Stenson, J., Womack, A.M. Bohannan, B.J.M., Brown, G.Z. and Green, J.L. (2012). Architectural design influences the diversity and structure of the built environment microbiome. Multidisciplinary Journal of Microbial Ecology, 6:1469–79.
Lecours, P.B., Veillette, M., Marsolais, D., and Duchainea, C. (2012). Characterization of bioaerosols from dairy barns: Reconstructing the puzzle of occupational respiratory diseases by using molecular approaches. Applied and Environmental Microbiology, 78 (9):3242–3248

Lee, B.U. (2011). Life comes from the air: A short review on bioaerosol control. Aerosol and Air Quality Research, 11: 921–927.
Lohmann, U., and Feichter, J. (2005). Global indirect aerosol effects: A review. Atmospheric Chemistry and Physics, 5:715-737.
Madigan, M.T., Martinko, J.M., Dunlap, P.V. and Clark, D.P. (2009). Brock Biology of Microorganisms. 12th edition. New York: Benjamin Cummings, pp.118-136
Maier, R.M., Palmer, M.W., Andersen, G.L., Halonen, M.J., Josephson, K.C. and Maier, R.S., Martinez, F.D., Neilson, J.W., Stern, D.A., Vercelli, D. and Wright, A.L. (2010). Environmental determinants of and impact on childhood asthma by the bacterial community in household dust. Applied Environmental Microbiology, 76:2663–2667.
Makut, M., Nyam, M., Shehu, L. and Anzaku, S. (2014). A survey of microflora of the outdoor air
environment of Keffi Metropolis, Nasarawa state, Nigeria. African Journal of Microbiology
Research, 8(27): 2650-2655.
Mandal, J. and Brandl, H. (2011). Bioaerosols in indoor environment - A review with special reference to residential and occupational locations. The Open Environmental & Biological Monitoring Journal, 4: 83-96.
Mbareche, H., Brisebois, E., Veillette, M. and Duchaine, C. (2017). Bioaerosol sampling and detection methods based on molecular approaches: No pain no gain. Science of the Total Environment, 599(600):2095-2104.
Meadow, J., Altrichter, A., Kembel, S., Kline, J., Mhuireach, G., Moriyama, M, Northcutt, D., O‘Connor, T.K., Womack, A.M., Brown, G.Z., Green, J.L. and Bohannan, B.J. (2014). Indoor airborne bacterial communities are influenced by ventilation, occupancy, and outdoor air source. Indoor Air, 24:41–8.
Möhler, O., DeMott, P.J., Vali, G. and Levin, Z. (2007). Microbiology and atmospheric processes: The role of biological particles in cloud physics. Biogeosciences, 4:1059-1071.
Morris, C. E. and Kinkel, L. L. (2002). Fifty years of phyllosphere microbiology: Significant contributions to research in related fields. In S.E. Lindow, E.I. Hecht-Poinar and V.J. Elliot, eds., Phyllosphere Microbiology. Minnesota: APS Press., pp.365-375.
Mustapha, B. A., Blangiardo, M., Briggs, D. J. and Hansell, A. L. (2011). Traffic Air Pollution and
Other Risk Factors for Respiratory Illness in Schoolchildren in the Niger-Delta Region of
Nigeria. Environmental Health Perspectives, 119(10): 1478–1482.
Nayfach, S. and Pollard, K. S. (2016). Toward Accurate and Quantitative Comparative
Metagenomics. Cell, 166(5), 1103–1116.
Nehme, B., Le´tourneau, V.L., Forster, R.J., Veillette, M. and Duchaine, C. (2008). Culture-independent approach of the bacterial bioaerosol diversity in the standard swine confinement buildings and assessment of the seasonal effect. Environmental Microbiology, 10:665–675.
Nelson, D. and Cox, M. (2005). Lehninger principles of biochemistry (4th ed.). Freeman and Company: New York.
Ni, J., Yan, Q. and Yu, Yuhe. (2013). How much metagenomic sequencing is enough to achieve a given goal? Available at: https://www.nature.com/articles/srep01968 Accessed 4 October, 10/2017.

O‘Connor , D., Healy, D.A., Hellebust, S., Buters, J.T.M. and Sodeau, J.R. (2014). Using the WIBS-4 (Waveband Integrated Bioaerosol Sensor) technique for the on-line detection of pollen grains. Aerosol Science and Technology, 48:4, 341-349.
O‘Dowd, Facchini, M. C., Cavalli, F., Ceburnis, D, Mircea, M., Decesari, S., Fuzzi, S., Yoon, Y. and Putaud, J. P. (2004). Biogenically driven organic contribution to marine aerosol, Nature, 431(7009): 676-80.
Omoigberale, M. N., Amengialue, O. O., Iyamu, M. I. (2014). Microbiological assessment of hospital
indoor air quality in Ekpoma, Edo State, Nigeria. Glob Res J Microbiol, 4:1‑5.
Ownby, D.R., Johnson, C.C., Peterson, E.L. (2002). Exposure to dogs and cats in the first year of life and risk of allergic sensitization at 6 to 7 years of age. JAMA, 288: 963-972.
Pan, Y. (2015). Detection and characterization of biological and other organic-carbon aerosol particles in atmosphere using fluorescence. Journal of Quantitative Spectroscopy and Radiative Transfer, 150:12-35.
Pearson, C., Littlewood, E., Douglas, P., Robertson, S., Gant, T.W. and Hansell , A.L. (2015). exposures and health outcomes in relation to bioaerosol emissions from composting facilities: A systematic review of occupational and community studies. Journal of Toxicology and Environmental Health. Part B, Critical Review, 18(1): 43–69.
Podzorski, R., Loeffelholz, M. and Hayden, R. (2010). Detection and Characterization of Molecular
Amplification Products: Agarose Gel Electrophoresis, Southern Blot Hybridization,
Restriction Enzyme Digest Analysis, and Enzyme-Linked Immunoassay. Advanced
Techniques in Diagnostic Microbiology, 243-263.
Pohlker, C., Huffman, J. and Poschl, U. (2012). Autofluorescence of atmospheric bioaerosols –
fluorescent biomolecules and potential inferences. Atmos Meas Technol, 5: 37-71.
Polymenakou, P.N. (2012). Atmosphere: A source of pathogenic or beneficial microbes? Atmosphere, 3:87-102.
Prabhu, K. V. (2009). Use of GMOs under containment confined and limited field trials and post-release monitoring of GMOs. In: M.K.A. Chowdhury, M.I. Hoque and A. Sonnino, eds., Biosafety of Genetically Modified Organisms: Basic Concepts, Methods and Issues. Food and Agricultural Organization of the United Nations, pp.157-220.
Prospero, J.M., Blades, E., Mathison, G. and Naidu, R. (2005). Interhemispheric transport of viable fungi and bacteria from Africa to the Caribbean with soil dust. Aerobiologia , 21:1–19.
Prussin, A.J. and Marr, C.L. (2015). Sources of airborne microorganisms in the built environment. Microbiome, 3:78.
Qian, J., Hospodsky, D., Yamamoto, N., Nazaroff, W.W. and Peccia, J. (2012). Size‐resolved emission rates of airborne bacteria and fungi in an occupied classroom. Indoor Air, 22:339–51.
Rasmussen, H.B. (2012). Restriction fragment length polymorphism analysis of PCR-amplified fragments (PCR-RFLP) and gel electrophoresis - valuable tool for genotyping and genetic fingerprinting. In S. Maddeldin, ed., Gel Electrophoresis - Principles and Basics. Available at: http://www.intechopen.com/books/gel-electrophoresis-principles-and-basics/restrictionfragment-length-polymorphism-analysis-of-pcr-amplified-fragments-pcr-rflp-and-related-te Accessed 3 October, 2017.
Research and Technology Organisation of the North Atlantic Treaty Organisation. (2010). Laser Based Stand-off Detection of Biological Agents: Final Report of Task Group SET-098/RTG-55.

Riedel, S. (2004). Biological warfare and bioterrorism: A historical review. Proceedings (Bayl University Medical Center), 17(4): 400–406.
Rustad, G. and Farsund, O. (2008). Standoff detection of biological aerosols by UV-laser induced fluorescence. Norwegian Defence Research Establishment (FFI)-rapport 2008/02025. Available at: rapporter.ffi.no/rapporter/2008/01990.pdf Accessed 26 November, 2017.
Saari, S. E., Putkiranta, M. J., and Keskinen, J. (2013). Fluorescence spectroscopy of atmospherically relevant bacterial and fungal spores and potential interferences. Atmospheric Environment, 71:202–209.
Saari, S., Reponen, T. and Keskinen, J. (2014). Performance of two fluorescence based real-time bioaerosol detectors: Bioscout Vs. UVAPS. Aerosl Sciencce and Technology, 48(4): 371-378.
Saha, S. (2012). Computational tools for metagenomics. [PowerPoint slides]. Retrieved on 29th
March, 2018 from https://www.slideshare.net/suryasaha/surya-saha-metagenomics-tools.
Salem, H. and Gardner, D.E. (1994). Health aspects of bioaerosols. In: B. Lighthart and A.J. Mohr, eds., Atmospheric Microbial Aerosols: Theory and Applications. New York: Chapman and Hall, pp.304-330.
Sánchez-Monedero, A., Stentiford, E.I. and Urpilainen, S.T. (2005). Bioaerosol generation at large-scale green waste composting plants. Journal of the Air and Waste Management Association, 55(5):612-61.
Searl, A. (2008). Exposure-response relationships for bioaerosols emissions from waste treatment processes. Defra project WR0606. Available at: http://sciencesearch.defra.gov.uk/Default.aspx?Menu=Menu&Module=More&Location=None&Completed=0&ProjectID=15140. Accessed 27 September, 2017.
Seifi, M., Ghasemi, A., Heidarzadeh, S., Khosravi, M., Namipashaki, A., Soofiany, V.M., Khosroshahi, A.A. and Danaei, N. (2012). Overview of real-time PCR principles. In: P. Hernandez-Rodriguez, ed., Polymerase Chain Reaction. Available at: http://www.intechopen.com/books/polymerase-chain-reaction/overview-of-real-time-pcrprinciples. Accessed 4 October, 2017.
Sender, R., Fuchs, S. and Milo, R. (2016). Revised estimates for the number of human and bacteria cells in the body. Plos Biology, 14(8): e1002533.
Signor, L. and Boeri, E. (2013). Matrix-assisted Laser Desorption/Ionization Time of Flight
(MALDI-TOF) Mass Spectrometric Analysis of Intact Proteins Larger than 100 kDa. Journal
of Visualized Experiments , 79: 50635.
Simard, J. R., Roy, G., Mathieu, P., Larochelle, V., McFee, J. and Ho, J. (2002). ―Standoff Integrated Bioaerosol Active Hyperspectral Detection (SINBAHD): Final Report‖. DREV TR, 2002-125, pp.118.
Simard, J.R. (2006). Short-range bioaerosol LIDAR detection: transmitter design and sensitivity analysis. Technical Memorandum, DRDC, Valcartier, TM 2005-303.
Skyes P., Jones K. and Wildsmith J. D. Managing the potential public health risks from bioaerosol liberation at commercial composting sites in the UK: An analysis of the evidence base. Resources, Conservation and Recycling, 52:410–424.
Smith, D.J., Jaffe, D.A., Birmele, M.N., Griffin, D.W., Schuerger, A.C, Hee J. and Roberts, M. (2012). Free tropospheric transport of microorganisms from Asia to North America. Microbial Ecology. 64:973–85.

Summerbell, R., Green, B., Corr, D. and Scott, J. (2011). Molecular Methods for Bioaerosol
Characterization. In B. Flannigan, R. Samson and J. Miller. Microorganisms in Home and Indoor
Work Environments: Diversity, Health Impacts, Investigation and Control, 2nd Ed., CPC Press: New
York, pp. 247-263.
Tringe, S.G., Zhang, T., Liu, X., Yu, Y., Lee, W.H., Yap, J., Yao, F., Suan, S.T., Ing, S.K., Haynes, M., Rohwer, F., Wei, C.L., Tan, P., Bristow, J., Rubin, E.M. and Ruan, Y. (2008). The airborne metagenome in an indoor urban environment. PLoS One, 3:e1862.
Vaïtilingom, M., Amato, P., Sancelme, M., Laj, P., Leriche, M., Delort, A.M. (2010). Contribution of microbial activity to carbon chemistry in clouds. Applied of Environmental Microbiology, 76, 23–29.
Wainwright, M., Wickramasinghe, N.C., Narlikar, J.V. and Rajaratnam, P. (2003). Microorganisms cultured from stratospheric air samples obtained at 41km. FEMS Microbiology Letters, 218:161–165.
Womack, A.M., Bohannan, B.J.M. and Green, J.L. (2010). Biodiversity and biogeography of the atmosphere. Philosophical Translation of the Royal Society B., 365:3645–3653.
Xu, Z., Wu, Y., Shen, F., Chen, Q., Tan, M. and Yao, M. (2011). Bioaerosol science, technology, and engineering: Past, present, and future. Aerosol Science and Technology, 45 (11):1337-1349.
Yang, H., Sun, Y.F., Wang, T.D., Zhao, X.S., Dong, Y. and Qing, F. (2016). Study on bioagents or bioaerosols standoff detection by LIDAR. Materials Science, Engineering and Chemistry (MATEC) Web of Conferences, 44 (02030):1-5.
Yerlekar, A., Kshirsagar, M.M. (2014). A review on mass spectrometry: Technique and tools. International Journal of Engineering Research and Applications, 4(4):17-23
Yoo, K., Lee, T.K., Choi, E.J., Yang, J., Kumar, S.S., Hwang, S. and Park, J. (2017). Molecular approaches for the detection and monitoring of microbial communities in bioaerosols: A review. Journal of Environmental Sciences, 51:234-247.
Zheng, L. (2014). 16S rRNA is a better choice than COI for DNA barcoding hydrozoans in the
coastal waters of China. Acta Oceanologica Sinica, 33(4): 55–76.
EFFECT OF RAW AND TOASTED SOYA BEANS DIETS ON

GROWTH OF Clarias gariepinus
*Azubuike Adams and **Nwoye Elias
*Department of Biological Sciences ,Nigeria Police Academy, Wudil,Kano-Nigeria
**Department of Chemistry, Nigeria Police Academy, Wudil, Kano-Nigeria
Abstract Comparing the effects of raw, toasted and amino acid enriched diets on the growth and nutrient utilization of Clarias gariepinus allocated in to eight different treatments with two replicates each with 10 Juveniles in 16 aquaria tanks. Eight different diets containing 40% crude protein each were compounded and fed to the fish at 5% body weight for 16 weeks. Diet T1 was the control while diet T2 was the conventional diet (coppens) purchased commercially. Diet T5 which had a 50% toasted soybean inclusion and contained 50g yellow maize, 20g toasted .soybean. 10g fish meal, 13g Groundnut cake, 2.5g vegetable oil. 2.0g starch and 0.5g vegetable oil had the greatest growth rate which were significant higher ((P<0.05) than those fish fed on other diets. Diet T7 (100% raw soybean with methionine and lysine) containing 50g yellow maize 30g raw soybean. 13g groundnut cake. 2.5g vegetable oil. 2,0g starch and 0.5g vegetable oil followed diet T5. Average weight gain, specific growth rate (SGR), Average daily weights gain, protein efficiency ratio (PER), feed conversion ratio (FCR) and Net Nitrogen retention were significantly higher (P<0.05) in fish fed diet T5 and diet T7 in the experiment. The results showed that fish fed toasted soybean based diet had the highest average weight gain (A.V/.G) of 432.55g, specific growth rate (SCR) of 3.38%/day and food conversion ration 'FCR} of 5.78. The juveniles fed raw soybean gave the least growth performance. It could be concluded in practice that toasted soybean based diet is optimal for growth of C. gariepinus juveniles, mortality rates recorded during the dietary trial ranged between 30% in fish fed diet Ts to 100% in fish fed diets T,. 73. T4, T5 and T6. The results were discussed in relation to fish feed production and its implication for fish culture intensification in Nigeria. Keywords: Raw Toasted soya beans, growth, Clarias gariepinus, Feed ingredients Introduction Aquaculture like other agricultural sectors has potential to contribute significant!) to the national economy. It has been recognized in most developing countries as a major avenue for improving the diet of the people and generating employment opportunity for rural dwellers. The practice is still at the subsistence level by private individual with very few achievements at commercial level and at pilot scheme by some government agencies despite (he 40yeras old of pond culture in Nigeria (Okoye, 1986). Nigeria like other developing countries is having as challenge, acute protein shortage as the daily intake falls far short of the recommended minimum (Olayide et a/... 1972). Fish farming is increasing rapidly in Nigeria today and if this development is sustained, then aquaculture will create a great impact on the economy and provide protein as food for its populace fish is noted for high quality protein and its protein content can be high as 60% on dry matter basis. Lack of good quality feed for economic production of fish in Nigeria, adversely affects growth rate, survival rate, and total harvest. The deficiency of protein in human diets in Nigeria has been responsible for incidence of kwashiorkor in infants, general weakness of the human body which predisposes man to diseases. This has been so critical that Nigeria is now ranked among the group of nations characterized by deficiency of animal protein in their diets.

Soya bean (Glycine Max) is a leguminous crop that produces seeds containing 1400 to 2000kg/hectare. It is cultivate in many areas of the world from the tropics to the temperate regions. Soya beans also contain high nutritional value compared to other oil seed species. Its crude protein level ranges between. 44-50%, Nitrogen free extract (N F E) is 40%, Lipid is 15-20%and it is equal higher in essential ammo acid, fatly acids, vitamins and mineral (Dabrowski and Kozak. 1989). Fish meal has been the most used protein source in the production of feeds but due to its high cost and demand it becomes necessary to device different method on how best soya beans seeds can be processed to ensure high yield and good harvest in fish production. Optimum protein level in fish diet is dependent on many factors. These include protein quality, energy source, physiological factors and economics. Dietary protein requirement for fish has been investigated by many workers (Ogino and Chen, (1973) and Faturoti el al, (1986) reported that fish has a high dietary protein requirement. The catfish, Clarias gariepinus has a protein requirement of 30-36% estimated protein requirement of fingerlings of C. gariepinus as between 31-34%and of brood stock at 40% Ayinla, (1998). Protein requirement of fish tends to change with the size of fish, water temperature and the balance of individual nutrient components in a given ratio. It is higher during the initial feeding stage of fry and then decrease in the age of the fish. A major problem in the development of complete artificial diets for aquaculture is the higher protein requirement of many species of fish, since it contributes a higher proportion of feed cost. Principally, quality of protein is dependent on its amino acid composition. Deficiency in any of the amino acid could cause retarded growth and loss of appetite. For optimum growth and development, total essential amino acid content of the feed ingredient must be balance to allow for maximum amount of amino acid in the diet. Among cultural fish in Nigeria freshwater are tilapia species, Cyprinus carpio (Common Carp], Clarias species, Heterotis niloticus and Heterobrancus bidosariis (Okoye, 1996) These species of fish are been produced on small scale. Clarias gariepimta is of paramount importance to Nigeria as it is to other western world because of its rapid growth rate and high prolific-ness. Objectives of the Study The main aim of this study is to determine the effect of soyabean inclusion in practical diets on the growth performance and nutrient utilization of Clarias gariepinus. In order to achieve this, the following specific objectives arc determined: i. To investigate the effect of diets totally substituted with variously processed soyabean on
the growth of Juvenile C gariepinus II. To investigate the effect of soyabean meal on the carcass composition of Clarias gariepinus. iii. To determine the cost analysis of the experiment diet. Materials and Methods Feed ingredients. Ingredients used for the diet formulations are yellow maize, groundnut cakes, soybean, fishmeal (produced from whole small Alestes) sourced from brigade market Kano; fishmeal was dried in an oven set at 60"C for 24 hours milled using a small grinder and stored in the freezer until required other ingredients include palm oil, vitamin premix which was brought from the Phed Agrovet stores in Kano town. Processing of Soyabean

Raw soyabean was toasted at 1000C for 10 minutes (Eyo, 1991) in an electronic oven; it was later grinded in a milling machine to a fine texture and sieve with 0.1mm mesh opening. Processing of other Feed Ingredients Groundnut cake was purchased from the local oil milling industry. Maize was prepared by grinding the maize into a fine powder with the hammer mill, while the vitamin mineral premix was purchased commercially from the shop in town. Feed Formulation The weighed ingredients were later mixed with starch of cassava origin and water as binder. Mixing of ingredients and premixes was-done with the hands in a plastic bowl. The dough was pelleted using a screw type pelietizer to 2mm diameter sizes, the pelleted collected were air dried for 2 days and stored in plastic containers sample were taken for analysis. Fingerling Procurement C/arias gariepimts Juveniles were purchased from Baeauda fish farm located 60km Southeast of Kano town; they were transported in a 100 litre plastic can (cut at the top to provide aeration) which were later placed into two plastic tanks for 48 hours before stocking into experimental tanks. The juveniles were acclimatized for forty-Eight hours (48 hours) before feeding commenced. They were fed twice daily at 5% (percent) of their body weight (Alatise, 2004) for sixteen weeks. Feeding Regime The experimental diets were offered to the fish in the experimental tanks twice daily at 8 am and 5 pm. feeding rate to be adopted was 5% body weight per day divided into two equal portions; usually, the fish ate almost all the feed offered to them. The left over feed was removed the next day before another feed was given. The feeding trials will last for 120 days with the feeding trial commencing from 2nd January 2018 to 30th April 2018. The fish were fed on experimental diets compounded at 40% crude protein (Eyo, 1991) with varying levels of processed soybean. The diet with zero level soybean inclusion served as the control while other diets contained 50% and 100% dietary inclusion of soyabean, The control diet was compounded with 30g of fishmeal, 50g of yellow maize, 13g of Groundnut cake, 2.0g of Vit. Premix 2.0g of starch, 0.5g salt x 2.5g of vegetable oil; the ingredients were poured into a large plastic and it was properly mixed, water is added before pelletizing. Fish Holding Facility and Husbandry Protocol Rectangular plastic aquarium tanks 30cm x 15cm were used during the experimental regime. They were filled with water sourced from the borehole at the Department of Biological Sciences; water was poured up to 75% of the capacity of the aquarium and left for 24 hours before socking with fish. Daily water temperature, pH was measured, oxygen level was measured weekly, complete water change was effected daily to ensure good water quality for fish growth and dietary utilization. The daily water temperature was measured using mercury in glass thermometer; it was inserted in the water and then the reading was taken to ascertain the water temperature. The pH was measured using a pH metre model 3150 the metre was standardized and then the was electrode was submerged inside the water samples and the reading was taken. Clarias gariepinus of initial weight ranging from 7 - 8gm were stocked 10 per tank in duplicate. Fish were weighed out of the water in a Basket using the weight balance available at the department's aquarium; each experiment was conducted for 16 weeks. Proximate composition Analysis The following laboratory experiment were Carried out on the feeds Content Estimation

Moisture content was determined by drying the samples in an oven. The samples were dried in the oven for twenty minutes to evaporate the moisture in the Petri-dish and place in the dessicator to cool. After cooling, weight of Petri-dishes were recorded, 5gm of the sample was placed in to the Petri-dishes. The weight of the dish together with the sample were dried for 6 hours at a temperature of 700C. The Petri-dishes removed, cooled in the dessicator and reweighed until a constant weigh was-obtain (AOAC, 1975). Ash Content Estimation The ash content was determined by burning each of the samples in the muffle furnace at a temperature of 550°C for three hours, the residue estimated as percentage ash content. Thus residue was then weighed and the ash content of the feed (g ash / kg feed Dm) is calculated from:
Ash content of the feed = Weight of ash x 100 Weight of sample feed
(FAO, 2004) Crude Fibre Estimation (C.F.E) This-was determined by subjecting the residual feed from ether extraction (lipids) to successive treatments with boiling acid and alkali of defined concentration. 2g of the dried free sample was weighed into a 600ml beaker, 200 ml of hot sulphuric acid was, added and heated to boiling within 1 minute. After boiling for 30 minutes, the mixture was filtered through porous crucible and wash with boiling water 1% hydrochloric acid and then again with boiling water. It was then washed twice with alcohol, dry overnight at 100°C cool and weigh. Ash at 500°C for 3 hours, cool and weighed. The weight of fibre was calculated by the difference in weights.
Crude fibre (% of fat - free Dm) (Weight of crucible + dried residue) - (weight crucible + ashed residue) X 100
(weight of sample) (FAO, 1987)
Lipid Content Analysis Lipid extraction was by soyhlet extraction method, using petroleum ether on the dry sample gotten from the moisture free sample. The solvent was-removed by evaporation and the residue of fat wag- weighed. Dry residue from the determination of moisture was transferred into extraction thimbles. The thimbles were placed in the extraction and a weighed flask containing 100ml petroleum ether was connected. The extractor was connected to a reflux condenser, and was extracted under a reflux on a steam bath for 8 hours. The petroleum ether was evaporated up to the extent of drying. The dry flask containing the fat residue was put in an air oven for 40 minutes, cooled in a dessicator (AOAC, 1975). Percentage lipid content was calculated as: Extracted fat % - W3 – W2 x 100 W1 I W1 = Weight (g) of sample before drying W2 = Weight (g) of flask without fat W3 = Weight (g) of flask with fat Crude Protein Estimation Protein content was determined using the microkjeldahl method (AOAC, 1975), sulphuric acid was used 10 digest the samples with copper used as a catalysts. This was done to convert organic

nitrogen into ammonia ions. Sodium hydroxide was added and the liberated ammonia was distilled in the boric acid solution. Determination of ammonia absorbed in boric acid was done by titrating the distillate with hydrochonic acid 0.5gm of copper sulphate and 15gm of potassium were put in kjedahl flask, 2g of the sample was weighed using filter paper, this was also added into the acid in the kjeldahl flask, 25ml of concentrated sulphuric acid was added to the content of the flask and mixed gently. Nitrogen Free Extract (NFE) This was obtained as a difference between hundred and the sum of percentage Ash, lipid, crude protein, crude fibre and moisture. Bacteriological Analysis One gram (Ig) of the feed sample was added to 25ml of buffered peptone water and the mixture was weighed aseptically into a sterile jar. The feed was blended and the food homogcnatc was mixed by shaking and 1.0ml was pippetted into a tube containing 9ml of buffered peptone water. This was mixed with a fresh pippete. This was repeated using a 3rd, 4th, 5th tube. One milliliter (1.0ml) of the food homogenate, of each dilution of the homogenate will be pipetted into each of the appropriately marked dishes. 10 - 15mi of plate count agar (kept at 450C + 10C in a water bath) was poured into each Fein-dish within 15mins of the time of original dilution. The sample dilution and agar medium was mixed thoroughly and allowed to solidify. The prepare dishes was inverted and incubated at 30+ 10C for 72 hours. After incubation, all the colonies on the dishes containing 30 -300 colonies were counted and the result recorded per dilution (FAO, 1979). Water Quality Parameters The water temperature of the experimental tanks were taken by a mercury - in - glass thermometer and the mean temperature during the experimental period was. 25. 300C. Hydrogen Ion Concentration (pH) The pH values were read off a pH meter (model 3150 Jenway) after standardizing the meter, the meter electrode was. Submerged inside the water samples and the reading taken. Dissolved Oxygen D.O and the water conductivity were- measured weekly using an oxygen metre of model HANNA HI 9146 OXYGEN BENCHMETER. Evaluation of Growth Performance Nutrient utilization of the fish was determined. Weight Gain This was calculated from the difference between the final weight of the test fish and the initial weight Weight gain = Final Weight - Initial Weight. Percentage Weight Gain This was estimated from the relationship between the increment in weight (i.e. weight gain) and the protein consumed (Zeitoun, el al, 1973).
Gain in Weight of Fish Protein consumed
Specific Growth Rate

Specific growth rate is the actual weight gain during the fish life or during the feeding trial. It has the following formular according to Brown (1957). SGR = 100 x (In Vf In M1)
t Where, Wf = Final average weight at the end of the experiment
W1 = Initial average weight at the beginning of experiment T = Culture period in days.
Feed Conversion Ratio A feed conversion ratio is defined as measure of the degree of gross utilization of food for growth in fish. Feed conversion ratio is the quantity of feed required to produce a given weight offish. FCR = Dry weight of diet (g)
Total wet weight gain by fish (g) (FAO, 2004) Protein Intake This was calculated using the formular: protein intake = feed consumed x. % crude protein content of feed. Feed Intake This was estimated by subtracting weight of the feed remnants siphoned from each tank from the feed fed to the fishes. Net Nitrogen Retention This was expressed as percentage Net Nitrogen retention. Initial body protein x 100 Final body protein Statistical Analysis The Biological data arising from the treatment were subjected to descriptive analysis and differences in means were determined using the least significant correlation. All statistical analysis, the sum, the mean, standard deviation and the range (Minimum -- Maximum) were done using the software SPSS version 15.1. Results Proximate Composition of the Experiment Diets The proximate composition of the experimental diet is shown in Table 3. Diets T1 and T2 have the highest crude proteins; they are the control and conventional feeds, followed by T5 and T7 which are 50% inclusion of toasted soybean and 100% inclusion of Raw soybean with methionine and lysine. Diet T4, with 100% Raw soybean inclusion has the least crude protein. The lipids content is highest in Diet T2, while Diet T5 has equal amount of lipid content with the control diet T1,. Diets T7 and T8 have equal lipid contents. Diet T8 has the highest Ash percentage 24.78 while diets T3 and T4 have the lowest percentage Ash. The highest crude fibre content of 9.00 percent was obtained in diet T3 and T4 while the least 7.00 percent in T4 and T7. The moisture content is highest in diet T2 (9.99) while diets T4 and T8 have the lowest moisture content of 8.80 and 8.40 percent each.
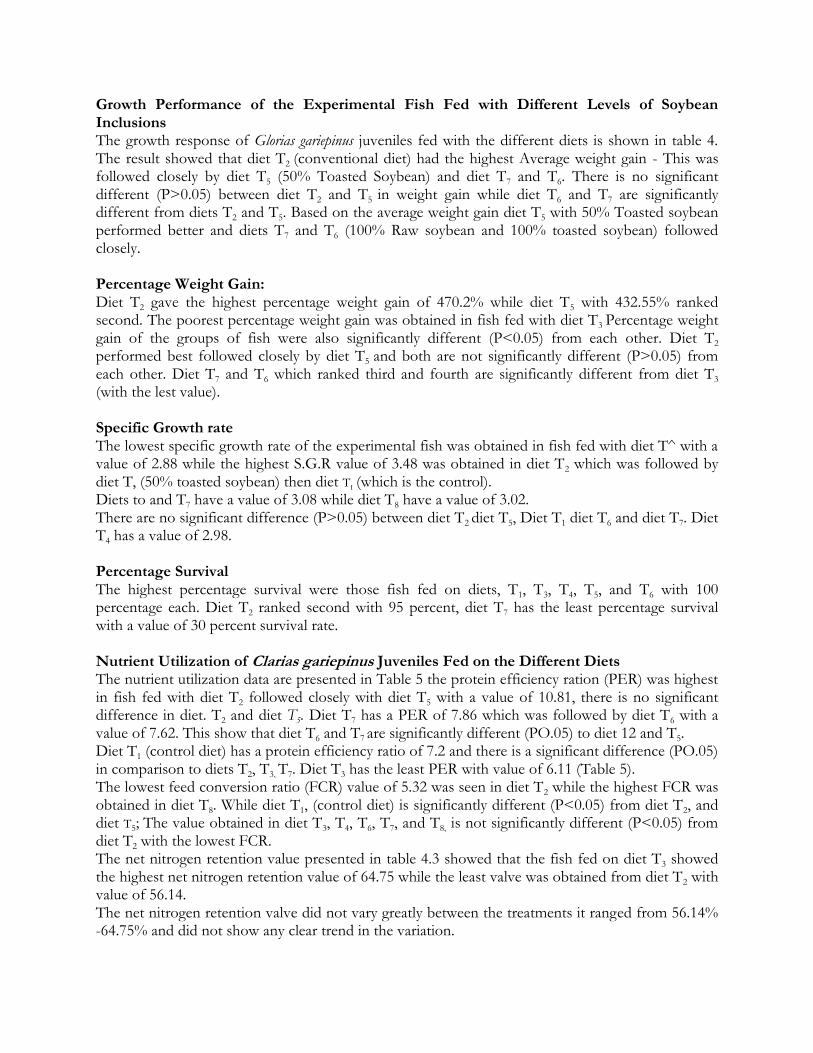
Growth Performance of the Experimental Fish Fed with Different Levels of Soybean Inclusions The growth response of Glorias gariepinus juveniles fed with the different diets is shown in table 4. The result showed that diet T2 (conventional diet) had the highest Average weight gain - This was followed closely by diet T5 (50% Toasted Soybean) and diet T7 and T6. There is no significant different (P>0.05) between diet T2 and T5 in weight gain while diet T6 and T7 are significantly different from diets T2 and T5. Based on the average weight gain diet T5 with 50% Toasted soybean performed better and diets T7 and T6 (100% Raw soybean and 100% toasted soybean) followed closely. Percentage Weight Gain: Diet T2 gave the highest percentage weight gain of 470.2% while diet T5 with 432.55% ranked second. The poorest percentage weight gain was obtained in fish fed with diet T3 Percentage weight gain of the groups of fish were also significantly different (P<0.05) from each other. Diet T2 performed best followed closely by diet T5 and both are not significantly different (P>0.05) from each other. Diet T7 and T6 which ranked third and fourth are significantly different from diet T3 (with the lest value). Specific Growth rate The lowest specific growth rate of the experimental fish was obtained in fish fed with diet T^ with a value of 2.88 while the highest S.G.R value of 3.48 was obtained in diet T2 which was followed by diet T, (50% toasted soybean) then diet TI (which is the control). Diets to and T7 have a value of 3.08 while diet T8 have a value of 3.02. There are no significant difference (P>0.05) between diet T2 diet T5, Diet T1 diet T6 and diet T7. Diet T4 has a value of 2.98. Percentage Survival The highest percentage survival were those fish fed on diets, T1, T3, T4, T5, and T6 with 100 percentage each. Diet T2 ranked second with 95 percent, diet T7 has the least percentage survival with a value of 30 percent survival rate. Nutrient Utilization of Clarias gariepinus Juveniles Fed on the Different Diets The nutrient utilization data are presented in Table 5 the protein efficiency ration (PER) was highest in fish fed with diet T2 followed closely with diet T5 with a value of 10.81, there is no significant difference in diet. T2 and diet T5. Diet T7 has a PER of 7.86 which was followed by diet T6 with a value of 7.62. This show that diet T6 and T7 are significantly different (PO.05) to diet 12 and T5. Diet T1 (control diet) has a protein efficiency ratio of 7.2 and there is a significant difference (PO.05) in comparison to diets T2, T3, T7. Diet T3 has the least PER with value of 6.11 (Table 5). The lowest feed conversion ratio (FCR) value of 5.32 was seen in diet T2 while the highest FCR was obtained in diet T8. While diet T1, (control diet) is significantly different (P<0.05) from diet T2, and diet T5; The value obtained in diet T3, T4, T6, T7, and T8, is not significantly different (P<0.05) from diet T2 with the lowest FCR. The net nitrogen retention value presented in table 4.3 showed that the fish fed on diet T3 showed the highest net nitrogen retention value of 64.75 while the least valve was obtained from diet T2 with value of 56.14. The net nitrogen retention valve did not vary greatly between the treatments it ranged from 56.14% -64.75% and did not show any clear trend in the variation.

Carcass Analysis of the Flesh of C. gariepinus Juveniles Fed with Different Diets The result of the proximate composition of the initial and final muscle tissues of C. gariepinm juveniles fed on the different diets is presented m Table 6: The highest protein value in the muscle was obtained from the fish fed on diet T2 closely followed by fish fed on diet T5 while the lowest muscle protein value was obtained from fish fed on diet T3. Final carcass protein did not vary significantly (P<0.05) between treatments. Fish fed on diet T2 showed the highest value of crude fat followed by fish fed on diet Ts while least crude fat value was recovered from fish fed on diet T8. The difference in carcass ash in the treatments was minimal (Table 6) while the least crude fibre was discovered in the carcass of the fish fed with diet T5 the highest crude fibre was diet T6.
Analysts of the Diets The cost of production of one kilogramme of each diet is shown in table 7: Diet TI coasted N42.00 per kg and N42,000 per ton feed . Diet T2 per kg feed is N350.00 and N350 000 per tone - Diet T3 cost N28.5, diet T4 N15, diet T5 N28.50, diet T6 Nl5.00 while diets T7 and T8
costN17.00, Diets T4 and diet T6 are the cheapest in terms of cost of production while diet T7 and T8 are second in terms of feed cost, diet T3 and T5 cost N28,50k each: Diets T3 and T5 could be termed cheapest in production cost when the relationship of weight gain and feed intake is calculated, especially when the protein efficiency ratio and its lowest feed conversion ratio is strictly considered. Aerobic Mesophilic Bacterial Counts of the Feeds Table 8: shows the bacterial load contained in the treatments the colonies formed in each of the treatment shows that they are less than thirty (<30) - there is no significant difference (P>0.05) in the different feeds in respect to the bacterial load; therefore the values obtained are within the acceptable values according to FAO, 1979; this shows that the feeds were not contaminated and is within the acceptable level for the fish consumption. Water Quality Records Dissolved oxygen contents of water in the various treatments were relatively similar and never got below 5.60mg/L. water temperature ranged between 25°C to 25.5°C while pH was between 7.5 and 7.8 (Table 1) these records were within the limits of good water quality for aquaculture as recommend by Boyd and Lichtkoppler(1985). Table 1: Weekly Average Water Quality Parameters
Treatment Parameters T1 T2 T3 T4 T5 T6 T7 T8
Temperature 25.5 25.0 25.0 25.5 25.0 25.0 25.5 25.0 pH 7.8 7.8 7.8 7.8 7.8 7.5 7.8 7.8 Dissolve 02 (mg/ht) 5.50 5.60 5.50 5.50 5.55 5.50 5.55 5.50 Conductivity 2.30 2.30 2.30 2.30 2.30 2.30 2.30
Table 2: Gross Composition of Experimental Diets
100 Grammes: T1 T2 T3 T4 T5 T6 T7 T8
a. Fish meal 30 10 - 0 - - -

b. Raw soyabean meal 0 20 30 - - - - c. Yellow maize 50 50 50 50 50 50 50 d. Groundnut cake 13 13 13 13 13 13 13 e. V.T Premix Vitamin Premix 2.0 2.0 2.0 2.0 2.0 2.0 2.0 f. Starch 2.0 2.0 2.0 2.0 2.0 2.0 2.0 g. Toasted soyabean - - - 20 30 - - h. Raw soyabean meal with methionine
(0.04g) and lysine (0.02g) - - - - - 30 -
i. Toasted soyabean meal with methionine (0.04g) and lysine (0.02g)
30
j. Salt 0.5 0.5 0.5 0.5 0.5 0.5 0.5 k. Vegetable 2.5 2.5 2.5 2.5 2.5 2.5 2.5 l. Bone meal
T2 contains fish soluble, wheat fish oil, fish meal, soya, and premix. It also has an Ash content of 7.4%, phosphorous 1%, Vit A, D3, E, and CUso4 5H20.
Vitamin premix was composed (g/kg) diet: Vit. A5, 500 I.V., Vit. D100 I.V., Vit/E. 50 IV; 10mg, choline 550mg, Niacine 1000mg, Riboflavin 20mg, pyrodoxin 20mg, thiamine 20mg, u – calcion pantonenate 50mg, Biotin 0.1mg, floacin 5mg, Vit B12.0.02mg, Ascobic acid 50mg, inocitol 0.1mg (Hayloy, 1992)
Table 3: Proximate composition of the formulation diets used in the experiments:
Nutrient contents T1 T2 T3 T4 T5 T6 T7 T8
Crude protein % 45.40b 44.97b 39.24b 39.20d 42.00d 40.10d 42.10b 41.20d Crude fat % 2.50b 2.65b 2.30c 2.25c 2.50b 2.45b 2.40b 2.40b Crude ash % 21.59a 20.81a 19.00b 19.50b 21.59a 20.49b 23.80c 24.78c Crude fibre % 8.00b 8.97d 9.00d 7.00a 8.00b 9.00d 7.00a 8.40c Moisture % 9.81d 9.99d 8.90c 8.80c 9.40d 9.63d 9.13d 8.40d Nitrogen free 15.53a 19.34b 21.60c 21.63c 15.20a 15.28a 20.64c 20.50c Extract % (NFE)
Figure bearing the same superscripts in the same row are not significant different (P<0.005) Table 4: Growth Performance of Clarias gariepinus Juveniles Fed on the Different Diets
Growth Parameters T1 T2 T3 T4 T5 T6 T7 T8
Average initial Wt (g) 7.0d 7.3d 7.7d 7.3d 7.7d 7.8d 8.0d 7.8d Average final Wt (g) 285.9b 477.5d 245.25a 262.5a 440.25d 313.5c 322.5c 290.00b Average Wt gain (g) 288.0a 470.2d 224.55c 255.2c 432.55d 304.7b 314.5b 282.2b Average daily Wt gain (g) 0.024 0.039 0.019 0.021 0.036 0.025 0.026 0.024 Average % Wt 41.14 64.11 29.16 34.9 56.17 39.06 39.31 36.17 Average-specific growth rate
3.12 3.48 2.88 2.98 3.38 3.08 3.08 3.02
Percentage survival 100 95 100 100 100 100 75 30 Initial body length 6.77 6.70 6.79 6.50 6.72 6.70 6.72 6.79 (cm) Average Final body length (cm) 25.50 28.70 21.70 22.75 27.80 26.80 16.50 17.40

Average length gain (cm) 18.73 22.00 14.991 16.25 21.08 20.10 9.78 10.61 Average length gain (cm) 18.73 22.00 14.91 16.25 21.08 20.10 9.78 10.61
Figures being the same superscript in the same row are not significantly different (P<0.05) Table 5: Nutrient Utilization of Clarias gariepinus Juveniles Fed on the Different Diets
Growth Parameters T1 T2 T3 T4 T5 T6 T7 T8
Average daily gain (g) 0.024 0.039 0.019 0.021 0.036 0.025 0.026 0.024 Average protein efficiency ratio (PER) (g)
7.2d 11.80c 6.11a 6.40a 10.81c 7.62d 7.86d 7.10d
Average feed conversion ratio (FCR) (g)
8.68 5.23 10.22 9.80 5.78 8.20 7.95 8.86
Net Nitrogen retention 57.42 56.14 64.75 63.48 56.24 61.37 58.93 58.44
Figures being the same superscript in the same row are not significantly different (P<0.05) Table 6: Proximate Composition of the Fish Carcasses (% Dry weight) Fed on the Different Diets
Nutrients Initial T1 T2 T3 T4 T5 T6 T7 T8
Crude protein 32.90a 57.30d 58.60d 50.81c 51.83c 58.50d 53.61b 54.48b 53.97b Crude fat 15.10b 16.30a 18.0d 15.62b 14.13c 17.05a 17.01a 16.02a 15.08a Crude Ash 15.20c 14.10a 15.30c 16.20d 16.10d 15.08c 14.34a 6.20d 16.40d Crude Fibre 4.60a 4.40a 3.45b 4.10a 2.49c 2.80c 4.95a 3.90d 2.85c Moisture 2.40b 4.71a 3.50a 2.74b 2.70b 3.23c 3.41a 3.10c 3.10c NFE 2.34d 4.97a 4.82a 2.57d 2.84d 3.98c 4.10c 2.95d 3.05d
Figures bearing the same superscripts in the same row are not significant different (P<0.05)

Table 7: Cost Analysis (100 grammes feed) of the Experimental Diets Inclusion Cost (N)
Ingredients T1 T2 T3 T4 T5 T6 T7 T8
a. Yellow maize 0.30 b. Groundnut cate 0.60 (a-f) 75% 50% 75% 50% 50% 50% (a-e) (a-d) (a-e) (a-d) (a-d) (a-d) c. Starch binder 0.10 d. Premix 0.20 e. Fish meal 3.00 f. Soyabean meal - 25% 25% 50% 50% 50% 50% g. Methionine and
lysine 4.20 35.00 2.85 1.50 2.85 1.50 1.70 1.70
Feed cost per kg 42.00 350.00 28.50 15.00 28.50 15.00 17.00 17.00 Feed cost per ton 42.000 35.000 28.500 15.000 28.500 15.00 17.00 17.00
Diet T1 - control zero percent level of soyabean Diet T2 - Conventional feed Diet T3 - 50% raw S.B Inclusion Diet T4 - 100% raw S.B Inclusion Diet T5 - 50% toasted S.B Inclusion Diet T6 - 100% toasted S.B Inclusion Diet T7 - 100 raw S.B Inclusion Diet T7 - 100% S.B Inclusion
Table 8: Aerobic mesophilic bacterial counts of the different feed:
Treatments (APC cfu/g)
1. 1.40 x 10² 2. 6.80 x 10² 3. < 30 4. < 30 5. < 30 6. < 30 7. < 30 8. < 30
Discussion The relatively chapter cost of soybean in comparison to animal protein sources could lead to the rapid promotion of fish culture intensification in Nigeria and other developing countries. Results of the present research have shown that use of soybean in fish feed (Partial inclusion or fully substituted) in feed for catfish C. gariepinus gave good growth rate, good food conversion ratio and good protein utilization compared to the control diet (Table 4 and 5). Viola, et al (1982) reported that partial replacement) 40% of fishmeal) by soybean meal in pond trails of carp required only supplement of methionine at 50% level in order to attain the same growth, protein and energy utilization as that with the control ration that had fish meal as the main protein supplement. When most of the fish meal was replaced by soybean meal, supplement of methionine and 0.4 - 0.5% lysine were necessary to achieve gains, protein efficiency ratio retention equal to

those of the control fish meal ration. In this stud}', total replacement of fishmeal with soybean did not appear to significantly affect FCR and PER (Table 5) Lovell (1997) stressed that soybean protein has one of the best amino acids profile of all protein rich plan; feeding stuffs to meet essential amino acid requirements of fish. There was no significant difference (PO.05) in weights of the fish in all the groups (Tables 4 and 5) this indicates that the different diets produce similar effect on growth of fishes. In this study, the best growth rate was obtained in fish fed on diet T3 and diet T5 followed by diet T7. The diets are relatively higher in quality and quantity of the ingredients used in the formulation of the diets (Table 4, 5, 6, and 7). The finding of this study agrees with the work of Smith el al (2000) who claimed success in feeding rainbow trout a diet based almost entirely on raw materials of vegetable origin containing 80% roasted soybean. Pantha (2007) observed no significant difference in growth performance and diet utilization in O. niiiticus fed a diet where all the protein was supplied by herring meal and 75% of the herring meal was replaced by full fat soybean cake supplemented by methionine. Jackson et al, (1992) also found no significant difference in growth performance and diet utilization in tilapia, Sarotherodon mossambicus fed a diet where 25% of a control diet was replaced by soybean meal, although complete replacement resulted in 27-33% growth depression. Other parameters such as specific growth rate (SGR), protein efficiency ratio (PER), food conversion ratio followed the same pattern as that of weight gain values (Tables 4 and 5). Feed ingredients of plant origin have shown to contain various anti-nutritional factors, for instance, soybean contains haemaglutinin (Jackson e! al, 1992), groundnut has aflatoxin (Rayfeltwell and Sydfox, 1998), wheat offal has high fibre and low amino acid content (Gohl, 2005). However, some of these defects in these plants product can be ameliorated by heat and chemical treatment. Heat is known to improve digestibility of polysaccharidcs and metabolization energy in addition to inactivation of trypsin inhibitors (Smith, 1997; Dabrowsky et al. 1989) the inactivation of trypsin inhibitors would certainly lead to increased protein digestion. Treatment 5 (T5) with 50% inclusion of toasted soybean gave a very good performance than the control diet, also T6 (100% inclusion of toasted soybean) gave a very good performance in comparison to the control; this is as earlier reported by Kyo (1999) who confirmed that toasted soybean gave the best growth performance to Clarias anguillaris fingerlings compared to raw soybean. Although the performance of the fish fed with the totally substituted fishmeal gave a good result it can be said that it produced to the nearest optimum: for the best result a partially substituted feed in fish some level of the fishmeal is substituted with the fishmeal will yield to a very satisfying yield as in diets T5. In these experiments when catfish Clarias gariepinus juveniles were fed 40% protein from differently processed soybean FCR of 5.32-10.22 was obtained (Table 5). In this study, no depression in growth was observed between treatment group on the experimental diets. Fish fed on diets T1. T3, T4, T?, and T6 recorded the highest percentage of survival each. This could be attributed to acceptability of the diets and a high level of nutrient utility in the fish. The low percentage survival offish in diet T8 may be an indication of their non - acceptability of the artificial diet (Madu e1 al, 2001) also the low percentage survival offish in diet T8 could as a result pollution of the water (when water was left for 4 days before replacement) foul smell (pollution) resulted. It is certain that too much nutrients in culture medium results in pollution and Joss of fish if adequate precautions are not taken (Adeniji, 1996). The inferior growth rate observed for C. gariepinus juveniles in diet T1 with zero percent inclusion of soybean could be a manifestation of the high crude fibre content and low protein content of the diet shown by proximate analysis (Table 6).

The physico-chemical parameters value are shown in table 1, these parameters arc within those recommended by Boyd (1985) and vivean et al (1985) for fish culture. The cost analysis of the diets was calculated base on the cost per kilogramme of feed stuffs at the period of the experiment. The analysis showed the feed with least cost was revealed in diet T4 and T6 soybean is relatively cheaper in comparison to animal source protein. Conclusion The results from this study showed that 50% inclusion of toasted soybean - performed better than the zero percent inclusion of soybean (control). This was closely followed by diet T7 which is 100% raw soybean with methionine and lysine (included). The cost rate of diet T5 and diet T7 is minimal compared to diet T1 and diet T2 which is the conventional feed (coppens). The cost rate is cut down up to 50 - 80% per kilogramme feed. Recommendations Base on the growth performance, nutrient utilization parameters and cost effectiveness of the eight diets at varying inclusions of soybean in the practical diet for C. gariepinus in this study, and the superiority of 50% and 100% inclusion of toasted soybean (in addition to methioninc and lysine) the following recommendations are suggested: (a) That toasted soybean should be embraced by fish farmers as the most preferred treatment
for soybean used in fish feed. (b) That in order to maximize profit animal protein can be substituted partially or fully
with soybean provided the essential amino acid (methionine and lysine) are added to improve feed.
(c) That in the toasting of soybean, it should be done in a sufficient way so as to reduce the effect of inhibitors and also provides a flavour to the feed.
REFERENCES Adeniji H.A. (1996). Precautions for good water quality management - NIFFR Extension guide
series. - No, 2, 1996. Alatise, P.S., Ogunbele, O., Eyo, A..A & Oladunjoye, L.F. (2004). Evaluation of Different Soybean
based diets on growth and nutrient utilization of Heterobranchus longifilis in Aquaria tanks. Journal of fisheries society of Nig. 2004 Edition.
Association of Official Analytical Chemist (AOAC) (1975). Official methods of Analyst (W.
Hortwit, Zeditor) 12th Edition A.O.A.C. Washington DC, Pp. 129-146. Ayinla, O..A & Akande, G.R.. (1998). Growth response of C. gariepinus silage based diets Nigeria
institute of oceanography and Marine Boyd. C..F. & Lichikoppler, F. (1985). Water quality mangt. In pond fish, culture; intern center for
Aqua agric. Exper. Station Ausburn Univ. 2 Pp - 30P. Dabrowsky, K, Poczyczynski, P., Kock, G. & Berger, B. (1989). Effect of partially or totally
replacing fish meal protein by soybean meal protein on growth food utilization and proteolytic enzyme activities in rainbow trout (Salmo galidneri)- New I vivo test for exocrine pancreatic secretion - Aquaculture 77, Pp. 29-49.
Eyo, A.A. (1988). Commercial fish feed production National Institute for Freshwater. Fisheries
research, New Bussa, Nigeria. FAO; (1979). Manuals of Food Quality Control FAO, R.R. Col well, 2001. FAO (1984). Report of the FAQ World conference on fisheries management and development.
Rome 27 June - 6 July 1984. 60p. Jackson, A.J. & Capper, B.S. (1992). Investigations in to the requirements of the lilapia Sarotherodon
mossambicus for dietary melhionine, lysine and arginine in semi synthetic diets Aquaculture 2 (:289 - 297).
Lovell,. T. (1997). Nutrition and feeding of fish. Van Nostrand Reinhold, New York, 260 Pp. Madu. C.T. & Tsumba, T.T. (2001); Dietary protein requirement of mud fish (ciarias angillaris)
fingerlings. The optimum level for die diet of Mud fish for fingerlings in an outdoor rearing system N1FFR Ann. Report - 104-109.
Murai, T, Ogata, H. Kosutarak. P. & Arai, S. (1986). Effects of amino acid supplementation and
methanol treatment on utilization of soybean flour by fingerling carp. Aquaculture 56; Pp. 197 - 206.
Ogino, C. & Chen M.S. (1973). The effect of varying dietary protein level for fish—Aquaculture. as
cited in www.sciencedirect.com/scieiice/aiticle vol.27, feb. 1982

Okoye, F.C. (1986). Fish pond culture in fisheries enterprises and information
Brochure, In Commemoration of the 5th Annual Conference of FlSON. Oiajide S.O., & Olayemi, J.K .(1972). Economic aspects of agriculture and nutrition A. Nigerian case
study. FAO, Nutrition and policy Planning in English speaking African Countries. Report on the FAO/DANIDA Seminar, Lusaka. Zambia, 1975, p. 10
Pantha, N. B. (2007). The use of soybean in practical feeds for Tilapia. oreochronics niloticus
(TREWAVAS). M.Sc Thesis, University of Sterling, Scotland, U.K. Rayfeltwell, A.C., & Sydfox, A.G (1998). Practical Poultry Feeding Macmilian Ltd.
London. Robinson, E.H. & Lovell, R..T. (1998). National Research Council (U.S.) subcommittee. Titled
Nutrient requirements of warm water fishes and shellfishes. Smith, M..A..K.. & Robert, R.. (2000) General Aquaculture, fisheries and fish science journal offish
biology,. 19( 2). Smith, B.W.,. & Lovell, R..T. (2000). Digestibility of nutrients in rainbow trout stainless steel
trovahs. Proc. Ann. Conf. Viola, S., Mokady, S., Rappaport; V. & Arielli, Y. (1982). Partial and complete replacement of fish
meal by soybean meal in feeds for intensive culture of carp. Aquaculture 26, Pp. 223 - 236. Zeitoun, I.H et al (1973). Quantifying nutrient requirements of fish. J. fish Res. Board can. 33 167-
72.

PRESENCE OF INVASIVE FRESHWATER SNAILS POMACEA (APPLE SNAILS) IN WASAI PART OF JAKARA DAM AND A RICE FARM IN FARAR GADA, KANO STATE,
NIGERIA
S.D.Rabi
Department of Biological Sciences, Nigeria Police Academy, Wudil,Kano State, Nigeria Abstract One evidence of our changing environment is the appearance of new species of animals in places where they were hitherto not found. This paper reports the presence of two new freshwater snail species, Pomacea (apple snail) in Wasai part of Jakara dam (Minjibir local government area) and a rice farm in Farar gada, Gezawa local government area of Kano state, Nigeria. Altogether two hundred and seventy one snails were collected, made up of two hundred and seven (76.38%) Bulinus, fifty seven (21.03%) Lymnea and two pomacea snails from Wasai part of Jakara dam while five pomacea snails were collected from Farar gada, altogether (2.58%) in the two study sites. There are no other snail species in Farar gada apart from the Pomacea species. This is the first report of this invasive species in Kano state, Nigeria. Statistical analysis was done descriptively. Keywords: Pomacea, Bulinus, Lymnea, Jakara dam, Rice farm Introduction Apple snails belong to the phylum Mollusca, class Gastropoda (snails), subclass Prosobranchia, order Caenogastropoda, superfamily Ampullarioidae and family Ampullariidae. They are native to subtropical and temperate South America. It naturally distributes from southern Brazil to the south of Buenos Aires Province, where it reaches its southernmost limit in Encadenadas del Oeste basin (Martín et al., 2001). Apple snails, have a long history of invading habitats as nonindigenous introductions and out competing native snails (Mochida, 1991). They are very invasive and of negative impact to areas where they were introduced (Cowie et al., 2009; EFSA 2012). They are known agricultural pests, feeding on rice crops and causing great economic damage (Cowie, 2002; Hayes et al., 2008). Pomacea canaliculata has also been known to be an intermediate host of Angiostrongylus cantonensis (the rat lungworm parasite) a parasite that causes Angiostrongioliasis in humans (Ting-Bao Yang et al, 2013)
Material and methods Study area This study was carried out in Wasai part of Jakara dam and its immediate environs between April 2017 to January 2018. Jakara dam was constructed in 1976 and occupies the south eastern part of Minjibir near Gezawa local government area. The area in terms of geology falls within the tip end of the Basement complex adjoining the Chad formation, which is characterized by disappearing type of streams. Jakara dam is one of the most grossly polluted dam in West Africa, because during the dry season all the streams that feed it dry up with the exception of the major Jakara stream which sustain it. The water bodies contain muddy substrata and gentle flowing, low turbidity water with rich growth of algae and macrophytes. Farar gada (White bridge), the second study site is located in Gezawa local government area of Kano state. Gezawa Local Government is bordered by Gabasawa local government to the east, Nassarawa local government to the west, Minjibir local government to the north and Warawa local government to the south.

Fig. 1: Map showing Jakara dam (Wasai) and Farar gada
Snail collection Wasai part of Jakara dam in Minjibir Local government area of Kano state and other water bodies were investigated for the presence of freshwater snails between April 2017 to January 2018. Samples were collected with a long-handle snail sieve net (mesh size: 3mm-4mm). The sieve net was dragged through the water thereby collecting snails clinging to aquatic plants (water hyacinth). Snails were also handpicked when it was convenient. The snails were fed with lettuce during this study and were identified using keys provided by Vinarski (2016) and Mandahl-Barth (1965) and Brown (1994) where possible. Snapshots of the snails were taken using a Sony digital camera (DSC-W610). Efforts were made to identify the apple snails based on descriptions in applesnail.net and other published works. Examination for possible cercarial infection Snails were placed separately in compartmented petridishes for hours to examine them for possible cercarial infection. Result Two snails of the genus Pomacea were found in Wasai part of Jakara dam and five in Farar gada (white bridge). The Pomacea species have an operculum, an oval structure that can seal the shell and prevent desiccation (Fig 2b); four tentacles can be visible (Fig. 3). No cercarial infection was found.
a. b. Fig.2: (out of water) a. Abapertural and b. apertural view of Pomacea spp from Wasai part of Jakara dam, note the operculum (First day)
Fig.3: Pomacea from Wasai (placed in water)same as fig.2

Fig.4: Pomacea species from Farar gada placed in water (note the pair of eyes) The farar gada species are dull brown with yellow bands, while the musculature is yellow, with four tentacles and a pair of eyes.
Fig.5: Pomacea species collected in Wasai and Farar gada with an operculum
a. b. c. d. e.
f. . g. Fig. 6abcdef: Not clearly identified species of Pomacea g. Pomacea paludosa? Discussion It is not known how and why these species were introduced into these river bodies but the fact that they have been recognized as potentially dangerous species elsewhere calls for proper regulatory bodies in this country (Nigeria) too. The danger inherent in these species is not known or is ignored by the local farmers who proudly guides the author to where more of the snails were found. The Farin gada species were found in a rice farm while that of Wasai were found in the fishing part of Jakara dam and may likely spread to other areas. The identity of the Pomacea species encountered in this study does not coincide with the African species Afropomus, Lanistes and Saulea but one of them has some characteristics similar to the species described by Hayes at al, (2012), Pomacea canaliculata which is native of Brazil, Bolivia, South America, etc. Its identity too is still been questioned as it has been compared with Pomacea insularum (Timothy et al., 2007). Although the invasive apple snail Pomacea canaliculata was known as an omnivorous species, there are reports of its predation on other freshwater snail species in other places (Kwong, et al., 2009) and it is likely that it served as a predator to other snail species here too. In Wasai part of Jakara dam where it was first encountered many species of live Bulinus and Lymnea were encountered but very few of each species were found (Duwa, 2018), in Farar gada the second study site there were no other snail species apart from the Pomacea species. They are a serious pest of rice in southern Asia and taro in
Hawaii, and have been damaging rice in Spain (Korycinska. and Eyre, 2012). It is likely that the Farar gada species is Pomacea canaliculata since it is found in a rice farm. These snails were collected in November and December during the harmattan season when the temperature was 200c this coincides with the temperature at which these snail species thrive most (http://applesnail.net). One of the pomacea species collected in the rice farm in December is still alive after three months (courtesy the operculum). Conclusion The presence of these new species may be related to environmental change which turn to provide the right habitat for the new spp. But anthropogenic activities cannot be ruled out in bringing about environmental change as well as instrumental in introducing the spp. Pomacea species has been recognized as invasive species, threats to farmers and are intermediate hosts for nematode parasites that can cause severe health problems in humans. This snail species has been reported to reproduce rapidly. It is therefore of utmost importance that emergency measures be taken against its spread. Much work also still need to be done in order to identify the species. References Cowie, R.H., (2002) Apple snails (Ampullariidae) as agricultural pests: their biology, impacts and
management. In: Barker, G.M.(Ed.), Molluscs as Crop Pests. CABI. International, Wallingford, UK, pp. 145–189
Duwa, R. S (2018) Current status of Lymnea and Bulinus species in Wasai part of Jakara dam, Kano state, Nigeria and their public health implications International Journal of Pharmacy and Biological Sciences (IOSR-JPBS) Vol.13 issue 1 version V pp05-08
http://www.applesnail.net EFSA (2012) Scientific Opinion on the evaluation of the pest risk analysis on Pomacea insularum, the
island apple snail, prepared by the Spanish Ministry of Environment and Rural and Marine Affairs. Eur Food Safe Authority J 10 (2552):57
Hayes, K.A., Joshi, R.C., Thiengo, S.C., Cowie, R.H., (2008) Out of South America: Multiple origins of non-native apple snails in Asia. Diversity and Distributions. 14(4), 701–712.
Hayes, K.A., R.H. Cowie, S.C. Thiengo, and E.E. Strong. (2012). Comparing applesnails with apples: clarifying the identities of two highly invasive Neotropical Ampullaridae (Caenogastropoda). Zoological Journal of the Linnean Society 166(4):723-753.
King-Lun Kwong, Robert K.Y. Chan and Jian-Wen Qiu (2009) The Potential of the Invasive Snail Pomacea canaliculata as a Predator of Various Life-Stages of Five Species of Freshwater Snails Malacologia :Vol. 51, Issue 2, pg (s) 343- 356
Korycinska, A. and Eyre, D (2012) Plant Pest Factsheet The Food and Environment Research Agency (Fera)
Martín P R, Estebenet A L, Cazzaniga N J (2001) Factors affecting the distribution of Pomacea canaliculata (Gastropoda: Ampullariidae) along its southernmost natural limit. Malacologia 43:13–23
Mochida, O. (1991) Spread of freshwater Pomacea snails (Pilidae, Mollusca) from Argentina to Asia. Micronesica, Suppl. 3: 51-62.

Rawlings, T. A., K. A. Hayes, R. H. Cowie, and T. M. Collins (2007). The identity, distribution, and
impacts on non-native apple snails in the continental United States. BMC Evolutionary Biology, http://www.biomedcentral.com/1471-2148/7/97
Timothy A R, Kenneth A H, Robert H C and Timothy M C ( 2007) BMC Evolutionary Biology 7:97
Ting-Bao Yang, Zhao-Rong Lung and Zhong-Dao Wu (2013) The Apple Snail Pomacea canaliculata, a Novel Vector of the Rat Lungworm, Angiostrongylus cantonensis: its Introduction, Spread, and Control in China. Hawai Journal of Medicine and Public Health : 72(6 Suppl 2):23-5

EVALUATION OF PUBLIC PERCEPTION OF MEDIA AWARENESS CAMPAIGNS ON ZIKA VIRUS IN SOUTH EASTERN NIGERIA
Ezugwu Martins N; Anorue, Uchenna C and Ugwuoke, Joel C. Department of Mass Communication, University of Nigeria, Nsukka
Abstract
In recent times, quality health care delivery has become an issue of priority to nations across the globe. This study examined public perception of media awareness campaigns on zika virus in South Eastern Nigeria. It was anchored on RE-AIM model. The population of the study was drawn from six state capitals in South Eastern Nigeria, using survey method. From the five south eastern states, a sample size of 252 respondents was selected. Questionnaire served as the instrument for data collection. From the data collected and analyzed, it was revealed that the media have not changed public perception towards zika virus, due to the low persuasive nature of their messages. It was also revealed that the low level of mass media awareness campaigns encouraged the public to take preventive measures, but this has not change their perception towards zika virus. The study however, recommended that to achieve better result in the campaigns on zika virus, media campaign managers should take into consideration those factors that influence perception of the populace the campaign is targeted at, involving traditional media in their campaigns strategy, thereby making media campaigns participatory in nature and avoid centralizing media awareness campaigns on channel they presume to be effective. Key words: Public, Perception, media awareness, campaigns and zika Virus
INTRODUCTION
In recent times, the World Health Organisation (WHO) (2016) has declared Zika virus infection a global public health emergency, stating that the virus, which has spread rapidly in South America, is not just a threat to countries in South America or Europe but to the whole world. The virus is seen as a global concern because it could spread to areas of the world where the population may not be immune. The mosquitos that carry Zika virus are present in Africa, parts of southern Europe and Asia, particularly South Asia (Costello,2016).
However, available statistics from World Health Organization (WHO, 2016), have shown that more than 1.5 million Brazilians have been infected with Zika virus since early 2015, while the country recorded its third Zika-related death on 11 February, 2016. Zika virus is also biting hard in Colombia with WHO statistics indicating 31,555 cases of the condition in the country, 5,013 of those being pregnant women. The WHO also reported that the virus has spread to Mexico, the Caribbean, the Pacific Islands and Cape Verde; while over 50 Americans have been infected (WHO, 2016).
Recent reports have shown that Africa is not left out in the spread of the virus. A report by the Lancet Infectious Diseases research scientists (2017) revealed that an estimated 2.6 billion people living in Africa and the Asia-Pacific region are vulnerable to the Zika virus. This report was based on numbers of travellers arriving from Zika-affected areas. In line with the above, Brady (2016) noted that countries such as India, Indonesia and Nigeria are predicted to be at highest risk of Zika introduction with up to 5,000 passengers a month arriving from Zika endemic areas.
According to Bogotch (2016), Nigeria stands out as one of the high-risk zones owing to its large population and other ecological factors. He said: ―We actually map out areas that are of higher

risk than others, so parts of West Africa such as Nigeria have all the right ingredients for a Zika virus outbreak. For example they have the right type of mosquitoes, currently they have the right temperature, the right amount of rainfall, and they travel to Zika virus affected areas like Latin America and the Caribbean‖. This shows that if care is not taken, Nigeria might be the highest infected area of this endemic virus.
The rapid increase in the spread of the Zika virus has become a growing cause for concern among countries, including Nigeria. That was why governments, individuals and international health organizations have urged people, especially expectant mothers, to take precautionary measures including avoiding stagnant bodies of water, gutters and biting mosquitoes. Intervention efforts to change behaviours are communicative acts (Anno, 2015). The necessity to convey health information to the population makes the media essential for effective health awareness campaigns on Zika virus in Nigeria.
According to the Minister of Health, Professor Adebowole (2016) the disposition of complacency toward the Lassa fever outbreak has taught Nigeria a lesson. According to him, all the states of the federation should immediately embark on health education campaigns to empower communities take actions to protect themselves from Zika Virus as well as other mosquito-borne diseases. Considering the primary medium through which Zika virus spreads, Nigerians needs an early intervention programme to prevent a serious outbreak.
Today in Nigeria, concerned bodies both at the local and international level are engaging in awareness campaigns against zika virus such as Wellbeing Foundation Africa (WBFA), Pharmannews and World Health Organization. These campaigns are carried out through different communication channels with the aim of educating, informing and influencing the perception of Nigerians towards zika virus.
Health communication is one of the growing important sectors of health promotion (Parrot 2004) and a key strategy to create awareness on unhealthy practices and to improve public health through media campaigns. The campaign messages against Zika virus, calls for an adequate level of awareness creation that is a necessary precondition for the proper fight against the virus. Hence, this study evaluates public perception of media awareness campaigns on Zika virus in South Eastern Nigeria. Statement of the Problem In recent times, government and other public agencies engaged in various media campaigns as a social intervention tool to reduce or stop the spread of zika virus across the globe. Zika virus has been linked to have congenital, neurological, and malformation implication on babies, pregnant women and the populace at large. The problem is that the disposition of complacency towards zika virus awareness campaigns by the government and the media has made Nigeria populace not to perceive the virus as a serious health issue. Most Nigerians are ignorant of what the virus is all about. The little percentage aware of the virus fails to see it as a serious health problem. This is why Nigerians are still travelling to zika endemic areas en masse without fear of the virus. Zika virus is spreading fast across the globe and Nigeria is yet to put in place measures to combat its emergence like other nations. Therefore, the increase in the spread of zika virus poses a pertinent question on public perception of media awareness campaigns on zika virus in South Eastern Nigeria. Objectives of Study The major objectives of this study are to:
1. Ascertain the extent south eastern residents are exposed to zika virus media awareness campaigns.

2. Determine how south eastern residents perceive media awareness campaigns on zika virus. 3. Find out how south eastern residents perceived communication channels used by the media
in their zika virus awareness campaigns. 4. Know whether these campaigns have changed south eastern residents perception on zika
virus overtime 5. Ascertain those factors that affect south eastern resident‘s perception on media awareness
campaigns on Zika virus.
Research Questions 1. To what extent are south eastern resident exposed to zika virus media awareness campaigns? 2. What perception do south eastern residents have on Zika virus awareness campaigns? 3. What perception do south eastern residents have on communication channels used by the
media in their zika virus awareness campaigns? 4. To what extent have media awareness campaigns on zika virus changed the perception of
south eastern residents? 5. What are those factors that affect the perception of south eastern residents on media
awareness campaigns on Zika virus?
Literature review Zika virus
Zika virus was discovered in Uganda in 1947. Zika virus is a member of the flavivirus family. Other flaviviruses include dengue, yellow fever, and West Nile. Like its relatives, Zika virus is primarily transmitted to humans through the bite of infected Aedes aegypti mosquitoes. According to the National Institute of Allergy and Infectious Diseases (2016), the virus may also be transmitted from an infected pregnant woman to her baby during pregnancy or around the time of birth. Sexual transmission by males and blood transfusion are also potential routes for the spread of Zika virus. Most people who become infected with Zika virus do not become sick. The illness is generally mild with symptoms that include fever, rash, joint pain, or conjunctivitis (red eyes) and lasts several days to a week. Zika virus infection during pregnancy, however, can cause a serious birth defect called microcephaly, as well as other severe fetal brain defects (NIAD,2016).
According to medical professionals, cited in Wellbeing Foundation Africa (WBFA) (2016),
the Zika virus has an incubation period of about 3 to 12 days after the bite of an infected mosquito. Apart from pregnant women and their babies, Zika virus can affect anyone who lives or travels to any area where the virus is found. The virus is usually asymptomatic in roughly 80% of individuals who have been infected, and its symptoms typically include fever, rash, joint pain, conjunctivitis, muscle pain and headache (Wellbeing Foundation Africa, 2016). Zika virus carrier in Nigeria: A myth or reality
The World Health Organisation (WHO, 2016) warned that Zika virus, a mosquito-borne disease that has swept quickly throughout equatorial countries, may spread across the Americas, the United States and even Nigeria.
The Guardian‘s investigation (2016) revealed that Nigeria, which is one of the malaria-endemic countries, is home to the Aedes aegypti, also a vector for malaria, yellow fever and dengue fever. Nigeria is in danger of dengue fever outbreak, another deadly fever in the class of Ebola Virus Disease, transmitted by Aedes aegypti mosquito (yellow fever mosquitoes) and Aedes albopictusis (tiger mosquitoes) that are now common in the country mostly in and around homes.

A virologist and Director of WHO National Polio Laboratory, Department of Virology, University of Ibadan (UI), Adeniji (2014) noted that there is no house that these mosquitoes are not present, including big hotels. We have all the four stereotypes of dengue fever in Nigeria. Although not all mosquitoes are infected with dengue virus, if bitten by an infected one, it will spread the virus.‖ According to the expert, the mosquitoes, black and tiny, with white patches, look alike, adding that in a recent case people thought was Ebola virus disease turned out be a case of dengue fever. He said dengue virus had been isolated by the Department of Virology as far back as the 70s from humans and mosquitoes, declaring that Aedes albopictusis was not native to Africa, but found its way into Nigeria through the international trade in used tyres, where their eggs were deposited. Media awareness campaigns Patel (2011) study on the healthy monday campaign: Health awareness in elementary schools. The study focuses on the implementation of the Healthy Monday campaign to fourth and fifth grade students in two Kentucky elementary schools. The degree of awareness and the effectiveness the campaign raised in children, teachers, and parents was specifically studied through pre and post surveys. Each pre survey was distributed and collected from students, parents, and teachers in the two elementary schools. Each follow-up or post survey was distributed and collected from students, parents, and teachers in the same two elementary schools. This study shows that the health campaign increased student‘s awareness, nutrition knowledge, and behavior change. Also the parent and teacher population showed significant increase in campaign awareness and behavior change. Roba (2012) studied media and environmental awareness: A geographical study in Kembata Tembaro zone, Southern Ethiopia. The study employed mixed methods which include interviews, questionnaire and content analysis designed for the study Survey was conducted in one of the seven districts of the Kembata Tembaro Zone. The content analysis was used to find out how much time and space the different types of media like television, radio and daily news papers have devoted to information on environmental issues and what kind of issues are tackled. The study covers 120 purposefully sampled Addis Zemen daily newspaper reports from a total of 1,800 sample newspaper reports. In addition to this, the television and radio programs as well as distribution of print media per day were evaluated in the respondent survey. It was found that poor information delivery and communication systems are the major challenges for the media to effectively create awareness of the environment. Dombrowski., Mackintosh., Sniehotta., Araujo-Soares., Rodgers., Thomson., Murtagh., Ford., Eccles and White (2013). The impact of the UK ‗Act FAST‘ stroke awareness campaign: content analysis of patients, witness and primary care clinicians‘ perceptions. The study examined perceived impact and views of the campaign in target populations to identify potential ways to optimise mass-media interventions for stroke. Semi-structured interviews were content analysed to determine campaign awareness, perceived impact on decisions and response to stroke, and views of the campaign. The result showed that Act FAST stroke awareness campaign has had some perceived impact on stroke recognition and response in some stroke patients and witnesses, but the majority reported no campaign impact. Primary care clinicians were positive about the campaign, and believed it had impacted on stroke awareness and recognition but doubted impact on response behavior. Ankomah, Adebayo, Arogundade, Anyanti, Nwokolo, Inyang, Oladipupo Ipadeola and Meremiku (2014) studied the Effect of Mass Media Campaign on the Use of Insecticide-Treated Bed Nets among Pregnant Women in Nigeria. Twenty-one out of the 36 states in Nigeria including the

Federal Capital Territory were visited for the study. The study was a cross-sectional and population-based survey. A systematic multistage sampling technique was used to select pregnant women resident in the eighteen Global Fund states and three other adjoining states. Data were collected by trained interviewers using validated questionnaires to obtain information on maternal and child health with focus on malaria control. Respondents who knew that sleeping under ITN prevents malaria were 3.2 times more likely to sleep under net. Those who listened to radio are about 1.6 times more likely to use ITN , while respondents who had heard of a specific (monitored) sponsored radio campaign on ITN are 1.53 times more likely to use a bed net. The result of the study indicated that promoting the use of Insecticide-Treated Nets, through mass media, has proved to be effective and has improved ITN use among pregnant women in Nigeria. Nyakundi (2015) studied on the impact of communication campaigns on mental health behavior change among secondary school students in Nairobi. The target population of this study was students from public secondary schools in Langata District in Nairobi. Stratified random sampling technique was used to select the students who participated in the study. Qualitative data was collected from psychiatrists and psychiatric nurses using interviews. Quantitative data was collected from respondents through the survey method using a questionnaire and printed materials obtained from the public hospital. The study found that the levels of knowledge of mental health among public secondary school students in Langata District in Nairobi were low, the messages communicated during communication campaigns for mental health left out important information and they were not tailored for secondary school students, and that the communication campaigns for mental health did not adhere to the principles of effective health communication Okorie and Abiodun (2016) studied on the influence of media awareness campaigns on breast cancer care among women in South-West Nigeria. The study employed a mixed research method, which include survey and focus group discussion. A total of 632 persons participated in the study. The multi- stage sampling and simple random sampling techniques were used to select the questionnaire respondents in Lagos, Oyo and Ekiti States. The findings of the study show that the level of knowledge of breast cancer in South-West Nigeria is still low. Some of the factors limiting the knowledge of breast cancer care in the area of study are cultural traditions, secrecy and religion. Respondents in the study received most of their breast cancer information from newspapers/magazines, television and radio. Theoretical framework
This work adopted the RE-AIM model. This model was propounded by Glasgow, Vogt and Boles (1999). This model is based on the idea that a health promotion campaign should be efficacious i.e create a substantial amount of change and reach a large number of people. RE-AIM stands for Reach, Efficacy or Effectiveness, Adoption, Implementation and maintenance. Reach- is a measure of how many people can be influence by the health promotion campaign Efficacious- Efficacious and effective campaign produces positive outcomes along with few unintended consequences. Adoption- focuses on the participation rate i.e number of people who engage in the health promotion behaviour and whether the setting is representative of a large populat ion. Implementation- targets whether the health promotion campaign was employed as intended Maintenance- focuses on the long term utilization of the given health behaviour and whether a health promotion campaign is sustainable.
The goal is not to have a health promotion campaign that is equal effective in all the five dimensions; rather, these dimensions help to evaluate a campaign before it is adopted , so that those

characteristics that are most important in a given setting can be selected and used in the main campaign. This model is relevant to the study under investigation because it centres on the five dimensions that are very necessary before media campaign can be adopted. It points to the fact that for media awareness campaign on Zika Virus to be effective it must pass through these five dimensions. These five dimensions show the importance of campaign evaluation before adoption as a requisite for effective media campaign. In other words, without conducting a formal evaluation of media awareness campaign on Zika virus before adoption, it will be difficult to gain representative feedback on the campaign, the message and the effective component of the campaign. This model calls for media campaign outcome evaluations for campaign planners before adoption. This will enable campaign planners to assess changes in the level of public perception and determine to what extent the public can engaged in the campaign and make changes where applicable or necessary. Methodology The research design for this study was survey method. The use of survey design in this study helped the researcher to identify and explain statistically, public perceptions of media awareness campaigns in South Eastern Nigeria. Survey method is appropriate to this study because the work itself focuses on opinion, attitudes and views of people towards awareness creation by the media on Zika virus in South Eastern Nigeria. The population of this study was South Eastern Nigeria. The figure of South Eastern Nigeria as provided by the National Population Commission in Nigeria as at 2006 was 16431555. To calculate the sample size of this study, the Australian calculator was used. The sample size of this study was 385 respondents. In this study, the multi-stage sampling technique was used. This technique requires the use of several sampling techniques or/and stages in a particular method when the population is large and complex to ensure true presentation (Chukwuemeka, 2002 cited in Udeh, 2011) Stage 1
First, the researcher used cluster technique; the South East Geo-Political Zone which the research studied has five (5) states (Abia, Anambra, Ebonyi, Enugu and Imo). These states are regarded as cluster. In line with this, South Eastern Nigeria as a geo-political zone was sub-divided into the five (5) existing states. Stage 2 The researcher purposively selected two local government areas from each of the states. In all, this gave a total of ten (10) local governments. The table below gives a picture of how the sampling was done.
Name of country
Geo-political zones
States in each zones
Number of local governments Selected Local Govts
Nigeria SOUTH-EAST
Abia, Abia North, Abia South, Arochukwu, Bende, Ikwuano, Isiala Ngwa North , Isiala Ngwa South , Isuikwu ato, Obingwa, Ohafia, Osisioma, Ugwunagbo, Ukwa East, Ukwa West, Umuahia North, Umuahia South and Umunneochi (17)
Abia South and Umuahia North,
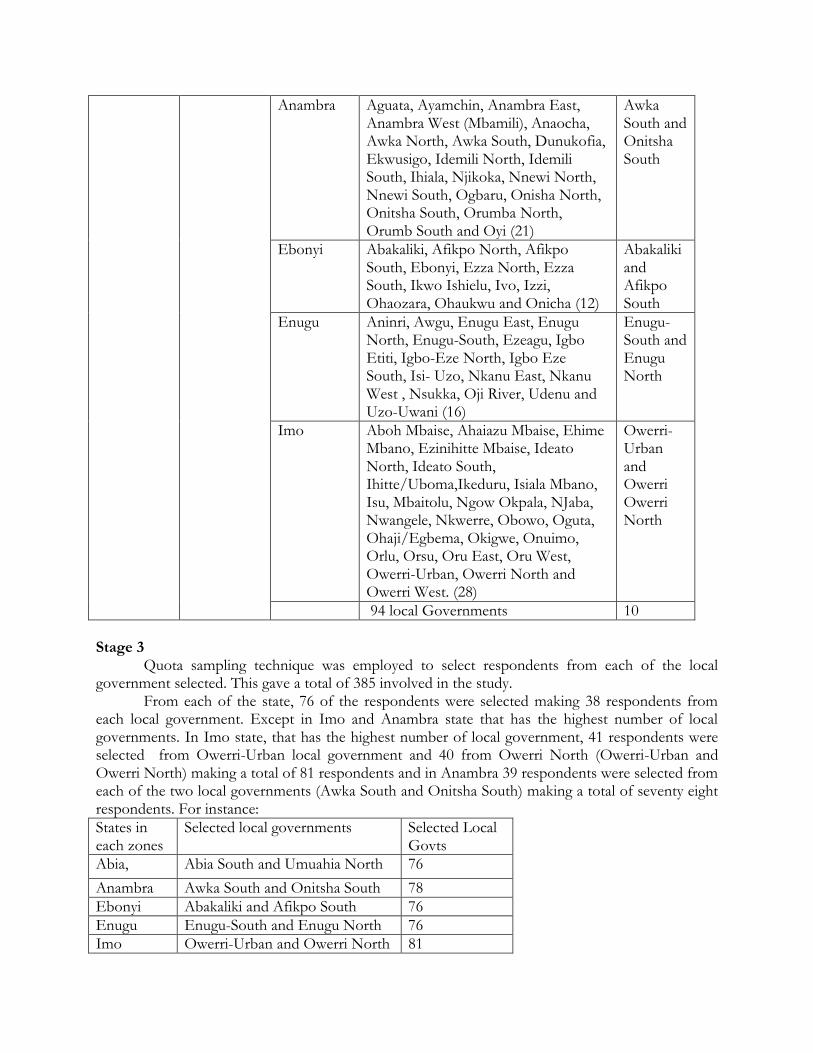
Anambra Aguata, Ayamchin, Anambra East, Anambra West (Mbamili), Anaocha, Awka North, Awka South, Dunukofia, Ekwusigo, Idemili North, Idemili South, Ihiala, Njikoka, Nnewi North, Nnewi South, Ogbaru, Onisha North, Onitsha South, Orumba North, Orumb South and Oyi (21)
Awka South and Onitsha South
Ebonyi Abakaliki, Afikpo North, Afikpo South, Ebonyi, Ezza North, Ezza South, Ikwo Ishielu, Ivo, Izzi, Ohaozara, Ohaukwu and Onicha (12)
Abakaliki and Afikpo South
Enugu Aninri, Awgu, Enugu East, Enugu North, Enugu-South, Ezeagu, Igbo Etiti, Igbo-Eze North, Igbo Eze South, Isi- Uzo, Nkanu East, Nkanu West , Nsukka, Oji River, Udenu and Uzo-Uwani (16)
Enugu-South and Enugu North
Imo Aboh Mbaise, Ahaiazu Mbaise, Ehime Mbano, Ezinihitte Mbaise, Ideato North, Ideato South, Ihitte/Uboma,Ikeduru, Isiala Mbano, Isu, Mbaitolu, Ngow Okpala, NJaba, Nwangele, Nkwerre, Obowo, Oguta, Ohaji/Egbema, Okigwe, Onuimo, Orlu, Orsu, Oru East, Oru West, Owerri-Urban, Owerri North and Owerri West. (28)
Owerri-Urban and Owerri Owerri North
94 local Governments 10
Stage 3
Quota sampling technique was employed to select respondents from each of the local government selected. This gave a total of 385 involved in the study.
From each of the state, 76 of the respondents were selected making 38 respondents from each local government. Except in Imo and Anambra state that has the highest number of local governments. In Imo state, that has the highest number of local government, 41 respondents were selected from Owerri-Urban local government and 40 from Owerri North (Owerri-Urban and Owerri North) making a total of 81 respondents and in Anambra 39 respondents were selected from each of the two local governments (Awka South and Onitsha South) making a total of seventy eight respondents. For instance:
States in each zones
Selected local governments Selected Local Govts
Abia, Abia South and Umuahia North 76
Anambra Awka South and Onitsha South 78
Ebonyi Abakaliki and Afikpo South 76
Enugu Enugu-South and Enugu North 76
Imo Owerri-Urban and Owerri North 81

Total 10 local Governments 385
The questionnaire was used as an instrument for data collection. The instrument has two sections: the demographic and psychographic sections. The demographic section was used to elicit information about the bio-data of the respondents while the psychographic section focused on the research questions. The questionnaire was drafted in simple sentences consisting of 20 questions. It made use of close and open ended techniques in order to give the respondents enough room to field in responses to the questions.The instrument, however, was administered with the help of five (5) trained research assistants in ten (10) local governments of the states. A response window of two (2) weeks was given to the respondents to complete the questionnaire. The data collected was analysed using tables and simple percentages. The reason for the use of tables was to show the relationship between the various responses fielded for the options at the disposal of the respondents. The percentages and tables were used for analysis in the study. Data analysis Bio-data 42 of the respondents representing 17% falls within the age rang of 20-25, 72 representing 29% falls within the age range of 26-35, 56 representing 22% falls within the age range of 36-45, 45 representing 18% falls within the age range of 46-55 while 36 representing 14% are above the age range of 55.112 of the respondents representing 44% were married while 140 respondents representing 56% are single. Research question 1: To what extent are south eastern resident exposed to zika virus media awareness campaigns? 44% of the respondents are not aware of zika virus awareness campaigns while 66% of the respondents are not aware of the campaign. 25 respondents representing 29% got their information regarding zika virus from friends, 17 respondents representing 20% got theirs from relations, 13 respondents representing 15% got information from NGO‘s, while 31 respondents representing 36% got theirs from the media. 64 of the respondents representing 25% agreed that the media is good in creating zika virus awareness, while 75% said no. 103 respondents representing 21% said the media present programmes on zika virus not often while 198 respondents representing 79% were indifferent. Research question two: What perception do south eastern residents have on Zika virus awareness campaigns? 10 respondents representing 4% agreed that the media is good in creating zika virus awareness, 37 respondents representing 15% rated the media average, 122 respondents representing 48% said below average, while 83 respondents representing 33% said the media was poor in creating zika virus awareness. 11 of the respondents representing 4% are impressed, 241 representing 96% are not impressed with the performances of the media awareness campaign on zika virus so far. 18 of the respondents representing 21% agreed that media awareness campaign on zika virus is informative in arresting attention, 38 of the respondents representing 44% said it is educative, 8 of the respondent representing 9% said it is entertaining while 22 representing 26% indicated all of the above. Research question 3. What perception do south eastern residents have on communication channels used by the media in their zika virus awareness campaigns? 8% of the respondents said that newspaper frequently carries zika awareness messages; 10% said magazine; 17% indicated television; 12% said radio, while 52% indicated the social media. 32 respondents representing 13% prefer seeing media awareness campaign messages on zika virus in newspaper, 11% said magazine, 6% indicated billboard, 22% said television, 32% said radio, while

16% indicated the social media. 5% of the respondents said newspaper is more effective on zika virus awareness campaign; 3% said magazine; 6% indicated billboard; 24% said television; 48% indicated radio, while 14% said the social media. Research question 4. To what extent have media awareness campaigns on zika virus changed the perception of south eastern residents? 100% of the respondents are encouraged by the media to take preventive measures on zika virus. 45% of the respondents agreed that media awareness messages on zika virus are very persuasive in encouraging people to take preventive measures, 65% said slightly persuasive. 21% agreed that the media has changed people‘s attitude and behaviour towards zika virus, while 79% indicated no. Research question five: What are those factors that affect the perception of south eastern residents on media awareness campaigns on Zika virus? 16% of the respondents agree that not involving the people in their campaign affect the perception of south eastern residents on media awareness campaigns. 36% of the respondents indicated negligence of the grassroot. 37% noted government complacency towards the virus and 11% said tradition. Implications of the findings
The result of this study has shown that if care is not taken zika virus might spread to Nigeria. This is as a result of low perception Nigerians have on the virus. Therefore, RE-AIM model becomes relevant to government, campaign planners and designers to adopt. This model calls evaluating a campaign before it is adoption. The essence is to select those characteristics that are most important in a given setting and use them in the main campaign for effective result. Summary and Conclusion The main thrust of this study was to evaluate public perception of media awareness campaigns on zika virus in South Eastern Nigeria. In doing this, five (5) states in South Eastern Nigeria were used as a study. Using five research questions that bordered on public perception of media awareness campaigns in Nigeria, looked at the level of awareness, people‘s perception, medium of information, the level of influence and factors that affect the effectiveness of media campaigns on Zika virus?. It was revealed that the media actually created awareness on zika virus but to a very low extent. This finding is in line with previous studies like Patel (2011), Roba (2012), Okorie et.al (2016) findings. These findings indicated to an extent, media campaigns are very low. Factors such as cultural traditions, religion, etc do affect the effectiveness of media campaigns. The media have not really created enough awareness on Zika virus. 66% of the populace are yet to be aware of media awareness campaigns on Zika virus. In spite of the low level of media awareness campaigns on zika virus in South Eastern Nigeria, people still take preventive measures. These preventive measures have not change their perception towards zika virus. There are areas the media need to address to achieve desired results on zika virus campaigns. These areas include; taking full account of factors that influences perception of the populace the campaign is targeted at, tradition, religion or belief system, involving traditional media in their campaigns strategy, thereby making media campaigns participatory in nature and avoid centralizing media awareness campaigns on channels they presume to be effective. Recommendations
The following recommendations were made in the light of the major findings. . There is need for campaign managers or designers to take into full account of those factors that influences perception of the populace the campaign is targeted at. This is why it is necessary to evaluate campaigns before execution, looking at perception factors that influence the public.

. Total dependence on social media as a modern communication vehicle should be discouraged. There is need to look at how rich, available or suitable a particular medium is to the target populace. . The success of campaign depends on the level of people‘s involvement. Media campaigns should center on the people. The top down approach used in media campaigns should be discouraged. Media campaign should be people-oriented and participatory in nature. . Factors like religion, tradition or belief system need to be put into consideration before embarking on media campaigns. Previous studies on media awareness campaigns have shown the effects of these factors on campaign effectiveness. References Adebowole (2016, February 11), Minister assures Nigerians that lassa fever outbreak is under control
but tasks citizenry to be vigilant on Zika virus. WHO. Retrieved from www.afro.who.int › Nigeria › News
Adeleke, M. A., Mafiana, C. F., Idowu, A. B., Adekunle, M. F. and Sam-Wobo, S. O (2014) Mosquito larval habitats and public health implications in Abeokuta, Ogun State, Nigeria, Tanzania Journal of Health Research.
Ankomah, A., Adebayo, I., Arogundade,E., Anyanti, J., Nwokolo, E., Inyang, U., Oladipupo B., and Meremiku, M. (2014). The effect of mass media campaign on the use of insecticide-treated bed nets among pregnant women in Nigeria. Malaria Research and Treatment, Volume 2014,p. 7.
Anno, A. (2015). Mass media and health promotion: A campaign to promote flu vaccination among healthcare workers. Università degli studi di udine dipartimento di scienze umane
Bogotch, I. (2016, May 9). Assessing transmission risks of Zika virus in Africa. Africanews. Retrieved from www.africanews.com
Brady, O. (2016, September 2). Zika: Two billion at risk in Africa and Asia. BBC News. Retrieved from www.bbc.co.uk/news/health-37244577
Chukwuma, M. (2016, February 3). Nigeria: Mosquito-Transmitted Zika Virus May Spread to Nigeria. The Guardian. Retrieved from https://guardian.ng/news
Costello, A. (2016, Feburary 3).Quest for Zika vaccine widens; Africa, Asia deemed vulnerable. The Peninsula Newspaper. Retrieved from https://www.thepeninsulaqatar.com.
Dombrowski, U., Mackintosh, E., Sniehotta, F., Araujo-Soares, V., Rodgers, H., Thomson, G., Murtagh, M., Ford, M., Eccles, P., and White, M. (2013). The impact of the UK ‗Act FAST‘ stroke awareness campaign: content analysis of patients, witness and primary care clinicians‘ perceptions. BMC Public Health, 13:915.
Glasgow, R.E. Vogt, T., & Boles, S.M. (1999). Evaluating the public health impact of health promotion interventions: The RE-AIM Framework. American Journal of Public Health, 89, 1322-1327
National Institute of Allergy and Infectious Diseases (2016). Zika virus. Retrieved from https://www.niaid.nih.gov/diseases-conditions/zika-virus
National Statistical Service (NSS Australian calculator, Retrieved 6th April 2016) Nyakundi (2015). The impact of communication campaigns on mental health behavior change
among secondary school students in Nairobi. Jomo Kenyatta University of Agriculture and Technology.
Okorie, N. and Abiodun, S. (2016).Effective use of media awareness campaigns for breast cancer care among women: A comparative study. Journal of International Women‘s Studies Vol. 17, No. 4 July 2016
Patel, P.S. (2011). The healthy monday campaign: Health awareness in elementary schools, University of Kentucky, Uknowledge.
Parrott, R. (2004) Emphasizing communication in health communication. Journal of Communication 54: 751-87
Roba, T. (2012). Media and environmental awareness: A geographical study in Kembata Tembaro Zone, Southern Ethiopia
The Wellbeing Foundation Africa (2016, February 3). Wellbeing Foundation Africa Maternal Monday Campaign Issues Zika Virus Alert for Pregnant Women; Highlights Effects on Pregnancy and Birth Outcomes (2). Sabinews. Retrieved from https://www.sabinews.com › All News
Udeh, K. (2011). The influence of media campaigns on vesico vaginal fistula prevention and control in North West Nigeria. A research project submitted to the department of mass communication, university of Nigeria, Nsukka.
WHO (2016, January 15).Minister assures Nigerians that Lassa fever outbreak is under control but tasks citizenry to be vigilant on Zika virus. www.afro.who.int › Nigeria › News
World Health Organization (2016, February 12). Zika situation report. Retrieved from www.who.int/emergencies/zika-virus/

ASSESMENT OF SOME PHYSIO-CHEMICAL PARAMETERS OF RIVER KOGIN WUDIL, KANO STATE
Azubuike Adams; Nwoye Elias and Idris Aisha Fatima Faculty of Science, Nigerian Police Academy, Wudil Kano State
ABSTRACT
The quality of water usually describe according to its physical, chemical and biological characteristics. Rapid industrialization and use of chemical fertilizers and pesticides in agriculture are causing deterioration of water quality. Due to use of contaminated water human population suffers from water borne diseases. This study assesses some physiochemical parameters of river Kogin Wudil, Kano State, Northern Nigeria. Four sampling stations were located along the water body to reflect a consideration of all possible human activities that are capable of changing the quality of the river. the water samples were collected monthly for six consecutive months (Jan 2017-June 2017) at the four sampling stations. pH, temperature (air and water temperature oC)., conductivity, total dissolved solid and transparency were conducted. Findings revealed that the values obtained were within the expected range in reference to the tables. KEY WORDS: Assessment, Physio-chemical Parameters, Sampling Station, Wudil River.
INTRODUCTION Water is a vital commodity and its sources include rivers, streams, lakes, wells, boreholes, spring etc (Wakama, uZiru, Kagbu & Balarabe, 2008). Rivers are among the oldest water bodies in the world (Edegbene & Arimoro, 2012).Ground water, surface water (rivers, streams and ponds), atmospheric water (rain-water, snow and hail) and springs are the main source of water available to the people in general. The qualities of these water bodies vary widely depending on the location and environmental factors. The major source of ground water is precipitation that infiltrates the ground and moves through the soil and pore spaces of rocks. Other sources include water infiltrating from lakes and streams, recharge ponds and waste-water treatment system. As ground water moves through soil, sediment and rocks, many impurities such as disease-causing micro-organisms are filtered out. Many water resources in developing countries are unhealthy because they contain harmful physical, chemical and biological agents. To maintain a good health however, water should be safe to drink and meet the local standards and international standards to taste, odour and appearance. To monitor the water resource and ensure sustainability, national and international criteria and guidelines established for water quality standards are being used. (De Cabo, Purg, Areghene, Ologiun, Seone & Obertello, 2003).The chemistry of water is very dynamic, largely controlled and modified by its medium of contact. Since the chemistry of water directly hints the quality of water for various purposes, its monitoring and assessment gained substantial importance in the present century. A tremendous increase in the population increased the stress on both surface and the groundwater. It is believed at the beginning of the human civilization itself, groundwater was the most trusted form of drinking water because of the filtering effect of the aquifer. However, in the present world drinking the water directly from the source without proper treatment is a tough task. The water analysis for physical and chemical properties is very important for Public health studies. These studies are also main part of pollution studies in the environment. The groundwater contains dissolved solids possesses physical characteristics such as odour, taste and temperature. The natural quality of groundwater depends upon the physical environment, the origin, and the movement of water.

As the water moves through the hydrological cycle, various chemical, physical and biological processes change its original quality through reactions with soil, rock and organic matter. Natural processes and human activities cause the changes in groundwater quality, directly or indirectly. According to WHO organization, about 80% of all the diseases in human beings are caused by water. Since water is of necessity to man, animal and plant there is therefore need to assess its quality so as to proffer guidelines for its sustainable usage and river in comparison with national and international standards./or make corrective steps to ensure its quality. This study is therefore aimed at assessing some physio-chemical parameters of River Kogin Wudil. These physio-chemical parameters are dissolved oxygen (DO), temperature (T), conductivity (CON), pH, transparency, and total dissolved solid (TDS). Dissolved oxygen is one of the most important parameters in aquatic systems (Davies, Ugwumba, & Abolude, 2006).When the temperature of water increases, a portion of oxygen converts from the liquid state to a gaseous state. Thus the ability of water to maintain oxygen in dissolved state decreases with increasing temperature. As a result, colder water can potentially contain more
dissolved oxygen than warm water (Chitmanat, & Traichaiyaporn, 2010). Water temperature is one of the most important physical characteristics of aquatic systems
(Castaneda, Sucgang, Almoneda, R. V., Mendoza & David, 2012). It is one of the most important regulators of life processes in aquatic ecosystems (Chidamandi, Shreekant & Argun, 2013). It has direct and indirect effects on nearly all aspects of stream ecology. Temperature amounts of nutrients (Asonye, Okoloie, Okenwa Iwenjamur, 2007). Conductivity of water is a measure of the ability of water to carry an electric current. Conductivity indicates the presence of ions within the water, usually due to in majority, saline water and in part, leaching. It can also indicate industrial discharges. The conductivity of water is directly linked to the
concentration of the ions and their mobility (Gunjan, Swamee, Arvind & Ajay, 2012). The removal of vegetation and conversion into monoculture may cause run-off to flow out immediate thus decrease recharge during drier period. Hence, saline intrusion may go upstream and this can be indicated by higher conductivity. Millisiemensor microsiemns are used as units for water conductivity. The term pH refers to the measure of hydrogen ion concentration in a solution. The term pH comes from the French: "puissance d'Hydrogène" which means strength of the hydrogenand is defined as the negative log hydrogen ion (H+) concentration in water. pH of water is how acidic or basic (alkaline) the water is. The values of pH 0 to a little less than 7 are termed acidic and the value of pH a little above 7 to 14 are termed as basic. When the concentration of H+ and OH- ions are equal, then it is termed as neutral pH.). It is defined as the negative log of the hydrogen ion concentration. When the pH of water decreases, the water becomes more acidic; as water becomes more basic, the pH increases Transparency is how easily light can pass through a substance. In other words, when the water is murky or cloudy and contains a lot of particles, the light cannot penetrate as deeply into the water column which hence limits primary productivity. Total dissolved solid (TDS) is a measurement of inorganic salts, organic matter and other dissolved materials in water. These solids are filterable in nature. It is defined as the residue upon evaporation

of filterable sample. TDS concentrations are used to evaluate the quality of freshwater systems
(Ojutiku, & Kolo, 2011)). Objectives of Study 1. To assess the physic-chemical parameters of the water in the river 2. To ascertain which parameters appear most in the river sites 3. To assess the months and the variations of the parameters 4. To compare the months and parameters in each river site. Research Questions 1. What is the mean variation of the parameters in the rivers? 2. What parameter appear most in the rivers for the six months? 3. What is the difference in the parameters in the four river sites? Methods River Kogin Wudil stream is located in Kano State area of the country Nigeria. The stream is located at latitude and longitude coordinates of 12.065321 and 8.994838, 11 40`0`` North , East 8 51`0`` with DMS Lat and DMS long of 120355 and 85941, antipode of 12.065321, -171.005162, with sunrise rising at 05:49 GMT and sunset of 17: 26 GMT. The stream is impacted by dams and other structures along its channel. The rainfall is from June to October annually of over 1000mm.
Picture of River Kogin Wudil, indicating the four sampling collection sites Assessment of physicochemical Parameters Dissolved Oxygen: Dissolved oxygen content was determined using the Winkler‘s method (Sarah & Ravi, 2012)). Water was collected using DO stopper bottle (no air bubbles). 2mLof Reagent 1 and 2 (Manganese Sulfate and Alkali-Iodide-Azide) was added using a pipette by dipping the pipette inside the sample. Sample was mixed thoroughly and the precipitate was allowed to settle down. 2mL of Sulfuric acid was added via a pipette. Bottle was inverted to mix the content. Sample was kept for 8 hours in a cool, dark place. Content was titrated against sodium thiosulphate to straw yellow colour. 2mL of starch

was added to the conical flask and the colour turned blue. Titration was continued until the sample turned colourless. Dissolved oxygen concentration was calculated. Calculation of DO can be carried with the formula below: DO (mg/l) =Volume (NO2S2O2) x Normality (acid) x 8 x 100 Sample Volume Where, 8= atomic no. of O2 Temperature: Water temperature (WT) and Air temperature (AT) were determined in the field a mercury bulb thermometer. Water sample was collected from River Kogin Wudil in a clean container deep enough to cover the tip of the thermometer. Sample was allowed to sit for a moment so that the water temperature can stabilize. Thermometer was inserted into the water sample for seconds and brought out immediately. Readings were taken when it stabilized. Air temperature was determined by placing the thermometer around River Kogin Wudil. Readings were taken immediately the thermometer stabilized. Conductivity: Conductivity was measure with conductivity meter model Jenway 4010. Electrode was rinsed and wiped carefully with a tissue paper. 200mL of water was measured and transferred into a beaker and placed on a magnetic stirrer. Electrode was dipped into the water sample taken in a beaker. Reading was taken when the conductivity meter steady in order to give a stable reading. Hydrogen ion concentration (pH): The pH of the water was measured with a pH meter model pHS25.Probe was rinsed with clean water wiped with clean tissue to dry. Water from River Kogin Wudil was collected in a clean container the water sample must be deep enough to cover the tip of the electrode. Probe was inserted into the sample and allowed for some time for the meter to come to equilibrium. Readings were taken when the meter has reached equilibrium. Transparency: Transparency of the water was in the field determined using a Secchi disc of 10cm diameter. Secchi disc was deepen into the water until it disappears, noting the depth of the cord. Disc was slowly pulled up until it becomes visible also noting the depth of the cord. Records of the two average depths were taken along: with the date and time of the reading. Total Dissolved Solid (TDS): Water sample from River Kogin Wudil was collected in a clean glass, power of the TDS meter was turned on and the 2 electrodes at the end of the TDS meter were inserted fully into the water being sure the whole unit wasn‘t inserted along and no bubbles were attached to the electrodes. Readings were taken when the meter was stabilized. Results Physico-chemical Parameter of River Kogin Wudil by Station Table 1: Station Variation of Physicochemical Parameter for River Kogi Wudil for January
Parameter Site A Site B Site C Site D Total Mean
DO 8.70 7.60 6.35 6.80 29.43 7.36
AT 21.2 24.7 28.1 23.9 97.9 24.48

WT 17.6 18.0 22.0 18.5 76.1 19.03
CON 77.8 76.5 1470.5 94.2 1719 429.75
pH 7.26 7.45 7.17 7.49 29.37 7.34
TRANS 0.099 0.106 0.048 0.094 0.347 0.087
TDS 4.20 5.00 5.92 6.00 21.12 5.28
Total 136.859 139.356 1540.09 156.984
Grand mean 19.55 19.91 220.01 22.43
Table 2: Station Variation of Physicochemical Parameter; for River Kogin Wudil for February
Parameters Site A Site B Site C Site D Total Mean
DO 8.20 8.15 8.20 6.35 30.9 7.73 AT 24.3 24.8 25.0 25.3 99.4 24.9 WT 20.5 20.5 22.0 22.0 85 21.25 CON 84.0 80.0 1006.0 94.5 1264.5 316.13 pH 7.31 7.44 7.04 7.53 29.32 7.33 TRANS 0.108 0.097 0.058 0.089 0.352 0.088 TDS 5.45 5.33 5.00 5.67 21.45 5.36 Total 149.868 146.319 1093.298 161.439 Grand mean 21.41 20.90 153.33 23.09
Table 3: Station Variation of Physicochemical Parameter for River Kogin Wudil for March
Parameters Site A Site B Site C Site D Total Mean
DO 7.25 7.00 0.40 5.90 20.55 5.14 AT 27.9 28.0 28.5 29.1 113.5 28.38 WT 23.0 23.0 24.5 24.0 94.5 23.63 CON 90.5 273.5 354.5 131.0 750 187.5 pH 8.06 7.92 7.63 7.67 31.28 7.82 TRANS 0.108 0.097 0.058 0.094 0.357 0.084 TDS 6.11 6.00 6.88 5.71 24.7 6.18 Total 162.928 345.517 422.468 203.474 Mean 23.28 49.36 60.33 29.07
Table 4: Station Variation of Physicochemical Parameter for River Kogin Wudil for April
Parameters Site A Site B Site C Site D Total Mean
DO 7.35 7.00 1.10 2.90 18.25 4.56

AT 30.3 30.9 32.1 34.0 127.3 31.83 WT 26.0 26.2 27.5 27.0 106.7 26.68 CON 80.0 81.0 694.5 230.0 1085.5 271.38 pH 7.76 8.17 8.35 8.34 32.62 8.16 TRANS 0.096 0.098 0.060 0.082 0.336 0.084 TDS 5.00 5.32 6.01 6.32 22.65 5.66 Total 156.506 158.688 769.62 308.642 Mean 22.36 22.67 109.95 44.09
Table 5: Station Variation of Physicochemical Parameter for River Kogin Wudil for May
Parameters Site A Site B Site C Site D Total Mean
DO 6.90 7.15 0.30 3.55 17.9 4.48 AT 31.0 32.5 33.1 35.7 132.3 33.08 WT 27.5 28.0 28.5 29.0 113 28.25 CON 92.0 86.5 2981.0 223.0 3382.5 845.63 pH 6.94 7.22 7.56 7.85 29.57 7.40 TRANS 0.091 0.090 0.057 0.089 0.327 0.082 TDS 4.67 4.90 4.12 4.89 18.58 4.65 Total 169.101 166.36 3054.637 303.079 Mean 24.16 23.77 436.38 43.44
Table 6: Station Variation of Physicochemical Parameter for River Kogin Wudil for June
Parameter Site A Site B Site C Site D Total Mean
DO 7.20 6.45 2.95 4.80 21.4 5.35 AT 30.0 31.9 33.0 35.9 130.8 32.7 WT 26.0 26.0 27.0 28.0 107 26.75 CON 78.0 75.0 194.0 137.0 484 121 pH 6.78 6.61 6.91 6.83 27.13 6.78 TRANS 0.052 0.056 0.040 0.044 0.192 0.048 TDS 4.00 3.87 3.12 4.11 15.1 3.78 Total 152.032 149.886 267.02 216.684 Mean 21.72 21.41 38.15 30.96
Table 7: Comparing the Mean Variation of Parameters According to Months Parameters Jan Feb March April May June DO 7.36 7.73 5.15 4.56 4.48 5.35 AT 24.48 24.9 28.38 31.83 33.08 32.7 WT 19.03 21.25 23.63 26.68 28.25 26.75 CON 429.75 316.13 187.5 271.38 845.63 121 pH 7.34 7.33 7.82 8.16 7.40 6.78 TRANS 0.087 0.088 0.089 0.084 0.082 0.048 TDS 5.28 5.36 6.18 5.66 4.65 3.78 Grand mean 69.43 54.68 32.47 49.77 131.94 28.06

Table 8: Comparing the Mean Variations of Parameters According to Sites Parameters Site A Site B Site C Site D DO 7.6 7.2 3.22 5.05 AT 24.45 28.8 24.68 24.68 WT 23.4 23.6 25.25 24.75 CON 200.58 112.08 1116.75 151.6 pH 7.35 7.47 7.44 6.48 TRANS 0.09 0.091 0.054 0.082 TDS 4.91 5.07 5.45 5.45 Grand mean 38.34 26.33 168.97 31.17 Table 9 Significant Difference in the Mean Variations According to months Source variation Sum of
square Df Mean
square F-cal p-sig Decision
Between group 5339.26 5 1067.85 3.20 .001 Sig Within group 6006.98 18 333.72 Total 11346.24 23
DISCUSSION Table 1 showed the mean variations of the parameters in different river sites in six months. It shows mean oxygen (7.36), air temperature (24.48), water temperature (19.03), conductivity (429.75), hydrogen ion PH (7.34), TRANS (0.087) and total dissolved solids (5.28). Table 2 showed the mean variations of the parameters in different river sites in six months. It shows mean dissolved oxygen (7.73), air temperature (24.9), water temperature (21.25), conductivity (316.13), hydrogen ion PH (7.33), TRANS (0.088) and total dissolved solids (5.36). Table 3 shows the mean variations of the parameters in different river sites in six months. It shows mean oxygen (5.14), air temperature (28.38), water temperature (23.63), conductivity (187.5), hydrogen ion PH (7.82), TRANS (0.084) and total dissolved solids (6.18). Table 4 shows the mean variations of the parameters in different river sites in six months. It shows mean oxygen (5.56), air temperature (31.83), water temperature (26.68), conductivity (271.38), hydrogen ion PH (8.16), TRANS (0.084) and total dissolved solids (5.66). Table 5 shows the mean variations of the parameters in different river sites in six months. It shows mean dissolved oxygen (4.48), air temperature (33.08), water temperature (28.25), conductivity (845.63), hydrogen ion PH (7.40), TRANS (0.082) and total dissolved solids (4.65). Table 6 shows the mean variations of the parameters in different river sites in six months. It shows mean oxygen (5.35), air temperature (32.7), water temperature (26.75), conductivity (121), hydrogen ion pH (6.78), TRANS (0.048) and total dissolved solids (3.78). Table 7 shows the mean variations of the parameters in according to months. It shows mean oxygen (7.73) highest in Feb and lowest (4.56) in May, Air temperature (33.08) highest in May and lowest (24.48) in Jan, water temperature (28.25) highest in May but lowest (19.03) in Jan, conductivity (845.63) highest in May and lowest (121) in June, hydrogen ion pH (8.16) highest in April and lowest (6.78) in June, TRANS (0.089) highest in March and lowest in 0.048 in June, and total dissolved solids (6.18) highest in March but lowest (3.78) in June. The mean pH recorded at all the sites were within the acceptable limit of 6.5-8.5 recommended for drinking water quality. Table 8 shows the mean variations of the parameters in according to rivers sites. It shows mean oxygen (7.6) highest in River A, Air temperature (28.8) highest in River B, water temperature (25.25)

highest in River C, conductivity (1116.75) highest in River C, TRANS (0.091) highest in River B, and total dissolved solids (5.45) highest in River D. Dissolved oxygen recorded from the river, as their means were all above the minimal 5.0mg/L for drinking water quality (FEPA 1991), although it was below the minimal in May. Table 9 shows F-cal as 3.20 and F-tab 2.77 with a p-value of 0.001 which is less than 0.05 level of significance. The hypothesis is therefore rejected thus the alternative is accepted which state that there a significant differences in the mean variations according to months. Conclusion/Recommendations The physio-chemical parameters of River Kogin Wudil was achieved by collecting different water samples from four various sampling sites. From the results analysed, most of the physicochemical parameters assessed were found to be present within the range of the normal values. Thus, the water is recommended for agricultural purposes like aqua cultural activities and cultivation of aquatic vegetables like lettuce, cabbage and carrot.
REFERENCES
Asonye, C. C., Okonlie, N. P., Okenwa, E.E. & Iwuanyanwu, U. G. (2007).Some physic- chemical characteristics and heavy metal profiles of Nigeria rivers streams and waterways. African journal of Biotechnology, 6(5), 617-624.
Castaneda, S. S., Sucgang, R.J., Almoneda, R. V., Mendoza, N. D. S. & David, C.P.C. (2012). Environmental isotopes and major ions for tracing leachate contamination from a municipal landfill in Metro Manila, Philippines‖, Journal of Environmental Radioactivity, 110:30-37.
Chidanand, P., Shreekant, N. & Arjun, V. (2013). ―Assessment of Groundwater Quality Around Solid Waste Landfill Area - A Case Study, International Journal of Innovative Research in Science, Engineering and Technology 2(7):3131-3136.
Chitmanat, C. & Traichaiyaporn, S. (2010).Spatial and Temporal Variation of Physico-chemial Water Quality and Some Heavy Metals in Water, Sediment and Fish of the Mae Kuaug River, Northern Thailand.International Journal of Agriculture and Biology, 12(6): 816-820. ISSN; 1560-8530.
Davies, O. A., Ugwumba, A.A.A. & Abolude, D. S. (2008). Physic-chemistry quality of Trans-Amadi(Wogi) creeks Port Harcourt,Niger Delta, Nigeria. Journal of fisheries International, 3(3), 91-97.
De cabo, L., A. Puig, S. Arreghimi, H. F. Oluguin, R. Seoane, & I. Obertello (2003). Physiochemical variablesand plankton from thr Lower Dekta of the paranaRiver (Agentina) in relation to Flow.HydroloialProcessws 17:1279-1290.
Edegbene, A. O. & Arimoro, F. O. (2012).Ecological Status of Owan River, Southern Nigeria using Aquatic Insects as Bioindicators. Journal of Aquatic Sciences, 27(2), 99-111.
Gunjan B., Swamee, P. K, Arvind, K. & Ajay, B. (2012). ―Assessment of groundwater quality near municipal solid waste landfill by an Aggregate Index Method‖, International Journal of Environmental Sciences 2(2):1492- 1503.

Ojutiku, R. O. & Kolo, R. J. (2011).Temporal and spatial variations in some physico-chemical parameters of River chanchaga, Niger State, Nigeria. Journal of Applied Bioscience, 47, 3242-3255.
Sarala, C. & Ravi B. P. (2012). ―Assessment of Groundwater Quality Parameters in and around Jawaharnagar, Hyderabad, International Journal of Scientific and Research Publications, 2(10):1- 6.
Wakama, R. J. Uzairu, A., Kagbu J. A. & Balarabe, M. L. (2008). Impact assessment elluent discharge on physicochemical parameters and some heavy metals concentrations in surface water of River Challawa, Kano, Nigeria. African Journal of Pure and Applied Chemistry, 2(10), 100-106.

RE-ASSESSING PUBLIC PERCEPTION OF MASS MEDIA BREAST CANCER AWARENESS CAMPAIGN IN NIGERIA
*Ugwulor Chinyere; *Ukamaka Akata and **Amadi Okechukwu *Department of Mass Communication,University of Nigeria, Nsukka
**Department of Mass Communication, Port Harcourt Polytechnic, Rumuola-Nigeria
Abstract
Over the years, government and other public agencies engage in various media campaigns geared at educating, protecting and improving public health in the society. This paper reassessed public perception of mass media breast cancer awareness campaign in Nigeria. It was anchored on the model known as Health belief model. The population of the study was drawn from six state capitals in Nigeria using survey method. From the state capitals, a sample size of 252 respondents was selected. Questionnaire served as the instrument for data collection. From the data collected and analyzed, it was revealed that the mass media have changed women’s attitude and behaviour towards breast cancer, due to the persuasive nature of its message. It was also revealed that the mass media encourages women to take preventive measure on breast cancer. The study however, recommended that to achieve better result in the campaign on breast cancer, the concentration of mass media campaign messages on modern media alone should be discouraged; rather a balanced dissemination of breast cancer messages at the grassroots level using community based organizations should be encouraged. Key words: Perception, mass media, breast cancer and campaign
INTRODUCTION
Over the years, government and other public agencies engage in various media campaigns geared at educating, protecting and improving public health in the society. Such campaigns, due to a variety of factors, often record success or otherwise.Quality health care delivery has become an issue of priority to nations across the globe. According to Gottlieb (2001) to tackle health problems, concerned governments and organizations the world over, have often resolved to the use of media campaigns to reach out to the populace, with the aim of educating, informing and influencing them into carrying out desired healthy practices. This demonstrates the power of the media. In recent times, campaigns are carried out through several channels of communication such as traditional channels and the mass mediated channels. Abone (2008) describes the mass as the key component of the global strategy for sustainable health development through adequate information and education on various health issues. The role played by the mass media is also a vital one such that without the media, it would be absolutely impossible for health promoters and stakeholders to disseminate information as well as monitor, coordinate and evaluate campaigns on health issues. Across the globe, breast cancer has long been recognized as a major public health burden. Despite all efforts by government, World Health Organization, Community Based Organizations (CBOs), churches and individuals, barriers to breast care persist. Many women do not have access to the information and screening necessary to prolong survival, as evidenced by the high mortality incidence ratio in the world (Gottlieb, 2001). They lack the basic knowledge of breast cancer prevention.

The power of media to disseminate health news (or other matters) has, in effect, reduced the world‘s size (global village). The value of health news is related to what gets reported and how it gets reported. According to Moynihan (2000: 1645):
The news media are an important source of information about health and medical therapies, and there is widespread interest in the quality of reporting. Previous studies have identified inaccurate coverage of published scientific papers, overstatement of adverse effects or risks, and evidence of sensationalism. The media can also have a positive public health role, as they did in communicating simple warning about the connection between Reye‘s syndrome and the use of aspirin in children.
Despite the potential of news media to perform valuable health education functions, Moynihan conclude that media stories about medications continue to be incomplete in their coverage of benefits, risks, and costs of drugs, as well as in reporting financial ties between clinical trial investigators and pharmaceutical manufactures. Supporting the above, Coulson (2008:112) writes thus:
The mass media are capable of facilitating short-term, intermediate-term, and long –term effects on audiences. Short- term objectives include exposing audience to health concepts, creating awareness and knowledge; altering outdated or incorrect knowledge; and enhancing audience recall of particular advertisements or Public Service Announcements (PSAs) ,promotions, or program names. Intermediate-term objectives include all of the above, as wells changes in attitudes, behaviours, and perception of social norms. Long-term objectives incorporate all of the aforementioned tasks, in addition to focused restructuring of perceived social norms, and maintenance of behaviours change. Evidence of achieving these three tiers of objectives is useful in evaluating the effectiveness of mass media.
In Nigeria for instance, public health campaign messages are carried out using various channel of communication. Mustapha (2008:14) noted that issues on public health have become regular features in the messages of Nigeria media. Hardly does a day pass by without at least one form of public health message or the other either on TV or radio broadcasts or on the pages of the newspapers/magazines, or through community mobilization, posters, handbills, stickers, and among others. Agencies such as the Federal and States Ministries of Health, National Agency for Food and Drug Administration and Control (NAFDAC), National Agency for the Control of AIDS, etc do carry out breast cancer awareness campaigns from time to time.
Therefore, the basic tenet of this paper reassessed public perception of mass media breast cancer awareness campaign with special focus on Nigeria.
Statement of Problem Over the years, studies have shown that governments and organizations have invested so
much on health related programmes like the National Malaria Control Programme, Society for Family Health, Global Fund to Fight AIDS, TB Malaria, etc. In spite of their efforts to reduce health problems, there is an increasing dissatisfaction and criticism of these programmes for having no

effect on the targeted populace. That was why majority of such programme efforts has produced slight behavioural change (achieve fair success) or a complete waste of time and resources all together.
Similar effort has been expounded in creating awareness about breast cancer in recent years by government and other concerned bodies. Whether the campaign is achieving its desired objective is still in doubt. Hence, this study is geared towards examining the public perception of mass media breast cancer awareness campaign in Nigeria. Objectives of Study
1) Find out whether the people are aware of media campaigns on breast cancer. 2) Find out the perception of the people on media campaigns on breast cancer in the country 3) Ascertain whether media campaigns on breast cancer have any significant influence on the
people 4) To examine the level of influence of breast cancer media campaign on people
Research Questions 1. Are Nigerians aware of mass media breast cancer awareness campaigns? 2. What perception do people have on breast cancer campaign in Nigeria? 3. Through which medium do people get information on breast cancer? 4. What level of influence do media campaigns on breast cancer have on the people? Literature Review In Nigeria, the number of women at risk of breast cancer increased steadily from approximately 24.5 million in 1990 to approximately 40 million in 2010 and is projected to rise to over 50 million by 2020 (Adebamowo and Adekunle: 1999). Today, societies depend on mass media to deliver health information. Marshall McLuhan calls media "extensions of man." Kreps and Thornton (1992) believe media extend "people's ability to communicate, to speak to others far away, to hear messages, and to see images that would be unavailable without media" (Globalization). The employment of mass media to disseminate health news (or other matters) has, in effect, reduced the world's size. The value of health news is related to what gets reported and how it gets reported. According to Moynihan., Bero, Ross-Degnan, et al. (1999):
The news media are an important source of information about health and medical therapies, and there is widespread interest in the quality of reporting. Previous studies have identified inaccurate coverage of published scientific papers, overstatement of adverse effects or risks, and evidence of sensationalism. The media can also have a positive public health role, as they did in communicating simple warnings about the connection between Reye's syndrome and the use of aspirin in children).
Despite the potential of news media to perform valuable health-education functions, Moynihan et al. (1999) conclude that media stories about medications continue to be incomplete in their coverage of benefits, risks, and costs of drugs, as well as in reporting financial ties between clinical trial investigators and pharmaceutical manufacturers. To avoid this, U.S. Department of Health and Human Services publication (1989) advises that health-message designers to consider a series of questions relative to choice of channels:
Which channels are most appropriate for the health problem/issue and message?
Which channels are most likely to be credible to and accessible by the target audience? Which channels fit the program purpose (e.g., inform, influence attitudes, change behavior)? Which and how many channels are feasible, considering your time and budget?
This shows that is not how the message is package that makes it effective but the channels in which it disseminated. Most campaigns have failed not as a result of poor planning or budget, but as a result of using inappropriate channel in message delivery. In most societies (third world countries) modernization has really affected the efficacy of media campaign messages. They depend on modern media alone forgetting that medium usage in most areas is part of their culture. That is why it is advisable to combine both the modern and traditional means (i.e intermix media) to make sure that the essence of carrying out a particular health campaign is achieve to the later. Theoretical framework Health Belief Model Health belief model was propounded by Rosenstock (1966). This model tries to explain beliefs that should be targeted in communication campaigns to cause positive health behaviours. The model specifies that if individuals perceive a negative health outcome to be severe, perceive themselves to be susceptible to it, perceive the benefits to behaviors that reduce the likelihood of that outcome to be high, and perceive the barriers to adopting those behaviors to be low, then the behavior is likely for those individuals to change. The HBM specifies that individuals' perceptions of four variables can predict their behaviour. First, the model argues that people will be more motivated to act in healthy ways if they believe they are susceptible to a particular negative health outcome. The model states that people will not act to prevent a negative health outcome that is unlikely to afflict them. For example, women are unlikely to get a mammogram if they believe they are unlikely to develop breast cancer (Hyman, Baker, Ephraim, Moadel, & Philip, 1994) Second, the model stated that the stronger people's perception of the severity of the negative health outcome, the more they will be motivated to act to avoid that outcome (Rosenstock, 1966). The model includes a cue to action whereby the individual is spurred to adopt the preventative behaviour by some additional element. In Rosenstock's original formulation, signals to action could include external prompt like a mass media campaign or internal cues like a negative change in bodily state. This model is relevant to this study in the sense that the level of awareness campaigns created by the media on breast cancer can go long way in changing women attitude, belief and perception about breast cancer. It will help spur them to prevent negative health outcome that lead to breast cancer. Methodology The research design for this study was survey method. This is because survey method allows the researcher to measure public opinions, attitude and perception, which are dominant among a large population at a particular period (Okoro, 2001). Survey method is appropriate to this study because the work itself focuses on opinion, attitudes and views of people towards awareness creation by the media on breast cancer in Nigeria. The population of this study is women in the country. The figure of women as provided by the National Population Commission in Nigeria as at November 2011 was 91500000.To calculate the sample size of this study, the Australian calculator was used. The calculator as provided by the National Statistical Service. The sample size of this study was 258 respondents. In this study, the cluster sampling technique was used. Nigeria was sub-divided into the six existing geopolitical zones. From each of the political zones, one state each was selected to represent the zones. In all, this gave a total of six states. The choice of these states was as a result of their strategic
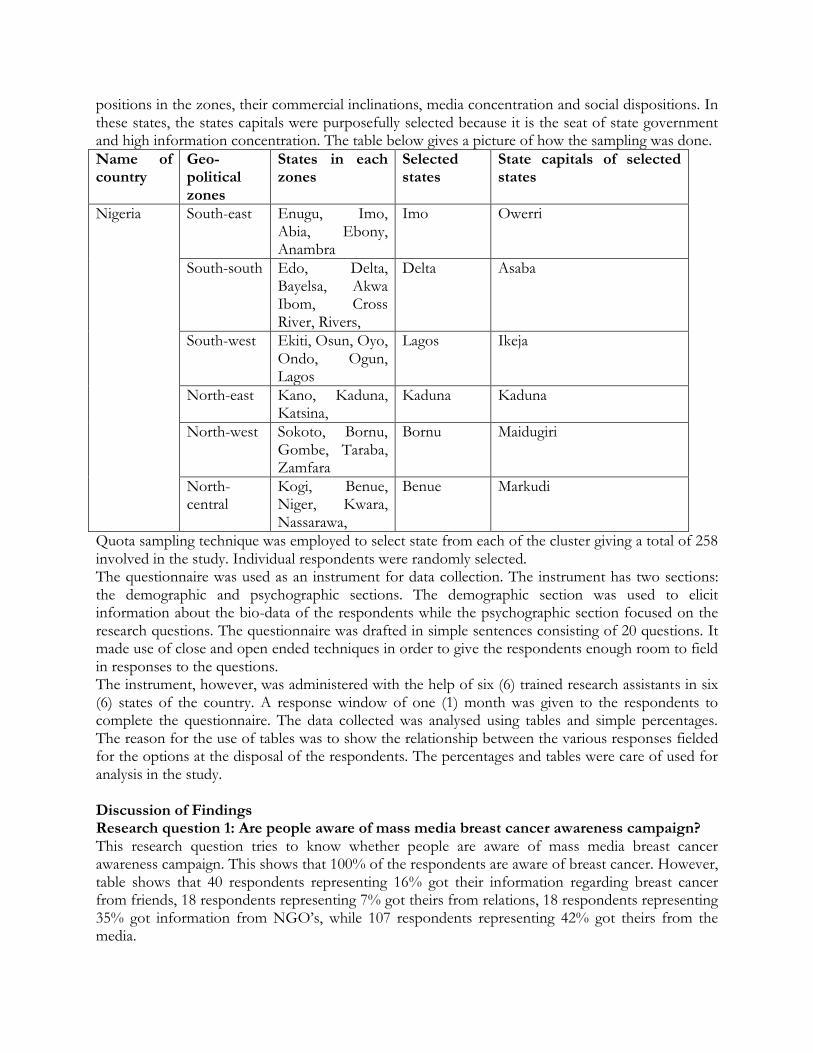
positions in the zones, their commercial inclinations, media concentration and social dispositions. In these states, the states capitals were purposefully selected because it is the seat of state government and high information concentration. The table below gives a picture of how the sampling was done.
Name of country
Geo-political zones
States in each zones
Selected states
State capitals of selected states
Nigeria South-east Enugu, Imo, Abia, Ebony, Anambra
Imo Owerri
South-south Edo, Delta, Bayelsa, Akwa Ibom, Cross River, Rivers,
Delta Asaba
South-west Ekiti, Osun, Oyo, Ondo, Ogun, Lagos
Lagos Ikeja
North-east Kano, Kaduna, Katsina,
Kaduna Kaduna
North-west Sokoto, Bornu, Gombe, Taraba, Zamfara
Bornu Maidugiri
North-central
Kogi, Benue, Niger, Kwara, Nassarawa,
Benue Markudi
Quota sampling technique was employed to select state from each of the cluster giving a total of 258 involved in the study. Individual respondents were randomly selected. The questionnaire was used as an instrument for data collection. The instrument has two sections: the demographic and psychographic sections. The demographic section was used to elicit information about the bio-data of the respondents while the psychographic section focused on the research questions. The questionnaire was drafted in simple sentences consisting of 20 questions. It made use of close and open ended techniques in order to give the respondents enough room to field in responses to the questions. The instrument, however, was administered with the help of six (6) trained research assistants in six (6) states of the country. A response window of one (1) month was given to the respondents to complete the questionnaire. The data collected was analysed using tables and simple percentages. The reason for the use of tables was to show the relationship between the various responses fielded for the options at the disposal of the respondents. The percentages and tables were care of used for analysis in the study. Discussion of Findings Research question 1: Are people aware of mass media breast cancer awareness campaign? This research question tries to know whether people are aware of mass media breast cancer awareness campaign. This shows that 100% of the respondents are aware of breast cancer. However, table shows that 40 respondents representing 16% got their information regarding breast cancer from friends, 18 respondents representing 7% got theirs from relations, 18 respondents representing 35% got information from NGO‘s, while 107 respondents representing 42% got theirs from the media.

It also revealed that 252 of the respondents representing 100% agreed that the media is good in creating breast cancer awareness. Table 6 on the other hand, shows that 10 respondents representing 4% agreed that the media is effective in creating breast cancer awareness in Abuja urban, 106 respondents representing 42% said rated the media as good, 76 respondents representing 30% said average, 40 respondents representing 16% said below average, while 20 respondents representing 8% said is poor in creating breast cancer awareness in Abuja urban. Furthermore, 27 of the respondents representing 11% said that the media present programmes on breast cancer very often, 100 representing 37% said often, 103 respondents representing 41% said not often while 27 respondents representing 11% were indifferent. Research question 2. What perception do people have on media breast cancer campaign? This question tries to know how people perceive media breast cancer campaign. The study shows that 40 of the respondents representing 16% said that the media do not involve the people in their campaign, 90 of the respondents representing 36% said negligence of the grass root, 92 representing 37% indicated lack of accurate report, while 30 of the respondents representing 11% said all of the above. 45 of the respondents representing 18% are very impressed with the performance of the media campaign on breast cancer. 85 respondents representing 34% are impressed, 122 representing 48% are not impressed with the performances of the media campaign on breast cancer so far. While 106 of the respondents representing 42% agreed that media campaign on breast cancer is informative in arresting attention, 50 of the respondents representing 20% said it is educative, 64 of the respondent representing 25% said it is entertaining while 32 representing 13% agreed that it is all of the above. Research question 3. Through which medium do people get information on breast cancer? This research question tries to know which particular medium people get information on breast cancer. This study shows that 6% of the respondents said that newspaper frequently carry breast cancer messages; 2% said magazine; 4% said billboard; 26% said television; 55% said radio, while 7% indicated others. Also 14 respondents representing 5% like seeing media campaign message on breast cancer in newspaper, 12 respondent representing 4% said magazine, 124 respondents representing 49% said television, while 106 respondents representing 42% said others. On the other hand, 5% of the respondents said newspaper is more effective on breast cancer campaign; 3% said magazine; 6% indicated billboard; 24% said television; 48% indicated radio, while 14% said others, while 54 of the respondents representing 22% said that they very often listen, view or read breast cancer message on their choice of medium. 100 representing 37% said often, while 103 respondents representing 41% said not often. Research question 4. What level of influence do media campaigns on breast cancer have on the people? This research question tries to know the level of influence media campaigns on breast cancer have on the people. It was revealed that 227 respondents representing 90% are motivated by the media to go for breast cancer screening while 25 of the respondents representing 10% are not motivated by the media. Also 222 of the respondents representing 88% agreed that the media has changed people‘s attitude and behaviour towards breast cancer, 10 of the respondents representing 4% disagreed, while 20 of the respondent representing 8% are not aware. The media encourage people to take preventive measure on breast cancer .This was established by 252 respondents representing 100%, while 101 of the respondent representing 40% agreed that media messages are very persuasive in encouraging people to take preventive measures, while 142 of the respondents representing 60% said slightly persuasive.

Summary and Conclusion The main thrust of this study was to find public perception of mass media breast cancer awareness campaign in Nigeria. In doing this, six states in Nigeria were used as a study. Using four research questions that bordered on public perception of mass media breast cancer awareness campaign in Nigeria, looking at the level of awareness, people‘s perception, medium of information and the level of influence mass media breast cancer awareness campaign has on the people. It was revealed that the media has created awareness on breast cancer to an extent, but there are areas that the media need to address to achieve desired results in their campaign on breast cancer. The mass media have really changed women‘s perception, attitude and behaviour towards breast cancer. The level of mass media awareness campaigns encouraged women to take preventive measures. There are areas the media need to address to achieve desired results on breast cancer. These areas includes; involving traditional media in their campaigns strategy, thereby reaching women at the grassroots and avoid centralizing media awareness campaigns at the urban areas. Recommendations
The following recommendations were made in the light of the major findings. .Media messages on breast cancer should be simple, straightforward, and realistic, but should be articulated on a similar emotional level as the diagnosis or health problem is being understood and digested by women. .Much work needs to be done in order to better understand breast cancer and effective strategies or measures of preventing it. . The concentration of media campaign messages on modern media alone should be discouraged. There is need to combine traditional and modern media in carrying out media campaign on breast cancer. . Media campaign messages should not be centralized at the centre alone. There should be balance dissemination of breast cancer message at grass root level and the centre for desired result. . The availability and richness of a medium should be considered on any media campaign programme. . Government, Non-governmental Organizations and individuals are expected to support media campaign on breast cancer for an effective result of the campaign.
References Abone, C. (2008). Mass media: Effective instrument for promoting health programmes in Africa. In Nwosu, I.E, Soola, O.E & Nwodu, L.C (Eds), Communication for health and sustainable development in Nigeria. (pp 174-180). Enugu: Rhysc Kerex Publishers. Adebamowo, C. &, Adekunle, O. (1999). Case-controlled study of the epidemiological risk factors for breast cancer in Nigeria. Br J Surg, 86:665-668. Coulson, N. (2008). Development in the use of mass media at the national level for HIV/AIDS prevention in South Africa. From http://www.comminit.com/pdf/HIV/AIDS_South_Africa_campaings_report.pdf

Farmer P. & Frenk J. (2010). Expansion of cancer care and control in countries of low and middle income: a call to action. Lancet 376:1186-1193. Gottlieb, N. (2001). The age of breast cancer awareness. What is the effect of mass media coverage? Journal of the National Cancer Institute. 93, 1520-1522. Hyman, R. B., Baker, S., Ephraim, R., Moadel, A., & Philip, J. (1994). Health belief model variables as predictors of screening mammography utilization. Journal of Behavioral Medicine, 17, 391–406. Kreps, G. L., and Thornton, B. C. (1992). Health communication theory & practice. prospect heights, IL: Waveland Press. Moynihan, R. (2000). Coverage by the news media of the benefits and harms of medications. Journal of General Internal Medicine. 342,1645-1650 Moynihan, R.; Bero, L.; Ross-Degnan, D.; Henry, D.; Lee, K.; Watkins, J.; Mah, C.; and Soumerai, S. B.(1999). Coverage by the news media of the benefits and risks of medications. New England Journal of Medicine 342:1645â1650. Mustapha, L.K. (2008). Mass media and optimization of health policy: the participatory option. In Akinfeleye, R.A (Ed) Mass media and society: A multi perspective Approach. (pp 190-209) Lagos: Department of Mass Communication, University of Lagos. Okoro, N. (2001). Mass communication research: Issues and methodologies. Enugu: A P Express Publication. Rosenstock, I. M. (1966). Why people use health services. Milbank Memorial Fund Quarterly, 44, 94–127. U.S. Department of Health and Human Services (1989). Making health communication programs work: A Planner's Guide. Bethesda, MD: National Cancer Institute.
EVALUATION OF GROUNDWATER QUALITY FOR IRRIGATION IN NATIONAL CEREALS RESEARCH INSTITUTE BIDA NIGER STATE NIGERIA
Ahmed A. O*, Umar A., Aliyu B.U, Usman N., Shuaibu A.
Department of Water Resources and Environmental Engineering, Ahmadu Bello University, Zaria.
Abstract The importance of the quality of ground water intended to be used for irrigation purposes cannot be over emphasized hence the need to undertake the study. The study evaluated the ground water quality for irrigation in National Cereals Research Institute, Bida , Niger State.Groundwater samples from five different boreholes used for irrigation in National Cereals Research Institute, Bida in Niger State were collected and evaluated to ascertain the suitability of the groundwater for irrigation. From the available reviewed literatures, all the ionic concentration values of the analysed samples were within the tolerance level and obtained values were used to determine water quality indices such as Sodium Adsorption Ratio (SAR), Residual Sodium Carbonate (RSC), Magnesium Hazard (MH) and Permeability Index (PI).The Sodium Adsorption Ratio (SAR) ranges from 0.56 - 1.86 which indicates low risk of sodium build up in the soils. All other four water quality indices determined were also within the recommended range. In general, the groundwater status of the five sampled boreholes is suitable for irrigation. Key words: Water quality, total dissolved solid, sodium adsorption ratio, permeability index, irrigation. 1.1 Introduction Ground water is a valuable natural resource, it occurs almost in all geological formations under the earth surface not in a single widespread aquifer but in thousands of local aquifer sSingh,2015). This resource is commonly explored through shallow - wells and boreholes for various purposes, it may be explored for domestic, agricultural or industrial purposes. However, the groundwater is majorly use in the study area for agricultural purpose (Irrigation) to help in addressing the challenges posed by the tremendous increase in demand for freshwater due to population growth and climate change. Irrigation is the artificial application of water to land or soil for the purpose of growing crops. It helps to augment the water requirement of crops during periods of inadequate rainfalls. Major sources of irrigation water includes surface water sources such as river, lake, sea, dam, reservoir e.t.c and groundwater sources such as Boreholes and shallow wells. Irrigation is the most important water use sector accounting for 70%of the global fresh water withdrawals and 90% of consumptive water uses. (Morris et.al, 2003). For many important agricultural production areas, groundwater will remain the ultimate source of freshwater when surface water sources have been depleted. The aquifers that host groundwater are primary buffers against drought for both human requirement and crop production. To complement this requirement, the quality of groundwater used for irrigation has to be determined and assessed time to time in term of its suitability for irrigation. The suitability of groundwater for irrigation is contingent on the effects of the mineral constituents of the water on the plants and the soils. According to Todd (1980), poor quality irrigation water (high salt concentration) may affect plant growth physically by limiting the uptake of water through modification of osmotic processes. Effect of salts on soils could result in alterations in soil structure, permeability and aerations, which indirectly affect plant growth. Problems of groundwater quality degradation are much more difficult to overcome as it often requires long period to detect the true

extent of degradation. Groundwater chemistry also has a potential use for tracing the origins and the history of water as well as its compositional charges through reactions with the environment. The chemical parameters such as Ca2+ , Mg2+, Na+, K+, HCO3
- , CO3-, SO4
2- Play a significant role in classifying and assessing water quality for irrigation. The quality of irrigation water is of particular importance especially in the arid zone where extremely high temperature and low relative humidity result in high rates of evaporation, with consequent deposition of salt which tends to accumulate in the soil profile. Water quality criteria can be defined as the concentration of narrative statement recommended to support and maintain a designated water use. Water quality criteria are developed by scientist and provide basic scientific information about the effects of water pollutants on a specific use. They also describe water quality requirements for protecting and maintaining individual use. Irrigation water quality criteria can therefore set a maximum level for the concentration of a substance in the water which will not be harmful when the water is used continuously for irrigation purpose. All groundwater contains dissolved minerals. The amount and kind of minerals vary from one location to another and may vary with time. The main water quality problems associated with irrigation are salinization, nutrients and pesticide pollution. Salinization is commonly cited as the most widespread groundwater quality problem and economics impacts (Morris et.al, 2003). When irrigation water is applied, the mineral salts are left in the soil after the crop has used the water. Most of the mineral salts are beneficial to crop growth and soil condition, but in some cases they may be harmful. 1.2 SOME BASIC CRITERIA FOR EVALUATING IRRIGATION WATER QUALITY 1.2.1 SODIUM ADSORPTION RATIO (SAR) This simply defines the relative proportion of sodium cation (Na+) to other cations of (Ca++) and (Mg++). It gives an indication of the level to which irrigation water undergoes cation exchange reaction in soil. Continued use of water with a high SAR value leads to a breakdown in the physical structure of the soil caused by excessive amount of colloidally absorbed sodium. This breakdown results in the dispersion of soil clay that causes the soil to become hard and compact when dry and increasingly impervious to water penetration due to dispersion and swelling when wet. SAR proposed by the Richards (1954) and defined as:
SAR =
√
1.2.2 RESIDUAL SODIUM CARBONATE (RSC) The excess sum of carbonate and bicarbonate in groundwater over the sum of calcium and magnesium influences the suitability of ground water for irrigation. When the excess carbonate concentration becomes too high, the carbonate combines with calcium and magnesium to form solid minerals which settles out of the water. The relative abundance of sodium with respect to alkaline earths and the quantity of bicarbonate and carbonate in excess of alkaline earth also influence the suitability of water for irrigation. RSC is an important parameter to evaluate the suitability of irrigation water, calculated according to Gupta (1987) employing the following equation;
RSC =
-

1.2.3 PERMEABILITY INDEX (PI) Soil permeability is affected by long time use of irrigation water with high salt content as influenced by Na+, Ca2+, Mg2+, and HCO3
- content of the soil. PI was calculated according to Doneen (1964) employing the following equation;
PI =
1.2.4 MAGNESIUM HAZARD (MH) Magnesium hazard is used for ascertaining factors on which the chemical characteristics of water depends. MH which was proposed by Raghunath (1987) was calculated using the following equation;
MH =
1.3 Method A total of fifteen samples were collected from five different boreholes within the study area for analysis. The water samples were coded as follows; 1. BH-NW1 - BH-NW3 (three samples from borehole at NEWEST project site) 2. BH-BB1 – BH-BB3 (three samples from borehole at breeding block) 3. BH-FF1 – BH-FF3 (three samples from borehole at Fadama field) 4. BH-GCP1 – BH-GCP3 (three samples of borehole at generation challenge project) 5.BH-CF1 – BH-CF3 (three samples of borehole at central field) Clean one liter volume plastic container was used for sampling. The samples were analysed for cations (Ca2+,Mg2+,Na+,and K+) and anions (Cl-,CO3
2-,HCO3,PO4) using standard laboratory procedures (APHA,2005) important criteria of water quality for irrigation were derived using guidelines by Ayers and Westcott 1985 parameter such as sodium adsorption ratio (SAR), residual sodium carbonate (RSC), magnesium hazard (MH), permeability index (PI) were used to access the suitability of water for irrigation purposes. DETERMINATION OF SODIUM, CALCIUM, MAGNESIUM, POTASSIUM USING FLAME PHOTOMETER (FP902 PG INSTRUMENT) APPARATUS: wash bottle, one 500-ml volumetric flask, graduated pipettes, five 100-ml volumetric flask and ten small plastic containers. PROCEDURE
1. The instrument was turned on and the flame lit for 15 minutes (aspirating deionised water) to ensure stability.
2. All the equipment used was thoroughly rinsed, first with distilled water then with deionized water.
3. The tall 25-ml capped polyethylene vials were filled with the blank (deionized water), the standards (20, 40, 60, 80, and 100 ppm of K, Na, Ca, Mg) and the samples in that order.
4. The instrument was calibrated using the five standards by aspirating deionized water until the meter reading stabilizes to 0.00, then the highest standard (100 ppm) was aspirated until the meter reading stabilized.
5. The two step calibration procedure with deionized water and the 5 ppm standards were repeated.

6. The blank, the 5 standards and the samples were aspirated in that order and the readings of each solution were recorded once the meter reading stabilized.
1.4 Results Table 1.1 shows the respective mean values of K+, Na+, Ca2+, Mg2+, SO4
2-, CL-, HCO3 and CO3 (meqL-1) corresponding to boreholes, BH-NW, BH-BB, BH-FF, BH-CGP and BH-CF respectively. TABLE 1.1 MEAN VALUES OF THE IONIC CONCENTRATIONS
SAMPLE CODE
Na+ K+ Ca2+ Mg2+ HCO3- CO3
2- SO42- Cl-
BH-NW 1.9 2.7 4.4 0.9 1.20 0.00 0.02 0.52
BH-BB 2.5 3.9 2.4 1.3 1.48 0.00 0.04 0.85
BH-FF 1.7 2.7 3.1 2.3 1.62 0.00 0.04 0.70
BH-GCP 3.4 4.1 4.2 3.6 1.96 0.00 0.16 1.53
BH-CF 1.2 3.5 5.3 3.9 1.71 0.00 0.04 1.39
TABLE 1.2: WATER QUALITY INDICES OF GROUNDWATER OF THE STUDY AREA:
SAMPLE CODE SAR RSC PI MH
BH-NW1 1.12 -4.01 42.71 15.38
BH-NW2 1.17 -4.10 43.06 16.98
BH-NW3 1.16 -4.18 42.74 18.52
BH-BB1 1.03 -4.00 43.66 41.82
BH-BB2 1.09 -4.05 44.52 41.82
BH-BB3 0.65 -3.60 47.83 44.23
BH-FF1 1.79 -2.00 66.67 33.33
BH-FF2 1.74 -2.18 64.84 36.84
BH-FF3 1.86 -2.28 64.92 35.89
BH-GCP1 1.67 -5.60 47.66 45.33
BH-GCP2 1.77 -5.83 48.41 46.15
BH-GCP3 1.73 -6.20 47.01 46.34
BH-CF1 0.61 -7.40 28.85 40.66
BH-CF2 0.56 -7.40 28.16 42.86
BH-CF3 0.56 -7.58 27.81 44.09
1.5 Discussion
1.5.1 IONIC CONCENTRATION The concentration of cations and anions in the groundwater mostly depends on the types of the underlying rocks and soil and water management practices. The mean value of sodium (Na+) obtained from analysis of samples varied between 1.2 meqL-1to 3.4 meqL-1 and that of potassium (K+) varied from 2.7 meqL-1 to 4.1 meqL-1 as shown in table 1.1 The safe range of Na+ is 0 – 40 meqL-1 thus, the water samples from the study area is 100 percent within the safe range. Calcium (Ca2+) in groundwater usually have its source from underlying sedimentary rocks such as calcite, gypsum, e.t.c. The Ca2+ varied from 2.4 meqL-1 to 5.3 meqL-1 and magnesium (Mg2+) varied
from 0.9 meqL-1 to 3.9 meqL-1 as shown in table 4.3. The usual safe range of Ca2+ and Mg2+ in irrigation water is 0 to 20 and 0 to 5 meqL-1 respectively. Therefore, the water samples from the study area is within safe range. Water with high Ca2+ and Mg2+ results in alkalinity of water and induces osmotic stress to the plants. Cl- varied from 0.52 meqL-1 to 1.53 meqL-1, this results classified the groundwater sample of the study area as good according to FAO standards (Ayers and Westcot, 1985). Thus, the water samples are free from CL- toxicity and are suitable for irrigation. HCO3
- varied from 1.20 meqL-1 to 1.96 meqL-1 and SO42- varied from 0.02 meqL-1 to 0.16 meqL-1.
Available literature suggest that irrigation water within this range of mean values are considered suitable for irrigation. 1.5.2 WATER QUALITY INDICES Sodium adsorption ratio (SAR) indicates relative proportion of sodium to calcium and magnesium, SAR influences physical properties of soil especially hydraulic conductivity. Result of the analysed samples indicate that groundwater from the study area have SAR values ranging from 0.56 to 1.86 as shown in table 1.2 This generally classified the samples as S1 according to Ayers and Westcot, (1985). The Residual sodium carbonate (RSC) index of the analysed samples varied from -7.58 meqL-1 to -2.00 meqL-1. This indicates that the groundwater samples have low concentration of HCO3
-& CO32-. Water with high concentration of HCO3
- and CO3-influences its suitability for
irrigation purpose as it will increase the pH in soil. (Sadashvaiahet.al 2008). The permeability index (PI) results of the analyzed water samples varied from 27.81% - 66.67%. the classification of water for irrigation as suggested by Doneen and USSL diagram (MusahSalifuet.al, 2015), indicates that the water samples from the study area is classified as CLASS II, PI of 25% –75%. From the result of the analyzed sample magnesium hazard (MH) varied from 15.38% - 46.34% which falls within the safe range (<50%), Gupta and Gupta (1987) suggest that high magnesium hazard value (>50%)has an adverse effect on the crop yield as the soil become more alkaline. MH result from this study shows that all the samples are well below 50% and as such suitable for irrigation. 1.6 CONCLUSION The groundwater quality analysis of the study area revealed that the SAR varies between 0.56 to 1.86 which indicates that the land irrigated using the water will witness little or no potentials of hazardous sodium build up overtime. On the other hand, results of residual sodium carbonate, permeability index and magnesium hazard showed that samples are safe for irrigation. RECOMMENDATIONS
There is need for periodic groundwater quality analysis and monitoring to sustained this present safe status of the groundwater.
A short and long term management action plan should be encourage for the efficient use of groundwater resources taking into account agricultural activities

REFERENCES
APHA (1992), Standard Methods for the Examination of Water and Waste Water, American Public Health Association 18th edition, Washington DC.
Ayer R.S and Westcot D.W (1985), Water Quality for Agriculture, FOA Irrigation and Rev. L FOA, Rome pp 97.
Doneen L.D (1964) Notes on water quality in Agriculture, Published as a Water Science and Engineering Paper 4001, Department of Water Science and Engineering, University of California.
FAO (1988), Irrigation Practice and Water Management L.D. Doneen and D.W Westcot Irrigation and Drainage paper 1, Rev 1. FAO, Rome pp 71.
Gupta S.K and I.C Gupta, (1987) Management of Salme Soils and Water.Oxford and IBH Publication Coy, New Delhi, India pp 399.
MusahSalifu, Flin A. Micheal S.H., Dickson A. Enoch A. (2015). Evaluating the suitatibility of ground water for irrigation purposes in some selected districts of upper west region of Ghana.
Article published with open Access at Springerlink.com Morris, Lawrence, Chitton, Adamu, Calow R.C and Wink (2003).Groundwater and its Susceptibility to Degradation; A Global Assessment Report of the problem and Options for Management. Early
Warning and Assessment report Series, RS 03-3. United Nations Environment Programme.Nairobi Kenya.
Raghunath I.M (1987) Groundwater Second Edition Wiley Eastern Limited, New Delhi, India pp 344-369
Sadashivaiah C. (2008) Hydro chemical analysis and Evaluation of Groundwater Quality in TumkurTalule, Karnataka State, India. Int. J. Eviron rev. Public health 5(3): 158-169
Singh S., (2015). Evaluation of Groundwater Quality and its Suitability for domestic andIrrigation use in parts of the Chandaul; Varanas Region, Uttar Pradish, India.Journal of Water
Resources and protection, 2015 pp 572-287, published by Scientific Research Publishing Inc. Todd D.K (1980). Groundwater Hydrogeology, John Wiley and Sons Inc. New York.

INVESTIGATING THE IMPACT OF AMBIENT TEMPERATURE ON THE POWER OUTPUT PERFORMANCE OF SOLAR CELL
Tolufase E ; Bello O and Chidalu M Department of Physics, Faculty of Science, Nigeria Police Academy, Wudil, Kano.
ABSTRACT
The Search for alternative energy sources cannot be avoided due to the fact that fossil fuels which constitute the major energy sources are depleting at a faster rate and the same time causing ecological and environmental pollutions. Solar energy, particularly Photovoltaic (PV) is an alternative source with strong potential that can guarantee energy security and environmental sustainability. The research investigated the impact of temperature on the power output performance parameters of the solar cell: Short-circuit current (Isc), Open-circuit voltage (Voc), Fill factor (FF), Efficiency (η) and power output (Pmax). A 20 watt rated Solar Module was used for the study. A low resistance ammeter was connected in series while a high resistance voltmeter was connected in parallel to 5.7Ω variable resistor used as the load. The output current and voltage were recorded while output power, efficiency and fill factor were computed from the recorded values. The investigation was carried out in Wudil, Kano with temperature range of 290C – 450C. The results obtained indicate that the ambient temperature has a drastic effect on the open-circuit voltage (Vvo). The open circuit voltage (Voc) decreases from 20.80V to 16.00V as the temperature increases from 290C – 450C. Whereas, the Short-circuit current(Isc) increases from 0.75A to 0.90A as the temperature increases from 29.00C – 45.00C. Maximum efficiencies ( ) of 1.44%, 1.29%, and 1.16% were achieved at a temperature of 29.00C, 340C and 380C respectively. However, at a temperature of 450C the efficiency dropped to 1.03%. The fill factor (FF) dropped from 0.697 to 0.541 as the temperature increases to 450C, just as the maximum power output dropped from 10.88W to 7.80W at the same temperature.
Key Words: Ambient Temperature, Power out put, Solar cell(Photovoltaic), Short-circuit current, Open-circuit voltage, Fill factor and Efficiency.
1.0 INTRODUCTION
A major step forward in solar cell technology came in the 1940s and 1950s when a method (called the Czochralski method) was developed for producing highly pure crystalline silicon. In 1954 work at Bell Telephone Laboratories resulted in a silicon cell with 4% efficiency. Bell Laboratories improved this to 6% and then to 11% efficiency.
Sequel to the energy supply crisis experienced by the oil dependent western world in the 1970s, which led to a sudden growth of interest in alternative sources of energy and funding for research and development in those areas. During the period, there was intensification of interest in photovoltaic and a range of strategies for producing photovoltaic devices and materials more cheaply and for improving devices efficiency were explored.
Today, photovoltaic systems are capable of transforming one kilowatt of solar energy falling one square meter into about a hundred watts of electricity. One hundred watts can power most household appliances. Standard solar cells covering the sun facing roof space of a typical home can provide about 8500 kilowatt-hour of electricity annually, which is about the average household‘s yearly electricity consumption (Musa, 2010).

Within the last decade, the energy concerns have gained prominence throughout the world. Several nations have sought alternative means to deal with the emerging energy crisis. In Nigeria, the demand for electricity far outstrips the supply and the supply is epileptic in nature. The country is faced with acute electricity crisis, which is hampering its development notwithstanding the availability of vast natural resources in the country (Sambo, 2008). These problems have led Nigeria to look for alternative power supply such as solar energy among others. The energy emitted from the sun is primarily as electromagnetic radiation in the ultraviolet to infrared and radio spectral regions (0.2 to 3μm). The sun has a reasonable stable life time with a projected constant radiative energy output of over 10 billion (1010) years (Sze, 1981).
Solar cells are electronic devices used for the direct conversion of solar energy to electricity, using the photovoltaic (PV) effect. Photons from the Sun with sufficient energy near the depletion region of a p-n junction produce electron-hole pairs. If these electrons have enough energy, they will move to the conduction band, leaving holes in the valence band. The potential difference across the depletion region provides an electric field that pulls the electron to the n-region and hole to the p-region. The newly free electron can then flow from the n-region to the p-region and recombines with the newly created holes. In this way the energy of the incident photon is converted. In addition to other advantages, the method of converting solar energy to electricity is pollution free, and appears a good practical solution to the global energy problems; especially if practical economic means of direct conversion can be developed (Abdu and Musa, 2009).
Unfortunately, the output performance of solar cell varies with atmospheric factors such as ambient temperature, relative humidity, wind speed and dust among others. Since sunlight is intermittent, the energy produce by a solar cell is not at a constant rate and the power delivered at a certain instant is still very much a function of weather factors (Gxasheka et al 2005). Effort has been focus on the performance of the cell as its surrounding temperature rises. This is obvious because the amount of photo generated current increase slightly with increasing ambient temperature which is as a result of increase in the number of thermally generated carrier in the cell.
This research is an attempt to investigate the impact of ambient temperature on the power output performance of solar cell in Nigeria police Academy wudil, Kano. This is because the performance of solar cell varies with atmospheric factors and the solar cell designers assess their devices by evaluating the efficiency at standard test conditions, STC ( illumination = 1000W/m2, temperature = 25°C and Air Mass, AM 1.5 reference spectrum). However, these conditions practically never occur during normal outdoor operation (Heidler et al 1990), as they do not take into consideration the actual geographical and meteorological conditions at the installation sites. The study will help to establish the relationship between the power output performance and the ambient temperature, considering the high temperature Kano state has during the dry season.
Solar cells convert sunlight to electricity using the photovoltaic effect. These cells are made from semiconductor materials. These semiconductor materials behave as insulators at absolute zero temperature but become conductors of electricity when exposed to high temperature (light).
Like all other semiconductor devices, solar cells are sensitive to temperature. Increase in temperature reduces the band gap of a semiconductor, thereby affecting most of the semiconductor material parameters.

In a solar cell, the parameter most affected by an increase in temperature is the open-circuit voltage
OCV. The open-circuit voltage
OCV decreases with temperature because of the temperature
dependence of the reversed saturation current density ( OJ). Also, the short-circuit current, increases
slightly with temperature, since the band gap energy, decreases and more photons have enough energy to create electron-hole pair.
(Dubey et al, 2012) ―the operating temperature plays a key role in the photovoltaic conversion process. Both the electrical efficiency and the power output of a photovoltaic (PV) module depend linearly on the operating temperature. Hence, Solar cell performance decreases with increasing temperature, fundamentally owing to increased internal carrier recombination rates, caused by increased carrier concentrations‖.
Temperature effects are the result of an inherent characteristic of solar cells. They tend to produce higher voltage as the temperature drops and conversely, to lose voltage in high temperature. However, Amajama et al. (2016) in their research on the‖ effect of Air temperature on the Output of photovoltaic panelsandits relationship with Solar illuminance/intensity‖ concluded that the output voltage (or open-circuit voltage) rises with increase in air temperature, but gradually get steady as the peak voltage is approached. This was collaborated by the work of Biodun et al (2017) on the ―Experimental Evaluation of the Effect of Temperature on Polycrystalline and Mono-crystalline Photovoltaic Modules‖ where it was reported that as the temperature increases, there is no
significant effect on the open-circuit voltage OCV
of both photovoltaic modules. The open-circuit
voltage OCV
increases slightly after which it becomes steady as it approaches the peak value.
Ike (2013) established that there is an indirect proportionality between the power output produced by the system and the ambient temperature of the locality. Thus the application of photovoltaic technology in the conversion of solar energy to electricity is not favourable during the period of very high ambient temperature than the period of low ambient temperature. As a result, photovoltaic solar panels must be installed at a place where they receive more air current so that the temperature remains low while the power output remains high. But this was contradicted by Amajama et al (2016) in their research on the ―Effect of Air temperature on the Output of photovoltaic panels and its relationship with solar illuminance/intensity‖ where they opined that this is quite untrue, since solar radiations are energetic and convey energy in the form of heat, resulting in rise air temperature. They further stated that the amount of solar radiation raining or level of illuminance/intensity determines whether a day is sunny or not and that increase in illumination/intensity is a function of temperature. Hence, it is difficult to have a cold sunny day.
2.0 PARAMETERS OF SOLAR CELL
The output performance of a solar cell depends heavily on the following parameters; the short-
circuit current density SCJ
, the open-circuit voltage OCV
, the fill factor (FF) and the efficiency ( ). These parameters can be analysed by studying its current-voltage (I-V) characteristics under illumination.

The Short-Circuit Current Density SCJ
The short-circuit current density SCJ
is the current that flows through the junction under
illumination at zero applied voltage. In the ideal case (when series resistance, SR and shunt
resistance, ShR effect are negligible) it is equal to the light generated current density LJ
i.e.
1exp
KT
qVJJJ OLSC
When LOLOLSC JJJJJJV 1110exp,0
Or SCJJ L
The Open-Circuit Voltage OCV
The open-circuit voltage OCV
of a solar cell is its voltage on open circuit. It is the
maximum available voltage at 𝐽=0 and can be expressed as,
1
O
SC
OCJ
JIn
q
KTV
Since O
SC
J
J
1, the open-circuit voltage can be given approximately to be
O
SC
OCJ
JIn
q
KTV
The Fill Factor (FF)
Fill factor (FF) is defined as the ratio of the maximum power output ( MaxP) at the
maximum power point to the product of the open-circuit voltage OCV
and short-
circuit current density SCJ
and can be expressed as:
OCSC
Max
VJ
PFF
Efficiency

The electrical power conversion efficiency of a solar cell is determine by the ratio of the power output to the power input.
in
Max
P
P
OCSCMax VJFFP
in
OCSC
P
VFFJ
3.0 MATERIALS AND METHOD The materials that were used for this research include the following: 20 watt Solar Module, a
5.7K variable resistor which served as a load in the work, connection wires. A low resistance ammeter, high resistance voltmeter, and a sensitive digital humidity temperature meter were used for monitoring and measuring the output current, voltage, and ambient temperature respectively. Experiment A 20 watt rated Solar Module was used for the study. The dimension of the solar cell plate excluding the metallic frame of the panel is 40.0cm by 31.5cm. The module was tilted at approximately 12ºN (the latitude of Wudil) to the horizontal and facing North to ensure maximum insolation. To the solar module, a low resistance ammeter was connected in series while a high resistance voltmeter was connected in parallel to the 5.7KΩ variable resistor used as the load. The output current and voltage of the photovoltaic solar Module were measured and recorded between the hours of 08:00AM and 02:00PM in the month of April and June. From the recorded values, the output powers of the photovoltaic (PV) solar system were computed. The ambient temperatures were measured and recorded within these hours using a sensitive digital humidity temperature meter for the periods under investigation. A graph of current against time was plotted to obtain a temperature profile and variation of current with time of the day as shown in figure 3. This section of the study was used to plot the current-voltage characteristics curves at different temperatures for the location selected for the study.

Figure 1: A complete set up of the PV module circuit
Figure 2: Circuit diagram of the set up

Figure 3: Graph of current against time of the day Table 1: Manufacturer specification at STC: (illumination = 1000W/m2, Temperature = 25°C and AM 1.5 reference spectrum).
Maximum power
Output Tolerance
Current at .
Voltage at .
Short-circuit current .
Open-circuit voltage .
Fill Factor .
Efficiency .
4.0 RESULTS AND DISCUSSION This section gives analysed results, interpretations and findings of the study.
. , ,
.
.
. .
.
. .
0
0,1
0,2
0,3
0,4
0,5
0,6
0,7
0,8
8 : 0 0 9 : 0 0 1 0 : 0 0 1 1 : 0 0 1 2 : 0 0 1 3 : 0 0 1 4 : 0 0 1 5 : 0 0 1 6 : 0 0
CU
RR
ENT(
A)
TIME OF THE DAY
CURRENT

. , ,
.
.
. .
.
. .
. , ,
.
.
. .
.
. .
. , ,
.
.
. .
.
. .
, .

Figure 4: Graph of Current VS Voltage.
Figure 5: Graph of Power VS Voltage. DISCUSSION OF RESULTS The Effects of Ambient Temperature on Module Parameters
The short-circuit current The dependence of short-circuit current on ambient temperature is as shown in figure 6.
Result shows that there is a gradual increase in short-circuit current as the ambient
temperature increases. The short-circuit current increases from 0.75A to 0.90A as the ambient
temperature increases from 29.0 to 45.0 . This is attributed to the decrease in the band gap
0
0,1
0,2
0,3
0,4
0,5
0,6
0,7
0,8
0,9
1
0 5 10 15 20 25
CU
RR
ENT(
A)
VOLTAGE(V)
0
2
4
6
8
10
12
14
0 5 10 15 20 25
PO
WER
(W)
VOLTAGE(V)

which causes a slight increase in output current. As ambient temperature increases, the band gap
( ) reduces meaning more incident energy is absorbed because a greater percentage of the
incident light has enough energy to raise charge carriers from the valence band to the conduction
band. A larger photocurrent results; therefore, short-circuit current increases for a given insolation, and photovoltaic (PV) cells have a positive temperature coefficient of short-circuit
current . This is in line with the study carried out by Omubo-Pepple et al. (2013) on ―Influence of Meteorological Parameters on the Efficiency of Photovoltaic Module in some cities in the Niger Delta of Nigeria‖, results showed that as the solar panel temperature increases so also the output current.
The open-circuit voltage ( OCV )
Figure 7 shows the variation of the open-circuit voltage ( OCV ) with ambient temperature. It can be
seen from the graph that as the ambient temperature increases, the open-circuit voltage ( OCV )
decreases. The value of the open-circuit voltage ( OCV ) decreases from 20.80V at a temperature of
29.0 to 16.00V at a temperature of 45.0 . This was as a result of increase in the reverse saturation
current density ( OJ ) as the temperature increases causing a significant change in the voltage. The
reverse saturation current density ( OJ ) is a measure of the leakage (or recombination) of minority
carriers across the p–n junction in reverse bias. This leakage was a result of carrier recombination in the neutral regions on either side of the junction and therefore, reverse saturation current density (
OJ ) primarily controlled the value of open-circuit voltage ( OCV ) in the solar cells. The minority
carriers are thermally generated; Hence, reverse saturation current density ( OJ ) is highly sensitive to
temperature changes. This also agreed with the result obtained by Mustapha et al. (2013) in their research on the ―Performance evaluation of polycrystalline solar photovoltaic module in weather conditions of Maiduguri, Nigeria‖. Their results showed that module voltage decreased by 0.05
V/ with increase in temperature. Although, this was not in total agreed with Amajama et al. (2016) that the output voltage (or open-circuit voltage) rises with increase in air temperature, but gradually get steady as the peak voltage is approached.
The maximum power In figure 8, the graph shows a marked change in power output as the ambient temperature increases. The power output is high at a lower ambient temperature and low at a higher ambient temperature.
Whereas the maximum power at a temperature of 29.0 is 10.88W, it decreases to 7.80W as the
ambient temperature rises to 45.0 . This compare favourably with the work of El-Shaer et al. (2014) on the‖ Effect of Light intensity and Temperature on Crystalline Silicon Solar Modules Parameters‖ they observed that the maximum power density of the two modules decreases with increasing module temperature, where the maximum power density of the mono-crystalline and the poly-
crystalline modules for temperature=10 was 43.4 and 48.76 , respectively.
Increasing the temperature to 50 causes the decrease of the power by 25% and 14% to reach
values 36.32 and 41.88 respectively.
The fill factor The effect of ambient temperature on fill factor was shown in figure 9. From the graph, it was
clearly indicated that the fill factor decreased with temperature increase. As the ambient
temperature increased from 29.0 to 38.0 , the fill factor decreased from 0.697 to 0.563 but

gradually get steady as the peak temperature was approached. This agrees with the work of Cuce E, et al. (2013) titled‖ An experimental analysis of light intensity and temperature dependency of photovoltaic module parameters‖.
The efficiency The efficiency decreases with increase in ambient temperature as indicated in figure 10. The
efficiency values which decreased from 1.44% to 1.03% as the temperature approaches 45.0 was
mainly due to decrease in open-circuit voltage ( OCV ). The reverse saturation current density ( OJ ) is
a critical parameter affecting the efficiency of solar cells. The reverse saturation current density ( OJ )
is a material dependent parameter and depends on the band gap ( gE ) of the material.
5.0 CONCLUSIONS Proper understanding of solar cell parameters from the measured I–V characteristics is quite significant for the quality control and the performance assessment of solar cells. The results
indicated that the short-circuit current increases as the ambient temperature increases. On the other hand, it was observed that ambient temperature had a drastic effect on the open-circuit voltage
OCV. Open-circuit voltage
OCV decreases with increase in ambient temperature. So the power
output decreased by 29% with increasing ambient temperature from 29.0 to 45.0 . Maximum
efficiencies of 1.44%, 1.29% and 1.16% were achieved at an ambient temperature of 29.0 , 34.0
and 38.0 respectively. However, at an ambient temperature of 45.0 , the efficiency dropped to 1.03%. Therefore, the results showed that there was an indirect proportionality between the power output produced by the solar cell and the ambient temperature. The study established that the
parameter most affected by an increase in ambient temperature was the open-circuit voltage OCV
.
The open-circuit voltage OCV
decreases with increasing ambient temperature because of the
temperature dependence of the reverse saturation current density ( OJ). Also, the short-circuit
current, increases slightly with temperature, since the band gap energy decreases and more photons have enough energy to create electron-hole pairs. Both the fill factor and efficiency demonstrated a decrease with ambient temperature. Thus, it can be concluded that solar cells do not gain efficiency based on temperature, but instead based on the amount of solar irradiance. Hence, the application of photovoltaic technology in the conversion of solar energy to electricity gives more power and efficiency during the period of low ambient temperature than the period of high ambient temperature
AMBIENT T
OPEN-CIR
SHORT-CI
MAXIMUM POWER(W)
FILL –FACT
EFFICIE

EMPERATURE
CUIT VOLTAGE
RCUIT CURRENT
OR
NCY
29.0
20.80
0.75
10.880
0.697
1.44
34.0
20.00
0.77
9.756
0.633
1.29
38.0
19.46
0.80
8.766
0.563
1.16
41.0
18.60
0.84
8.580
0.549
1.13
43.0
17.20
0.86
7.959
0.538
1.05
45.0
16.00
0.90
7.800
0.541
1.03

Figure 4: Graph of Current VS Voltage.
Figure 5: Graph of Power VS Voltage.
0
0,1
0,2
0,3
0,4
0,5
0,6
0,7
0,8
0,9
1
0 5 10 15 20 25
CU
RR
ENT(
A)
VOLTAGE(V)
0
2
4
6
8
10
12
14
0 5 10 15 20 25
PO
WER
(W)
VOLTAGE(V)

Figure 6: Graph of Short-circuit current VS Ambient temperature.
Figure 7: Graph of Open-circuit voltage VS Ambient temperature
0
0,1
0,2
0,3
0,4
0,5
0,6
0,7
0,8
0,9
1
0 5 10 15 20 25 30 35 40 45 50
SHO
RT-
CIR
CU
IT C
UR
REN
T(A
)
AMBIENT TEMPERATURE(ºC)
0
5
10
15
20
25
0 5 10 15 20 25 30 35 40 45 50
OP
EN-C
IRC
UIT
VO
LTA
GE(
V)
AMBIENT TEMPERATURE(ºC)

Figure 8: Graph of Power VS Ambient temperature.
Figure 9: Graph of Fill Factor VS Ambient temperature.
0
2
4
6
8
10
12
0 5 10 15 20 25 30 35 40 45 50
PO
WER
(W)
AMBIENT TEMPERATURE(ºC)
0
0,1
0,2
0,3
0,4
0,5
0,6
0,7
0,8
0 5 10 15 20 25 30 35 40 45 50
FILL
-FA
CTO
R
AMBIENT TEMPERATURE(ºC)

Figure 10: Graph of Efficiency VS Ambient temperature. . REFERENCES
Abdu, Y. and Musa, A.O. (2009).‖Copper (1) oxide (CU2O) Based solar cells-A review‖, Bayero journal of pure and applied science, Vol.2. no.2, pp. 8-12
Al-Khazzar, A. (2016).‖ Behavour of Four Solar PV Modules with Temperature Variation‖, International Journal of Renewable Energy Research, Vol.6, No.3.
Amajama, and Mopta, S.E (2016). Effect of Air temperature on the Output of photovoltaic panels and its relationship with solar illuminance/intensity .International Journal of Scientific Engineering and Applied Science (IJSEAS) – Volume-2, Issue-8, pp. 2395-3470.
Amuda, D. B, Adeleke, D. K., and Orotoye, T. A. (2017).‖ ExperimentalEvaluation of the Effect of Temperature on Polycrystalline and Mono-crystalline Photovoltaic Modules‖ IOSR Journal of Applied Physics (IOSR-JAP). Volume 9, Issue 2, pp. 05-10.
Cuce E, Cuce P and Bali T (2013). ―An experimental analysis of light intensity and temperature dependency of photovoltaic module parameters‖. Applied Energy Vol.111, pp. 374–382
Dinçer, F and Meral, M.E. (2010). Critical Factors that Affects Efficiency of Solar Cells, Smart Grid and Renewable Energy, Vol. 1, pp. 47-50
Dubey, S., Sarvaiya, J. N. and Seshadri, S. B. (2013).‖ Temperature Dependent Photovoltaic (PV) Efficiency and Its Effect on PV Production in the World- A Review‖. Energy Procedia, vol.33, pp.311 – 321
Effect of temperature. In PV Education.org. Retrieved 26 July, 2017, from
http://www.pveducation.org/pvcdrom/solar-cell-operation/effect-of-temperature, 2017.
0
0,2
0,4
0,6
0,8
1
1,2
1,4
1,6
0 5 10 15 20 25 30 35 40 45 50
EFFI
CIE
NC
Y(%
)
AMBIENT TEMPERATURE(ºC)

El-Shaer, A., Tadros, M.T.Y and Khalifa, M.A (2014). Effect of Light intensity and Temperature on Crystalline Silicon Solar Modules Parameters. International Journal of Emerging Technology and Advanced Engineering Volume 4, Issue 8, pp. 311-318
Gxasheka, A.R., E.E. Van Dyk, and E.L. Meyer. (2005). ―Evaluation of Performance Parameters of PV Modules Deployed Outdoor‖, Renewable Energy. Vol.30, pp. 611- 620.
Sze, S.M. (1981). Physics of semiconductor devices. John Wiley and Sons, Inc. pp.790-835.
Heidler, K. Raicu, A. and Wilson, H. R. (1990). Proc. 21st IEEE PV Specialist Conf., Kissimmee.
Ike, C.U. (2013). ―The effect of temperature on the performance of a photovoltaic solar system in eastern Nigeria‖, International journal of engineering and science, Vol.3. Issue 12, pp. 10-14.
Kano Meteorological unit, Monthly mean daily radiation of a horizontal surface for the month of April and June Mallam Aminu Kano International Airport Kano.
Musa, A.O. (2010). Principles of Photovoltaic Energy Conversion: Zaria, Ahmadu Bello University Press Limited, pp. 71-74
Mustapha, I., Dikwa, M.K., Musa, B.U., Abbagana, M. (2013). Performance evaluation of polycrystalline solar photovoltaic module in weather conditions of Maiduguri, Nigeria Arid Zone Journal of Engineering, Technology and Environment. Vol. 9, pp. 69-81.
Omubo-Pepple, V. B., Tamunobereton-ari, I. and Briggs-Kamara, M. A. (2013). ―Influence of Meteorological Parameters on the Efficiency of Photovoltaic Module in some cities in the Niger Delta of Nigeria‖. Journal of Asian Scientific Research, vol. 3, no.1, pp.107-113
Onimisi, M.Y. (2008).‖Temperature dependence on the power output in copper (1) Oxide solar cell‖. Journal of science and industrial studies, Vol. 6, no.2, pp.26-29
Photoelectric effect, In Science daily. Retrieved 26 July, 2017, from
https://www.sciencedaily.com/terms/photoelectric_effect.htm, 2017.
Pradhan A. and Ali S.M. (2016).‖Analysis of solar PV performance with change in temperature‖, International journal of applied engineering research, Vol.11, no.7, pp.5225-5227
Sambo A.S. (2008).‖Matching electricity supply with demand in Nigeria‖. International association for energy economics, fourth quarter, pp.32-38
Sanusi, Y.K., G.R. Fajinmi, and E.B. Babatunde. (2011). ―Effects of Ambient Temperature on the Performance of a Photovoltaic Solar System in a Tropical Area‖. Pacific Journal of Science and Technology. Vol.12, no.2, pp.176-180.
Singh, P. and Ravindra, N.M (2012).‖Temperature dependence of solar cell performance—an analysis‖, Solar Energy Materials & Solar Cells, pp. 36–45
Zhang, L., Tan, Y., Yang, Z., Gao, Z., and Nie, Y. (2012). ―Effect of Temperature on Performance Parameters of Metallurgical Grade Poly silicon Solar Cells‖. Applied Mechanics and Materials Vol. 148-149, pp. 1252-125

THE A, B, C OF GEOGRAPHIC INFORMATION SYSTEM (GIS)
Isa, Muhammad Zumo Department of Surveying, Federal Polytechnic Damaturu, Nigeria
Abstract
This paper explains the fundamentals of Geographic Information System (GIS) in its simplest form. It is seen as a science of as well as tools of acquisition, management and dissemination of Geoinformation. The basic concept of (GIS) is to modeled and identifies an object or phenomena at a particular time in specific location in space. In order to achieve this, certain scientific methodologies and tools as digital hardware and software must be used. The paper highlighted some of these tools as data acquisition tools, data management, and information presentation tools. The methods include Ground Survey, Photogrammetry and Remote Sensing, Laboratory Techniques and Social Survey. The data acquired may come from Field using digital survey equipment, Maps or Images and Social Survey. Keywords: Fundamental, Geographic, Information, System. 1.0 Introduction Geographic Information System (GIS) is discipline that deals with the methods of data acquisition, data management and the presentation of the processed and analyzed data inform of information that is being made reference to the earth surface. According to the International Institute of Geo-Information Science and Earth Observations (ITC), the Netherlands, technologies supporting the processes of acquiring, analyzing, and visualizing spatial data form the core of Geoinformatics (ITC, 2001). Borough (1998) define Geoinformatics as a powerful set of tools for collecting, storing, retrieving at will, transforming and displaying spatial data from the real world. While Borough see it as a tool, Paker (1998) see it as an information technology which stores, analyses, and displays both spatial and non-spatial data. Cowen (1998) defines it as a decision support system involving the integration of spatially referenced data in a problem solving environment. Koskariov, Tikunov and Trofimov (1989) on the other hand view Geoinformatics as a system with advanced Geo-modelling capabilities. From the above definitions it can seen that Geoinformatics can be a tool, science, technology or a decision support system. GOODCHILD (1992) defines GIS research as ―research on the generic issues that surround the use of GIS technology, impede its successful implementation, or emerge from an understanding of its potential capabilities.‖
1.1 Basic Terms: -
i. Data: - It is a measure of quantity that has no meaning on its own. 45, 07, A4, G9, are examples of data that doest make any meaning. Data are normally processed and analyzed to obtain information about place or phenomenon.
ii. Information: - Processed data, which is ready for use. It conveys meaning or knowledge of a particular subject.
iii. System: - Interrelated components/parts, which work together/interact to achieve a common goal. Human resources, hard wares, software‘s, etc are all systems.
iv. Geo: - Geo or Geographic simply refers to the Earth as an entity. v. Information System: - Computerized tools for the acquisition, storage, processing,
analysis and interpretation of any kind of information. The information can be locational e.g. rate of change erosion within a particular area or non-locational information such as academic performance of students. The information is general.

vi. Database Management System (DBMS):- A collection of software for organizing the information in a data-base. It contains routines of data input, verification, storage and retrieval i.e. software that can receive and manage data in a database.
vii. Database: - Is an organized, integrated collection of non-redundant data stored so as to be capable of use by relevant applications with the data being accessed (reached) by different logical paths.
viii. Data Model: - An abstraction of the real world which incorporates only those properties thought to be relevant to the applications at hand. It normally defines specific group of entities, their attributes and relationship between them. It is independent of computer model and its associated data structures.
ix. Data Structure: - The logical arrangement of data as used by a system for data management; representation of data model in computer form. It is also called logical data model.
x. Computer Assisted Design (CAD): - It is a graphic system or electro drafting system use for the design and drafting of graphic elements such as points, lines and polygons.
xi. Computer Assisted Cartography (CAC): - Automatic control of cartographic processes includes symbolization, map generalization, display and map printing. Maps are usually stored in layers.
xii. Computer Assisted Mapping (CAM): - Is a system, which enables digital compilation of maps especially from hybrid and analytical stereo plotters. The digital manuscripts are also kept as simple files (in layers) in spaghetti (mixed up) format.
xiii. Digital Mapping System (DMS): - Is the development of digital acquisition system, digital image processing system, analytical and soft copy photogrammetric workstations and digital land surveying equipment‘s (G.P.S., Total Station, etc) that improved the capability of CAM.
1.2 Basic Concepts of Geoinformatics: The basic concept in GIS is revolving within three distinct units. These are date and time, the object, event or phenomenon and the spatial location of the object, event or phenomenon in space. Time Location Object, event Fig. 1.2 Basic concept in GIS
The basic philosophy in the above modeling (fig. 1.2) is that the above basic units are measured with their relationships. We assume that one of them is constant (time), predefined one while the remaining one is not known. In relation to our geographic location, the ‗what‘ becomes the object (phenomenon), the ‗where‘ becomes space (location) and the ‗when‘ becomes time (date). In the case of remote sensing, we predefined the location and measure the phenomenon (object). To predefined (where) and measured one (what) depends on personal view, which is based on: - Field based concept and basic spatial reasoning (Remote Sensing approach). - Object base concept (vector approach).
Whe

1.3 Components of a Spatial Object. a spatial object has three basic components. They are the attribute of the object, the geometry and its time. Figure 1.3(a) and (b) is a schematic diagram of components of a spatial object.
Figure 1.3(a): components of a spatial object.
i. Attribute data: - This refers to some observable facts about an object. The data also depends on application at hand. E.g. Cadastral information on a parcel of land will have attributed such as area, owner, cost, location etc for mainly cadastral application. Agricultural information on the same parcel will have attribute data as soil type, erodability, rainfall amount, fertility etc for Agric application. Therefore acquisition of attribute information will depends on the application at hand.
ii. Temporal Data: - These are data obtained on the objects existed as a particular time. It may change with time. i.e. time is not constant, it varies. This is called Spatio Temporal Modeling (Time is variable). The features keep on changing as the time also changes. When a map is printed, it has time of printing. At that particular time the features can be determined. But as the time changes, the features on the land also change. After certain period of time t1, t2, t3 …….tn, the map have to be updated.
This can be use to study the rate of erosion, desert encroachment, etc at various times. i.e. at a given time (t2 – t1) one will perform analysis (modelling) and determine the rate of erosion or desert encroachment.
iii. Geometric data: - This component can be further divided into 3 categories.
Figure 1.3(b): components of a spatial object.
Object
Attribute
Temporal
Geometric
Spatial relationship
Shape & Size
Location
Geomet

Location: - This can be determined during data acquisition, they may be acquired either by using object based approach (vector) or field based (raster) using Digital Image Processing. Shape & size: - This forms part of the object‘s geometrical characteristics. Areas and volume of objects will be obtained through determining its dimensions. Spatial Relationship: - Uses mainly in G.I.S to carry out spatial analysis. It gives spatial relationship between one object and the other, i.e. relationship in shape, size, location etc. It has three main components i.e. Topology, metric, and spatial order relationships.
Figure 1.3(c): components of a spatial object.
a) Topologic: - This is based on mathematical geometry (angles, squares, lines, polygons nodes etc). It is the relationship that remains independent under certain transformation e.g. rotation (about an axis), shift (translation) and (to some extent) scaling. The relationship will remain the same whether it was shifted, rotated reduced or enlarged. These types of relationship are needed for spatial analysis for customized map.
b) Metric: - Based on coordinate geometry (x, y and z). Concept of distance and bearing can be derived easily from location
b) Spatial Order: - It is based on lattice geometry, it does not give relationship as detailed as topologic relationship.
2.0 GIS tools: A GIS is defined as follows (ARONOFF, 1989): A GIS is a computer-based
system that provides the following four sets of capabilities to handle geo-referenced data: i. Input, ii. Data management (data storage and retrieval), iii. Manipulation and analysis, and iv. Output. In order to perform any of these capabilities, there must be an involvement of necessary hardware and software. This are known as GIS tools.
2.1 Hardware components for GIS. Hardware is the physical components of a system. In
Geo-informatics, hardware was classified into three categories via; Data acquisition hardware, Data management hardware and information presentation hardware.
i. Data Acquisition Hardware: - These include Digital land survey equipment, Analytical and Digital Photogrammetry and Remote sensing equipment, Hydrographic survey equipment and Laboratory data acquisition equipment.
ii. Data Management Hardware: The hardware in data management includes Host
Spatial
relationshiMetri
Topologic
Spatial order

Computer, PC Mainframe, Workstation, and Desktop. In case of a stand alone unit the hardware platform requires 32 megabits of RAM or higher. The hard disk should be of 250 Gygabite or higher and speed of 500MHZ or higher.
iii. Information Presentation Hardware: Hardware involve in information presentation are printers, plotters and VDU.
2.2 GIS Software: - Software is a set of programmes (modules) design for a specific task. Some common of GIS software‘s include Computer Assisted Design Software‘s (CAD), Database Management Software (DBMS), Cartographic Software, Digital Elevation Modeling (DEM), Digital Image Processing (DIP), Word Processing and Internet Services: There are some software that combine the activities of CAD, CAC, DBMS and also perform analysis in many forms. Some literatures considered them as the GIS software. Both the text and the graphics will be queried and displayed within the same window. Common among them are Integrated Land and Water Information System (ILWIS), Idrisi, Arc Info, and ArcGIS.
3.0 Sources of Data: The collation of data about the spatial distribution of significant
properties of the Earth surface has long been an important part of the activities of organized societies. From the earliest civilizations to the modern times, spatial data have been collected by navigators, geographers, and surveyors and rendered into pictorial form by the mapmakers or cartographers. Data may be obtained through direct field observation (e.g. Land Surveying, Hydrography etc) or through existing maps and images (satellite or Aerial) and through social survey.
3.1 Types of Field Observed Data Observed data may be obtained by different means few examples are data obtain from theodolite observation, levels, GPS, Total station and Hydrophones.
i. Map: Map is a representation of a portion of the earth‘s surface upon a plane. There are different types of maps: Digital Map, Topographical Map, Thematic Map, Hydrographic Maps, Geographical Maps, Planimetric Maps, Orthophoto Maps.
ii. Images: Image is a visible representation of a feature (or person). These representation
may be on a hard copy (paper or on as a softcopy (screen). There are different types of images. Some of which are Aerial Images, Satellite images, Multi temporal Image, Stereo Image etc.
4.0 Data Acquisition Methods 4.1 Surveying: - Data are acquired in the field measurements by observation of angles and
lengths. These data are then processed to determine the exact position of point(s) and the distance between successive points. These data acquired in surveying by means of some survey instrument like theodolite, Total station, level, GPS etc. In surveying the accuracy of the data acquired are in relation to the specification of the survey. It could be third order traverse or levelling, second order or first order depending on application at hand.
4.2 Photogrammetry: - Photogrammetry involves obtaining data (in form of aerial photographs) from an aircraft flown in strips along the area of interest. Their photographs are prepared in form of a mosaic and later processed to have a map of that area. It is only applicable to areas of large coverage.
4.3 Remote Sensing: - The process is almost the same with photogrammetry but with wider area of coverage and a high resolution. The data obtained are from orbiting satellite images.

4.4 Laboratory method. This method uses the techniques of acquiring data in the laboratory. These are digitizing and scanning.
i. Digitizing: One of the laboratory data acquisition method is by digitizing of existing hardcopy map/plan using a digitizer. A digitizer is a manual graphic input device that allows capturing coordinates from given source material mounted on the surface of a tablet Wolfgang K, (2004 ) Geographic Information Science (GIS) Vienna. It converts analogue database map in its digital format. There are two methods of digitizing. Digitizing using digitizing tablet and on screen digitizing. When digitizing X, Y coordinates are picked serially of all the area visited on the map placed on the tablet with the digitizer mouse incase of digitizing with tablet. Digitizing is also known as electronic tracing.
ii. Scanning: Another laboratory data acquisition method is scanning. In scanning, gray values are measured and converted into series of numbers from 0 to 255. Scanning is of two modes. Black & white mode and colored mode. Accuracy of scanning depends on the resolution of the scanner (i.e. dpi).
4.5 Statistical Survey: This involves the use of questionnaire or social survey in obtaining data of a specific location of a feature/event or partial distribution of feature/event. Accuracy of social survey/questionnaire depends on findings/response from the sources/public.
5.0 Conclusion GIS can be a tool, science, technology or a decision support system for the acquisition, management and production and dessimination of geoinformation. Ehlers (2003) sum it all by defining GIS as ―the art, science or technology dealing with the acquisition, storage, processing, production, presentation and dissemination of geoinformation‖.
References Aronoff S., 1989, Geographic Information Systems: A Management Perspective. WDL
Publications, Ottawa. Borough, P. A. (1996): principles for geographic information system for land resources
assessment. Clarendon, Oxford. Cowen, D. J. (1988). GIS versus CAD versus DBMS. What are the differences?
Photogrammetric Engineering and Remote Sensing 54:1551-1 EhlersM(2003) Geoinformatics and digital earth initiatives: a German perspective. Int J Dig
Earth 1(1):17–30 Goodchild, M.F. (1992). Geographical Information Science . Int. J. Geographical Information
Systems, Vol. 6, No. 1, pp. 31–45. ITC, (2001), The educational information book of the International Institute of Geoinformation
Sciences and Earth Observations (ITC), the Netherlands, 54pages. Koskariov A V, Tikunov V S, Trofimov A M (1989): The current state and the main trends in the development in development of Geographic Information System in the USSR. International journal of Geographic Information Systems 3(3):257-72 Paker H D (1988): The unique qualities of geographical information system: a commentary.
Phogrammetric Engineering and Remote Sensing. (54)11:1547-49

ASSESSMENT OF TREE REGENERATION POTENTIAL IN THE PARKLAND OF GWARZO LOCAL GOVERNMENT, KANO STATE
*Abdulrashid I. A.G Bello**, A.F. Umar*, H. Bilyamin* and A.F. Wada*
*Department of Forestry, Fisheries and Wildlife, Kano University of Science and Technology Wudil, Nigeria. **Department of Forestry and Environment, Usmanu Danfodiyo University, Sokoto-Nigeria
ABSTRACT This research work was carried out to assess tree regeneration potential of the parkland, along Gwarzo-Kano road. Fifty (50) sampled plots (25x25m) were laid systematically, and regenerating tree species were determined. A total of 920 stands were encountered in the area, belonging to sixteen (16) different species, distributed within eleven (11) families. Fabacaceae, had the highest number of four species, followed by Anacardiaceae and Combretaceae with two species each. Low numbers of seedlings were recorded (138 stems) among which Diospyros mespiliformis had the highest frequency of 27stems (19.57%) and Daniellia oliveri had the least appearance with only 3 (2.17%). Terminalia macroptera, Ficus sycomorus, and Sclerocarya birrea have no seedlings and saplings recorded. Shannon‘s diversity index (H‘) was 2.0572, 2.4394 and 2.6502 for seedlings, saplings and trees respectively. The parkland had a moderate diversity and poor regeneration on a fairly low fertile soil. Intervention is needed by the governments at all levels, NGOs, and CBOs for proper development, conservation and sustainable use of the tree species on the farms. Keywords: Regeneration; Shannon‘s diversity index, Parkland, Seedlings and Sapling. INTRODUCTION
Nigeria‘s forest resources have been declining steadily due to the rapid growth of population and urban expansion, persistence of shifting cultivation and the ever-increasing demand for forest product, especially fuel wood (Kehinde et al. 2009). FAO (1987) noted that if that trend of timber exploitation persists in Nigeria, the useful timber resources would be exhausted by the year 2010. Indeed, presently most of the useful tree resources have disappeared from our forest and even farms. Unless these trees are reproduced and re-established in our forest and farms, they would soon become permanently extinct (Okonkwo, 2010). According to FAO (1997), the pressure of growing populations in developing countries, has forced landless farmers unto soils which cannot sustain crop production and slopes that cannot be cultivated safely. It is also compounded by consistent influx of migrant from neighboring countries, resulting in over grazing and continuous over exploitation of marginal lands. This has in turn aggravated the twin problem of drought and desertification. Increasing demand for land has also intensified deforestation; the traditional system of Agriculture is largely characterized by clearance of vegetation (Okonkwo, 2010).
Tree regeneration is described as the act of renewing tree cover by establishing young trees naturally or artificially, after the previous stand or forest has been removed. The method, species and density are chosen to meet the goal of the landowner. Regeneration can be natural (coppicing, self-sown seeds and root suckers) or artificial (planting), (Sarkar and Devi, 2014). According to Bonkoungouet et al. (1994), farmed parklands ―are land-use systems in which woody perennials are deliberately preserved in association with crops and/or animals in a spatially dispersed arrangement and where there is both ecological and economic interaction between the trees and other components of the system‖. Nair, (1985) stated that, In the ICRAF Agroforestry systems inventory; farmed parklands are included in the category of ‗multipurpose trees on farmlands‘. The term ‗farmed parkland‘ also encompass parklands being farmed as well as land lying fallow, and does not exclude a pastoralist component. Farmed parklands are common types of Agroforestry systems in

the tropics that were over looked for a long time (FAO, 1997). Recent studies by Gideon and Verunumbe (2013) observed that trees feature prominently in traditional farming system because of their contributions to famers‘ livelihood. Woody species form a major component of the bush fallow system and are widely retained in permanent land. In farmed parkland, cereals are cultivated, sometimes manured, and grazed after harvest by livestock. A successful regeneration is indicated by the presence of sufficient number of seedlings, saplings and young trees in a given population and the number of seedlings of any species can indicate the regeneration potential of that species (Negi and Nautiyal, 2005).
Tree regeneration is a central component for tropical forest ecosystem dynamics and is essential for preservation and maintenance of biodiversity (Rahman et al., 2011). A stand may have sufficient seedlings per hectare; there may be areas where seedling density is below what is required to maintain site productivity and good tree form. Several types of disturbances like logging, landslides, extraction, and harbivory etc. can affect the potential regenerative status of species in forest stand spatially and temporally. It‘s therefore important to understand the status of tree species in the ecosystem as one of the key parameters to determine ecosystem stability (Sarkar and Devi, 2014). MATERIALS AND METHODS Study Area
The study area is Gwarzo local government area of Kano state, Nigeria, located between latitude 1102312611 and 1105811111N and longitude 7o15o011 and 8o1115911E, with a population estimate of 216,570 people and a total area of 393km2 (NPC, 2006). The area has a mean annual rainfall of about 696.4mm that last usually for three to five months, the mean temperature ranges from 260C to 330C.The area is characterized by four distinct seasons, a dry and cold seasons, (Kaka) (mid November to February) marked by cold and dry weather plus occasional haze; the dry and hot season, (Bazara) (March to mid-May) when temperatures rise up to 400C and which is a transition period between the harmattan and wet season; the wet and warm season, (Damina) (mid-May to September) is the proper wet season when the lowest temperature is recorded; and a dry warm season, (Rani) (October to mid-November) marked by high humidity and high temperatures (KNSG, 2014). Sampling Procedure A systematic sampling technique of parallel line transect with plots method was employed and as Getachew and Biruk (2014) suggested, fifty (50) 25×25m plots were set up and spaced at interval of 100m along linear transects separated by 200m from one another, and all the tree species encountered within the plots were identified by their local names (with the help of local people and farmers), recorded and measured (diameter at breast height and collar diameter for seedlings using girth tape and Vanier caliper). All sample plots were located at least 100m from the road to avoid edge effect.

Data Collection During field assessment, the plots were marked using plastic rope and four wooden pegs, within the plots, all types of regenerated tree species encountered were identified, counted and measured. Individual trees having ≥ 30cm diameter (measured at breast height) was considered as Trees, saplings with ≥ 10cm to < 30cm diameter and seedlings with < 10cm diameter. The status of regeneration of species was determined based on population size of seedlings, saplings and Trees as (modified from Shankar (2001) and Khumbongmayum et al. (2006). Soil samples were also collected for chemical analysis. Vegetation Analysis
The data obtained from the study was summarized and presented in tables; species richness, diversity and evenness of regenerating tree species were analyzed using biodiversity formulas and methods as follows: Shannon’s diversity index: H‘= -∑ Pi ln pi
Where H‘ = Shannon diversity and Pi = proportion of individual species, ln = natural logarithm
road
100m 100m
25m2
20
0m
25m2 25m
2 25m
2
25m2 25m
2
100m
100m 100m
100m
Road
ed
ge
100m 100m
100m
25m2 25m
2 25m
2
20
0m
Parkland (plots)

Species richness is an index based on the number of species; it describes Variety of species or the number of different species (or genera, families, etc.). Species richness R is given as d = N S Where; S is number of species; N is number of individuals. Evenness is a measure of the relative abundance of the different species making up the richness of an area. Evenness is calculated using Shannon Evenness index (E’) E’= H′/H′max or E’=H’/lnS Where, H’ is observed diversity; H′max is equal to natural logarithm of richness, ln S. Density = total No of stems of the species/ sampled area (ha) Table 1: Tree species composition SCIENTIFIC NAME FAMILY VERNACULAR NAME Adansonia digitata Bombacaceae Kuka Azadirachta indica Maliaceae Darbejiya Terminalia macroptera Combretaceae Kwandari Ficus sycomorus Moraceae Báuré Parkia biglobosa Fabaceae Dorawa Faidherbia albida Fabaceae Gawo Diaspyros mespiliformis Ebanaceae Kanya/Kaiwa Tamarindus indica Fabaceae Tsamiya Balanites aegyptiaca Zygophyllaceae Aduwa Mangifera indica Anacardiaceae Mangoro Vitex doniana Vertenaceae Dínyáá Anogeissus leiocarpus Combretaceae Marke Sclerocarya birrea Anacardiaceae Danya Ziziphus spina-christi Rhamnaceae Kurna Eucalyptus camaldulensis Myrtaceae Turare Daniellia oliveri Fabaceae Maje
Table 2: Frequency and percentage of regenerating species
Seedlings (1-10cm) Saplings (dbh=11-30cm) Trees
(dbh=>30cm) Species Freq % Freq % Freq %
Adansonia digitata 13 9.42 19 7.72 36 6.72
Azadirachta indica 23 16.67 31 12.60 49 9.14
Terminalia macroptera 0 0.00 0 0.00 7 1.31

Ficus sycomorus 0 0.00 0 0.00 6 1.12
Parkia biglobosa 11 7.98 27 10.98 43 8.02
Faidherbia albida 0 0.00 9 3.66 32 5.97
Diospyros mespiliformis 27 19.57 33 13.41 62 11.57
Tamarindus indica 9 6.25 21 8.54 39 7.28
Balanites aegyptiaca 0 0.00 17 6.91 32 5.97
Mangifera indica 16 11.59 20 8.13 43 8.02
Vitex doniana 0 0.00 11 4.47 27 5.04
Anogeissus leiocarpus 0 0.00 7 2.85 30 5.60
Sclerocarya birrea 0 0.00 0 0.00 31 5.78
Ziziphus spina-christi 11 7.97 18 7.32 27 5.04
Eucalyptus camaldulensis 25 18.12 29 11.79 59 11.01
Daniellia oliveri 3 2.17 4 1.63 13 2.43
Total 138 100 246 100 536 100
Source: Field Survey, 2015
Table 3: Shannon diversity value (H’) for seedlings
Species Ni Pi InPi (Pi)(InPi)
Adansonia digitata 13 0.094 -2.3645 0.2223
Azadirachta indica 23 0.167 -1.7898 0.2989
Terminalia macroptera 0 0.000 0.0000 0.0000
Ficus sycomorus 0 0.000 0.0000 0.0000
Parkia biglobosa 11 0.080 -2.5257 0.2021
Faidherbia albida 0 0.000 0.0000 0.0000
Diaspyros mespiliformis 27 0.196 -1.6296 0.3194
Tamarindus indica 9 0.065 -2.7334 0.1777
Balanites aegyptiaca 0 0.000 0.0000 0.0000
Mangifera indica 16 0.116 -2.1542 0.2413
Vitex doniana 0 0.000 0.0000 0.0000
Anogeissus leiocarpus 0 0.000 0.0000 0.0000
Sclerocarya birrea 0 0.000 0.0000 0.0000
Ziziphus spina-christi 11 0.080 -2.5257 0.2021
Eucalyptus camaldulensis 25 0.181 -1.7073 0.3094
Daniellia olivieri 3 0.022 -3.8167 0.0840
2.0572
Source: Field Survey, 2015

Table 4: Shannon’s diversity value (H’) for saplings
Species Ni Pi InPi - (Pi) x (InPi)
Adansonia digitata 19 0.077 -2.5639 0.1974
Azadirachta indica 31 0.126 -2.0715 0.2610
Terminalia macroptera 0 0.000 0.000 0.0000
Ficus sycomorus 0 0.000 0.0000 0.000
Parkia biglobosa 27 0.110 -2.2073 0.2428
Faidherbia albida 9 0.037 -3.2968 0.1220
Diaspyros mespiliformis 33 0.134 -2.0099 0.2693
Tamarindus indica 21 0.085 -2.4665 0.2097
Balanites aegyptiaca 17 0.069 -2.6736 0.1845
Mangifera indica 20 0.081 -2.5133 0.2036
Vitex doniana 11 0.045 -3.5756 0.1395
Anogeissus leiocarpus 7 0.028 -3.5756 0.1001
Sclerocarya birrea 0 0.000 0.0000 0.0000
Ziziphus spina-christi 18 0.073 -2.6173 0.1911
Eucalyptus camaldulensis 29 0.118 -2.1371 0.2522
Daniellia olivieri 4 0.016 -4.1352 0.0662
2.4394
Source: Field Survey, 2015
Table 5: Shannon’s diversity value (H’) for Trees
Species Ni Pi InPi - (Pi) (InPi)
Adansonia digitata 36 0.067 -2.7031 0.1811
Azadirachta indica 49 0.091 -2.3969 0.2181
Terminalia macroptera 7 0.013 -4.3428 0.0565
Ficus sycomorus 6 0.011 -4.5099 0.0496
Parkia biglobosa 43 0.080 -2.5057 0.0496
Faidherbia albida 32 0.061 -2.7969 0.2021
Diaspyros mespiliformis 62 0.116 -2.1542 0.2499
Tamarindus indica 39 0.073 -2.6173 0.1912
Balanites aegyptiaca 32 0.061 -2.7969 0.1912
Mangifera indica 43 0.080 -2.5257 0.2021
Vitex doniana 27 0.050 -2.9957 0.1498
Anogeissus leiocarpus 30 0.056 -2.8824 0.1614
Sclerocarya birrea 31 0.058 -2.8473 0.1651
Ziziphus spina-christi 27 0.050 -2.9957 0.1498
Eucalyptus camaldulensis 59 0.110 -2.2073 0.2428
Daniellia oliveri 13 0.024 -3.7297 0.0895
2.6502
Source: Field Survey, 2015

Table 6: Species richness (R), evenness (E) and density values
Diversity indices Seedlings Saplings Trees
Species richness 1.3620 1.0201 0.6912
Species evenness 0.7420 0.8798 0.9559
Density (per hectare) 44.16 78.72 171.52
Source: Field Survey, 2015
DISCUSSION Tree Species Composition The species and families of regenerating tree species encountered in this study (16 species and 11 families) gave vegetation composition far from what Bello et al. (2012) found in the neighboring Kogo forest reserve of Katsina state north-western Nigeria, the number of species was also less than what Mu‘azu (2010) found in kuyanbana forest reserve of Maru, Zamfara state. The sixteen regenerating species of Gwarzo town is close to what Shreekar and Samant (2012) found (17 species) at the far away khokhan wildlife sanctuary, north-western Himalaya, India. The result had higher regenerating species compared to 15 species documented by Nuraddeen (2014) at the parklands of Katsina State. At Ehor forest reserve in Edo state of southern Nigeria, 99 different species were identified belonging to 87 genera and 36 families. Weather and climate of the ecological zones are important factors influencing the distribution and abundance of different species as described by Causton (1988). In a similar research conducted at the parklands of Katsina state by Nuraddeen (2014) he reported a similar pattern of regeneration in which there was a higher density of more mature stems and lower density of smaller stems (seedlings and saplings). The outcome has gone contrary to Shackleton (2000): Luoga et al. (2004) and Mlambo and Huizen (2004) as reported in Shacleton et al. (2005) that ―the high density of small stems can be due to the high capacity of savanna trees to regrow after felling via coppice stems‖. Diospyros mespiliformis had the highest appearance in all the regeneration classes (seedlings, saplings and Trees), Terminalia macroptera, Ficus sycomorus and Anogeissus leiocarpus had no seedlings recorded. In the sapling class, Sclerocarya birrea and Terminalia macroptera were absent, while in the Trees class, Ficus sycomorus constitute the least percentage of the total Adult tree species encountered. This is not in agreement to what Nuraddeen (2014) found, in which Anogeissus leiocarpus had the highest frequency followed by Balanite aegyptiaca, Faidherbia albida, Parkia biglobosa and Vitaellania paradoxa in that order. This is in agreement with the findings of Bello et al. (2013) at Kogo forest reserve in which Anogeissus leiocarpus recorded the highest relative density of 24.49% and Annona senegalensis is the least with 0.40%. The findings of the study shows that Terminalia macroptera, Ficus sycomorus and Anogeissus leiocarpus were at the top of the possible list of vulnerable tree species under threat of endangerment in the parklands of Gwarzo; this may be as a result of competition, over-exploitation and climatic or edaphic factors.
Diversity Index Depending on the available tree species in an ecological zone, the diversity indices varies with location, the parklands of Gwarzo, is blessed with moderate diversity of regenerating tree species, in which Trees had higher diversity of 2.6502, followed by saplings (2.4394) and seedlings had the least diversity with 2.0572, this falls within the general limits of 1.5-3.5 (Kent and Coker, 1992). In comparison, the result agreed with the findings of Bello et al. (2013) in which they recorded a

diversity value of 2.626 for trees at Kogo forest reserve, but higher than what Dikko (2012) found at Dabagi, who recorded H‘ value of 1.45 for trees which is very low. Shiva (2007) reported a diversity value of 2.20 to 2.50 at the Central Midhills of Nepal, which aligned with the findings of this work. Other findings such as Onyekwelu et al. (2007) recorded H‘ values of 3.12 and 3.31 at Oluwa and Queen‘s Forests, south-western Nigeria. The moderate diversity obtained at the parkland of Gwarzo showed that climate favors diversity and may be partly responsible for the diversity obtained in the area; this also confirmed that ecological factors dictate the distribution and abundance of species. Margurran (1988) described Evenness (EH) as a measure of Equitability of spread of available species. The regenerating species had a calculated evenness of 0.742, 0.879 and 0.9559 for Seedlings, Saplings and Trees respectively, which is higher than Kuwanka Banza Forest reserve (0.74) as recorded by Danjibo (2014), Dabagi (0.74) as recorded by Dikko (2012). This indicate that all the regeneration indicators are moderately distributed in the parklands, which may be due to less competition for space among the tree species considering the nature of the site. Aparajita (2007) described richness of species as the basic component of diversity of any community, the parklands of Gwarzo, had a species richness of 1.362, 1.020 and 0.691 for Seedlings, Saplings and Trees respectively which is low compared to 1.84 recorded by Bishir (2012) at Kogo forest reserve, 1.92, 1.85 and 2.16 found at Oluwa, Queen‘s and Elephant forests of the low land humid tropical rainforest region of Nigeria by Onyekwelu (2009). In a similar research conducted by Nuraddeen (2014) at the parklands of Katsina state, the species richness stood at 0.73 to 1.56. The differences may be as a result of the more favorable conditions of the tropical rainforest zone in comparison to the Sudan savanna zone, level of exploitation, adaptability of species, and preference by the exploiters. CONCLUSION It was concluded that the parkland was moderate in terms of tree species composition, and regeneration was poor as some species were endangered which may be due to over exploitation, climatic and or edaphic factors. The poor regeneration reported can be attributed to the low nutrient status of the soil in the area. This highlighted the need to draw an all inclusive integrated management approach that will bring back the diminishing tree resources in the area.
REFERENCES Aparajita, D. (2007) Patterns of Plant Species Diversity in the Forest Corridor of Rajaji–Corbett
National Parks, Uttaranchal, India. Current Science 92(1), 90-93. Bello, A.G., A.D Isah and B. Ahmad (2013) Tree species diversity analysis of Kogo forest reserve in
north western Nigeria. International journal of Plant, Animals and Environmental sciences 3(3); 189-196.
Bonkoungouet, E.G., D.Y. Alexandre, E.T. Ayuke., D. Depommier, P. Morant, and J.M. Ouadda (1994) Agroforestry parkland of the west African semi-arid Lands. Conclusions and recommendations of an international symposium ICRAF/SALWA, 25 – 27 October 993, Ouagadougou Burkina Faso pp. 18.
Causton, D. R. (1988) Introduction to Vegetation Analysis. Unwin Hyman Ltd. London. pp 342. Danjibo M. (2014) Assessment of floristic composition of Kuwanka Banza forest reserve kebbi
state, Nigeria. Unpublished Msc dissertation, Department of Forestry and Environment, Usmanu Danfodiyo University, Sokoto.

Dikko, A. A. (2012) Tree Species Density and Diversity Distribution in Dabagi Forest Reserve. Unpublished B. Forestry project, Department of Forestry and Fisheries, Usmanu Danfodio University, Sokoto pp. 27.
FAO (1997) ―Improving Agricultural Extension‖. A reference manual, Rome, Italy 1-9. Getachew, M. and A. Biruk (2014) Status of Native Woody Species Regeneration in the Plantation
Stands of Yeraba Priority State Forest, Amhara Region, Ethiopia Journal of Natural Sciences Research Vol.4, No.16.
Kano State Government (KSNG) (2014) Climate accessed on the 12/10/2014 from www.kano.gov.ng.
Kehinde, A.L., J.A. Akande, and E. Ntabe (2009) Forest stakeholder‘s awareness of reduced impact logging (RIL) in Nigeria and Cameroun. Journal of Horticulture and forestry Vol 1 (9) pp. 176-181 available online http.//www.academicjournal.org/jhf
Khumbongmayum A.D, M.L, Khan and R.S Tripathi (2006) Biodiversity conservation in sacred groves of Manipur, northeast India: population structure and regeneration status of woody species. Biodiversity and Conservation 15:2439–2456.
Margurran, A. E. (1988). Ecological Diversity and its Measurements, Croom, Helm.pp. 350. Mu‘azu, A. (2010). Woody Plant Genetic Resources of Kuyambana Forest Reserve Maru, Zamfara
State. Unpublished M Sc Dissertation, Department of Biological Sciences, Usmanu Danfodiyo University, Sokoto. pp. 64.
Nair, P.K.R (1985) Classification of Agroforestry systems. Agroforestry system 3:97-128. National Population Commission (2011) www.population.gov.org Retrieved 28/11/2014. Negi C.S and S. Nautiyal (2005) Phytosociological studies of a traditional reserve forest- Thal Ke
Dhar, Pithoragarh, Central Himalayas (India). Indian Forester 131: 519–534. Nuraddeen, A.M (2014) Girth class distribution analysis of some tree species in the parklands of
North-western Katsina state. International Journal of Current microbiology and applied Sciences 3(12): 183-188.
Okonkwo, M.C (2010) Analysis of Agroforestry practices in Katsina state, Nigeria. A PhD thesis (unpublished) in the Department of Geography and planning, faculty of Environmental science, University of Jos.
Rahman M.H, A.S.A Khan, B. Roy and M.J. Fardusi (2011) Assessment of natural regeneration status and diversity of tree species in the biodiversity conservation areas of Northeastern Bangladesh. Journal of Forestry Research 22: 551–559.
Onyekwelu, J. C., R. Mosandl, B. Stimm (2007) Tree Species Diversity and Soil Status of Two Natural Forest Ecosystems in Lowland Humid Tropical Rainforest Region of Nigeria. Conference on International Agricultural Research for Development (Tropentag 2007). pp. 4.
Shankar U. (2001) A case of high tree diversity in a sal (Shorea robusta)-dominated lowland forest of Eastern Himalaya: Floristic composition, regeneration and conservation. Current Science 81: 776–786.
Shiva S.P (2007) Tree species diversity in existing community based forest management systems in central mid-hills of Nepal. Msc thesis (International Master Programme), Swedish Biodiversity Center.
Shreekar P. and S.S Samant (2014) Diversity and regeneration status of tree species in Khokhan wildlife sanctuary, north-western Himalaya. Tropical Ecology 53(3): 317-331.

ENIRONMENTAL DEGRADATION AND DEVELOPMENT: AN ANALYSIS OF SOCIO-ECONOMIC IMPACT OF DESERTIFICATION IN NORTHERN NIGERIA
*Jacinta A. Opara; **Mohammed Babagana and **Abubakar Adamu *Dept of Biological and Environmental Sciences, Kampala International University, Kampala, Uganda.
**College of Agriculture, Gujba. Yobe State, Nigeria
ABSTRACT The study was conducted in the months of July- September, 2017 to assess the socio economic impacts of desertification on local communities in Yusufari Local area of Yobe State, Nigeria. A total of 286 respondents comprising of 280 Local community dwellers and 6 officials of the department of Agriculture and Forestry participated in the study. Descriptive survey method of research was employed using both qualitative and quantitative data. Study data was collected using closed ended self made questionnaire and structured Interview Guide. Statistical Package for Social Sciences (SPSS) Version 6 was also used to analyse data on respondents’ characteristics, socio economic impacts of desertification as well as respondents perception of control measures using descriptive statistics. Study findings revealed that married men constituted biggest portion of the respondents while illiterate crop and live stock farmers dominated the occupation groupings. Dominant tribes happened to be Kanuri followed by Fulani and Hausa. Social impacts of desertification were found to be numerous ranging from relocation of houses or whole settlements, a town called Kaska relocated 2 times in less than 30 years, drying up of sources of water, forced migrations as well as Sporadic conflicts and loss of biodiversity and soil erosion. Economically, the impacts manifested in the farm of loss of soil fertility, reduction in farmlands, grazing and fishing sites with resultant drop in crop yields and number of animals and deaths. Transportation was also found to be seriously affected. Similarly, the local people were found to be fully aware of the concept of desertification. and its impacts but did not stop acts of deforestation nor engaged in any tangible form of reforestation activities. Governments’ efforts towards combating the menace were not enough. Based on these findings and others not mentioned here, it was recommended that local people should be well enlightened on the impacts of desertification and government’s programmes to curb the menace, deforestation laws should be strictly adhered to, shelter beats and nursery plots should also be established and maintained. Key Words: Desertification, socio economic impacts, local communities, Yusufari
INTRODUCTION The United Nations defined desertification as the degradation of the soil, landscape and bio-productive terrestrial system, in arid, semi-arid and sub-humid areas, resulting from several factors, including climatic change and human activities (UNCED, 1992). It is a progressive loss of soil fertility through the destruction of the structures and composition of the soil, which does not permit good agricultural productions, or the existence of vegetation with varied natural species. Dry lands occur in all continents except the Antarctica and are very much susceptible to desertification. The end result of desertification is barren and unproductive land that cannot be used for crop and food production or other agricultural purposes, and has little biodiversity value (Chibueze, 2015). When desertification occurs, it manifests itself through soil erosion, water scarcity, reduced agricultural productivity, loss of vegetation cover and biodiversity, draught, poverty and migration.

132
The UN conference convened in Nairobi in 1977 distinguished four kinds of desertification according to their degrees of intensity (Alsaadamny and Amileegy, 2006). These include slight desertification, moderate desertification, severe desertification and very severe desertification. According to Nasiru (2007), desertification is caused by both natural and anthropogenic factors. The natural causes of desertification include the poor physical conditions of soil, vegetation, topography as well as inherent extreme climatic variability as evidenced in periodic draughts. Climatic variation is perhaps the important natural cause of desertification and draughts. The anthropogenic factors is mainly the destructions of the ecological system caused by poor land use and ever increasing pressure put upon on the available resources by the expanding population. More specifically, there are four primary anthropogenic causes, notably over exploitation and poor irrigation practices, and these are influenced by factors such as changes in population, climate and socio-economic conditions. Desertification is certainly one of the greatest ecological disasters in Nigeria with propensity to undermine the socio-economic development of the entire country. The problem which is much more palpable in the eleven frontline states of Adamawa, Bauchi, Borno, Gombe, Kano, Katsina, Kebbi, Jigawa, Sokoto, Zamfara and Yobe threatens the livelihoods of over 40 million people and engulfing about 2,168sq km of rangeland and cropland each year, obliterating human settlements, inducing forced migration, exacerbating rural poverty and social conflicts. Populations in these states are among the poorest and most vulnerable to climatic variability and land degradation (NAGGW, 2016). The consequences of desertification are far-reading and diverse. (Olagunju, 2015). All aspect of human lives is either directly or indirectly impacted wherever the phenomenon exists. It ranges from food insecurity and socio-economic hardship to political unrest. Specifically, impacts of desertification include alteration of ecosystem services locally and globally, loss of biodiversity, habitat loss, species endangerment, changes in hydrological and climatic cycle, reduced agricultural yields and socio-economic welfare (Olagunju, 2015). Migration has also been cited as one of the impacts of desertification by some scholars. Conclusively, desertification reduces soil fertility, particularly base cation content, organic matter count, pore space, and water retention capacity. It also reduces vegetation productivity leading to long term declines in agricultural yields, livestock yields, plant standing biomass and plant diversity. These changes reduce the ability of the land to support people, often sparking an exodus of rural people of the area to urban areas. Breaking the strong connection of the people to the land produces profound changes in social structures, cultural identity and political stability. BACKGROUND For many years, drought and desertification present inexorable challenges to sustainable development of the countries in Africa‘s Sahel – Savanah region where millions of people rely upon the land as a vital source of life. Not only is this natural asset the basis of food security and agricultural production, it also generate employment and mitigates social crisis for the region‘s most poverty stricken and vulnerable groups. About 83% of the rural Sub-Saharan people are dependent on land for their livelihoods, yet 40% of the land resources are presently degraded, driving poverty, hunger, unemployment, forced migration and conflicts, while exacerbating climate risks, particularly drought and flood (NAGGW, 2016). Desertification constitutes one of the international environmental problems whose global importance has been recognized by the international community. This importance is clearly visible in the massive endorsement that states have given to the UN convention to combat desertification in those countries experiencing serious drought and/or desertification, particularly in Africa adopted in 1994 (Nasiru, 2007). Desertification in Africa is a major cause and consequences of poverty and resources depletion, which threaten economic growth (UNESC,

133
2007). The extent and severity of desertification in Nigeria has not been fully established neither the rate of its progression properly documented (CCD, 1999). Nigeria is one of the countries in the south of Sahara faced with a rapid desert encouragement, with notable effects on the northern part of the country. Out of the 909,890Km2 of the country‘s land area, about 580,841Km2 accounting for 63.83% of the total land is impinged on by desertification (Olagunju, 2015). Desertification phenomenon has been reported in the northern Nigeria since 1920, but the impact has been more glaring since the famine of 1971 to 1973 in this part of the country (CCD, 1999). It is common knowledge that land degradation and desertification constitute major causes of forced human migration and environmental refugees, deadly conflicts over the use of dwindling natural resources, food insecurity and starvation, destruction of critical habitats and loss of biological diversity, socio economic instability and poverty and climatic variability through reduced carbon sequestration potential (UNESC, 2007). The impacts of drought and desertification are among the most costly events and processes in Africa. Drought for example led to the reduction in the GDP growth in Nigeria from 18.4% in 1971-1972 to 7.3% in 1972-1973 (Oladipo, 1993). Information is no doubt a key to combating drought and desertification. However, empirical evidence points to the fact that the way government has managed awareness creation on the twin menace in Nigeria especially in the north-east, has limited effect on the people as established in a study by Nkwocha (2017) which revealed that 61.5% of the respondents noted that government awareness activities in relation to programs on drought and desertification, does not get to them neither do they know about it. This supports the agreement of Olagunju (2015) that, government is yet to raise enough awareness on drought and desertification, which he further said will provide people with the understanding of the causes and consequences of the phenomena so as to stop all possible actions that encourage the situation thus prevent further degradation of the soil. According to Nkwocha (2017), the strategies so far adopted by government in combating drought and desertification have been more of rhetoric than reality and have a major defect in that they are not citizen oriented. STATEMENT OF THE PROBLEM Desertification constitutes one of the international environmental problems whose global importance has been recognized by the international community. Desertification in Africa is a major cause and consequences of poverty and resources depletion, which threaten economic growth (UNESC, 2007) Nigeria is a large country with a substantial part of its area extending in to the Sudano - Sahelian belt with an estimated population of 140 million; human pressure on land particularly in the marginal areas has continued to take its toll on the environment, resulting in desertification. Nigeria is one of the countries in the south of Sahara faced with a rapid desert encouragement, with notable effects on the northern part of the country. Out of the 909,890Km2 of the country‘s land area, about 580,841Km2. Desertification is made very severe in the dry lands of the country by increasing human attempts to exploit the resources of the ecological zone in the face of persistence drought (Nasiru, 2007). All aspect of human lives is either directly or indirectly impacted where ever the phenomenon exists. It ranges from ecological impacts, habitat destruction and loss of biodiversity, changes in penology, health impacts, heat waves, cancer, vector born disease, loss of plants of medical importance, geo-chemical impacts, global warming, increased erosion, hydrological impacts, reduced water supply, over exploitation of ground water, socio-economic impacts, reduced agricultural productivity and food insecurity, economic

134
loss and reduced economic growth, migration, resource use conflict and unemployment (Olagunju, 2015). Nigeria is presently losing about 351,000km2 of its land mass to the desert which is advancing south wards at the rate of 0.6km per year (Amadi, et. al., 2011). Desertification is not only preventable but reversible. It is the most important environmental problem, affecting fifteen northern states of Nigeria. Yobe state which is one of the worst affected states has about 48% of its land under siege from desert encouragement. (Amadi, et. al., 2011). Entire villages and major access roads are being threatened and buried under sand dunes in the northern portions of Yunusari and Machina Local Government Areas of Yobe state. Nevertheless, governments at all levels had come up with many strategies aimed at combating the menace of desertification in Nigeria such as awareness programmes on drought and desertification, yearly tree planting campaigns, community development programmes involving planting of trees, enforcement of laws restricting community dwellers from engaging in discriminate falling of trees and provision of irrigation dams for farmers and maintaining the dams for optimal use. Driven by the urgent desire to ensure sustainable development of the dry lands of Africa vulnerable to this irrepressible problems of desertification, the African Union (AU) in 2007 endorsed the Great Green Wall for the Sahara and the Sahel originally conceived by the former Nigerian president Olusegun Obasanjo as a strategy to tackle the detrimental social, economic and environmental impacts of desertification and land degradation in the region. However, despite all these efforts and those not mentioned here, the presence of desertification in this region and its resultant devastating impacts are still evident. It is in this light that, this research was conducted to study and establish the extent of the impacts of desertification on people‘s livelihoods in Yusufari L.G.A. of Yobe state.
MATERIALS AND METHODS The research which studied the socio economic impacts of desertification on local communities in Yusufari Local Government Area of Yobe state, Nigeria was conducted in the months of July – August 2017 in three settlements of Yusufari, Kaska, Sumbar, Gumshi and Tulu Tulo all in Yusufari L.G.A. Descriptive Survey method of research involving the use of both quantitative and qualitative data collection was used. A total of 286 respondents comprising of 280 local people and 6 officials of the Department of Agriculture and Forestry were selected using the Purposive, Snowball and Systematic Random sampling methods based on some inclusion criteria. Researcher made closed ended questionnaire was used to collect quantitative data while Interview Guide was also used to get some qualitative data. All data collected was analyzed using the Frequency, Percentage, Mean and Standard Deviation distribution tables. STUDY AREA Yusufari is a local government area in Yobe state, Nigeria at coordinates 130 04‘ 06‘‘ N 110 10‘ 33‘‘E / 13.068330 N 11.17580E. It shares borders in the north with the republic of Niger. It has a total area of 3,928km2 and a population of 111,086. The climate is characterized by short wet season (June-Aug) and a long dry season (Oct- May) with high temperatures throughout the year. Annual rainfall is usually very low while evapotranspiration is high. DATA ANALYSIS AND INTERPRETATION Demographic characteristics of the local people For better understanding of characteristics of the local communities living in the study area, demographic characteristic of the respondents who participated in the research study regarding

135
their gender, age, marital status, level of education, household size, occupation and tribe was captured as indicated in the table below. TABLE 1: Showing demographic characteristics of the local people
VARIABLES FREQUENCY PERCENT
GENDER
Male 263 92.0 Female 23 8.0 TOTAL 286 100.0
AGE
15-24 33 11.5 25-34 40 14.0 35-44 63 22.0 45-54 69 24.1 55-64 61 21.3 Above 65 20 7.0 TOTAL 286 100.0
MARITAL STATUS
Single 42 14.7
Married 223 78.0 Divorced 21 7.3 TOTAL 286 100.0
LEVEL OF EDUCATION
Arabic Education 152 53.1 Primary Certificate 79 27.6 Secondary Certificate 23 8.0 Diploma Certificate 22 7.7 Bachelors degree 10 3.5 TOTAL 286 100.0
HOUSEHOLD SIZE
1-5 29 10.1 6-10 199 69.6 11-15 38 13.3 16-20 17 5.9 Above 21 3 1.0 TOTAL 286 100.0
OCCUPATION
Crop farming 98 34.3 Livestock farming 70 24.5 Fishing 11 3.8 Trading 23 8.0

136
Transportation 36 12.6 Irrigation 24 8.4 Fuel wood harvesting 24 8.4 Others 6 2.1 TOTAL 286 100.0
TRIBE
Kanuri 168 58.7 Fulani 70 24.5 Hausa 37 12.9 Bade 7 2.4 Others 4 1.4 TOTAL 286 100.0
Demographically, male were found to be the majority (92.0%) while age groups of 35-54 years were also the majority (46.1%). Married men and women were also the dominant respondents (78.0%) and those respondents without any form of western education also occupied the largest portion of the respondents (53.1%). Similarly, crop farming, livestock farming and transportation were found to be the dominant occupations of the local people represented by 34.3%, 24.55 and 12.6% respectively while household sizes of the respondents were also found to be relatively large ranging from 6-15 family members (82.9%) and unsurprisingly, Kanuri tribe was also the dominant ethnic group (58.7%) followed by Fulani, Hausa, and Bade represented by 24.5%, 12.9% and 2.4% respectively. Other tribes were also represented by 1.4%. TABLE 3: Showing social impacts of desertification
S/N QUESTIONS 4 3 2 1 MEAN STD
SID1 Desertification leads to destruction and relocation of houses
73 (25.5)
169 (59,1)
37 (12.9)
7 (2.4) 3.68 .692
SID2 Sometimes whole settlements relocate as a result of desertification
95 (33.2)
126 (44.1)
56 (19.6)
9 (3.1) 3.07 .807
SID3 Conflicts among people do occur as a result of desertification
188 (65.7)
90 (31.5)
8 (2.8)
0 (0) 3.63 .539
SID4 Desertification affects soil fertility
175 (61.2)
111 (38.8)
0 (0) 0 (0) 3.61 .488
SID5 Farming and grazing activities are also affected by desertification
136 (47.6)
141 (49.3)
9 (3.1) 0 (0) 3.44 .558
SID6 Desertification leads to drying up of sources of water
89 (31.1)
176 (61.5)
11 (3.8)
10 (3.5)
3.20 .671

137
SID7 As a result of desertification
loss of biodiversity is experienced
68 (23.8)
105 (36.7)
98 (34.3)
15 (5.2)
2.79 .865
SID8 Desertification induced problems lead to overall reduced quality of life among people
144 (50.3)
138 (48.3)
4 (1.4) 0 (0) 3.49 .528
SID9 Desertification leads to migration of people from the area
86 (30.07)
146 (51.04)
39 (13.64)
15 (5.24)
3.02 .778
SID10 Increase in soil erosion is noticed in recent years
99 (34.61)
177 (61.89)
10 (3.50)
0 (0) 3.45 .535
OVERALL AVERAGE 117 (40.95)
133 (46.70)
29 (10.18)
6 (2.18)
3.33 .661
The Table above shows responses of the respondents with respects to social impacts of desertification in the study location where 88.46% agreed that these impacts of desertification in the area are far reaching and the situation is very bad (mean value 3.33, std .661). These social impacts manifest in form of destruction and relocation of houses and even whole settlements, conflicts among people especially farmers and herdsmen, loss of soil fertility, diminishing grazing fields, drying up of sources of water such as ponds, loss of biodiversity, increased soil erosion and overall reduced quality of life among the local people. TABLE 4: Showing economic impacts of desertification
S/N QUESTIONS
4 3 2 1 MEAN STD
EID1 Loss of soil fertility and reduction in farmland sizes as a result of desertification leads to drop in crop yields
276 (96.5)
10 (3.5)
0 (0) 0 (0) 3.87 .184
EID2 Reduction in sources of water has affected fishing activities
196 (68.5)
86 (30.1)
4 (1.4) 0 (0) 3.67 .499
EID3 Transportation activities are affected with resultant hike in transport fares
82 (28.67)
162 (56.64)
28 (9.79)
14 (4.90)
3.09 .756
EID4 Generally, prices of goods have increased as a result of hike in transport fares
72 (25.2)
96 (33.6)
97 (33.9)
21 (7.3)
2.77 .912
EID5 All other businesses are as well affected as a result of the many
85 (29.72)
132 (46.15)
47 (16.43)
22 (7.69)
2.98 .878

138
desertification induced problems
EID6 Desertification leads to decrease in number of animals reared and death
70 924.5)
162 (56.6)
32 (11.2)
22 (7.7)
3.14 .766
EID7 Desertification induced poverty leads to people engaging in environmentally devastating activities such as fuel wood harvesting
100 (35.0)
153 (53.5)
22 (7.7)
11 (3.8)
3.20 .738
EID8 There is general decrease in people‘s overall incomes as a result of loss of sources of livelihoods caused by desertification
276 (96.5)
6 (2.1) 4 (1.4) 0 (0) 3.95 .273
EID9 Considerable drop in the amount of rainfall has been noticed in recent years
98 (34.27)
143 (50.0)
31 (10.84)
14 (4.90)
3.73 .755
OVERALL AVERAGE 141 (49.3)
88 (30.9)
41 (14.6)
15 (5.2)
3.25 .647
Quantitative data on economic impacts of desertification in the study location was captured Using a questionnaire and the responses indicated in the table above were gathered. From the Table it can be seen that majority of the respondents 80.2% (mean value 3.25, std .647 agreed that the economic impacts of desertification on the local communities are diverse and the situation is very bad. According the responses, these impacts are manifested in form of drop in crop yields, adverse effects on fishing activities and transportation activities, hike in transport fares, increase in prices of goods generally, direct or indirect impacts on many other businesses, reduction in number of animals or even death, complete loss of sources of livelihoods, considerable drop in the amount of rainfall as well as overall low income among the people. TABLE 5: Showing perceptions of the local communities on control measures against desertification
S/N QUESTIONS
4 3 2 1 MEAN STD
CMD1 Local people are not aware of the impacts of desertification on their lives and the community
21 (7.3) 52 (18.2) 112 (39.2)
101 (35.3)
1.98 .912
CMD2 Local people have not stopped all deforestation acts to stop desertification
98 (34.3)
127 (44.4)
39 (13.6)
22 (7.7) 3.05 .887
CMD3 Local people do not 171 38 (13.3) 65 12 (4.2) 3.29 .956

139
engage in reforestation activities to combat desertification
(59.8) (22.7)
CMD4 Efforts of government and other stakeholders towards combating desertification are not enough
107 (37.4)
166 (58.0)
9 (3.1) 4 (1.4) 3.31 .603
CMD5 Governments do not intervene in ameliorating the socio economic impacts of desertification on the local people
83 (29.0)
159 (55.6)
29 (10.1)
15 (5.2) 3.08 .772
OVERALL AVERAGE 94(32.9) 108(37.8) 51(17.8) 31(10.8) 2.94 .826
The Table above shows responses of the respondents on the issue of controlling the menace of desertification and its impacts in the area. About 74.5% of the respondents agreed that the local communities are very well aware of the adverse impacts of desertification on their livelihoods and the community while another 78.7% of them also agreed that the local people despite being aware of the impacts of desertification have not stopped all acts of deforestation such as felling down of trees for different purposes. Similarly, 73.1% of the respondents did also agree that the local communities do not engage in any reforestation activities such as planting of trees to minimize desertification whereas 95.4% and 84.6% did also strongly agree that efforts of the government and other stakeholders in combating desertification as well as government‘s intervention in ameliorating the economic impacts of desertification on the local communities are not something to write home about. DISCUSSIONS Demographically, characteristics of the local communities were found to be diverse in terms of tribe and occupations. Male respondents were found to constitute about 92% while only 8.0% were females. It is a known fact that, tradition of the study area and that of most parts of Yobe state in particular and northern Nigeria in general confines women to homes responsible only for household activities such as cooking, fetching water and firewood but do not engage in strenuous economic activities. However, they sometimes help their husbands and parents in such activities. Thus, the high number of male respondents portrayed by this study can be well attributed to this fact. Similarly, married men were also found to be the dominant respondents as well (78.0%). In the same spirit, one of the traditions of the Kanuri ethnic group who are the dominant tribe in the study location, force young men and girls to marry at tender ages of 25 and 15 years; a reason good enough to explain why majority of the respondents were married. Most importantly, Omolehin et. al., (2007), reported that married men are more conscious of the need to get better livelihood so that they could meet their family food needs. Agricultural practices in the rural areas is mostly associated with the married individuals and it is also likely that they engaged their family members in farming activities and hence making farm work relatively simple in operation (Jamala et al., 2013). In the aspect of education, 53% of the respondents had tertiary education, while 16.8% had secondary education, 13.3% non formal education, 3.3% of the Overwhelmingly, it was discovered by this study that the local communities lack the basic western education needed for efficient development because, more than 53% of the local people
140
were found to possess only Arabic education meaning, they can only read and write the holy Qur‘an while only 35.1% claimed to have primary and secondary education certificates. However, Steian (2003) pointed out that education is one of the important human capitals which play important roles in determining status in society. Education is expected not only to contribute to people‘s ability to read and understand instructions but also help them to adopt new techniques. According to Amaza and Tashikalma (2003), the literacy level of farmers is important as it determines the rate of adoption of improved technology for increased productivity. Also, Adekunle (2009) pointed out that the level of education of farmers will directly affects their ability to adapt to change and to accept new ideas. Besides, household sizes were also found to be relatively big majority of whom range between 6-15 family members (82.9%). With respect to their occupations, the local people were found to crop and livestock farmers represented by 34.3% and 24.5% respectively who mainly illiterates were managing to survive amidst hard biting impacts of desertification. The literacy level of farmers is important as it determines the rate of adoption of improved technology for increased productivity. Adekunle (2009) pointed out that the level of education of farmers will directly affects their ability to adapt to change and to accept new ideas. Unsurprisingly, it was also discovered that majority of the local people were from the Kanuri tribe (58.7%) followed by the Fulanis (24.5%) and the Hausas (12.9%). Yobe state is a predominantly Kanuri state living as the majority ethnic group in 9 out of the 17 Local Government Areas of the state. SOCIAL IMPACTS According to the findings of this study, social impacts of desertification on the local communities were diverse and far reaching (87.65%, mean value 3.06 and std .661) where 84.6% of the respondents agreed that it led to destruction of many houses or even relocation to other places. According to the local people, as a result of desertification, the soil becomes so loose thereby rendering it so vulnerable to gully erosion which led to destruction of houses during the rainy season. Sometimes whole settlements relocate to other villages or form new settlements in places felt to be better (77.3%). The intricate linkage of soil degradation, agricultural production, food security and poverty, many household members may as a consequence of desertification leave their homes and seek to supplement the income of their families through cash remittances. Other may even be uprooted with their whole families and decide to migrate in order to survive. In fact, it is one of the key findings of the Millennium Assessment that recurring drought and land degradation are predominant factors in the movement of people from dry-land to other area (Bauer, 2007). It was so alarming to discover that desertification forced the whole town of Kaska, one of the study areas to relocate entirely for two times in the last thirty years; meaning, in the next 9 years, the town will have to relocate again if measures are not taken. Such migrations are necessitated because when land becomes uneconomic to farm, people are often forced into internal or cross-border migration. In some countries, land degradation has led to massive internal migrations, forcing whole villages to flee their farms for already overcrowded cities. Fifty million people are at risk of displacement in the next ten years if desertification is not checked (UNU 2007). Migration impacts on family life leads to separation of families-wives and children and ultimately the destruction of family patterns (Oladipo, 1993) as women, children and the elderly ones are often left with the burden of agricultural activities. However, the story from Gumshi town was quite an encouraging one. Bulk of those respondents who disagreed with majority of the facts presented in the questionnaire was from this town. In Gumshi town, most of the problems associated with desertification were found to be very much relatively less in comparison to other towns. Vast areas used as grazing fields and farmlands were still obtained with good number of farmers engaged in both crop and livestock farming. In fact, the town was considered by farmers

141
as the heaven of Yusufari L.G.A. where large numbers of nomadic herdsmen coming from neighbouring states converge to graze their animals. The only problem which the respondents complained of was that of shortage of drinking water which they attributed to the rocky nature of the area. Furthermore, overwhelming majority of the respondents agreed that the social impacts of desertification in the area manifest itself in recurrent conflicts among different people or communities, loss of soil fertility, decrease in grazing activities as a result of loss of many grazing fields, drying up of water sources upon which many of the local communities depend on for drinking water, loss of biodiversity as well as overall reduced quality of life among the local people. Like all major ecological changes, desertification may have impacts at three levels; on- site, off -site and global. On-site impact related to change in: Plant growth (reduction of primary production), animal life (reduction of livestock, wild animal) as well as surface deposits (soil erosion, loss organic matter). Off-site impacts are also many and varied including: surface deposits that are transported through water and wind erosion and pile sediment on downstream site of productive lands ,road and water reservoirs, suspended particulates (dust) that affect the health of livestock and people which also reduce visibility, salinized surfaces of deserted irrigated fields become sources of salt particles and may be wind –carried to other productive lands as well as forced movement of people who have to leave the land because their life – support system has deteriorated. According to the UNEP's assessment (1992) 1.9 million ha of irrigated crop land (or 18% of the total area), 48.86 million ha of rain-fed crop lands (or 61% of the total area) and 995.08 million ha of rangeland (or 74% of the total area). On global scale the impact of desertification relate to its effects on world food producing capacity, world biodiversity and world climate. (Kassas et al., 1991). On global scale the impact of desertification relate to its effects on world food producing capacity, world biodiversity and world climate (Kassas et al., 1991). In addition, land degradation in the dry lands can have direct consequences on the water cycle. If there is low rainfall, drought ensues: groundwater reserves do not refill, water sources become depleted , wells run dry, plants and animals die and humans have to migrate to more hospitable regions. Desertification translates into a spiral of declining production, increasing poverty and diminished potential productivity. Desertification and resources scarcity can provoke social unrest and political and armed conflict .Several governments, have been swept from power by the suffering and unrest associated with drought and famine. (Darkoh, 1998). According to UNESCO (2007), the consequences of desertification on human populations are diverse and include: the growth of poverty and dependence, socio-economic development in disequilibrium as well as rural populations often lose their possessions during severe drought. ECONOMIC IMPACTS Economically, responses of the respondents indicated that the impacts of desertification on the local communities are biting hard on them. Many studies have confirmed that usually, the majority of people who are directly affected by desertification live below poverty line and without adequate access to fresh water. Poverty drives populations to over-exploit the remaining natural resources, triggering a vicious cycle of accelerating land degradation and greater poverty. Poverty is thus both a cause and a consequence of desertification. More than three quarter of the respondents 85.85% (mean value 3.33, std .626) agreed that the situation in respect of economic impacts of desertification in Yusufari was too bad where 84.6% agreed that it led to significant drop in crop yield as a result of loss of soil fertility and reduction in farmlands, decrease in fishing activities as a result of drying up of water sources such as ponds 77.3%, hike in transport fares as a result of decreased transportation activities 85.31%, decrease in other businesses 75.87%, decrease in amount of rainfall as well as increase in prices of general commodities

142
58.8%. According to Mortimore (1989) desertification and drought were responsible for the rapid increase in prices indices of food stuff and other non oil export. The importance of rainfall for agriculture, especially small holder agriculture, cannot be over emphasized as its variability and scarcity affects sharply the yields and livelihood of farmers. In fact, transportation was one of the hardest hit aspects of the communities‘ livelihood by impacts of desertification. Despite its importance and necessity for both social and economic development of an area, tarred roads cannot be constructed in many parts of Yusufari L.G.A. and where they are available; they have been covered by sand dunes making movement by vehicles to other places very difficult or even impossible. Thus, only certain types of vehicles such as Four Wheel Drives, Range Rovers, Land Rovers, Jeeps and one other vehicle popularly called ―ECOMOG‘ were used by those who could afford them and for commercial purposes while the majority poor people resort to the use of animals such as camels, horses and donkeys for long distant movements. Hence, transport fares are so exorbitant to the extent that many local people cannot afford. In a similar study conducted by Nwokoacha (2017), it was revealed that desertification affected people‘s livelihoods, there was reductions in the amount of rainfall received each year, there was increase in temperature, and drying of water bodies. Diverse response was also obtained concerning the impact of desertification on farmer‘s agricultural activities include poor bumper harvest, increase in wind erosion, decrease in the availability of pasture for livestock, as well as drastic reduction in soil fertility. The Sahel desertification has brought an alarming drop in agricultural production: millet, sorghum and ground-nut harvests have been critically low in Mali since 1970 drought. Production has dropped by 50 -80 % compared to the situation in 1930 and loss per year in income is estimated at US$ 5.7 million .In Senegal, ground-nut production has fallen to 800 kg per hectare since 1991, In many parts of Africa, desertification induces hunger related disasters are still recorded. In eastern Africa , some 13 million people still rely on food assistance because of the lingering effects of last year drought , coupled with conflict in some parts , the situation is particularly severe in Eritrea , Ethiopia , Kenya and Sudan , where drought have sharply reduced food production and killed large number of livestock. (FAO, 2001). Most worrisome is the possibility that climate change is expected to increase frequency, duration and severity of droughts in many parts of the world. Such changing conditions add to already stressing land use globally and especially in the world‘s fragile dry lands. This may lead to an accelerated rate of land degradation and desertification which, in turn, is likely to increase poverty. According to the UNEP's assessment (1992), 1.9 million ha of irrigated crop land (or 18% of the total area), 48.86 million ha of rain-fed crop lands (or 61% of the total area) and 995.08 million ha of rangeland (or 74% of the total area) in Africa are affected by desertification at moderate or higher level .Three distinct areas of the continent are at most-risk; the Mediterranean Africa, the Sudano-sahelian region and Kalahari-Namibian region in the southern Africa. One third of Africa is affected by desertification and 73% of the total agriculturally used dry land is degraded. Recurrent drought is a fact of life throughout dry land of Africa; virtually every year there is drought in some part of the continent majorly affecting large portions of dry lands. Such disasters occurred in 1968-73, 1982-85 and 1990-91 causing many countries of Africa to experience substantial food shortage. With each drought cycle, desertification increases (Darkoh, 1998). Nigeria the most populous black nation of the world is losing 1,355 square miles of cropland and rangelands due to desertification each year. This problem affects each of the 11 states of the northern Nigeria. Nigeria loses approximately 320,000-351,000 hectares of land per year, which causes mass displacement of local communities in the North. At least 35 million people are

143
facing threat of hunger and economic problems due to present scale of desertification. Shehu (2014) laments that the worst hit by this situation are some states in the North-East. The situation in Yobe State indicates that, productive and mass land occupied by the dunes in the state has increased from 25000 hectares to more than 30,000 hectares with its attendant negative impact on food and livestock production. More than five million livestock in Yobe State are under serious threat due to the deterioration of pastures occasioned by seasonal droughts and desert encroachment. A report by Adamawa State Ministry of Agriculture in 1994 indicated that more than 15,000 hectares of land in the state suffered from serious desertification related problems. RESPONDENTS’ PERCEPTION ON CONTROL MEASURES AGAINST DESERTIFICATION With respect to perception of the concept of desertification, its impacts as well as its control measures in the study area, majority of the respondents (74.5%) agreed that they are fully aware of what desertification stands for and its negative consequences as it affects their lives and the environment but unfortunately, they also agreed that they have not stopped all forms of deforestation such as fuel wood harvesting, over grazing etc (78.7%). Considerable number of the respondents (73.1%) did also agree that the local communities do not engage in any tangible reforestation activities in order to stop desertification except that some few local people do plant trees which usually die off as a result of insufficient water and high ambient temperatures. Besides, the local communities do not in any way agree that desertification can be caused by anthropogenic factors but instead, attributed it in whole to the will of nature. Similarly, with regards to governments‘ efforts towards combating desertification and ameliorating its adverse impacts on the local communities, majority of the respondents 95.4% and 84.6% agreed that the efforts of governments at all levels as well as that of other stakeholders towards combating desertification in the area are nothing to write home about and that the governments do not make any sort of intervention with the aim of ameliorating the social and economic hardships caused by desertification on the local communities in spite the fact that uncountable number of the local people especially crop and livestock farmers had totally lost their sources of livelihoods or have migrated to other better places within or outside Yobe state. However, it was discovered that governments do embark on certain programmes such as tree planting campaigns in many rural areas prone to desertification, establishment of shelter belts as well as organization of progarammes aimed at raising local people‘s awareness on the concept of desertification and its impacts and enlightening them on simple control measures. Furthermore, though they did agree that they do not engage in any serious control measures against desertification, the local people believe that aforestation and sustained irrigation fields are two good strategies for combating desertification. Establishment and maintenance of shelter belts was also believed to reduce the impact of desertification in the study area. Perhaps, the local people‘s lukewarm attitude towards reforestation activities could be because the government has not massively engaged them on being aware of government programs on drought and desertification thus, the inability of the people benefiting from such program or being able to ask questions when necessary actions are needed contributed to their negative attitudes. According to Olagunju (2015), government is yet to raise enough awareness on drought and desertification, which he further said will provide people with the understanding of the causes and consequences of the phenomena so as to stop all possible actions that encourage the situation thus prevent further degradation of the soil. However, yearly tree planting campaigning which was employed by many vulnerable states to combat desertification especially in the north-east Nigeria that was very active some years back, has now been reduced to mere verbal political statements. Even when the trees are planted, they
144
immediately die off due to poor maintenance culture. According to Nwokoacha (2017), in the absence of replacement for trees cut-down either officially approved by the forestry authorities or indiscriminate actions of the citizens, the activities of government at combating drought and desertification will obviously appear ridiculous. From the foregoing it is evident that the trees that are meant to protect the zone from the scourge of drought and desertification is not properly managed. Thus when there is no concerted effort at replacement of the trees or better still proactive action to keep at planting in other to beef up the environment against. The activities of the drought and desertification would rather be encouraged. Makinde (2005) submitted that communication is an essential ingredient for effective implementation of public policy. If awareness is not properly created on the activities of government, how then will the farmers get to know and be part of the tree planting exercise? This again can aid indiscriminate falling of the trees since the people are not involved. Meanwhile, Nwokoacha (2017), stated that to effective and efficient control measures in combating desertification, the following factors must be considered; awareness of drought and desertification or the programs of government, host community‘s involvement in the tree planting exercise of government and awareness on laws prohibiting the cutting down of trees CONCLUSION In conclusion, this study was able to discover that demographically, characteristics of the local communities were diverse in terms of tribe and occupations. Able young married men were found to constitute the biggest portion of the respondents and majority of whom were engaged in occupations that were in one way or the other related to the environment or people‘s livelihoods. Overwhelmingly, it was discovered that the local communities lack the basic western education needed for efficient development which could enable them secure white collar jobs elsewhere so had to cling to cling to the few occupations having very good environmental inclination such as farming, fuel wood harvesting and selling, fishing and so on. Evidently, the socio economic impacts of desertification in all the study locations with the exception of Gumshi were found to be high. Thus, with the unprecedented increase in the rate of deforestation activities such as logging coupled with the non chalet attitudes of the local communities towards controlling desertification and its impacts, continuous deforestation acts by the local people, lukewarm attitudes of the Government, increasing over dependence of the local communities on fire wood as the dominant source of domestic energy as well as the growing dependence of considerable number of the local communities on fire wood selling as a source of income, desertification can continue taking toll in these areas and its impacts both socially and economically can escalate. Consequently, all other businesses including farming, fishing, grazing and transportation can be seriously affected and their sustainability can be threatened. Such a situation can force the mainly poor and illiterate local people to further engage in more environmentally devastating activates or even migrate to other places in search of livelihoods. RECOMMENDATIONS Based on the findings made by this study, the following recommendations are hereby proffered:
1. Many of the areas being threatened by desertification are mostly inhabited by poor rural communities who depend largely on the soil resources as their source of livelihoods and the increasing impacts of desertification further deteriorates resourcefulness of the land resources hence, resulting in diverse socio economic impacts. Thus, the first step in combating these adverse phenomena is to highly enlighten the local communities on the adverse impacts of desertification on the environment as well as their livelihoods. This can then be followed by: Hence,
2. Rural communities should be actively involved in any government or other stakeholders sponsored programmes to combat desertification.
145
3. Local farmers should be discouraged from environmentally devastating activities such as overgrazing, fuel wood harvesting and bush burning all of which contribute to desertification.
4. Agricultural Extension workers should be massively deployed to rural areas prone to desertification to train farmers on how to improve their activities amidst desertification induced problems.
5. Government should employ massive and effective programmes to combat the menace of desertification in all vulnerable areas such as the establishment of shelter belts, tree planting campaigns, establishment of vast sustainable irrigation fields etc.
6. Government should imbibe the spirit of proper maintenance culture in respect of all established desertification control programmes such as shelter belts and tree plantings.
7. Established deforestation laws should be made well known to the people and strictly adhered to.
8. Fuel wood harvesting especially in areas prone to desertification should be discouraged by the provision of more job opportunities as well as other sources of fuel such as kerosene.
9. Bore holes and other stable sources of potable water supply as well as other necessary infrastructure should be made available in all areas affected by desertification in oder to ease their social sufferings
10. Rural people‘s productivity should be boosted by the government through financial assistance such as the provision of soft loans and acquisition of entrepreneurial skills like welding, carpentry, tailoring etc.
11. Most importantly, ecological Funds being allocated to all desertification prone states by the Federal Government of Nigeria should be judiciously used mainly for the purpose it is meant.
REFERENCES
Adekunle, V.A.(2009).Contribution of agro forestry practices in Ondo state, Nigeria to environmental sustainability and sustainable agricultural production. Afrikas, vol. 22, Nr. 2. Pp 27-40 Alsaaday, A. and Almileegy, T. (2006). Environmental problem, its Nature, Causes and Impacts. Publishing House for New Books. Cairo. Pp 174. Amadi, D. C. A., Nwagboso, N.K., Kwaga, B.T. and Akosin, C. (2011). Human Copping
Strategies to Desertification in Yobe State, Nigeria. Animal Research International 8 (3): 1439-1444.
Bauer, S. (2007). Land and water scarcity as drivers of migration and conflicts. Agricultural and rural development Bulletin 1. Chibueze, N. (2015).Effects of Desertification on Environmental Management in Northern Nigeria. Arabian Journal of Business and Management Review (Nigerian Chapter) Vol. 3, No 6. Combating Desertification and Mitigating the Effects of Drought in Nigeria (1999).National on the
implementation of United Nation‘s Convention to Combat Desertification in those Countries Experiencing Serious Drought and/or Desertification, Particularly in Africa (CCD) for submission at the Third Session of the Conference of the Parties, Recife, Brazil.
Darkoh, M.B.K. (1998). The nature, causes and consequences of desertification in dry lands of Africa. Land degradation and development bulletin 9, 1-20. FAO (2001). Food, agriculture and rural development: current and emerging issues for economic analysis and
policy research. Edited by Kostas, G., Stamonlis, Rome, Italy. Hamza, A.M. (1999). Socioeconomic impacts of drought and desertification on the livelihood on farmers and pastoralists in El Duiem locality, White Nile state, Sudan.

146
Jamala, G.Y., Mada, D.A., Abraham, P. and Joel, L. (2013). Socio-economic impacts of desertification in rural livelihoods in Ganye Southeastern Adamawa state, Nigeria. IOSR jour. of envir. Scie.toxicology and food techn.. Vol. 7, 3 pp 26-31 Kassas, M., Ahmed, Y.J. and Rozana, B. (1991). Desertification and drought: An ecological analysis. Desertification Control Bulletin. Makinde, T. (2005) Problems of policy implementation in developing nations. .Jour. of Soci. Sci. 11: 63-69. Nasiru, I. M. (2007). Desertification in the Dry lands of Nigeria and its Consequences.Seminar paper, Department of Urban Planning, Faculty of Built Environment, University Teknollogi Malaysia. National Agency for the Great Green Wall (2016). Combatting desertification in Nigeria. Report. National Population Commission of Nigeria [NPC], ―2006 Facts and Figures,‖ 2010. www.Population.gov.ng/factsandfigures2006 Nwokocha C. O. (2017). An Appraisal of the Strategies Implored by Government to Combating Drought and Desertification in the North-East Geo-Political Zone, 2004-2014. Review Pub Administration Manag 5: 205. doi:10.4172/2315-7844.1000205 Oladipo, E.O., (1993). A Comprehensive approach to drought and desertification in Northern
Nigeria. Nat. Hazards 8 (3): 234-261. Olagunju, T. E. (2015).Drought, desertification and the Nigerian environment: A review Journal of Ecology and the National Environment. Vol.7 (7). Pp 196-209. UNCCD (2011). Desertification: A visual synthesis. GRAPHI 4 press, Bresson, France. Pp 1-52. UNCCD (1992). Earth Submit 92. London Regency press. UNCED (1992). Managing fragile ecosystems: Combating Desertification and Drought (Agenda 21,
Chapter 12).United Nations Conference on Environment and Development, (UNCED). Rio de Janeiro, Brazil.
UNEP (1992). UN Future- Desertification, the problem that won‘t go. UNEP, Nairobi. United Nations Economic and Social Council UNESCO (2007). Africa Review Report on Drought and Desertification. Fifth meeting of the Africa committee on sustainable development ( ACSD-5). Regional Implementation Meeting (RIM) for CSD-16. Addis Ababa.

147
SOCIAL ISSUES AND ENVIRONMENTAL POLICIES
IN EKITI STATE,NIGERIA
Daramola, C.O and Emua Charles, I
Department of Social Studies,
College of Education,
Ikere-Ekiti,Nigeria
Abstract
A social issue is a problem that influences a considerable number of individuals within a society. It is often the
consequence of factors extending beyond an individual's control, and is the source of a conflicting opinion on the
grounds of what is perceived as a morally just personal life or societal order. In combating the social problems in the
society and maintenance of sustainable development, Ekiti State government enact series of environmental policies
and bills ranging from; terrorism Act, Ekiti State Economic Crime Commission, Anti-Kidnapping Law and
The Secret Cult (Abolition and Prohibition) (Amendment) Bill, 2017 among others.
Keywords: Social Issues, Environmental Policies and Sustainable Development in Ekiti State.
Introduction It is evident that the primary purpose of Social Studies is to help young people make
informed and reasoned decisions for the public good as citizens of culturally diverse society in an interdependent world (Nzegbulem, 2014). According to Ikem (2014), social Studies equip the learners with values, attitudes and skills to become functional citizens, who are nationally conscious and responsive to their country‘s challenges. It imparts civic education, human relations education, environmental education, technological education, socio-cultural education amongst others. The essence of social studies is to expand the knowledge capability of the learners locally, nationally and at the global level. Social Studies goal is to develop civilized and patriotic citizens. (Esu, 2012)
The development of a State depends on many factors out of which social issues took a significant position. Social issue is a problem that influences a considerable number of the individuals within a society. It is any general behavior or condition that is prevalent among the majority in a particular society and has a negative effect on the society beyond what is seen as moral and just acceptable. Social problems include problems that reduce the standard of living beyond an acceptable level. It is often the consequence of factors extending beyond an individual's control, and is the source of a conflicting opinion on the grounds of what is perceived as a morally just personal life or societal order. While environmental policies are policies that guided human activities towards promoting hazard like climate change, deforestation, water scarcity, decreasing biodiversity and erosion etc. which are global problems. As declared by the United Nations, it is our global responsibility ―to promote harmony with nature and the Earth to achieve a just balance among the economic, social and environmental needs of present and future generations of humanity.
Observation has shown that many developed countries of the world have experienced rapid and dramatic changes in their economic, social and political spheres. Despite the wide diversity among these countries, a few general trends can be observed. Globalization has swept across these countries, bringing intensive economic interactions, with a strong commitment to international business expansion and industrialization. Adequate attentions were given to unemployed youths. Industrialization and urbanization have had a major impact on demographics, family structures and normative frameworks. These were missing in African
148
nations most especially Nigeria where social issues like poverty, corruption, inequality, terrorism, high level of child mortality, unemployment and poor education is more alarming.
Environmental and social issues can have significant impacts on the development and sustenance of the society. The government of Ekiti State in the course of finding solutions to social issues that is gradually denying her citizenry of peaceful coexistence and benefit of political dividends, introduced environmental policies that would assist in curbing some social issues in the state.
Environmental policy impacts on society in different ways while social issues affect environmental quality. In a modern society like Nigeria, many contemporary social problems have emerged which are against the norms, morals and ethics of our society and of course make life very unbearable. Such problems include our deviance behaviour toward the commandments of God e.g. as in our struggle for the control of available scarce resources wrongly and violently. This in turn creates problems in the society especially among the have and the have not.
The contemporary problems under consideration include insecurity and insurgencies, poverty, corruption, inequality, drug abuse, kidnapping and cultism among others and their impact on the environmental policies in Ekiti State.
● Corruption: A high level of corruption has broken down a system meant to function and unify us as one. The corruption we are talking about here is not just the one practiced in the governance. Corruption in Nigeria is very visible at every level, from the intricate part of the government to the corners of the street.
● Inequality: It is another major societal problem in Nigeria. Equality is not necessarily when people are equal in all things. However, in our society, the concept of inequality is open wound in so many areas like ethnic, gender inequality and inequality based on societal class, all these constituted a serious social problem in our society.
● Poverty: More than seventy percent of Nigerians are living in poverty. Most Nigerians cannot afford to eat three good meals in a day. For some to eat at least one is a big problem. Let's not even mention being able to live in good condition and in a healthy environment. This is the root of more societal problems like crimes, diseases, high mortality rate, and other major issues.
● Insecurity and insurgencies: Also, there is a high level of insecurity in Nigeria. There are different insurgencies found in the country like the Boko Haram insurgency, Fulani insurgency, militancy, widespread kidnappings, and many others. All these have a serious negative impact on living conditions in the society. People live in fear due to the destruction of lives and properties among other things.
In view of the negative consequences of these social problems, the government of Ekiti State introduced some environmental and social policies that were targeted towards eradication and reduction of the identified social problems within it populace. Some of these policies include:
i. Terrorism Act:
ii. Ekiti State Economic Crime Commission
iii. Anti-Kidnapping Law
iv. The Secret Cult (Abolition and Prohibition) (Amendment) Bill, 2017 among
others
Governor of Ekiti State, Mr. Ayodele Fayose, signing into law the ―Anti-Grazing Bill 2016. The law specifies areas in each local government area of the state where herdsmen could graze their cattle. It specifies time when such grazing would cease. Anyone caught grazing on portions of land or any farmland not allotted by government shall be apprehended and made to face the law. Any herdsman caught with firearms and any weapons whatsoever during grazing shall be charged with terrorism. Any cattle confiscated shall be taken to government cattle ranch at Erifun and Iworoko Ekiti community in the state.

149
On February 1, 2018, Gov. Ayodele Fayose push bill for the establishment of Ekiti Economic Crimes Commission (EECC). The bill which is titled, Ekiti State Economic and Financial Crimes Commission (Establishment) Bill 2018, seeks to provide for the creation of a commission that will serve as a watch dog to financial administration in the state, investigate and prosecute corrupt financial crimes
The Ekiti State House of Assembly on 08 November 2017 passed a law The Secret Cult (Abolition and Prohibition) (Amendment) Bill, 2017 prescribing death penalty for anyone found guilty of engaging in cultism and reviewed upward punishments for those who aid and abet the crime.
All the aforementioned bills were hoped to put an end to various social menaces in the society most especially within the territorial landscape of Ekiti State. Conclusion and Recommendation In building a crime free society, it is paramount that the citizens of the state must be guided by various policies that could ensure safety of lives and properties. This has led to the establishment of various environmental policies most especially in Ekiti State to combat social problems and enhance good governance. It is thus recommended that other states of the federation should emulate Ekiti State by enacting environmental laws that will reduce if not totally eradicate most social issues in the country so that the aim of peaceful coexistence among the people could be maintained.
REFERENCES
Esu, A.E.O. (2012). Paradigm shift for repositioning social studies education challenges in Nigeria. Nigeria Journal of Social Studies, 15(2). 42-53.
Ikem, K. (2014). Teaching social studies in secondary schools through the use of dynamic approach. Nigerian Journal of Social Studies and Civic Education, 6(1), 165-180.
Nzegbulem, P.S.C. (2014). Meaning and goals of social studies and its relationship with the social sciences. IMSU Journal of Social Science Education, 12(6), 83-99.

150
SPATIAL AND ECONOMIC DIMENSION OF LIVESTOCK PASTURING ON RURAL LIVELIHOODS AND BIODIVERSITY ALONG THE RIPARIAN
VEGETATION OF RIVER BENUE IN NORTHERN NIGERIA
Jacinta A. Opara; Madube Tumba Kwabe and Nuwe John Bosco Department of Biological and Environmental Sciences
Kampala International University Kampala-Uganda
ABSTRACT The study investigated into the spatial and socio economic consequences of grazing in the riparian on the livelihood of the community along river Benue in Adamawa state Nigeria. Survey design was used and involved 232 respondents selected randomly from the communities along the riparian areas. Data were collected using the researcher made questionnaire, descriptive statistics and Pearson’s correlation were used to analyze data. The findings revealed a strong negative relationship at (r = 0.852, p < 0.05), conclusively indicate negative implication on the sustainability of socio-economic activities among communities along river Benue. The study revealed economic effects of grazing as; decrease in habitat and fish productivity, decrease in wild foods and medicinal plants, cultural and recreational potentials among others. Social effects include deteriorating quality of sanitation, poor quality of life and increase in communicable diseases among others. Study further revealed variation in the socio-economic effects of grazing on the livelihoods amidst community in the upper and lower section of the riparian Findings revealed that communities along the lower section of the riparian has more severe weight of both social and economic effects compare to the upper section of the riparian. Study recommends Federal, State government agencies in alliance with traditional authorities and community base organizations; should use research institutions, and universities to push for research projects to educate the society towards having a healthy riparian. Enhance strategies and application of national ranch grazing system which will help in the rehabilitation of the upland vegetation, safeguarding the riparian for a better ecological services.
Keywords: Grazing, Effects, Socio-Economic, Riparian Livelihood, Community Introduction
Grazing abounds across the world with differences in effects due to variation in climate and culturally conceptualization of grazing management strategies by communities. Regardless of the conceptualization of grazing management strategies, grazing still seems to be the most disastrous action where uncontrolled or unregulated practices exist. Upland vegetation grazing is as old as crop cultivation among most of the communities in Nigeria, especially among communities in the savanna region of North Eastern Nigeria, where unguided open cattle grazing has caused a serious problem of overgrazing (Adefioye, 2013). However, prior the post-independent era, grazing activities was not common along the riparian due to limited economic, technological adaptation and prevalence of tsetse fly(Adefioye,2013). Although riparian grazing seems to be a recent development however, it seems to be more disastrous and devastating across Africa countries, especially in Nigeria along the riparian of river Benue
Grazing effects is identified to be the potential influence of livestock grazing on environment in various ways such as; defoliation, trampling and browsing on plants (Zoheir,2011). Such processes lead to redistribution of nutrients, redistribution of plant seeds by passive transportation and by other propagules. Livestock management have been and still a huge source of livelihood for a large percentage of both rural and urban dwellers in Nigeria (Oyinloye,2011). Like in the pre-settlement time, grazing is mostly traditionally managed in Nigeria with variation in the practices limited to communities or regions.

151
The interplay between livestock grazing and sustainability of riparian vegetation has long been established as conflicting, due to their interdependence and vulnerability. These are resources of critical values to the survival of the biodiversity and the society, such resources needs to be managed harmoniously to avoid conflicting situations. Regardless of the improvements in economic, technology adaptation, however, traditional ways or methods of grazing is still in use in the north east of Nigeria among communities and the nomadic pastoralists. It is indeed a serious concern to the communities of the Savanna region of Nigeria, where livestock grazing has caused a serious problem of overgrazing (Adefioye,2013; Blench,2010).
Before the improvement in Nigeria economic, technology adaptation and population growth, riparian vegetation was well developed with stable vegetation heterogeneity which were wide stable across the country (Blench, 1999; Onoaha,2008). Also, prior post-independence the profound influence of grazing was associated with terrestrial vegetation (Aremu & Onadeko, 2010). Prior policy of breakoff of land and individual ownership of 1861 of the colonial masters, every tribe and community in Nigeria has its own customary laws safe guarding the natural resources o both terrestrial and aquatic environmental resources (Meagher and Yunusa,2012) As policies determined land ownership to the community, clan and family because, every community in Nigeria has its own customary policies used in safe guarding land and other natural resources (Meagher & Yunusa, 2012).
The riparian vegetation conditions were then in good conditions and stable with efficient ecological services, which were relatively free from human activities especially grazing. The vegetation community was wide matured with standard succession level which provided to the community‘s efficient ranges of non-farming social and economic opportunities (Olaotswe, et al., 2013). Grazing drifted into the riparian areas at the post independent period due to the exhausted conditions of the terrestrial vegetation, and the demands for animal protein requirements of the teeming population.it is becoming more intensified and devastating in the riparian, which is alarming and regrettable (Adefioye, 2013). Subsequently, uncontrolled grazing has become a serious problem in the riparian, the farming and non-farming opportunities along the riparian on which most of the community‘s livelihood dependence are degraded and vanished (Meagher and Yunusa, 2012). The uncontrolled grazing along the riparian is a serious threat to the riparian vegetation and the livelihood of the community, due to the vanishing of the non-farming economic activities along the riparian. This study sought to investigate into the effects of unregulated grazing activities on the socio-economic livelihoods of people living along the riparian of river Benue in Adamawa state, Nigeria.
Literature Review
Capper, (2013) focused on the importance of livestock and its wide range of undesirable direct environmental impacts upon the quality of plants, water and biodiversity. The major environmental impact of livestock on plant community, land, water and biodiversity conservation are found where production systems are not well managed. There has been much speculation around the impact of increasing livestock production on the environment, as global livestock demand increases to meet the increasing population demands.it is often seen as a potential danger to plant community (IFAD, 2013; Scholtz.et al,.2013).
Livestock is the major floristic users (Herrero et al. 2013; Nyariki et al., 2009). According to Seré (2012), livestock systems occupy 45 percent of the earth‘s surface. This is not surprising as 70 percent of the agricultural land in South Africa is utilized by livestock as such, most of the valley species are dominated by exotic or invasive plant that are of less value, (Meissner et al., 2013); 75 percent of land in Namibia is used for extensive livestock ranching (Lange et al, 2011); cattle production alone occupies 75 million hectares in Northern Australia (Macleod et al., 2014).

152
However, livestock production is generally assumed to be adversely affected by land degradation, which eventually reflects on the economic performance (Macleod et al., 2014).
Poor management of livestock grazing is evident of overgrazing leading to overstocking beyond the lands‘ carrying capacities, which exposes pastureland and riparian loss of vegetation. Macleod et al., (2014) examined the productivity of livestock under different grazing regimes; they found that changes in plants and land conditions had both positive and negative effects on livestock production. The link between vegetation condition, livestock grazing and economic outcomes was determined using a combination of experimental data and simulating models. It was established that as plants and land conditions deteriorate, reduction in livestock numbers was warranted Meissner. et al., (2014). Extreme cases of poor floristic and land conditions with high livestock numbers resulted in poor livestock performance, with poor market value and hence low profitability. This is mostly common with the dry season because of lack of water and grass in the highland area.
However, economic activities such as fishing, farming, weaving, hunting, transportation (navigation), among others are the common effects of overgrazing along the riparian (Adefioye,2013). The communities living along river Benue are mixed-up with reasonable number of Nomadic and Agro-pastoralists who keep large herds of cattle and some few goats and sheep, which has serious negative implications on the non-farm activities‘ (Meagher and Yunusa,2012).
Grazing as one of the most dominant economic activities has resulted in degradation of vegetation, land and water over the years, which impacted negatively, the non-farming and farming economic and social opportunities along the riparian (Adefioye,2013 and Blench, 2010).
Furthermore, due to the nomadic lifestyle and struggle for control of riparian resources conflicts have become the norm due to limited grazing areas. Lives, property and animals have been lost in these conflicts over the years and little is been done by the local, State and Federal authorities (Linus. et al., 2014)
Methodology
The riparian areas along the river Benue starting from Lamurde and the areas below the joining of river Gongola a tributary, extending up to Fufore in the upstream in Adamawa State is the study site. The study adopted quantitative and qualitative approaches, as cross- sectional descriptive survey was used. Random simple sampling and stratified sampling were used in identifying the categories of sample population along the riparian. Study sample size was derived from five selected categories base on the nature and structure of the communities. It comprised of (1), River basin development authority (65), (2), Adamawa state environmental management agency (55), (3) Community based organizations (36), (4), Non-governmental Organisations (12), and (5) Local community members (382). Thus; a representative sample of 232 respondents from target population of 550 was attained.
The study used questionnaire to cover the objective of the research, there were questions on the social effects of grazing as well as economic effects of grazing on the livelihoods of the riparian communities along river Benue. Descriptive statistics, inferential statistics were used in consistence with research design. Statistical Package for Social Sciences (SPSS 23) and Excel were used for data analysis. Quantitative data were coded, descriptive statistics such as frequency, and percentages, Pearson‘s correlation was used to determine relationship. Tables, charts and figures were used in presenting the analyzed data.

153
Research findings:
Social effect of grazing on the communities along riparian area
Figure 1: Social effects of grazing on the community along the riparian
Figure 1 findings indicate that grazing affects the social functions of the communities along the riparian of the river Benue. Poor quality of life among the community was advanced by the respondents to be the most severe by 67 percent. With 65 percent, destruction of water source by the cattle constitute a major problem as advanced by the respondents. Limited access to safe and clean water was rated 60 percent by the respondents as a serious grazing effect. Poor health quality among the communities is 56 percent above average as advanced by the respondents. Others are; poor sanitation or sanitary condition among the community as advanced by the respondents to be 53 percent. The respondents also advanced that due to grazing, there is increase in communicable diseases which they rated as 53 percent and finally, insecurity was identified and advanced by the respondents as one of the social challenges, rate 40 percent. However, it is one of the most difficult challenges. Differences in social effects of grazing amidst the communities
40%
65%
53% 56%
52%
60%
67%
Increase in
insecurity
Destruction of
water source
Increase poor
sanitation
Increase in
poor health
quality
Increase in
communicable
diseases
Limited
access to safe
and clean
water
Increase poor
quality of life
Percentage

154
Figure 2: Differences in social effects of grazing amidst the communities
Figure 2, findings, identified difference in the social effects of grazing amidst the communities along the riparian area. Results clearly indicate that there is a great variation in the social consequences of grazing amidst the communities. The lower section of the riparian has more severe weight of the effects compares to the upper section of the riparian. Demsa is mostly affected with 17.8 percent of asperity of all the challenges, followed by Lamurde area as 15.8 percent crabbiness of the effects and Numan areas with 15 percent tartness to the prevalence respectively. In the upper section, Yola South is most affected by 15 percent sourness of the challenges, Fufore 13.4 percent astringency of the effect on community and Girei with 12.7 percent experiences of challenges bitterness to the actuality of effects and Yola North with 9.9 percent less experiences of challenges severity. The economic effects of grazing on community livelihood along the riparian of river Benue
Figure 3: Economic effects of grazing on communities along riparian area
Figure 3, findings indicate that grazing has economic backlash on the communities along the riparian area. Most common and severe of the effects that are upsetting the communities include inter Lia; decrease in wild foods (fruits/vegetable) and medicinal plants, destruction of habitat and Fishery productivity, and decrease in the navigability of riparian water for transportation and other functions. The destruction of habitat and decrease in fish productivity was advanced by the respondents to be 65 percent. Decline in wild foods (e.g. Hack berry, Anacardium occidentale) and
13,4% 15,4%
9,9% 12,7%
17,8% 15,0% 15,8%
0,0%
5,0%
10,0%
15,0%
20,0%
FUFORE YOLA SOUTH YOLA NORTH GIREI DEMSA NUMAN LAMURDE
Percentage
Percentage
62% 65%
53% 50%
60%
68%
53%
River navigabilityaffected
Habitat /fishproductivity
affected
Upseteducattional
potentials
Irrigationaffected
Recreationalactivities/tourism
affected
wild foods/medicinal plants
affected
decline incultural /spiritual
enrichment
Percentage

155
medicinal plants (Leonurus sibiricus, lactuca salinga) is most affect by grazing as rated 68 percent by the respondents. Decrease in the navigability level of riparian water is one of the severe challenges, rated 62 percent by the respondents. Also affirmed by the respondents‘ is the destruction or upsetting of educational potential of the riparian resources advance to be 53 percent. Others which are not compromising are; destruction of recreational activities 60 percent, decline in irrigation 50 percent and finally the destruction of spiritual and cultural enrichment of the riparian vegetation 53 percent as advanced by the respondents respectively. Differences in the economic effects of grazing amidst the communities along the riparian
Figure 4: Differences in the economic effects of grazing amidst the communities
Figure 4 findings indicate that there is a great difference in the economic consequences of grazing amidst the communities along river Benue, communities in the lower section of the riparian are more affected than those in the upper section. Demsa is most affected with 17 percent astringency; followed by Lamurde 15 percent asperity and Numan 14.5 percent bitter experience. In the upper section of the riparian, Girei is most affected with 14 percent severity, while Yola North 12 percent sourness, Yola South 13.2 percent asperity and Fufore within the range of 14.3 percent of the challenges astringency respectively. Relationship between grazing and socio economic livelihoods of the communities Table 2 Pearson correlation analysis of socio-economic effects of grazing on the communities‘ livelihoods
Social economic effects of grazing
People's Overall livelihood
Social economic effects of grazing
Pearson Correlation 1 .852* Sig. (2-tailed) .000 N 230 230
Deterioration in People's livelihood
Pearson Correlation .852* 1 Sig. (2-tailed) .000 N 230 230
According to the analyzed result of Pearson correlation there exists a strong negative relationship at (r=0.852*, p<0.05) between livestock grazing and the socio-economic values of riparian vegetation and the livelihoods of the community. That grazing has negative implications on the sustainability of socio-economic activities among the communities along riparian of river Benue. This signifies that the various socio economic effects of grazing like poor navigability, fishing, poor quality of life, insecurity and wild foods harvesting have a profound effect on the overall livelihood of the riparian communities. Consequently, the result indicates that, as grazing
14,3% 13,2%
12,0%
14,0%
17,0%
14,5% 15,0%
0,0%
2,0%
4,0%
6,0%
8,0%
10,0%
12,0%
14,0%
16,0%
18,0%
FUFORE YOLA SOUTH YOLA NORTH GIREI DEMSA NUMAN LAMURDE
Percentage
Percentage

156
increases in the riparian, there is more deterioration of the socio-economic activities and livelihoods of the communities along the riparian area.
The most affected valuable riparian economic plant species
Findings indicate that riparian supply variety of non-timber and bio-fuel products of significant to the riparian community livelihood economy. These products in addition to the wild foods, include handicrafts made from riparian floristic species, largely by sailors and children which support significantly source of household income.
Consequently, grazing has affected some economic plant species such as hackberry and cashew apple, produced naturally by cashew tree (Anacardium occidentale). Nigerian leafy vegetables such as Wild Lettuce locally known as (Efo Yarin –Yoruba) and Crassocephalum rubens locally known as the (Yoruban bologi Ebolo) were also affected. Some of these considerable plants include; Vernonia amygdalina the Edo call it oriwo; Hausa, chusar doki (a horsetonic food containing the leaves), fatefate/mayemaye (a food prepared from the leaves); Ibibio atidot; Igbo, onugbu; Tiv, ityuna; and Yoruba, ewuro. Moringa oleifera, Garcinia kola, and Anacardium occidentale. One of the economic trees along the riparian is Anacardium occidentale, the tree is not native of the riparian plant forms but one of the several valuable trees introduced by the communities to the riparian environment due to its economic and medicinal values. Hackberries one of the native tree found commonly on river terraces and flood plain in Lamurde, Demsa and Dong, Vunoklong, Geriyo, jobwuloyo, and Damare along the riparian. Is one of the useful economic plant used for fruits and juice by the children herding along the riparian, also picked for sale (to earn money) most especially by school age children.
Wild lettuce, this plant species is one of the lettuce genus family such as;( lactuca virosa, lactuca salinga and leonurus sibiricus) they are native of the riparian used as food and medicinal herbs for centuries in the area. Some of these lettuce species (e.g. lactuca virosa and lactuca salinga) are very palatable for human and animals. There are found along the riparian but with variation in species kind influenced by soil type and nutrients, the palatable species are more in the non-grazed site of the study area.
Crassocephalum rubens (the Yoruban bologi Ebolo), is one of the crassocephalum genus family members include rag leaf, thickhead and he bologi. There are several in the vegetal family which are edible and consumed by many tribes across Africa. There are native of the riparian species, some like Crassocephalum crepidiodes and mannii are shrubs which are ornamental and toxic used as medicinal. Crassocephalu genus family is one of the most economic species in herbs and shrubs forms that every community value it and as such can be a source of conflicts amidst grazing herds and human beings. Vernonia amygdalina a native plant of the riparian species a member of the Asteraceae family a small shrub of different class grows mostly on sandy soil of riparian stream bank it looks like the drumstick (Moringa oleifera). It is one of the most economic plants in the riparian use for vegetable soup and medicinal herbs like the Moringa oleifera. It is mostly found in the non-grazed areas as it is one of the palatable species sensitive to grazing, it is found in a scattered residual patches along the grazed site of the riparian.

157
Discussion The social and economic consequences of grazing on the livelihood of the riparian community was determine through respondents‘ opinion, which were analyzed using descriptive techniques simultaneously with the correlation techniques. The descriptive analysis was on both social and economic effects.
The work found that the social effects commonly cited by the respondents included; prevalence of insecurity, increased risks of contracting communicable diseases, destruction of water source for drinking. Others are increased poor health quality due to flood and open defecation by herdsmen, and limited access to safe / clean drinking water. In other words, by degrading water supplies and reducing the health of riparian habitat, livestock fragment landscape-level connections. They also damage the connection between natural and human communities, since degraded streams and plant community reduce the potential for recreational, fishing, swimming and boating in the area. Degrade riparian vegetation influence precipitation amount, provide less water for reservoirs, as well damage coastal sporting and fishing festival are some of the social implications of grazing, being experience by the communities (Linus, et al., 2014).
Some of the social implications with less prevalence in the communities as affirmed by the respondents are: poor sanitation, and poor quality market, school and sports infrastructures due to the insecurity and destructions of social amenities. Effects of intensive grazing in riparian is not only on the plant community resources, but it creates conflicts between the communities and herdsmen which generate huge social implications (Meagher and Yunusa, 2012; Linus. et al., 2014). There is a great variation in the social effects across the communities along the river Benue, communities along the lower section of riparian are mostly faced with severe social problem. The effect is more disastrous in Demsa which has the highest percentage, followed by Numan and Lamurde respectively. Categorically, settlements are rural in these communities with most of their social livelihood activities rely heavily on the riparian along the river.
The study found that the most common economic effects biting livelihood of the communities, accepted by the respondents included among others; destruction of fish habitat and decrease in fish productivity and wild life which is another source of protein for the community.
Destruction of recreational potentials such like pools and ponds, boating and sand mining. Others are; decline in eco-tourism activities, destruction of medicinal plants and the decline in navigability of the river which affected transport business, practices of herbal medicine and even vegetable.
Livestock grazing can affect the riparian environment by changing and reducing vegetation or by actual elimination of riparian areas by channel widening, channel aggradation, or lowering of the water table through plant degradation (Macleod. et al., 2014). Along the riparian the communities, the most apparent effects are on fish habitat due to vegetation degradation which reduces shade cover, and influx of food supply. Others are resultant increases in stream temperature, decline in wild fruits along stream, decrease of debris cover through plants degradation. The result complement the study of Armour. et al., (2011), that stream-channel vegetation degradation has long been recognized as a major watershed-fisheries problem, not only to fisheries but it is even general to ecological services. The elimination of stream bank vegetation due to acute livestock grazing is a serious negative development to all vegetative dependent riparian components. In the grazed site of the riparian, stream banks eroded because livestock congregate along streams for shade, succulent riparian vegetation and drinking water. The collapse of overhanging banks due to livestock grazing is one of the principal factors contributing to the decline of native trout in the Western Australia (Jansen and Robertson, 2012).

158
Furthermore, the importance of riparian vegetation to the life support function begins in the aquatic communities of headwater streams and rivers. Studies have linked the importance of riparian plant cover to fish populations. McIntosh. et al., (2013), for example, found that populations of brown trout (Salmo trutta) were reduced by 27 per cent when riparian vegetation was removed by grazing cattle.
Waterholes are often favoured locations for camping, picnicking, swimming and fishing. These values can be lessened by reduced fish populations, loss of aesthetic appeal, poorer water quality, increased weeds and reduced number of shady trees and native couch grass on riverbanks. The water quality of the water holes may also exceed Nigeria health guidelines for secondary contact (e.g., swimming), especially with regard to indicators such as faecal coliforms deposits by stocks which encourages predominance of algae invasive.
The descriptive simple percentages explanation of the respondents responds and the correlation statistical analysis were simultaneously used to determine the relationship, between grazing consequences and the degrading socio-economic activities on community livelihood. The coefficient results of person correlation indicate that there was association between the grazing socio-economic effect and livelihood of the communities along the river. The high and significant Pearson correlation coefficient provides sufficient evidence for the research null
hypothesis rejection. The P-value ( . was significantly lower than the . significance level Table 8.
The high and significant Pearson correlation coefficient analysis provides sufficient evidence for the rejection of the Null hypothesis, which states that there is no socio- economic effect of grazing in the riparian along river Benue. The p- value calculated at, (P=0.000) is significantly lower than (r=0.852) at(α=0.05) significance level, Pearson correlation state that, when P-value calculated is less than critical level of significance, Ho, should be rejected. Conclusively, the P-value (0.000) is less than α=0.05, therefore, Null hypothesis is rejected in favor of the alternative. Grazing affects the socio economic activities and the livelihoods of the communities along the riparian of river Benue.
Conclusion
Livestock grazing has affected the riparian environment by changing and reducing vegetation of riparian areas by channel widening, channel aggradation, or lowering of the water table. Nevertheless, the adoptability and utilization of modern grazing management strategies are lacking in Adamawa State. The sustainability of the riparian areas is a serious environmental issue due to the presences of the local open and unregulated traditional grazing method. In proper grazing along the riparian has damaged the riparian vegetation which inversely damaged other vital components of the system. The degraded plant community reduce the potential for recreational, fishing and swimming among others in the area. Therefore, social and economic consequences of grazing on the livelihood of the riparian community include; non-farm and farm activities. This damaged the connection between natural resources and human communities, it also generated conflicts among herdsmen and the communities.
Recommendations
From the findings of the study there is no attempt made on policy implementation, and other measure towards conserving the riparian vegetation. The study therefore, recommends that, Adamawa State Government Agencies in alliances with traditional and community Association, should empower public and private universities like American University of Nigeria (AUN), to

159
push for research projects to educate the society towards: understanding that, having a healthy riparian ecology is a strong mitigation measure against climate change impingement.
Government at both Federal, State, Community leaders and Community Base Organisations should revegetate the riparian with reasonable plant species of riparian character.
Traditional rulers, Community Organizations, Institutions, individuals and government agencies should employ the use of modern grazing management practices, to help prevent or minimize the negative effects of livestock grazing in riparian.
Federal, State government and Community leaders should cooperate and provide reasonable land for establishment of ranches to control unregulated open grazing. References
Adefioye S.A. (2013). Analysis of land Use/ Land cover pattern along the River Benue channel in Adamawa State, Nigeria: Academic Journal of interdisciplinary studies, 2(5) MSCER –CEMAS.
Armour, C.L., Duff, D.A., & Elmore, W. (2011). The Effects of Livestock Grazing on Riparian and Stream Ecosystems. Journal of fisheries, 16 (1); 7-11.
Aremu, O.T., Onadeko, S.A., & Inah, E.I. (2010). Impact of Grazing on Forage Quantity and Quality for Ungulates of Kainji Lake National Park Nigeria, Journal of Applied Sciences, (1)-1800-1804. Blench, R. (2010), The transformation of conflicts between the Pastoralists and cultivators in Nigeria DFID.
Blench, R. (2010), The transformation of conflicts between the Pastoralists and cultivators in Nigeria DFID.
Bradford, M., & Ernest, S. (2013). Current usage of symbiosis and associated terminology. International Journal of Biology, 5 (1): 1-32. doi:10.5539/ijb. v5n1p32.
Capper, J.L. (2013). Should we reject animal source foods to save the planet? A review of the sustainability of global livestock production. South African Journal of Animal Science, 43(3), 233-246.
Charles, K. (2010). A Negotiated Frame works for Rehabilitation of Riparian Zones in Nairobi City: Available from http:/iso carp net/data/case-studies/1780.Pdf.
Dossely, M., Vidon, P., Garwick, N, P., Allen, G. J., Dural. T. P., & Lawrence, R. (2010). The role of Riparian Vegetation in protecting and improving chemical water quality in stream, Journal of America water Resources Association, 40, 260.
FAO (2009). The state of food and Agricultural Livestock in the Balance: Food and Agricultural organization of united Nation, Publication.
Gunderson, D.R. (1968). Floodplain use related to stream morphology and fish populations. J. ld.]. Manage. 32 (2), 507-514.
Herrero, M., Grace, D., Nsuki, J., Johnson, N., Enahoro, D., Silvestri, S. and Rufino, M.C. (2013). The role of livestock in developing countries. International Journal of Animal Bioscience, 7:3-18.

160
Hogan C. (2013 Benue River, Retrieved on 29th, December, 2016; from http://www.eoearth.org/view/article/228342.
International Fund for Agricultural Development (IFAD) (2013). Smallholders, food security, and the environment, IFAD publishers, Rome.
Jansen, A., & Robertson, A.I. (2012). Grazing, ecological condition and biodiversity in riparian river red gum forests in south-eastern Australia ‗, Proceedings of the Royal Society of Victoria, 117 (1), 85–95.
Lange, G., Barnes, J. and Motinga, D. (2011). Cattle numbers, biomass, production and land degradation in the commercial farming sector of Namibia. Development Solutions Africa, 15(4), 555.
Linus B. G., Amos, S. O., Michael, E. T., & Ensenga, G.M. (2014). Fishing Communities and Fishing as livelihoods in Adamawa state. Direct Research. Journal of agriculture and food sciences, 2 (11); 154 -204.
Macleod, N.D., Ash, A.J., & McIvor, J.G. (2014). An economic assessment of the impact of grazing land condition on livestock performance in tropical woodlands. Rangel Journal, 26(1), 49-71.
Meagher, F., & Yunusa, K. (2012). If the drumming change, the dance also changes deagrarianisaion and rural non- farm employment in the Nigerian Savanna African studies center, Leiden.
Meissner, H., Scholtz, M., & Palmer, A. (2013). Sustainability of the South African livestock sector towards 2050. Part 1: worth and impact of the sector. South African Journal of Animal Science, 43(3), 282-297.
Nyariki, D.M., Mwang‘ombe, A.W., & Thompson, D.M. (2009). Land-use change and livestock production challenges in an integrated system: The Masai-Mara ecosystem, Kenya. Journal of Human Ecology, 26(3), 163-173.
Olaotswe, E.K., Witness, M., & Barbra A.H. (2013). Grazing management system and their effects on savanna eco system dynamics: A Review journal of ecology and the natural Environmental, 5 (16); 3-64.
Onouha F. C. (2008). Saving Africa Shrinking lakes through inter- basin water transfer reflections on the proposal Lake Chad replenishment project. Nigeria journal of international Affairs, 34 (2); 34-45.
Oyinloye M., & Kufoniyi, A. (2011). Analysis of land use, land cover and Urban Expansion in Akure, Nigeria. Journal of innovative Research in Engineering and science, 2 (4).
Sarr, D., Knapp, R.A., Owens, J., Balser, T., & Dudley, T. (2009). Ecosystem recovery from livestock grazing in the southern Sierra Nevada. Aldo Leopold Wilderness. Res. Insti., Missoula, MT.

161
Scholtz, M.M., Van Ryssen, J.B.J., Meissner, H.H., & Laker, M.C. (2013). A South African perspective on livestock production in relation to greenhouse gases and water usage. South African Journal of Animal Science, 43(3), 1-9.
Zhou, S. (2012). Effects of wilderness training giant pandas? Grazing and artificial harvesting on clone population biomass of umbrella bamboo. Chinese Journal of Applied and Environmental Biology. 18 (1):1-18.
Zoheir, A. (2011). Livestock grazing and riparian areas: A Literature Review. Grazing and Pasture Technology Program.
162
A STUDY OF MULTI-ANNUAL VARIABILITY OF EFFECTIVE SUNSHINE DURATION IN NIGERIA AND ITS IMPLICATIONS FOR
CLIMATE FORCING AND AIR QUALITY
Solomon O. Amadi1 and Sunday O. Udo2 1Department of Physics, Geology & Geophysics, Federal University Ndufu-Alike Ikwo, Nigeria.
2Department of Physics, University of Calabar, Cross River State, Nigeria.
Abstract
Air quality is influenced by weather and climate and is sensitive to climate change. Some studies have provided the relationships of this climate effect through correlation of air quality with meteorological parameters. The aim of this study is to draw attention to global dimming and its implications for some Nigerian cities. The study analysed the interannual variations of sunshine duration, both as a meteorological variable and as an excellent proxy for global solar radiation, in 20 Nigerian cities. The sunshine duration data were accessed from the Nigerian Meteorological Agency, Oshodi, Lagos Nigeria for the period 1961-2012. Data were analysed using descriptive statistics, Mann-Kendall’s test, least squares regression, time series and R programming language. The results show that the mean annual daily sunshine hours show latitudinal and elevation dependence whereas the coefficients of variation do not exhibit latitudinal dependence. The Mann-Kendall’s trend test and the student’s t- test results indicate that 15 stations have decreasing trends with 9 stations showing significant trends at the 1% and 5% levels. 5 stations indicate increasing trends with 3 having significant trends at the 1% and 5% levels. The time series plots provide an elaborate year- to- year fluctuations with trend lines that depict the overall linear trends over the period to complement the Mann-Kendall’s test and the least squares regression results. The results have strong implications for climate forcing and air quality which are discussed. It is recommended that efforts to curb air pollution should be executed under a common framework with efforts to reduce greenhouse gases in view of prevailing realities.
Key Words: Sunshine duration, Multiannual variability, Implication, Air quality, Climate change, Nigeria.
1.0 Introduction
The earth‘s atmosphere comprises gases, particles and clouds confined in a thin column surrounding the earth. This thin column plays host to billions of tons of pollutants that inadvertently modify the atmosphere. These pollutants originate from fossil fuel combustion for domestic and industrial energy needs and transportation, bush burning, volcanoes, soil dust and sea salts. The ultimate by-product of all forms of combustion is carbon dioxide, a greenhouse gas. Products of incomplete combustion such as carbon monoxide and nitrogen oxides react with other gaseous species such as sulphur dioxide, methane and non-methane volatile organic compounds (NMVOCs) present in the atmosphere. According to Ramanathan and Feng (2009), the cumulative effect of these reactions is to produce ozone, another greenhouse gas. Greenhouse gases are agents of global warming and climate change.
Within the last few decades, there have been detected considerable changes in the physical climate system at global, regional and local scales. Changes in climate affect air quality by perturbing some processes and mechanisms such as ventilation rates, precipitation scavenging (wet deposition), dry deposition, chemical production and destruction rates etc. The changes in some climate variables such as cloud cover, sunshine duration and solar flux at the earth‘s surface have made it imperative to explore the variability of these climate parameters over different spatial and temporal scales.

163
It has been reported that the network of stations taking measurements of solar radiation are few in Nigeria (Chineke, 2007) in Obiekezie (2009). Stanhill and Cohen (2008) identified sunshine duration as an excellent proxy for solar radiation. In the light of this, the study is undertaken to explore the spatio-temporal variability of effective sunshine duration in Nigeria, both as a meteorological element and as a reliable proxy measure for solar radiation. This element has a bearing on cloudiness, aerosols and other atmospheric pollutants that have tendency for air quality modifications and climate forcings. According to Sanchez-Lorenzo et al (2009), sunshine duration is the amount of time, expressed in hours, that direct solar radiation exceeds the threshold value of 120 Wm-2.
It is solar energy that drives life on earth and sustains air, water and carbon cycle. Solar dimming (decrease in solar irradiance) observed over many regions around the globe cannot be explained on the basis of variation of the sun‘s radiative output (Forkel et al, 2006). McGregor and Nieuwolt (1998) reported that variations in the solar constant resulting from changes in the solar activity rarely exceeds 2% of the average value, and can be disregarded in climatology. These variations in sunshine hours are a consequence of changing atmospheric transmittance as a result of accumulation of anthropogenic aerosols (Norris and Wild, 2007). Aerosols promote scattering and absorption of solar radiation and also produce brighter clouds that are less efficient at forming and releasing precipitation (Ramanathan and Feng, 2009). This causes considerable reductions in the amount of solar radiation intercepted at the earth‘s surface, an increase in atmospheric solar heating, alterations in the atmospheric thermal structure, induced surface cooling, perturbation of regional circulation system, rainfall suppression, slowing down of hydrological cycle, decrease in evaporation and less efficient removal of pollutants by wet deposition. Stanhill (2005) reported that even though the reason for the reduction in global irradiance is not fully understood and could not be explained quantitatively yet, the most likely reason is change in the transparency of the earth‘s atmosphere. Stanhill (2005) posited that decreased atmospheric transmissivity could result from changes in the short-wave radiative properties of the sky and the clouds, as well as increased cloud cover. These changes could probably be the result of greater accumulation of aerosols in the atmosphere, either directly or indirectly.
These aerosols are simply liquid and solid particles suspended in the atmosphere. They are relevant to radiative and chemical processes and range in size from thousandths of a micron to several hundred microns. Aerosols are produced naturally as soil dusts, sea salts and organic debris; they are produced anthropogenically through combustion and industrial processes. Another important source of aerosols is gas-to-particle conversion, which is brought about by chemical reactions involving some precursor gases such as sulphur dioxide that is produced by industrial activities, and even during volcanic activities.
The direct effects of aerosols relate to their solar radiation (short-wave) absorption and scattering whereas the indirect effects relate to their role as cloud-condensation nuclei (CCN) or ice nuclei (IN) which bring about increased cloud cover. Ruckstuhl et al (2008) observed that aerosols affect atmospheric transmissivity, and hence temperature through their direct effects. Lohmann and Feichter (2005) reported that cloud-mediated indirect effects have even greater impact than the direct effects at the top of the atmosphere. These indirect effects refer to: the enhancement of cloud albedo resulting from the formation of small cloud droplets that are very reflective (cloud-albedo effect or Twomey effect); prolongation of cloud lifetime resulting from the formation of small cloud droplets (as in cloud-albedo effect) that slows precipitation formation and resist precipitation scavenging, called cloud-lifetime effect or Albrecht effect.
The perturbations and the corresponding modifications of processes and mechanisms involved in the climate system consequent upon the sunshine duration variability would have a bearing on

164
climate forcing and air quality. It is the aim of this study to examine the trends and variations of the sunshine duration in Nigeria and its implications for climate forcing and air quality.
2.0 The Study Area
Nigeria lies between latitude 4oN and 14oN, and between longitude 2oE and 15oE. The climate of Nigeria is tropical humid, wet and dry. The climate is dominated by the influence of ―Tropical Maritime‖ (TM) air mass, the ―Tropical Continental‖ (TC) air mass, and the ―Equatorial Easterlies‖ (EE) (Ojo, 1977) in Abiodun et al (2011). The TM and TC air masses converge at the Inter-Tropical Convergence Zone (ITCZ), also known as Inter -Tropical Discontinuity (ITD). The north-south oscillation of the ITD dictates Nigerian weather pattern. There are two main seasons, namely rainy and dry seasons. The rainy season lasts from April to October in the South, and from May to September in the North. The coastal cities have significant rainfall events all the year round. For simplicity, Nigeria can be divided into four major eco-climatic zones but for detailed forest ecology, it could be divided into more stratifications. The pattern of the eco-climatic zones largely follows the vegetation or agro-ecological patterns; rainfall is the determining factor but relief, soil type and human activity exert considerable influence. Fig 1 is the map of Nigeria showing climatic zones and the meteorological stations selected for the study.
3.0 Data and Methodology
3.1 Data
The data for twenty meteorological stations selected for the study were sourced from the Nigeria Meteorological Agency, Oshodi, Lagos Nigeria. The selected stations cut across different climatic zones in Nigeria. The data comprised monthly mean daily sunshine hours and spanned 1961 to 2012. Table 1 presents the summary information of the stations selected for the study while Table 2 provides the summary information on the sunshine duration. The classification in Table 1 is based on Abiodun et al (2011) and Adofolalu (2002).
3.2 Methodology

165
3.2.1 Data Quality Check and Database Construction
Data were checked for missing data and unrealistic values. There were cases of missing data. The missing data were not replaced. Shongwe et al (2006) suggested the uses of data from stations that do not exceed 5% missing records. Hosking and Wallis (1997) recommended the use of data with up to 10% missing values in data scarce region. Helsel and Hirch (1992) recommended that monotonic trend analysis could be applied to data whose missing records do not exceed one-third of the total record. This recommendation is based on the use of non-parametric statistical trend tests that are robust against outliers and large data gaps. This was adopted in this study. The original monthly mean values were converted to annual mean values for the analysis.
3.2.2 Data Analysis
Both parametric and non-parametric tests are used in trend studies. The non-parametric statistical tools have superiority in cases of skewed distribution and outlier presence. The Mann-Kendall‘s (M-K) non-parametric test was used to detect the direction and significance of the trends, as well as the coefficients of the time trend. The magnitude of the time trends were estimated by the linear regression model using the method of least squares linear fitting. The details of the M-K trend test and least squares regression methods abound in the literature (e.g Amadi et al, 2014a, Amadi et al, 2014b, Amadi et al 2015).
3.2.3 Mann-Kendall’s Rank Correlation Test For n size data of independent time series for which 10n , the Mann-Kendall‘s test statistic S is determined according to the formula (Rai et al, 2010):
kj
n
lkj
n
lk
xxSgnS
1
(1)
jx and kx are the jth and kth terms of the sequential data in which .kj
kj xxSgn =
kj
kj
kj
xxif
xxifo
xxif
1
1
(2)
A large positive value of S indicates upward trend whereas a large negative value of S indicates
downward trend. No clear trend is identified for small values of S. The variance of S, 2 is computed as
q
p
ppp tttnnn1
2 52152118
1 (3)
q is the number of tied group and pt is the number of data values in the pth. S and 2 are used
in computing the test statistic Z thus:
01
00
01
SifS
Sif
SifS
Z
(4)
Z is normally distributed. The null hypothesis, Ho is rejected when the Z-value is greater in
magnitude than the critical value, 2
Z at the significance level in which case H1 is accepted.
The Kendall‘s coefficient of time trend is expressed as:

166
1
21
nn
S (5)
Ho is rejected when is significantly different from zero p .
3.2.4 The Linear Regression Model. The magnitudes of the trends were determined by the least squares regression. A simple linear regression of y on time is a test for a linear trend:
ty 10 (6)
1 is the slope while 0 is the value of y at 0t . is error term. The sum of squared errors
provides a measure of the ―goodness of fit‖ of the line to the data. Accordingly, the line with the least sum of squared errors provides the ―line of best fit‖. The line thus fits the data in the least
squares sense. The significance of the model estimators 01 and were tested based on the
student‘s t-test statistics, t expressed as:
1
1 0
t (7)
0
0 0
t (8)
1 and 0 are the standard errors in the model estimators 1 and 0 respectively. 0H was
rejected if 2
tt p for which 1H was upheld.
Table 1: Summary information on the meteorological stations.
Station Name Eco-Climatic Zone Latitude (oN) Longitude (oE) Altitude (m)
Sokoto Sahel
12.55 5.12 351 Maiduguri 11.51 13.05 354
Kano
Sudan Savanna
12.03 8.32 476 Yelwa 10.53 4.45 244 Kaduna 10.42 7.19 645 Bauchi 10.17 9.49 591 Yola 9.16 12.26 191 Lokoja 7.48 6.44 41
Ilorin
Guinea-Wooded Savanna
8.26 4.30 308 Oshogbo 7.47 4.29 305 Makurdi 7.42 8.37 113 Ibadan 7.22 3.59 234 Enugu 6.28 7.34 137
Ogoja
Tropical Rainforest
6.40 8.48 117 Benin 6.19 5.36 77.8 Warri 5.31 5.44 6 Owerri 5.25 7.13 91
Ikeja Mangrove Swamp Forest
6.35 3.20 40 Port Harcourt 5.01 6.57 18 Calabar 4.58 8.21 62
(Classification based on Abiodun et al (2011) and Adefolalu (2002)

167
Table 2: Summary information on sunshine duration data
Station Name Period (years) Sequence Length (months)
% Missing Records.
Sokoto 1961-2012 564 9.62 Maiduguri 1961-2012 624 0.00 Kano 1961-2012 612 1.92 Yelwa 1965-2012 552 4.17 Kaduna 1961-2012 624 0.00 Bauchi 1961-2012 552 11.54 Yola 1961-2012 624 0.00 Lokoja 1961-2012 576 7.69 Ilorin 1961-2012 576 7.69 Oshogbo 1961-2012 624 0.00 Makurdi 1961-2012 564 9.62 Ibadan 1961-2012 612 1.92 Enugu 1961-2012 588 5.77 Ogoja 1976-2012 444 0.00 Benin 1961-2012 552 11.54 Warri 1961-2012 624 0.00 Owerri 1976-2012 444 0.00 Ikeja 1961-2012 600 3.85 Port Harcourt 1961-2012 588 5.77 Calabar 1961-2012 612 1.92
The tests are two-tailed. The null hypothesis, Ho for a two-tailed test is that there is not trend. The alternative hypothesis, H1 is that trend exists. The null hypothesis is rejected when the z value is greater in absolute value than the critical (table) value zα/2 at the α level of significance in which case the alternative hypothesis is accepted. The probability values (p -values) were also used to test the significance of the test statistics. If a particularly high value of the test statistic is observed, the p -value is very small. The null hypothesis is rejected where the p -value is less than the chosen level of significance (p < α). In this study, the test statistics were tested at 1% and 5% significance levels. The trend is positive for positive values of the test statistics, s, z, and t and vice versa.
3.2.3 Statistical Software Processing Packages
The descriptive statistics of the distribution and M-K trend tests were evaluated using SPSS version 17 package. The MATLAB 2008 software package was used to execute the regression analysis and the time series anomaly plots. The R programming language was used to execute the bar charts.
4.0 Results and Discussions
4.1 Results of the Descriptive Statistics for Sunshine hours
The results of the descriptive statistics for sunshine hours are presented in Table 3. The mean annual daily sunshine hours show latitudinal and elevation dependence, increasing with latitude

168
and elevation. Stations further inland such as Maiduguri, Kano, Sokoto, Kaduna, Yola, etc have the highest values of the mean annual daily sunshine hours whereas the coastal cities such as Calabar, Port Harcourt Warri etc have the lowest mean values. Elevation dependence of the mean values are perceptible in the mean values for Maiduguri, Kano and Kaduna etc. The coefficients of variation (CV) do not exhibit latitudinal dependence but rather demonstrate that different eco-climatic zones have high sunshine reliability for cases of consideration as a renewable alternative energy resource. The coefficients of skewness and kurtosis are included to indicate the extent of departure of the data from normal distribution.
The variation in the mean and the C.V could be attributed to aerosols and cloud forcing effects. Clouds and aerosols are known to simultaneously affect short-wave (solar) radiation and long-wave (thermal) radiation, but with opposite effects, through their direct and indirect effects. Aerosols and clouds cause solar dimming by scattering and absorbing short-wave (solar) radiation. Aerosols and clouds also cause warming by absorbing and re-emitting long-wave radiations. The direct effect relates to the increased short-wave absorption and scattering by aerosols and clouds under both clear and overcast conditions, and absorption of long-wave radiation. The indirect effects refer to the role of aerosols in cloud condensation nuclei (CCN) or ice nuclei (IN) which leads to increased cloud cover.
Table 3: Descriptive statistics for sunshine hours
Station Name No of years
Mean (in hours)
Std. deviation (in hours)
C.V (%) Coefficient of skewness
Coefficient of kurtosis
Sokoto 47 7.701 0.854 11.089 -0.900 0.749
Maiduguri 52 8.218 0.407 4.953 -0.311 0.185 Kano 50 7.879 0.475 6.029 -0.108 -0.100 Yelwa 46 7.386 0.983 13.309 -1.431 2.261 Kaduna 52 7.656 0.331 4.323 0.012 -0.137 Bauchi 46 7.023 1.068 15.207 -1.248 0.083 Yola 52 7.525 0.389 5.169 0.117 -0.951 Lokoja 48 6.190 0.623 10.065 -0.684 -0.243 Ilorin 48 6.228 0.332 5.331 -0.975 1.582 Oshogbo 52 5.355 0.403 7.526 -0.210 -0.835 Makurdi 47 6.226 0.575 9.235 -0.596 0.020 Ibadan 51 5.192 0.671 12.924 0.437 -0.384 Enugu 49 5.485 0.287 5.232 -0.212 -0.794 Ogoja 37 5.562 0.613 11.021 -0.696 -0.176 Benin 46 4.803 0.366 7.620 0.029 -0.696 Warri 52 4.322 0.577 13.350 -0.338 1.553 Owerri 37 4.454 0.370 8.307 -0.134 -0.262
Ikeja 50 5.134 0.394 7.674 0.511 0.300 Port Harcourt 49 4.021 0.648 16.115 0.518 -0.552 Calabar 51 3.770 0.492 13.050 -0.813 0.774
4.2 Results of M-K Trend Tests.
The M-K trend test results for the sunshine hours are presented in Table 4. 15 stations indicate declining trends, 9 of them having significant declining trends. 5 stations indicate upward trends, with 3 having significant upward trends. Some explanations can be given to account for the observed trends. Although the causes may not be quantitatively explained, the most probable reason is the variability in the transmissivity of the earth‘s atmosphere. Another explanation that

169
the solar flux at the top of the atmosphere of the earth has deceased over the years could be discarded because recent studies suggest otherwise (Stanhill, 2005). Clouds exert a major effect on a global energy balance and can be attributed to be a leading cause of the trends and variations in Table 4. Cloudiness can contribute to dimming because of low-level clouds linked to their high albedo. Cloudiness can also cause brightening due to high clouds emitting less radiation to space than low clouds, or due to the clear atmosphere (Mace et al, 2006). Changes in aerosol optical thickness due to changes in the concentrations and aerosol optical properties produce changes in atmospheric transmissivity. These can cause dimming or brightening depending on the aerosol type responsible for the local pollution. Furthermore, IPCC (2007) observed that aerosol heating within layers of clouds reduces cloud fractions while aerosol heating above the layers of clouds tends to increase cloud fractions.
Reduced atmospheric transmissivity could have resulted from alterations in the short-wave radiative properties of the atmosphere, or from increase in cloud cover or both. These changes are probably the outcome, directly or indirectly of greater concentrations of aerosols in the atmosphere. The aerosol direct effects (absorption and scattering of solar radiation under clear and overcast sky conditions) and the aerosol indirect effects (such as its role in CCN and IN) both have perceptible impact.
Table 4: Mann-Kendall‘s trend test results for sunshine hours
Station Name S Kendall‘s tau b Z p-Values
Sokoto -608 -0.562** -5.566 0.000 Maiduguri -399 -0.301** -3.141 0.002
Kano -354 -0.289** -2.953 0.003
Yelwa -141 -0.136 -1.326 0.185
Kaduna 16 0.012 0.118 0.899
Bauchi -265 -0.256* -2.500 0.012
Yola -537 -0.405** -4.320 0.000
Lokoja -408 -0.362** -3.617 0.000
Ilorin -94 -0.083 -0.827 0.408
Oshogbo -305 -0.230* -2.399 0.016
Makurdi -282 -0.261** -2.580 0.010
Ibadan -374 -0.293** -3.030 0.003
Enugu -26 -0.022 -0.215 0.822
Ogoja -45 -0.068 -0.575 0.556
Benin -78 -0.075 -0.729 0.466
Warri 284 0.214* 2.243 0.026
Owerri 192 0.289* 2.498 0.013
Ikeja 298 0.243* 2.484 0.013
Port Harcourt 222 0.189 1.905 0.056
Calabar -201 -0.158 -1.624 0.102
**Kendall‘s tau b is significant at the 0.01 level (2-tailed). *Kendall‘s tau b is significant at the 0.05 level (2-tailed).
170
Uncertainties of aerosol indirect effects on clouds and precipitation can also cause either induced changes in the cloud properties such as albedo and lifetime, or the modification of precipitation-forming processes. These aerosol indirect effects on clouds and precipitation are in the form of cloud-albedo effect, cloud-lifetime effect and semi-direct effect etc. Cloud- albedo and cloud-lifetime effects can be brought about by hygroscopic (wettable) aerosols such sulphates. Sulphate aerosols have the tendency to produce small cloud droplets that efficiently reflect solar radiations, retards precipitation formation and prolong cloud lifetime. These two effects together with the direct effects, perhaps are responsible for the observed downward trends in sunshine duration in majority of the stations.
Soot aerosols (particulate black carbon) absorb short-wave (solar) radiation and re-emit it as long-wave (thermal) radiations within cloud layers. As a consequence, they heat the air-mass and vapourize the cloud droplets, resulting in reduced cloud fractions and change in cloud amount (Ramanathan et al, 2001). This semi-direct effect could result in increasing trends in sunshine duration as observed in few stations. This could be dominant in locations with large fossil fuel burning and several other manufacturing concerns such Port Harcourt, Warri and Ikeja. Owerri trend may be under the influence of several manufacturing activities in Aba industrial cluster which is very close to Owerri. Again, large aerosols have the tendency of precipitation formation with the formation of few and larger droplets. These aerosols are efficiently scavenged by precipitation (washout), which is their major atmospheric sink. For this reason, large aerosols have a reduced atmospheric lifetime of few days in the boundary layer and few weeks in the free troposphere. Expectedly, this effect will increase sunshine duration as a consequence, and could probably partially account for the observed upward trends as observed in few stations in Table 4. Thus, increasing and decreasing trends in sunshine duration could be attributed to changes in short-wave and long-wave radiative properties of the atmosphere which, to a large extent, derive from the aerosols direct and indirect effects.
4.3 Results of Linear Trend Estimation for Sunshine Hours
The results of linear trend estimation for sunshine hours are presented in Table 5. 15 stations how downward trends with 9 stations showing significant downward trends. 5 stations show upward trends with only 2 stations indicating significant upward trends. The estimates of the trends range in magnitude from 0.001 to 0.044 hour per year. Comparing the results of Tables 4 and 5 indicates that the two tables are in complete agreement in terms of the direction (nature) of the trends. Nevertheless, the beauty of the result is that Table 5 provides the estimates of the temporal trends while Table 4 specifically provides a more robust significance of the trends. Thus the two tables complement each other, which is the objective of integrated and synergistic approach to trend analysis.
4.4 Time Series Anomaly Plots Results.
Figures 2 to 6 are the time series anomaly plots of sunshine duration for the stations. The plots depict the general indication of long-term trends of sunshine in the stations. The inter- decadal upward and downward trend are quite perceptible in some stations whereas some station plots depict mere frequency fluctuations. For instance, Kano plot indicates downward trend from 1961 to 1984 and an upward trend from 1985 to 2007. Ilorin plot depicts a generally downward trend between 1961 and 1985 and an upward trend from 1985 to 2012. Warri did not show any trend direction until around 1990 when a positive trend is observed until around 2010. Enugu has no clear trend indication even though a negative trend is suggested. The plots in Figures 2 to 6 agree very well with the M-K trend results (Table 4) and linear trend estimation results (Table 5) in terms of the direction of the trends. However, the plots reveal that the entire period of linear trends of climate parameters as usually presented by trend tests makes little meaning for

171
time series at the stations where the trends are concentrated in a limited period. An overall linear trend distorts the information. A more elaborate look at the actual time series especially for inter decadal analysis effectively complements the non-parametric M-K test and the parametric student‘s t test, both of which always give the average long-term trend over the period. In this way, different methods can complement one another and make the result more coherent. This is the hallmark of integrated approach in research. Interestingly, the results of this study demonstrate that M-K test and student‘s t test could be applied interchangeably in practical applications with similar results in most cases, provided that the outliers are competently addressed and the data size is large enough.
Table 5: Results of linear trend estimation for sunshine hours
Station name Parameters Estimates (hours per year)
Std error Students t-statistic
p-Value
Sokoto Slope -0.044** 0.010 -4.565 0.000 Intercept 8.768 0.211 41.630 0.000
Maiduguri Slope -0.010 0.006 -1.674 0.103 Intercept 8.503 0.125 67.809 0.000
Kano Slope -0.037** 0.005 -7.178 0.000 Intercept 8.568 0.112 76.433 0.000
Yelwa Slope -0.036* 0.015 -2.384 0.023 Intercept 7.985 0.331 24.140 0.000
Kaduna Slope 0.008 0.005 1.774 0.085
Intercept 7.522 0.104 72.504 0.000
Bauchi Slope -0.027* 0.013 -2.019 0.049
Intercept 7.739 0.288 26.876 0.000
Yola Slope -0.021** 0.005 -4.341 0.000 Intercept 8.022 0.105 76.495 0.000
Lokoja Slope -0.011 0.006 -1.774 0.085 Intercept 6.607 0.140 47.056 0.000
Ilorin Slope -0.012* 0.005 -2.336 0.025 Intercept 6.442 0.114 56.350 0.000
Oshogbo Slope -0.016** 0.006 -2.771 0.009
Intercept 5.691 0.126 45.045 0.000
Makurdi Slope -0.006 0.009 -0.645 0.523
Intercept 6.397 0.201 31.767 0.000
Ibadan Slope -0.020* 0.009 -2.166 0.037 Intercept 5.677 0.200 28.396 0.000
Enugu Slope -0.001 0.004 -0.173 0.863 Intercept 5.504 0.095 57.871 0.000
Ogoja Slope -0.013 0.009 -1.432 0.161 Intercept 5.815 0.203 28.676 0.000
Benin Slope -0.014** 0.005 -2.702 0.009
Intercept 5.018 0.113 44.470 0.000
Warri Slope 0.014* 0.007 2.021 0.048
Intercept 4.370 0.147 29.662 0.000
Owerri Slope 0.014* 0.005 2.559 0.015 Intercept 4.196 0.116 36.266 0.000
Ikeja Slope 0.006 0.005 1.278 0.210 Intercept 5.103 0.101 50.723 0.000
Port Harcourt Slope 0.010 0.009 1.204 0.237

172
Intercept 3.706 0.188 19.746 0.000 Calabar Slope -0.013 0.008 -1.513 0.139
Intercept 4.028 0.184 21.905 0.000
**Slope is significant at the 0.01 level (2-tailed). *Slope is significant at the 0.05 level (2-tailed).
Yelwa
Time
Sunshin
e h
rs A
nom
aly
1970 1990 2010
-3-2
-10
1
Sokoto
Time
Sunshin
e h
rs A
nom
aly
1960 1980 2000-2
-10
1
Kaduna
Time
Sunshin
e h
rs A
nom
aly
1960 1980 2000
-0.5
0.0
0.5
Kano
Time
Sunshin
e h
rs A
nom
aly
1960 1980 2000
-1.0
0.0
1.0
FIG. 2: Time series anomaly plots for sunshine hours for Yelwa, Sokoto, Kaduna and Kano
Stations.
(a) (b)
(c) (d)
(hours
)
(hours
)
(hours
)
(hours
)

173
Bauchi
Time
Sunshin
e h
rs A
nom
aly
1960 1980 2000
-2.0
-1.0
0.0
1.0
Maiduguri
Time
Sunshin
e h
rs A
nom
aly
1960 1980 2000
-1.0
0.0
0.5
Ilorin
Time
Sunshin
e h
rs A
nom
aly
1960 1980 2000
-1.0
-0.5
0.0
0.5
Yola
Time
Sunshin
e h
rs A
nom
aly
1960 1980 2000
-0.5
0.0
0.5
FIG. 3: Time series anomaly plots for sunshine hours for Bauchi, Maiduguri, Ilorin and Yola
Stations.
(a) (b)
(c) (d)
(hours
)
(hours
)
(hours
)
(hours
)

174
Ikeja
Time
Sunshin
e h
rs A
nom
aly
1960 1980 2000
-0.5
0.0
0.5
1.0
Ibadan
Time
Sunshin
e h
rs A
nom
aly
1960 1980 2000
-1.0
0.0
1.0
Oshogbo
Time
Sunshin
e h
rs A
nom
aly
1960 1980 2000
-0.5
0.0
0.5
Benin
Time
Sunshin
e h
rs A
nom
aly
1960 1980 2000
-0.6
-0.2
0.2
0.6
FIG. 4: Time series anomaly plots for sunshine hours for Ikeja, Ibadan, Oshogbo and Benin
Stations.
(a) (b)
(c) (d)
(hours
)
(hours
)
(hours
)
(hours
)

175
Warri
Time
Sunshin
e h
rs A
nom
aly
1960 1980 2000
-1.5
-0.5
0.5
Lokoja
Time
Sunshin
e h
rs A
nom
aly
1960 1980 2000-1
.5-0
.50.5
Port Harcourt
Time
Sunshin
e h
rs A
nom
aly
1960 1980 2000
-1.0
0.0
1.0
Owerri
Time
Sunshin
e h
rs A
nom
aly
1975 1985 1995 2005
-0.6
-0.2
0.2
0.6
FIG. 5: Time series anomaly plots for sunshine hours for Warri, Lokoja, Port Harcourt
and Owerri Stations.
(a) (b)
(c) (d)
(hours
)
(hours
)
(hours
)
(hours
)

176
Enugu
Time
Sunshin
e h
rs A
nom
aly
1960 1980 2000
-0.6
-0.2
0.2
Calabar
Time
Sunshin
e h
rs A
nom
aly
1960 1980 2000
-1.0
0.0
1.0
Makurdi
Time
Sunshin
e h
rs A
nom
aly
1960 1980 2000
-1.5
-0.5
0.5
Ogoja
Time
Sunshin
e h
rs A
nom
aly
1975 1985 1995 2005
-1.0
0.0
1.0
FIG. 6: Time series anomaly plots for sunshine hours for Enugu, Calabar, Makurdi and
Ogoja Stations.
(a) (b)
(c) (d)
(hours
)
(hours
)
(hours
)
(hours
)

177
4.5 Seasonal Variations in Sunshine Hours
The seasonal variations of sunshine hours are presented in the form of bar charts in Figures 7 and 8. The pattern of seasonal variation are similar across Nigeria, peaking around November to February, including April and May for some stations. Minima are recorded in July to September across Nigeria to show the effect of cumlus-nimbus clouds during the rainy season.
5.0 Implications of the Results
5.1 Implications for Climate Forcing
Atmospheric aerosols significantly modify radiative transfer. The high reflectivity of aerosols in the visible band enable them shield the earth-atmosphere system and results in cooling in the short-wave energy budget. Indirect aerosol effects promote cloud formation and enhances cloud albedo and cloud lifetime. These consequently lead to large reductions in the amount of solar radiation intercepting the earth‘s surface (solar dimming) which manifest themselves as declining trends in sunshine duration. Changes in the transmissivity of the atmosphere resulting from changes in the concentration and optical properties of aerosols can cause dimming or brightening depending on the type and distribution of aerosols causing the pollution in a locality.
Solar dimming is associated with surface cooling, increase in atmospheric solar heating, disruption of regional circulation systems, changes in atmospheric thermal structure, suppression of evaporation and precipitation, slowing down of hydrological cycle and less efficient removal of pollutants. Further implications for the altered hydrological cycle could accompany changes in atmospheric circulation arising from altered pattern of solar heating. Changes in atmospheric circulations are a major cause, as well as a consequence of local climate change with the practical implications that are inherent.
Global dimming could have widespread consequences on the carbon cycle: lower intensities of solar radiation in the photosynthetically active wave bands can seriously affect carbon assimilation by plant populations, thereby endangering biomass production. Aside this, aerosols play key roles in several chemical processes involving multiple phase reactions (Salby, 1996), which extend the roles of aerosols to climate fluctuation tendencies. According to Salby (1996), sporadic increases in aerosols produced by volcanoes are associated with changes in thermal, optical and chemical properties of the atmosphere.
5.2 Implication for Air Quality
Jacob and Winner (2009) reported that the climate forcing effects of aerosols and cloud influence air quality through the following processes and mechanisms: causing small but significant changes in ventilation rates, precipitation scavenging, changes in chemical production and loss rates, and dry depositions etc. Temperature increase resulting from the warming has great implications for ozone formation, a pollutant of major concern for public health. Ordonez et al (2005) and Camalier et al (2007) identified temperature as a dominant predictor variable for ozone. Cox and Chu (1995) and Wise and Comrie (2005) found that ozone is strongly correlated with temperature. Ozone is produced in the troposphere by photochemical oxidation of carbon monoxide (CO), methane and non-methane volatile organic compounds (NMVOCs) and the hydroxyl radical in the presence of reactive nitrogen oxides, NOx. Ozone precursors such as

178
FIG. 7: Seasonal variation of sunshine hours at Yelwa, Sokoto, Kaduna and Kano
stations.

179
FIG. 8: Seasonal variation of sunshine hours at Benin, Warri, Port Harcourt and Calabar
stations.
(a) (b)
(c) (d)

180
NMVOCs, CO and NOx have large combustion sources and are products of incomplete combustion. They can react with other gaseous species in the atmosphere to produce ozone.
Jacob and Winner (2009) identified surface ozone and particulate matter (PM2.5) as the two air pollutants of major concern for public health. The PM2.5 components are mostly present as fine particles less than 2.5µm in diameter and include sulphates, nitrates, organic carbon and elemental carbon. Sulphates, nitrates and organic carbon are produced within the atmosphere by oxidation of sulphur dioxide (SO2), NOX and NMVOCs respectively whereas elemental carbon particles are emitted directly by combustion. Nitrates and organic carbon exchange between the particle and gas phases, depending particularly on temperature (Jacob and Winner, 2009). Thus, aerosols have adverse direct and indirect effects on air quality as they engender air pollutant of major concern for public health.
6.0 Conclusion and Recommendations
Results of this study indicate dominant decreasing trends and few upward trends in sunshine duration. These trend results are presumably consequences of aerosols direct and indirect effects together with cloud forcing effects. The results have strong implications for climate forcing and air quality in the stations. Changes in aerosol optical thickness consequent upon changes in concentration and optical properties of aerosols can induce dimming or warming, each with inherent practical implications for climate fluctuations. These changes trigger atmospheric circulation changes that cause local climate change. These climate forcing effects of aerosols also affect air quality by perturbing some processes and mechanisms that enhance the formation of aerosols and ozone precursor gases that reduce air quality. The issue at hand perhaps put us in a dilemma, in which we have to make a very difficult choice between two things of almost equal importance. While efforts to curb air pollution is important, it is worthy to recognize that the surface cooling effect of these air pollutants (aerosols) have masked much of the heat of global warming by the greenhouse gases. Efforts to curb air pollution would address the global dimming and the associated forcing effects, including unmasking the cooling effect of aerosols that will promote global warming. Warming itself would increase air temperature which will favour the production of aerosol and ozone precursor gases. Thus global warming and global dimming (caused by air pollution) issues cannot be resolved at the same level of consciousness that created them. Global warming and global dimming issues are intertwined as efforts to curb global dimming have a tendency to amplify warming and its associated adverse socio-climatic effects.
This paper recommends that mechanisms to curb air pollution ought to be implemented under the same framework with the mechanisms to cut greenhouse gas emissions. This will guarantee ultimate air management strategy for socio-economic and environmental benefit. It is also recommended that ozone and its precursor gases together with the PM 2.5 and their precursor gases be continuously monitored in the cities to ensure that their concentrations do not exceed acceptable levels. This will prevent the deterioration of air quality and guarantee safe air in the environment.

181
References
Abiodun, B.J., Salami, A. T. & Tadross, M. (2011). Climate Change Scenarios for Nigeria: Understanding the Biophysical Impacts. A report by the Climate Systems Analysis Group, Cape Town, for Building Nigeria‘s Response to Climate Change (BNRCC) Project, Ibadan, Nigeria.
Adefolalu, A.D. (2002). Climate of Nigeria. In: Atlas of Nigeria, (p.65), Paris: Les Editions J.A.
Amadi, S.O., Udo, S.O. & Ewona I.O. (2014a). Spatio–temporal variations of monthly rainfall totals in Nigeria for the period 1950 – 2012. International Journal of Pure and Applied Physics, 10(1), 75-93.
Amadi, S.O., Udo, S.O. & Ewona, I.O. (2014b). Trends and variations of monthly mean minimum and maximum temperature data over Nigeria for the period 1950-2012. International Research Journal of Pure and Applied Physics, 2(4), 1-27.
Amadi, S.O., Udo, S.O. & Udoimuk, A.B. (2015). An examination of trends and variations of monthly mean relative humidity data in Nigeria from 1950-2012. International Journal of Pure and Applied Sciences and Technology, 28(2), 63-76.
Camalier, L., Cox, W. & Dolwick, P. (2007). The effects of meteorology on ozone in urban areas and their use in assessing ozone trends. Atmospheric Environment, 41, 7127 – 7137.
Chineke, T.C. (2007). Renewable energy: equations for estimating global solar radiation in data sparse regions. Science Direct, 1-13.
Cox, W.M. & Chu, S.H. (1995). Assessment of inter annual ozone variation in urban areas from a climatological perspective. Atmosphereic Environment, 30, 2615-2625.
Forkel, R. & Knoche, R. (2006). Regional climate change and its impact on photo-oxidant concentrations in southern Germany: simulations with a coupled regional chemistry climate model. J. Geophys. Res. 111, D12302.
Helsel, D.R. & Hirch, R.M. (1992). Statistical methods in water resources. Studies in Environmental Research, 49, New York; Elsevier.
Hosking, J.R.M. & Wallis, J.R. (1997). Regional Frequency Analysis: An Approach based on L-moment, Cambridge: Cambridge University Press.
IPCC, (2007) Climate Change, 2007: The Physical Science Basis. Contribution of WG 1 to the AR4 of the IPCC, Cambridge: Cambridge University Press.
Jacob, D.I. & Winner, D.A. (2009). Effect of climate change on air quality. Atmospheric Environment, 43, 51-63.
Lohmann, U. & Feichter, J. (2001). Can the direct and semi-direct aerosol effect compete with the indirect effect on a global scale? Geophys. Res. Lett., 28(1), 159-161.
Mace, G.G., Benson, S. & Kato, S. (2006). Cloud radiative forcing at the atmospheric radiation program climate research facility: vertical redistribution of radiant energy by clouds. J. Geophys. Res., 111, D11591.
McGregor, G.R. & Nieuwolt, S. (1998). Tropical Climatology, 2nd edn, (p. 31), Chichester: John Wilsey & Sons Ltd.

182
Norris, J.R. & Wild, M. (2007). Trends in aerosol radiative effects over Europe inferred from observed cloud cover, solar dimming, and solar brightening J. Geophys. Res., 112, D08214.
Obiekezie, T.N. (2009). Sunshine hours variability and its response to aerosols in Lagos State Nigeria. African Journal of Physics, 2, 246-255.
Ojo, O. (1977). The Climates of West Africa, Ibadan: Heinemann.
Ordonez, C., Mathis, H., Furger, M., Henne, S., Hoglin, C., Staehelin, J. & Prevot, A. S.H. (2005). Changes in daily surface ozone maxima in Switzerland in all seasons from 1992 to 2002 and discussion of summer 2003. Atmos. Chem. Phys., 5, 1187 – 1203.
Rai, R. K. Upadhyay, A & Ojha, C.S.P (2010). Temporal Variability of climate parameters of Yumuna River basin: spatial analysis of persistence, trend and periodicity. The Open Hydrology Journal, 4, 184-210.
Ramanathan, V. & Feng, Y. (2009). Air pollution, greenhouse gases and climate change: global and regional perspectives. Atmospheric Environment, 43, 37-50.
Ramanathan, V., Crutzen, P.J., Kiehl, J.T. & Rosenfeld, D. (2001). Aerosols, climate and the hydrological cycle. Science, 294, 2119-2124.
Ruckstuhl, C., Philipona, R., Behrens, K., Coen, M.C., Durr, B., Heimo, A., Matzler, C., Nyeki, S., Ohmura, A., Vuilleumier, L., Weller, M., Wehrli, C. & Zelenka, A. (2008). Aerosol and cloud effects on solar brightening and the recent rapid warming. Geophys. Res. Lett., 35, L12708.
Salby, M.L. (1996) Fundamentals of Atmospheric Physics, (pp. 35; 258 – 264), London: Academic Press Inc.
Sanchez–Lorenzo, A., Calbo, J., Brunetti, M. & Deser, C. (2009). Dimming/brightening over the Iberian Peninsula: trends in sunshine duration and cloud cover and their relations with atmosphere circulation. Journal of climate, 21, 6089-6098.
Shongwe, M.E., Landman, W.A. & Mason, S.J. (2006). Performance of recalibration systems for GCM forecasts for Southern Africa. International Journal of Climatology, 26, 1567-1585.
Stanhill, G. (2005). Global dimming: a new aspect of climate change. Weather, 60, 11-14.
Stanhill, G. & Cohen, S. (2008). Solar radiation changes in Japan during the 20th century: evidence from sunshine duration measurements. Journal of Meteorological Society of Japan, 86, 57-76.
Wise, E.K. & Comrie, A.C. (2005). Meteorologcially adjusted urban air quality trends in the southwestern United States. Atmospheric Environment, 39, 2969-2980.