Embed Size (px)
Citation preview

mcg
aw
gro
up
pty
ltd
AB
N 3
4 1
17
49
1 2
28
Building Educational Capacity: Enhancing Leadership Potential
Barry McGawBarry McGaw
International messages for Australia’s schools: still good but slipping
Melbourne, 1 August 2011Melbourne, 1 August 2011
Joint Conference of the Victorian Association of State Secondary Joint Conference of the Victorian Association of State Secondary Principals and the Victorian Principals AssociationPrincipals and the Victorian Principals Association

mcg
aw
gro
up
pty
ltd
AB
N 3
4 1
17
49
1 2
28
Message from international surveys

mcg
aw
gro
up
pty
ltd
AB
N 3
4 1
17
49
1 2
28
Australia tied for 2nd with 8 othersamong 42 countries.
Mean reading results (PISA 2000)
OECD (2003), Literacy skills for the world of tomorrow: Further results from PISA 2000, Fig. 2.5, p.76.
mcg
aw
gro
up
pty
ltd
AB
N 3
4 1
17
49
1 2
28
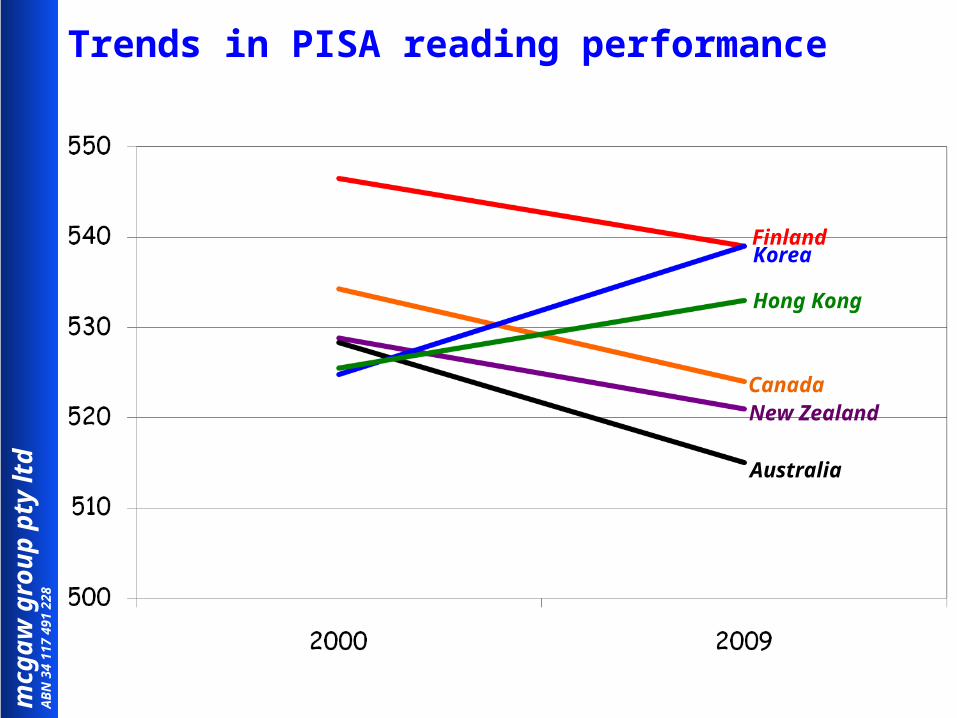
Trends in PISA reading performance
Finland
Hong Kong
CanadaNew Zealand
Korea
Australia

mcg
aw
gro
up
pty
ltd
AB
N 3
4 1
17
49
1 2
28
Trends in Australian reading performances
95th %ile
5th %ile
90th %ile
10th %ile
75th %ile
25th %ile
Mean

mcg
aw
gro
up
pty
ltd
AB
N 3
4 1
17
49
1 2
28
Countries ahead of Australia in PISA 2009
CanadaFinland
Hong Kong-
Korea---
ShanghaiSingapore
Reading
Mathematics Science
CanadaFinland
Hong KongJapanKorea
Liechtenstein
MacaoNetherlands
ShanghaiSingapore
SwitzerlandTaiwan
-Finland
Hong KongJapanKorea
---
ShanghaiSingapore

mcg
aw
gro
up
pty
ltd
AB
N 3
4 1
17
49
1 2
28
The story so far…
Australia’s average performance in international terms is high but slipping.

mcg
aw
gro
up
pty
ltd
AB
N 3
4 1
17
49
1 2
28
Social background & reading literacy
SocialAdvanta
gePISA Index of social
background
HighR
ead
ing
lit
era
cy
Low
Two indices of relationship
Correlation or variance accounted for
Social gradient: Magnitude of increment in achievement associated with an increment in social background (on average)
Correlation: How well the regression line summarises the relationship
Source: OECD (2001) Knowledge and skills for life, Appendix B1, Table 8.1, p.308
Social gradient

mcg
aw
gro
up
pty
ltd
AB
N 3
4 1
17
49
1 2
28
Australia
AustriaBelgium
Canada
Czech Republic
Denmark
Finland
France
Germany
Greece
Hungary
Iceland
Ireland
Italy
Japan
Korea
Luxembourg
Mexico
NetherlandsNew Zealand
Norway
Poland
PortugalSlovak Republic
Spain
SwedenSwitzerland
Turkey
United Kingdom
United States
400
425
450
475
500
525
550
575
-15.0 -10.0 -5.0 0.0 5.0 10.0 15.0
Social equity (OECD regression slope - country regression slope
Scie
nce
liter
acy
High qualityLow equity
High quality
High equity
Low qualityLow equity
Low quality
High equity
Social gradients for science (PISA 2006)
OECD (2007) PISA 2006: science competencies for tomorrow’s world, Vol 1 – analysis, Figure 4.6, p.184.
mcg
aw
gro
up
pty
ltd
AB
N 3
4 1
17
49
1 2
28
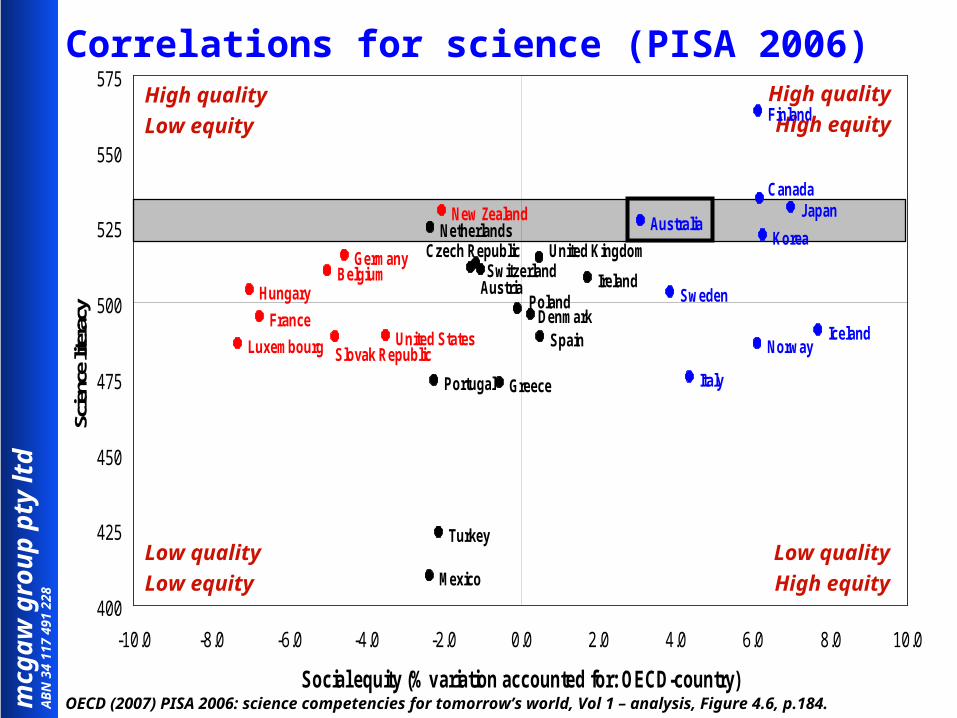
High qualityLow equity
High quality
High equity
Low qualityLow equity
Low quality
High equity
United States
United Kingdom
Turkey
SwitzerlandSweden
SpainSlovak Republic
Portugal
Poland
Norway
New ZealandNetherlands
Mexico
Luxembourg
Korea
Japan
Italy
Ireland
Iceland
Hungary
Greece
Germany
France
Finland
Denmark
Czech Republic
Canada
BelgiumAustria
Australia
400
425
450
475
500
525
550
575
-10.0 -8.0 -6.0 -4.0 -2.0 0.0 2.0 4.0 6.0 8.0 10.0
Social equity (% variation accounted for: OECD-country)
Scie
nce
liter
acy
Correlations for science (PISA 2006)
OECD (2007) PISA 2006: science competencies for tomorrow’s world, Vol 1 – analysis, Figure 4.6, p.184.

mcg
aw
gro
up
pty
ltd
AB
N 3
4 1
17
49
1 2
28
Variation in science performance (PISA 2006)
Variation of performance within schools
Variation of performance
between schoolsExplained by SESNot explained by SES
mcg
aw
gro
up
pty
ltd
AB
N 3
4 1
17
49
1 2
28
The story so far…
Australia’s average performance in international terms is high but slipping.
Differences in students’ social backgrounds have a more impact on educational performance in Australia than in most other high-performing countries though there are more exceptions in Australia than in some others.

mcg
aw
gro
up
pty
ltd
AB
N 3
4 1
17
49
1 2
28
Using national data to address the issues

mcg
aw
gro
up
pty
ltd
AB
N 3
4 1
17
49
1 2
28
School B
School A
School C
Performance vs socio-educational advantage
Index of community socio-educational advantage (ICSEA)


Indooroopilly Primary
460445-475
Brunswick East Primary
524502-546


mcg
aw
gro
up
pty
ltd
AB
N 3
4 1
17
49
1 2
28
The story so far…
Australia’s average performance in international terms is high but slipping.
Differences in students’ social backgrounds have a more impact on educational performance in Australia than in most other high-performing countries though there are more exceptions in Australia than in some others.
One way to reduce the impact of differences in students’ social backgrounds is to learn lessons from cases where it matters less.

mcg
aw
gro
up
pty
ltd
AB
N 3
4 1
17
49
1 2
28
Raising expectations – an international example

mcg
aw
gro
up
pty
ltd
AB
N 3
4 1
17
49
1 2
28
Variation in science performance (PISA 2006)
Variation of performance within schools
Variation of performance
between schoolsExplained by SESNot explained by SES

mcg
aw
gro
up
pty
ltd
AB
N 3
4 1
17
49
1 2
28
Trends in PISA reading performance

mcg
aw
gro
up
pty
ltd
AB
N 3
4 1
17
49
1 2
28
The story so far…
Australia’s average performance in international terms is high but slipping.
Differences in students’ social backgrounds have a more impact on educational performance in Australia than in most other high-performing countries though there are more exceptions in Australia than in some others.
One way to reduce the impact of differences in students’ social backgrounds is to learn lessons from cases where it matters less.
A key research message is that raising expectations leads to improved performance, particularly of low performers, provided students have appropriate learning opportunities.

mcg
aw
gro
up
pty
ltd
AB
N 3
4 1
17
49
1 2
28
Raising expectations – curriculum reform as one important step

mcg
aw
gro
up
pty
ltd
AB
N 3
4 1
17
49
1 2
28
The emerging Australian curriculum
Shape of the Australian Curriculum – 2008 Initial version on Phase 1 – 2008 Revised version for whole – 2011
Position paper on whole curriculum, achievement standards, students with disabilities
Adopted by Ministers on Friday 8 July 2011
Three-dimensional design Learning areas General capabilities Cross-curriculum priorities
Benchmarked internationally Comments on drafts included complaints about level of
demand All part of asking more of ourselves!

mcg
aw
gro
up
pty
ltd
AB
N 3
4 1
17
49
1 2
28
The whole story
Australia’s average performance in international terms is high but slipping.
Differences in students’ social backgrounds have a more impact on educational performance in Australia than in most other high-performing countries though there are more exceptions in Australia than in some others.
One way to reduce the impact of differences in students’ social backgrounds is to learn lessons from cases where it matters less.
A key research message is that raising expectations leads to improved performance, particularly of low performers, provided students have appropriate learning opportunities.
The introduction of an Australian Curriculum with appropriate resources is an important step in raising expectations.