Embed Size (px)
Citation preview
THE JOURNAL OF FINANCE • VOL. LXIV, NO. 5 • OCTOBER 2009
Media Coverage and the Cross-sectionof Stock Returns
LILY FANG and JOEL PERESS∗
ABSTRACT
By reaching a broad population of investors, mass media can alleviate informationalfrictions and affect security pricing even if it does not supply genuine news. We investi-gate this hypothesis by studying the cross-sectional relation between media coverageand expected stock returns. We find that stocks with no media coverage earn higherreturns than stocks with high media coverage even after controlling for well-knownrisk factors. These results are more pronounced among small stocks and stocks withhigh individual ownership, low analyst following, and high idiosyncratic volatility. Ourfindings suggest that the breadth of information dissemination affects stock returns.
MASS MEDIA OUTLETS, such as newspapers, play an important role in disseminat-ing information to a broad audience, especially to individual investors. Everyweekday, some 55 million newspaper copies are sold to individual readers inthe United States, reaching about 20% of the nation’s population. If we con-sider online subscriptions and multiple readers per copy, the actual readershipof the printed press is even larger, and certainly far broader than other sourcesof corporate information such as analyst reports. Given mass media’s broadreach, one might expect it to affect securities markets. Interest in the relationbetween media and the market has been on the rise among both researchersand practitioners. Klibanoff, Lamont, and Wizman (1998), Tetlock (2007), andTetlock, Saar-Tsechansky, and Macskassy (2008) are examples of this growingliterature.1
We contribute to this strand of research by examining the cross-sectional re-lation between mass media coverage and stock returns. We find that stocks notcovered by the media earn significantly higher future returns than stocks thatare heavily covered, even after accounting for widely accepted risk character-istics. A portfolio of stocks with no media coverage outperforms a portfolio of
∗Lily Fang and Joel Peress are both at INSEAD. We would like to thank Bernard Dumas,Edward Fang, Harald Hau, Pierre Hillion, Harrison Hong, Soeren Hvidkjaer, Charles Jones,Massimo Massa, Steve Monahan, Paul Tetlock, Clara Vega, Kent Womack, Lu Zheng, and semi-nar participants at Imperial College London, INSEAD, Lehman Brothers, Numeric Investors LLC,University of Wisconsin Madison, and Singapore International Conference on Finance (2007) forhelpful comments and discussions. We are also grateful to an anonymous referee and CampbellHarvey (the editor) for many insightful comments and detailed suggestions. We thank William Fisk,Shirish Tatikonda, Pradeed Mittal, Ananda Kumar, Sriram Ganesan, and Sriram Subramaniamfor outstanding assistance with the data collection process.
1 A detailed literature review appears in Section I.
2023
2024 The Journal of Finance R©
stocks with high media coverage by 3% per year following portfolio formationafter adjusting for market, size, book-to-market, momentum, and the Pastor-Stambaugh (2003) liquidity factor. The return difference is particularly largeamong small stocks, stocks with low analyst coverage, stocks primarily ownedby individuals, and stocks with high idiosyncratic volatility. In these subsam-ples, the “no-media premium” ranges from 8% to 12% per year after risk ad-justments. Thus, the return premium for stocks with no media coverage iseconomically significant.
The rational-agent framework provides two main explanations for the no-media premium in the cross-section. First, it may be a liquidity-related phe-nomenon. If the no-media premium reflects a mispricing (i.e., arbitrage), thenprofit-motivated traders will take positions to exploit and thereby eliminatethis mispricing. Thus, a mispricing can persist only if market frictions aresevere enough to prevent arbitrageurs from exploiting it. We call this the“impediments-to-trade” hypothesis. Alternatively, the no-media premium mayrepresent compensation for imperfect diversification. The “investor recognitionhypothesis” advanced by Merton (1987) posits that in informationally incom-plete markets, investors are not aware of all securities. As a consequence, stockswith lower investor recognition need to offer higher returns to compensate theirholders for being imperfectly diversified. By disseminating information to awide audience, media coverage broadens investor recognition. Thus, stocks withintense media coverage earn a lower return than stocks in oblivion.
Our empirical tests provide support for both hypotheses. In particular, wefind that the media effect is strong among small stocks and stocks with highbid-ask spreads. These results are consistent with the impediments-to-tradehypothesis. We also find that the no-media premium is particularly large amongstocks that face the most severe information problems, that is, stocks with lowanalyst coverage, a high fraction of individual ownership, and high idiosyncraticvolatility. These findings suggest that mass media’s information disseminationrole is particularly important among stocks for which information tends to bemore “incomplete,” consistent with Merton (1987). We note, however, that whileimpediments to trade may explain the persistence of the no-media premium,it does not explain why it arises in the first place. Thus, our conclusion is thatthe media effect is rooted in a Merton-type information story, and liquidityconstraints help perpetuate the phenomenon.
The media effect is not subsumed by a host of well-documented return anoma-lies, including the postearnings announcement drift, IPO underperformance,and delisting bias. We also show that it is not driven by industry biases, differ-ences in fundamental performance, and the bid-ask bounce. Finally, it is robustto different portfolio formation and holding periods. In particular, the returnpremium among no-coverage stocks is remarkably stable for at least 12 months.
Given publication delays, it is unlikely that information contained in massprint media is genuine news. But mass media does disseminate informationto a broad audience. Thus, our finding on the role of the media indicates thatthe breadth of information dissemination affects stock returns. An interestingimplication of our results is that noninformative channels such as mass media

Media Coverage and the Cross-section of Stock Returns 2025
and even firms’ public relation programs can affect firms’ cost of capital. Whilemarket participants and company executives recognize that information dis-semination plays a crucial role in determining the cost of capital, traditionallythe focus has been on channels such as disclosure and stock analyst reports.In recent years, reforms in the securities industry, such as Reg FD and theGlobal Settlement between regulators and Wall Street research departments,have led to the (perhaps unintended) consequence that many stocks, includingsome listed on the NYSE, no longer enjoy analyst coverage. The Wall StreetJournal has reported numerous anecdotes in which executives are concernedabout the lack of analyst coverage on their stock and the adverse effect on theirstock price. Our results indicate that for firms suffering from reduced analystcoverage, mass media coverage as well as firms’ public relations efforts aimedat creating awareness and familiarity could pay off in terms of generating in-vestor interest and reducing the cost of capital, especially in the post Reg FDenvironment.2
The remainder of the paper is organized as follows. Section I reviews theliterature. Section II describes our data. Sections III and IV present and discussthe main empirical results. Section V concludes.
I. Literature Review
This paper is related to the literature on the relation between media and stockreturns, and the literature on the cross-sectional pattern of stock returns.
A. The Media and the Stock Market
Earlier papers in this literature include Klibanoff et al. (1998), who showedthat country-specific news reported on the front page of the New York Timesaffects the pricing of closed-end country funds. They find that during weeksof front-page news, price movements are more closely related to fundamen-tals. They therefore argue that news events lead some investors to react morequickly. More recently, Tetlock (2007) analyzes the linguistic content of themass media and reports that media pessimism predicts downward pressureand a subsequent reversal. Tetlock et al. (2008) further document that the frac-tion of negative words used in news stories predicts earnings and stock returns.These findings suggest that qualitative information embedded in news storiescontributes to the efficiency of stock prices.
Among papers that examine broadly defined media exposure, ours is the firstthat documents a cross-sectional relation between media coverage and securityreturns. Several recent papers document a positive relation between media andliquidity but fail to find significant return differentials. For example, Antweilerand Frank (2004) find that stock messages predict market volatility but their
2 Reports confirm that companies are paying more attention to mass media after Regulation FD.According to a survey conducted in 2004 by Thomas L. Harris/Impulse Research, companies haveincreased spending on public relations by an average of 28% compared to that a year ago.
2026 The Journal of Finance R©
effect on returns is small. Grullon, Kanatas, and Weston (2004) document thatfirms with larger advertising expenditures have more liquid stocks. Frieder andSubrahmanyam (2005) report that individuals are more likely to hold stockswith strong brand recognition. Meschke (2004) finds that stocks experience astrong run-up and reversal during the 11 days after CEO interviews on CNBC.None of these papers finds persistent cross-sectional return patterns.3
Our paper is closely related to but distinct from Chan (2003), who exam-ines momentum and reversal patterns following large price moves with andwithout accompanying news. Using data obtained mainly from the Dow JonesNewswire, Chan (2003) focuses on headline news. In contrast, we enumerate ar-ticles (not necessarily headlines) in mass-circulation newspapers and focus oncoverage. We note that “news” and “coverage” are indeed different: Many stockswith news (headlines in the Dow Jones Newswire) remain neglected by massmedia; in addition, while newswires are released in real time and contain gen-uine news, this is unlikely to be the case for mass print media due to publicationlags. Another distinction is that Chan (2003) looks at market reactions to newsin the time dimension (and the difference therein between winners and losers),whereas we examine the cross-sectional differences between stocks with andwithout coverage. We defer a more detailed discussion of the relation betweenour results and those in Chan (2003) to Section IV.
Our paper is also related to Barber and Odean (2008), who show that in-dividual investors are net buyers of attention-grabbing stocks, for example,stocks in the news.4 They argue that individuals face difficulties when choos-ing which stocks to buy from a large pool of candidates; thus, attention-grabbingstocks such as those in the news are more likely to enter their choice set. Thisbuying pattern seems consistent with the media effect we document to theextent that individuals’ buying pressure temporarily pushes up the prices ofattention-grabbing (in-the-news) stocks, but such pressure subsequently re-verses. Whether the media effect is driven by individual buying pressure isexamined in Section III below.
B. The Determinants of Stock Returns in the Cross-section
Our paper is also related to the literature that analyzes the determinantsof the cross-section of stock returns. Among recent studies in this literature,two papers are related to ours. Diether, Malloy, and Scherbina (2002) (DMS)document that stocks with higher analyst forecast dispersion yield lower futurereturns. Ang et al. (2006) (AHXZ) document that stocks with high idiosyncratic
3 A separate stream of research represented by Mullainathan and Shleifer (2005) and Gentzkowand Shapiro (2006a, 2006b) studies media bias. In addition, an older literature examines marketreactions to rumors featured in the popular “Heard on the Street” column in the Wall Street Journal(see, for example, Pound and Zeckhauser (1990)).
4 In a related paper, Kumar and Lee (2006) show that individual investors trade in concert andthat systematic retail trading explains return comovements for stocks with a high retail concen-tration. This paper leaves open the question of the origin of the systematic component of retailtrades. Barber and Odean (2008) suggest that one source could be mass media coverage.
Media Coverage and the Cross-section of Stock Returns 2027
volatility (with respect to the Fama-French (1993) three-factor model) exhibit“abysmally” low returns. We find that media coverage is positively related toboth analyst forecast dispersion and idiosyncratic volatility, after controllingfor firm size.5 Thus, our result that no-coverage stocks earn higher returns isconsistent with both the DMS finding and the AHXZ finding. In Section IV, wediscuss in more detail the relations between these results and show that themedia effect is not subsumed under either effect.
Finally, another related paper is Easley, Hvidkjaer, and O’Hara (2002), whoinvestigate whether information asymmetry between informed and uninformedtraders is a determinant of asset returns. The authors propose and estimate aproxy for asymmetric information called PIN (Probability of Informed Trading)and show that it has incremental explanatory power for cross-sectional returnsafter controlling for size and book-to-market. Our analysis reveals that the me-dia effect is not explained by PIN, suggesting that the media effect we documentis not driven by information asymmetries between informed and uninformedtraders.
II. Data and Descriptive Statistics
Our sample consists of all companies listed on the NYSE and 500 ran-domly selected companies listed on the NASDAQ between January 1, 1993 andDecember 31, 2002. The NYSE universe contains mainly large stocks. To theextent that large stocks enjoy good information dissemination, our sample is bi-ased against finding any media effect. Following prior work, we exclude stockswith prices below $5 to ensure that results are not driven by small illiquidstocks or bid-ask bounce.
We use the number of newspaper articles about a stock to proxy for the stock’soverall media exposure.6 To collect this information, we systematically searchthe LexisNexis database for articles published in major U.S. newspapers thatrefer to the companies in our sample. We focus on four influential daily newspa-pers with nationwide circulation: New York Times (NYT), USA Today (USAT),Wall Street Journal (WSJ), and Washington Post (WP). With weekday circula-tion of about six million copies, these four newspapers account for 11% of totaldaily circulation in the United States.7
For each company in our sample, we obtain from LexisNexis its associatedindexing keywords. We then manually match these company names with other
5 Vega (2006) also documents that media coverage and analyst forecast dispersion are positivelycorrelated.
6 The rise of the internet in recent years as a mainstream media could have a large impact onthe relevance of print media. Our sample ends in 2002, which diminishes this impact.
7 Our sample includes four of the five most circulated newspapers in the United States. Accordingto the Audit Bureau of Circulation, the WSJ, NYT, WP, and USAT had average daily circulationsof 1.8, 1.1, 0.7, and 2.2 million paid copies, respectively (from April 1, 2002, to September 30,2002). According to the Newspaper Association of America, the aggregate daily circulation of allnewspapers is 55 million.
2028 The Journal of Finance R©
standard data sets.8 LexisNexis uses a “relevance score” to measure the qualityof the match between an article and a company. This score is based on criteriasuch as the keyword’s frequency, and its weight and location within the docu-ment. To capture articles with a primary focus on a given company, we retainarticles with a relevance score of 90% or above, which LexisNexis describes as“Major References.” To obtain a time series of company-specific coverage, wetake the weighted sum of articles published about each company in each month,where weights equal the newspapers’ circulation in 2002, obtained from the Au-dit Bureau of Circulations.
We obtain stock return, market capitalization, and trading volume data fromCRSP, and accounting data, such as book value of assets, from Compustat.Analyst coverage data are collected from I/B/E/S summary files. We measureanalyst coverage for each firm and year in our sample by counting the numberof analysts making fiscal year-end forecasts. We also estimate the fraction ofindividual ownership for each stock and year as 1 minus the fraction of totalinstitutional ownership, obtained by aggregating 13f filings.
Table I provides summary statistics on the newspaper coverage of our samplestocks. Panels A, B, and C pertain to all, NYSE, and NASDAQ stocks, respec-tively. For brevity, Panel A reports annual statistics, whereas Panels B and Creport average statistics over the entire period. We report both unconditionalcoverage statistics, namely, the fraction of firms covered by each source, andconditional statistics, namely, the number of newspaper articles per coveredstock.
Several interesting observations can be made about media coverage patterns.First, overall newspaper coverage is surprisingly low. Even among NYSE stocks,which are generally large, over 25% are not featured in the press in a typicalyear. Coverage is even lower for NASDAQ stocks, with only about 42% of themreceiving coverage in a given year. Second, the breadth of coverage differs con-siderably across newspapers. WSJ and NYT have the most comprehensive cov-erage, featuring 57% and 54% of NYSE stocks, respectively. WP and USAT havesignificantly less coverage. In particular, while NYT, WP, and USAT togethercover 56% of firms, NYT alone covers 54%, indicating that the incremental cov-erage by WP and USAT is only 2%. Finally, the numbers also imply that thereis considerable overlap—about 75%—in the different newspapers’ coverage.9
This overlap together with the low marginal contribution of widely circulatednewspapers such as USAT and WP indicates that even though we focus on onlyfour papers, our data are representative of the newspaper media. To the extentthat coverage is correlated across media types, our data are also a reasonableproxy of overall media coverage.
8 Data errors and omissions could create sampling error. LexisNexis tries to minimize this prob-lem by associating each company with multiple keywords. For example, IBM is associated withboth “IBM” and “International Business Machine.”
9 Wall Street Journal alone covers 59% of NYSE stocks. The three nonfinancial papers combinedcover 57% of NYSE stocks (Panel B of Table II). But all four papers combined cover 73%, indicatingthat the overlap between WSJ and the nonfinancial papers is around 75%.
Media Coverage and the Cross-section of Stock Returns 2029
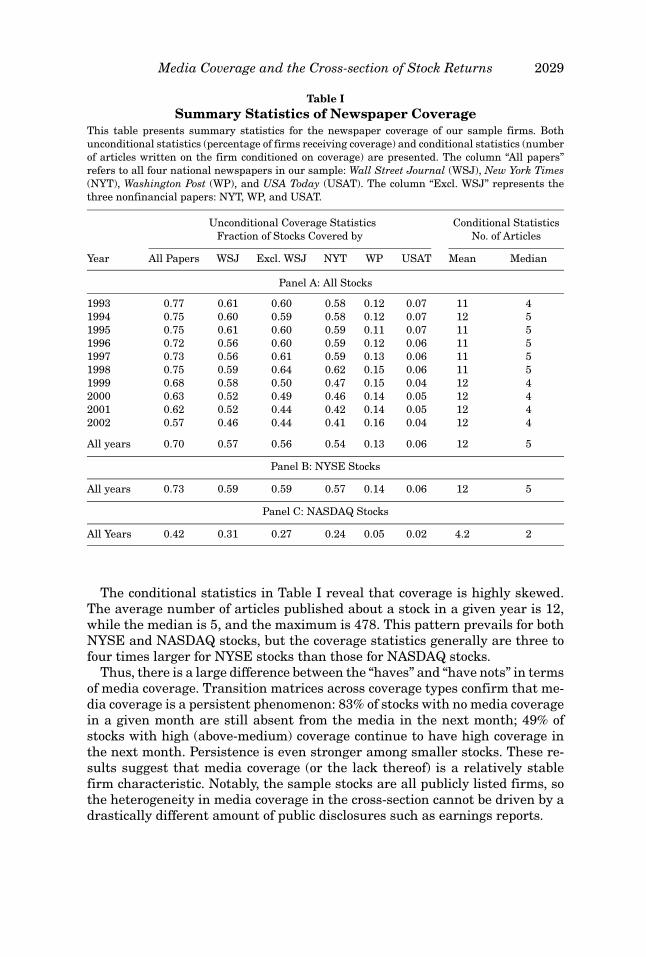
Table ISummary Statistics of Newspaper Coverage
This table presents summary statistics for the newspaper coverage of our sample firms. Bothunconditional statistics (percentage of firms receiving coverage) and conditional statistics (numberof articles written on the firm conditioned on coverage) are presented. The column “All papers”refers to all four national newspapers in our sample: Wall Street Journal (WSJ), New York Times(NYT), Washington Post (WP), and USA Today (USAT). The column “Excl. WSJ” represents thethree nonfinancial papers: NYT, WP, and USAT.
Unconditional Coverage Statistics Conditional StatisticsFraction of Stocks Covered by No. of Articles
Year All Papers WSJ Excl. WSJ NYT WP USAT Mean Median
Panel A: All Stocks
1993 0.77 0.61 0.60 0.58 0.12 0.07 11 41994 0.75 0.60 0.59 0.58 0.12 0.07 12 51995 0.75 0.61 0.60 0.59 0.11 0.07 11 51996 0.72 0.56 0.60 0.59 0.12 0.06 11 51997 0.73 0.56 0.61 0.59 0.13 0.06 11 51998 0.75 0.59 0.64 0.62 0.15 0.06 11 51999 0.68 0.58 0.50 0.47 0.15 0.04 12 42000 0.63 0.52 0.49 0.46 0.14 0.05 12 42001 0.62 0.52 0.44 0.42 0.14 0.05 12 42002 0.57 0.46 0.44 0.41 0.16 0.04 12 4
All years 0.70 0.57 0.56 0.54 0.13 0.06 12 5
Panel B: NYSE Stocks
All years 0.73 0.59 0.59 0.57 0.14 0.06 12 5
Panel C: NASDAQ Stocks
All Years 0.42 0.31 0.27 0.24 0.05 0.02 4.2 2
The conditional statistics in Table I reveal that coverage is highly skewed.The average number of articles published about a stock in a given year is 12,while the median is 5, and the maximum is 478. This pattern prevails for bothNYSE and NASDAQ stocks, but the coverage statistics generally are three tofour times larger for NYSE stocks than those for NASDAQ stocks.
Thus, there is a large difference between the “haves” and “have nots” in termsof media coverage. Transition matrices across coverage types confirm that me-dia coverage is a persistent phenomenon: 83% of stocks with no media coveragein a given month are still absent from the media in the next month; 49% ofstocks with high (above-medium) coverage continue to have high coverage inthe next month. Persistence is even stronger among smaller stocks. These re-sults suggest that media coverage (or the lack thereof) is a relatively stablefirm characteristic. Notably, the sample stocks are all publicly listed firms, sothe heterogeneity in media coverage in the cross-section cannot be driven by adrastically different amount of public disclosures such as earnings reports.
2030 The Journal of Finance R©
0.00%
5.00%
10.00%
15.00%
20.00%
25.00%
30.00%
0 1 2 3 4 5 6 7 8 9
1-digit SIC code
Per
cen
t o
f sa
mp
le
Stocks covered in the media Stocks not covered in the media
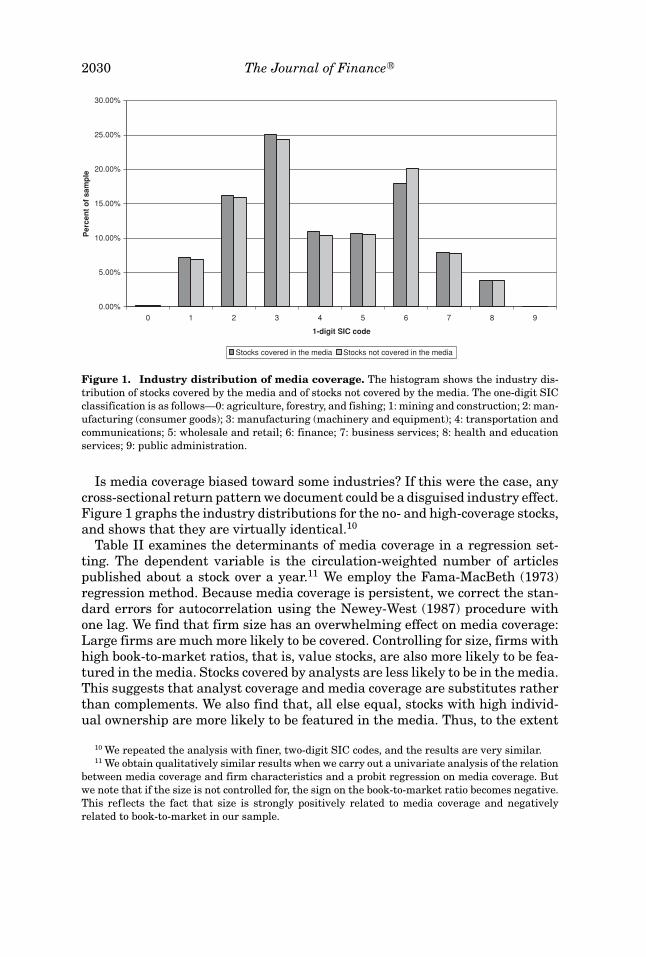
Figure 1. Industry distribution of media coverage. The histogram shows the industry dis-tribution of stocks covered by the media and of stocks not covered by the media. The one-digit SICclassification is as follows—0: agriculture, forestry, and fishing; 1: mining and construction; 2: man-ufacturing (consumer goods); 3: manufacturing (machinery and equipment); 4: transportation andcommunications; 5: wholesale and retail; 6: finance; 7: business services; 8: health and educationservices; 9: public administration.
Is media coverage biased toward some industries? If this were the case, anycross-sectional return pattern we document could be a disguised industry effect.Figure 1 graphs the industry distributions for the no- and high-coverage stocks,and shows that they are virtually identical.10
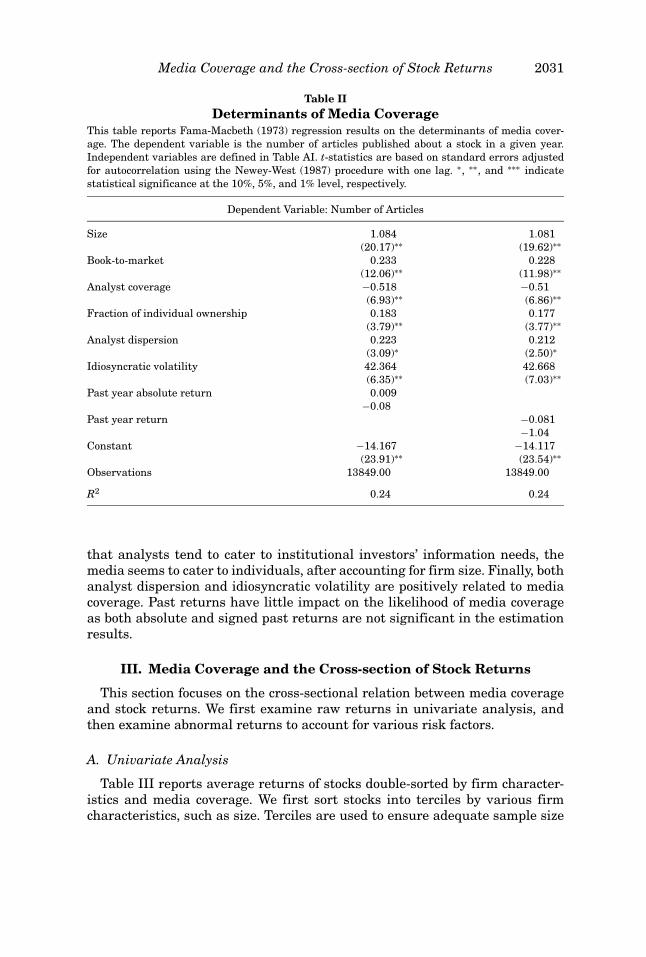
Table II examines the determinants of media coverage in a regression set-ting. The dependent variable is the circulation-weighted number of articlespublished about a stock over a year.11 We employ the Fama-MacBeth (1973)regression method. Because media coverage is persistent, we correct the stan-dard errors for autocorrelation using the Newey-West (1987) procedure withone lag. We find that firm size has an overwhelming effect on media coverage:Large firms are much more likely to be covered. Controlling for size, firms withhigh book-to-market ratios, that is, value stocks, are also more likely to be fea-tured in the media. Stocks covered by analysts are less likely to be in the media.This suggests that analyst coverage and media coverage are substitutes ratherthan complements. We also find that, all else equal, stocks with high individ-ual ownership are more likely to be featured in the media. Thus, to the extent
10 We repeated the analysis with finer, two-digit SIC codes, and the results are very similar.11 We obtain qualitatively similar results when we carry out a univariate analysis of the relation
between media coverage and firm characteristics and a probit regression on media coverage. Butwe note that if the size is not controlled for, the sign on the book-to-market ratio becomes negative.This reflects the fact that size is strongly positively related to media coverage and negativelyrelated to book-to-market in our sample.
Media Coverage and the Cross-section of Stock Returns 2031
Table IIDeterminants of Media Coverage
This table reports Fama-Macbeth (1973) regression results on the determinants of media cover-age. The dependent variable is the number of articles published about a stock in a given year.Independent variables are defined in Table AI. t-statistics are based on standard errors adjustedfor autocorrelation using the Newey-West (1987) procedure with one lag. ∗, ∗∗, and ∗∗∗ indicatestatistical significance at the 10%, 5%, and 1% level, respectively.
Dependent Variable: Number of Articles
Size 1.084 1.081(20.17)∗∗ (19.62)∗∗
Book-to-market 0.233 0.228(12.06)∗∗ (11.98)∗∗
Analyst coverage −0.518 −0.51(6.93)∗∗ (6.86)∗∗
Fraction of individual ownership 0.183 0.177(3.79)∗∗ (3.77)∗∗
Analyst dispersion 0.223 0.212(3.09)∗ (2.50)∗
Idiosyncratic volatility 42.364 42.668(6.35)∗∗ (7.03)∗∗
Past year absolute return 0.009−0.08
Past year return −0.081−1.04
Constant −14.167 −14.117(23.91)∗∗ (23.54)∗∗
Observations 13849.00 13849.00
R2 0.24 0.24
that analysts tend to cater to institutional investors’ information needs, themedia seems to cater to individuals, after accounting for firm size. Finally, bothanalyst dispersion and idiosyncratic volatility are positively related to mediacoverage. Past returns have little impact on the likelihood of media coverageas both absolute and signed past returns are not significant in the estimationresults.
III. Media Coverage and the Cross-section of Stock Returns
This section focuses on the cross-sectional relation between media coverageand stock returns. We first examine raw returns in univariate analysis, andthen examine abnormal returns to account for various risk factors.
A. Univariate Analysis
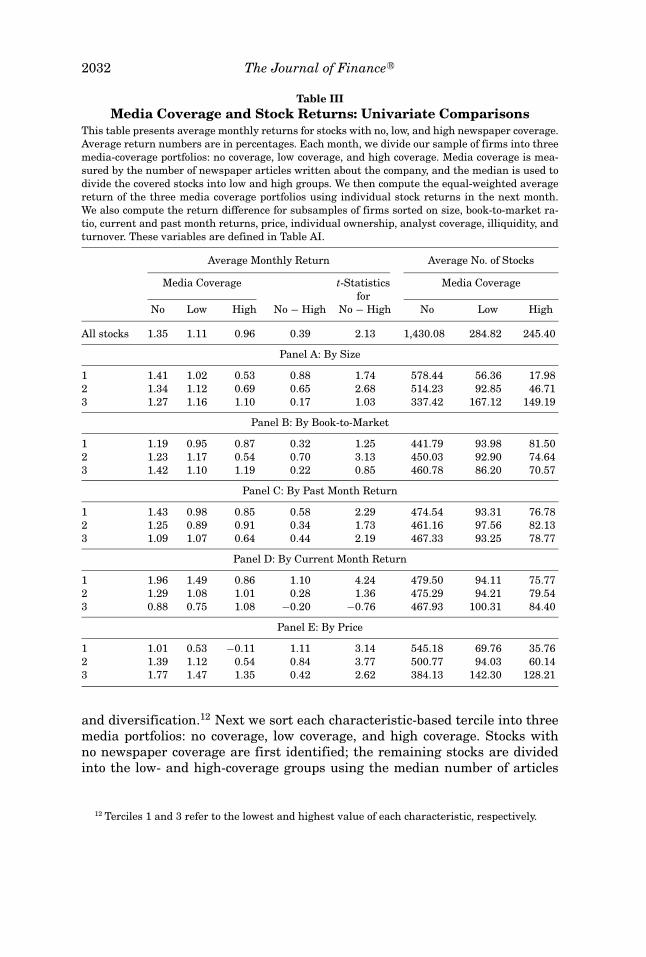
Table III reports average returns of stocks double-sorted by firm character-istics and media coverage. We first sort stocks into terciles by various firmcharacteristics, such as size. Terciles are used to ensure adequate sample size
2032 The Journal of Finance R©
Table IIIMedia Coverage and Stock Returns: Univariate Comparisons
This table presents average monthly returns for stocks with no, low, and high newspaper coverage.Average return numbers are in percentages. Each month, we divide our sample of firms into threemedia-coverage portfolios: no coverage, low coverage, and high coverage. Media coverage is mea-sured by the number of newspaper articles written about the company, and the median is used todivide the covered stocks into low and high groups. We then compute the equal-weighted averagereturn of the three media coverage portfolios using individual stock returns in the next month.We also compute the return difference for subsamples of firms sorted on size, book-to-market ra-tio, current and past month returns, price, individual ownership, analyst coverage, illiquidity, andturnover. These variables are defined in Table AI.
Average Monthly Return Average No. of Stocks
Media Coverage t-Statistics Media Coveragefor
No Low High No − High No − High No Low High
All stocks 1.35 1.11 0.96 0.39 2.13 1,430.08 284.82 245.40
Panel A: By Size
1 1.41 1.02 0.53 0.88 1.74 578.44 56.36 17.982 1.34 1.12 0.69 0.65 2.68 514.23 92.85 46.713 1.27 1.16 1.10 0.17 1.03 337.42 167.12 149.19
Panel B: By Book-to-Market
1 1.19 0.95 0.87 0.32 1.25 441.79 93.98 81.502 1.23 1.17 0.54 0.70 3.13 450.03 92.90 74.643 1.42 1.10 1.19 0.22 0.85 460.78 86.20 70.57
Panel C: By Past Month Return
1 1.43 0.98 0.85 0.58 2.29 474.54 93.31 76.782 1.25 0.89 0.91 0.34 1.73 461.16 97.56 82.133 1.09 1.07 0.64 0.44 2.19 467.33 93.25 78.77
Panel D: By Current Month Return
1 1.96 1.49 0.86 1.10 4.24 479.50 94.11 75.772 1.29 1.08 1.01 0.28 1.36 475.29 94.21 79.543 0.88 0.75 1.08 −0.20 −0.76 467.93 100.31 84.40
Panel E: By Price
1 1.01 0.53 −0.11 1.11 3.14 545.18 69.76 35.762 1.39 1.12 0.54 0.84 3.77 500.77 94.03 60.143 1.77 1.47 1.35 0.42 2.62 384.13 142.30 128.21
and diversification.12 Next we sort each characteristic-based tercile into threemedia portfolios: no coverage, low coverage, and high coverage. Stocks withno newspaper coverage are first identified; the remaining stocks are dividedinto the low- and high-coverage groups using the median number of articles
12 Terciles 1 and 3 refer to the lowest and highest value of each characteristic, respectively.
Media Coverage and the Cross-section of Stock Returns 2033
published. The equal-weighed return of each portfolio during the followingmonth is then tabulated.13
The first row of Table III shows that unconditionally, the average monthly re-turns for stocks with no-, low-, and high-media coverage are 1.35%, 1.11%, and0.96%, respectively. The difference between the no- and high-coverage groups isa statistically significant and economically meaningful 0.39% per month (4.8%per year). Thus, sorting stocks on media coverage alone generates a significantreturn differential in the cross-section, pointing to a return premium associ-ated with no-coverage stocks. The double-sorts in Panels A–E control for firmcharacteristics one at a time and generally support the unconditional result.With only one exception, the return difference between no-coverage stocks andhigh-coverage stocks is positive, and in most cases significant. Therefore, thereseems to be a pervasive no-coverage premium among stocks, even holding var-ious firm characteristics constant.
Interestingly, Panel D of this table shows that the no-media premium is foundonly among low current return (i.e., loser) stocks (tercile 1). This is consistentwith the finding in Chan (2003) that loser stocks with contemporaneous newsexperience negative return drift and loser stocks without news tend to reversesubsequently. Chan also finds no such drift nor reversal for winner stocks. Thissuggests that our media effect could be related to the phenomena documentedby Chan (2003). We return to this point in much greater detail in Section IVbelow when we explore the explanations of the media effect.
B. Multivariate Analysis
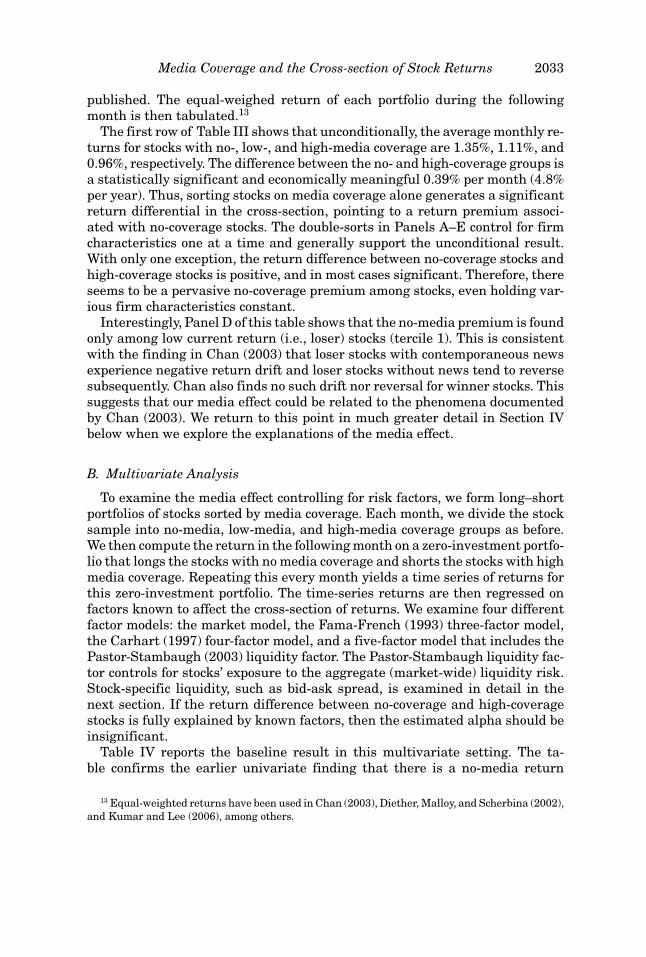
To examine the media effect controlling for risk factors, we form long–shortportfolios of stocks sorted by media coverage. Each month, we divide the stocksample into no-media, low-media, and high-media coverage groups as before.We then compute the return in the following month on a zero-investment portfo-lio that longs the stocks with no media coverage and shorts the stocks with highmedia coverage. Repeating this every month yields a time series of returns forthis zero-investment portfolio. The time-series returns are then regressed onfactors known to affect the cross-section of returns. We examine four differentfactor models: the market model, the Fama-French (1993) three-factor model,the Carhart (1997) four-factor model, and a five-factor model that includes thePastor-Stambaugh (2003) liquidity factor. The Pastor-Stambaugh liquidity fac-tor controls for stocks’ exposure to the aggregate (market-wide) liquidity risk.Stock-specific liquidity, such as bid-ask spread, is examined in detail in thenext section. If the return difference between no-coverage and high-coveragestocks is fully explained by known factors, then the estimated alpha should beinsignificant.
Table IV reports the baseline result in this multivariate setting. The ta-ble confirms the earlier univariate finding that there is a no-media return
13 Equal-weighted returns have been used in Chan (2003), Diether, Malloy, and Scherbina (2002),and Kumar and Lee (2006), among others.

2034 The Journal of Finance R©
Table IVMedia-Related Trading Profits: Baseline Multivariate Results
This table examines the profitability of a trading strategy that longs stocks with no media coverageand shorts stocks with high media coverage. Each month, stocks are sorted according to the numberof newspaper articles published about them. A stock is considered to have no media coverageif no article is published about the stock in a given month. A stock is considered to have highcoverage if the number of articles about it exceeds the medium in a given month. Both the long andshort positions are equally weighted, and held for 1 month after portfolio formation. Portfolios arerebalanced monthly. The resulting time-series returns on the long–short portfolio are regressedon widely accepted risk factors (defined in Table AI), and the results are reported. p-values are inparentheses. ∗, ∗∗, and ∗∗∗ indicate statistical significance at the 10%, 5%, and 1% level, respectively.
Model 1: Model 2: Model 3: Model 4:CAPM FF Three-Factor Carhart Four-Factor PS Liquidity
Panel A: Long No-Media Stocks, Short High-Media Stocks
Mkt-rf −0.1434∗∗∗ −0.1182∗∗∗ −0.0910∗∗∗ −0.0918∗∗∗(0.0002) (0.0004) (0.0053) (0.0050)
SMB – 0.3719∗∗∗ 0.3565∗∗∗ 0.3602∗∗∗(0.0000) (0.0000) (0.0000)
HML – 0.1580∗∗∗ 0.1732∗∗∗ 0.1620∗∗∗(0.0004) (0.0001) (0.0003)
UMD – – 0.0767∗∗∗ 0.0939∗∗∗(0.0006) (0.0017)
LIQ – – – −2.5419(0.3783)
Intercept 0.0045∗∗ 0.0035∗∗∗ 0.0024∗∗ 0.0023∗(0.0110) (0.0051) (0.0471) (0.0611)
Observations 119 119 119 119R2 0.11 0.58 0.62 0.62
Panel B: Alphas for No-Media Coverage Stocks
Intercept 0.0065∗∗∗ 0.0024 0.0042∗∗∗ 0.0039∗∗∗(0.0072) (0.1020) (0.0023) (0.0047)
Panel C: Alphas for High-Media Coverage Stocks
Intercept 0.002 −0.0011 0.0018 0.0016(0.3263) (0.4749) (0.1263) (0.1859)
premium even after controlling for market, size, book-to-market, momentum,and liquidity factors. However, the factor models do explain a significant portionof the premium, as the alphas successively decrease when factors are added.The alpha in the five-factor model is 23 basis points per month, compared to45 basis points in the market model, indicating that about half of the alpharelative to the market model is absorbed by commonly known risk factors.14
14 We also repeat the analysis splitting our sample period into two subperiods, 1993 to 1997 and1998 to 2002. The results are qualitatively similar in both subperiods (no-coverage stocks generatesignificant positive alphas relative to high-coverage stocks), albeit statistically stronger in the first
Media Coverage and the Cross-section of Stock Returns 2035
The loadings on the risk factors are interesting. The positive and significantcoefficients on the size factor (SMB), the book-to-market factor (HML), and themomentum factor (UMD) indicate that the zero-investment strategy of buyingno-media coverage stocks and shorting high-media coverage stocks has a posi-tive exposure to small stocks, value stocks, and momentum stocks. The strategyhas a negative exposure to overall market movements, as indicated by the neg-ative sign on the market factor. This is because our portfolio strategy is zeroinvestment, and the stocks sold short (those with high media coverage) tendto co-move more with the market than stocks held long (those with no mediacoverage).
Panels B and C of Table IV investigate the long (no-coverage stocks) andshort (high-coverage stocks) legs of the portfolio separately. The results hereshow that the media effect is primarily driven by the long positions in thestocks without media coverage. High-coverage stocks, in contrast, do not exhibitsignificant alphas.15 This asymmetry indicates that stocks neglected by themedia earn a significant return premium, and this causes the observed mediaeffect.
Interestingly, this asymmetry also suggests that the media effect is unlikelyto be caused by individual (or generally unsophisticated) investors’ buying ofattention-grabbing stocks. Barber and Odean (2008) document that individualsexert buying pressure on attention-grabbing stocks such as those in the news.These stocks subsequently underperform. If the media effect is caused by thisphenomenon, we expect the long–short strategy alpha to come from the shortleg (high-coverage stocks). But this is not the case. On the contrary, the mediaeffect stems from those stocks in oblivion that earn abnormally high returns.We will examine the cause of this in detail in Section IV below.
We also use the characteristic-based benchmark method in Daniel et al.(1997) (DGTW) to check our results. The benchmark returns are based on portfo-lios matched on size, book-to-market, and momentum.16 In unreported analysis,we find that the difference in benchmark-adjusted returns between no-coveragestocks and high-coverage stocks is 29 basis points per month (t-statistic = 3.34).In addition, it is the no-coverage stocks that continue to exhibit positive andsignificant alphas: The DGTW benchmark-adjusted returns are 23 basis pointsper month (t-statistic = 6.63) for these stocks, and −6 basis points (t-statistic =
subperiod. Lower statistical significance in the second sub-period seems to be caused by a higheroverall return volatility.
15 The fact that both the long and short legs of the portfolios display positive alphas—thoughnot significantly so for high-media coverage stocks—reflects both the equal-weighting schemeused to compute portfolio returns and the limited number of stocks in our sample, which consistsmostly of NYSE stocks. Indeed, we find that stocks with a low media coverage (the remainingmiddle-portfolio stocks not used in the portfolio strategy) also exhibit a positive alpha on average:It equals, respectively, 0.0038, 0.0001, 0.0022, and 0.0019 in models 1–4. Importantly, alphas aremonotonically decreasing in the amount of media coverage, which is consistent with the Mertonhypothesis.
16 We thank the authors of DGTW (1997) for making the benchmark data available via RussWermer’s website at http://www.smith.umd.edu/faculty/rwermers/ftpsite/Dgtw/coverpage.htm.
2036 The Journal of Finance R©
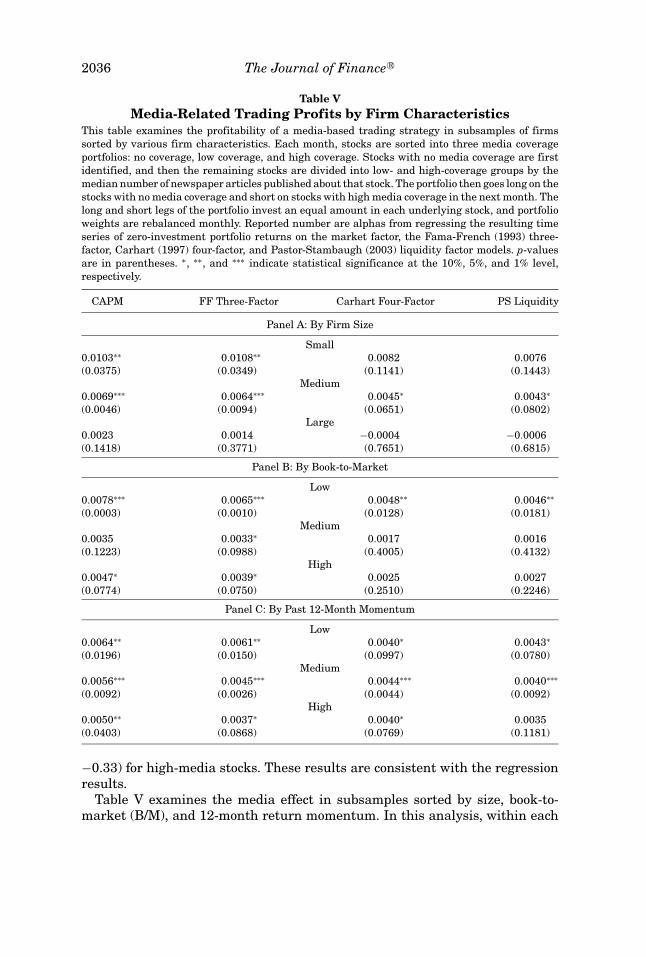
Table VMedia-Related Trading Profits by Firm Characteristics
This table examines the profitability of a media-based trading strategy in subsamples of firmssorted by various firm characteristics. Each month, stocks are sorted into three media coverageportfolios: no coverage, low coverage, and high coverage. Stocks with no media coverage are firstidentified, and then the remaining stocks are divided into low- and high-coverage groups by themedian number of newspaper articles published about that stock. The portfolio then goes long on thestocks with no media coverage and short on stocks with high media coverage in the next month. Thelong and short legs of the portfolio invest an equal amount in each underlying stock, and portfolioweights are rebalanced monthly. Reported number are alphas from regressing the resulting timeseries of zero-investment portfolio returns on the market factor, the Fama-French (1993) three-factor, Carhart (1997) four-factor, and Pastor-Stambaugh (2003) liquidity factor models. p-valuesare in parentheses. ∗, ∗∗, and ∗∗∗ indicate statistical significance at the 10%, 5%, and 1% level,respectively.
CAPM FF Three-Factor Carhart Four-Factor PS Liquidity
Panel A: By Firm Size
Small0.0103∗∗ 0.0108∗∗ 0.0082 0.0076(0.0375) (0.0349) (0.1141) (0.1443)
Medium0.0069∗∗∗ 0.0064∗∗∗ 0.0045∗ 0.0043∗
(0.0046) (0.0094) (0.0651) (0.0802)Large
0.0023 0.0014 −0.0004 −0.0006(0.1418) (0.3771) (0.7651) (0.6815)
Panel B: By Book-to-Market
Low0.0078∗∗∗ 0.0065∗∗∗ 0.0048∗∗ 0.0046∗∗
(0.0003) (0.0010) (0.0128) (0.0181)Medium
0.0035 0.0033∗ 0.0017 0.0016(0.1223) (0.0988) (0.4005) (0.4132)
High0.0047∗ 0.0039∗ 0.0025 0.0027(0.0774) (0.0750) (0.2510) (0.2246)
Panel C: By Past 12-Month Momentum
Low0.0064∗∗ 0.0061∗∗ 0.0040∗ 0.0043∗
(0.0196) (0.0150) (0.0997) (0.0780)Medium
0.0056∗∗∗ 0.0045∗∗∗ 0.0044∗∗∗ 0.0040∗∗∗
(0.0092) (0.0026) (0.0044) (0.0092)High
0.0050∗∗ 0.0037∗ 0.0040∗ 0.0035(0.0403) (0.0868) (0.0769) (0.1181)
−0.33) for high-media stocks. These results are consistent with the regressionresults.
Table V examines the media effect in subsamples sorted by size, book-to-market (B/M), and 12-month return momentum. In this analysis, within each
Media Coverage and the Cross-section of Stock Returns 2037
tercile, the relevant characteristic is controlled for in two ways: by sorting andby an explicit regression control. The goal of this analysis is to identify thesubsets of stocks in which the media effect is the strongest. Table V shows thatthe media effect is concentrated among small stocks (Panel A) and low B/Mstocks (Panel B). It is also stronger among stocks with low past returns (PanelC), but the difference across the momentum terciles is not as dramatic as thatin the univariate results in Panel D of Table III.
The fact that the media effect is strongest among small stocks raises the con-cern that the media effect is spurious, as many documented return anomaliesoccur among small firms. Two specific concerns are that (1) the media effectcould be driven by bid-ask bounce, which affects the measurement of smallstock returns, and (2) the media effect could be a misnamed size effect. Re-garding the first concern, we note that our sample consists mainly of NYSEstocks, which are far larger and more liquid than the overall CRSP universe.17
In addition, we have dropped stocks with prices below $5, making it less likelythat the no-media premium is caused by bid-ask bounce among small stocks.Furthermore, in robustness checks below, we compute returns from bid-askmidpoints and find results that are quantitatively and qualitatively similar tothe baseline. Regarding the second concern, it is important to interpret the testin Table V correctly. If the media coverage sort were simply a disguised sorton size, then the media effect should disappear within each size tercile. In ourexperiment, stocks within each size tercile are relatively homogenous in sizebut differ significantly in media coverage. We find a strong media effect amongthe smallest set of stocks and no effect among the largest set. Because smallerstocks as a group tend to have poorer information dissemination compared tolarger stocks, the asymmetry between small and large stocks suggests that massmedia plays a bigger role when information dissemination is otherwise poor; forlarge stocks, which already have many information channels, the role of massmedia is limited.
C. Robustness
In this section, we conduct a number of robustness checks on the baseline re-sults presented in Tables IV and V. In particular, we try to alleviate the concernthat the media effect could be driven by (a) bid-ask bounce, (b) postearnings an-nouncement drift, (c) delisting bias, (d) IPO underperformance, and (e) sectorbias.
Monthly returns based on closing prices are used in the baseline analysis.This could lead to a bias induced by bid-ask bounce if some stocks are thinlytraded. This is a relevant concern as we find that the media effect is more
17 For example, the mean (median) equity market capitalization is $4.7B ($947M) for NYSEstocks, compared to $1.9B ($198M) for all CRSP stocks. The mean (median) monthly trading volumeis $352M ($59M) for NYSE stocks compared to $223M ($14M) for all CRSP stocks. The mean(median) bid-ask spread using monthly closing data is 1.83% (1.43%) for NYSE stocks comparedto 2.83% (1.96%) for all CRSP stocks.
2038 The Journal of Finance R©
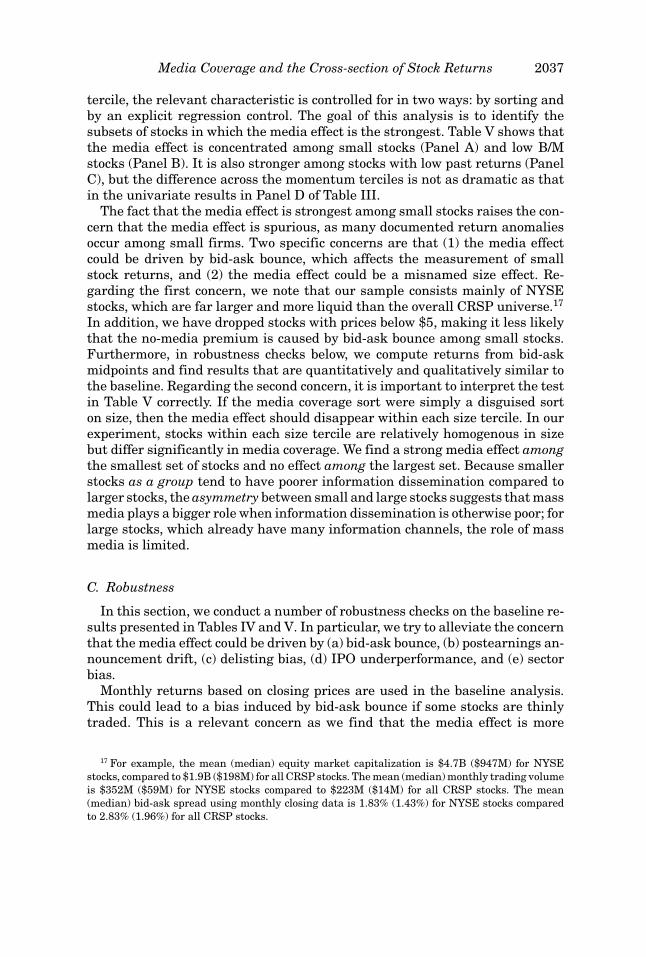
Table VIRobustness Checks
This table reports returns of a long–short portfolio that goes long on stocks with no media coveragein the previous month and goes short on stocks with high (above median) media coverage in theprevious month, after applying various data screens. The long and short legs of the portfolio investan equal amount in each underlying stock. p-values are in parentheses. ∗, ∗∗, and ∗∗∗ indicatestatistical significance at the 10%, 5%, and 1% level, respectively.
Model 1: Model 2: FF Model 3: Carhart Model 4: PSCAPM Three-Factor Four-Factor Liquidity Factor
Panel A: Returns Based on Bid-Ask Midpoints
Intercept 0.0051∗∗∗ 0.0043∗∗∗ 0.0030∗∗ 0.0029∗∗(0.0051) (0.0010) (0.0159) (0.0195)
Panel B: Excluding Earnings Announcements
Intercept 0.0056∗∗∗ 0.0049∗∗∗ 0.0046∗∗∗ 0.0046∗∗∗(0.0017) (0.0035) (0.0082) (0.0080)
Panel C: Excluding IPOs
Intercept 0.0046∗∗∗ 0.0033∗∗∗ 0.0021∗ 0.002(0.0086) (0.0081) (0.0789) (0.1036)
Panel D: With Corrected Delisting Returns
Intercept 0.0045∗∗ 0.0035∗∗∗ 0.0024∗∗ 0.0023∗(0.0109) (0.0047) (0.0470) (0.0607)
Panel E: Applying All Three Filters (B–D)
Intercept 0.0053∗∗∗ 0.0044∗∗ 0.0039∗∗ 0.0039∗∗(0.0038) (0.0133) (0.0332) (0.0343)
Panel F: Excluding Tech-Sector Stocks
Intercept 0.0038∗∗ 0.0035∗∗∗ 0.0031∗∗∗ 0.0031∗∗∗(0.0264) (0.0022) (0.0086) (0.0097)
concentrated among smaller stocks. To check this possibility, we repeat ouranalysis using monthly returns based on bid-ask midpoints, rather than trans-action prices. Panel A of Table VI shows that results based on bid-ask midpointsare similar to and indeed slightly stronger than the baseline results. Thus, weconclude that our result is not driven by microstructure issues such as bid-askbounce.
Postearnings announcement drift, IPO underperformance, and delisting biasare well-documented return anomalies and hence we need to check that the me-dia effect is not driven by them. These anomalies could lead to a spurious mediaeffect if media coverage is more intense for firms announcing earnings, for IPOstocks, or for stocks going through delisting. For example, if media coverage is
Media Coverage and the Cross-section of Stock Returns 2039
biased toward bad earnings news, or if returns tend to drift more following badearnings news compared to good earnings news,18 then indeed a strategy thatlongs no-coverage stocks and shorts high-coverage stocks will generate a pos-itive alpha. A no-coverage premium would also result if high-coverage stocksare disproportionally represented by IPO stocks that subsequently underper-form. Finally, if media has a tendency to cover firms going through delisting fornegative reasons (for example, liquidation or takeover), then the delisting biasreported by Shumway (1997) could also lead to a spurious media effect.19
To check that our results are not driven by postearnings announcement driftor IPO underperformance, we exclude all potentially earnings-related mediacoverage20 and all IPO stocks. To check that our results are not driven by delist-ing bias, we follow Shumway (1997) and replace all missing delisting returnswith −30% for delisting codes of 500 or 520–584. Results for these robustnesschecks are reported in Panels B, C, and D of Table VI, respectively, and theyshow that the media effect is robust to these alternative specifications. Whenall three filters are simultaneously applied (Panel E), the results remain qual-itatively and quantitatively similar to the baseline.
Finally, we check that our results are not driven by the tech sector, which ex-perienced a dramatic rise and fall during our sample period. For this purpose,we exclude all tech-sector stocks from our sample.21 Panel F shows that the me-dia effect is robust and strong in the remaining nontech sector. Thus, it is nota tech-sector phenomenon. We also investigate whether the return differencebetween high- and no-coverage stocks is simply driven by differences in oper-ating performance. We fail to find support for this conjecture (unreported).22
We conclude that the media effect is not caused by a number of known returnanomalies.
IV. Explaining the Media Effect
In this section, we discuss three possible causes of the media effect: continu-ations and reversals in returns, lack of liquidity, and information frictions.
18 Both of these conjectures, however, are not borne by the data. Hayn (1995) finds that returnsare more sensitive to positive earnings surprises than to negative ones. Moreover, in our sample,stocks in the media are just as likely to experience positive returns as negative returns in themonth contemporaneous with media coverage, so mass media does not seem to exhibit a bias.
19 Shumway (1997) reports that the CRSP database has a systematic upward bias on returns ofcertain delisted stocks. This is because negative delisting returns are coded as missing when thedelisting is due to performance reasons.
20 We consider any media coverage in months that a firm reports earnings as potentially earn-ings related. Excluding these articles reduces our media sample by about 40%. Thus, earningsannouncements seem to account for a large proportion of routine coverage.
21 We use the tech/non-tech classification based on SIC codes and PERMNOs in Loughran andRitter (2004).
22 We examine two operational performance measures: return on equity, defined as income beforeextraordinary items over book equity, and return on assets, defined as income before extraordinaryitems over total assets. We compare both levels and changes of these measures for firms with andwithout media coverage, and fail to find significant differences.
2040 The Journal of Finance R©
A. Return Continuations and Reversals
One possibility is that the media effect we document is a transient phe-nomenon caused by short-term return continuations or reversals. Chan (2003)documents that stocks with low returns during months when firms have head-line news (he calls these stocks “news losers”) experience negative returndrift for over 12 months.23 In contrast, “no-news losers” (i.e., stocks that havelow returns during months without accompanying news) see their returnsreverse.24
These patterns could generate the result that no-coverage stocks have higherreturns than high-coverage stocks, to the extent that no-coverage stocks cor-respond to “no news stocks” and high-coverage stocks to “news stocks.” In thiscase, our long–short strategy will be equivalent to buying no-news stocks andshorting news stocks, and given the reversal among no-news stocks (losers inparticular) and drift among news stocks (losers in particular), such a strategywould generate a positive alpha, consistent with our results. Since the reversaland drift effects documented by Chan (2003) are concentrated among losers,there is a concern that our results represent the same reversal/drift patterns,especially since Panel D of Table III suggests that the media effect is strongeramong losers.25
Relating to Chan (2003), we first note that “news” and “coverage” are in factmarkedly different. While 92% of our high-coverage stocks have contemporane-ous headline news, so do 76% of our no-coverage stocks.26 Thus, many companieswith news continue to be neglected by mass media. This means that equatingthe new/no-news classification in Chan (2003) and the coverage/no-coverageclassification in this paper is inaccurate.
We now investigate whether the media effect is due to either (a) negativereturn drift among high-coverage losers or (b) return reversal of no-coveragelosers. Scenario (a) can be ruled out because the alpha on the long–short port-folio stems primarily from the long leg (no-coverage stocks). If the media effectwere caused by negative drift among high-coverage losers, then the alpha of thelong–short portfolio should primarily come from the short leg (high-coverage
23 There is no strong drift, however, for “news winners.” Drift among “news losers” is consistentwith the “bad news travels slowly” idea in Hong, Lim, and Stein (2000).
24 Chan finds no reversal among “no-news winners.” In other words, the drift and reversal effectsin Chan (2003) are both concentrated among losers.
25 However we note that once multiple risk factors are controlled for, Panel C in Table V showsthat the no-media premium exists in winners as well as losers, albeit slightly stronger amonglosers.
26 We thank Wesley Chan for making some of his data available to us for comparison. Furtheranalysis reveals that Chan’s media data have overall more “hits” per stock than our data. This is dueto a larger set of sources used by Chan, which include in particular the Dow Jones Newswire service.Interestingly, Chan’s data cover disproportionally more loser stocks, small stocks, and stocks withearnings news. Statistics pertaining to these comparisons are available from this article’s InternetAppendix available at http://www.afajof.org/supplements.asp.
Media Coverage and the Cross-section of Stock Returns 2041
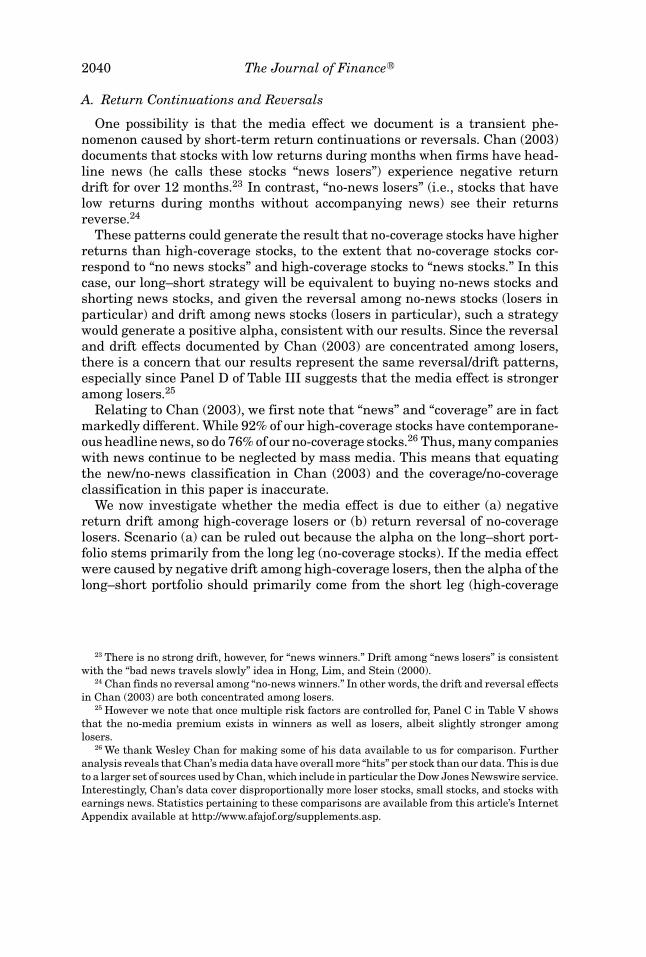
Table VIIDifferent Formation Periods and Holding Periods
This table reports mean returns for the long–short portfolio that goes long on stocks with no mediacoverage over the past N months (the “formation period”) and short on stocks with high (above-median) media coverage over the past N months (N = 1, 3, 6). Average monthly alphas for variousholding horizons between 1 month and 12 months are reported (the “holding period”). ∗, ∗∗, and ∗∗∗indicate statistical significance at the 10%, 5%, and 1% level, respectively.
Holding Time-Series CAPM FF Three- Carhart Four- PS Five-Period Mean Alpha Factor Alpha Factor Alpha Factor Alpha
Panel A: Formation Period = 1 Month
1 month 0.0039∗∗ 0.0045∗∗ 0.0035∗∗∗ 0.0024∗∗ 0.0023∗3 months 0.0033∗ 0.0039∗∗ 0.0028∗∗ 0.0016 0.00156 months 0.003 0.0036∗∗ 0.0026∗∗ 0.0013 0.00129 months 0.0026 0.0033∗ 0.0024∗∗ 0.0012 0.001112 months 0.0027 0.0034∗ 0.0025∗∗ 0.0013 0.0011
Panel B: Formation Period = 3 Months
1 month 0.0036∗∗ 0.0042∗∗ 0.0033∗∗∗ 0.0022∗∗ 0.0020∗3 months 0.0032∗ 0.0038∗∗ 0.0030∗∗∗ 0.0017 0.00156 months 0.0029 0.0035∗∗ 0.0028∗∗ 0.0016 0.00159 months 0.0028 0.0035∗∗ 0.0029∗∗∗ 0.0017∗ 0.001512 months 0.0028 0.0034∗ 0.0030∗∗∗ 0.0017∗ 0.0016
Panel C: Formation Period = 6 Months
1 month 0.0032∗ 0.0038∗∗ 0.0032∗∗∗ 0.0022∗∗ 0.0021∗∗3 months 0.0029 0.0034∗∗ 0.0030∗∗∗ 0.0021∗∗ 0.0020∗∗6 months 0.0027 0.0033∗ 0.0030∗∗∗ 0.0021∗∗ 0.0020∗9 months 0.0027 0.0033∗ 0.0032∗∗∗ 0.0022∗∗ 0.0021∗∗12 months 0.0028 0.0035∗ 0.0033∗∗∗ 0.0022∗∗ 0.0021∗
stocks) of the strategy. But Table IV shows that alphas are indistinguishablefrom zero among high-coverage stocks.27
To evaluate the possibility that the media effect is caused by return reversalsamong no-coverage stocks, we examine the effect’s horizon. The idea is as fol-lows. Chan (2003) documents that the reversal pattern among no-news losers isshort-lived: Among stocks priced above $5 (similar to our sample), the reversalis very weak and only found in the first month after portfolio formation. Thus, ifreversal explains our result, we expect it to be short-lived as well. Accordingly,we examine the alphas of our long–short strategy for postformation holdingperiods ranging from 1 to 12 months and report the findings in Table VII. Weuse the calendar-time overlapping portfolio approach of Jegadeesh and Titman
27 Table IV shows that high coverage stocks actually exhibit positive alphas, although they aregenerally insignificant. The fact that both the long and short legs of the strategy exhibit positivealphas in terms of magnitude is a result of equal weighting and our sample stocks constituting onlya subsample of the CRSP universe. If Chan’s results explain ours, however, we’d expect negativealphas among high-coverage stocks, which is not the case.
2042 The Journal of Finance R©
-0.0015
-0.001
-0.0005
0
0.0005
0.001
0.0015
0.002
0.0025
0.003
1 2 3 4 5 6 7 8 9 10 11 12
Months after portfolio formation
Alp
ha
No-coverage stocks, 1m formation period High-coverage stocks, 1m formation period
No-coverage stocks, 3m formation period High-coverage stocks, 3m formation period
No-coverage stocks, 6m formation period High-coverage stocks, 6m formation period
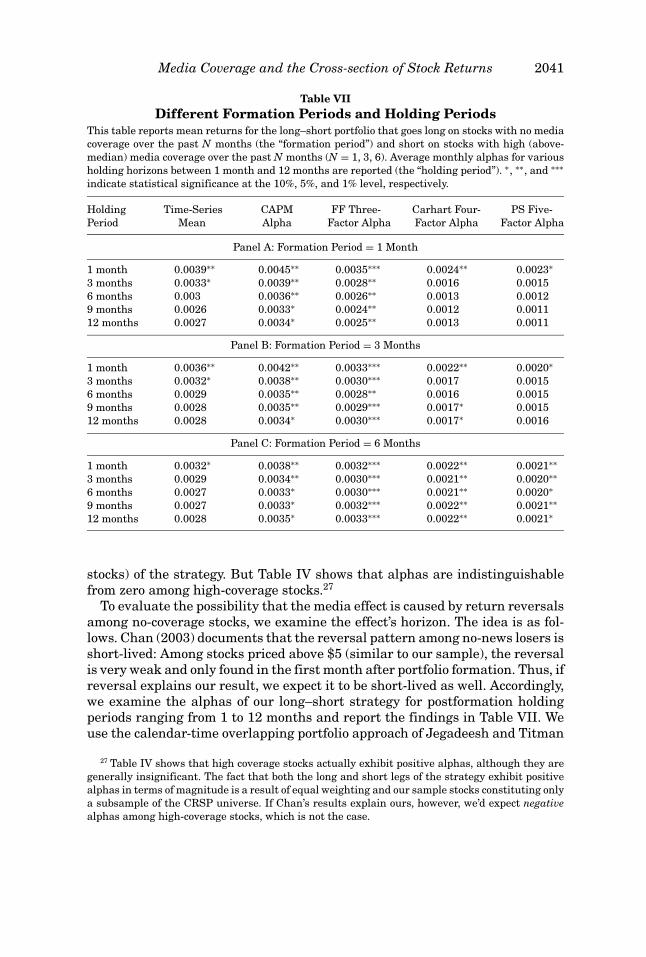
Figure 2. Horizon analysis of the media effect. Fama–French three-factor adjusted alphasfor no- and high-coverage stocks are displayed for various formation and holding periods. Stocksare assigned to portfolios based on their coverage in the media over the past 1, 3, or 6 months. Theportfolio returns are plotted for holding horizons ranging from 1 month to 12 months.
(1993) to calculate postformation returns.28 For brevity, only select holding pe-riod results are tabulated. We form portfolios based on 1-month media coverage(Panel A, as in our baseline analysis), as well as 3- and 6-month media coverage(Panels B and C).
This table shows that the Fama-French three-factor alpha of our long–shortstrategy persists far beyond the 1-month horizon (three-factor alphas are com-parable to Chan (2003) who adjusts for size and book-to-market ratios. Ourconclusion does not change when four-factor alphas are used). Corroboratingthis conclusion, Figure 2 graphs the alphas of the long and short legs sepa-rately, and indicates not only that the alphas on the long–short strategy stemfrom the long (no-coverage) leg, as we have noted above, but also that they areremarkably stable. These patterns suggest that our results are not driven byshort-term reversals among no-coverage stocks.
In addition, both Table VII and Figure 2 also show that the media effect ismore stable when a longer formation period is used. In particular, while themomentum factor reduces the alpha’s significance in the 1-month formation
28 This approach has been widely adopted in the finance literature. See, among others, Fama(1998), Diether, Malloy, and Scherbina (2002), and Chan (2003). Fama (1998) indicates that “Thetime-series variation of the monthly abnormal return on this portfolio accurately captures theeffects of the correlation of returns across event stocks missed by the model for expected returns.The mean and variance of the time series of abnormal portfolio returns can be used to test theaverage monthly response of the prices of event stocks . . . following the event” (p. 295).
Media Coverage and the Cross-section of Stock Returns 2043
case (Panel A, baseline), it remains stable and strong 12 months postformationwith four-factor adjustments when the longer formation period of 6 months isused.
In summary, the results in this section suggest that the media effect is notcaused by short-term reversal and continuation patterns widely discussed inthe literature and documented in Chan (2003). Instead, it is a stable cross-sectional return difference the cause of which is examined further below. Wealso show that “news” and “coverage” are different, as many stocks with newsremain neglected by the media (as do many stocks without news).
B. The “Impediments to Trade” Hypothesis
The rational agent framework offers two explanations for the cross-sectionalreturn differential we document.29 If the media effect represents an arbitrageopportunity, it can only persist if large impediments prevent rational agentsfrom trading on it. We call this the “impediments-to-trade” or “illiquidity” hy-pothesis. Alternatively, the return differential may not reflect a mispricing buta fair compensation for risks not captured by standard factors. We examinethese two explanations in turn.
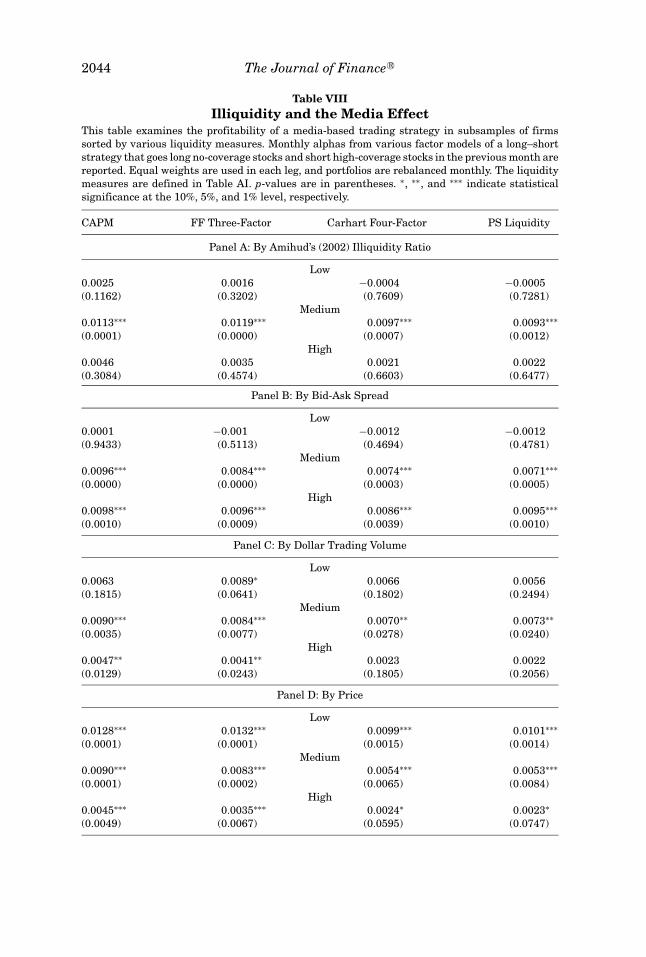
To test the impediments-to-trade hypothesis, we examine its cross-sectionalpredictions. If impediments to trade explain the media effect, then the media-based abnormal profits should be concentrated among the most illiquid stocks.In Table VIII, we sort stocks into groups based on various liquidity proxies andreport the long–short alphas for each group. We examine four liquidity proxies:the Amihud (2002) illiquidity ratio, bid-ask spread, dollar trading volume, andprice.
The results in Table VIII provide mixed evidence. Sorting stocks by bid-askspread (Panel B) provides the strongest support for the illiquidity hypothesis:This panel shows that the media effect is strongest among stocks with the high-est bid-ask spread. Sorting by price (Panel D) results in significant alphas in allthree price ranges, but the magnitude of the media effect is the largest amonglow-priced stocks, consistent with the illiquidity hypothesis. The implicationsof sorts by the Amihud illiquidity ratio and daily trading volume are less clear.For both measures, we find that the media effect is most pronounced amongstocks with a medium level of liquidity; in fact, the effect actually disappearsamong the most illiquid stocks by these measures, when the theory suggeststhat it should be the strongest.
We can estimate how much liquidity is needed to dissipate the alpha as anadditional check on the illiquidity hypothesis. The Amihud ratio, calculated asa stock’s absolute daily return divided by its daily trading volume (scaled by106), is a price impact measure. For stocks that exhibit the strongest mediaeffect (the medium group in Panel A), the average value of this ratio is 0.016,
29 Alternatively, the media effect could be driven by behavioral stories. We do not investigate thisclass of explanations formally in this paper. We note, however, in Section III B that it is unlikelyto be caused by attention-induced buying pressure as in Barber and Odean (2008).
2044 The Journal of Finance R©
Table VIIIIlliquidity and the Media Effect
This table examines the profitability of a media-based trading strategy in subsamples of firmssorted by various liquidity measures. Monthly alphas from various factor models of a long–shortstrategy that goes long no-coverage stocks and short high-coverage stocks in the previous month arereported. Equal weights are used in each leg, and portfolios are rebalanced monthly. The liquiditymeasures are defined in Table AI. p-values are in parentheses. ∗, ∗∗, and ∗∗∗ indicate statisticalsignificance at the 10%, 5%, and 1% level, respectively.
CAPM FF Three-Factor Carhart Four-Factor PS Liquidity
Panel A: By Amihud’s (2002) Illiquidity Ratio
Low0.0025 0.0016 −0.0004 −0.0005(0.1162) (0.3202) (0.7609) (0.7281)
Medium0.0113∗∗∗ 0.0119∗∗∗ 0.0097∗∗∗ 0.0093∗∗∗(0.0001) (0.0000) (0.0007) (0.0012)
High0.0046 0.0035 0.0021 0.0022(0.3084) (0.4574) (0.6603) (0.6477)
Panel B: By Bid-Ask Spread
Low0.0001 −0.001 −0.0012 −0.0012(0.9433) (0.5113) (0.4694) (0.4781)
Medium0.0096∗∗∗ 0.0084∗∗∗ 0.0074∗∗∗ 0.0071∗∗∗(0.0000) (0.0000) (0.0003) (0.0005)
High0.0098∗∗∗ 0.0096∗∗∗ 0.0086∗∗∗ 0.0095∗∗∗(0.0010) (0.0009) (0.0039) (0.0010)
Panel C: By Dollar Trading Volume
Low0.0063 0.0089∗ 0.0066 0.0056(0.1815) (0.0641) (0.1802) (0.2494)
Medium0.0090∗∗∗ 0.0084∗∗∗ 0.0070∗∗ 0.0073∗∗(0.0035) (0.0077) (0.0278) (0.0240)
High0.0047∗∗ 0.0041∗∗ 0.0023 0.0022(0.0129) (0.0243) (0.1805) (0.2056)
Panel D: By Price
Low0.0128∗∗∗ 0.0132∗∗∗ 0.0099∗∗∗ 0.0101∗∗∗(0.0001) (0.0001) (0.0015) (0.0014)
Medium0.0090∗∗∗ 0.0083∗∗∗ 0.0054∗∗∗ 0.0053∗∗∗(0.0001) (0.0002) (0.0065) (0.0084)
High0.0045∗∗∗ 0.0035∗∗∗ 0.0024∗ 0.0023∗(0.0049) (0.0067) (0.0595) (0.0747)
Media Coverage and the Cross-section of Stock Returns 2045
meaning that a $1M trade triggers a 1.6% price impact. Given a four-factoralpha of 0.98% in this group, it would take a trade of 0.98%/1.6% = $0.61Mto eliminate the profit over a single day. This is a large amount according tocommon classifications of “large” and “small” trades.30 In addition, Panel Cshows that the media effect is strongest among stocks with a medium levelof trading volume. The average daily trading volume is about $2M for thesestocks, which is equal to the median daily volume among NYSE stocks. Thesenumbers suggest that the market is deep enough to support arbitrage trades,thus casting some doubt on whether impediments to trade explain the mediaeffect in practice.
C. The Investor Recognition Hypothesis
Merton (1987) offers an alternative explanation to the media effect withinthe rational agent paradigm. He models informationally incomplete marketsin which investors only know about a subset of the available stocks. In such mar-kets, stocks that are recognized by fewer investors need to offer higher returnsto compensate their holders for being imperfectly diversified. This hypothesis,known as the “investor recognition hypothesis,” has particular relevance to themedia effect. Mass media, by reaching a broad audience, can increase the degreeof investor recognition of a stock (even if it does not provide genuine news).
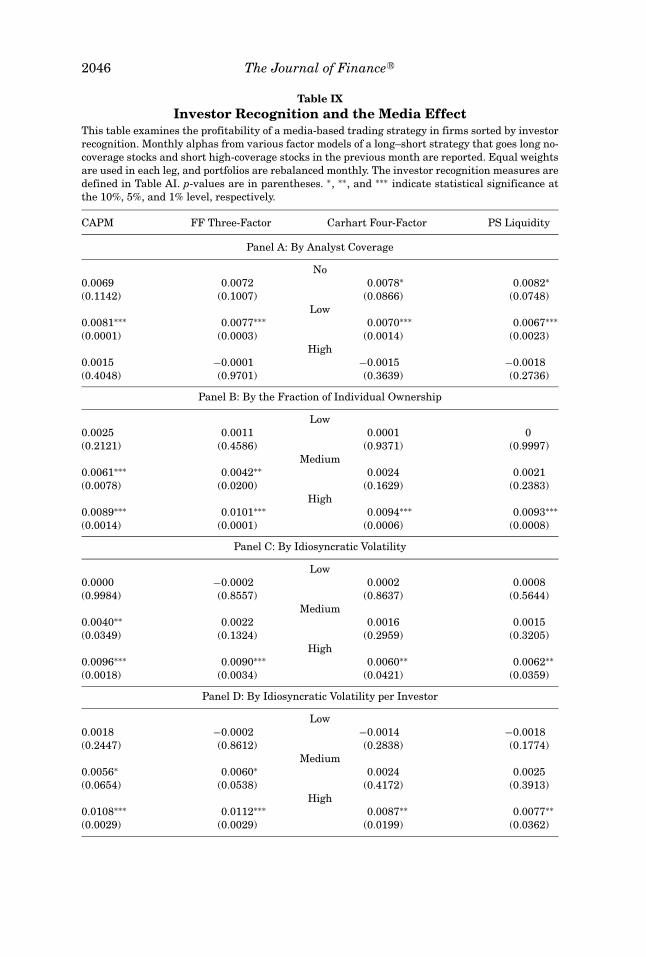
If media coverage improves investor recognition, then its effect should bestronger among stocks that otherwise have a lower degree of recognition. Wetest this hypothesis by sorting stocks on variables that reflect the degree ofinformation incompleteness. Our information proxies include analyst coverageand the fraction of individual ownership. We conjecture that low analyst cover-age and a high fraction of individual ownership characterize stocks with poorinformation dissemination, so we expect the media effect to be particularlystrong among these stocks. In addition, in Merton’s (1987) framework, firms’idiosyncratic risk is priced because of the imperfect diversification that stemsfrom a lack of investor recognition. Firms with higher idiosyncratic volatilityshould offer a return premium to compensate shareholders for the undiver-sified risk they impose. This suggests two additional proxies that indicate thecost of poor investor recognition: idiosyncratic volatility and the ratio of idiosyn-cratic volatility to the number of shareholders (obtained from 13f filings). Theformer measures the amount of idiosyncratic risk borne by investors due to im-perfect diversification; the latter measures the same amount on a per-investorbasis. Following Ang et al. (2006), we estimate firms’ idiosyncratic volatility asthe standard deviation of daily abnormal stock returns relative to the Fama-French three-factor model. If media coverage increases investor recognition andimproves diversification, its effect should be stronger among firms with higheridiosyncratic volatility and higher idiosyncratic volatility per shareholder.
Table IX reports the media effect among stocks sorted by our informationproxies. The results here provide broad support for the investor recognition
30 For example, Hvidkjaer (2006) suggests $3,400, $4,800, $7,300, $10,300, and $16,000 as cutoffsfor “small trades” for NYSE/AMEX quintiles.
2046 The Journal of Finance R©
Table IXInvestor Recognition and the Media Effect
This table examines the profitability of a media-based trading strategy in firms sorted by investorrecognition. Monthly alphas from various factor models of a long–short strategy that goes long no-coverage stocks and short high-coverage stocks in the previous month are reported. Equal weightsare used in each leg, and portfolios are rebalanced monthly. The investor recognition measures aredefined in Table AI. p-values are in parentheses. ∗, ∗∗, and ∗∗∗ indicate statistical significance atthe 10%, 5%, and 1% level, respectively.
CAPM FF Three-Factor Carhart Four-Factor PS Liquidity
Panel A: By Analyst Coverage
No0.0069 0.0072 0.0078∗ 0.0082∗(0.1142) (0.1007) (0.0866) (0.0748)
Low0.0081∗∗∗ 0.0077∗∗∗ 0.0070∗∗∗ 0.0067∗∗∗(0.0001) (0.0003) (0.0014) (0.0023)
High0.0015 −0.0001 −0.0015 −0.0018(0.4048) (0.9701) (0.3639) (0.2736)
Panel B: By the Fraction of Individual Ownership
Low0.0025 0.0011 0.0001 0(0.2121) (0.4586) (0.9371) (0.9997)
Medium0.0061∗∗∗ 0.0042∗∗ 0.0024 0.0021(0.0078) (0.0200) (0.1629) (0.2383)
High0.0089∗∗∗ 0.0101∗∗∗ 0.0094∗∗∗ 0.0093∗∗∗(0.0014) (0.0001) (0.0006) (0.0008)
Panel C: By Idiosyncratic Volatility
Low0.0000 −0.0002 0.0002 0.0008(0.9984) (0.8557) (0.8637) (0.5644)
Medium0.0040∗∗ 0.0022 0.0016 0.0015(0.0349) (0.1324) (0.2959) (0.3205)
High0.0096∗∗∗ 0.0090∗∗∗ 0.0060∗∗ 0.0062∗∗(0.0018) (0.0034) (0.0421) (0.0359)
Panel D: By Idiosyncratic Volatility per Investor
Low0.0018 −0.0002 −0.0014 −0.0018(0.2447) (0.8612) (0.2838) (0.1774)
Medium0.0056∗ 0.0060∗ 0.0024 0.0025(0.0654) (0.0538) (0.4172) (0.3913)
High0.0108∗∗∗ 0.0112∗∗∗ 0.0087∗∗ 0.0077∗∗(0.0029) (0.0029) (0.0199) (0.0362)
Media Coverage and the Cross-section of Stock Returns 2047
hypothesis. Panels A and B show that the media effect is stronger among stockswith low analyst coverage and a high percentage of individual ownership. Thesestocks are poorly covered by conventional information channels, and our resultssuggest that media coverage plays a large incremental role. Panels C and Dshow that the magnitude and significance of the media effect monotonically in-crease with idiosyncratic volatility and idiosyncratic volatility per shareholder,consistent with the predictions of the Merton model. The magnitude of the ef-fect is about 1% per month among stocks with the highest measures (Panels Cand D), which is economically large.
In summary, the results in the last two sections provide support for boththe illiquidity hypothesis and the investor recognition hypothesis. However,although illiquidity may explain why the media effect persists, it does not ex-plain why it arises in the first place. We conclude that the media effect maystem from media’s role in enhancing investor recognition, and that a lack ofadequate liquidity helps explain why it is not arbitraged away.
D. Media, Analyst Dispersion, and Idiosyncratic Volatility
An interesting question is whether the media effect is subsumed under re-cently documented anomalies related to analyst dispersion and idiosyncraticvolatility. Diether et al. (2002) (DMS) document that stocks with high analystforecast dispersion exhibit low future returns. Building on Miller (1977), theyargue that forecast dispersion proxies for heterogeneity in investors’ opinionsand that under short-sales constraints, prices reflect the most optimistic views.Ang et al. (2006) document that stocks with high idiosyncratic volatility earnlow future returns. This is at odds with the notion that investors should berewarded for bearing risk that they cannot diversify away (e.g., Merton (1987)).Furthermore, this effect cannot be explained by stocks’ exposure to systematicvolatility, leading the authors to conclude that the finding represents a puzzle.
We first note that the main finding in this paper is directionally consistentwith both results. Indeed, media coverage is positively related to both ana-lyst dispersion and idiosyncratic volatility (Table V). Thus, our finding thathigh-media coverage stocks earn lower returns is consistent with high ana-lyst dispersion stocks and high idiosyncratic volatility stocks earning lowerreturns.
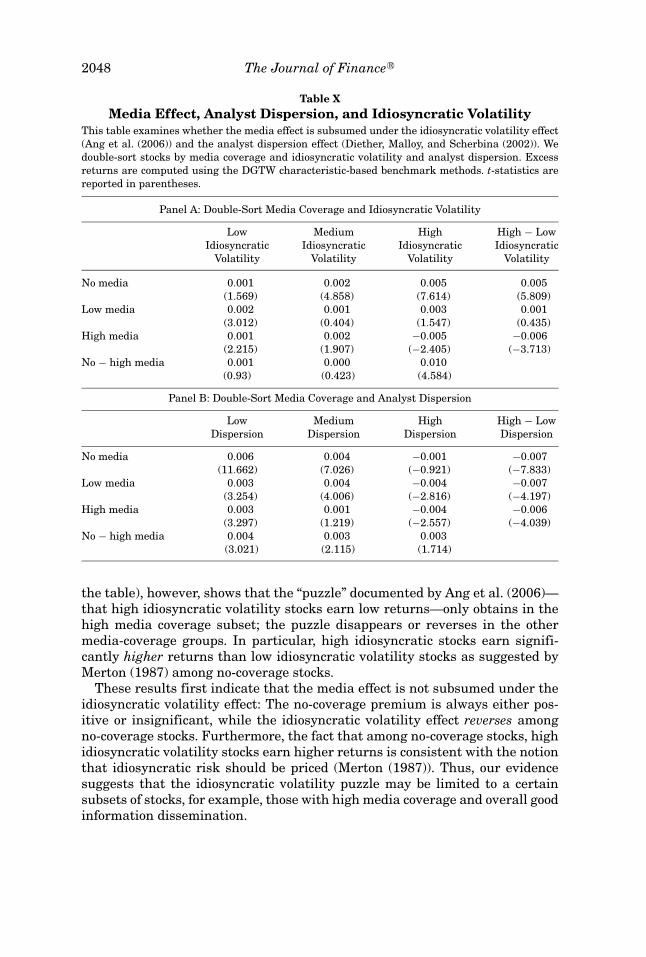
To investigate whether the media effect is subsumed under either effect,we double-sort stocks by media coverage and either analyst dispersion or id-iosyncratic volatility, and compare the return differential along each dimension.Table X reports the results. Excess returns for each group are calculated usingthe DGTW characteristic-based benchmark method.
Double-sorting stocks by media coverage and idiosyncratic volatility (Panel A)reveals that, controlling for idiosyncratic volatility (columns of the table), thereis a large no-media premium among high idiosyncratic volatility stocks, andan insignificant premium in the other two idiosyncratic volatility groups. Thisis consistent with results in Table IX that the media effect is concentrated inthe high idiosyncratic volatility group. Controlling for media coverage (rows of
2048 The Journal of Finance R©
Table XMedia Effect, Analyst Dispersion, and Idiosyncratic Volatility
This table examines whether the media effect is subsumed under the idiosyncratic volatility effect(Ang et al. (2006)) and the analyst dispersion effect (Diether, Malloy, and Scherbina (2002)). Wedouble-sort stocks by media coverage and idiosyncratic volatility and analyst dispersion. Excessreturns are computed using the DGTW characteristic-based benchmark methods. t-statistics arereported in parentheses.
Panel A: Double-Sort Media Coverage and Idiosyncratic Volatility
Low Medium High High − LowIdiosyncratic Idiosyncratic Idiosyncratic Idiosyncratic
Volatility Volatility Volatility Volatility
No media 0.001 0.002 0.005 0.005(1.569) (4.858) (7.614) (5.809)
Low media 0.002 0.001 0.003 0.001(3.012) (0.404) (1.547) (0.435)
High media 0.001 0.002 −0.005 −0.006(2.215) (1.907) (−2.405) (−3.713)
No − high media 0.001 0.000 0.010(0.93) (0.423) (4.584)
Panel B: Double-Sort Media Coverage and Analyst Dispersion
Low Medium High High − LowDispersion Dispersion Dispersion Dispersion
No media 0.006 0.004 −0.001 −0.007(11.662) (7.026) (−0.921) (−7.833)
Low media 0.003 0.004 −0.004 −0.007(3.254) (4.006) (−2.816) (−4.197)
High media 0.003 0.001 −0.004 −0.006(3.297) (1.219) (−2.557) (−4.039)
No − high media 0.004 0.003 0.003(3.021) (2.115) (1.714)
the table), however, shows that the “puzzle” documented by Ang et al. (2006)—that high idiosyncratic volatility stocks earn low returns—only obtains in thehigh media coverage subset; the puzzle disappears or reverses in the othermedia-coverage groups. In particular, high idiosyncratic stocks earn signifi-cantly higher returns than low idiosyncratic volatility stocks as suggested byMerton (1987) among no-coverage stocks.
These results first indicate that the media effect is not subsumed under theidiosyncratic volatility effect: The no-coverage premium is always either pos-itive or insignificant, while the idiosyncratic volatility effect reverses amongno-coverage stocks. Furthermore, the fact that among no-coverage stocks, highidiosyncratic volatility stocks earn higher returns is consistent with the notionthat idiosyncratic risk should be priced (Merton (1987)). Thus, our evidencesuggests that the idiosyncratic volatility puzzle may be limited to a certainsubsets of stocks, for example, those with high media coverage and overall goodinformation dissemination.
Media Coverage and the Cross-section of Stock Returns 2049
Double-sorting by media coverage and analyst dispersion (Panel B) showsthat neither effect subsumes the other. Within each media coverage group, ananalyst dispersion effect obtains whereby stocks with higher dispersion earnlower returns; similarly, within each analyst dispersion group, a media effect ob-tains whereby no-coverage stocks earn a return premium. However, the analystdispersion effect appears considerably stronger in magnitude and significancethan that in the media effect. This is perhaps not entirely surprising given thatour sample consists of mainly large and liquid NYSE stocks. The incrementalrole played by media is probably weaker than that in smaller stocks.
V. Conclusion
We examine the relation between media coverage and the cross-section ofstock returns. We find a significant return premium on stocks with no mediacoverage: On average, stocks not featured in the media outperform stocks fre-quently featured by over 0.20% per month, even after accounting for widelyaccepted risk factors—market, size, book-to-market, momentum, and liquidity.Moreover, this return premium is particularly large for small stocks and stockswith high individual ownership, low analyst following, and high idiosyncraticvolatility. For these subsamples, stocks with no media coverage outperformthose with high media coverage by 0.65–1% per month. These figures are notonly statistically significant but also economically large.
We show that the media effect is robust to a number of well-known returnanomalies and is distinct from time-series patterns such as return reversalsand continuations. Instead, the phenomenon represents a stable cross-sectionalreturn differential among high-coverage stocks and low-coverage stocks thatcould be explained by either illiquidity or investor recognition. We provide evi-dence that supports both hypotheses. However, since illiquidity can only explainthe persistence of the phenomenon but not its cause, we conclude that the me-dia effect stems from an information story such as Merton (1987), and the lackof liquidity helps perpetuate the phenomenon.
We also show that the media effect is consistent with, but not subsumed un-der, recently documented anomalies associated with analyst forecast dispersionand idiosyncratic volatility. Recent research shows that stocks with high ana-lyst forecast dispersion and high idiosyncratic volatility earn low returns. Wefind that media coverage is positively related to both analyst forecast dispersionand idiosyncratic volatility. Thus, our finding that high-media coverage stocksearn lower returns is consistent with both results. Interestingly, if idiosyncraticvolatility is interpreted as an indication of the speed at which firm-specific in-formation is incorporated into prices (e.g., Durnev, Morck, and Yeung (2004)),then the positive correlation between media coverage and idiosyncratic volatil-ity suggests that media coverage expedites the impounding of information intoprices. On the other hand, the positive correlation between media coverageand analyst forecast dispersion shows that media coverage does not lead to theconvergence of opinions. These observations suggest that mass media’s effecton security pricing stems from its ability to disseminate information broadly,rather than to shape opinions or form consensus.

2050 The Journal of Finance R©
One practical implication of our results is that coverage by mass media canplay a role in alleviating information problems even if it does not break gen-uine news. This has the further implication that companies’ media relationsactivities can affect their cost of capital. In recent years, regulatory changes inthe securities industry and cuts in Wall Street research departments have leftmany firms without analyst coverage. Our results suggest that the media (andfirms’ media relations departments) may offer a substitute or a supplement totraditional channels of corporate information such as analyst coverage.
Appendix
Table AIVariables’ Definitions
Stock Characteristics
Amihud’s (2002) illiquidityratio
Stock’s absolute return divided by its daily dollar tradingvolume, scaled by 106.
Analyst coverage Natural log of 1 plus the number of analysts issuing earningsforecasts on the stock in the past year.
Analyst dispersion Natural log of 1 plus the standard deviation of analyst forecastsdivided by the absolute value of the mean forecast.
Bid-ask spread Difference between the ask and the bid prices divided by themidpoint.
Book-to-market Natural log of the book value of equity divided by the marketvalue of equity, as of the previous year end.
Dollar trading volume Daily value of trades in a stock, averaged over all days in a year.Fraction of individual
ownershipPercentage of the stock’s shares outstanding owned by
individuals.Idiosyncratic volatility Natural log of the residual stock return from a Fama-French
(1993) three-factor regression based on daily data.Idiosyncratic volatility per
investorIdiosyncratic volatility scaled by the number of investors
obtained from 13f filings.Past year (month) absolute
returnAbsolute value of past year (month) return.
Past year (month) return (Signed) stock’s return measured over the previous year (month).Price Average closing price during the previous month.Size Natural log of the average market capitalization of equity over
the previous calendar year, in thousands of dollars.
Factors
Mkt-rf Market return minus return on the U.S. Treasury bond.SMB Return of a portfolio of small stocks minus the return of a
portfolio of large stocks.HML Return on a portfolio of stocks with high book-to-market ratio,
minus return on a portfolio of stocks with low book-to-marketratio.
UMD Return on a portfolio of stocks with a high past 12-month return,minus the return on a portfolio of stocks with a low past12-month return.
LIQ Traded liquidity factor constructed by Pastor and Stambaugh(2003).

Media Coverage and the Cross-section of Stock Returns 2051
REFERENCESAmihud, Yakov, 2002, Illiquidity and stock returns: Cross-section and time-series effects, Journal
of Financial Markets 5, 31–56.Ang, Andrew, Robert J. Hodrick, Yuhang Xing, and Xiaoyan Zhang, 2006, The cross-section of
volatility and expected returns, Journal of Finance 61, 259–299.Antweiler, Werner, and Murray Z. Frank, 2004, Is all that talk just noise? The information content
of internet stock message boards, Journal of Finance 59, 1259–1293.Barber, Brad, and Terry Odean, 2008, All that glitters: The effect of attention and news on the
buying behavior of individual and institutional investors, Review of Financial Studies 21,785–818.
Carhart, Mark, 1997, On persistence in mutual fund performance, Journal of Finance 52, 57–82.Chan, Wesley, 2003, Stock price reaction to news and no-news: Drift and reversal after headlines,
Journal of Financial Economics 70, 223–260.Daniel, Kent, Mark Grinblatt, Sheridan Titman, and Russ Wermers, 1997, Measuring mutual fund
performance with characteristic-based benchmarks, Journal of Finance 52, 1–33.Diether, Karl B., Christopher J. Malloy, and Anna Scherbina, 2002, Differences of opinion and the
cross section of stock returns, Journal of Finance 57, 2113–2141.Durnev, Art, Randall Morck, and Bernard Yeung, 2004, Value-enhancing capital budgeting and
firm-specific return variation, Journal of Finance 59, 65–105.Easley, David, Soeren Hvidkjaer, and Maureen O’Hara, 2002, Is information risk a determinant
of asset returns? Journal of Finance 57, 2185–2221.Fama, Eugene F., 1998, Market efficiency, long-term returns, and behavioral finance, Journal of
Financial Economics 49, 283–306.Fama, Eugene F., and Kenneth French, 1993, Common risk factors in the returns on stocks and
bonds, Journal of Financial Economics 33, 3–56.Fama, Eugene F., and James MacBeth, 1973, Risk, return and equilibrium: Empirical tests, Journal
of Political Economy 81, 607–636.Frieder, Laura, and Avanidhar Subrahmanyam, 2005, Brand perceptions and the market for com-
mon stock, Journal of Financial and Quantitative Analysis 40, 57–85.Gentzkow, Matthew, and Jesse Shapiro, 2006a, Media bias and reputation, Journal of Political
Economy 114, 280–316.Gentzkow, Matthew, and Jesse Shapiro, 2006b, What drives media slant? Evidence from U.S. daily
newspapers, Working paper, National Bureau of Economic Research.Grullon, Gustavo, George Kanatas, and James P. Weston, 2004, Advertising, breadth of ownership,
and liquidity, Review of Financial Studies 17, 439–461.Hayn, Carla, 1995, The information content of losses, Journal of Accounting and Economics 20,
125–153.Hong, Harrison, Terrence Lim, and Jeremy Stein, 2000, Bad news travels slowly: Size, analyst
coverage and the profitability of momentum strategies, Journal of Finance 55, 265–295.Hvidkjaer, Soeren, 2006, A trade-based analysis of momentum, Review of Financial Studies 19,
457–491.Jegadeesh, Narasimhan, and Sheridan Titman, 1993, Returns to buying winners and selling losers:
Implications for stock market efficiency, Journal of Finance 48, 65–91.Klibanoff, Peter, Owen Lamont, and Thierry A. Wizman, 1998, Investor reaction to salient news
in closed-end country funds, Journal of Finance 53, 673–699.Kumar, Alok, and Charles M. C. Lee, 2006, Retail investor sentiment and return comovements,
Journal of Finance 61, 2451–2486.Loughran, Tim, and Jay Ritter, 2004, Why has IPO underpricing changed over time? Financial
Management Autumn, 5–37.Merton, Robert C., 1987, A simple model of capital market equilibrium with incomplete information,
Journal of Finance 42, 483–510.Meschke, Felix J., 2004, CEO interviews on CNBC, Working paper, Arizona State University.Miller, E., 1977, Risk, uncertainty, and divergence of opinion, Journal of Finance 32, 1151–
1168.

2052 The Journal of Finance R©
Mullainathan, Sendhil, and Andrei Shleifer, 2005, The market for news, American Economic Re-view 95, 1031–1053.
Newey, Whitney, and Kenneth West, 1987, A simple, positive semi-definite, heteroscedastic andautocorrelation consistent covariance matrix, Econometrica 55, 703–708.
Pastor, Lubos, and Robert F. Stambaugh, 2003, Liquidity risk and expected stock returns, Journalof Political Economy 111(3), 642–685.
Pound, John, and Richard Zeckhauser, 1990, Clearly heard on the Street: The effect of takeoverrumors on stock prices, Journal of Business 63, 291–308.
Shumway, Tyler, 1997, The delisting bias in CRSP data, The Journal of Finance 52, 327–340.Tetlock, Paul C., 2007, Giving content to investor sentiment: The role of media in the stock market,
Journal of Finance 62, 1139–1168.Tetlock, Paul C., Maytal Saar-Tsechansky, and Sofus Macskassy, 2008, More than words: Quanti-
fying language to measure firms’ fundamentals, Journal of Finance 63, 1437–1467.Vega, Clara, 2006, Stock price reaction to public and private information, Journal of Financial
Economics 82, 103–133.