Embed Size (px)
Citation preview

Metasys Advanced Reporting System and Energy Essentials Help Guide
LIT-12011312
Software Release 10.0
Johnson Controlswww.johnsoncontrols.com2018-12-17


ContentsContentsMetasys Advanced Reporting System Overview........................................................................... 5
Summary of Changes............................................................................................................................5
Concepts............................................................................................................................................5
ADX/ODS and SCT Interaction..............................................................................................................5
Microsoft SQL Server Reporting Services...........................................................................................7
Security Administration........................................................................................................................ 7
Advanced Reporting System Access................................................................................................... 8
Advanced Reporting System Log in Details....................................................................................... 9
Energy Essentials Overview..................................................................................................................9
Energy Essentials Workflow.......................................................................................................9
Energy Essentials Setup Considerations................................................................................11
User Interface...................................................................................................................................... 23
Web Browser Tools................................................................................................................... 25
Toolbar....................................................................................................................................... 25
Tabs.............................................................................................................................................26
Panel Area..................................................................................................................................26
Standard and Predefined Reports.....................................................................................................30
Report Selection Folder Organization Strategy...............................................................................31
Report Screen.......................................................................................................................................32
Report Toolbar..................................................................................................................................... 34
Report Types........................................................................................................................................ 35
Configuration Setup Review Reports..................................................................................... 35
System Behavior Reports.........................................................................................................35
Energy Essentials Reports........................................................................................................39
Export Options.....................................................................................................................................41
Selection Persistence.......................................................................................................................... 42
Timeout Period.................................................................................................................................... 42
Error Handling..................................................................................................................................... 42

Example Report Sequence Scenarios............................................................................................... 43
Energy Data Rollups............................................................................................................................44
Detailed Procedures.......................................................................................................................44
Logging in to the Metasys Advanced Reporting System.................................................................44
Setting up Energy Essentials..............................................................................................................45
Creating an Energy Essentials User View.............................................................................. 45
Mapping Energy Essentials Points..........................................................................................47
Configuring Energy Essentials Report Information............................................................. 48
Creating Predefined Reports............................................................................................................. 49
Creating Folders.................................................................................................................................. 49
Deleting User-Created Folders and Predefined Reports................................................................50
Running a Report................................................................................................................................ 50
Viewing a Report................................................................................................................................. 51
Canceling a Report.............................................................................................................................. 52
Searching for Data in a Report.......................................................................................................... 52
Exporting/Saving a Report................................................................................................................. 53
Printing a Report................................................................................................................................. 53
Exiting a Report................................................................................................................................... 53
Logging out of the Metasys Advanced Reporting System.............................................................. 54
Refreshing the Metasys Advanced Reporting System Data Manually...........................................54
Screens and Tabs............................................................................................................................55
Login Screen.........................................................................................................................................55
Reports Tab Content........................................................................................................................... 55
Report Selection Panel Content.............................................................................................. 57
Predefined Report Properties Panel Content........................................................................58
Folder Properties Panel Content.............................................................................................59
Select Objects Panel Content.................................................................................................. 59
Select Date Range Panel Content........................................................................................... 59
Other Filters Panel Content.....................................................................................................62
Advanced Reporting System and Energy Essentials Help Guideii
Energy Filters Panel Content................................................................................................... 65
Energy Setup Tab/Panel Content.......................................................................................................66
Energy Folders View Content.................................................................................................. 67
Billing Period View Content..................................................................................................... 69
Billing Rate View Content.........................................................................................................70
Energy/Utility Meter View Content......................................................................................... 73
Equipment View Content......................................................................................................... 79
Weather Data View Content.................................................................................................... 81
Other Data View Content.........................................................................................................82
Report Screen Content....................................................................................................................... 83
Configuration Setup Review Report Content........................................................................ 83
System Behavior Report Content........................................................................................... 89
Energy Essentials Report Content........................................................................................ 102
Troubleshooting........................................................................................................................... 111
Metasys Advanced Reporting System Troubleshooting................................................................111
Energy Essentials Troubleshooting.................................................................................................115
Energy Essentials Advanced Configuration Questions.................................................................119
Quick Reference - Energy Essentials...............................................................................................122
Related Documentation.............................................................................................................. 124
Index..............................................................................................................................................125
iiiAdvanced Reporting System and Energy Essentials Help Guide


Metasys Advanced Reporting System Overview
Welcome to the Metasys® Advanced Reporting System and Energy Essentials Help.The Metasys Advanced Reporting System provides historical and configuration data reportingcapabilities to the Metasys system. This system allows facility managers, BAS operators, buildingmaintenance staff, and others to run reports to review the configuration and performance of theirMetasys system.The Metasys Advanced Reporting System allows authorized users to generate and view reports.Standard Access users are authorized using the Advanced Reporting option in the SecurityAdministrator System. See the Security Administration section for details.The Metasys Advanced Reporting System User Interface allows you to easily run reports andimmediately view them in a web browser. The Metasys Advanced Reporting System provides twomain categories of reports: Configuration Setup Review and System Behavior. If you install EnergyEssentials, a third category of energy reports is available. For information on the two main reportcategories, see the Configuration Setup Review Reports and System Behavior Reports sections. Forinformation on Energy Essentials reports, see Energy Essentials Reports.You can export a report and save it in a variety of formats, such as Microsoft Excel® or Adobe PDF.You can use Windows Explorer or File Explorer and other tools to browse to and open a savedreport. See the Report Toolbar section for details on this feature and other report functionality.
Summary of Changes
No technical changes were made to the document for this release.Note: Energy Essentials does not support installation on a computer with SQL Server 2016 orlater.
Concepts
ADX/ODS and SCT Interaction
The Metasys Advanced Reporting System runs on either a unified or split Extended Application andData Server (ADX) or an Open Data Server (ODS). For the split ADX, install the Metasys AdvancedReporting System on the web/application server computer. The ODS does not support splitapplications. You can install only one instance of the reporting system on an ADX or ODS.The Site Director can be the ADX or ODS in which the Metasys Advanced Reporting System isinstalled; however, the Site Director can be a different ADX or ODS instead. The reporting systemdetermines user privileges from the Site Director ADX or ODS.
Note: The Metasys Advanced Reporting System does not run on the Application and DataServer (ADS) or ADS-Lite. The SCT computer must have supported version of SQL Serversoftware installed. We highly recommend that you use the same versions of SQL Serversoftware on the SCT computer and ADX or ODS computer, but you can use different editions(for example, SQL Server 2014 Express on the SCT and SQL Server 2014 Standard on the ADXor ODS).
The reporting system retrieves historical information from the ADX or ODS historical database andgathers configuration information from the SCT archive database (see Figure 1).The ADX or ODS JCIHistorianDB database provides trend data values for Trend Summary, TrendDetails, and Energy Essentials reports. The JCIEvents database provides information for the EventSummary, Event Details, Controller Offline Summary, and Controller Offline Details reports. The
5Advanced Reporting System and Energy Essentials Help Guide
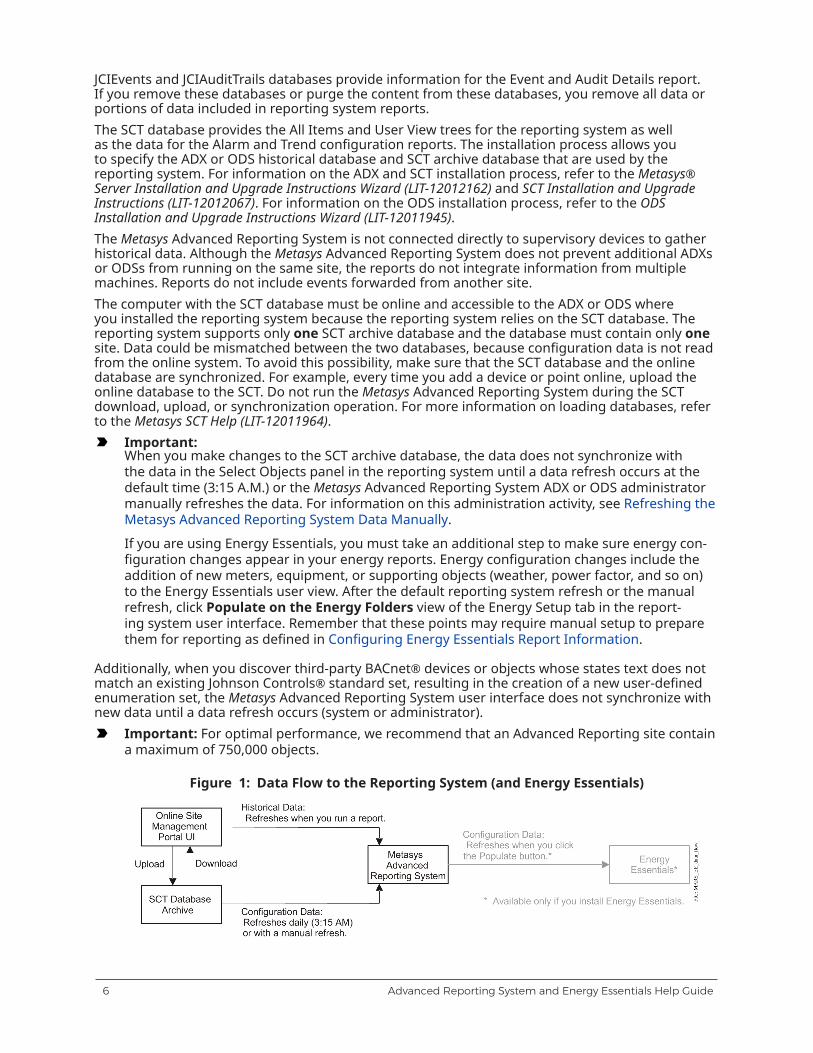
JCIEvents and JCIAuditTrails databases provide information for the Event and Audit Details report.If you remove these databases or purge the content from these databases, you remove all data orportions of data included in reporting system reports.The SCT database provides the All Items and User View trees for the reporting system as wellas the data for the Alarm and Trend configuration reports. The installation process allows youto specify the ADX or ODS historical database and SCT archive database that are used by thereporting system. For information on the ADX and SCT installation process, refer to the Metasys®Server Installation and Upgrade Instructions Wizard (LIT-12012162) and SCT Installation and UpgradeInstructions (LIT-12012067). For information on the ODS installation process, refer to the ODSInstallation and Upgrade Instructions Wizard (LIT-12011945).The Metasys Advanced Reporting System is not connected directly to supervisory devices to gatherhistorical data. Although the Metasys Advanced Reporting System does not prevent additional ADXsor ODSs from running on the same site, the reports do not integrate information from multiplemachines. Reports do not include events forwarded from another site.The computer with the SCT database must be online and accessible to the ADX or ODS whereyou installed the reporting system because the reporting system relies on the SCT database. Thereporting system supports only one SCT archive database and the database must contain only onesite. Data could be mismatched between the two databases, because configuration data is not readfrom the online system. To avoid this possibility, make sure that the SCT database and the onlinedatabase are synchronized. For example, every time you add a device or point online, upload theonline database to the SCT. Do not run the Metasys Advanced Reporting System during the SCTdownload, upload, or synchronization operation. For more information on loading databases, referto the Metasys SCT Help (LIT-12011964).
Important:When you make changes to the SCT archive database, the data does not synchronize withthe data in the Select Objects panel in the reporting system until a data refresh occurs at thedefault time (3:15 A.M.) or the Metasys Advanced Reporting System ADX or ODS administratormanually refreshes the data. For information on this administration activity, see Refreshing theMetasys Advanced Reporting System Data Manually.
If you are using Energy Essentials, you must take an additional step to make sure energy con-figuration changes appear in your energy reports. Energy configuration changes include theaddition of new meters, equipment, or supporting objects (weather, power factor, and so on)to the Energy Essentials user view. After the default reporting system refresh or the manualrefresh, click Populate on the Energy Folders view of the Energy Setup tab in the report-ing system user interface. Remember that these points may require manual setup to preparethem for reporting as defined in Configuring Energy Essentials Report Information.
Additionally, when you discover third-party BACnet® devices or objects whose states text does notmatch an existing Johnson Controls® standard set, resulting in the creation of a new user-definedenumeration set, the Metasys Advanced Reporting System user interface does not synchronize withnew data until a data refresh occurs (system or administrator).
Important: For optimal performance, we recommend that an Advanced Reporting site containa maximum of 750,000 objects.
Figure 1: Data Flow to the Reporting System (and Energy Essentials)
Advanced Reporting System and Energy Essentials Help Guide6

Microsoft SQL Server Reporting Services
The Metasys Advanced Reporting System uses SQL Server Reporting Services, depending on yourversion of SQL Server, to create and view reports. For information on Reporting Services and howto configure it to work with the reporting system, refer to the SQL Server Software Installation andUpgrade Instructions (LIT-12012240).
Security Administration
If you are granted the Advanced Reporting option in the Security Administrator System, you areauthorized to generate reports from the entire ADX or ODS database. You also can log in to theMetasys system; however, any other privileges defined in the Security Administrator System apply(for example, you may not be allowed to clear the Audit history or change values to unauthorizedobject categories). The Advanced Reporting option is available on the System Privileges screenof the Security Administrator System, as shown in Figure 2. The Advanced Reporting privilege isavailable only if Metasys Advanced Reporting System is installed.In addition, your Access Type must be Standard Access to use the Metasys Advanced ReportingSystem. Access Type is defined in the Properties screen of the Security Administrator System,as shown in Figure 3. A user with Basic Access cannot log in to the Metasys Advanced ReportingSystem.For details on how to set up user accounts and authorization, refer to the Security AdministratorSystem Technical Bulletin (LIT-1201528).
Figure 2: Security Administrator System - System Privileges
7Advanced Reporting System and Energy Essentials Help Guide

Figure 3: Security Administrator System - Properties
Advanced Reporting System Access
You can access the Metasys Advanced Reporting System from the Tools > Advanced Reporting menuoption in the Metasys SMP UI.You also can enter the URL of the reporting system (https://<<MetasysServer>>/MetasysReports) ina web browser to reach the Login Screen. The reporting system supports the Windows® InternetExplorer web browser.
Note: If you cannot access the Reporting system using the URL described here, see the entryin the Metasys Advanced Reporting System Troubleshooting section.
Use the Launcher application instead of a web browser to reach the login screen for the SiteManagement Portal UI. If the Launcher is not already installed on your machine, you are promptedto install it after you attempt to log in using the web browser. Refer to the Launcher InstallationInstructions (LIT-12011783). The Launcher is installed on each client computer and lets you accessany Metasys server or supervisory engine on the building network, regardless of its softwareversion. For details, refer to the Launcher Help (LIT-12011742).
Note: We strongly advise that you do not browse to the Metasys Site Management PortalUI from a computer running a server-class operating system. By default, Windows InternetExplorer Enhanced Security Configuration is enabled on server-class operating systems, andmay block the Launcher download page from which you install the Launcher application foraccess to the Site Management Portal. Open the Site Management Portal UI from a computerthat is not running a server-class operating system (OS).
Advanced Reporting System and Energy Essentials Help Guide8

Advanced Reporting System Log in Details
When you access the Metasys Advanced Reporting System, the Login screen appears. See theLogin Screen section. There is no separate user name and password for the reporting system.The Login screen accepts your Metasys system user name and password. After clicking Login,the system authenticates your user name and password, and checks if you have proper SecurityAdministration.
Note: Microsoft Active Directory service is not available with Metasys Advanced ReportingSystem.
If you have authorization to access the reporting system, the Report Selection screen appears. Thisscreen is described in the User Interface section. A message indicating Invalid name or passwordentered appears if you do not have authorization to access the Metasys Advanced ReportingSystem. See Security Administration.See Logging in to the Metasys Advanced Reporting System.
Energy Essentials Overview
Energy Essentials is an add-on to the Metasys Advanced Reporting System that focuses on theenergy and utility use of your facility. After you install Energy Essentials, the following items appearin the Metasys Advanced Reporting System user interface:• Seven new report types. See Energy Essentials Reports.
• Energy Setup tab. See Tabs.Before you can run an Energy Essentials report for the first time, you must set up Energy Essentials.See Energy Essentials Workflow and Energy Essentials Setup Considerations.
Energy Essentials Workflow
Figure 4 shows the overall workflow for Energy Essentials and the documentation that containsmore information on each step. Steps 1 through 8 are required for initial setup only, after whichStep 9 can be done at any time.Complete workflow Steps 1 and 2 before following the steps in this document. This documentcontains workflow Steps 3 through 9. To start, see Creating an Energy Essentials User View or clickthe step you need.
Note: To log in to the Metasys Advanced Reporting System, you must first log in to the SiteManagement Portal UI and accept the license agreement. You also must have the AdvancedReporting privilege and your access type must have Standard Access in the Metasys SecurityAdministrator System. See Security Administration.
9Advanced Reporting System and Energy Essentials Help Guide
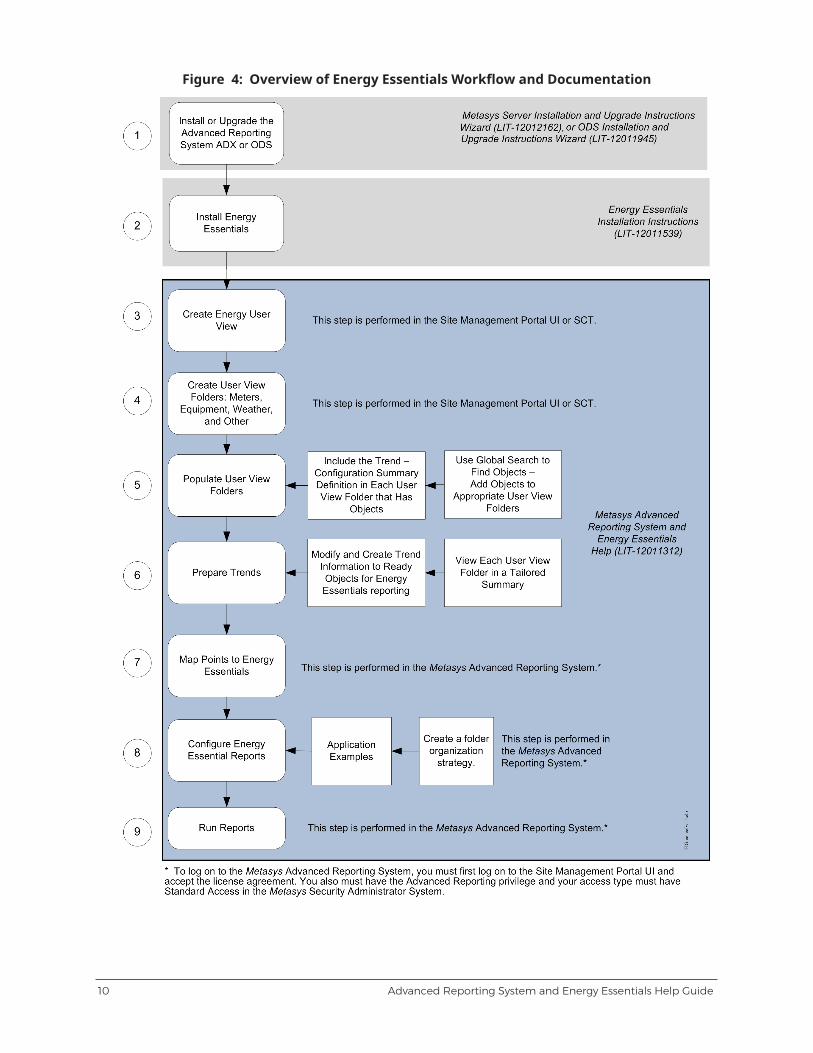
Figure 4: Overview of Energy Essentials Workflow and Documentation
Advanced Reporting System and Energy Essentials Help Guide10
Energy Essentials Setup Considerations
When using Energy Essentials, a well laid-out site reduces setup time and improves reportusefulness and accuracy. Consider the following sections when preparing a site for EnergyEssentials.
Information Needed for Setup
Before setting up Energy Essentials, gather the following information from site professionals:• The types of meters on the site
• The billing periods for the site
• The billing rates for the site
• Available outside weather information (temperature, humidity, and enthalpy)
• Size of the area served by each meter
• Meter usage
• Trend intervals used for meter points
• The type of building service provided by each meter
• The equipment points that are monitoring equipment run status
• Occupancy schedules that can be associated with equipment
Site Layout
Carefully examine the layout of your site. Possible problem areas include:• Units that do not match the type of point
• For example, an outdoor air sensor should not be assigned kBtu for units. See Units Compatiblewith Energy Essentials for tables that list which units should be used for particular points.
• Overlapping measurement areas or duplicate measurements
• For example, each meter should measure one area and not a portion of another meter’s area;otherwise, the accuracy of Energy Intensity calculations is degraded.
• Improperly configured trends or missing trends
• Energy Essentials uses trend data to populate reports. These trends must be configured properlyto be useful in reports. See Trending Requirements for specific information.
• Layouts that lend themselves to double-counting
• For example, if you have a meter that collects data for several Variable Frequency Drives (VFDs),you do not want to report on the meter and the VFDs in the same report. Instead, you shouldinclude either the meter or the VFDs in the report, but not both. This method prevents reportsfrom inflating the energy use or cost for the system. See Figure 5.
11Advanced Reporting System and Energy Essentials Help Guide

Figure 5: Possible Meter Configurations
User View Folder Content
Energy Essentials creates energy reports based on associations with Metasys objects in a userview. If you do not have one user view that contains energy points for meters and equipment, thisprocedure is covered in the first step of Energy Essentials setup. See Creating an Energy EssentialsUser View.In this Energy User View, we recommend you create four specific folders and group pointsunder these folders. Points should have Trend extensions and be trended properly. See TrendingRequirements.The following are tips for which points to add to which folder:• Energy/Utility folder: In this folder, place all energy and meter objects. Six of the seven Energy
Essentials reports allow you to include detailed information on meters used to create thereport if the meters are electrical. If the meters are not electrical, four reports incorporate thisinformation. The reports require that you have at least one meter mapped to Energy Essentials.
• Equipment folder: In this folder, place equipment points on the site whose runtime you wish toreport. This folder populates the Equipment Setup view.
• Weather Data folder: In this folder, place points related to the outdoor air temperature,humidity, and enthalpy.
• Other Data folder: In this folder, place occupancy schedule points, power factor points(electrical energy), and reactive power points (electrical energy).
Note: You can use subfolders to help organize points within the main folders. Also, usesubfolders when the number of points in a folder is greater than 100. This practice makes allpoints available when you create Tailored Summaries for configuring trends.
Use Global Search or a manual search to identify points related to meters, equipment, weatherconditions, or other points of interest. These points must be trended. Change point labels in theuser view as needed to make sure it is clear which points exist in the view.When using Global Search, commonly named points in your system may be found using thefollowing conventions: *SF-S* (Supply Fan Status), *RF-S* (Return Fan Status), *MTR* (Meter), *CH*(Chiller), and *BLR* (Boiler). Weather points may be named *OA-T* (Outdoor Air Temperature),*OA-H* (Outdoor Air Humidity), and *OA-E* (Outdoor Air Enthalpy). You can select results from aGlobal Search and drag and drop them into a user view folder to populate it quickly.Tailored Summaries (Figure 6) allow you to validate point configurations for Energy Essentials use.We recommend using the Configuration Trends - Summary Definition to verify four attributes foreach object listed:• Present Value: Check that enumerations and units are configured and supported for each object
shown. For a list of supported list of enumerations and units, refer to the Metasys SMP Help(LIT-1201793) or Metasys SCT Help (LIT-12011964). If any definition is incorrect or not defined, right-click the object and select View. Add or modify units in the Focus view (Advanced).
• Log Enable: Verify this attribute is set to True. If not, right-click and command the trend
Advanced Reporting System and Energy Essentials Help Guide12

extension to Enabled.
• Repository Enabled: Verify this attribute is set to True. If not, right-click and modify to True.
• Sample Interval: Verify this attribute is 0 for Change of Value (COV) for equipment objects. Keepin mind that missing samples cannot be calculated for COVs. For accuracy, we recommend amaximum value of 900 seconds (15 minutes) for meter objects. Right-click and modify to change.
Notice in Figure 6 that none of the object attributes have lines (---) in their fields. If this markingappears, this line indicates that either no trend extension exists for this object or the trendextension name is not compatible with the summary definition. To resolve these markings, eitherright-click the item in the first column, select Show Extensions, and use the Extension Wizard toadd the trend; or, right-click, select View, then click the Trend tab and modify the reference nameof the Trend Extension to include the word Trend.
Note: If you are upgrading from a site prior to 5.0, add the word Trend to all of your trendextensions in order for the points to show in the Summary Definition trend search window.You can make this change manually in the Trend tab.
Another option is to add *Present Value* as a filter to the Child Items in the summary definition.This option makes the existing trend extension names compatible if the default name of PresentValue was used. Finally, another recommended option is to perform a global search while selectingTrends for the Object type. Perform a Global Modify to rename the Name attribute to Trend -Present Value on the results of the search. This option brings consistency with other trends definedafter Release 5.0 using the default name.The Configuration Trends - Summary Definition also helps you verify that engineering units areassigned to analog objects. See Units Compatible with Energy Essentials.For more details on Tailored Summaries, refer to the Metasys SMP Help (LIT-1201793) or Metasys SCTHelp (LIT-12011964).
Figure 6: Tailored Summary Example
Note: Verify that all attributes (for example, Log Enable, Repository Enabled, and SampleInterval) have attributes defined (that is, none of the --- markings remain).
Trending Requirements
Energy Essentials uses trend data as the basis for reports. Refer to the Metasys SMP Help(LIT-1201793) for details on Trend extensions.The criteria for proper trending is:• The point must have at least one Trend extension with the following:
- The Trend extension Log Enabled attribute must be set to True.
13Advanced Reporting System and Energy Essentials Help Guide

- The Trend extension is configured to forward its content to the ADX or ODS when the bufferis full. To configure the Trend extension, set the Repository Enabled attribute to True.
- The Present Value attribute of the object must be trended.
- To simplify the calculation of the Energy Essentials Expected Sample Interval (minutes)value later, we recommend that you use only one Trend extension.
Note: When a meter object contains more than one Trend extension, you must calculate andenter the Expected Sample Interval in the Energy/Utility Meter view’s Energy/Utility MeterDetails box of the Energy Setup tab for each meter based on the sample period of eachTrend extension. See the remaining Trend extension Sample Interval considerations listed inthis section, then see the Expected Sample Interval (minutes) calculation information in theEnergy/Utility Meter View Content section.
• The units for the point must be defined and match units available in Energy Essentials. See UnitsCompatible with Energy Essentials.
• Trend extension Sample Interval considerations are the following:
- Equipment and Schedule objects require a COV trend. To capture the COV trend, set theSample Interval to 0. All other objects require sample-based trends. For these objects, werecommend that the Sample Interval be set to a maximum of 900 seconds (15 minutes).
- To provide the best opportunity for detecting the peak electric demand value, we recommendthat the Sample Interval be 60 seconds.
- If consumption values for meters are periodically reset, use the recommended SampleInterval of 900 seconds.
- Energy Essentials ignores any trended consumption value less than the previous value andthose that are negative.
- To simplify the calculation of the Energy Essentials Expected Sample Interval (minutes)value later, we recommend that you do not configure trending to capture values at irregularintervals (such as more frequent trending for points in alarm).
Metasys objects that are not trended correctly appear with a warning icon (yellow triangle withexclamation point) in the Energy Setup panel views. To verify proper trending, you also can log into the Metasys Advanced Reporting System and run the Trend Log Definition report on the points inthe user view to detect points that are not trended or are not trended properly.
Units Compatible with Energy Essentials
The tables in this section show the units that are compatible with Energy Essentials. Default unitsare in bold. Default units are used when multiple points with different units are selected on thereport. For example, if you run an Electrical Energy report against meter 1 (W) and meter 2 (kW), thereport shows values in default (kW) when aggregating the two meters. If you configure meters andequipment in the Metasys system with units other than the ones shown in this section, the contentsof Energy Essentials reports become unpredictable. You can also change the defaults configured forthe units. See Energy Essentials Advanced Configuration Questions.Table 1: Energy Units
Energy Imperial Units Metric UnitsSource Energy Btu, kBtu, MBtu J ( Joules), cal (calories), kJ, MJ,
GJ, kcal, kWhEnergy Intensity - SourceEnergy
Btu, kBtu, MBtu J ( Joules), cal (calories), kJ, MJ,GJ, kcal, kWh
Advanced Reporting System and Energy Essentials Help Guide14

Table 1: Energy Units
Energy Imperial Units Metric UnitsEnergy Intensity - Area sq ft sq meter
Table 2: Electricity Utility Meter Units
Electric Utility MeterType
Imperial and MetricUnits
Aggregated asConsumption
Aggregated as PeakDemand
Electrical Demand W, kW, MW, GW Wh, kWh, MWh, GWh –Electrical Consumption Wh, kWh, MWh, GWh – W, kW, MW, GW
Note:• The Aggregate as Consumption indicates the calculated consumption based on the demand
rate.
• The Aggregated as Peak Demand indicates the calculated consumption based on thedemand rate.
Table 3: Units for Electrical Utility Associated Objects
Electrical Utility Meter Type Imperial and Metric Units NotesReactive Power VAR, kVAR –Power Factor PF, % Degree phase is not supported.
Negative values are notsupported.
Table 4: Units for Utility Associated Objects
Utility Meter Type Imperial Units Metric UnitsNatural Gas Consumption thrm, dekatherm, cu ft, ccf Nm3Liquefied Petroleum Gas (LPG)Consumption
Gal, imp Gal, tons Nm3, kg, tonne (metric)
Steam Consumption lbm, klb, Mlb, thrm (therms) kgOil Consumption Gal, imp Gal L, cu meterCoal Consumption tons tonneWater - Distribution Btu, kBtu, MBtu J ( Joules), cal (calories), kJ, MJ,
GJ, kcalWater Consumption Gal, imp Gal, cu ft, ccf L, cu meter
Table 5: Flow Rates Supported for Meters that Measure Flow (Demand)
Demand or Rate Rolls Up to This as a Consumption Valuecu m/min Ncu metercu meter/h cu meterkg/h kgL/h LL/s L
15Advanced Reporting System and Energy Essentials Help Guide

Table 5: Flow Rates Supported for Meters that Measure Flow (Demand)
Demand or Rate Rolls Up to This as a Consumption ValueL/min Llbm/h lbm
Note: These typically are used in measuring steam and water consumption. Also, values fromthese meters cannot be converted to energy or source energy.
Table 6: Units for Weather Associated Objects
Weather Data Imperial Units Metric UnitsTemperature deg F deg C, KHumidity %RH, % %RH, %Enthalpy Btu/lb, Btu/lb dry air J/kg, kJ/kg, kJ/kg dry airDegree Days Degree days F Degree days C
Table 7: Other Units
Measurement Imperial Units Metric UnitsArea sq ft sq meter
Comparable Utility/Energy Types
Table 8 lists common utility groups/energy types and the utility types that appear in EnergyEssentials reports/views. For example, the Big Picture Energy report normalizes energy usingmultipliers based on utility type. Also, see Table 16.Table 8: Utility Group/Energy Type to Utility Type Mapping
Utility Group/Energy Type Utility TypeWater Distribution Hot Water, Chilled WaterWater Consumption WaterCoal/Coke Bituminous Coal, Subituminous Coal, Anthracite Coal, CokeLP Gas LPG, PropaneOil Diesel, Gasoline, Kerosene, #1 Fuel Oil, #2 Fuel Oil, #3 Fuel Oil,
#4 Fuel Oil, #5 Fuel OilSteam SteamElectricity ElectricityNatural Gas Natural GasOther Other
Reports and charts that contain single or multiple utility types present values in source energy.Source energy is a representation of the total amount of fuel required to operate a building.Source energy takes into account all transmission, delivery, and production losses, therebyproviding a complete assessment of energy efficiency in a building. For more backgroundon source energy and the Source-Site ratios used to convert a utility type into source energy(for example, a ratio of 3.34 for electricity), download the technical document called ENERGYSTAR Performance Ratings Methodology for Incorporating Source Energy Use. This documentis available from the following Energy Star website: http://www.energystar.gov/index.cfm?c=evaluate_performance.bus_benchmark_comm_bldgs
Advanced Reporting System and Energy Essentials Help Guide16

For information on how Energy Essentials uses multipliers to normalize energy use, see Table 16.
Supported Objects for Energy Essential Reports
Table 9 lists the objects per data type that Energy Essentials supports.Table 9: Supported Object Types
Type of Data Supported ObjectsMeter AI, AO, AV, Accumulator, and Pulse CounterEquipment BI, BO, BV, MI, MO, MVWeather AI, AO, AVOther AI, AO, AV, BI, BO, BV, MI, MO, MV, Program (Control System),
and Schedule
Chart and Table Intervals
The chart interval rules that Energy Essentials applies to reports are described in Table 10. Forexample, if you select a report for one day, the chart shows one data point for each hour anddisplays the data using the short date time format.Table 10: Chart Interval Rules
Display FormatReport Duration (Range) IntervalFormat Example
Report Duration <= 1 Day 1 Hour short date time 5/16/2011 9:01 A.M.1 Day(s) < Report Duration <= 2Months
1 Day short date 5/16/2011
2 Months < Report Duration <=24 Months
1 Month month/year May, 2011
24 Months < Report Duration Years year 2011
Note: This particular example is for English-United States locale. The reports match the localesetting configured for the user who is currently logged in.
The table interval rules that Energy Essentials applies to reports are described in Table 11. Forexample, if you select a report for 3 months, the report shows one data point for each day anddisplays month/year under the Primary When column and day under the Secondary When column.Table 11: Table Interval Rules
PrimaryWhenFormat
Secondary When FormatReportDuration(RD,range)
Row Limit Test Interval
Format Example Format ExampleRD < 1Month
#items * #hrs < limit 1 Hour short date 5/16/2011 short time 9:01 A.M.
RD < 1Month
#items * #days < limit 1 Day month/year
May, 2011 day 11
RD < 1Month
#items * #days >=limit
ERROR — — — —
17Advanced Reporting System and Energy Essentials Help Guide

Table 11: Table Interval Rules
PrimaryWhenFormat
Secondary When FormatReportDuration(RD,range)
Row Limit Test Interval
Format Example Format Example1 Month<= RD< 12Months
#items * #days < limit 1 Day month/year
May, 2011 day 11
1 Month<= RD< 12Months
#items * #days >=limit
ERROR — — — —
12Months<= RD< 36Months
#items * #months <limit
1 Month year 2011 monthname
May
12Months<= RD< 36Months
#items * #years <limit
1 Year year 2011 year 2011
12Months<= RD< 36Months
#items * #years >=limit
ERROR — — — —
36Months<= RD
#items * #years <limit
1 Year year 2011 year 2011
36Months<= RD
#items * #years >=limit
ERROR — — — —
Note:• When the Interval is ERROR, the report has exceeded the maximum number of records
allowed.
• This particular example is for English-United States locale. The reports match the localesetting configured for the user who is currently logged in.
Table 11 contains the following information:• Report Duration: length of time applied to the report based on the Start Date and End Date
selections.
• Row Limit Test: the equation Energy Essentials uses to determine if the report is within therecord limit. The number of items is determined by what you select under the Select Objectspanel. The limit is the maximum number of rows configured for the Metasys Advanced Reporting
Advanced Reporting System and Energy Essentials Help Guide18
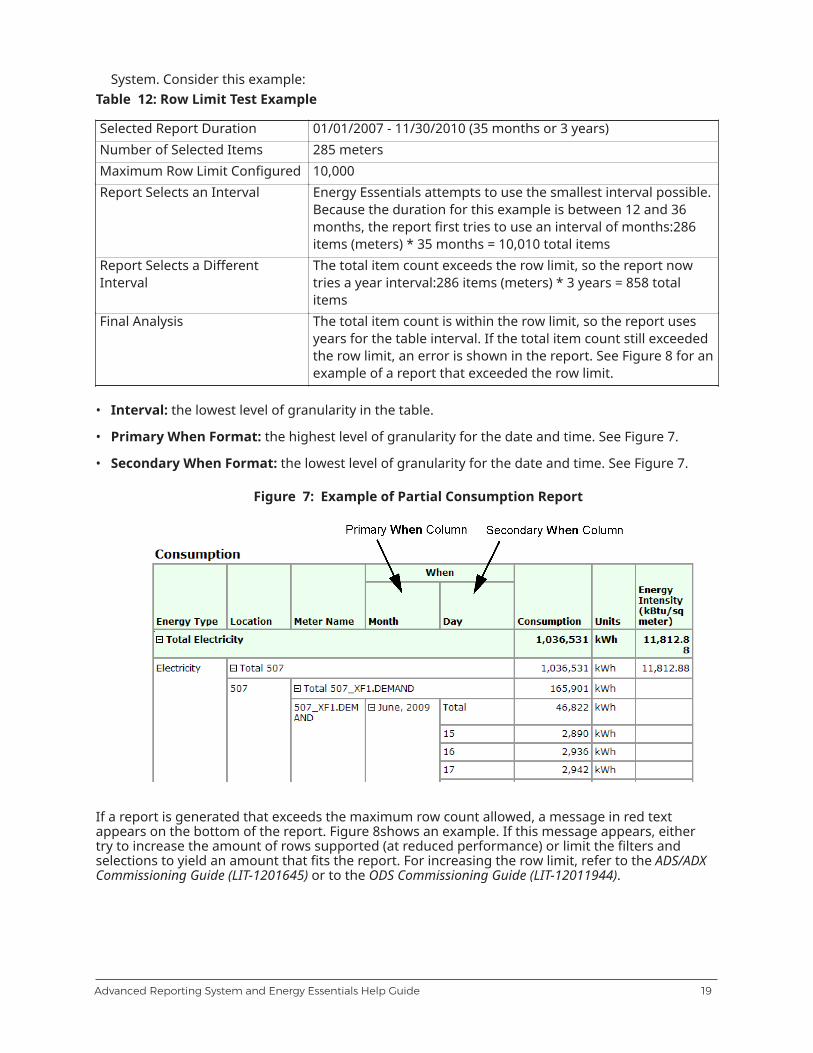
System. Consider this example:Table 12: Row Limit Test Example
Selected Report Duration 01/01/2007 - 11/30/2010 (35 months or 3 years)Number of Selected Items 285 metersMaximum Row Limit Configured 10,000Report Selects an Interval Energy Essentials attempts to use the smallest interval possible.
Because the duration for this example is between 12 and 36months, the report first tries to use an interval of months:286items (meters) * 35 months = 10,010 total items
Report Selects a DifferentInterval
The total item count exceeds the row limit, so the report nowtries a year interval:286 items (meters) * 3 years = 858 totalitems
Final Analysis The total item count is within the row limit, so the report usesyears for the table interval. If the total item count still exceededthe row limit, an error is shown in the report. See Figure 8 for anexample of a report that exceeded the row limit.
• Interval: the lowest level of granularity in the table.
• Primary When Format: the highest level of granularity for the date and time. See Figure 7.
• Secondary When Format: the lowest level of granularity for the date and time. See Figure 7.
Figure 7: Example of Partial Consumption Report
If a report is generated that exceeds the maximum row count allowed, a message in red textappears on the bottom of the report. Figure 8shows an example. If this message appears, eithertry to increase the amount of rows supported (at reduced performance) or limit the filters andselections to yield an amount that fits the report. For increasing the row limit, refer to the ADS/ADXCommissioning Guide (LIT-1201645) or to the ODS Commissioning Guide (LIT-12011944).
19Advanced Reporting System and Energy Essentials Help Guide

Figure 8: Report That Exceeded Maximum Record Count
How Billing Period Selection Affects Reporting
When you select a Simple Energy Cost, Consumption, Electrical Energy, or Production report, youselect from a list of billing periods. The three choices for Billing Period are: Not Included, Aggregateon Billing Period End Date, and Distribute Aggregation Over Billing Period.The base charge for a billing rate appears in the Simple Energy Cost report, in one of two ways,depending on the chosen billing period option. If you select the Billing Period option Not Included,the entire base cost is applied to the meter once, in an even distribution across the requestedreport period. If you select either of the other Billing Period options (Aggregate on Billing PeriodEnd Date, and Distribute Aggregation Over Billing Period), the base cost appears in the SimpleEnergy Cost report once per billing period.
Not Included
This selection does not allow the associated billing period to affect the report content. In otherwords, billing periods are ignored. When calculating utility cost:• Base is distributed over the specified date range.
• Consumption is actual over the specified date range.
• Peak Demand is the maximum value over the specified date range. The Demand Cost is reportedon the actual date of the peak.
Aggregate on Billing Period End Date
This selection aggregates values over a billing period object’s cycle or a series of cycles, and thendisplays the aggregated value at the end of the cycle or series of cycles. A cycle is the period of timefrom one effective date to the next effective date. When calculating utility cost:• Base is aggregated on the billing cycle end date.
Advanced Reporting System and Energy Essentials Help Guide20
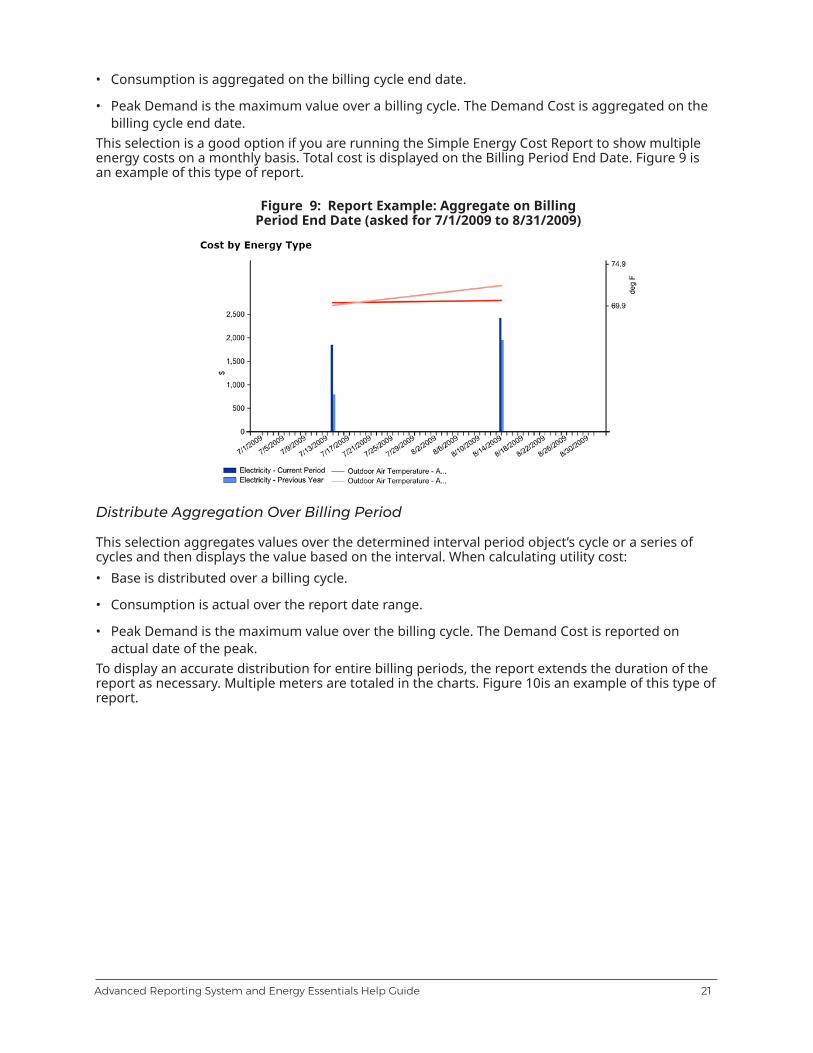
• Consumption is aggregated on the billing cycle end date.
• Peak Demand is the maximum value over a billing cycle. The Demand Cost is aggregated on thebilling cycle end date.
This selection is a good option if you are running the Simple Energy Cost Report to show multipleenergy costs on a monthly basis. Total cost is displayed on the Billing Period End Date. Figure 9 isan example of this type of report.
Figure 9: Report Example: Aggregate on BillingPeriod End Date (asked for 7/1/2009 to 8/31/2009)
Distribute Aggregation Over Billing Period
This selection aggregates values over the determined interval period object’s cycle or a series ofcycles and then displays the value based on the interval. When calculating utility cost:• Base is distributed over a billing cycle.
• Consumption is actual over the report date range.
• Peak Demand is the maximum value over the billing cycle. The Demand Cost is reported onactual date of the peak.
To display an accurate distribution for entire billing periods, the report extends the duration of thereport as necessary. Multiple meters are totaled in the charts. Figure 10is an example of this type ofreport.
21Advanced Reporting System and Energy Essentials Help Guide

Figure 10: Report Example: Distribute AggregationOver Billing Period (asked for 6/15/2009 to 8/14/2009)
Example of Calculating a Billing Period
To help you understand how Energy Essentials calculates the billing period, consider an example.In this example, you can select either the Aggregate on Billing Period End Date or the DistributeAggregation Over Billing Period billing option under the Select Date Range filter. Energy Essentialsuses the entire billing period, rather than a partial billing period, and the report duration iscalculated based on the example shown by Figure 11and Table 13. First, Energy Essentialsdetermines how many billing period end dates fall within the Select Date Range filter. In thisexample, the report is generated on 9/15/2009 and you select This Month for the period in theSelect Date Range filter. Three billing period end dates are found (as indicated by the blue dots).Next, Energy Essentials calculates the Start Date for the report duration. If you select Aggregate onBilling Period End Date, Energy Essentials uses the Start Date of 9/1/09, as the report only needsto show information on the End Date. If you selected Distribute Aggregation Over Billing Period,Energy Essentials determines the Start Date by the earliest billing period Start Date of the billingperiods found. In this example, since the Water Company Start Date of 6/4/2009 is the earliest,Energy Essentials uses 6/4/2009 for the report duration Start Date. Finally, Energy Essentialscalculates the End Date of the report duration. For Aggregate on End Date, the End Date is thesame as the End Date of the Select Date Range filter. For Distribute, the report ends on the latestBilling Period End Date.So, although you asked for the current month in the Select Date Range filter, the report generateddelivers the appropriate amount of information for the Billing Period based on your selections.
Figure 11: Energy Report Filtering Based on Billing Period
Advanced Reporting System and Energy Essentials Help Guide22

Table 13: Billing Period Example
Select Date RangePeriodStart Date End Date
Billing Period TypeSelected
BillingPeriod(s)Found
ReportDuration
Last Month 8/1/2009 8/31/2009 Aggregate on BillingPeriod End Date
1 8/1/2009 -8/31/2009
Last Month 8/1/2009 8/31/2009 Distribute AggregationOver Billing Period
1 7/15/2009 -8/15/2009
This Month 9/1/2009 9/30/2009 Aggregate on BillingPeriod End Date
3 9/1/2009 -9/30/2009
This Month 9/1/2009 9/30/2009 Distribute AggregationOver Billing Period
3 6/4/2009 -9/26/2009
User Interface
The user interface of the Metasys Advanced Reporting System is divided into three sections:• A toolbar allows you to open the Help system, access the Metasys Site Management Portal UI,
and log out of the reporting system.
• Tabs allow you to switch between the Reports tab and Energy Setup tab.Note: The Energy Setup tab appears only when you install Energy Essentials.
• A panel area contains information related to the tab you select.See Figure 12and Figure 13for examples of layout on each tab.
23Advanced Reporting System and Energy Essentials Help Guide

Figure 12: Reports Tab Layout
Advanced Reporting System and Energy Essentials Help Guide24
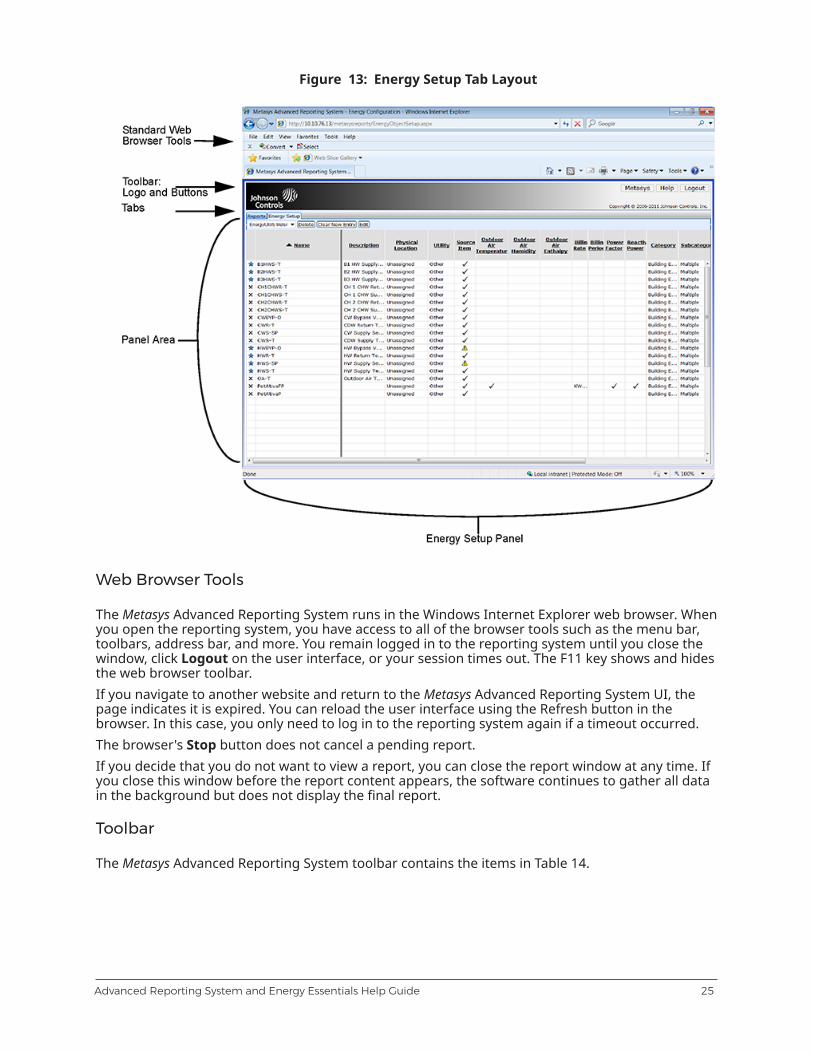
Figure 13: Energy Setup Tab Layout
Web Browser Tools
The Metasys Advanced Reporting System runs in the Windows Internet Explorer web browser. Whenyou open the reporting system, you have access to all of the browser tools such as the menu bar,toolbars, address bar, and more. You remain logged in to the reporting system until you close thewindow, click Logout on the user interface, or your session times out. The F11 key shows and hidesthe web browser toolbar.If you navigate to another website and return to the Metasys Advanced Reporting System UI, thepage indicates it is expired. You can reload the user interface using the Refresh button in thebrowser. In this case, you only need to log in to the reporting system again if a timeout occurred.The browser's Stop button does not cancel a pending report.If you decide that you do not want to view a report, you can close the report window at any time. Ifyou close this window before the report content appears, the software continues to gather all datain the background but does not display the final report.
Toolbar
The Metasys Advanced Reporting System toolbar contains the items in Table 14.
25Advanced Reporting System and Energy Essentials Help Guide
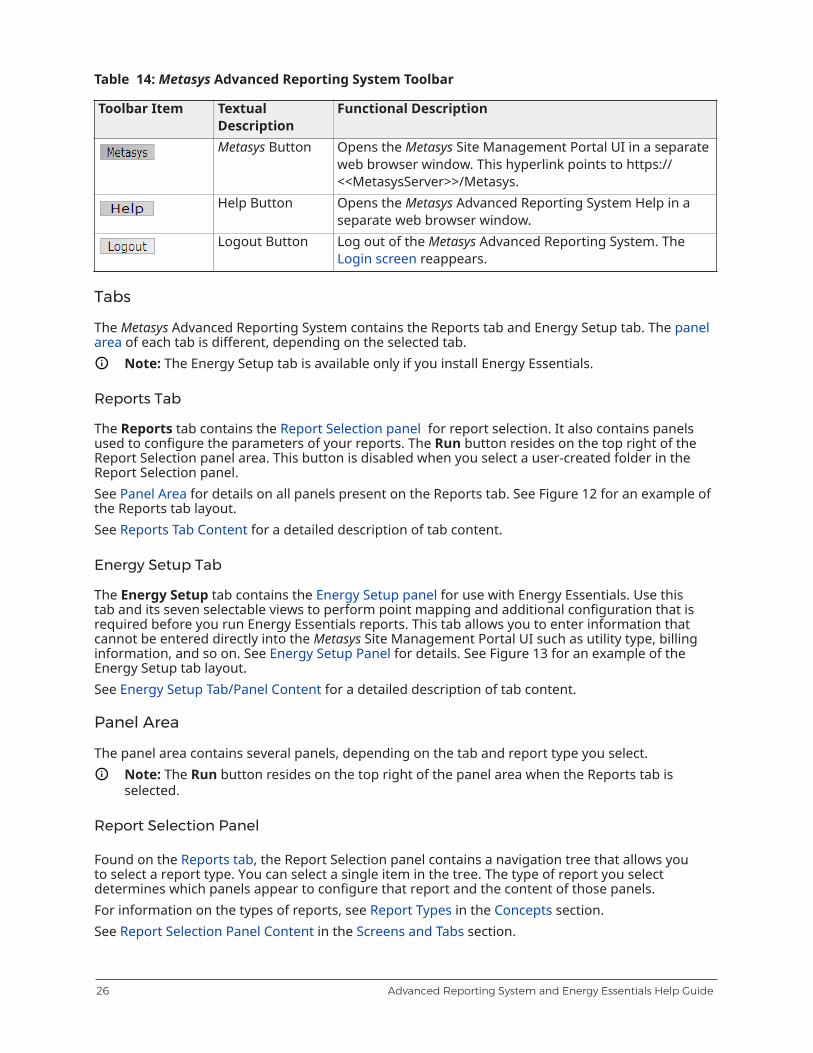
Table 14: Metasys Advanced Reporting System Toolbar
Toolbar Item TextualDescription
Functional Description
Metasys Button Opens the Metasys Site Management Portal UI in a separateweb browser window. This hyperlink points to https://<<MetasysServer>>/Metasys.
Help Button Opens the Metasys Advanced Reporting System Help in aseparate web browser window.
Logout Button Log out of the Metasys Advanced Reporting System. TheLogin screen reappears.
Tabs
The Metasys Advanced Reporting System contains the Reports tab and Energy Setup tab. The panelarea of each tab is different, depending on the selected tab.
Note: The Energy Setup tab is available only if you install Energy Essentials.
Reports Tab
The Reports tab contains the Report Selection panel for report selection. It also contains panelsused to configure the parameters of your reports. The Run button resides on the top right of theReport Selection panel area. This button is disabled when you select a user-created folder in theReport Selection panel.See Panel Area for details on all panels present on the Reports tab. See Figure 12 for an example ofthe Reports tab layout.See Reports Tab Content for a detailed description of tab content.
Energy Setup Tab
The Energy Setup tab contains the Energy Setup panel for use with Energy Essentials. Use thistab and its seven selectable views to perform point mapping and additional configuration that isrequired before you run Energy Essentials reports. This tab allows you to enter information thatcannot be entered directly into the Metasys Site Management Portal UI such as utility type, billinginformation, and so on. See Energy Setup Panel for details. See Figure 13 for an example of theEnergy Setup tab layout.See Energy Setup Tab/Panel Content for a detailed description of tab content.
Panel Area
The panel area contains several panels, depending on the tab and report type you select.Note: The Run button resides on the top right of the panel area when the Reports tab isselected.
Report Selection Panel
Found on the Reports tab, the Report Selection panel contains a navigation tree that allows youto select a report type. You can select a single item in the tree. The type of report you selectdetermines which panels appear to configure that report and the content of those panels.For information on the types of reports, see Report Types in the Concepts section.See Report Selection Panel Content in the Screens and Tabs section.
Advanced Reporting System and Energy Essentials Help Guide26

Predefined Report Properties Panel
Found on the Reports tab, this panel appears only when you click New Report in the ReportSelection panel or when you select a predefined report. A predefined report allows you to createcopies of a standard report with saved filters for reuse. This panel allows you to enter a name anddescription for a new predefined report. You can also select a destination if you are using folders toorganize your predefined reports.See Predefined Report Properties Panel Content in the Screens and Tabs section for descriptions ofthe contents of this panel.
Folder Properties Panel
Found on the Reports tab, this panel appears only when you click New Folder in the ReportSelection panel or when you select a folder that you created. This panel allows you to enter a nameand description for a new folder.See Folder Properties Panel Content in the Screens and Tabs section for descriptions of thecontents of this panel.
Select Objects Panel
Found on the Reports tab, the Select Objects panel allows you to select the items to include inthe report. Depending on the type of report you select, this panel displays the All Items tree, userviews, or a subset of user views on your site. For example, after you complete setup steps, EnergyEssentials reports show either a Meter tree or Equipment tree that is broken down by type.You can expand and collapse items in the tree using the + and - buttons. Single-click to select anitem. You can also select multiple items in a single navigation tree using the Ctrl or Shift keys. If youselect nothing, the report includes all items in the tree, subject to the report and filters you choose.
Important: For optimal performance, we recommend that an Advanced Reporting site containa maximum of 750,000 objects.
If the report you select offers a tree of user views, this list includes all user views available in theSite Director ADX or ODS. You can create user views exclusively for the purposes of outputtingreports. If you plan to run reports against certain points often, group those key points in a userview to customize, speed up, and make the reporting process easier. For example, create userviews for critical temperatures, space temperatures, or AHUs. In addition, user views allow you togroup a site by spaces such as buildings, floors, and other areas.See the Selection Persistence section for details on how the Metasys Advanced Reporting Systemremembers selections made in these panels.See Select Objects Panel Content in the Screens and Tabs section for descriptions of the contents ofthis panel.
Select Date Range Panel
Found on the Reports tab, the Select Date Range panel allows you to select a pre-set or customdate range/time period against which to run the report. You also can select a relative time such asyesterday, last week, last month, this year, and many others.See the Selection Persistence section for details on how the Metasys Advanced Reporting Systemremembers selections made in these panels.See Select Date Range Panel Content in the Screens and Tabs section for descriptions of thecontents of this panel.
27Advanced Reporting System and Energy Essentials Help Guide

Example
For example, make the following selections to report on events that occurred from October 1, 2012to November 1, 2012:• Start Date: 10/1/2012
• Start Time: 12:00:00 A.M.
• End Date: 11/1/2012
• End Time: 11:59:59 P.M.All times are based on the time zone of the ADX or ODS. Date and time formats are based on thelocale of the logged-in user as set in the Metasys Security Administrator Tool. If you browse into theMetasys Advanced Reporting System running on an ADX or ODS in another time zone, be aware thatthe date and time are different from your location’s time zone.The time format (00:00:00 to 23:59:59 or 12:00:00 A.M. to 11:59:59 P.M.) is based on the locale of thelogged-in user. For Energy Essentials, all start times must be at the start of the hour (for example,11:00:00) and all end times must be at the end of the hour (for example, 9:59:59).This panel does not appear in reports that do not search for data based on date and time such asthe Configuration Setup Review reports.
Date and Time Period Rules
All intervals are optional. If you omit any fields listed here, the following conventions apply:• Start Date: The starting time is ignored, and the report includes all records that have a time
stamp before the ending date/time.
• Start Time: The starting time is 00:00:00/12:00:00 A.M. of the starting date.
• End Date: The ending time is ignored, and the report includes all records that have a time stampafter the starting date/time.
• End Time: The ending time is 23:59:59/11:59:59 P.M. of the ending date.
Billing Period Panel
Found on the Reports tab, the Billing Period panel allows you to filter based on three selections.• Not Included: This selection does not allow the associated billing period to affect the report
content.
• Aggregate on Billing Period End Date: This selection shows any usage or cost within therequested report period on the last day of the billing period associated with each item in thereport. Data for billing periods that end within the selected report interval also is included.
• Distribute Aggregation Over Billing Period: This selection may extend the start of the reportperiod to include the start of any billing period that is associated with the chosen items. It mayalso shorten the end of the report period to show only complete billing periods that end withinthe requested report period.
Other Filters Panel
Found on the Reports tab, the Other Filters panel allows you to filter the items included in a report.The filter choices in this panel allow you to focus on a particular set of data on which to report. Thefilters include item name, item type, attribute, user, and more. For example, selecting Field Devices
Advanced Reporting System and Energy Essentials Help Guide28
in the Item Type filter gathers data only from field devices. Depending on the report type selected,the contents of this panel may be different.This panel does not appear for Energy Essentials reports.Obsolete items do not appear in reports when filtering on Item Type. Obsolete items are items thatmay have generated events but they no longer exist in the SCT archive database and have fullyqualified references that begin with the site name of the SCT archive database.Any items defined for Energy Essentials reports with trend data continue to exist as selectableitems in reports, even after you delete them from the SCT archive. These items are marked asdeleted. These items also have a black X next to them in the views of the Energy Setup tab. SeeEnergy Setup Tab/Panel Content.See the Selection Persistence section for details on how the Metasys Advanced Reporting Systemremembers selections made in these panels.See Other Filters Panel Content in the Screens and Tabs section for descriptions of the contents ofthis panel.
Energy Filters Panel
Found on the Reports tab, the Energy Filters panel allows you to filter the items included inan Energy Essentials report. You can filter on energy type and other criteria, or choose to addadditional data to the report such as prior year data and weather data.See Energy Filters Panel Content in the Screens and Tabs section for descriptions of the contents ofthis panel.
Energy Setup Panel
Found on the Energy Setup tab, the Energy Setup panel appears only after you install EnergyEssentials. Using seven views, this panel allows you to configure details such as billing information,equipment data, weather data, and other information used in Energy Essentials reports. This panelalso allows you to map Metasys system points to your Energy Essentials reports.See Setting up Energy Essentials for how you must use this panel before you attempt to run anEnergy Essentials report.See Energy Setup Tab/Panel Content for descriptions of the content of each view in this panel.You can sort each column by clicking the name of the column. When a column is sorted, a triangleappears next to the column name.A warning icon (yellow triangle with exclamation point) in an Energy Setup panel view indicates thata point is not trended (no Trend extension exists).The different views in the Energy Setup panel are:• Energy Folders: This view allows you to map folders from your user views to Energy Essentials.
The items in those mapped folders and subfolders become the rows found in four other views:the meters present in the Energy/Utility Meter view, the equipment in the Equipment view, theweather data points in the Weather Data view, and data points that appear in the Other Dataview. Furthermore, the view includes the Populate button, which is necessary to map over newlyadded points to the existing user view folders. See Report Screen Content for details on this view.
• Billing Period: Billing periods are custom user-defined time ranges that typically coincide withtheir utility billing dates. Once you create a billing period, it maintains a history of dates to beused by Energy Essentials reports. If you add a billing period to a report and do not associate abilling period with a meter, that meter uses the period of the first to the last day of the month.
• This view allows you to enter billing period information that can be incorporated into the EnergyEssentials reports. Information in this view includes the name you define for the billing periodand a start date. This view is useful if your utility billing periods do not coincide with whole
29Advanced Reporting System and Energy Essentials Help Guide

month periods. See Billing Period View Content for details on this view.• Billing Rate: Billing rates are used only by the Simple Energy Cost report. See Simple Energy
Cost Reports. These reports give a high level view of energy costs on your Metasys site. Utilitycompanies tend to have very complex rate structures, requiring you to configure the availablerates appropriately to attain a satisfactory level of accuracy. Energy Essentials simplifies dataentry by requesting only three configurable rates that feed the Simple Cost Report.
Important: Billing rates and the Simple Energy Cost reports are not intended for billingvalidation purposes. Do not use billing rates or the Simple Energy Cost reports in an attempt tovalidate your utility bill.
• This view allows you to enter billing rate information such as a name and a values/start times forthe base, consumption, and demand rates. After you define a billing rate, you can associate therate with a meter. See Billing Rate View Content for details on this view.
• Energy/Utility Meter: This view contains the meters used to measure energy and utilityconsumption/generation. Meter information available in this view includes physical locationinformation, outdoor air associations, and area served settings. The meters that appear in thisview must all reside in the folder or subfolder you map to the Energy/Utility Meters category inthe Energy Folders view. See Energy/Utility Meter View Content for details on this view.
• Equipment: This view contains the equipment used for Equipment Runtime report. Equipmentinformation available in this view includes physical location information and occupancyassociations. The equipment that appears in this view must all reside in the folder or subfolderyou map to the Equipment category in the Energy Folders view.
• For equipment that has more than On and Off as possible occupancy states, any state that is notOff is considered On.
• See Equipment View Content for details on this view.• Weather Data: This view contains the weather data used for Energy Essentials reports. Weather
data information available in this view includes a user-configurable description of the data andthe Metasys system source information. The weather data that appears in this view must residein the folder you map to the Weather Data category in the Energy Folders view. No additionalconfiguration is necessary for weather data, and you can exclude this information from thereports if desired. See Weather Data View Content for details on this view.
• Other Data: This view contains data such as Schedule objects (optional for Equipment Runtimereports) and Power Factor/Reactive Power (optional for Electrical Energy reports). This view alsoincludes a user-defined description of the data and Metasys system source information. The datathat appears in this view must reside in the folder you map to the Other Data category in theEnergy Folders view. No additional configuration is necessary for other data, and you can excludethis information from the reports if desired. See Other Data View Content for details on this view.
Standard and Predefined Reports
Both standard and predefined reports are available in the Metasys Advanced Reporting System UI:• Standard reports appear by default when you log in to the system. If you configure these
reports, the selections you make persist and appear each time you return to the report. To createanother version of a standard report with specific selections, use a predefined report.
• Predefined reports allow you to create and save versions of the standard reports. Predefinedreports must reside under the standard report on which they are based. See Creating PredefinedReports.
Advanced Reporting System and Energy Essentials Help Guide30
Note: When you click Run to request a standard or predefined report, or when you switch toanother report, the current report selections are validated and autosaved, so that the nexttime you run the report, your previous selections are retained.
Report Selection Folder Organization Strategy
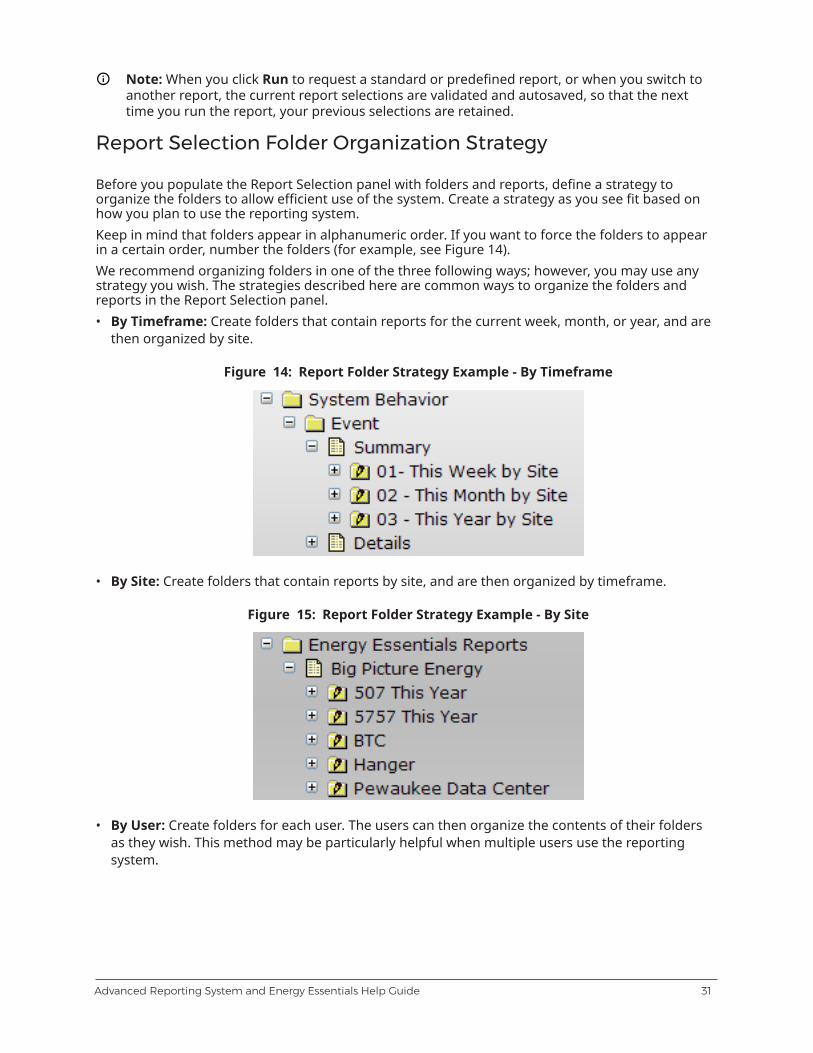
Before you populate the Report Selection panel with folders and reports, define a strategy toorganize the folders to allow efficient use of the system. Create a strategy as you see fit based onhow you plan to use the reporting system.Keep in mind that folders appear in alphanumeric order. If you want to force the folders to appearin a certain order, number the folders (for example, see Figure 14).We recommend organizing folders in one of the three following ways; however, you may use anystrategy you wish. The strategies described here are common ways to organize the folders andreports in the Report Selection panel.• By Timeframe: Create folders that contain reports for the current week, month, or year, and are
then organized by site.
Figure 14: Report Folder Strategy Example - By Timeframe
• By Site: Create folders that contain reports by site, and are then organized by timeframe.
Figure 15: Report Folder Strategy Example - By Site
• By User: Create folders for each user. The users can then organize the contents of their foldersas they wish. This method may be particularly helpful when multiple users use the reportingsystem.
31Advanced Reporting System and Energy Essentials Help Guide

Figure 16: Report Folder Strategy Example - By User
Report Screen
When you run a report, the Report screen opens in a separate web browser window to display thereport results. Figure 17 shows the different parts of a typical Report screen. Energy Essentialsreports have a unified and unique layout. See Figure 18 for an overview of an Energy Essentialsreport.
Note: For each report you run, a new web browser window opens. You must manually closethese browser windows per report.
For an overview of each report, see Report Types.For detailed information on the Report screen content for each type of report, see Report ScreenContent.
Figure 17: Report Screen Example
Advanced Reporting System and Energy Essentials Help Guide32
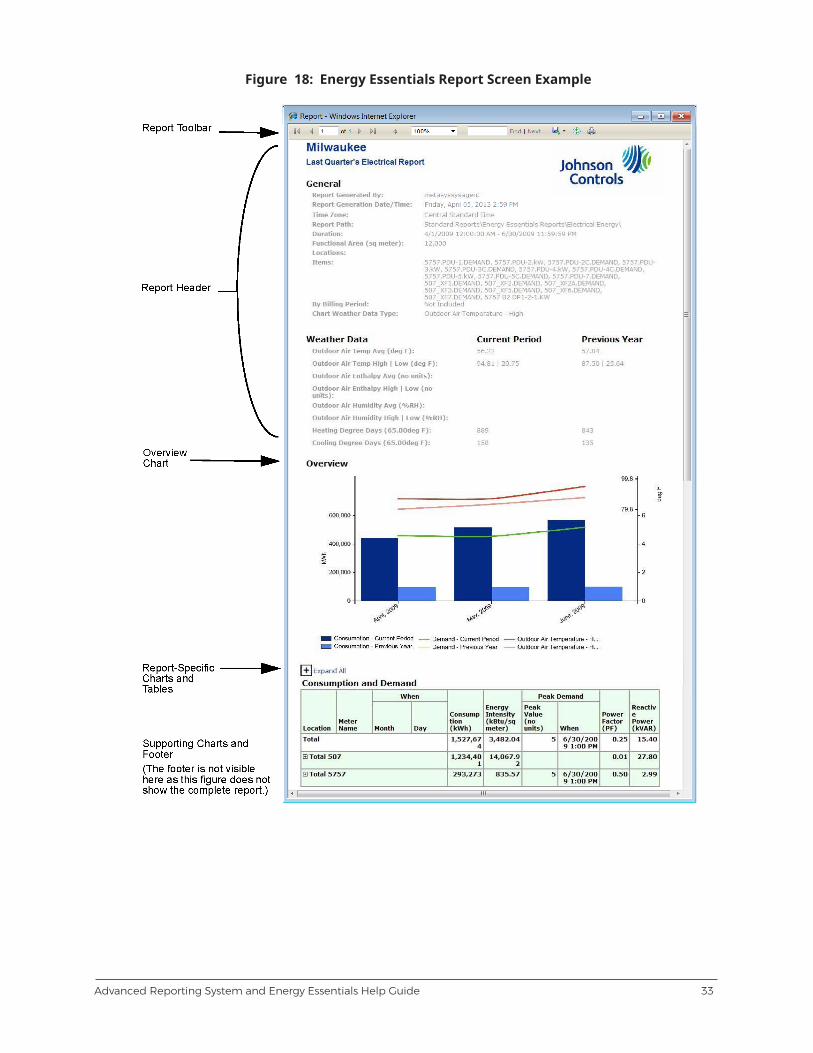
Figure 18: Energy Essentials Report Screen Example
33Advanced Reporting System and Energy Essentials Help Guide

Report Toolbar
The report toolbar appears at the top of the Report screen and allows you to navigate the reportpages, print, export/save, and so on. Table 15 describes the toolbar options.Table 15: Report Toolbar
Toolbar Item Name Functional DescriptionFirst Page Goes to the first page of the report.
PreviousPage
Goes to the previous page of the report.
CurrentPage/Go toPage
Indicates the current page being displayedand allows you to enter a specific page of thereport to which you want to jump.
Next Page Goes to the next page of the report.
Last Page Goes to the last page of the report.
Go Back tothe ParentReport
Goes back to the parent report when viewinga subreport.
Zoom Level Allows you to select or type a zoom level forviewing the report.
Find/Search Allows you to search for a text string in thereport. Click Find to locate the first item, andclick Next to find the next occurrence of theitem.
Export/SaveReport
Allows you to export/save the report byselecting the desired format from the drop-down menu. The Export Options sectiondescribes the supported formats.
Refresh Refreshes the data in the report by runningthe report again in the same window usingthe selected configuration parameters.
Print Prints the report on a printer installed on theclient computer. See the Printing a Reportsection for details.
Advanced Reporting System and Energy Essentials Help Guide34
Report Types
The Metasys Advanced Reporting System contains two main categories of reports that are dividedinto subcategories. If you install Energy Essentials, a third category of energy reports becomesavailable. For information on each category and its reports, see the following sections.See the Example Report Sequence Scenarios section for workflow examples and guidelines onrunning reports.
Configuration Setup Review Reports
Use Configuration Setup Review reports to verify the setup of the Metasys system, including alarmand trend configurations. This data originates from the SCT database.
Alarm Definition Report
Alarm definition reports contain the parameters of the alarms configured for the points in theselected context. This report also includes subreports that list the devices with disabled alarmingand points without alarm extensions configured. The report contains only alarm extensions anddoes not include the intrinsic or Event Enrollment alarming configurations.Fields that are not applicable, such as Normal State for Analog Alarms or Low/High Alarm Limit forMultistate Alarms, are marked with N/A.Due to its width, this report prints on 11x17-in. paper in landscape mode by default (A3 in Europe).Subreports print on Letter size paper in landscape mode by default (A4 in Europe). See the Printinga Report section.See Alarm Definition Report Content in the Screens and Tabs section for details on the contents ofthis report.
Trend Log Definition Report
Trend Log Definition reports contain the trend configuration values for points that have trendsconfigured. When selected, this report also includes a subreport, which lists the points with notrend extensions configured.This report prints on Letter size paper in landscape mode by default (A4 in Europe). Subreportsprint on Letter size paper in Portrait mode by default (A4 in Europe). See the Printing a Reportsection.See Trend Log Definition Report Content in the Screens and Tabs section for details on the contentsof this report.
System Behavior Reports
Use System Behavior reports to monitor the behavior of the Metasys system during a specified timeperiod. Behavior, performance, and diagnostic information originates from historical data storedon the ADX or ODS. See the Example Report Sequence Scenarios section for workflow examplesand guidelines on running reports.
Event Reports
Event reports include the Event Summary report, which lists the total count of events grouped byevent type; and the Event Details report, which lists events and the time those events occurred.
35Advanced Reporting System and Energy Essentials Help Guide
Event Summary Reports
The Event Summary report provides a quick overview of the system. We recommend running thisreport before the Event Details report. The report comprises the report header and footer, TotalEvents Chart, and the table of event data. Figure 17shows an example of this report.This report prints on Letter size paper in landscape mode by default (A4 in Europe). See the Printinga Report section.See Event Summary Report Content in the Screens and Tabs section for details on the contentsof this report. See the Example Report Sequence Scenarios section for workflow examples andguidelines on running reports.
Event Details Reports
The Event Details report provides a detailed view of the system. We recommend running this reportafter the Event Summary report. From the summary report, you can determine a particular set ofitems, type of event, and time interval on which to focus. Then, you can create an Event Detailsreport to view or troubleshoot the potential problem. The report comprises the report header andfooter and the table of event data.This report prints on Letter size paper in landscape mode by default (A4 in Europe). See the Printinga Report section.See Event Details Report Content in the Screens and Tabs section for details on the contents of thisreport. See the Example Report Sequence Scenarios section for workflow examples and guidelineson running reports.
Controller Offline Reports
Controller Offline reports include the Controller Offline Summary report, which lists the offlinecontrollers by trunk; and the Controller Offline Details report, which lists the offline controllers bydevice.The Controller Offline reports provide benchmarking statistics to determine whether your siteis running smoothly or whether it needs improvements. You can gather benchmarking statisticsusing the Percent column because it indicates the percentage of time the devices were offline in theselected time period.Controllers with Automatic Alarming disabled are not counted in the Controller Offline reports. Thissituation occurs even though the controllers have an Offline status because the Metasys systemdoes not create a record for the controllers in the Events database.
Controller Offline Summary Reports
The Controller Offline Summary report allows you to quickly evaluate network issues at a highlevel. We recommend running this report before the Controller Offline Details report. The reportcomprises the report header and footer, Controller Offline By Trunks Chart, and the table of data.Figure 19 shows an example of this report.This report prints on Letter size paper in landscape mode by default (A4 in Europe). See the Printinga Report section.See Controller Offline Summary Report Content in the Screens and Tabs section for details on thecontents of this report. Also, see the Example Report Sequence Scenarios section for workflowexamples and guidelines on running reports.
Advanced Reporting System and Energy Essentials Help Guide36

Figure 19: Controller Offline Summary Report
Each row in the report table indicates the offline totals by breaking down the data in the followingorder: supervisory device, trunk/integration, month, week, and day. This hierarchy allows you todrill down to investigate potential problems on your site.In Figure 19, for example, devices on the N2-1 trunk of the 507NAE4502-B1F5 supervisory devicewere offline. Ten devices out of a total of sixty-four devices on the trunk were offline during theselected time period. The system reported 10 online-to-offline transitions. The devices on the trunkwere offline for a total of 4 days, 4 hours, 54 minutes, and 5 seconds. The devices were offline0.11% of the time.In this particular time period, the devices were offline only in February 2005. Three devices wereoffline in Week 2, and seven devices were offline in Week 4, which equals the total of 10 devicesoffline.
Controller Offline Details Reports
The Controller Offline Details report provides a detailed view of the offline controllers. Werecommend running this report after the summary report. From the summary report, you canidentify a particular set of controllers and a time interval in which to focus. Then, you can createan Controller Offline Details report to view or troubleshoot the potential problem. The reportcomprises the report header and footer and the table of data. The report prints on Letter size paperin landscape mode by default (A4 in Europe). See the Printing a Report section.
37Advanced Reporting System and Energy Essentials Help Guide
See Controller Offline Details Report Content in the Screens and Tabs section for details on thecontents of this report. Also, see the Example Report Sequence Scenarios section for workflowexamples and guidelines on running reports.
Event and Audit Details Reports
The Event and Audit Details report is intended as a diagnostic report, providing time and eventcorrelation to system behavior. The report displays a list of system events and user actions,enabling you to determine the sequence of actions that lead to a specific event (for example,changing a setpoint may cause an alarm to go off).This report contains primarily events and audits, including annotations and signatures, asapplicable. Annotations and signatures appear in the report following their respective parent eventor annotation. In the cells of the table where data is not applicable or expected, N/A appears. NotSpecified appears in the cells of the table where data is expected but not available. This reportcomprises the report header and footer and the table of data.This report prints on 11x17-in. size paper in landscape mode by default (A3 in Europe). See thePrinting a Report section.See Event and Audit Details Report Content in the Screens and Tabs section for details on thecontents of this report. See the Example Report Sequence Scenarios section for workflow examplesand guidelines on running reports.
Trend Reports
Trend reports include the Trend Summary report and the Trend Details report. Unlike the otherSystem Behavior and Configuration Setup Review reports, Trend reports do not include the AllItems tree in the Select Objects panel. Instead, User Views allow you to run reports based ongroups of related trend items such as all zone temperatures in the system. The term point refers toa data collection point such as a room’s temperature or the status of a field device.Trend points deleted from the SCT archive database are considered obsolete items and do notappear in the report. Renamed points appear in the report with their current name (that is, the oldpoint name is lost).
Trend Summary Reports
The Trend Summary report aggregates trends by time intervals (hours, days, weeks, and so on);calculates the minimum, maximum, and average of the trended values during each interval; andcalculates the Mean Kinetic Temperature (MKT) when the values are temperatures.The Trend Summary report provides a quick overview of the system. We recommend runningthis report before the Trend Details report. The report includes only reliable sample values in itscalculations. Calculations do not include unreliable points (for example, points with a bad status orduplicate timestamps). The Trend Summary report includes only analog data. Use the Trend Detailsreport to see unreliable points and binary or multistate data. See the Trend Details Reports section.This report comprises the report header and footer and the table of trend data. You cannot sortthe data in this report; instead, the report is organized alphabetically by Point Full Reference andchronologically by time.This report prints on 11x17-in. size paper in landscape mode by default (A3 in Europe). See thePrinting a Report section.See Trend Summary Report Content in the Screens and Tabs section for details on the contentsof this report. See the Example Report Sequence Scenarios section for workflow examples andguidelines on running reports.
Advanced Reporting System and Energy Essentials Help Guide38
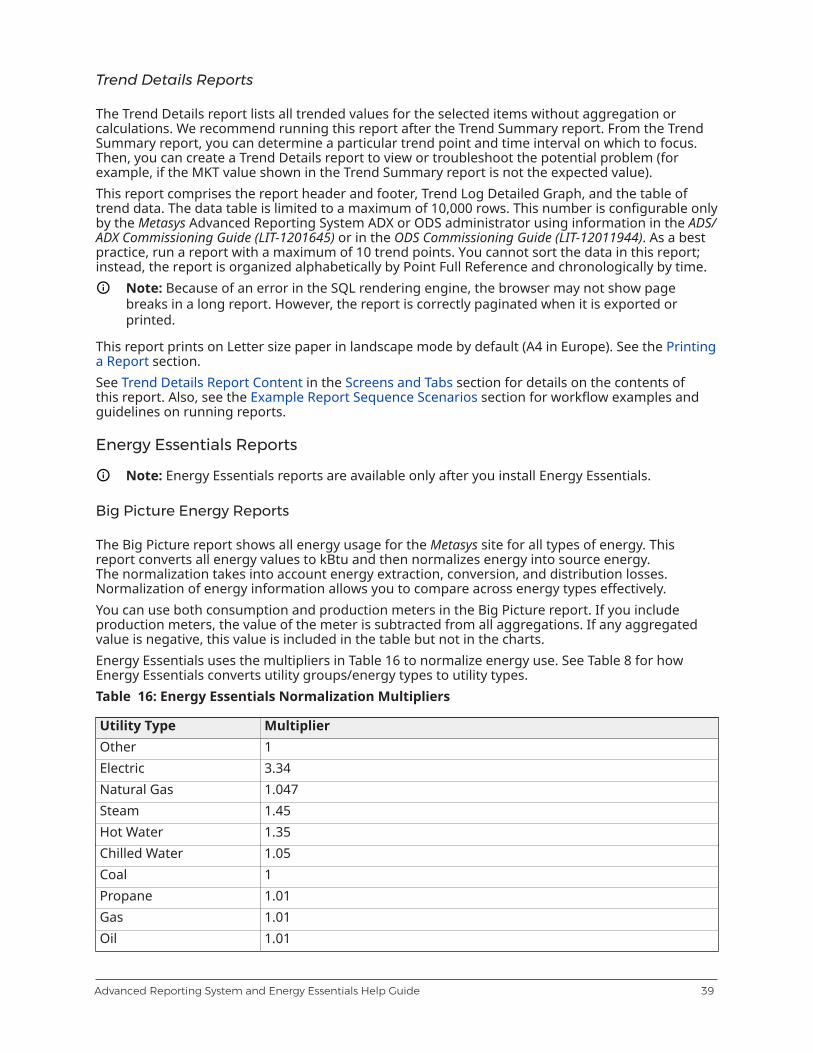
Trend Details Reports
The Trend Details report lists all trended values for the selected items without aggregation orcalculations. We recommend running this report after the Trend Summary report. From the TrendSummary report, you can determine a particular trend point and time interval on which to focus.Then, you can create a Trend Details report to view or troubleshoot the potential problem (forexample, if the MKT value shown in the Trend Summary report is not the expected value).This report comprises the report header and footer, Trend Log Detailed Graph, and the table oftrend data. The data table is limited to a maximum of 10,000 rows. This number is configurable onlyby the Metasys Advanced Reporting System ADX or ODS administrator using information in the ADS/ADX Commissioning Guide (LIT-1201645) or in the ODS Commissioning Guide (LIT-12011944). As a bestpractice, run a report with a maximum of 10 trend points. You cannot sort the data in this report;instead, the report is organized alphabetically by Point Full Reference and chronologically by time.
Note: Because of an error in the SQL rendering engine, the browser may not show pagebreaks in a long report. However, the report is correctly paginated when it is exported orprinted.
This report prints on Letter size paper in landscape mode by default (A4 in Europe). See the Printinga Report section.See Trend Details Report Content in the Screens and Tabs section for details on the contents ofthis report. Also, see the Example Report Sequence Scenarios section for workflow examples andguidelines on running reports.
Energy Essentials Reports
Note: Energy Essentials reports are available only after you install Energy Essentials.
Big Picture Energy Reports
The Big Picture report shows all energy usage for the Metasys site for all types of energy. Thisreport converts all energy values to kBtu and then normalizes energy into source energy.The normalization takes into account energy extraction, conversion, and distribution losses.Normalization of energy information allows you to compare across energy types effectively.You can use both consumption and production meters in the Big Picture report. If you includeproduction meters, the value of the meter is subtracted from all aggregations. If any aggregatedvalue is negative, this value is included in the table but not in the charts.Energy Essentials uses the multipliers in Table 16 to normalize energy use. See Table 8 for howEnergy Essentials converts utility groups/energy types to utility types.Table 16: Energy Essentials Normalization Multipliers
Utility Type MultiplierOther 1Electric 3.34Natural Gas 1.047Steam 1.45Hot Water 1.35Chilled Water 1.05Coal 1Propane 1.01Gas 1.01Oil 1.01
39Advanced Reporting System and Energy Essentials Help Guide

Table 16: Energy Essentials Normalization Multipliers
Utility Type MultiplierDiesel 1.01
As an example of how Energy Essentials uses the Electric multiplier, consider the following:
MeterReading
Meter ReadingkWh to kBtuConversion
NormalizationMultiplier
Total kBtu Reportedon Big Picture EnergyReport
2082 kWh*
3.41214163*
3.34=
23,727.623
Any meter that is configured with a unit that is not valid for the utility type is excluded in any sourceenergy aggregation. This exclusion includes all meters configured with the default utility type ofOther. Also, since water consumption cannot be converted to energy, these meters are excluded inany aggregation or pie chart using source energy.Minimal requirements for running a Big Picture Energy report: you must have a meter definedin the Energy/Utility folder and the meter must be trended properly.See the Printing a Report section.See Big Picture Energy Report Content for details on the contents of this report.
Load Profile Reports
The Load Profile report allows you to examine your energy demand from day to day (not dateto date). This Energy Essentials report, the only one available in landscape orientation, providesdemand profiles in a calendar view. The overview chart for this report allows you to see the averageload profile over a week’s time.If you compare with the previous year, the report compares the demand from the previous yearon a day-to-day basis. For example, the values on a Wednesday would be compared to the closestWednesday the year prior.The Load Profile report includes only electric consumption meters that are configured with ademand interval.See the Printing a Report section.See Load Profile Report Content for details on the contents of this report.
Simple Energy Cost Reports
The Simple Energy Cost report is a high-level look at your energy costs by utility type and meter.This report is useful for an overall picture of your energy costs that highlights unusual trends incost. If the Simple Energy Cost report indicates problem areas or contains unusual data, you mayfind it useful to run the Consumption report (or another relevant report) to diagnose any potentialissues.
Important: Do not use this report to validate your utility bill. This report is not intended foruse in a billing validation application.
See the Printing a Report section.See Simple Energy Cost Report Content for details on the contents of this report.
Advanced Reporting System and Energy Essentials Help Guide40
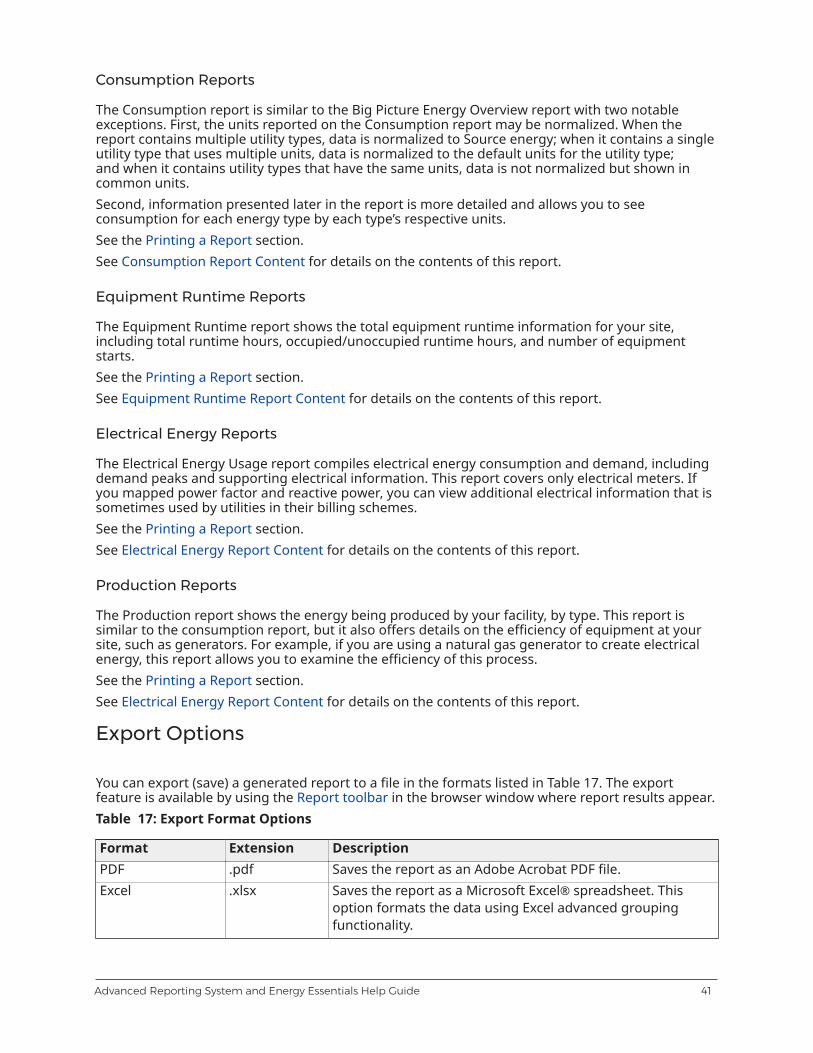
Consumption Reports
The Consumption report is similar to the Big Picture Energy Overview report with two notableexceptions. First, the units reported on the Consumption report may be normalized. When thereport contains multiple utility types, data is normalized to Source energy; when it contains a singleutility type that uses multiple units, data is normalized to the default units for the utility type;and when it contains utility types that have the same units, data is not normalized but shown incommon units.Second, information presented later in the report is more detailed and allows you to seeconsumption for each energy type by each type’s respective units.See the Printing a Report section.See Consumption Report Content for details on the contents of this report.
Equipment Runtime Reports
The Equipment Runtime report shows the total equipment runtime information for your site,including total runtime hours, occupied/unoccupied runtime hours, and number of equipmentstarts.See the Printing a Report section.See Equipment Runtime Report Content for details on the contents of this report.
Electrical Energy Reports
The Electrical Energy Usage report compiles electrical energy consumption and demand, includingdemand peaks and supporting electrical information. This report covers only electrical meters. Ifyou mapped power factor and reactive power, you can view additional electrical information that issometimes used by utilities in their billing schemes.See the Printing a Report section.See Electrical Energy Report Content for details on the contents of this report.
Production Reports
The Production report shows the energy being produced by your facility, by type. This report issimilar to the consumption report, but it also offers details on the efficiency of equipment at yoursite, such as generators. For example, if you are using a natural gas generator to create electricalenergy, this report allows you to examine the efficiency of this process.See the Printing a Report section.See Electrical Energy Report Content for details on the contents of this report.
Export Options
You can export (save) a generated report to a file in the formats listed in Table 17. The exportfeature is available by using the Report toolbar in the browser window where report results appear.Table 17: Export Format Options
Format Extension DescriptionPDF .pdf Saves the report as an Adobe Acrobat PDF file.Excel .xlsx Saves the report as a Microsoft Excel® spreadsheet. This
option formats the data using Excel advanced groupingfunctionality.
41Advanced Reporting System and Energy Essentials Help Guide
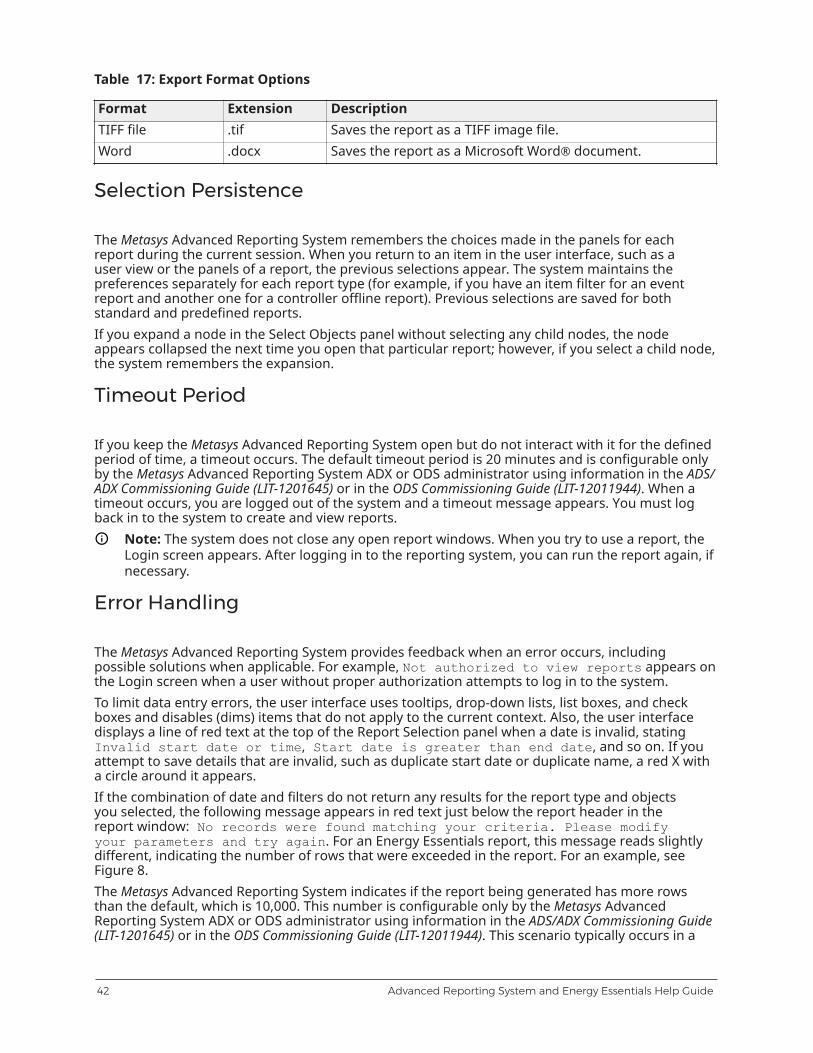
Table 17: Export Format Options
Format Extension DescriptionTIFF file .tif Saves the report as a TIFF image file.Word .docx Saves the report as a Microsoft Word® document.
Selection Persistence
The Metasys Advanced Reporting System remembers the choices made in the panels for eachreport during the current session. When you return to an item in the user interface, such as auser view or the panels of a report, the previous selections appear. The system maintains thepreferences separately for each report type (for example, if you have an item filter for an eventreport and another one for a controller offline report). Previous selections are saved for bothstandard and predefined reports.If you expand a node in the Select Objects panel without selecting any child nodes, the nodeappears collapsed the next time you open that particular report; however, if you select a child node,the system remembers the expansion.
Timeout Period
If you keep the Metasys Advanced Reporting System open but do not interact with it for the definedperiod of time, a timeout occurs. The default timeout period is 20 minutes and is configurable onlyby the Metasys Advanced Reporting System ADX or ODS administrator using information in the ADS/ADX Commissioning Guide (LIT-1201645) or in the ODS Commissioning Guide (LIT-12011944). When atimeout occurs, you are logged out of the system and a timeout message appears. You must logback in to the system to create and view reports.
Note: The system does not close any open report windows. When you try to use a report, theLogin screen appears. After logging in to the reporting system, you can run the report again, ifnecessary.
Error Handling
The Metasys Advanced Reporting System provides feedback when an error occurs, includingpossible solutions when applicable. For example, Not authorized to view reports appears onthe Login screen when a user without proper authorization attempts to log in to the system.To limit data entry errors, the user interface uses tooltips, drop-down lists, list boxes, and checkboxes and disables (dims) items that do not apply to the current context. Also, the user interfacedisplays a line of red text at the top of the Report Selection panel when a date is invalid, statingInvalid start date or time, Start date is greater than end date, and so on. If youattempt to save details that are invalid, such as duplicate start date or duplicate name, a red X witha circle around it appears.If the combination of date and filters do not return any results for the report type and objectsyou selected, the following message appears in red text just below the report header in thereport window: No records were found matching your criteria. Please modifyyour parameters and try again. For an Energy Essentials report, this message reads slightlydifferent, indicating the number of rows that were exceeded in the report. For an example, seeFigure 8.The Metasys Advanced Reporting System indicates if the report being generated has more rowsthan the default, which is 10,000. This number is configurable only by the Metasys AdvancedReporting System ADX or ODS administrator using information in the ADS/ADX Commissioning Guide(LIT-1201645) or in the ODS Commissioning Guide (LIT-12011944). This scenario typically occurs in a
Advanced Reporting System and Energy Essentials Help Guide42
detailed report with a large number of objects selected and a lengthy time range. You can decreasethe number of records returned by selecting fewer objects or a shorter time interval.
Example Report Sequence Scenarios
We recommend creating a summary report first. Then, based on the contents of that report (thatis, if you notice a problem or a particular pattern that requires attention), create a detailed report,specifying the particular time period on which to focus. The following scenarios provide workflowexamples for using the reporting system.Scenario 1: Checking Controller Offline StatusTo check whether devices on your site went offline during a particular time period and investigatewhy the devices went offline:
Note: Use the All Items tab to set the context for this report scenario.
1. Run a Controller Offline Summary report on the desired time period. Review the report andlook for specific dates with many offline devices.
2. Run a Controller Offline Details report using the date range you identified after running theprevious report. Review the report and check if a particular device caused the offline status. Ifnecessary, check the device to see if it is running properly.
3. To find out why the device went offline, take one of the following steps:
- Run an Event Details report and filter on the device name. Review the report and check ifone or more events correspond to the offline conditions.
- Run an Event and Audit Details report and filter on the device name, time period, andany other data gathered from the previous reports. Review the report and check if aparticular operator is associated with the events corresponding to the offline conditions.For example, if John Smith acknowledged the Alarms, you can check with him forbackground information.
From this investigation you may find, for example, that the devices went offline due to somemaintenance being performed during that time period.Scenario 2: Checking Alarm StatusTo check whether alarms occurred during a particular time period and investigate why the alarmshappened:
Note: Use either the All Items tab or the User Views tab to set the context for this reportscenario.
1. Run an Event Summary report on the desired time period. Review the report and look forspecific dates with many alarms. For example, if you ran the report for last week, identify theday with many alarms.
2. Run an Event Details report using the time period you identified after running the previousreport (for example, a particular day). Review the report and check if a device caused thealarm.
3. Run an Alarm Definition report for the items in question to make sure the alarm limits are setup correctly.
From this investigation you may find, for example, that the device went offline and caused thealarms. If necessary, run more reports (such as the Offline or Event and Audit Details reports) orcheck the device to see if it is running properly.Scenario 3: Viewing This Month’s Equipment Runtime to Same Month Last Year
43Advanced Reporting System and Energy Essentials Help Guide

To compare equipment runtime from this month to the same month last year:1. Run an Equipment Runtime report using the date range of This Month. Select the Include
Previous Year's Data option. Also, select the Include Weather Data option and appropriatelyselect either the Outdoor Air Temperature High or Low, depending on the season.
2. In the bar graph, review the total runtime for each equipment type.
3. In the table, review runtime by equipment type, location, equipment name, and date. Thetable also contains the number of unoccupied and occupied runtime hours when a schedule isassociated with the equipment and the total number equipment starts.
From this report, you can see whether equipment was running unnecessarily during unoccupiedtimes, how long the same equipment was running the previous year, and how the weather mayhave affected excessive runtime.
Energy Data Rollups
System performance of the reporting system can become an issue as the complexity of the reportsincrease and the amount of data that needs to be processed increases.Energy Essentials uses an aggregation process, based on the units of a point and sample interval,to reduce the amount of data that needs to be processed each time a report is executed. Each pointin the rolled up data represents a designated time interval over a period of time. For example, arollup value of 15 minutes, with a 1-minute sample interval, aggregates 15 samples for over a 15-minute period into one data point representing that period of time.Energy Essentials aggregates raw data (from both demand and consumption meters) when areport is generated. At report execution, Energy Essentials determines if the data has already beenaggregated, and if it has not, initiates the rollup for the missing time period. This sometimes causesa report to execute for a longer period of time the first time a specific period of data is reportedagainst. Subsequent executions of reports against the same data should take significantly less timeto execute as the entire rollup process does not need to be executed again.The aggregation algorithms depend on a combination of the units and sample interval of theobject or point being reported on. If the units change, Energy Essentials destroys the previouslyaggregated data, and new data is generated if the raw data for the point has not been purged fromthe database.Essentially, a rollup represents raw data in a continuous range of dates. There can be no gaps in therange over which the rollups calculate. Continuous means that every raw data value that exists overa time range is accounted for in the rollup. If the raw data has gaps, the rollup may have gaps aswell, but is still considered continuous because it reflects the underlying lack of data.
Detailed Procedures
Logging in to the Metasys Advanced Reporting System
Note: We strongly advise that you do not browse to the Metasys Site Management PortalUI from a computer running a server-class operating system. By default, Windows InternetExplorer Enhanced Security Configuration is enabled on server-class operating systems, andmay block the Launcher download page from which you install the Launcher application foraccess to the Site Management Portal. Open the Site Management Portal UI from a computerthat is not running a server-class OS.
1. Before you log in to the Metasys Advanced Reporting System for the first time, log in to theMetasys system ADX or ODS and accept the license agreement. If you attempt to log in to the
Advanced Reporting System and Energy Essentials Help Guide44

reporting system before performing this action, the login fails with a message prompting youto log in to the ADX or ODS and accept the license agreement.
Note: To log in to the Metasys Advanced Reporting system, you must have the AdvancedReporting privilege, and your access type must have Standard Access in the Metasys SecurityAdministrator System. See Security Administration.
2. Access the Login screen using one of the following methods:
- In the Metasys system User Interface, select Tools > Advanced Reporting.
- Enter the Metasys Advanced Reporting System address in a web browser: https://<<MetasysServer>>/MetasysReports
Note: Starting at Release 6.0, you use the Launcher instead of a web browser to reach thelogin screen for the Site Management Portal user interface. Refer to the Launcher InstallationInstructions (LIT-12011783).
The Login screen appears.
Note: If you cannot access the Reporting system using the method described here, see theentry in Metasys Advanced Reporting System Troubleshooting.
3. Type your Metasys system user name and password.
4. Click Login. The system authenticates your user name and password and checks if you haveproper authorization. If you have proper authorization, the Reports tab appears.
Note:- A message appears if you do not have authorization to access the reporting system.
- If you are in the system and a timeout message appears, you must log back in to thesystem to create and view reports.
Setting up Energy Essentials
You must set up an Energy Essentials user view in Metasys SMP, map points in those user views tothe reporting system, and configure report data before you run a report. You can perform all setup steps at once, or you can create the user view and add only the folders/points that you need forspecific reports, as time permits.See Energy Essentials Workflow for details on the complete list of steps related to installingand setting up Energy Essentials. See Energy Essentials Setup Considerations for details onsite configuration changes and point adjustments you may have to make before using EnergyEssentials effectively.To set up Energy Essentials, start with Creating an Energy Essentials User View.
Creating an Energy Essentials User View
Energy Essentials relies on Metasys system user view data for report content. We recommend youcreate a new user view solely for Energy Essentials; but if you have existing user views that containthe required data, you can use the existing user views. This section explains the recommendedprocedure for creating a user view exclusively used for Energy Essentials.See Energy Essentials Workflow for details on the complete list of steps related to installingand setting up Energy Essentials. See Energy Essentials Setup Considerations for details onsite configuration changes and point adjustments you may have to make before using EnergyEssentials effectively.
45Advanced Reporting System and Energy Essentials Help Guide

Note: This procedure assumes that you create user views online and then upload the changesto the SCT. You can create user views offline using SCT, but Global Search and TailoredSummaries are not available in SCT and can be useful when working with user views. If youcreate the user view using SCT, wait for the default reporting system refresh at 3:15 A.M. orsee Refreshing the Metasys Advanced Reporting System Data Manually to force a manualrefresh. A download to the ADX or ODS is recommended but not required to use EnergyEssentials.
To create an Energy Essentials user view:1. Make sure you installed or upgraded your Metasys Advanced Reporting System ADX or ODS
and installed Energy Essentials at the same release. See Energy Essentials Workflow.
2. In the Site Management Portal UI of your Site Director ADX or ODS, on the Insert menu,click User View. The Create New User View wizard appears. Refer to the Metasys SCT Help(LIT-12011964) for details on using this wizard.
Figure 20: Energy Essentials User View
3. On the Identifier screen, name the user view. We recommend naming the view EnergyEssentials (Figure 20).
4. Click Last, then click Finish to save the empty Energy Essentials user view.
5. Drag the Energy Essentials user view into an open panel. The user view opens for editing.
6. Add four folders to the user view (Figure 20). We recommend naming the folders Energy /Utility Meters, Equipment, Other Data, and Weather Data. These four folders represent thefour types of system points used by Energy Essentials.Refer to the Metasys SCT Help (LIT-12011964) for details on using user views.
7. Add energy-related points from your site to the appropriate folder. See Energy Essentials SetupConsiderations for more information on which points to include with each folder. Be sure touse Global Search to quickly populate each user view.
Note:- We strongly recommend limiting the content of the user view and folders to items
necessary for Energy Essentials. Including other items may make Energy Essentialsconfiguration in the Energy Setup tab confusing.
- If desired, you can add some points now and others later. But, you must addrequired points to the appropriate folders in the user view and wait for the defaultreporting system refresh at 3:15 A.M. or force a manual refresh. (See Refreshing theMetasys Advanced Reporting System Data Manually.) You then must click Populatebefore you run Energy Essentials reports.
Advanced Reporting System and Energy Essentials Help Guide46

- Since we recommend using Tailored Summaries to quickly set up point trending,limit the points to 100 per folder. You may use subfolders within the folders.
8. Add the Configuration – Trends Summary Definition object to each folder to help identify andmodify trended points for Energy Essentials. You can use it later to verify that all points meetthe trend extension requirement.
Note: The Configuration - Trends Summary Definition object is pre-built for you and isavailable on the Johnson Controls® Branch Purchase Package (BPP). Refer to the MetasysSCT Help (LIT-12011964) for details.
9. Save the user view.Note: If you decide to add or delete points at a later date, display the user view andclick Edit. Be sure to upload changes to SCT, perform a manual Metasys AdvancedReporting System refresh, and click Populate in Energy Essentials after you make changesto the Energy Essentials user view. Remember that these points may require manualsetup to prepare them for reporting as defined in Configuring Energy Essentials ReportInformation.
10. Use Tailored Summaries to help configure trends. Each object in an Energy Essentials reportmust have its Present Value attribute trended.
11. Using SCT, upload the ADX or ODS to the SCT archive database.The Metasys Advanced Reporting System and Energy Essentials use the SCT as a source forreports, so these changes must reside in SCT. See ADX/ODS and SCT Interaction.
12. Wait for the default Metasys Advanced Reporting System refresh (3:15 A.M.) or perform aMetasys Advanced Reporting System refresh. (See Refreshing the Metasys Advanced ReportingSystem Data Manually.)
13. Go to Mapping Energy Essentials Points.
Mapping Energy Essentials Points
1. Log in to the Metasys Advanced Reporting System UI.
2. On the Energy Setup tab, from the Energy Setup drop-down selection list, select the EnergyFolders view.
3. In the User Views list, expand the user view you created in the Creating an Energy EssentialsUser View section. If you followed the suggested naming convention, this user view is calledEnergy Essentials.
4. Click the folder that contains the points related to energy and utility meters. If you followed thesuggested naming convention, this folder is called Energy / Utility Meters.
5. On the Energy Folders side of the view, under the Energy / Utility Meters category, click Set.
6. Repeat Step 4 and Step 5 for the three energy folders. If you followed the suggested namingconvention, the folder names in the User Views list should match the name of the energyfolder to which you map the folder.
7. Go to Configuring Energy Essentials Report Information.
47Advanced Reporting System and Energy Essentials Help Guide

Configuring Energy Essentials Report Information
The basic Energy Essentials report layout is covered in Report Screen. Detailed report information isin the Report Screen Content.Energy Essentials has the ability to report on data that does not exist on the Metasys system. Tomake this information available to reports, you must configure this supporting data in the BillingPeriod, Billing Rate, and Energy/Utility Meter views of the Energy Setup tab. A multi-edit featureis available to minimize the configuration time when entering the same information for multiplemeters or equipment. Simply highlight each object you want to change, click Edit, and make thechanges in the Details panel. Specify the new value and click Send.To configure Energy Essentials report information:1. On the Metasys Advanced Reporting System Energy Setup tab, from the view drop-down
selection list, select the Billing Period view.
2. Click Add New. The Billing Period Details box appears and the new billing period appears inthe view.
3. Enter information for the billing period using Billing Period View Content.
4. Click Save. The new billing period name and information updates in the Billing Period view.
Note: Add as many billing periods as needed for the meters you plan to include in reports. Youcan associate multiple meters with the same billing period.
5. From the view drop-down selection list, select the Billing Rate view.
6. Click Add New. The Billing Rate Details box appears and the new billing rate appears in theview.
7. Enter information for the billing rate using Billing Rate View Content.
8. Click Save. The new billing rate name and information updates in the Billing Rate view.
Note: Add as many billing rates as needed for the meters you plan to include in reports. Youcan associate multiple meters with the same billing rate.
9. If you intend to filter your Energy Essentials reports or include weather information, be sure tohave values or points in the following view columns:
- Energy or Utility Meter view:
- Category
- Subcategory
- Utility
- Physical Location
- Outdoor Air Humidity
- Outdoor Air Temperature- Equipment view:
- Physical Location10. To include billing information on your reports, be sure to configure these values in the Energy/
Utility Meter view:
- Billing Rate (using a rate configured in the Billing Rate view)
Advanced Reporting System and Energy Essentials Help Guide48
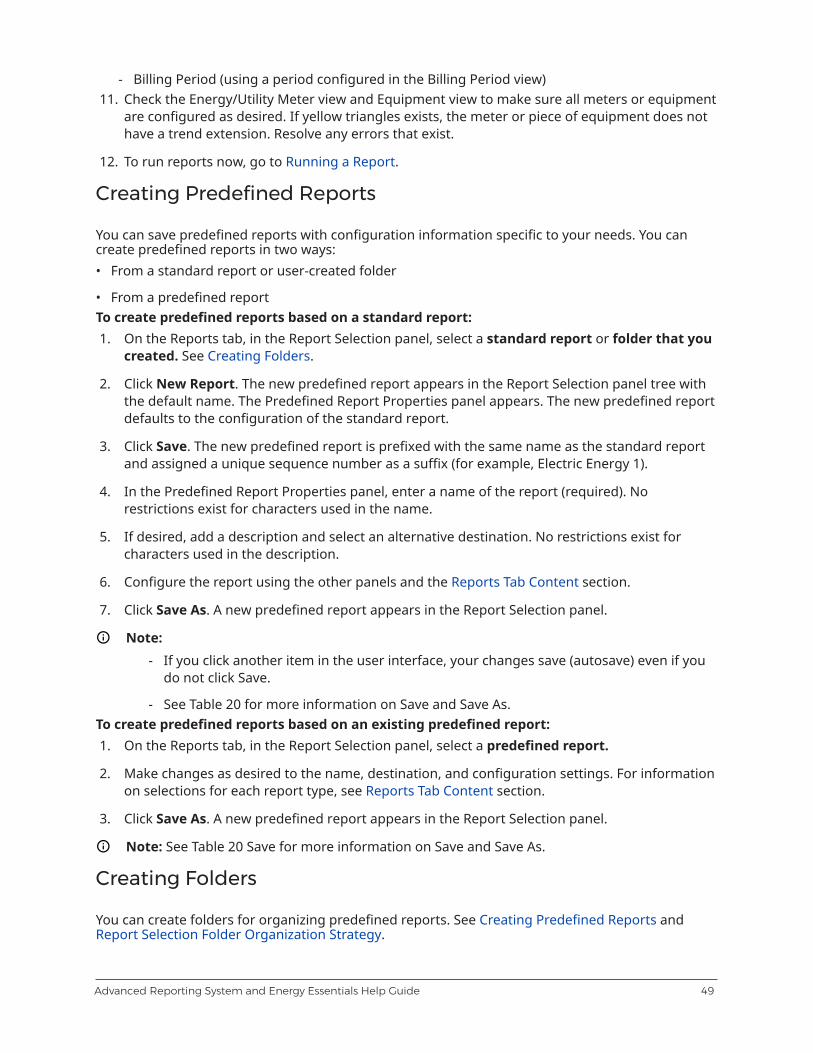
- Billing Period (using a period configured in the Billing Period view)11. Check the Energy/Utility Meter view and Equipment view to make sure all meters or equipment
are configured as desired. If yellow triangles exists, the meter or piece of equipment does nothave a trend extension. Resolve any errors that exist.
12. To run reports now, go to Running a Report.
Creating Predefined Reports
You can save predefined reports with configuration information specific to your needs. You cancreate predefined reports in two ways:• From a standard report or user-created folder
• From a predefined reportTo create predefined reports based on a standard report:1. On the Reports tab, in the Report Selection panel, select a standard report or folder that you
created. See Creating Folders.
2. Click New Report. The new predefined report appears in the Report Selection panel tree withthe default name. The Predefined Report Properties panel appears. The new predefined reportdefaults to the configuration of the standard report.
3. Click Save. The new predefined report is prefixed with the same name as the standard reportand assigned a unique sequence number as a suffix (for example, Electric Energy 1).
4. In the Predefined Report Properties panel, enter a name of the report (required). Norestrictions exist for characters used in the name.
5. If desired, add a description and select an alternative destination. No restrictions exist forcharacters used in the description.
6. Configure the report using the other panels and the Reports Tab Content section.
7. Click Save As. A new predefined report appears in the Report Selection panel.
Note:- If you click another item in the user interface, your changes save (autosave) even if you
do not click Save.
- See Table 20 for more information on Save and Save As.To create predefined reports based on an existing predefined report:1. On the Reports tab, in the Report Selection panel, select a predefined report.
2. Make changes as desired to the name, destination, and configuration settings. For informationon selections for each report type, see Reports Tab Content section.
3. Click Save As. A new predefined report appears in the Report Selection panel.
Note: See Table 20 Save for more information on Save and Save As.
Creating Folders
You can create folders for organizing predefined reports. See Creating Predefined Reports andReport Selection Folder Organization Strategy.
49Advanced Reporting System and Energy Essentials Help Guide
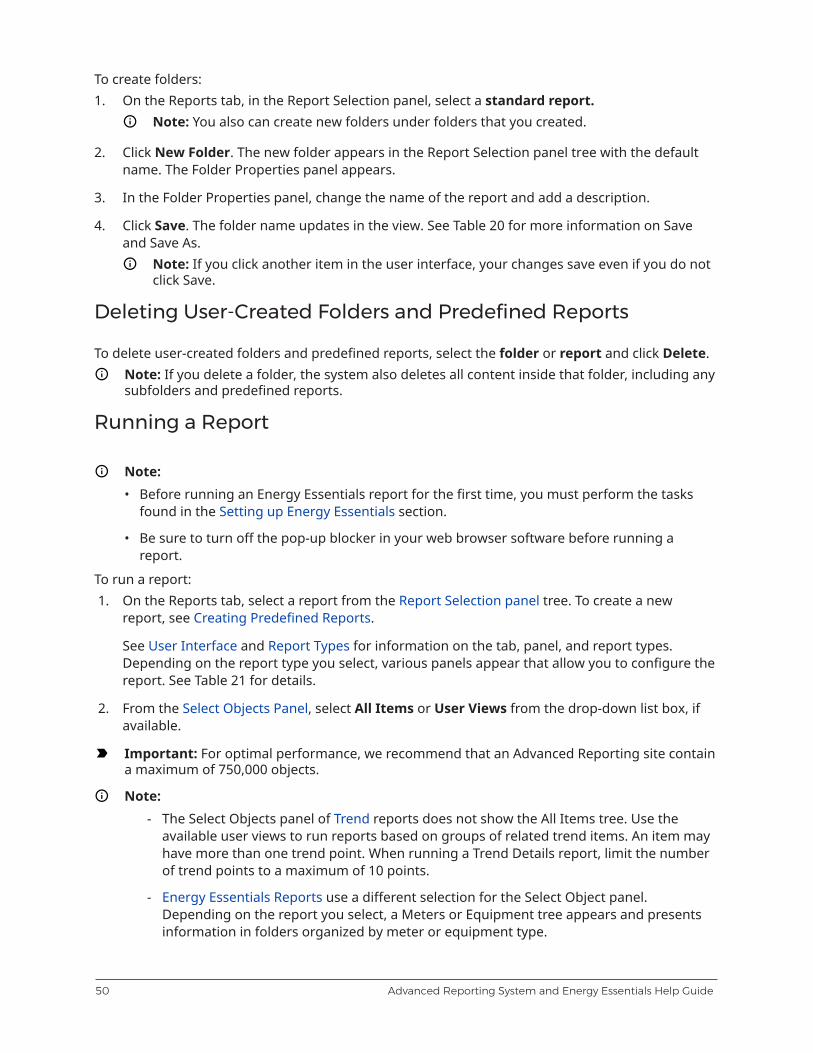
To create folders:1. On the Reports tab, in the Report Selection panel, select a standard report.
Note: You also can create new folders under folders that you created.
2. Click New Folder. The new folder appears in the Report Selection panel tree with the defaultname. The Folder Properties panel appears.
3. In the Folder Properties panel, change the name of the report and add a description.
4. Click Save. The folder name updates in the view. See Table 20 for more information on Saveand Save As.
Note: If you click another item in the user interface, your changes save even if you do notclick Save.
Deleting User-Created Folders and Predefined Reports
To delete user-created folders and predefined reports, select the folder or report and click Delete.Note: If you delete a folder, the system also deletes all content inside that folder, including anysubfolders and predefined reports.
Running a Report
Note:• Before running an Energy Essentials report for the first time, you must perform the tasks
found in the Setting up Energy Essentials section.
• Be sure to turn off the pop-up blocker in your web browser software before running areport.
To run a report:1. On the Reports tab, select a report from the Report Selection panel tree. To create a new
report, see Creating Predefined Reports.
See User Interface and Report Types for information on the tab, panel, and report types.Depending on the report type you select, various panels appear that allow you to configure thereport. See Table 21 for details.
2. From the Select Objects Panel, select All Items or User Views from the drop-down list box, ifavailable.
Important: For optimal performance, we recommend that an Advanced Reporting site containa maximum of 750,000 objects.
Note:- The Select Objects panel of Trend reports does not show the All Items tree. Use the
available user views to run reports based on groups of related trend items. An item mayhave more than one trend point. When running a Trend Details report, limit the numberof trend points to a maximum of 10 points.
- Energy Essentials Reports use a different selection for the Select Object panel.Depending on the report you select, a Meters or Equipment tree appears and presentsinformation in folders organized by meter or equipment type.
Advanced Reporting System and Energy Essentials Help Guide50

3. Click an item in the tree or select multiple items in the tree using the Ctrl or Shift keys.
Note:- When you select a node in the All Items tree, all children and their children are
considered selected.
- See Selection Persistence for details on how the system remembers report selectionsduring the current session.
4. From the Select Date Range Panel, select a period, start date and time, and end date and time.
5. From the Other Filters Panel or Energy Filters Panel, configure the filtering options, if desired.
6. On the right side of the Reports tab, click the Run button. The Report Screen opens in aseparate web browser window or tab, the report generates, and the results appear.
Note:- If you are using a standard report, clicking Run saves any changes you make in the
panels. This button does not perform an autosave if you are using predefined reports.
- If you select too large of a data set, the report may have numerous pages and the reportgeneration and display time may be slow (especially true for detailed report types).
- You can view multiple report windows next to each other on your screen, but you canrun only one report at a time.
- When you first run an Energy Essentials report, the report may take a few minutes tocomplete. Subsequent runs complete more quickly because some information is cached.
7. Go to the Viewing a Report section for information on how to work with a report in the Reportscreen.
Viewing a Report
To view a report:1. Run a report. See Running a Report.
2. When the report results appear in the Report Screen, you can view the contents of the reportto identify problem areas or to check your system for consistency (for example, naming anddescriptions).
You also can perform the following actions in the Report screen:
- Navigate through the report pages using the toolbar. See Report Toolbar section.
- Adjust the zoom level of the report using the toolbar.
- Refresh the report data using the toolbar.
- Print the report using the toolbar.
- Search for items in the report. See Searching for Data in a Report.
- Export the report to a supported format (.tif, .pdf, or .xls) to save the report and performother actions in that program. See Exporting/Saving a Report.
- View the chart, when applicable.
51Advanced Reporting System and Energy Essentials Help Guide

- Expand + and collapse - items in the table to show/hide details.
- The level to which you expand is the level that is displayed in exported files.• Sort the data in the table columns using the ascending/descending sort arrows.
• You cannot sort the data in the Trend reports. These reports are organized alphabetically byPoint Full Reference and chronologically by time. You cannot sort columns in Energy Essentialsreports.
• Cancel a pending report. See Canceling a Report.
• Exit the report. See Exiting a Report.For information on the contents of each report type, see the following Screens and Tabs sections:• Alarm Definition Report Content
• Trend Log Definition Report Content
• Event Summary Report Content
• Event Details Report Content
• Controller Offline Summary Report Content
• Controller Offline Details Report Content
• Event and Audit Details Report Content
• Trend Log Definition Report Content
• Big Picture Energy Report Content
• Load Profile Report Content
• Simple Energy Cost Report Content
• Consumption Report Content
• Equipment Runtime Report Content
• Electrical Energy Report Content
• Production Report Content
Canceling a Report
To cancel a report, close the Report screen web browser window.See the Exiting a Report section.
Searching for Data in a Report
Use this procedure to search for data in the active Report. You can press Ctrl+F to search for astring only on the current page of the report, or you can use the Search box in the report.To search for data in a report:
Advanced Reporting System and Energy Essentials Help Guide52

1. On the Report screen, enter a text string in the Search box. See Report Toolbar for moreinformation. The Find link becomes active.
2. Click Find. The screen moves to the first result, which is highlighted.Note: If the item you entered in the Search box does not exist in the report, a dialog boxappears stating: The search text was not found. Click OK and try anothersearch.
3. Click Next to find the next occurrence of the item in the report.Note: When you have searched the entire report, a dialog box appears stating: Theentire report has been searched.
Exporting/Saving a Report
1. On the Report screen, click the export/save icon to show the drop-down menu options. SeeReport Toolbar and Export Options for more information.
Note: Expand the report content so that all content you wish to export is visible.
2. Select a format from the drop-down menu. The File Download dialog box appears, askingwhether you want to open or save the file.
3. Perform one of the following actions:
- Click Open to open the report in a program that supports the specified format. Work with thefile as desired, and use that program to save the file.
- Click Save to save the file. The Save As dialog box appears. Indicate the location, name, andtype of report. Click Save. The Download Complete dialog box appears. Select to open thefile, open the folder, or close the dialog box.
Printing a Report
You can print a report to any printer installed on the client computer.1. Click the Print button located in the upper-right corner of the Report screen. The Print dialog
box appears. See Report Toolbar for details.
2. Select the desired printer and any other printing options.Note: Each report has a default page size setting for printing the contents of the report inthe best possible format. You can change this setting to another size, if desired.
3. Click OK.Note: If the print function does not work correctly on your system, see Metasys AdvancedReporting System Troubleshooting for details.
Exiting a Report
To exit a report, use one of the following methods:• Click the X button in the upper-right corner of the Report screen window.
• Click the Internet Explorer button in the upper-left corner of the Report screen window and
53Advanced Reporting System and Energy Essentials Help Guide

select Close.
• Press the Alt+F4 keys.
• Press the Ctrl+W keys.Note: Exiting the report also cancels a pending report's execution.
Logging out of the Metasys Advanced Reporting System
1. Click Logout on the toolbar. The Login Screen reappears.Note: Logging out of the Metasys Advanced Reporting System does not log you out of theSite Management Portal UI of the Site Director ADX or ODS. Also, logging out of the SiteManagement Portal UI of the Site Director ADX or ODS does not log you out of the MetasysAdvanced Reporting System.
2. Close the web browser window.
Refreshing the Metasys Advanced Reporting System DataManually
When you make changes to the SCT archive referenced by the Metasys Advanced Reporting System,the data does not refresh in the reporting system until 3:15 A.M. the following morning.
Note: Any users logged in to the reporting system at the time of the refresh are automaticallylogged out of the system. Perform manual refreshes at times when it is likely the system is notin use.
To refresh the Metasys Advanced Reporting System data manually:1. Exit the Metasys Advanced Reporting System UI.
2. On the Start menu of the reporting system ADX or ODS, select Run.
3. In the Run box, type cmd.
4. Press Enter. The command prompt appears in the Command Prompt window.
5. Type net stop metasysreportcacherefresh and press Enter.
6. Type net start metasysreportcacherefresh and press Enter.Note: The refresh process may take several minutes to complete. The ADX or ODS eventlog includes an entry when the refresh process completes, or indicates any errors.
7. Type exit and press Enter.
8. Open the Metasys Advanced Reporting System UI, and the data reflects the changes you madeto the SCT archive.
Advanced Reporting System and Energy Essentials Help Guide54

Screens and Tabs
Login Screen
See the Advanced Reporting System Log in Details and Running a Report sections.Table 18: Login
Field DescriptionUsername Allows you to enter your Metasys system user name.
Note: Password complexity is required. For more information,refer to the Security Administrator System Technical Bulletin(LIT-1201528).
Password Allows you to enter your Metasys system password.Login Button Authenticates the user name and password, verifies authorization, and
opens the Metasys Advanced Reporting System Reports tab.
Reports Tab Content
See Reports Tab in the User Interface section for an overview of the Reports tab.Table 19 contains the buttons in the Reports tab. Table 20 compares the behavior of the Saveand Save As buttons. Table 21 shows the panels that appear in the Reports tab when you select aspecific report type.
Note: Depending on whether you have predefined reports, some buttons in the Report tab donot appear.
Panels that appear in the Reports tab are the following:• Report Selection
• Predefined Report Properties
• Folder Properties
• Select Objects
• Select Date Range
• Other Filters
• Energy Filters
Table 19: Report Tab
Field DescriptionNew Report Button Creates a new predefined report of the type you select.
When you click this button, the Predefined Report Properties Panelappears.
New Folder Button Creates a new folder under the selected item in the tree. When you clickthis button, the Folder Properties Panel appears.
55Advanced Reporting System and Energy Essentials Help Guide
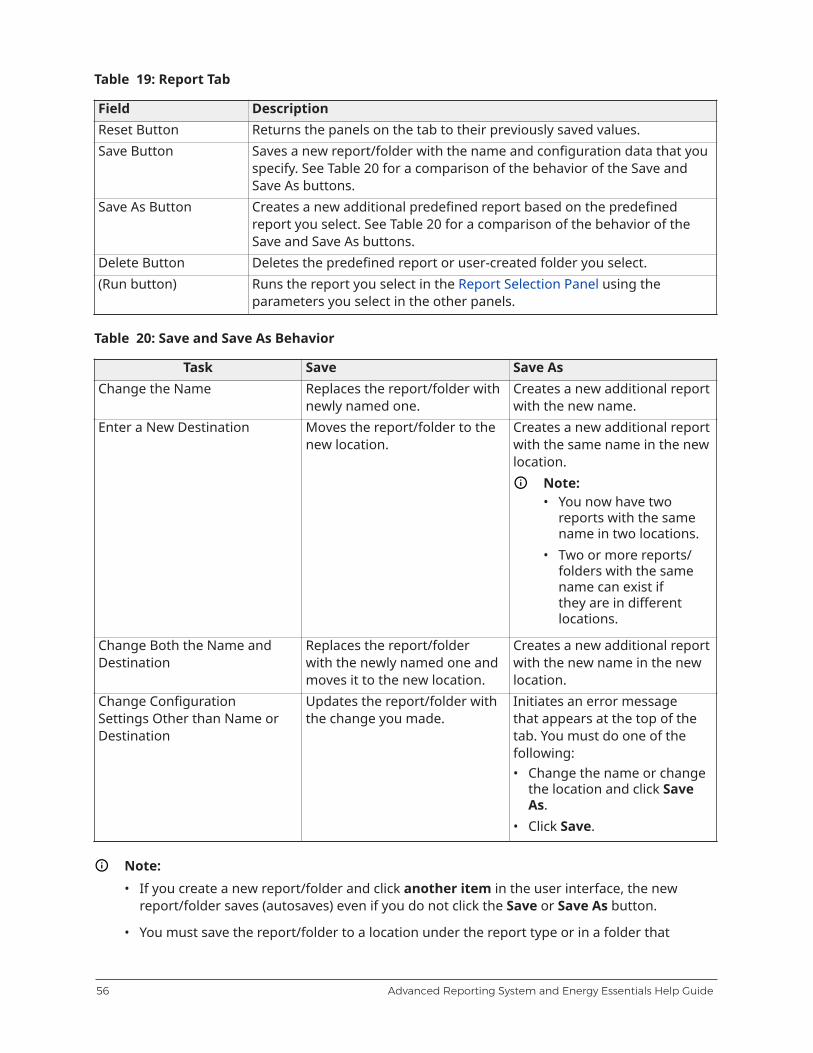
Table 19: Report Tab
Field DescriptionReset Button Returns the panels on the tab to their previously saved values.Save Button Saves a new report/folder with the name and configuration data that you
specify. See Table 20 for a comparison of the behavior of the Save andSave As buttons.
Save As Button Creates a new additional predefined report based on the predefinedreport you select. See Table 20 for a comparison of the behavior of theSave and Save As buttons.
Delete Button Deletes the predefined report or user-created folder you select.(Run button) Runs the report you select in the Report Selection Panel using the
parameters you select in the other panels.
Table 20: Save and Save As Behavior
Task Save Save AsChange the Name Replaces the report/folder with
newly named one.Creates a new additional reportwith the new name.
Enter a New Destination Moves the report/folder to thenew location.
Creates a new additional reportwith the same name in the newlocation.
Note:• You now have two
reports with the samename in two locations.
• Two or more reports/folders with the samename can exist ifthey are in differentlocations.
Change Both the Name andDestination
Replaces the report/folderwith the newly named one andmoves it to the new location.
Creates a new additional reportwith the new name in the newlocation.
Change ConfigurationSettings Other than Name orDestination
Updates the report/folder withthe change you made.
Initiates an error messagethat appears at the top of thetab. You must do one of thefollowing:• Change the name or change
the location and click SaveAs.
• Click Save.
Note:• If you create a new report/folder and click another item in the user interface, the new
report/folder saves (autosaves) even if you do not click the Save or Save As button.
• You must save the report/folder to a location under the report type or in a folder that
Advanced Reporting System and Energy Essentials Help Guide56
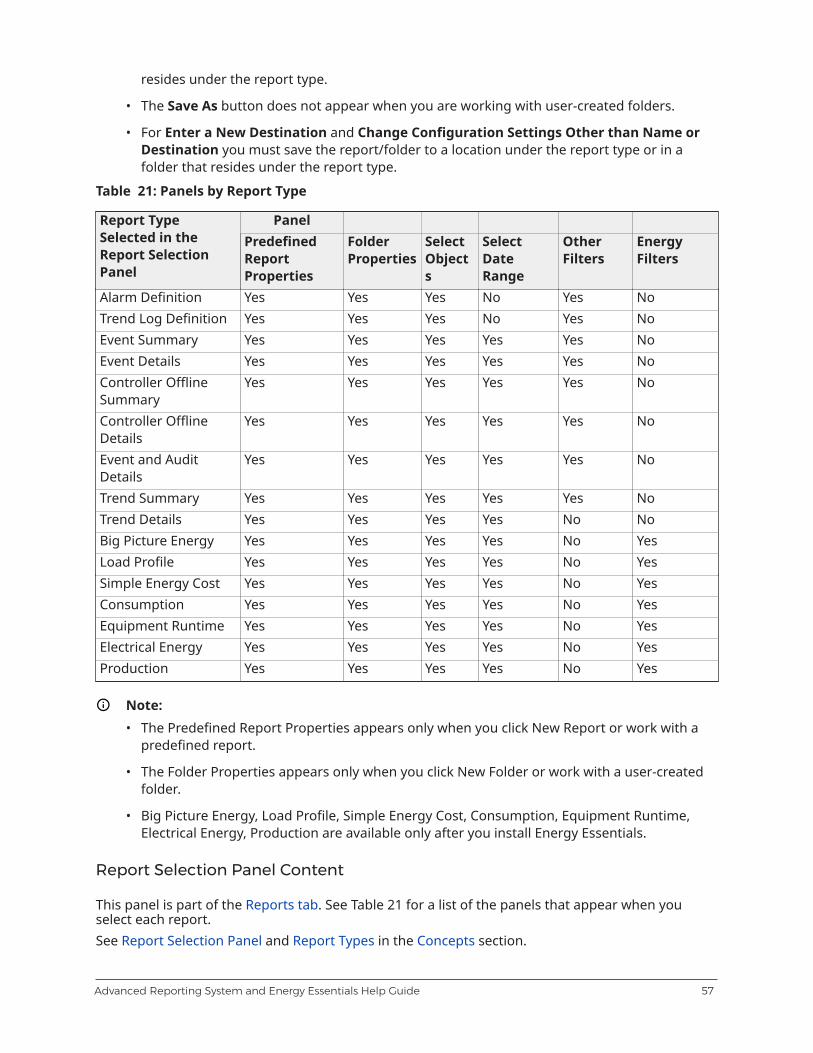
resides under the report type.
• The Save As button does not appear when you are working with user-created folders.
• For Enter a New Destination and Change Configuration Settings Other than Name orDestination you must save the report/folder to a location under the report type or in afolder that resides under the report type.
Table 21: Panels by Report Type
PanelReport TypeSelected in theReport SelectionPanel
PredefinedReportProperties
FolderProperties
SelectObjects
SelectDateRange
OtherFilters
EnergyFilters
Alarm Definition Yes Yes Yes No Yes NoTrend Log Definition Yes Yes Yes No Yes NoEvent Summary Yes Yes Yes Yes Yes NoEvent Details Yes Yes Yes Yes Yes NoController OfflineSummary
Yes Yes Yes Yes Yes No
Controller OfflineDetails
Yes Yes Yes Yes Yes No
Event and AuditDetails
Yes Yes Yes Yes Yes No
Trend Summary Yes Yes Yes Yes Yes NoTrend Details Yes Yes Yes Yes No NoBig Picture Energy Yes Yes Yes Yes No YesLoad Profile Yes Yes Yes Yes No YesSimple Energy Cost Yes Yes Yes Yes No YesConsumption Yes Yes Yes Yes No YesEquipment Runtime Yes Yes Yes Yes No YesElectrical Energy Yes Yes Yes Yes No YesProduction Yes Yes Yes Yes No Yes
Note:• The Predefined Report Properties appears only when you click New Report or work with a
predefined report.
• The Folder Properties appears only when you click New Folder or work with a user-createdfolder.
• Big Picture Energy, Load Profile, Simple Energy Cost, Consumption, Equipment Runtime,Electrical Energy, Production are available only after you install Energy Essentials.
Report Selection Panel Content
This panel is part of the Reports tab. See Table 21 for a list of the panels that appear when youselect each report.See Report Selection Panel and Report Types in the Concepts section.
57Advanced Reporting System and Energy Essentials Help Guide

Table 22: Report Selection Panel
Field DescriptionConfiguration Setup Review The following report types appear under Configuration Setup
Review:• Alarm Definition• Trend Log Definition
System Behavior The following report types appear under System Behavior:• Event Summary• Event Details• Controller Offline Summary• Controller Offline Details• Event and Audit Details• Trend Summary• Trend Details
Energy Essentials Reports The following report types appear under Energy EssentialsReports:• Big Picture Energy Reports• Load Profile Reports• Simple Energy Cost Reports• Consumption Reports• Equipment Runtime Reports• Electrical Energy Reports• Production Reports
(Standard Folder) This icon identifies a default folder provided by the reportingsystem. The default folder cannot be modified or removed.
(Standard Report)This icon identifies a default report provided by the reportingsystem.
(User-Created Folder)This icon identifies a folder created by a user. See Creating Folders.
(Predefined Report)This icon identifies a predefined report created by a user. SeeCreating Predefined Reports.
Note: Energy Essentials Reports available only when you install Energy Essentials.
Predefined Report Properties Panel Content
This panel is part of the Reports tab. This panel appears only when you select a report in the ReportSelection Panel and click New Report, or if you are working with a predefined report.See Predefined Report Properties Panel in the Concepts section for other details.Table 23: Predefined Report Properties Panel
Field DescriptionName Allows you to name the predefined report.Description Allows you to enter a short description of the predefined report.
Advanced Reporting System and Energy Essentials Help Guide58

Table 23: Predefined Report Properties Panel
Field DescriptionStandard Report Shows the path of the predefined report in the Report Selection panel
tree.Choose a DestinationFolder
Displays the folder or standard report location for the predefinedreport. Currently, this field is populated with the report type youselected when you clicked New Report.
Folder Properties Panel Content
This panel is part of the Reports tab. This panel appears only when you select a report in the ReportSelection Panel and click New Folder, or if you are working with a folder you created. See FolderProperties Panel in the Concepts section for other details.Table 24: Folder Properties Panel
Field DescriptionName Allows you to name the folder.Description Allows you to enter a short description of the folder.Standard Report Shows the path of the folder in the Report Selection Panel tree.Choose a Destination Folder Displays the folder or report location for the new folder. Currently,
this field is populated with the report type you selected when youclicked New Folder.
Select Objects Panel Content
This panel is part of the Reports tab. This panel includes the navigation trees that apply to thespecific report you select. This panel appears for all report types.See Select Objects Panel for more details.
Select Date Range Panel Content
This panel is part of the Reports Tab. See Table 21 for the report types that use this panel.All times use the time zone of the ADX or ODS.See Select Date Range Panel in the Concepts section for other details.
59Advanced Reporting System and Energy Essentials Help Guide

Table 25: Select Date Range Panel
Field DescriptionPeriod Allows you to select one of the following date options:
• Date Range: Includes records from a specified range of dates.• Today: Includes records from 00:00:00/12:00:00 A.M. onward.• Yesterday: Includes records from 00:00:00/12:00:00 A.M. to
23:59:59/11:59:59 P.M. of the previous day.• This Week: Includes records from 00:00:00/12:00:00 A.M. of
the first day of the week onward. The first day of the week isdetermined by your user locale (for example, the first day ofthe week can be Sunday, Monday, or another day).
• Last Week: Includes records from 00:00:00/12:00:00 A.M. ofthe first day of last week to 23:59:59/11:59:59 P.M. of the lastday of last week.
• This Month: Includes records from 00:00:00/12:00:00 A.M. ofthe first day of the month onward.
• Last Month: Includes records from 00:00:00/12:00:00 A.M. ofthe first day of last month to 23:59:59/11:59:59 P.M. of the lastday of last month.
• This Quarter Includes records from 00:00:00/12:00:00 A.M. ofthe first day of the quarter onward.
• Last Quarter: Includes records from 00:00:00/12:00:00 A.M. ofthe first day of the previous quarter to 23:59:59/11:59:59 P.M.of the last day of the quarter.
• This Year: Includes records from 00:00:00/12:00:00 A.M. of thefirst day of the year onward.
• Last Year: Includes records from 00:00:00/12:00:00 A.M. of thefirst day of last year to 23:59:59/11:59:59 P.M. of the last day oflast year.
• All Available: Includes all records without a filter (default).Note: The time format (00:00:00 to 23:59:59 or 12:00:00A.M. to 11:59:59 P.M.) is based on the client computer locale.
Start Date/End Date Allows you to directly enter the start and end dates in eitherlong (for example, December 1, 2006) or short (for example,12/01/2006) format. The format depends on your preferredlocale (for example, the short format may be DD.MM.YYYY orMM/DD/YYYY).
If you select a relative period such as Today or Last year, the StartDate and End Date fields populate automatically.
Advanced Reporting System and Energy Essentials Help Guide60
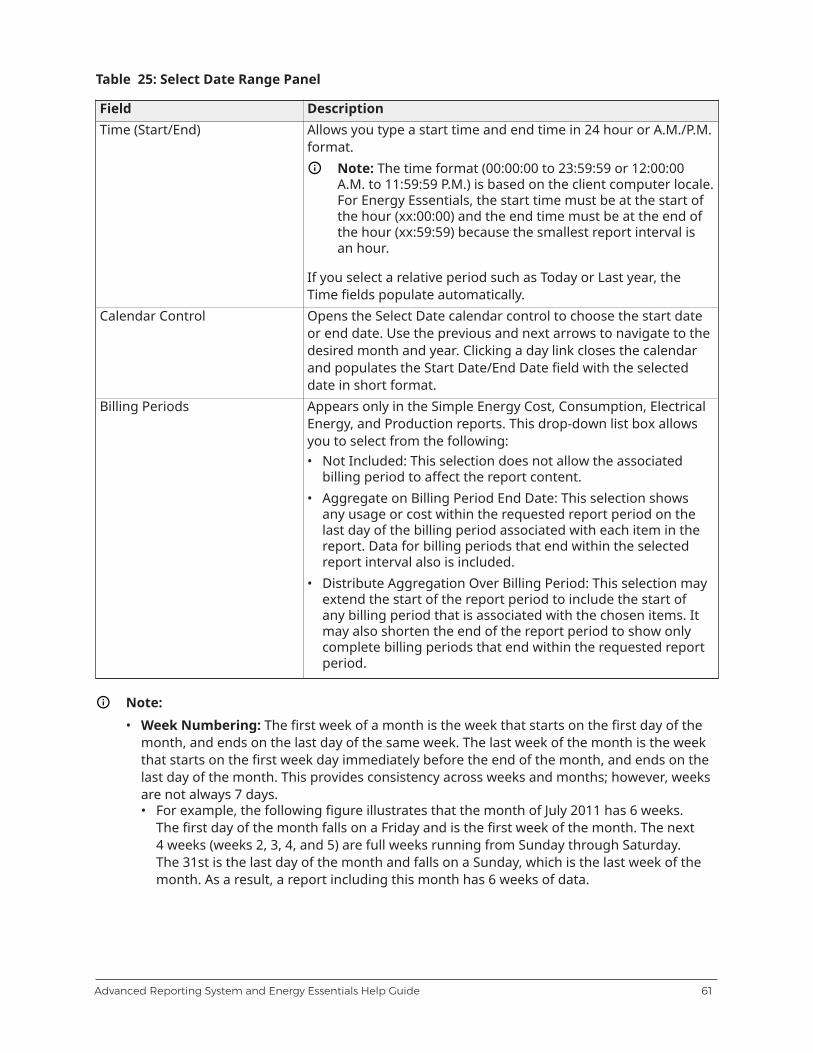
Table 25: Select Date Range Panel
Field DescriptionTime (Start/End) Allows you type a start time and end time in 24 hour or A.M./P.M.
format.Note: The time format (00:00:00 to 23:59:59 or 12:00:00A.M. to 11:59:59 P.M.) is based on the client computer locale.For Energy Essentials, the start time must be at the start ofthe hour (xx:00:00) and the end time must be at the end ofthe hour (xx:59:59) because the smallest report interval isan hour.
If you select a relative period such as Today or Last year, theTime fields populate automatically.
Calendar Control Opens the Select Date calendar control to choose the start dateor end date. Use the previous and next arrows to navigate to thedesired month and year. Clicking a day link closes the calendarand populates the Start Date/End Date field with the selecteddate in short format.
Billing Periods Appears only in the Simple Energy Cost, Consumption, ElectricalEnergy, and Production reports. This drop-down list box allowsyou to select from the following:• Not Included: This selection does not allow the associated
billing period to affect the report content.• Aggregate on Billing Period End Date: This selection shows
any usage or cost within the requested report period on thelast day of the billing period associated with each item in thereport. Data for billing periods that end within the selectedreport interval also is included.
• Distribute Aggregation Over Billing Period: This selection mayextend the start of the report period to include the start ofany billing period that is associated with the chosen items. Itmay also shorten the end of the report period to show onlycomplete billing periods that end within the requested reportperiod.
Note:• Week Numbering: The first week of a month is the week that starts on the first day of the
month, and ends on the last day of the same week. The last week of the month is the weekthat starts on the first week day immediately before the end of the month, and ends on thelast day of the month. This provides consistency across weeks and months; however, weeksare not always 7 days.• For example, the following figure illustrates that the month of July 2011 has 6 weeks.
The first day of the month falls on a Friday and is the first week of the month. The next4 weeks (weeks 2, 3, 4, and 5) are full weeks running from Sunday through Saturday.The 31st is the last day of the month and falls on a Sunday, which is the last week of themonth. As a result, a report including this month has 6 weeks of data.
61Advanced Reporting System and Energy Essentials Help Guide

• Daylight Saving Time (DST): Reports consider the day and time shifts due to the change inthe Daylight Saving Time policy. During the transitions between Standard Time and DaylightSaving Time, the intervals (hours in a day) vary. The date and time of records that spantransitions are displayed according to the Daylight Saving Time policy at the time of thereport execution. The data is stored on the ADX or ODS in coordinated universal time (UTC)format, which is locale independent. The Metasys Advanced Reporting System relies on theoperating system (OS) to convert the time to the local time. Reports generated at differenttimes may have date/time discrepancies because newer Microsoft Windows OSs do notpreserve past years' algorithms and apply the same, current algorithm to old dates andtimes.
• The first day of the week is determined by the ADX or ODS locale. For example, the first dayof the week can be Sunday, Monday, or any other specified day. The same method applies tothe last day of the week.
• Quarters are January-March, April-June, July-September, and October-December.
Other Filters Panel Content
This panel is part of the Reports Tab. See Table 21 for the report types that use this panel. Table 26lists all of the filter options. The fields that appear vary depending on the report type you select.See Other Filters Panel in the Concepts section for other details.
Advanced Reporting System and Energy Essentials Help Guide62

Table 26: Other Filters Panel
Field DescriptionItem Name Allows you to filter the items appearing in the report by using the
following wildcards:
? - one character
* - any length string
For example, Room 1? matches Room 1 and Room 12, whereas Room1* matches Room 1, Room 12, and Room 123. By default, this fieldis empty. The filter is not case sensitive. This field cannot exceed 100characters.
Note:• For items selected from the All Items tree, the name comes from
the Name attribute. For items selected from the User View tree,the name is the user-defined label designating the item in theuser view.
• Only one wildcard search term can be used per search. Forexample, you cannot combine searches by using two wildcardterms separated by commas, such as *MA* , *LOW*.
Item Type(s) Limits the type of items included in the report. You can select one ormore of the following types:• Field Devices• Points• Supervisory DevicesBy default, no entry is selected, meaning that the report includes allrecords.
Attribute(s) Limits the items included in the report to one or more selected attributes.This field is populated with the names of the attributes in the databasethat have entries applicable to the selected report. For example, if theselected report is Alarm Definition, then only the attributes for whichalarms are defined appear in the list. By default, no entry is selected,meaning that the report includes all records.
Disabled Alarms Only Includes records for items with alarming disabled, when selected.Disabled Trends Only Includes records for items with trends disabled, when selected.Alarm Types Includes records for items with one or both of the following type of alarm
extensions configured, when selected:• Analog Alarms• Multistate AlarmsThese fields are both selected by default.
63Advanced Reporting System and Energy Essentials Help Guide

Table 26: Other Filters Panel
Field DescriptionInclude Also Includes records for items with the specified configuration, when
selected. For the Alarm Definition report type, the following fields areavailable:• Points That Do Not Have Alarms Configured: Includes all points
that do not have any alarm extensions associated with any oftheir attributes. These points appear in the Points without Alarmssubreport, accessible through a link in the Alarm Definition report. Youcannot select this field when only Field Devices and/or SupervisoryDevices Item Types are selected.
• Devices with Automatic Alarming Disabled: Includes all devicesthat have the Disable Automatic Alarming attribute set to True.These devices appear in the Devices with Automatic Alarming Disablesubreport, accessible through a link in the Alarm Definition report. Youcannot select this field when only Points Item Type is selected.
Note: The Disable Automatic Alarming attribute specifies whetherautomatic online/offline reporting is disabled (True) or enabled(False) for the controller itself. This attribute does not apply to thepoints on the controller but to the controller itself. Devices with theDisable Automatic Alarming attribute set to True do not producean alarm or indicate they are offline in the Metasys system userinterface navigation tree. Alarm extensions are not affected by thisattribute.
For the Trend Log Definition report type, the following field is available:• Points That Do Not Have Trends Configured: Includes all points
that do not have any trend extensions associated with any of theirattributes. These points appear in the Points without Trends subreport,accessible through a link in the Trend Definition report. You cannotselect this field when only Field Devices and/or Supervisory DevicesItem Types are selected.
User(s) Limits the records in the report to only those associated with a specificuser.
Include in report Limits the contents of the report to one of the following options:• Events and Audits• Events Only• Audits OnlyAnnotations are included in the report.
Events Filter Filters the event records as follows:• Event Status: Limits the contents of the report to events with the
selected Status.• Priority: Limits the contents of the report to events with the specified
priority (range = 0–255).
Advanced Reporting System and Energy Essentials Help Guide64

Table 26: Other Filters Panel
Field DescriptionAudits Filter Filters the audit records as follows:
• Audit Status: Limits the contents of the report to audits with theselected Status.
• Pre Value: Limits the records in the report to audits with the specifiedprevious value.
• Post Value: Limits the records in the report to audits with the specifiedvalue.
Note: The Pre and Post value fields support wildcards and are notcase sensitive.
Calculate Mean KineticTemperature
Calculates and includes the Mean Kinetic Temperature (MKT) fortemperature points, when selected.
Energy Filters Panel Content
This panel is part of the Reports tab. All Energy Essentials reports offer this panel.Table 27 lists all ofthe filter options. The fields that appear vary depending on the report type you select.See Energy Filters Panel in the Concepts section for other details.Table 27: Energy Filters Panel
Field DescriptionCategories Allows you to filter based on the category defined for energy/utility
meters. To filter by the category, you must configure the Category fieldof the Energy/Utility Meter view.
Subcategories Allows you to filter based on the subcategory defined for energy/utility meters. To filter by the subcategory, you must configure theSubcategory field of the Energy/Utility Meter view.
Energy Types Allows you to filter based on available types of energy for the meters/equipment included in the report. Choices include Natural Gas, Steam,and Water Consumption. See Table 8.
Billing Periods Allows you to filter based on billing periods you entered in the BillingPeriod view.
Equipment Type Indicates the type of equipment. In the Equipment Details box, thechoices in the drop-down selection list are Boiler, Chiller, Fan, Other, andPump.
Physical Locations Allows you to filter based on physical location. To filter by location, itemsmust have a location entered in the Physical Location column of the Energy/Utility Meter view or Equipment view.
Weather Data Adds weather data to the report, if selected. To include weather data,you must have a folder with weather-related points mapped to WeatherData in the Energy Folders view, and have that data associated with themeters on which you wish to report. See Mapping Energy EssentialsPoints.
65Advanced Reporting System and Energy Essentials Help Guide
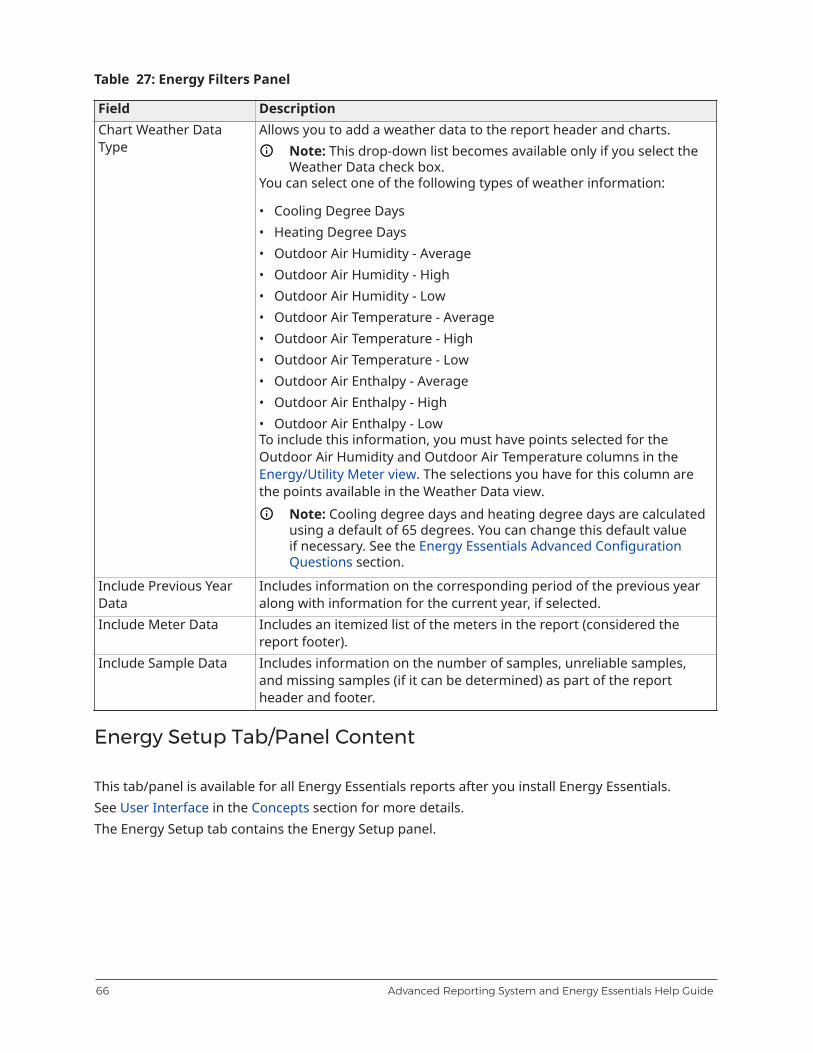
Table 27: Energy Filters Panel
Field DescriptionChart Weather DataType
Allows you to add a weather data to the report header and charts.Note: This drop-down list becomes available only if you select theWeather Data check box.
You can select one of the following types of weather information:
• Cooling Degree Days• Heating Degree Days• Outdoor Air Humidity - Average• Outdoor Air Humidity - High• Outdoor Air Humidity - Low• Outdoor Air Temperature - Average• Outdoor Air Temperature - High• Outdoor Air Temperature - Low• Outdoor Air Enthalpy - Average• Outdoor Air Enthalpy - High• Outdoor Air Enthalpy - LowTo include this information, you must have points selected for theOutdoor Air Humidity and Outdoor Air Temperature columns in theEnergy/Utility Meter view. The selections you have for this column arethe points available in the Weather Data view.
Note: Cooling degree days and heating degree days are calculatedusing a default of 65 degrees. You can change this default valueif necessary. See the Energy Essentials Advanced ConfigurationQuestions section.
Include Previous YearData
Includes information on the corresponding period of the previous yearalong with information for the current year, if selected.
Include Meter Data Includes an itemized list of the meters in the report (considered thereport footer).
Include Sample Data Includes information on the number of samples, unreliable samples,and missing samples (if it can be determined) as part of the reportheader and footer.
Energy Setup Tab/Panel Content
This tab/panel is available for all Energy Essentials reports after you install Energy Essentials.See User Interface in the Concepts section for more details.The Energy Setup tab contains the Energy Setup panel.
Advanced Reporting System and Energy Essentials Help Guide66

Table 28: Energy Setup Panel
Item DescriptionView Drop-Down ListBox
Allows you to select from the following views that appear in the panel:• Energy Folders
• Billing Period
• Billing Rate
• Energy/Utility Meter
• Equipment
• Weather Data
• Other Data
Delete Button Appears in these views:• Billing Period• Billing Rate• Energy/Utility Meter• Equipment• Weather Data• Other Data
Add New Button Appears in these views:• Billing Period• Billing Rate
Clear New EntryButton
Appears in these views:• Energy/Utility Meter• Equipment• Weather Data• Other Data
Edit Button Appears in these views:• Energy Folders• Billing Period• Billing Rate• Energy/Utility Meter• Equipment• Weather Data• Other Data
Energy Folders View Content
This view is available on the Energy Setup tab/panel that appears when you install EnergyEssentials. See Energy Setup Panel in the Concepts section for more details.This view is used to map Metasys system points/folders to Energy Essentials and to populate thecontent of the Energy/Utility Meter, Equipment, Weather Data, and Other Data views. See MappingEnergy Essentials Points.
67Advanced Reporting System and Energy Essentials Help Guide
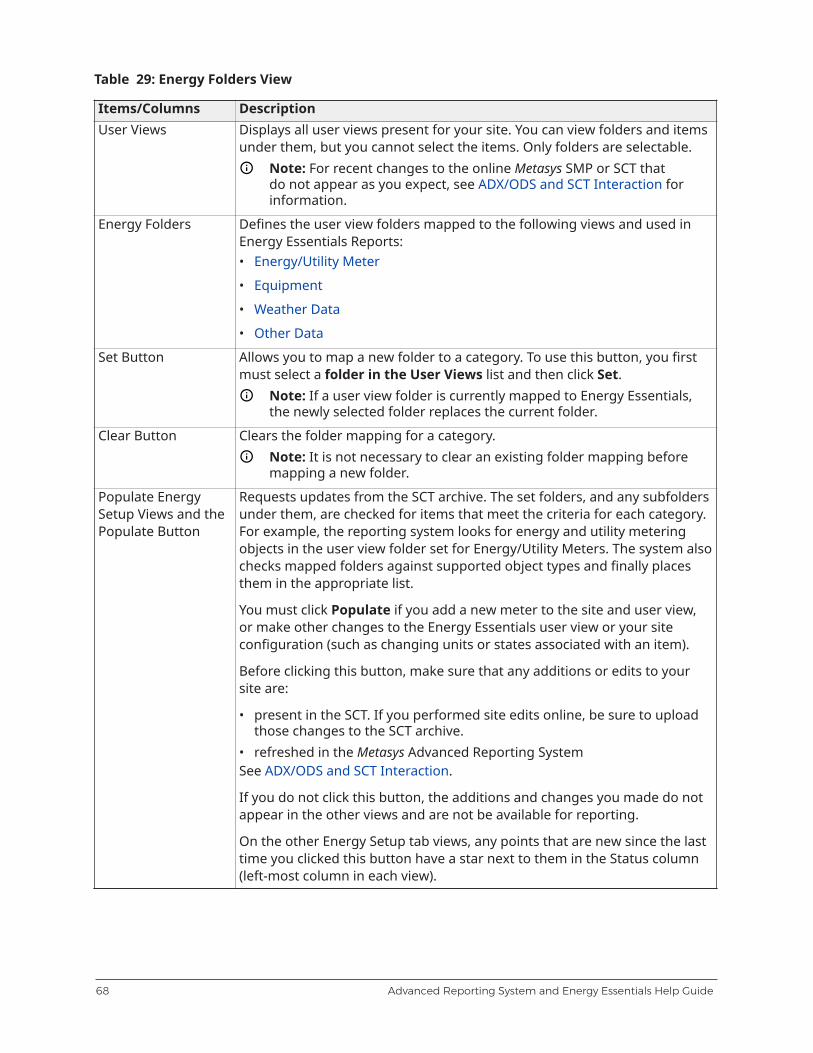
Table 29: Energy Folders View
Items/Columns DescriptionUser Views Displays all user views present for your site. You can view folders and items
under them, but you cannot select the items. Only folders are selectable.Note: For recent changes to the online Metasys SMP or SCT thatdo not appear as you expect, see ADX/ODS and SCT Interaction forinformation.
Energy Folders Defines the user view folders mapped to the following views and used inEnergy Essentials Reports:• Energy/Utility Meter
• Equipment
• Weather Data
• Other Data
Set Button Allows you to map a new folder to a category. To use this button, you firstmust select a folder in the User Views list and then click Set.
Note: If a user view folder is currently mapped to Energy Essentials,the newly selected folder replaces the current folder.
Clear Button Clears the folder mapping for a category.Note: It is not necessary to clear an existing folder mapping beforemapping a new folder.
Populate EnergySetup Views and thePopulate Button
Requests updates from the SCT archive. The set folders, and any subfoldersunder them, are checked for items that meet the criteria for each category.For example, the reporting system looks for energy and utility meteringobjects in the user view folder set for Energy/Utility Meters. The system alsochecks mapped folders against supported object types and finally placesthem in the appropriate list.
You must click Populate if you add a new meter to the site and user view,or make other changes to the Energy Essentials user view or your siteconfiguration (such as changing units or states associated with an item).
Before clicking this button, make sure that any additions or edits to yoursite are:
• present in the SCT. If you performed site edits online, be sure to uploadthose changes to the SCT archive.
• refreshed in the Metasys Advanced Reporting SystemSee ADX/ODS and SCT Interaction.
If you do not click this button, the additions and changes you made do notappear in the other views and are not be available for reporting.
On the other Energy Setup tab views, any points that are new since the lasttime you clicked this button have a star next to them in the Status column(left-most column in each view).
Advanced Reporting System and Energy Essentials Help Guide68

Billing Period View Content
This view is available on the Energy Setup tab/panel that appears when you install EnergyEssentials. See Energy Setup Panel in the Concepts section for more details.You can sort each column by clicking the name of the column. When a column is sorted, a triangleappears next to the column name.Table 30: Billing Period View
Items/Columns DescriptionDelete Deletes the selected billing period from the view.
Typically, billing periods are modified over time rather than deleted.Add New Creates a new billing period.
When you click this button, the Billing Period Details box appears.Edit Allows you to edit details for the selected period or periods.
When you click this button, the Billing Period Details box appears.Billing Period Details Appears on the right side of the view when you click Add New or Edit. This
box allows you to edit information that displays in the columns of the view.The Cancel button cancels the addition/edit of the period. The Save buttonsaves all additions and changes.
If you attempt to save details that are invalid, such as duplicate start dateor duplicate name, a red X with a circle around it appears. The fields in thisbox correspond to the columns in the view. For descriptions of the fields,use this table.
Name Contains the name of the billing period.Description Contains a brief description of the billing period.
69Advanced Reporting System and Energy Essentials Help Guide

Table 30: Billing Period View
Items/Columns DescriptionStarting On Date Indicates the date the billing period starts. In the Billing Period Details box,
click the plus sign next to Dates to select a new start date for each periodfor which you want to report.
For example, if your utility bill period runs from approximately the 20thof the month through approximately the 19th of the next month, and youwould like to create a report for 1/20/2011 through 4/20/2011, enter thefollowing dates in the Starting On Date field:• 1/20/2011• 2/19/2011• 3/20/2011• 4/21/2011To remove a date, click the minus sign next to the date.
Note:• If a billing period assigned to a meter does not end within the
requested report period, data for the requested report period usesonly the information for the completed periods. For example, ifyou decide to create a report for the first quarter of the year usingthe effective start dates above, only the billing information fromperiods from 1/20/2011 - 2/18/2011 and 2/19/2011 - 3/19/2011 areused. Periods that start or end outside the report period are notused.
• If a meter has a billing period that starts prior to the requestedreport period, the rate table in a Simple Cost report shows thereport start date as the first day of the requested report period.But, when a meter billing period starts within the requested reportperiod, the Simple Cost report shows the Starting On Date from thisview as the first day of the requested report period.
See Energy Essentials Advanced Configuration Questions.
Billing Rate View Content
This view is available on the Energy Setup tab/panel that appears when you install EnergyEssentials. Each billing rate must have a base rate, consumption rate, and demand rate (optional).See Energy Setup Panel in the Concepts section for more details.
Important: Do not use this report to validate your utility bill. This report is not intended foruse in a billing validation application.
You can sort each column by clicking the name of the column. When a column is sorted, a triangleappears next to the column name.Table 31: Billing Rate View
Items/Columns DescriptionDelete Deletes the selected billing rate from the view.
Typically, billing rates are modified over time rather than deleted.Add New Creates a new billing rate.
When you click this button, the Billing Rate Details box appears.
Advanced Reporting System and Energy Essentials Help Guide70

Table 31: Billing Rate View
Items/Columns DescriptionEdit Allows you to edit the details of the selected rate or rates.
When you click this button, the Billing Rate Details box appears.Billing Rate Details Appears on the right side of the view when you click Add New or Edit. This
box allows you to edit information that displays in the columns of theview. The Cancel button cancels the addition/edit of the period. The Savebutton saves all additions and changes.
If you attempt to save details that are invalid, a red X with a circle aroundit appears. The fields in this box correspond to the columns in the view.For descriptions of the fields, use this table.
Name Contains the name of the billing rate.Description Contains a brief description of the billing rate.Base Rate (FixedMonthly Cost)
Contains the fixed cost that does not fluctuate depending on use(sometimes known as a hookup charge). A base rate is required. Touse an empty rate, enter 0. Because of varying and complex utility ratestructures, the Base Rate (Fixed Monthly Cost) column also can be usedto estimate rates that may not have a specific entry for Billing Rate. Forexample, a utility company may charge for Distribution Demand which iscalculated based on the peak demand over the past 12 months. You candetermine the charge from your bill and add it to the base rate.
In the Billing Rate Details box, you can edit the rate value or set the startdate for this rate value. Click the plus sign next to Cost ($/period) to selectthe value of the rate and the day the rate starts. Enter a separate baserate cost and start day for each different rate.
To remove a start cost/start date pair, click the minus sign next to eachrate.
If you attempt to run a report for a period before the periods withdefined base rates, the oldest rate is used.
Consumption Units Contains the units used for consumption information.
In the Billing Rate Details box, select the appropriate units from the drop-down selection list.
Note:• If the units you select for Consumption Units cannot be converted
into the units used by the meter, the Simple Energy Cost reportshows a blank Consumption Rate.
• If report content uses one type of units, the report displays thoseunits. If report content uses two or more different types of units,the units that appear in the report are the default system units. Tochange the default, see Energy Essentials Advanced ConfigurationQuestions.
71Advanced Reporting System and Energy Essentials Help Guide
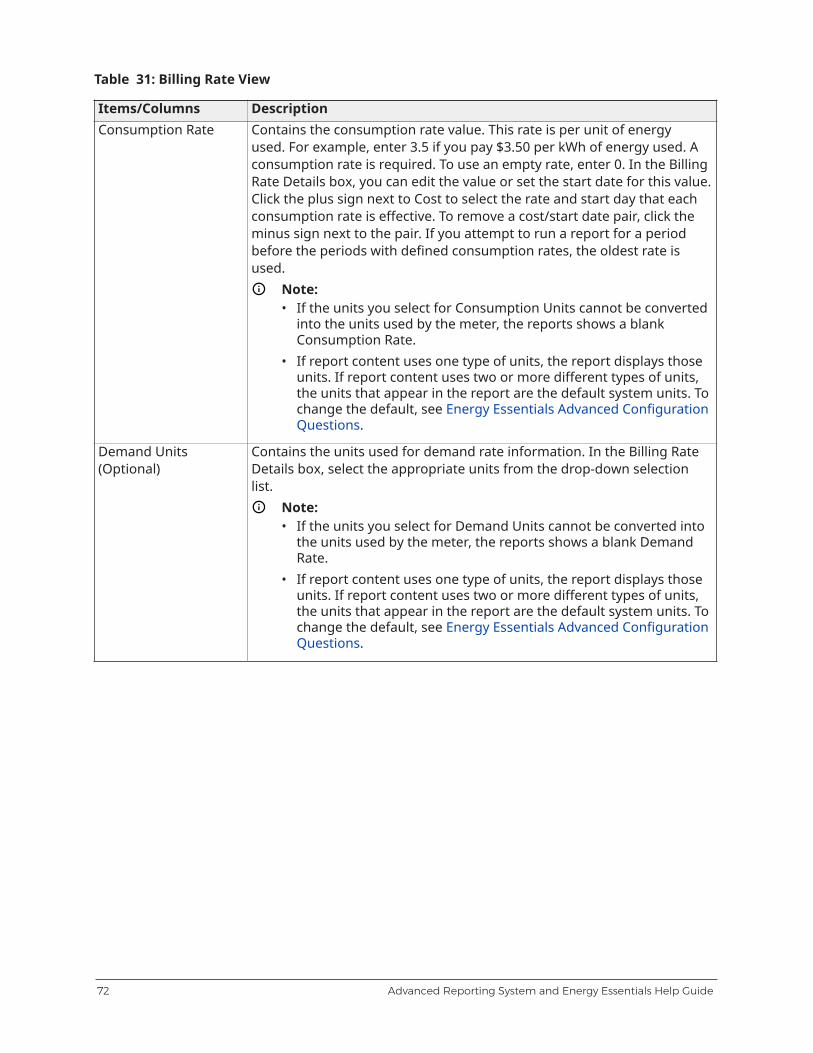
Table 31: Billing Rate View
Items/Columns DescriptionConsumption Rate Contains the consumption rate value. This rate is per unit of energy
used. For example, enter 3.5 if you pay $3.50 per kWh of energy used. Aconsumption rate is required. To use an empty rate, enter 0. In the BillingRate Details box, you can edit the value or set the start date for this value.Click the plus sign next to Cost to select the rate and start day that eachconsumption rate is effective. To remove a cost/start date pair, click theminus sign next to the pair. If you attempt to run a report for a periodbefore the periods with defined consumption rates, the oldest rate isused.
Note:• If the units you select for Consumption Units cannot be converted
into the units used by the meter, the reports shows a blankConsumption Rate.
• If report content uses one type of units, the report displays thoseunits. If report content uses two or more different types of units,the units that appear in the report are the default system units. Tochange the default, see Energy Essentials Advanced ConfigurationQuestions.
Demand Units(Optional)
Contains the units used for demand rate information. In the Billing RateDetails box, select the appropriate units from the drop-down selectionlist.
Note:• If the units you select for Demand Units cannot be converted into
the units used by the meter, the reports shows a blank DemandRate.
• If report content uses one type of units, the report displays thoseunits. If report content uses two or more different types of units,the units that appear in the report are the default system units. Tochange the default, see Energy Essentials Advanced ConfigurationQuestions.
Advanced Reporting System and Energy Essentials Help Guide72
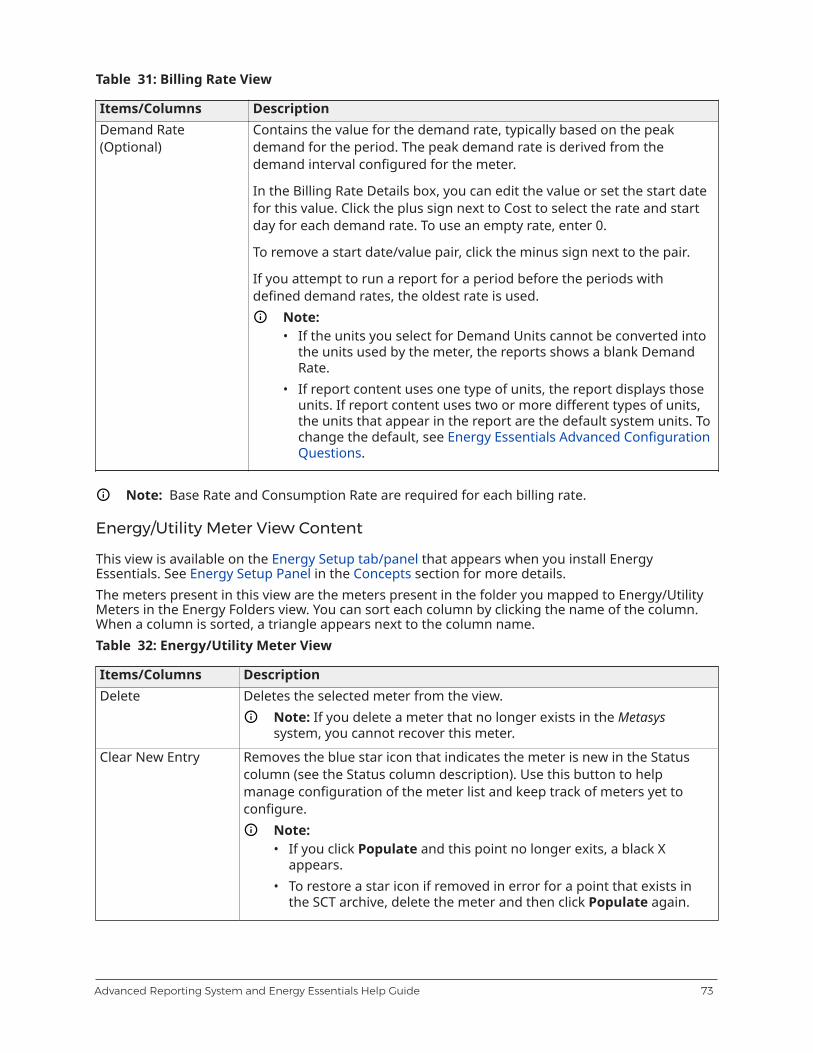
Table 31: Billing Rate View
Items/Columns DescriptionDemand Rate(Optional)
Contains the value for the demand rate, typically based on the peakdemand for the period. The peak demand rate is derived from thedemand interval configured for the meter.
In the Billing Rate Details box, you can edit the value or set the start datefor this value. Click the plus sign next to Cost to select the rate and startday for each demand rate. To use an empty rate, enter 0.
To remove a start date/value pair, click the minus sign next to the pair.
If you attempt to run a report for a period before the periods withdefined demand rates, the oldest rate is used.
Note:• If the units you select for Demand Units cannot be converted into
the units used by the meter, the reports shows a blank DemandRate.
• If report content uses one type of units, the report displays thoseunits. If report content uses two or more different types of units,the units that appear in the report are the default system units. Tochange the default, see Energy Essentials Advanced ConfigurationQuestions.
Note: Base Rate and Consumption Rate are required for each billing rate.
Energy/Utility Meter View Content
This view is available on the Energy Setup tab/panel that appears when you install EnergyEssentials. See Energy Setup Panel in the Concepts section for more details.The meters present in this view are the meters present in the folder you mapped to Energy/UtilityMeters in the Energy Folders view. You can sort each column by clicking the name of the column.When a column is sorted, a triangle appears next to the column name.Table 32: Energy/Utility Meter View
Items/Columns DescriptionDelete Deletes the selected meter from the view.
Note: If you delete a meter that no longer exists in the Metasyssystem, you cannot recover this meter.
Clear New Entry Removes the blue star icon that indicates the meter is new in the Statuscolumn (see the Status column description). Use this button to helpmanage configuration of the meter list and keep track of meters yet toconfigure.
Note:• If you click Populate and this point no longer exits, a black X
appears.• To restore a star icon if removed in error for a point that exists in
the SCT archive, delete the meter and then click Populate again.
73Advanced Reporting System and Energy Essentials Help Guide
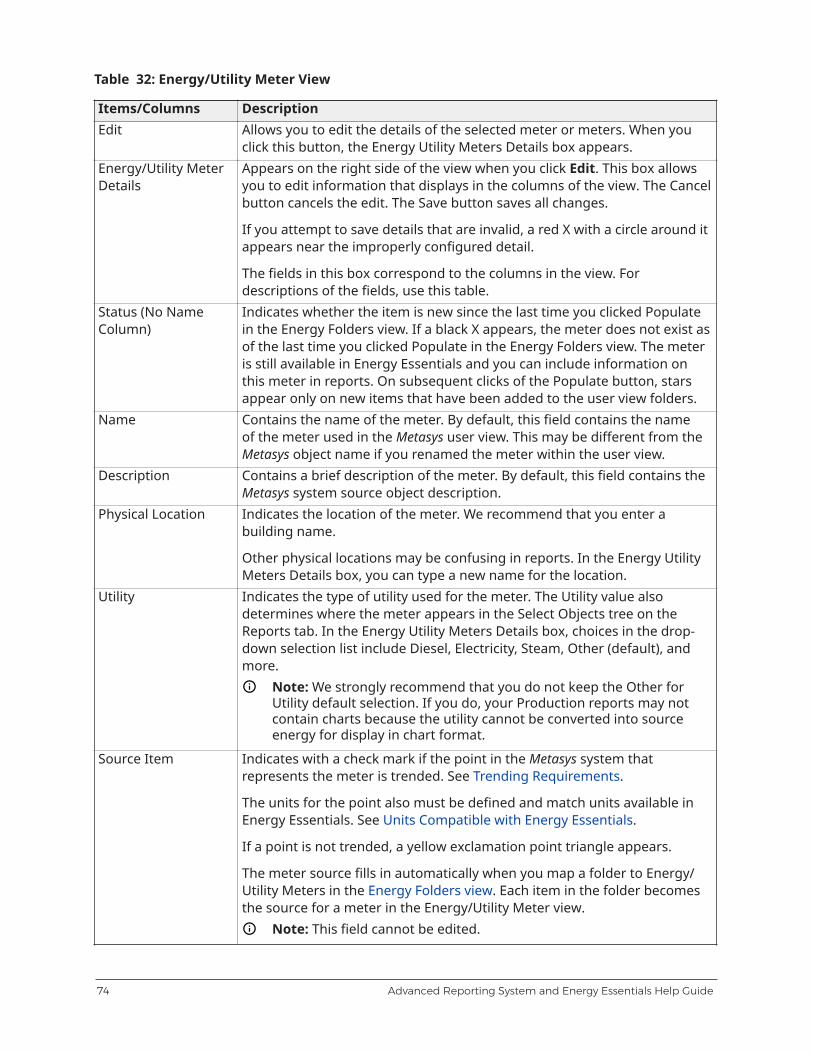
Table 32: Energy/Utility Meter View
Items/Columns DescriptionEdit Allows you to edit the details of the selected meter or meters. When you
click this button, the Energy Utility Meters Details box appears.Energy/Utility MeterDetails
Appears on the right side of the view when you click Edit. This box allowsyou to edit information that displays in the columns of the view. The Cancelbutton cancels the edit. The Save button saves all changes.
If you attempt to save details that are invalid, a red X with a circle around itappears near the improperly configured detail.
The fields in this box correspond to the columns in the view. Fordescriptions of the fields, use this table.
Status (No NameColumn)
Indicates whether the item is new since the last time you clicked Populatein the Energy Folders view. If a black X appears, the meter does not exist asof the last time you clicked Populate in the Energy Folders view. The meteris still available in Energy Essentials and you can include information onthis meter in reports. On subsequent clicks of the Populate button, starsappear only on new items that have been added to the user view folders.
Name Contains the name of the meter. By default, this field contains the nameof the meter used in the Metasys user view. This may be different from theMetasys object name if you renamed the meter within the user view.
Description Contains a brief description of the meter. By default, this field contains theMetasys system source object description.
Physical Location Indicates the location of the meter. We recommend that you enter abuilding name.
Other physical locations may be confusing in reports. In the Energy UtilityMeters Details box, you can type a new name for the location.
Utility Indicates the type of utility used for the meter. The Utility value alsodetermines where the meter appears in the Select Objects tree on theReports tab. In the Energy Utility Meters Details box, choices in the drop-down selection list include Diesel, Electricity, Steam, Other (default), andmore.
Note: We strongly recommend that you do not keep the Other forUtility default selection. If you do, your Production reports may notcontain charts because the utility cannot be converted into sourceenergy for display in chart format.
Source Item Indicates with a check mark if the point in the Metasys system thatrepresents the meter is trended. See Trending Requirements.
The units for the point also must be defined and match units available inEnergy Essentials. See Units Compatible with Energy Essentials.
If a point is not trended, a yellow exclamation point triangle appears.
The meter source fills in automatically when you map a folder to Energy/Utility Meters in the Energy Folders view. Each item in the folder becomesthe source for a meter in the Energy/Utility Meter view.
Note: This field cannot be edited.
Advanced Reporting System and Energy Essentials Help Guide74

Table 32: Energy/Utility Meter View
Items/Columns DescriptionOutdoor AirTemperature
Associates a specific outdoor air temperature point from the Weather DataEnergy Essentials folder to a meter.
Although the outdoor air temperature is not required to run a report, thisweather data is a natural complement to most reports and can be includedin the header and charts. For Metasys sites with a single geographic area,you can choose the same outdoor air temperature point for all metersand configure it once. See Units Compatible with Energy Essentials forsupported units of measure.
In the Energy/Utility Meters Details box, you can select the appropriatepoint from the drop-down selection list.
Outdoor Air Humidity Associates a specific outdoor air humidity from the Weather Data EnergyEssentials folder to a meter.
Although the outdoor air humidity is not required to run a report, thisweather data is a natural complement to most reports and can be includedin the header and charts. For Metasys sites with a single building, you canchoose the same outdoor air humidity point for all meters and configure itonce. See Units Compatible with Energy Essentials for supported units ofmeasure.
In the Energy/Utility Meters Details box, you can select the appropriatepoint from the drop-down selection list.
Outdoor Air Enthalpy Associates a specific outdoor air enthalpy from the Weather Data EnergyEssentials folder to a meter.
Although the outdoor air enthalpy is not required to run a report, thisweather data is a natural complement to most reports and can be includedin the header and charts. For Metasys sites with a single building, you canchoose the same outdoor air enthalpy point for all meters and configure itonce. See Units Compatible with Energy Essentials for supported units ofmeasure.
Note: Energy Essentials does not calculate enthalpy. The Metasyssystem or the end device must calculate enthalpy.
In the Energy/Utility Meters Details box, you can select the appropriatepoint from the drop-down selection list.
75Advanced Reporting System and Energy Essentials Help Guide
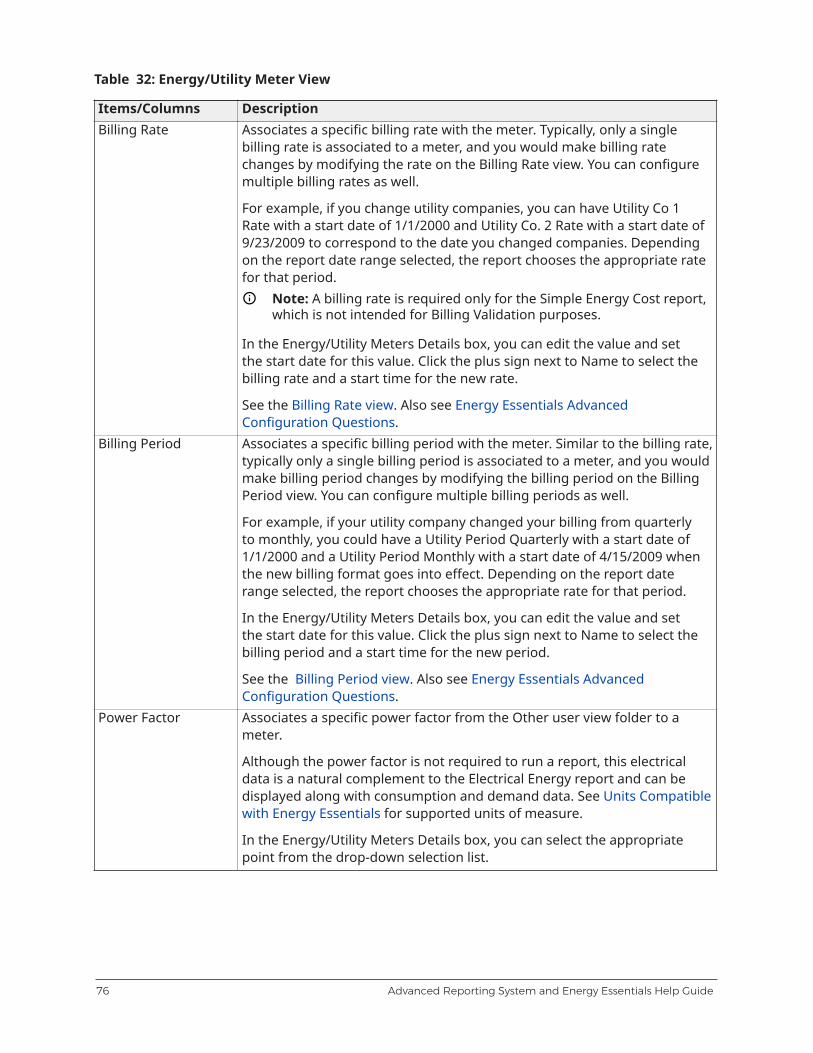
Table 32: Energy/Utility Meter View
Items/Columns DescriptionBilling Rate Associates a specific billing rate with the meter. Typically, only a single
billing rate is associated to a meter, and you would make billing ratechanges by modifying the rate on the Billing Rate view. You can configuremultiple billing rates as well.
For example, if you change utility companies, you can have Utility Co 1Rate with a start date of 1/1/2000 and Utility Co. 2 Rate with a start date of9/23/2009 to correspond to the date you changed companies. Dependingon the report date range selected, the report chooses the appropriate ratefor that period.
Note: A billing rate is required only for the Simple Energy Cost report,which is not intended for Billing Validation purposes.
In the Energy/Utility Meters Details box, you can edit the value and setthe start date for this value. Click the plus sign next to Name to select thebilling rate and a start time for the new rate.
See the Billing Rate view. Also see Energy Essentials AdvancedConfiguration Questions.
Billing Period Associates a specific billing period with the meter. Similar to the billing rate,typically only a single billing period is associated to a meter, and you wouldmake billing period changes by modifying the billing period on the BillingPeriod view. You can configure multiple billing periods as well.
For example, if your utility company changed your billing from quarterlyto monthly, you could have a Utility Period Quarterly with a start date of1/1/2000 and a Utility Period Monthly with a start date of 4/15/2009 whenthe new billing format goes into effect. Depending on the report daterange selected, the report chooses the appropriate rate for that period.
In the Energy/Utility Meters Details box, you can edit the value and setthe start date for this value. Click the plus sign next to Name to select thebilling period and a start time for the new period.
See the Billing Period view. Also see Energy Essentials AdvancedConfiguration Questions.
Power Factor Associates a specific power factor from the Other user view folder to ameter.
Although the power factor is not required to run a report, this electricaldata is a natural complement to the Electrical Energy report and can bedisplayed along with consumption and demand data. See Units Compatiblewith Energy Essentials for supported units of measure.
In the Energy/Utility Meters Details box, you can select the appropriatepoint from the drop-down selection list.
Advanced Reporting System and Energy Essentials Help Guide76

Table 32: Energy/Utility Meter View
Items/Columns DescriptionReactive Power Associates a specific Reactive Power from the Other user view folder to a
meter.
Although reactive power is not required to run a report, this electricaldata is a natural complement to the Electrical Energy report and can bedisplayed along with consumption and demand data. See Units Compatiblewith Energy Essentials for supported units of measure.
In the Energy/Utility Meters Details box, you can select the appropriatepoint from the drop-down selection list.
Category Indicates the category for the meter.
In the Energy/Utility Meters Details box, choices in the drop-down selectionlist include Building Energy Use (default), Cogeneration, Outdoor EnergyUse, and others.
Subcategory Indicates the subcategory for the meter that allows you to furthercategorize your meter.
In the Energy/Utility Meters Details box, choices in the drop-down selectionlist include Geothermal, Solar, Wind, Multiple (default), and others.
Area Served Indicates the size of the area served by the meter.
This field is not required for reporting but is required if you would likereports to calculate energy intensity. Energy Intensity does not calculatewhen data is aggregated for more than one meter because the area servedmay overlap. Overlap may result in false data.
In the Energy/Utility Meters Details box, you can edit the value or set theeffective date for this value. Click the plus sign next to Effective Date toselect the day and time the rate is effective, and the value of the rate.
Typically, only one value is present for Area Served Size. You can modifyareas over time when an existing meter begins to serve a larger area, suchas in the case of new construction. Reporting uses the appropriate value asdefined by the report period selected.
Area Served Units Indicates the units of the area served by the meter.
In the Energy/Utility Meters Details box, the choices in the drop-downselection list are sq meter (square meter) and sq ft (square feet).
Demand Interval(minutes)
Required to determine the peak demand. The value is based on a fixeddemand interval.
Note: The reporting system does not support sliding windowintervals.
In the Energy/Utility Meters Details box, the choices in the drop-downselection list are 15, 30, 60.
77Advanced Reporting System and Energy Essentials Help Guide
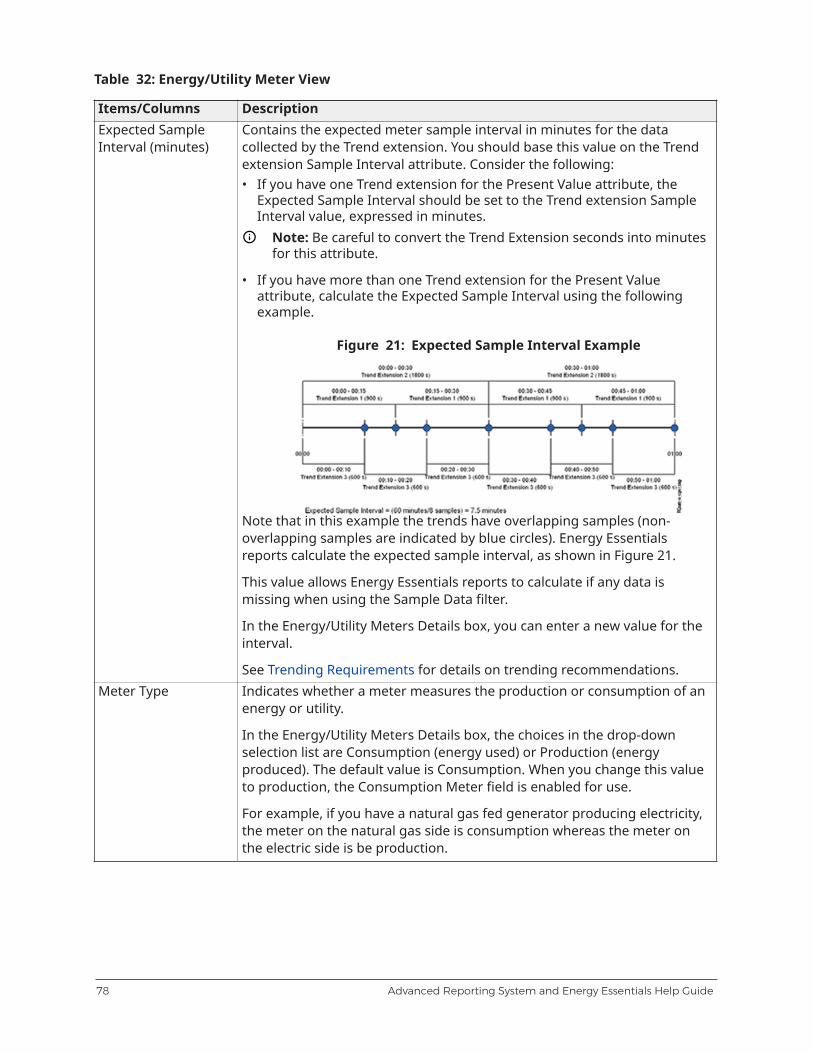
Table 32: Energy/Utility Meter View
Items/Columns DescriptionExpected SampleInterval (minutes)
Contains the expected meter sample interval in minutes for the datacollected by the Trend extension. You should base this value on the Trendextension Sample Interval attribute. Consider the following:• If you have one Trend extension for the Present Value attribute, the
Expected Sample Interval should be set to the Trend extension SampleInterval value, expressed in minutes.
Note: Be careful to convert the Trend Extension seconds into minutesfor this attribute.
• If you have more than one Trend extension for the Present Valueattribute, calculate the Expected Sample Interval using the followingexample.
Figure 21: Expected Sample Interval Example
Note that in this example the trends have overlapping samples (non-overlapping samples are indicated by blue circles). Energy Essentialsreports calculate the expected sample interval, as shown in Figure 21.
This value allows Energy Essentials reports to calculate if any data ismissing when using the Sample Data filter.
In the Energy/Utility Meters Details box, you can enter a new value for theinterval.
See Trending Requirements for details on trending recommendations.Meter Type Indicates whether a meter measures the production or consumption of an
energy or utility.
In the Energy/Utility Meters Details box, the choices in the drop-downselection list are Consumption (energy used) or Production (energyproduced). The default value is Consumption. When you change this valueto production, the Consumption Meter field is enabled for use.
For example, if you have a natural gas fed generator producing electricity,the meter on the natural gas side is consumption whereas the meter onthe electric side is be production.
Advanced Reporting System and Energy Essentials Help Guide78

Table 32: Energy/Utility Meter View
Items/Columns DescriptionConsumption Meter Indicates the meter associated with energy production.
This field is available only when you set Meter Type to production.Although a consumption meter is not required to run a Production report,the association to a consumption meter allows the report to calculateefficiency.
For example, if you have a natural gas fed generator that is producingelectricity, a meter on the natural gas side (MTR-1) would be consumptionwhereas the meter on the electric side (MTR-2) would be production. MTR-1would be entered in the Consumption Meter field.
In the Energy/Utility Meters Details box, you can select the appropriatemeter from the drop-down selection list. The list of meters originates fromthe Energy/Utility Meter view.
Equipment View Content
This view is available on the Energy Setup tab/panel that appears when you install EnergyEssentials. See Energy Setup Panel section for more details.The equipment present in this view are the equipment present in the user view folder you mappedto Equipment in the Energy Folders view. You can sort each column by clicking the name of thecolumn. When a column is sorted, a triangle appears next to the column name.Table 33: Equipment View
Items/Columns DescriptionDelete Deletes the selected equipment from the view.Clear New Entry Removes the blue star icon that indicates the meter is new in the Status
column. Use this button to help manage configuration of the meter andkeep track of meters yet to configure.
Note:• If you click Populate and this point no longer exits, the black X
appears.• To restore a star icon if removed in error, delete the meter and
then click Populate again.
Edit Allows you to edit the details for the selected equipment. You can selectand edit multiple pieces of equipment at one time.
When you click this button, the Equipment Details box appears.Equipment Details Appears on the right side of the view when you click Edit. This box allows
you to edit information that appears in the columns of the view. TheCancel button cancels the edit of the period. The Save button saves allchanges.
The fields in this box correspond to the columns in the view. Fordescriptions of the fields, use this table.
79Advanced Reporting System and Energy Essentials Help Guide

Table 33: Equipment View
Items/Columns DescriptionStatus (No NameColumn)
Indicates whether the item is new since the last time you clicked Populate.If a black X appears, the equipment does not exist as of the last time youclicked Populate. The equipment is still available in Energy Essentials, andyou can include information on this equipment in reports. On subsequentclicks of Populate, stars appear only on new items that have been addedto the user view folders.
Name Contains the name of the equipment. By default, this field contains thename of the meter used in the Metasys user view. This may be differentfrom the Metasys object name if you renamed the meter point in the userview.
Description Contains a brief description of the equipment. By default, this fieldcontains the Metasys system source object description.
Physical Location Indicates the location of the equipment. We recommend that you enter abuilding name. Other physical locations may not be confusing in reports.
In the Equipment Details box, you can type a new name for the location.Source Item Indicates with a check mark if the point in the Metasys system that
represents the equipment is trended. See Trending Requirements.
The units for the point also must be defined and match units available inEnergy Essentials. See Units Compatible with Energy Essentials.
If a point is not trended, a yellow exclamation point triangle appears.
The equipment source fills in automatically when you map a folder toEquipment in the Energy Folders view. Each item in the folder becomesthe source for a piece of equipment in the Equipment view.
Equipment Type Indicates the type of equipment.
In the Equipment Details box, the choices in the drop-down selection listare AC Unit Boiler Chiller Compressor Fan, Fan Coil Unit, Generator/UPS,Heat Pump, Light, Other, and Pump.
Equipment Off State Indicates the state of the equipment based on the item in the Source Itemfield.
In the Equipment Details box, the choices in the drop-down selection listinclude all available Off states (state98) for the item in the source item youselected.
Note: Any state other than Off is assumed to be On for use whencalculating the number of starts in the Equipment Runtime report.The correct Off state is verified when you click Set in the EnergyEssentials window.
Advanced Reporting System and Energy Essentials Help Guide80
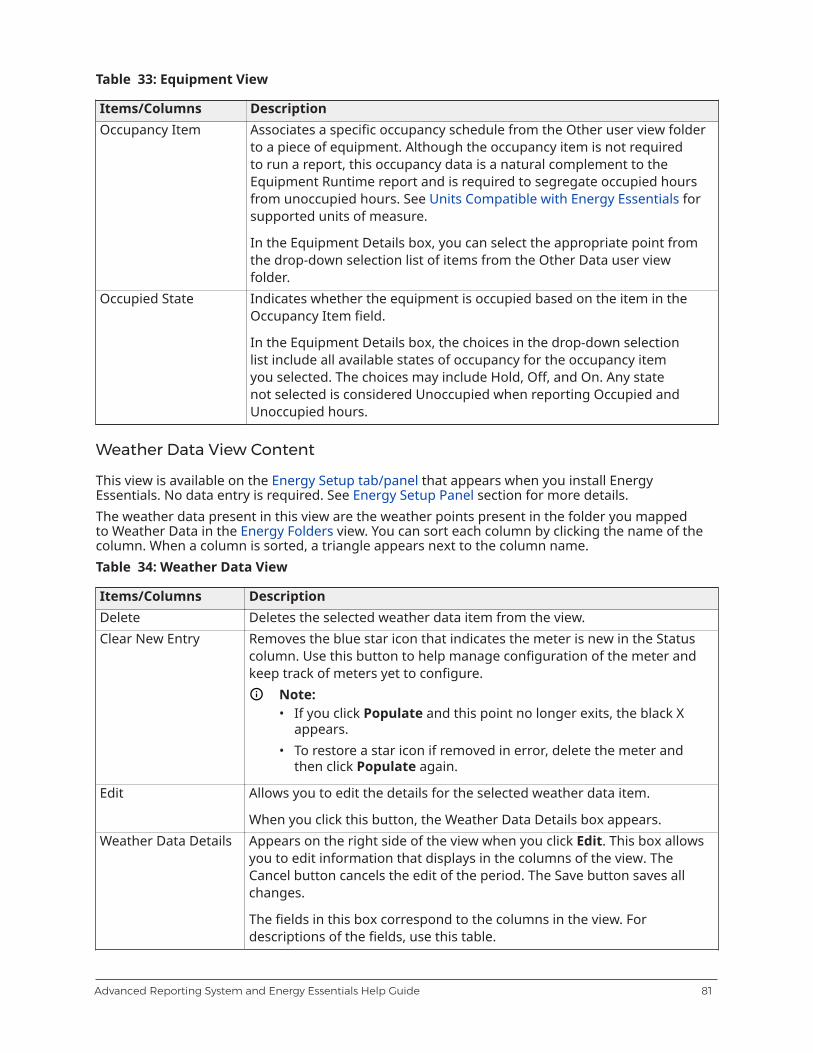
Table 33: Equipment View
Items/Columns DescriptionOccupancy Item Associates a specific occupancy schedule from the Other user view folder
to a piece of equipment. Although the occupancy item is not requiredto run a report, this occupancy data is a natural complement to theEquipment Runtime report and is required to segregate occupied hoursfrom unoccupied hours. See Units Compatible with Energy Essentials forsupported units of measure.
In the Equipment Details box, you can select the appropriate point fromthe drop-down selection list of items from the Other Data user viewfolder.
Occupied State Indicates whether the equipment is occupied based on the item in theOccupancy Item field.
In the Equipment Details box, the choices in the drop-down selectionlist include all available states of occupancy for the occupancy itemyou selected. The choices may include Hold, Off, and On. Any statenot selected is considered Unoccupied when reporting Occupied andUnoccupied hours.
Weather Data View Content
This view is available on the Energy Setup tab/panel that appears when you install EnergyEssentials. No data entry is required. See Energy Setup Panel section for more details.The weather data present in this view are the weather points present in the folder you mappedto Weather Data in the Energy Folders view. You can sort each column by clicking the name of thecolumn. When a column is sorted, a triangle appears next to the column name.Table 34: Weather Data View
Items/Columns DescriptionDelete Deletes the selected weather data item from the view.Clear New Entry Removes the blue star icon that indicates the meter is new in the Status
column. Use this button to help manage configuration of the meter andkeep track of meters yet to configure.
Note:• If you click Populate and this point no longer exits, the black X
appears.• To restore a star icon if removed in error, delete the meter and
then click Populate again.
Edit Allows you to edit the details for the selected weather data item.
When you click this button, the Weather Data Details box appears.Weather Data Details Appears on the right side of the view when you click Edit. This box allows
you to edit information that displays in the columns of the view. TheCancel button cancels the edit of the period. The Save button saves allchanges.
The fields in this box correspond to the columns in the view. Fordescriptions of the fields, use this table.
81Advanced Reporting System and Energy Essentials Help Guide
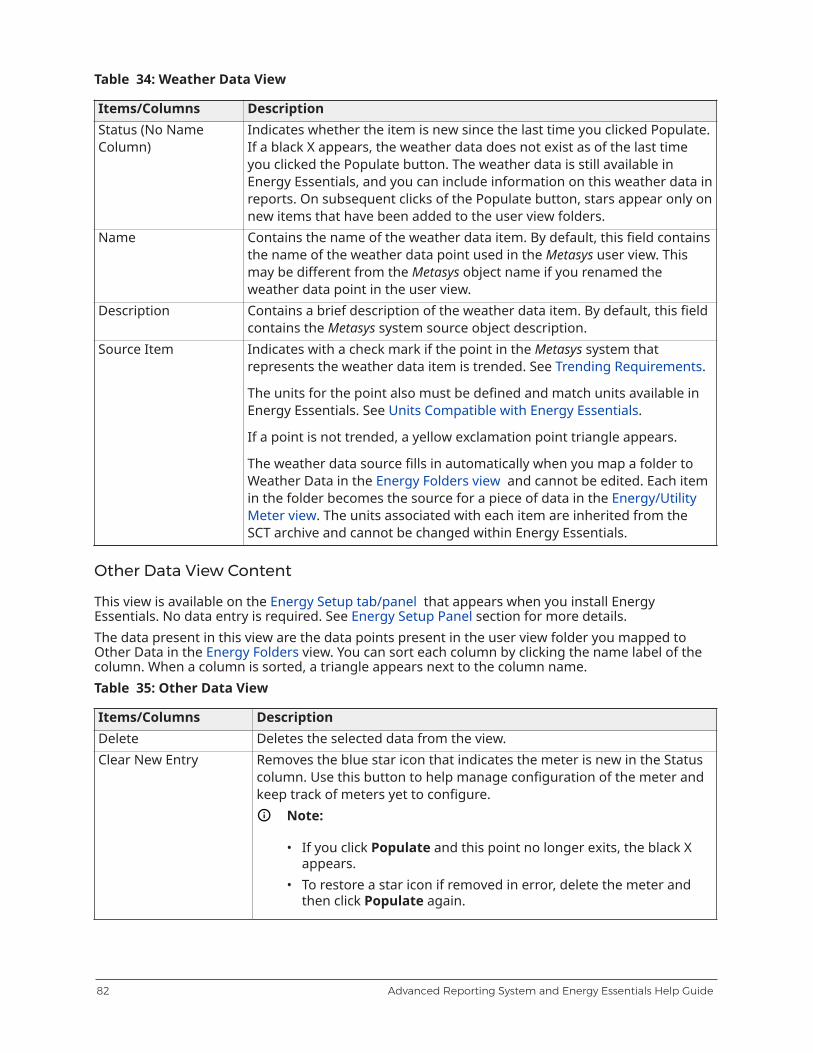
Table 34: Weather Data View
Items/Columns DescriptionStatus (No NameColumn)
Indicates whether the item is new since the last time you clicked Populate.If a black X appears, the weather data does not exist as of the last timeyou clicked the Populate button. The weather data is still available inEnergy Essentials, and you can include information on this weather data inreports. On subsequent clicks of the Populate button, stars appear only onnew items that have been added to the user view folders.
Name Contains the name of the weather data item. By default, this field containsthe name of the weather data point used in the Metasys user view. Thismay be different from the Metasys object name if you renamed theweather data point in the user view.
Description Contains a brief description of the weather data item. By default, this fieldcontains the Metasys system source object description.
Source Item Indicates with a check mark if the point in the Metasys system thatrepresents the weather data item is trended. See Trending Requirements.
The units for the point also must be defined and match units available inEnergy Essentials. See Units Compatible with Energy Essentials.
If a point is not trended, a yellow exclamation point triangle appears.
The weather data source fills in automatically when you map a folder toWeather Data in the Energy Folders view and cannot be edited. Each itemin the folder becomes the source for a piece of data in the Energy/UtilityMeter view. The units associated with each item are inherited from theSCT archive and cannot be changed within Energy Essentials.
Other Data View Content
This view is available on the Energy Setup tab/panel that appears when you install EnergyEssentials. No data entry is required. See Energy Setup Panel section for more details.The data present in this view are the data points present in the user view folder you mapped toOther Data in the Energy Folders view. You can sort each column by clicking the name label of thecolumn. When a column is sorted, a triangle appears next to the column name.Table 35: Other Data View
Items/Columns DescriptionDelete Deletes the selected data from the view.Clear New Entry Removes the blue star icon that indicates the meter is new in the Status
column. Use this button to help manage configuration of the meter andkeep track of meters yet to configure.
Note:
• If you click Populate and this point no longer exits, the black Xappears.
• To restore a star icon if removed in error, delete the meter andthen click Populate again.
Advanced Reporting System and Energy Essentials Help Guide82

Table 35: Other Data View
Items/Columns DescriptionEdit Allows you to edit the details for the selected data.
When you click this button, the Other Data Details box appears.Other Data Details Appears on the right side of the view when you click Edit. This box allows
you to edit information that displays in the columns of the view. TheCancel button cancels the edit of the period. The Save button saves allchanges.
The fields in this box correspond to the columns in the view. Fordescriptions of the fields, use this table.
Status (No NameColumn)
Indicates whether the item is new since the last time you clickedPopulate. If a black X appears, the data does not exist as of the last timeyou clicked the Populate button. The data is still available in EnergyEssentials, and you can include information on this data in reports. Onsubsequent clicks of the Populate button, stars appear only on newitems that have been added to the user view folders.
Name Contains the name of the data item. By default, this field contains thename of the data point used in the Metasys user view. This may bedifferent from the Metasys object name if you renamed the data point inthe user view.
Description Contains a brief description of the data item. By default, this fieldcontains the Metasys system source object description.
Source Item Indicates with a check mark if the point in the Metasys systemthat represents the weather data item is trended. See TrendingRequirements.
The units for the point also must be defined and match units available inEnergy Essentials. See Units Compatible with Energy Essentials.
If a point is not trended, a yellow exclamation point triangle appears.
The data source fills in automatically when you map a folder to OtherData in the Energy Folders view. Each item in the folder becomes thesource for a piece of data in the Energy/Utility Meter or Equipment view.
Report Screen Content
For detailed information on the contents appearing in each report, see the following sections.See Report Screen in the Concepts section.For detailed information on the report, see Report Types in the Concepts section.
Configuration Setup Review Report Content
Alarm Definition Report Content
Table 36 describes the columns of the Alarm Definition report. See Points without Alarms SubreportContent and Devices with Automatic Alarming Disabled Subreport Content for descriptions of thesubreports. See the Alarm Definition Report in the Concepts section for more details.
83Advanced Reporting System and Energy Essentials Help Guide
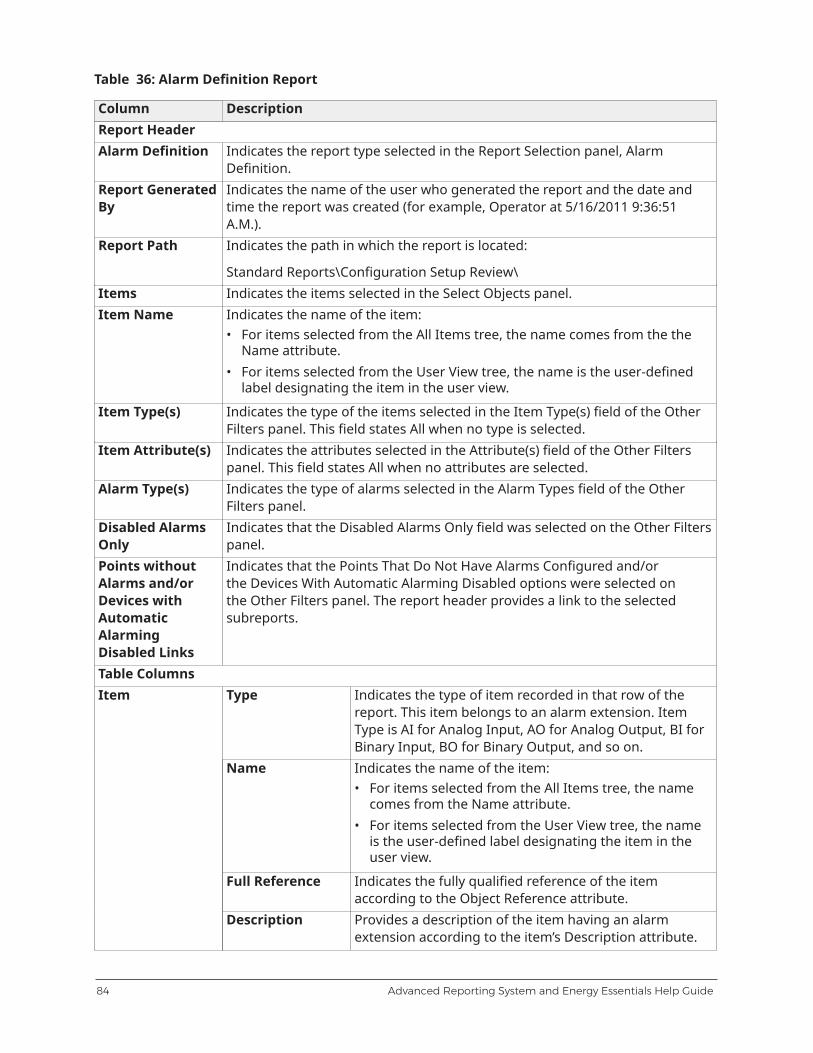
Table 36: Alarm Definition Report
Column DescriptionReport HeaderAlarm Definition Indicates the report type selected in the Report Selection panel, Alarm
Definition.Report GeneratedBy
Indicates the name of the user who generated the report and the date andtime the report was created (for example, Operator at 5/16/2011 9:36:51A.M.).
Report Path Indicates the path in which the report is located:
Standard Reports\Configuration Setup Review\Items Indicates the items selected in the Select Objects panel.Item Name Indicates the name of the item:
• For items selected from the All Items tree, the name comes from the theName attribute.
• For items selected from the User View tree, the name is the user-definedlabel designating the item in the user view.
Item Type(s) Indicates the type of the items selected in the Item Type(s) field of the OtherFilters panel. This field states All when no type is selected.
Item Attribute(s) Indicates the attributes selected in the Attribute(s) field of the Other Filterspanel. This field states All when no attributes are selected.
Alarm Type(s) Indicates the type of alarms selected in the Alarm Types field of the OtherFilters panel.
Disabled AlarmsOnly
Indicates that the Disabled Alarms Only field was selected on the Other Filterspanel.
Points withoutAlarms and/orDevices withAutomaticAlarmingDisabled Links
Indicates that the Points That Do Not Have Alarms Configured and/orthe Devices With Automatic Alarming Disabled options were selected onthe Other Filters panel. The report header provides a link to the selectedsubreports.
Table ColumnsType Indicates the type of item recorded in that row of the
report. This item belongs to an alarm extension. ItemType is AI for Analog Input, AO for Analog Output, BI forBinary Input, BO for Binary Output, and so on.
Name Indicates the name of the item:• For items selected from the All Items tree, the name
comes from the Name attribute.• For items selected from the User View tree, the name
is the user-defined label designating the item in theuser view.
Full Reference Indicates the fully qualified reference of the itemaccording to the Object Reference attribute.
Item
Description Provides a description of the item having an alarmextension according to the item’s Description attribute.
Advanced Reporting System and Energy Essentials Help Guide84

Table 36: Alarm Definition Report
Column DescriptionAttribute Indicates the attribute of the item tied to the alarm according to the Input
Reference attribute.Alarm Type Indicates whether the item has an Analog Alarm or Multistate Alarm.Alarm MessageText
Indicates the text that appears when the alarm is triggered according to theAlarm Message Text attribute of the alarm item.
AlarmDescription
Provides a description of the alarm extension according to the Descriptionattribute.
Alarm Enabled Indicates whether the alarm is enabled according to the alarm extension’sEnabled attribute.
Event Enable Indicates whether the alarm is enabled to report a warning messageaccording to the alarm extension’s Event Enable attribute.
Other AttributeColumns
Displays the values of other alarm extension attributes, for example:• Normal State• Low Alarm Limit• High Alarm Limit• Diff• Low Warning Offset• High Warning Offset• Warning Ref.• Alarm Priority• Alarm Ack. Reqd• Warning Priority• Warn. Ack Reqd• Normal Priority• Normal Ack. Reqd• Report Delay• Delay Time• Setpoint or Command Reference
Report FooterPage Number Indicates the page number on the lower right corner in the following format:
1/2 (page 1 of 2).
Points without Alarms Subreport Content
This is a subreport of the Alarm Definition Report Content. See Alarm Definition Report for moredetails.Table 37: Points without Alarms Subreport
Column DescriptionReport Header Includes the same report header information as indicated in Table 36, except the
title is Points without Alarms and there are no subreport links.Table Columns
85Advanced Reporting System and Energy Essentials Help Guide
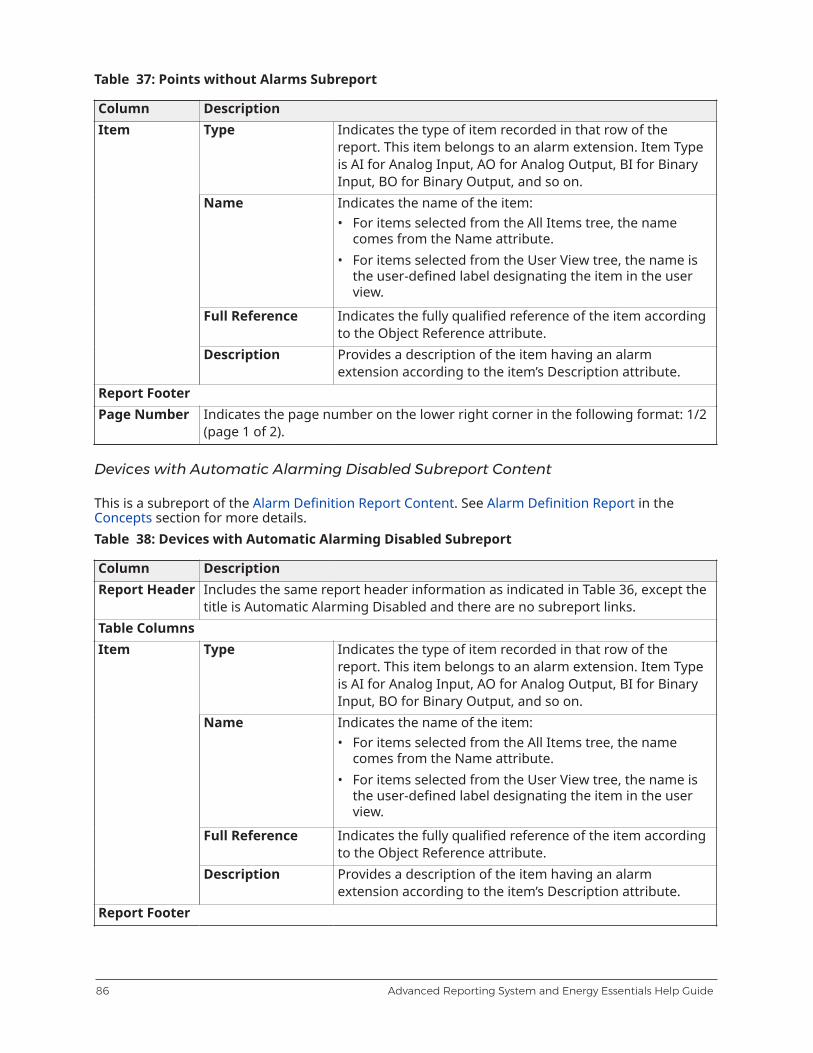
Table 37: Points without Alarms Subreport
Column DescriptionType Indicates the type of item recorded in that row of the
report. This item belongs to an alarm extension. Item Typeis AI for Analog Input, AO for Analog Output, BI for BinaryInput, BO for Binary Output, and so on.
Name Indicates the name of the item:• For items selected from the All Items tree, the name
comes from the Name attribute.• For items selected from the User View tree, the name is
the user-defined label designating the item in the userview.
Full Reference Indicates the fully qualified reference of the item accordingto the Object Reference attribute.
Item
Description Provides a description of the item having an alarmextension according to the item’s Description attribute.
Report FooterPage Number Indicates the page number on the lower right corner in the following format: 1/2
(page 1 of 2).
Devices with Automatic Alarming Disabled Subreport Content
This is a subreport of the Alarm Definition Report Content. See Alarm Definition Report in theConcepts section for more details.Table 38: Devices with Automatic Alarming Disabled Subreport
Column DescriptionReport Header Includes the same report header information as indicated in Table 36, except the
title is Automatic Alarming Disabled and there are no subreport links.Table Columns
Type Indicates the type of item recorded in that row of thereport. This item belongs to an alarm extension. Item Typeis AI for Analog Input, AO for Analog Output, BI for BinaryInput, BO for Binary Output, and so on.
Name Indicates the name of the item:• For items selected from the All Items tree, the name
comes from the Name attribute.• For items selected from the User View tree, the name is
the user-defined label designating the item in the userview.
Full Reference Indicates the fully qualified reference of the item accordingto the Object Reference attribute.
Item
Description Provides a description of the item having an alarmextension according to the item’s Description attribute.
Report Footer
Advanced Reporting System and Energy Essentials Help Guide86
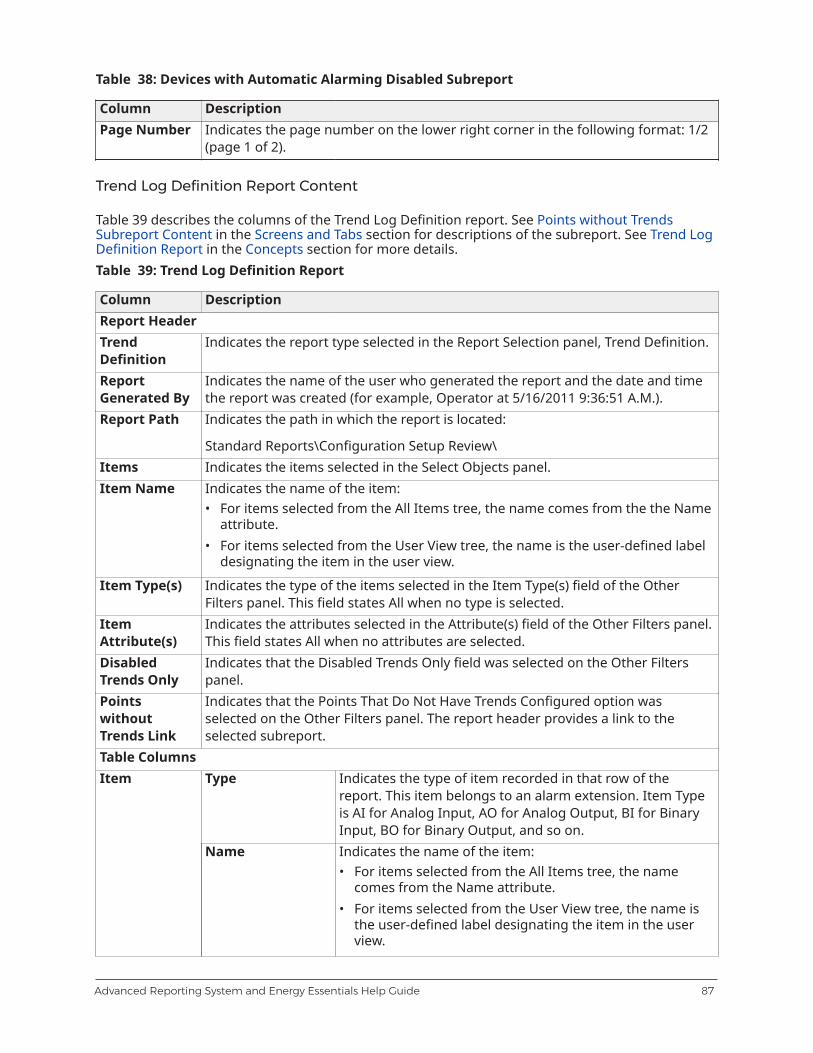
Table 38: Devices with Automatic Alarming Disabled Subreport
Column DescriptionPage Number Indicates the page number on the lower right corner in the following format: 1/2
(page 1 of 2).
Trend Log Definition Report Content
Table 39 describes the columns of the Trend Log Definition report. See Points without TrendsSubreport Content in the Screens and Tabs section for descriptions of the subreport. See Trend LogDefinition Report in the Concepts section for more details.Table 39: Trend Log Definition Report
Column DescriptionReport HeaderTrendDefinition
Indicates the report type selected in the Report Selection panel, Trend Definition.
ReportGenerated By
Indicates the name of the user who generated the report and the date and timethe report was created (for example, Operator at 5/16/2011 9:36:51 A.M.).
Report Path Indicates the path in which the report is located:
Standard Reports\Configuration Setup Review\Items Indicates the items selected in the Select Objects panel.Item Name Indicates the name of the item:
• For items selected from the All Items tree, the name comes from the the Nameattribute.
• For items selected from the User View tree, the name is the user-defined labeldesignating the item in the user view.
Item Type(s) Indicates the type of the items selected in the Item Type(s) field of the OtherFilters panel. This field states All when no type is selected.
ItemAttribute(s)
Indicates the attributes selected in the Attribute(s) field of the Other Filters panel.This field states All when no attributes are selected.
DisabledTrends Only
Indicates that the Disabled Trends Only field was selected on the Other Filterspanel.
PointswithoutTrends Link
Indicates that the Points That Do Not Have Trends Configured option wasselected on the Other Filters panel. The report header provides a link to theselected subreport.
Table ColumnsType Indicates the type of item recorded in that row of the
report. This item belongs to an alarm extension. Item Typeis AI for Analog Input, AO for Analog Output, BI for BinaryInput, BO for Binary Output, and so on.
Item
Name Indicates the name of the item:• For items selected from the All Items tree, the name
comes from the Name attribute.• For items selected from the User View tree, the name is
the user-defined label designating the item in the userview.
87Advanced Reporting System and Energy Essentials Help Guide
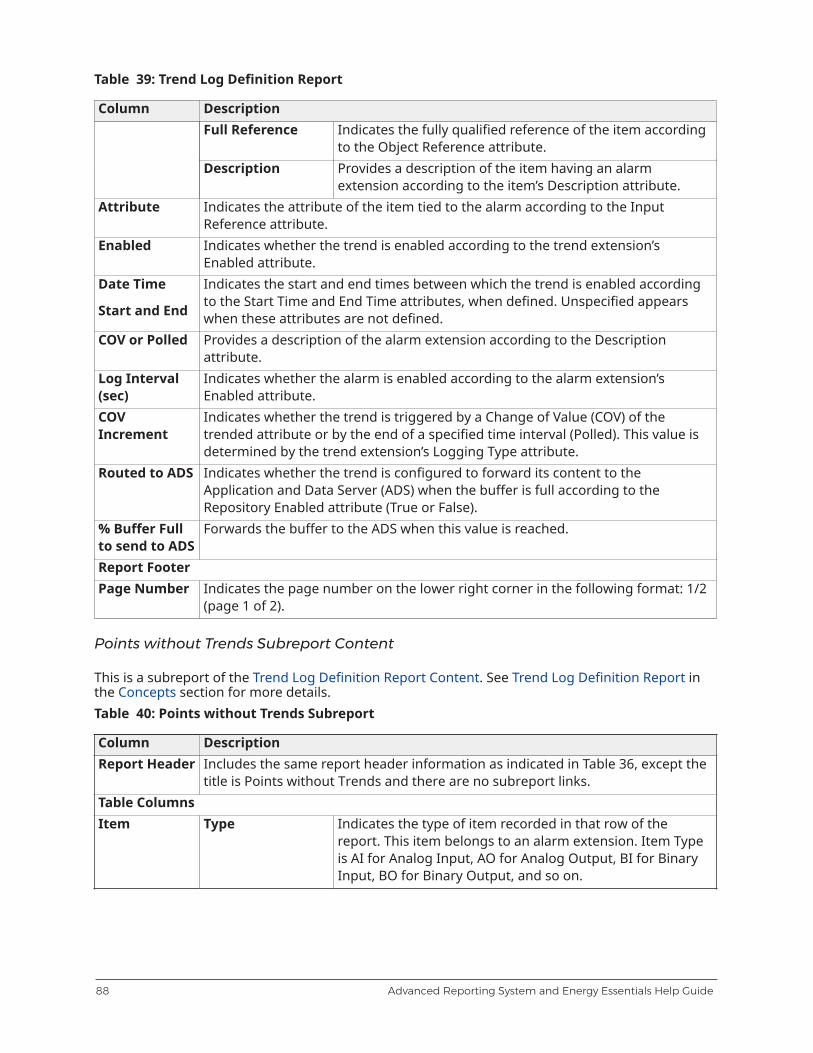
Table 39: Trend Log Definition Report
Column DescriptionFull Reference Indicates the fully qualified reference of the item according
to the Object Reference attribute.Description Provides a description of the item having an alarm
extension according to the item’s Description attribute.Attribute Indicates the attribute of the item tied to the alarm according to the Input
Reference attribute.Enabled Indicates whether the trend is enabled according to the trend extension’s
Enabled attribute.Date Time
Start and End
Indicates the start and end times between which the trend is enabled accordingto the Start Time and End Time attributes, when defined. Unspecified appearswhen these attributes are not defined.
COV or Polled Provides a description of the alarm extension according to the Descriptionattribute.
Log Interval(sec)
Indicates whether the alarm is enabled according to the alarm extension’sEnabled attribute.
COVIncrement
Indicates whether the trend is triggered by a Change of Value (COV) of thetrended attribute or by the end of a specified time interval (Polled). This value isdetermined by the trend extension’s Logging Type attribute.
Routed to ADS Indicates whether the trend is configured to forward its content to theApplication and Data Server (ADS) when the buffer is full according to theRepository Enabled attribute (True or False).
% Buffer Fullto send to ADS
Forwards the buffer to the ADS when this value is reached.
Report FooterPage Number Indicates the page number on the lower right corner in the following format: 1/2
(page 1 of 2).
Points without Trends Subreport Content
This is a subreport of the Trend Log Definition Report Content. See Trend Log Definition Report inthe Concepts section for more details.Table 40: Points without Trends Subreport
Column DescriptionReport Header Includes the same report header information as indicated in Table 36, except the
title is Points without Trends and there are no subreport links.Table ColumnsItem Type Indicates the type of item recorded in that row of the
report. This item belongs to an alarm extension. Item Typeis AI for Analog Input, AO for Analog Output, BI for BinaryInput, BO for Binary Output, and so on.
Advanced Reporting System and Energy Essentials Help Guide88

Table 40: Points without Trends Subreport
Column DescriptionName Indicates the name of the item:
• For items selected from the All Items tree, the namecomes from the Name attribute.
• For items selected from the User View tree, the name isthe user-defined label designating the item in the userview.
Full Reference Indicates the fully qualified reference of the item accordingto the Object Reference attribute.
Description Provides a description of the item having an alarmextension according to the item’s Description attribute.
Report FooterPage Number Indicates the page number on the lower right corner in the following format: 1/2
(page 1 of 2).
System Behavior Report Content
Event Summary Report Content
See Event Summary Reports in the Concepts section for more details.Table 41: Event Summary Report
Field DescriptionReport HeaderEvent Summary Indicates the report type selected in the Report Selection panel,
Event Summary.Report Generated By Indicates the name of the user who generated the report and
the date and time the report was created (for example, Operatorat 5/16/2011 9:36:51 A.M.).
Report Path Indicates the path in which the report is located:
Standard Reports\System Behavior\Event\Start Date Indicates the starting date and time entered for the selected
period in the Select Date Range panel.End Date Indicates the ending date and time entered for the selected
period in the Select Date Range panel.Items Indicates the items selected in the Select Objects panel.Item Name Indicates the name of the item:
• For items selected from the All Items tree, the name comesfrom the Name attribute.
• For items selected from the User View tree, the name is theuser-defined label designating the item in the user view.
Item Type(s) Indicates the type of the items selected in the Item Type(s) fieldof the Other Filters panel. This field states All when no type isselected.
89Advanced Reporting System and Energy Essentials Help Guide

Table 41: Event Summary Report
Field DescriptionChartTotal Events Chart Displays a summary of the events, grouped by day, in chart
format. The day of the event appears on the x-axis, and the totalnumber of events appears on the y-axis.
Table ColumnsExpand All/Collapse All Expands (shows) or collapses (hides) all node levels of the
records in the table.When Indicates when the event occurred in groups according to
month, week, and day (for example, May 2011, Week 3,5/16/2011). Expand and Collapse icons appear next to eachgroup to show/hide the details for only that node level.
Event Type Indicates the type of event (for example, High Alarm, Low Alarm,Offline, Unreliable, and more).
Total Events Indicates the number of events by event type, month, week, andday.
Acknowledged Indicates the number of events that were acknowledged.Discarded Indicates the number of events that were discarded.Grand Total Indicates the total number of events listed in the Total Events,
Acknowledged, and Discarded columns.Report FooterPage Number Indicates the page number on the lower right corner in the
following format: 1/2 (page 1 of 2).
Event Details Report Content
See Event Details Reports in the Concepts section for more details.Table 42: Event Details Report
Field DescriptionReport HeaderAlarmDefinition
Indicates the report type selected in the Report Selection panel, Event Detail.
ReportGenerated By
Indicates the name of the user who generated the report and the date and timethe report was created (for example, Operator at 5/16/2011 9:36:51 A.M.).
Report Path Indicates the path in which the report is located:
Standard Reports\System Behavior\Event\Items Indicates the items selected in the Select Objects panel.Item Name Indicates the name of the item:
• For items selected from the All Items tree, the name comes from the Nameattribute.
• For items selected from the User View tree, the name is the user-defined labeldesignating the item in the user view.
Advanced Reporting System and Energy Essentials Help Guide90

Table 42: Event Details Report
Field DescriptionItem Type(s) Indicates the type of the items selected in the Item Type(s) field of the Other
Filters panel. This field states All when no type is selected.Table Columns
Type Indicates the type of item that generated the event.
Item Type is AI for Analog Input, AO for Analog Output, BIfor Binary Input, BO for Binary Output, and so on.
Name Indicates the name of the item:• For items selected from the All Items tree, the name
comes from the Name attribute.• For items selected from the User View tree, the name is
the user-defined label designating the item in the userview.
Full Reference Indicates the fully qualified reference of the item accordingto the Object Reference attribute.
Item
Description Provides a description of the item having an alarmextension according to the item’s Description attribute.
Message Provides a message explaining the cause of the event.Event Type Indicates the type of event (for example, High Alarm, Low Alarm, Offline,
Unreliable, and more)When Indicates when the event occurred in day and time format (for example,
5/16/2011 12:00:11 A.M.).Value Indicates the value of the attribute when the event occurred (for example, On or
31.6 deg F).Priority Indicates the priority of the event.Report FooterPage Number Indicates the page number on the lower right corner in the following format: 1/2
(page 1 of 2).
Controller Offline Summary Report Content
See Controller Offline Summary Reports in the Concepts section for more details.Table 43: Controller Offline Summary Report
Field DescriptionReport HeaderController Offline Indicates the report type selected in the Report Selection
panel, Controller Offline Summary.Report Generated By Indicates the name of the user who generated the
report and the date and time the report was created (forexample, Operator at 5/16/2011 9:36:51 A.M.).
Report Path Indicates the path in which the report is located:
Standard Reports\System Behavior\Controller Offline\
91Advanced Reporting System and Energy Essentials Help Guide

Table 43: Controller Offline Summary Report
Field DescriptionStart Date Indicates the starting date and time entered for the
selected period in the Select Date Range panel.End Date Indicates the ending date and time entered for the
selected period in the Select Date Range panel.Items Indicates the items selected in the Select Objects panel.Item Name Indicates the name of the item:
• For items selected from the All Items tree, the namecomes from the Name attribute.
• For items selected from the User View tree, the name isthe user-defined label designating the item in the userview.
ChartController Offline By Trunks Displays a summary of the percentage of time the
controllers on the trunk were offline, grouped by day andtrunk, in chart format. The day of the event appears onthe x-axis and the percent of time offline appears on they-axis. A legend defines the colors that represent eachtrunk.
Table ColumnsExpand All/Collapse All Expands (shows) or collapses (hides) all node levels of the
records in the table.Name Indicates the name of the supervisory device to which the
trunk belongs:• For items selected from the All Items tree, the name
comes from the Name attribute.• For items selected from the User View tree, the name is
the user-defined label designating the item in the userview.
Expand and Collapse icons appear next to each item toshow/hide the details for only that node level.
SupervisoryDevice
Full Reference Indicates the fully qualified reference of the device.Trunk or Integration Indicates the name of the trunk or integration.Day Indicates the day when the controllers on the trunk were
offline.Offline Count Indicates the number of controllers offline during
the selected period of time over the total number ofcontrollers on the trunk. The offline count number isused to calculate the percent of time offline.
Offline Count = Number of Offline Controllers/TotalNumber of Controllers per Trunk
Advanced Reporting System and Energy Essentials Help Guide92

Table 43: Controller Offline Summary Report
Field DescriptionTotal Number of Offline Reports Indicates the total number of offline reports by counting
the number of online-to-offline transition events reportedon the trunk during the time period. A value of 1 or aboveindicates consecutive offline reports, and 0 means notransitions occurred during the time period.
DD HH:MM:SS Indicates the total amount of time the controllerson the trunk were offline. DD HH:MM:SS = DayHour:Minutes:Seconds
Total TimeOffline
Percent Indicates the percent of time the controllers on the trunkwere offline. Percent is calculated by dividing the totaltime offline by the length of the interval multiplied bythe total number of controllers on the trunk. Percent =Total Time Offline/(Total Time in Interval x Total Numberof Controller on Trunk)
For example, a trunk with 10 controllers and an intervalof 24 hours, with total amount of time offline of 2 hoursand 13 minutes, is calculated as follows:
(2 + 13/60)/(24 x 10) = 0.0092 x 100, which equals 0.92%Report FooterPage Number Indicates the page number on the lower right corner in
the following format: 1/2 (page 1 of 2).
Controller Offline Details Report Content
See Controller Offline Details Reports in the Concepts section for more details.Table 44: Controller Offline Details Report
Field DescriptionReport HeaderController Offline Detail Indicates the report type selected in the Report Selection panel,
Controller Offline Detail.Report Generated By Indicates the name of the user who generated the report and the
date and time the report was created (for example, Operator at5/16/2011 9:36:51 A.M.).
Report Path Indicates the path in which the report is located:
Standard Reports\System Behavior\Controller Offline\Start Date Indicates the starting date and time entered for the selected
period in the Select Date Range panel.End Date Indicates the ending date and time entered for the selected period
in the Select Date Range panel.Items Indicates the items selected in the Select Objects panel.
93Advanced Reporting System and Energy Essentials Help Guide

Table 44: Controller Offline Details Report
Field DescriptionItem Name Indicates the name of the item:
• For items selected from the All Items tree, the name comesfrom the Name attribute.
• For items selected from the User View tree, the name is theuser-defined label designating the item in the user view.
Table ColumnsExpand All/Collapse All Expands (shows) or collapses (hides) all node levels of the records
in the table.Expand/Collapse Expands (shows) or collapses (hides) only that node level. These
icons appear next to items in the table to show/hide the details.Name Indicates the name of the supervisory device to which the trunk
belongs:• For items selected from the All Items tree, the name comes
from the Name attribute.• For items selected from the User View tree, the name is the
user-defined label designating the item in the user view.
SupervisoryDevice
FullReference
Indicates the fully qualified reference of the device.
Trunk or Integration Indicates the name of the trunk or integration.Name Indicates the name of the offline field device:
• For items selected from the All Items tree, the name comesfrom the Name attribute.
• For items selected from the User View tree, the name is theuser-defined label designating the item in the user view.
Field Device
FullReference
Indicates the fully qualified reference of the field device.
Description Provides a description of the controller according to theDescription attribute.
Day Indicates the day when the controllers on the trunk were offline.Total Number of OfflineReports
Indicates the total number of offline reports by counting thenumber of online-to-offline transition events reported on thetrunk during the time period. A value of 1 or above indicatesconsecutive offline reports, and 0 means no transitions occurredduring the time period.
Total TimeOffline
DDHH:MM:SS
Indicates the total amount of time the controllers on the trunkwere offline on the current day.
This column shows data for the day, week, month, and controller
DD HH:MM:SS = Day Hour:Minutes:Seconds
Advanced Reporting System and Energy Essentials Help Guide94
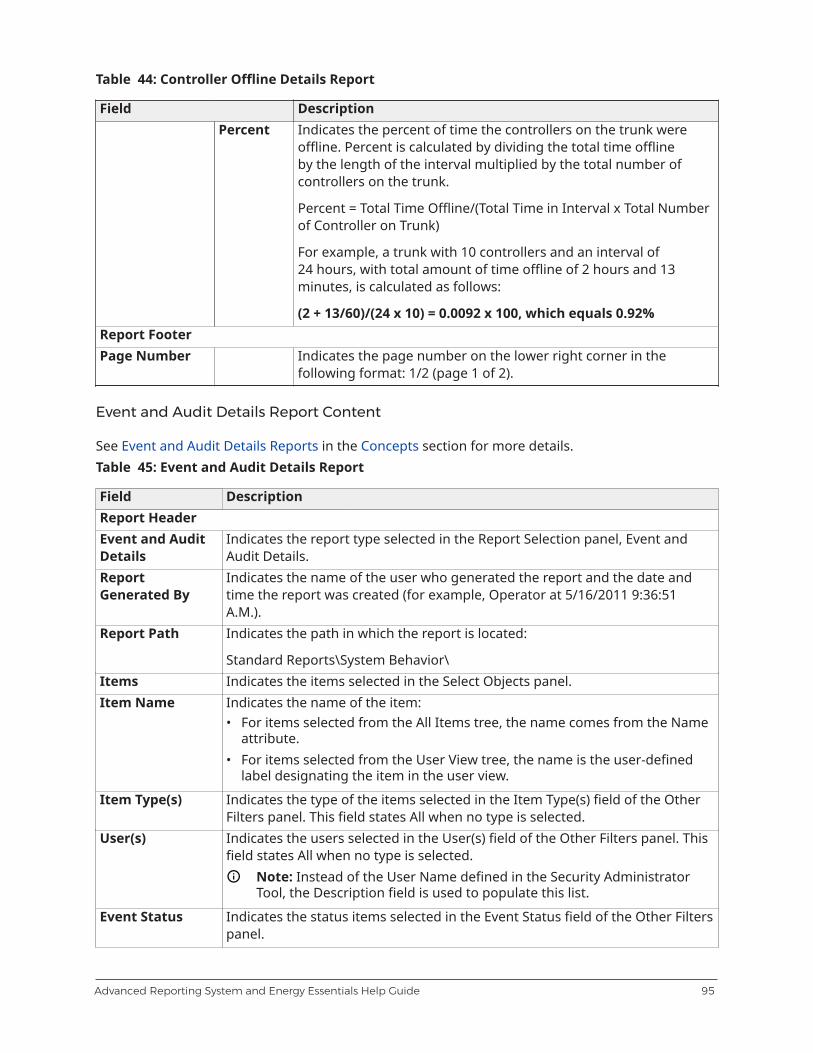
Table 44: Controller Offline Details Report
Field DescriptionPercent Indicates the percent of time the controllers on the trunk were
offline. Percent is calculated by dividing the total time offlineby the length of the interval multiplied by the total number ofcontrollers on the trunk.
Percent = Total Time Offline/(Total Time in Interval x Total Numberof Controller on Trunk)
For example, a trunk with 10 controllers and an interval of24 hours, with total amount of time offline of 2 hours and 13minutes, is calculated as follows:
(2 + 13/60)/(24 x 10) = 0.0092 x 100, which equals 0.92%Report FooterPage Number Indicates the page number on the lower right corner in the
following format: 1/2 (page 1 of 2).
Event and Audit Details Report Content
See Event and Audit Details Reports in the Concepts section for more details.Table 45: Event and Audit Details Report
Field DescriptionReport HeaderEvent and AuditDetails
Indicates the report type selected in the Report Selection panel, Event andAudit Details.
ReportGenerated By
Indicates the name of the user who generated the report and the date andtime the report was created (for example, Operator at 5/16/2011 9:36:51A.M.).
Report Path Indicates the path in which the report is located:
Standard Reports\System Behavior\Items Indicates the items selected in the Select Objects panel.Item Name Indicates the name of the item:
• For items selected from the All Items tree, the name comes from the Nameattribute.
• For items selected from the User View tree, the name is the user-definedlabel designating the item in the user view.
Item Type(s) Indicates the type of the items selected in the Item Type(s) field of the OtherFilters panel. This field states All when no type is selected.
User(s) Indicates the users selected in the User(s) field of the Other Filters panel. Thisfield states All when no type is selected.
Note: Instead of the User Name defined in the Security AdministratorTool, the Description field is used to populate this list.
Event Status Indicates the status items selected in the Event Status field of the Other Filterspanel.
95Advanced Reporting System and Energy Essentials Help Guide

Table 45: Event and Audit Details Report
Field DescriptionPriority Indicates the priority entered in the Priority field of the Other Filters panel.Audit Status Indicates the status items selected in the Audit Status field of the Other Filters
panel.Previous Value Indicates the previous value entered in the Pre Value field of the Other Filters
panel.Post Value Indicates the post value entered in the Post Value field of the Other Filters
panel.Table Columns
Name Indicates the name of the item:• For items selected from the All Items tree, the name
comes from the Name attribute.• For items selected from the User View tree, the name
is the user-defined label designating the item in theuser view.
Item
Full Reference Indicates the fully qualified reference of the itemaccording to the Object Reference attribute.
Record Type Indicates the type of record:• Audit• Audit Annotation• Event• Event Annotation
Audit Class Level Indicates the audit classification. This field only applies to audits.OriginApplication
Indicates the application that generated the audit record. This field onlyapplies to audits.
Date/Time ofEvent, Audit orAnnotation
Indicates the date and time of the audit or event, including the date and timefor any associated annotation.
User Indicates the person whose action generated the audit or who entered theannotation. This field only applies to audits.
Event, Audit orAnnotation Text
Indicates the page number on the lower right corner in the following format:1/2 (page 1 of 2).
Audit Action Typeor Event Valueand Units
Indicates the type of audit action (for example, Command or Write) or thevalue change that triggered the event (for example, 499/500 to notify that thebuffer is nearly full). This field does not apply to annotations.
Previous Value Indicates the value of the item before the event (that is, the status before theCOV) or action that triggered the audit occurred. This field does not apply toannotations.
Post Value Indicates the value of the item after the event (that is, the status before theCOV) or action that triggered the audit occurred. This field does not apply toannotations.
Status Indicates the result of the action that triggered the audit (for example, Ok,Password too short, or other error details). This field only applies to audits.
Priority Indicates the priority of the event. This field only applies to events.
Advanced Reporting System and Energy Essentials Help Guide96

Table 45: Event and Audit Details Report
Field DescriptionName Indicates the name of the user who signed the record.SignatureReason Indicates the reason for the signature.
Report FooterPage Number Indicates the page number on the lower right corner in the following format:
1/2 (page 1 of 2).
Trend Summary Report Content
See Trend Summary Reports in the Concepts section for more details.Table 46: Trend Summary Report
Field DescriptionReport HeaderTrend Summary Indicates the report type selected in the Report Selection
panel, Trend Summary.Report Generated By Indicates the name of the user who generated the report
and the date and time the report was created (for example,Operator at 5/16/2011 9:36:51 A.M.).
Report Path Indicates the path in which the report is located:
Standard Reports\System Behavior\Trend\Start Date Indicates the starting date and time entered for the
selected period in the Select Date Range panel.End Date Indicates the ending date and time entered for the selected
period in the Select Date Range panel.Items Indicates the items selected in the Select Objects panel.Mean Kinetic Temperature (MKT) Indicates whether the Mean Kinetic Temperature (MKT)
option was selected in the Other Filters panel.
This option is selected by default. To change thedefault setting, refer to the ADS/ADX CommissioningGuide (LIT-1201645) or to the ODS Commissioning Guide(LIT-12011944).
Table ColumnsExpand All/Collapse All Expands (shows) or collapses (hides) all node levels of
the records in the table. You cannot sort the data in thisreport. The report is organized alphabetically by Point FullReference and chronologically by time.
97Advanced Reporting System and Energy Essentials Help Guide

Table 46: Trend Summary Report
Field DescriptionItem Name Indicates the name of the item. The name is the user-
defined label designating the item in the User View. If anitem has different names in different User Views, the namefrom the topmost selected view appears.
Unlike the other report types, the Trend reports do notinclude the All Items tree in the Select Items panel. Instead,User Views allow you to run reports based on groups ofrelated trend items, such as all zone temperatures in thesystem.
Expand and collapse icons appear next to each item toshow/hide the details for only that node level.
Point Full Reference Indicates the fully qualified reference of the trend point plusthe attribute name.
YearMonthWeekDay
When
Hour
Indicates the current time interval selected in the SelectDate Range panel The trend points are grouped byyear, month, week, day, and hour. These columns varydepending on the selections made in the Select Date Rangepanel.
Note: The date appears only for intervals larger thanone day (that is, for more than the current day).
Average
Value Indicates the average value of the trend point during thecurrent time interval.
Minimum
When Indicates the date and time in the current time intervalwhen the maximum value occurred. If the same value wasrecorded at multiple dates/times during the interval, thelast occurrence appears.
Note: The date appears only for intervals larger thanone day (that is, for more than the current day).
Value Indicates the maximum value of the trend point during thecurrent time interval.
Maximum
When Indicates the date and time in the current time intervalwhen the minimum value occurred. If the same value wasrecorded at multiple dates/times during the interval, thelast occurrence appears.
Note: The date appears only for intervals larger thanone day (that is, for more than the current day).
Advanced Reporting System and Energy Essentials Help Guide98

Table 46: Trend Summary Report
Field DescriptionMean Kinetic Temperature (MKT) Indicates the Mean Kinetic Temperature (MKT) for
temperature points. This column appears only when youselect the Mean Kinetic Temperature option in the OtherFilters panel.
The intent of the MKT option is to provide a summary overa long period of time, and this column displays data atthe month, year, and point level. Use this calculation forstationary, climate-controlled facilities, where samples ofone hour to one week are sufficient.
The MKT is calculated according to the following formulaand Method C in Considerations on the Calculation of MeanKinetic Temperature (Bailey and others [1985]):
where
ΔH = activation energy (83.14472kJ/mol for solids andliquids, resulting in a ΔH/R constant of 10,000)
R = universal gas constant (8.314472 J/mol-K)
T1...n= highest and lowest temperatures recorded duringeach time period (Method C). The MKT is generallycalculated for a whole year, in which case one time periodis a week. Because the Trend Summary report allows youto specify smaller intervals, the time period used in thisequation is adjusted as necessary. (For example, if thereport range is greater than a year, the MKT time period is aweek. If the range is between a month and a year, the timeperiod is a day. Finally, if the range is less than a month, thetime interval is an hour.)
n = number of samples (For example, the value is 104for a year because the number of time periods [weeks]is multiplied by 2 [one for minimum and another formaximum], 60 to 730 for a month to a year [averagenumbers], and 2 to 1,440 for up to a month.)
Note: Due to the method used to define a week, thereare 4 to 6 weeks in each month. As a result, the samplerange for a report with a one-year duration is 104(52 x 2) to 144 (12 x 2 x 6). For information on weeknumbering, see Select Date Range Panel Content inthe Screens and Tabs section.
ln is the natural logarithm.
e is the natural log base (2.718281...).
99Advanced Reporting System and Energy Essentials Help Guide
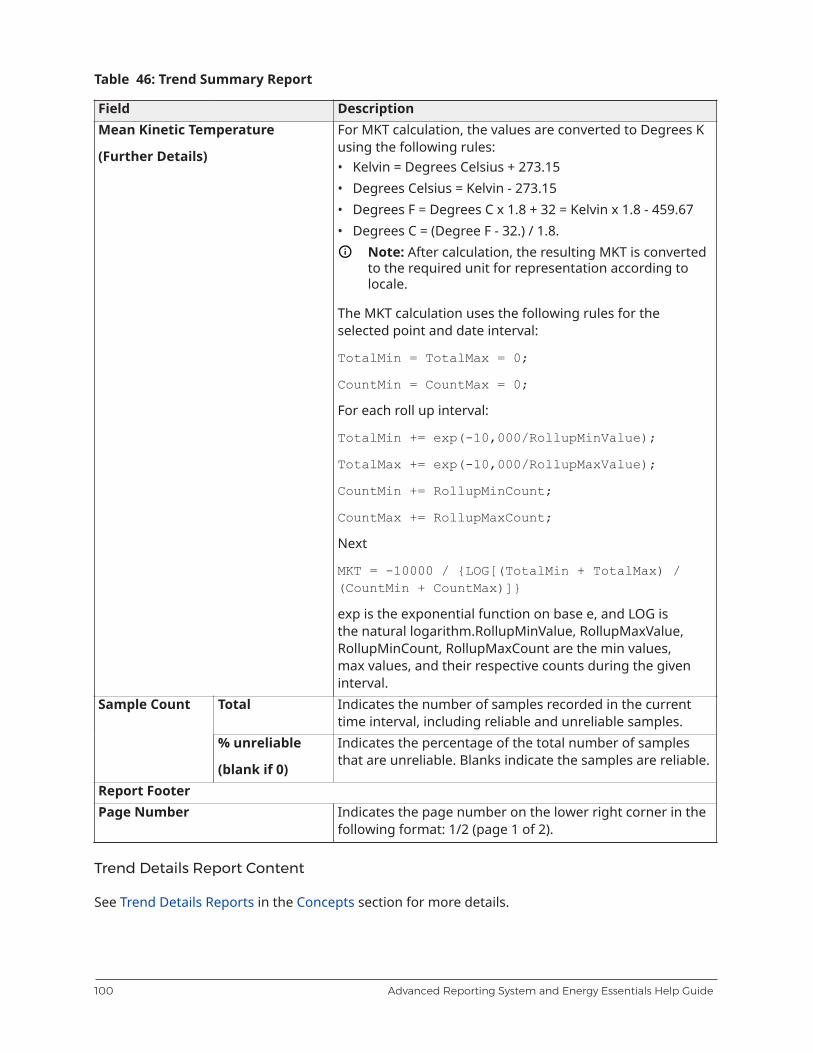
Table 46: Trend Summary Report
Field DescriptionMean Kinetic Temperature
(Further Details)
For MKT calculation, the values are converted to Degrees Kusing the following rules:• Kelvin = Degrees Celsius + 273.15• Degrees Celsius = Kelvin - 273.15• Degrees F = Degrees C x 1.8 + 32 = Kelvin x 1.8 - 459.67• Degrees C = (Degree F - 32.) / 1.8.
Note: After calculation, the resulting MKT is convertedto the required unit for representation according tolocale.
The MKT calculation uses the following rules for theselected point and date interval:
TotalMin = TotalMax = 0;
CountMin = CountMax = 0;
For each roll up interval:
TotalMin += exp(-10,000/RollupMinValue);
TotalMax += exp(-10,000/RollupMaxValue);
CountMin += RollupMinCount;
CountMax += RollupMaxCount;
Next
MKT = -10000 / {LOG[(TotalMin + TotalMax) /(CountMin + CountMax)]}
exp is the exponential function on base e, and LOG isthe natural logarithm.RollupMinValue, RollupMaxValue,RollupMinCount, RollupMaxCount are the min values,max values, and their respective counts during the giveninterval.
Total Indicates the number of samples recorded in the currenttime interval, including reliable and unreliable samples.
Sample Count
% unreliable
(blank if 0)
Indicates the percentage of the total number of samplesthat are unreliable. Blanks indicate the samples are reliable.
Report FooterPage Number Indicates the page number on the lower right corner in the
following format: 1/2 (page 1 of 2).
Trend Details Report Content
See Trend Details Reports in the Concepts section for more details.
Advanced Reporting System and Energy Essentials Help Guide100

Table 47: Trend Details Report
Field DescriptionReport HeaderTrend Detail Indicates the report type selected in the Report Selection panel, Trend
Details.Report Generated By Indicates the name of the user who generated the report and the date
and time the report was created (for example, Operator at 5/16/20119:36:51 A.M.).
Report Path Indicates the path in which the report is located:
Standard Reports\System Behavior\Trend\Items Indicates the items selected in the Select Objects panel.ChartTrend Log DetailedGraph
Displays a line chart of the trend points during the selected period. Thedate/time (hours, days, weeks, months, or years) appears on the x-axisand the trend sample value percentage appears on the y-axis. A legenddefines the colors that represent each point, the point’s full reference,units, and display range.
The display range indicates the scaling of the values appearing on thegraph. The values of the y-axis appear as percentages to accommodatefor graphs with more than one trend having different display ranges.For example, the recorded values for one point may range from 30 to500 while the values of another point may range from -1,000 to 1,000.The graph is scaled to display both points on the same chart usingpercentages. Use the values in the legend’s Display Range column toestimate values of the trend records. The actual values for the pointsappear in the table following the graph.
The graph includes only reliable sample values. The table of dataincludes unreliable points with the status of the point (for example,Bad Status). As a best practice, run a report with a maximum of 10trend points.
Table ColumnsExpand All/Collapse All Expands (shows) or collapses (hides) all node levels of the records in
the table.
You cannot sort the data in this report. The report is organizedalphabetically by Point Full Reference and chronologically by time.
101Advanced Reporting System and Energy Essentials Help Guide
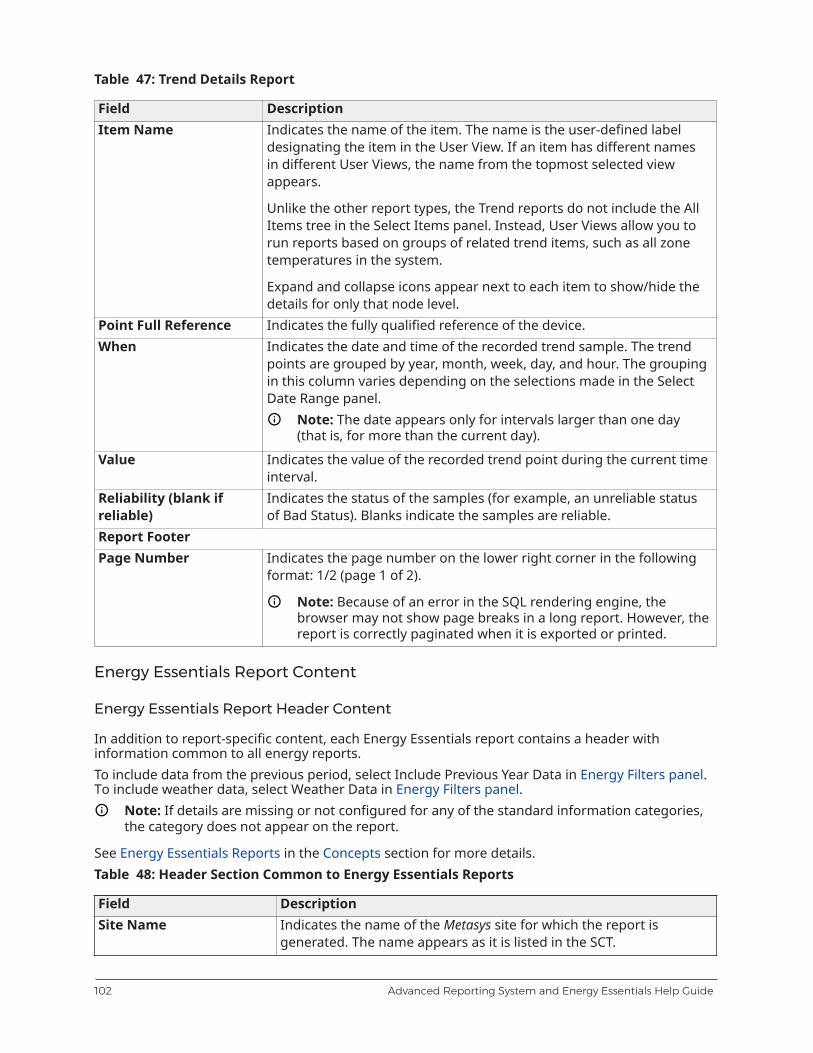
Table 47: Trend Details Report
Field DescriptionItem Name Indicates the name of the item. The name is the user-defined label
designating the item in the User View. If an item has different namesin different User Views, the name from the topmost selected viewappears.
Unlike the other report types, the Trend reports do not include the AllItems tree in the Select Items panel. Instead, User Views allow you torun reports based on groups of related trend items, such as all zonetemperatures in the system.
Expand and collapse icons appear next to each item to show/hide thedetails for only that node level.
Point Full Reference Indicates the fully qualified reference of the device.When Indicates the date and time of the recorded trend sample. The trend
points are grouped by year, month, week, day, and hour. The groupingin this column varies depending on the selections made in the SelectDate Range panel.
Note: The date appears only for intervals larger than one day(that is, for more than the current day).
Value Indicates the value of the recorded trend point during the current timeinterval.
Reliability (blank ifreliable)
Indicates the status of the samples (for example, an unreliable statusof Bad Status). Blanks indicate the samples are reliable.
Report FooterPage Number Indicates the page number on the lower right corner in the following
format: 1/2 (page 1 of 2).
Note: Because of an error in the SQL rendering engine, thebrowser may not show page breaks in a long report. However, thereport is correctly paginated when it is exported or printed.
Energy Essentials Report Content
Energy Essentials Report Header Content
In addition to report-specific content, each Energy Essentials report contains a header withinformation common to all energy reports.To include data from the previous period, select Include Previous Year Data in Energy Filters panel.To include weather data, select Weather Data in Energy Filters panel.
Note: If details are missing or not configured for any of the standard information categories,the category does not appear on the report.
See Energy Essentials Reports in the Concepts section for more details.Table 48: Header Section Common to Energy Essentials Reports
Field DescriptionSite Name Indicates the name of the Metasys site for which the report is
generated. The name appears as it is listed in the SCT.
Advanced Reporting System and Energy Essentials Help Guide102
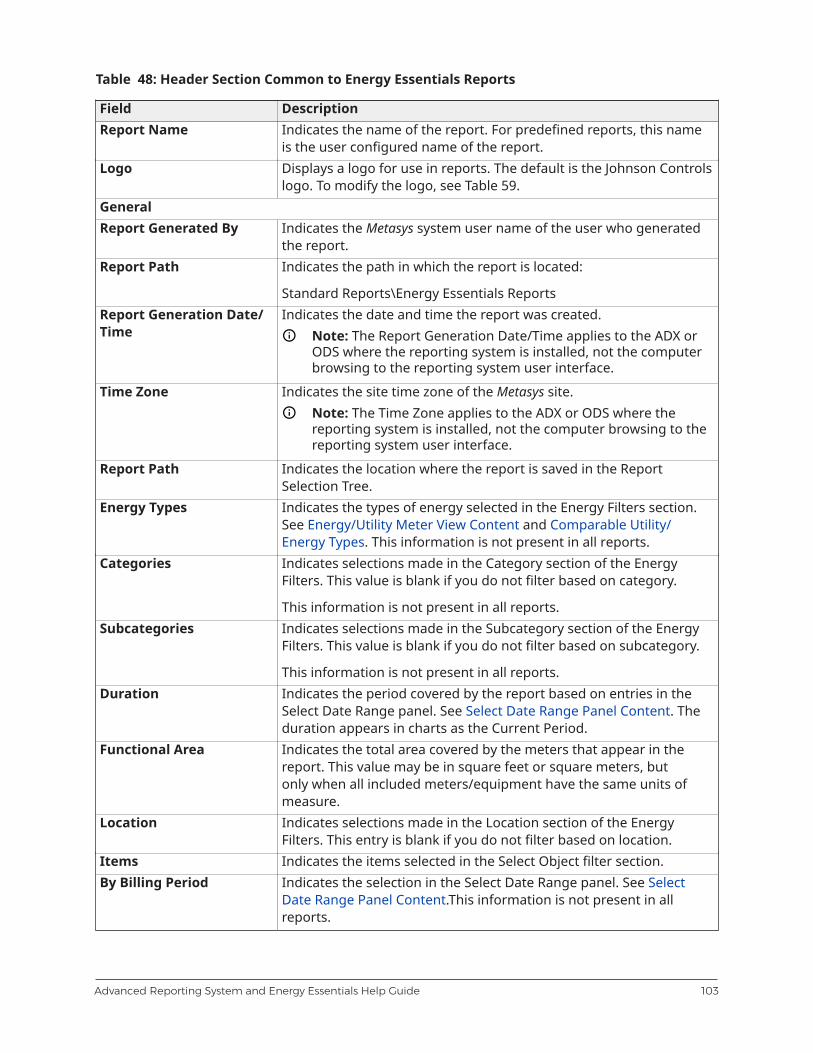
Table 48: Header Section Common to Energy Essentials Reports
Field DescriptionReport Name Indicates the name of the report. For predefined reports, this name
is the user configured name of the report.Logo Displays a logo for use in reports. The default is the Johnson Controls
logo. To modify the logo, see Table 59.GeneralReport Generated By Indicates the Metasys system user name of the user who generated
the report.Report Path Indicates the path in which the report is located:
Standard Reports\Energy Essentials ReportsReport Generation Date/Time
Indicates the date and time the report was created.Note: The Report Generation Date/Time applies to the ADX orODS where the reporting system is installed, not the computerbrowsing to the reporting system user interface.
Time Zone Indicates the site time zone of the Metasys site.Note: The Time Zone applies to the ADX or ODS where thereporting system is installed, not the computer browsing to thereporting system user interface.
Report Path Indicates the location where the report is saved in the ReportSelection Tree.
Energy Types Indicates the types of energy selected in the Energy Filters section.See Energy/Utility Meter View Content and Comparable Utility/Energy Types. This information is not present in all reports.
Categories Indicates selections made in the Category section of the EnergyFilters. This value is blank if you do not filter based on category.
This information is not present in all reports.Subcategories Indicates selections made in the Subcategory section of the Energy
Filters. This value is blank if you do not filter based on subcategory.
This information is not present in all reports.Duration Indicates the period covered by the report based on entries in the
Select Date Range panel. See Select Date Range Panel Content. Theduration appears in charts as the Current Period.
Functional Area Indicates the total area covered by the meters that appear in thereport. This value may be in square feet or square meters, butonly when all included meters/equipment have the same units ofmeasure.
Location Indicates selections made in the Location section of the EnergyFilters. This entry is blank if you do not filter based on location.
Items Indicates the items selected in the Select Object filter section.By Billing Period Indicates the selection in the Select Date Range panel. See Select
Date Range Panel Content.This information is not present in allreports.
103Advanced Reporting System and Energy Essentials Help Guide

Table 48: Header Section Common to Energy Essentials Reports
Field DescriptionBilling Periods Indicates the billing period filter used for the report based on the
Billing Period view. See Billing Period View Content. This entry isblank if you do not filter based on billing period.
This information is not present in all reports.Chart Weather Data Type Appears when you decide to include weather data in the report and
choose a chart type. To include weather data, select Chart WeatherData Type in the Energy Filters panel.
Weather DataThis optional section appears only if you choose to include weather data in a report. To includeweather data, select Weather Data in the Energy Filters panel. At least one meter included in thereport must have weather data associated with it for weather data to appear in the report. Whenmore than one meter with more than one weather data association is present in the report, thereport aggregates the data. Data is only shown when weather is associated to at least one meter.Outdoor Air Temp Avg Indicates the average outdoor temperature for the reporting period.Outdoor Air Temp High &Low
Indicates the high and low temperatures reached in the reportingperiod, separated by a bar symbol: |
Outdoor Air Enthalpy Avg Indicates the average outdoor air enthalpy for the reporting period.Outdoor Air EnthalpyHigh & Low
Indicates the high and low enthalpies, separated by a bar symbol: |
Outdoor Air Humidity Avg Indicates the average humidity of the outside air.Outdoor Air HumidityHigh & Low
Indicates the high and low humidity levels in the outdoor air,separated by a bar symbol: |
Heating Degree Days Indicates the total number of heating degree days.
The heating degree day total is derived from the following equationfor each day:
Base Temperature – (High Outdoor Air Temperature - Low OutdoorAir Temperature)/2 The base temperature appears in parentheses.The default is 65˚F. To change the base temperature, see EnergyEssentials Advanced Configuration Questions.
Cooling Degree Days Indicates the total number of cooling degree days.
The cooling degree day total is derived from the following equationfor each day:(High Outdoor Air Temperature – Low Outdoor AirTemperature)/2 - Base Temperature. The base temperature appearsin parentheses. The default is 65˚F. To change the base temperature,see Energy Essentials Advanced Configuration Questions.
Sample Data Quality
This optional section appears only if you choose to include sample data in a report. To includeweather data, select Include Sample Data in the Energy Filters panel.Total Sample Count Indicates the total number of data points included in the report.
Note: You must enter the sample Interval in Energy/Utility Viewproperly for this section to report properly.
% Unreliable Indicates the percentage of points in the report that are unreliable.
Advanced Reporting System and Energy Essentials Help Guide104

Table 48: Header Section Common to Energy Essentials Reports
Field DescriptionMissing Samples Indicates the estimated number of samples missing from the period.
Note: The number of missing samples is calculated bysubtracting the value for Total Sample Count from the ExpectedSample Count. See the Expected Sample Interval (minutes)value. Missing samples do not take into effect changes ofsample interval or quick trending.
Note: In the Equipment Runtime report, the Total Sample Count is the total number of piecesof equipment and their associated occupancy samples. The % Unreliable is the percentage ofthe Total Sample Count that is unreliable for each piece of equipment. For example, assumeyou have 2 pieces of equipment, each with 2 samples. Each piece of equipment is associatedto the same occupancy point that has 2 trend samples. The Total Sample Count is 8 (2 piecesof equipment + 4 samples + 2 occupancy point trend samples). If one occupancy point trendsample is unreliable, the % Unreliable is 25% for both pieces of equipment (1 unreliable pointfor Equipment1 + 1 unreliable point for Equipment2 = 2. 2/8 = .25 = 25%).
Big Picture Energy Report Content
See Big Picture Energy Reports in the Concepts section for more details.For information on the header content of this report, see Energy Essentials Report Header Content.To include data from the previous period, select Include Previous Year Data in the Energy Filterspanel. The Big Picture Energy report does not include weather data.Table 49: Big Picture Energy Report
Field
Header
See Energy Essentials Report Header Content.
Overview (Chart)
Indicates the normalized energy use for the current period by type using a pie chart. Theinformation is by percentage of total source energy use.
Note: The Other category and non-energy-related (Water Consumption) points do not appearas there are no calculations that can be performed against it.
Energy Usage (Table)
Summarizes energy usage for the current period using categories, subcategories, energy/utility type, and the source energy usage. See Energy Essentials Report Header Content forinformation on source energy and how it is normalized. The report organizes the information intothe following:• Total Building Energy Use• Total Facility Energy Production• Total Outdoor Energy Use• Net Facility Energy Use• Source Energy Equivalent (kBtu)
Usage by Category (Chart)
105Advanced Reporting System and Energy Essentials Help Guide
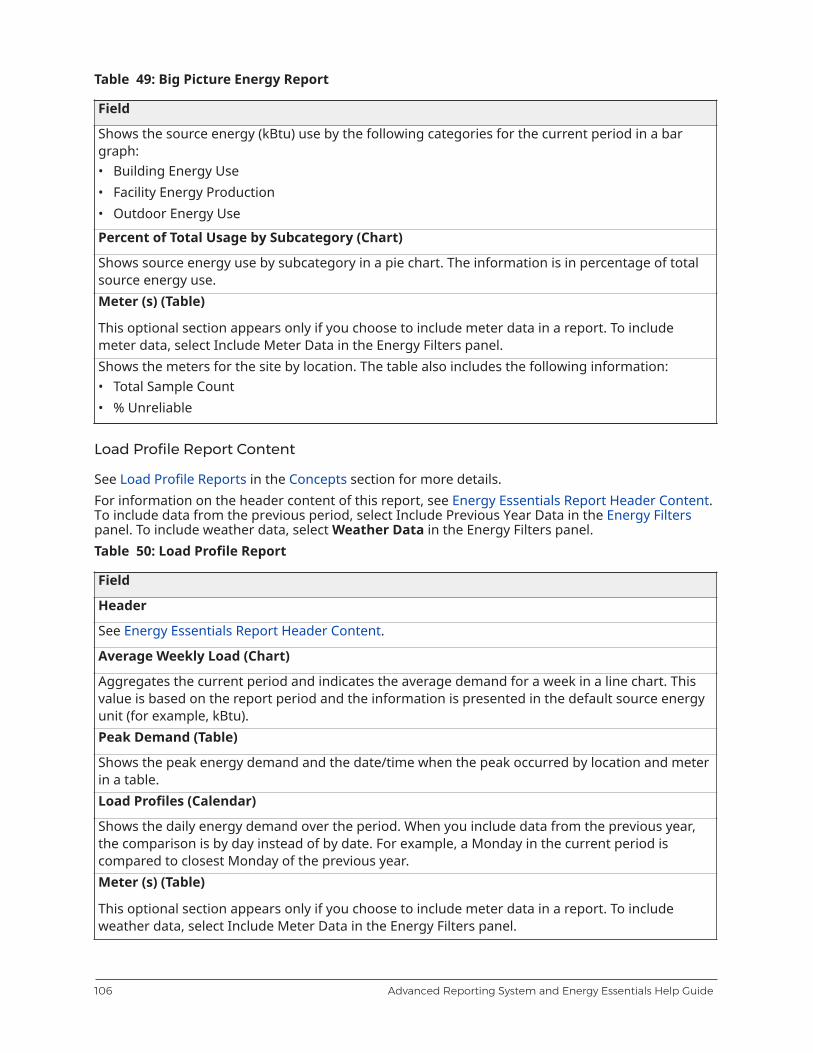
Table 49: Big Picture Energy Report
Field
Shows the source energy (kBtu) use by the following categories for the current period in a bargraph:• Building Energy Use• Facility Energy Production• Outdoor Energy Use
Percent of Total Usage by Subcategory (Chart)
Shows source energy use by subcategory in a pie chart. The information is in percentage of totalsource energy use.Meter (s) (Table)
This optional section appears only if you choose to include meter data in a report. To includemeter data, select Include Meter Data in the Energy Filters panel.Shows the meters for the site by location. The table also includes the following information:• Total Sample Count• % Unreliable
Load Profile Report Content
See Load Profile Reports in the Concepts section for more details.For information on the header content of this report, see Energy Essentials Report Header Content.To include data from the previous period, select Include Previous Year Data in the Energy Filterspanel. To include weather data, select Weather Data in the Energy Filters panel.Table 50: Load Profile Report
Field
Header
See Energy Essentials Report Header Content.
Average Weekly Load (Chart)
Aggregates the current period and indicates the average demand for a week in a line chart. Thisvalue is based on the report period and the information is presented in the default source energyunit (for example, kBtu).Peak Demand (Table)
Shows the peak energy demand and the date/time when the peak occurred by location and meterin a table.Load Profiles (Calendar)
Shows the daily energy demand over the period. When you include data from the previous year,the comparison is by day instead of by date. For example, a Monday in the current period iscompared to closest Monday of the previous year.Meter (s) (Table)
This optional section appears only if you choose to include meter data in a report. To includeweather data, select Include Meter Data in the Energy Filters panel.
Advanced Reporting System and Energy Essentials Help Guide106
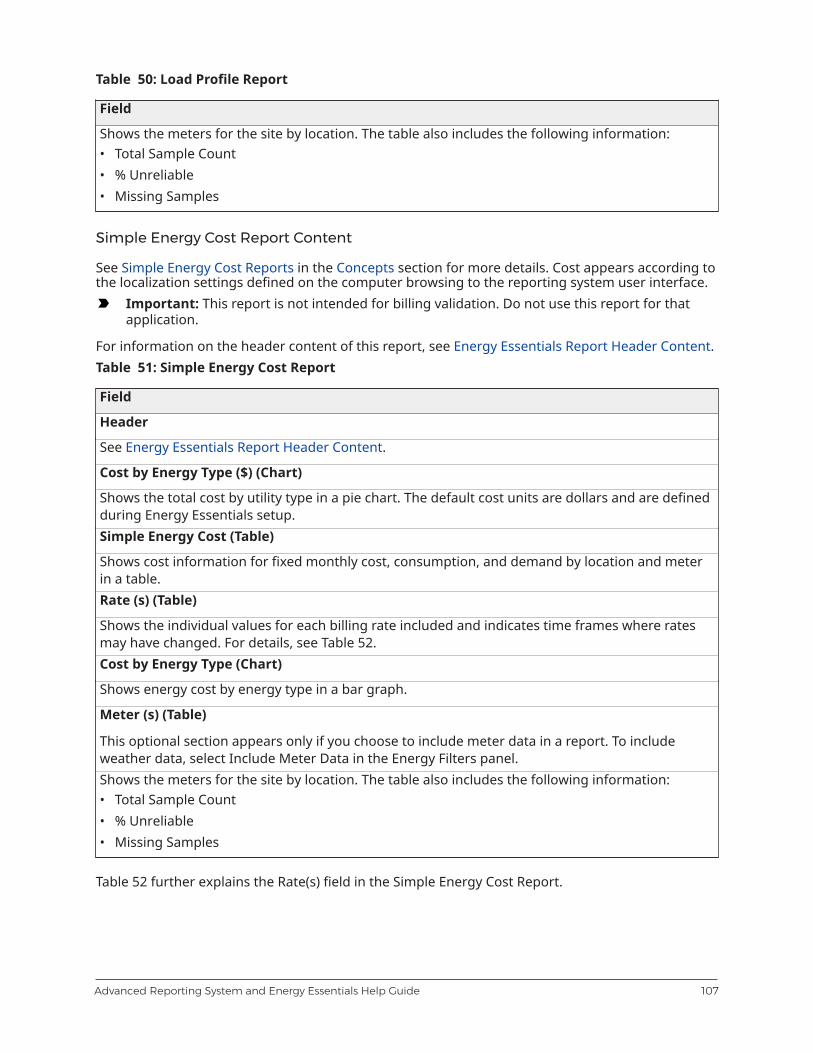
Table 50: Load Profile Report
Field
Shows the meters for the site by location. The table also includes the following information:• Total Sample Count• % Unreliable• Missing Samples
Simple Energy Cost Report Content
See Simple Energy Cost Reports in the Concepts section for more details. Cost appears according tothe localization settings defined on the computer browsing to the reporting system user interface.
Important: This report is not intended for billing validation. Do not use this report for thatapplication.
For information on the header content of this report, see Energy Essentials Report Header Content.Table 51: Simple Energy Cost Report
Field
Header
See Energy Essentials Report Header Content.
Cost by Energy Type ($) (Chart)
Shows the total cost by utility type in a pie chart. The default cost units are dollars and are definedduring Energy Essentials setup.Simple Energy Cost (Table)
Shows cost information for fixed monthly cost, consumption, and demand by location and meterin a table.Rate (s) (Table)
Shows the individual values for each billing rate included and indicates time frames where ratesmay have changed. For details, see Table 52.Cost by Energy Type (Chart)
Shows energy cost by energy type in a bar graph.
Meter (s) (Table)
This optional section appears only if you choose to include meter data in a report. To includeweather data, select Include Meter Data in the Energy Filters panel.Shows the meters for the site by location. The table also includes the following information:• Total Sample Count• % Unreliable• Missing Samples
Table 52 further explains the Rate(s) field in the Simple Energy Cost Report.
107Advanced Reporting System and Energy Essentials Help Guide

Table 52: List of Rates Example
Consumption DemandRateIdentifier
Date BaseRate ($) Rate ($) Units Rate ($) Units
Electric Rate 11/01/2008 1.00 1.50000 $/kWh 1.50000 $/kWGas Rate 11/01/2008 55.42 .0436 $/Btu 5.02 $/BtuElectric Rate 04/12/2009 1.15 1.50000 $/kWh 1.55000 $/kWElectric Rate 11/01/2009 1.20 1.50000 $/kWh 1.55000 $/kWElectric Rate 11/25/2009 1.20 1.60000 $/kWh 1.65000 $/kW
• Rate Identifier: Name of the billing rate as defined in the Energy Setup Billing Rate View.
• Date: The date on which a set of rates starts within the report. This date is later in time than theconfigured effective start date of the rate whenever the report’s start date is after the rate wentinto effect.
• Base Rate: The fixed base charge per billing period. This charge is applied even if there is zerousage during the report duration.
• Consumption Rate: The consumption rate that starts on Date. If this value is the last row in thetable, these rates continue through the end of the report duration.
• Demand Rate: The demand rate that starts on Date. If this value is the last row in the table,these rates continue through the end of the report duration.
• Demand Units/Consumption Units: The units associated with the corresponding rate. Unitsdo not have start-on dates; therefore, changing the rate at any time in the energy configurationscreen applies to the whole rate table/report.
When the Rate Table is prepared for each report, multiple scenarios may affect the Date:• The earliest date in the Rate Table is the start date of the Report. If you include previous year
data, the start date is equal to the previous year’s start date. For example, the report has a reportduration of 11/01/2010 to 12/01/2010. The earliest date in the Date column is 11/01/2009. If youincluded the previous year, the earliest date is 11/01/2009.
• When including the previous year’s data, you receive all rate changes that occurred between theprevious year’s Start Date and the report’s End Date. In the previous example, any rate change inthe range of 11/01/2009 to 12/01/2010 appears in the Rate Table.
• The Starting On date for rate changes in the Energy Setup Billing Rate View is used only whena rate change occurs between the Start Date and End Date of the report. When the reportingperiod is before or after Energy Setup Billing Rate View changed dates, the report shows anduses the first or last rate change, respectively. In other words, the rate is pulled forward to starton the Start Date or extend the last rate change through the report end date.
• It does not matter if Base, Consumption, Demand, or any combination of the three rates change;the rate table displays all three values in every row.
Consumption Report Content
See Consumption Reports in the Concepts section for more details.For information on the header content of this report, see Energy Essentials Report Header Content.
Advanced Reporting System and Energy Essentials Help Guide108
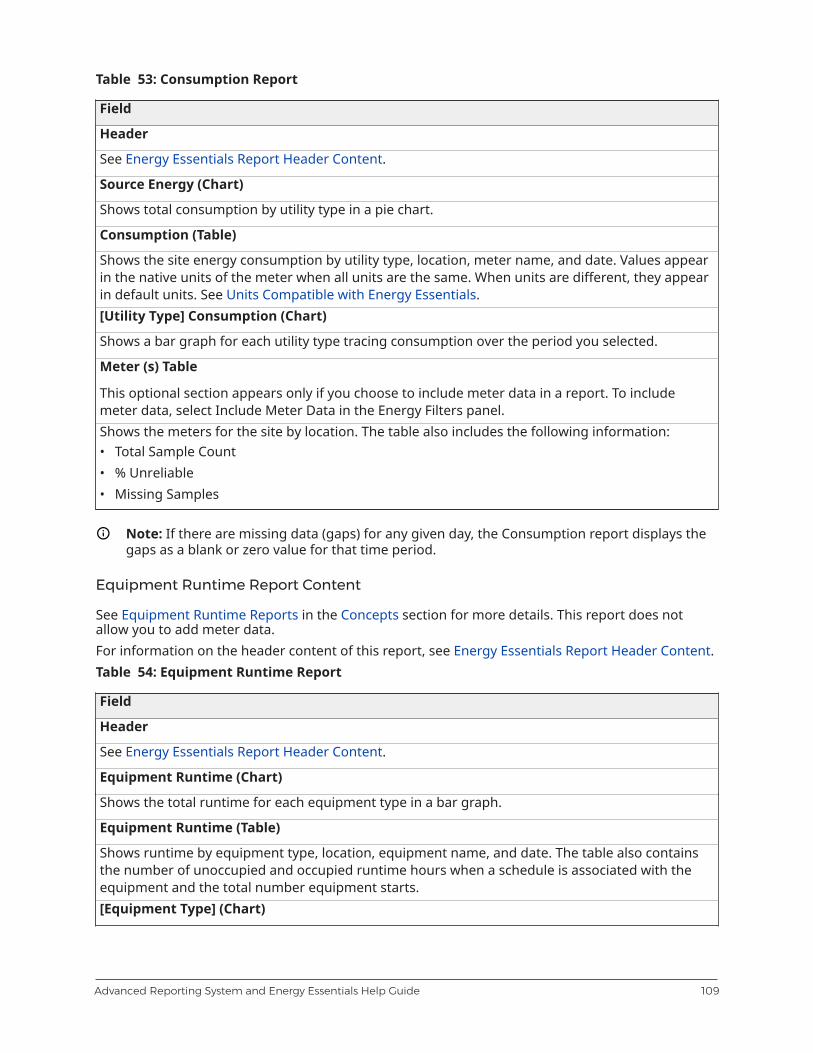
Table 53: Consumption Report
Field
Header
See Energy Essentials Report Header Content.
Source Energy (Chart)
Shows total consumption by utility type in a pie chart.
Consumption (Table)
Shows the site energy consumption by utility type, location, meter name, and date. Values appearin the native units of the meter when all units are the same. When units are different, they appearin default units. See Units Compatible with Energy Essentials.[Utility Type] Consumption (Chart)
Shows a bar graph for each utility type tracing consumption over the period you selected.
Meter (s) Table
This optional section appears only if you choose to include meter data in a report. To includemeter data, select Include Meter Data in the Energy Filters panel.Shows the meters for the site by location. The table also includes the following information:• Total Sample Count• % Unreliable• Missing Samples
Note: If there are missing data (gaps) for any given day, the Consumption report displays thegaps as a blank or zero value for that time period.
Equipment Runtime Report Content
See Equipment Runtime Reports in the Concepts section for more details. This report does notallow you to add meter data.For information on the header content of this report, see Energy Essentials Report Header Content.Table 54: Equipment Runtime Report
Field
Header
See Energy Essentials Report Header Content.
Equipment Runtime (Chart)
Shows the total runtime for each equipment type in a bar graph.
Equipment Runtime (Table)
Shows runtime by equipment type, location, equipment name, and date. The table also containsthe number of unoccupied and occupied runtime hours when a schedule is associated with theequipment and the total number equipment starts.[Equipment Type] (Chart)
109Advanced Reporting System and Energy Essentials Help Guide

Table 54: Equipment Runtime Report
Field
Shows the occupied and unoccupied runtime for each piece of equipment in a bar graph. If noOccupancy Schedules are associated, this chart is blank.[Equipment Type] (Table)
Shows the total runtime for the equipment over time.
Electrical Energy Report Content
See Electrical Energy Reports in the Concepts section for more details.For information on the header content of this report, see Energy Essentials Report Header Content.Table 55: Electrical Energy Report
Field
Header
See Energy Essentials Report Header Content.
Overview (Chart)
Shows total electricity consumed and demanded by your site in a compound bar graph.
Consumption and Demand (Table)
Shows consumption and demand by location, meter name, and date. The table also contains peakdemand, power factor, and reactive power.
Note: Power factor and reactive power are optional and appear only when they areassociated with a meter.
Consumption by Location (Chart)
Shows electrical consumption for each location you selected in a bar graph.
Demand by Location (Chart)
Shows electrical demand for each location you selected in a line graph.
Meter (s) Table
This optional section appears only if you choose to include meter data in a report. To includemeter data, select Include Meter Data in the Energy Filters panel.Shows the meters for the site by location. The table also includes the following information:• Total Sample Count• % Unreliable• Missing Samples
Production Report Content
See Production Reports in the Concepts section for more details.For information on the header content of this report, see Energy Essentials Report Header Content.
Advanced Reporting System and Energy Essentials Help Guide110
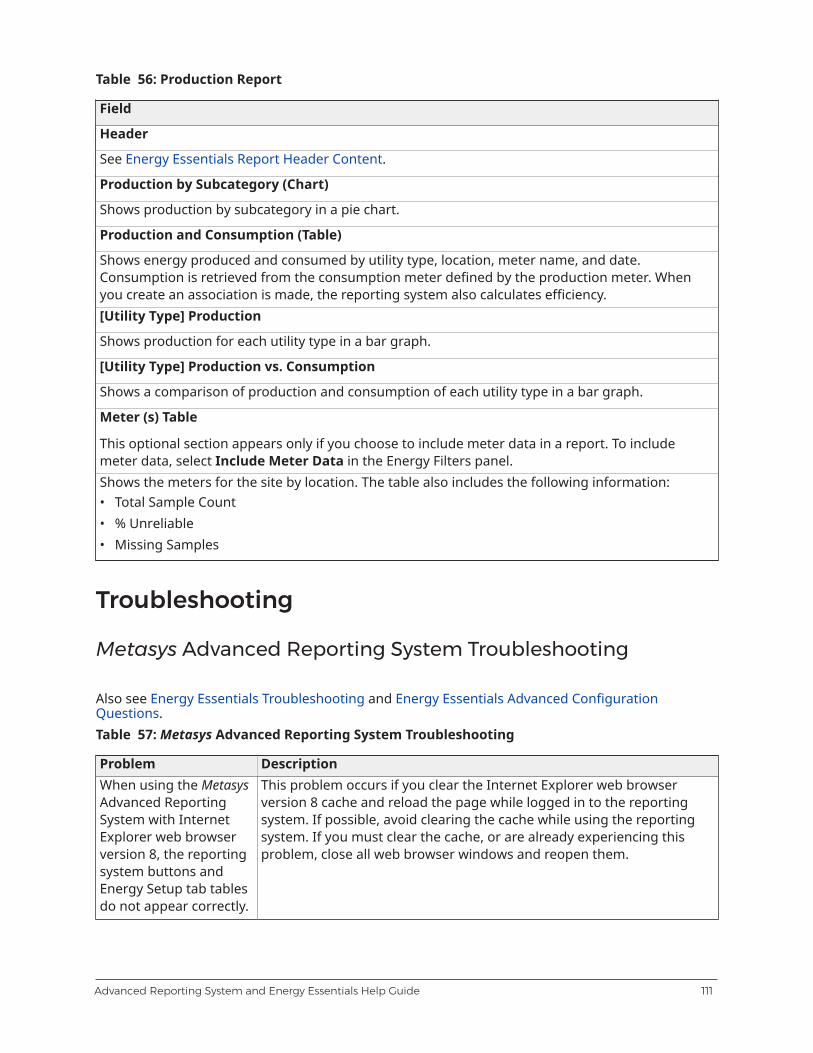
Table 56: Production Report
Field
Header
See Energy Essentials Report Header Content.
Production by Subcategory (Chart)
Shows production by subcategory in a pie chart.
Production and Consumption (Table)
Shows energy produced and consumed by utility type, location, meter name, and date.Consumption is retrieved from the consumption meter defined by the production meter. Whenyou create an association is made, the reporting system also calculates efficiency.[Utility Type] Production
Shows production for each utility type in a bar graph.
[Utility Type] Production vs. Consumption
Shows a comparison of production and consumption of each utility type in a bar graph.
Meter (s) Table
This optional section appears only if you choose to include meter data in a report. To includemeter data, select Include Meter Data in the Energy Filters panel.Shows the meters for the site by location. The table also includes the following information:• Total Sample Count• % Unreliable• Missing Samples
Troubleshooting
Metasys Advanced Reporting System Troubleshooting
Also see Energy Essentials Troubleshooting and Energy Essentials Advanced ConfigurationQuestions.Table 57: Metasys Advanced Reporting System Troubleshooting
Problem DescriptionWhen using the MetasysAdvanced ReportingSystem with InternetExplorer web browserversion 8, the reportingsystem buttons andEnergy Setup tab tablesdo not appear correctly.
This problem occurs if you clear the Internet Explorer web browserversion 8 cache and reload the page while logged in to the reportingsystem. If possible, avoid clearing the cache while using the reportingsystem. If you must clear the cache, or are already experiencing thisproblem, close all web browser windows and reopen them.
111Advanced Reporting System and Energy Essentials Help Guide
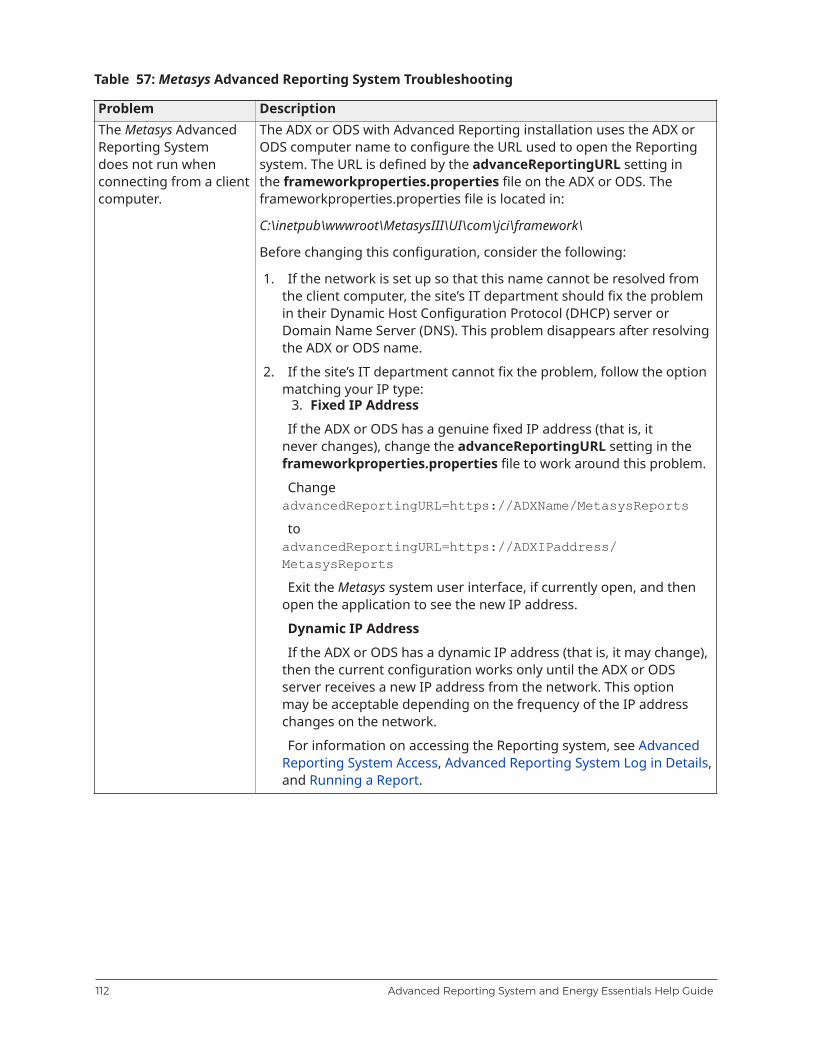
Table 57: Metasys Advanced Reporting System Troubleshooting
Problem DescriptionThe Metasys AdvancedReporting Systemdoes not run whenconnecting from a clientcomputer.
The ADX or ODS with Advanced Reporting installation uses the ADX orODS computer name to configure the URL used to open the Reportingsystem. The URL is defined by the advanceReportingURL setting inthe frameworkproperties.properties file on the ADX or ODS. Theframeworkproperties.properties file is located in:
C:\inetpub\wwwroot\MetasysIII\UI\com\jci\framework\
Before changing this configuration, consider the following:
1. If the network is set up so that this name cannot be resolved fromthe client computer, the site’s IT department should fix the problemin their Dynamic Host Configuration Protocol (DHCP) server orDomain Name Server (DNS). This problem disappears after resolvingthe ADX or ODS name.
2. If the site’s IT department cannot fix the problem, follow the optionmatching your IP type:
3. Fixed IP Address
If the ADX or ODS has a genuine fixed IP address (that is, itnever changes), change the advanceReportingURL setting in theframeworkproperties.properties file to work around this problem.
ChangeadvancedReportingURL=https://ADXName/MetasysReports
toadvancedReportingURL=https://ADXIPaddress/MetasysReports
Exit the Metasys system user interface, if currently open, and thenopen the application to see the new IP address.
Dynamic IP Address
If the ADX or ODS has a dynamic IP address (that is, it may change),then the current configuration works only until the ADX or ODSserver receives a new IP address from the network. This optionmay be acceptable depending on the frequency of the IP addresschanges on the network.
For information on accessing the Reporting system, see AdvancedReporting System Access, Advanced Reporting System Log in Details,and Running a Report.
Advanced Reporting System and Energy Essentials Help Guide112

Table 57: Metasys Advanced Reporting System Troubleshooting
Problem DescriptionYou cannot print areport.
Print does not function correctly on some systems.
To resolve this issue, try one of the following:• Export the report and print in the exported format.• If you are using SQL Server 2012 R2 or SQL Server 2012, install the
Report Viewer 2012 Redistributable Package, restart the computer,and print directly from the report. Report Viewer 2012 is availableon the Energy Essentials product disk and from microsoft.com at thefollowing address: www.microsoft.com/downloads
Installing Report Viewer 2012 resolves this problem.
See Printing a Report.A report does notappear after you clickRun.
To address this problem, verify that you have disabled the pop-upblocker in your web browser software.
The following messageappears in the ADS/ADX/ODS log in EventViewer:There was a problemaccessing theMetasys Report webservice.
The Metasys Advanced Reporting System could not complete its dailycache synchronization that occurs at 3:15 A.M. because the archivedatabase it is using may be too large. Reduce the point count in thearchive database.
A report takes longerto run the first timewhen compared withsubsequent times.
This behavior is normal. The first time you run a report, the MetasysAdvanced Reporting System is creating a cache of existing historicaldata that can be accessed quickly for future reports if it does notchange.
You can see the AllItems tree in thereporting system userinterface, but youcannot see it in the SiteManagement Portal UI.
The Metasys Advanced Reporting System requires the privileges listedin Security Administration. But, the reporting system ignores all otherprivileges. You may be able to create reports for trees that are notvisible to you in the Site Management Portal UI.
When you attemptto export reportinformation, thismessage appears:Internet Explorercannot downloadInternet Explorerwas not able toopen this Internetsite. The requestedsite is eitherunavailable orcannot be found.Please try againlater.
To address this problem:
1. On the computer you are using to browse to the Metasys AdvancedReporting System UI, open the Internet Explorer web browser.
2. On the Tools menu, select Internet Options.
3. On the Advanced tab, scroll down to the Security section.
4. Clear the check box for Do not save encrypted pages to disk.
5. Close all Internet Explorer web browser windows.
6. Attempt to export report content again.
113Advanced Reporting System and Energy Essentials Help Guide

Table 57: Metasys Advanced Reporting System Troubleshooting
Problem DescriptionInformation in thereporting system userinterface does notappear correctly or youhave problems usingthe web browser.
We strongly advise that you do not browse to the Metasys SiteManagement Portal UI from a computer running a server-classoperating system. By default, WindowsInternet Explorer EnhancedSecurity Configuration is enabled on server-class operating systems,and may block the Launcher download page from which you install theLauncher application for access to the Site Management Portal. Openthe Site Management Portal UI from a computer that is not running aserver-class OS.
Reporting content doesnot match the changesyou made in the SCT oronline user interface.
Updated information may not appear because you made changes to theconfiguration of your site, but did not do the following:
1. Upload changes to the SCT.
2. Wait for a reporting system refresh/perform a manual refresh.See ADX/ODS and SCT Interaction.
The navigation tree hasnever updated withnew content or has notupdated with recentlyadded content.
New or updated entries in the navigation tree may not appearbecause the ADX or ODS computer is overburdened handling otherprocesses. Verify this problem by opening the Windows Event Vieweron the ADX or ODS computer. Look for a recent entry from theMetasysReportCacheRefresh source under the Applications section. Theerror reports a service timeout. You may be able to resolve this issue byincreasing the WebServiceDBTimeout parameter setting as follows:
1. On the ADX or ODS computer, open the web.config file locatedunder the C:\Inetpub\wwwroot\MetasysIII\MetasysReports folder.
2. Search for this setting (the value is in seconds): <addkey="WebServiceDBTimeout" value="900"/>
3. Increase the number to a much higher value. Even a setting as highas 7,200 seconds (2 hours) is acceptable.
4. Save and close the web.config file.The following errorappears in the reportingsystem user interface:Unable to loadthe ObjectSelection tree.Please refreshyour browser.If the problemcontinues, contacta Metasys systemadministrator forassistance.
This problem happens if a refresh does not occur immediately afterinstalling the Metasys Advanced Reporting System.
To resolve this issue, attempt to refresh the browser. If this does notcorrect the problem, use the Windows Event log to resolve any issuesthat may have prevented a refresh.
Snoozed alarms do notappear in the EventViewer but do appear inreports.
This behavior is normal.
The Event Viewer does not show snoozed alarms. In Metasys AdvancedReporting System reports, snoozed alarms do appear with blank fieldsand fields that read Not Specified.
Advanced Reporting System and Energy Essentials Help Guide114

Energy Essentials Troubleshooting
Also, see Metasys Advanced Reporting System Troubleshooting and Energy Essentials AdvancedConfiguration Questions.Table 58: Energy Essentials Troubleshooting
Problem DescriptionEnergy Essentialscontent does not reflectthe changes you madein the SCT or online userinterface.
Energy Essentials information may not appear because you madechanges to the configuration of your site, but did not do the following:• Upload changes to the SCT.• Wait for a reporting system refresh/perform a manual refresh.• Click Populate.See ADX/ODS and SCT Interaction.
Selected points do notshow up in the report.
Check to see if the filter selection in use is preventing the points frombeing included. Be sure to scroll through all filter selections for location,category, and subcategory. See Selection Persistence for details on howthe system remembers report selections during the current session.
Energy Essentialsreports appear to runcorrectly but are missingdata.
This problem may occur due to any of the following reasons:• You deleted the JCIHistorianDB database or purged the data
requested from the JCIHistorianDB database. This database containsEnergy Essentials information.
• You chose a report period that contains no data based on the filtersand item selections.
• You did not trend your energy points correctly. See TrendingRequirements.
• You configured units for the item that do not match the EnergyEssentials units, and no conversion is possible between the mis-matched units. See Units Compatible with Energy Essentials.
Consumption Report:
Meter consumption totalis 1 in the tabular dataeven though all entryrows show a value of 0.
This behavior is normal if, for example, your meter is measuring inwatts (W) but the report is displays in kilowatt (kW). When the reportrounds the small watt values to 0 kW, the Total row reflects the smallvalues that are not visible in the other rows.
This problem is a rounding issue and should be interpreted as such.Consumption Report:
Values in the reportappear to not totalcorrectly.
This behavior is normal due to rounding of values during unitconversion and report generation.
This problem is a rounding issue and should be interpreted as such.Values should differ by no more than 1.
Note: You can view the actual values if you export the report to theExcel format.
115Advanced Reporting System and Energy Essentials Help Guide
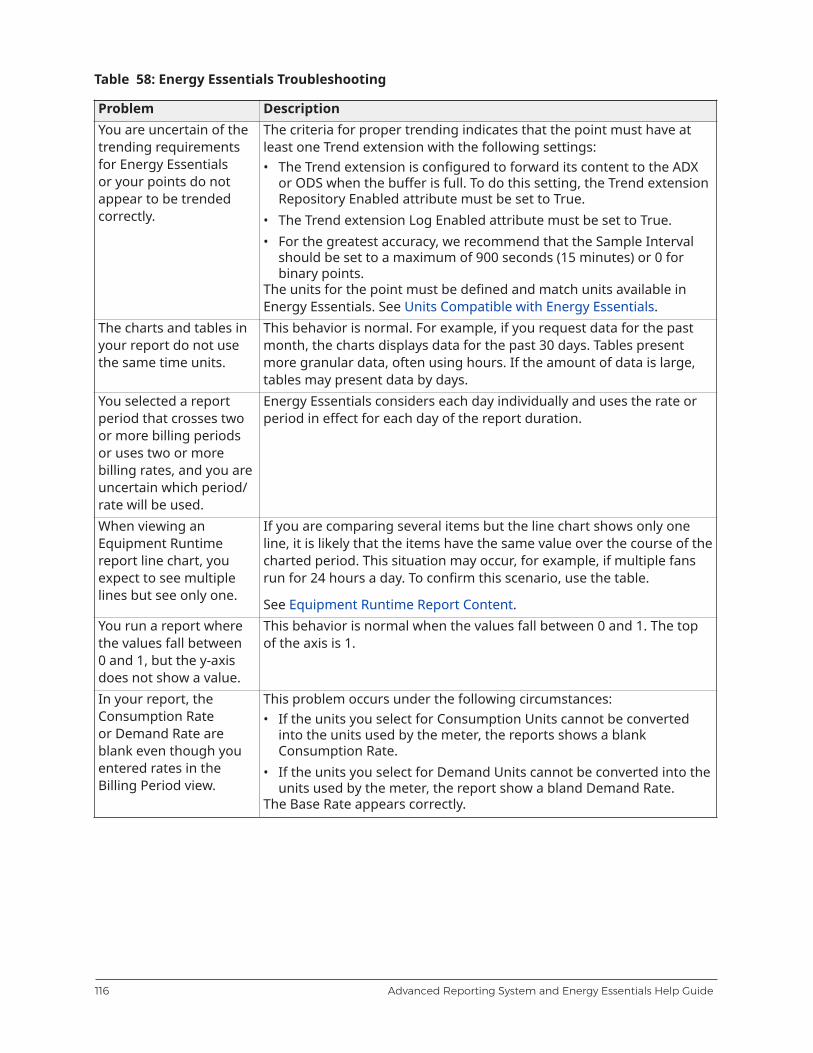
Table 58: Energy Essentials Troubleshooting
Problem DescriptionYou are uncertain of thetrending requirementsfor Energy Essentialsor your points do notappear to be trendedcorrectly.
The criteria for proper trending indicates that the point must have atleast one Trend extension with the following settings:• The Trend extension is configured to forward its content to the ADX
or ODS when the buffer is full. To do this setting, the Trend extensionRepository Enabled attribute must be set to True.
• The Trend extension Log Enabled attribute must be set to True.• For the greatest accuracy, we recommend that the Sample Interval
should be set to a maximum of 900 seconds (15 minutes) or 0 forbinary points.
The units for the point must be defined and match units available inEnergy Essentials. See Units Compatible with Energy Essentials.
The charts and tables inyour report do not usethe same time units.
This behavior is normal. For example, if you request data for the pastmonth, the charts displays data for the past 30 days. Tables presentmore granular data, often using hours. If the amount of data is large,tables may present data by days.
You selected a reportperiod that crosses twoor more billing periodsor uses two or morebilling rates, and you areuncertain which period/rate will be used.
Energy Essentials considers each day individually and uses the rate orperiod in effect for each day of the report duration.
When viewing anEquipment Runtimereport line chart, youexpect to see multiplelines but see only one.
If you are comparing several items but the line chart shows only oneline, it is likely that the items have the same value over the course of thecharted period. This situation may occur, for example, if multiple fansrun for 24 hours a day. To confirm this scenario, use the table.
See Equipment Runtime Report Content.You run a report wherethe values fall between0 and 1, but the y-axisdoes not show a value.
This behavior is normal when the values fall between 0 and 1. The topof the axis is 1.
In your report, theConsumption Rateor Demand Rate areblank even though youentered rates in theBilling Period view.
This problem occurs under the following circumstances:• If the units you select for Consumption Units cannot be converted
into the units used by the meter, the reports shows a blankConsumption Rate.
• If the units you select for Demand Units cannot be converted into theunits used by the meter, the report show a bland Demand Rate.
The Base Rate appears correctly.
Advanced Reporting System and Energy Essentials Help Guide116

Table 58: Energy Essentials Troubleshooting
Problem DescriptionYou are uncertain of thescope of a report whenyou do the following:• Select nothing in the
tree and attempt torun a report.
• Run a report thatincludes items thatno longer appear inthe tree (the reportincludes only invaliditems).
If you attempt to run a report without selecting items from the tree orto run a report for invalid/missing items, the report queries everythingin the tree. This behavior is expected. See Units Compatible with EnergyEssentials.
While attempting tomap folders in theEnergy Folders view,the following messageappears:Unable to retrieveenergy folderdata. Please tryagain. If theproblem continues,contact a Metasysadministrator forassistance.
To resolve this issue, log out of the reporting system and log back in.
While attempting tomap folders in theEnergy Folders view,the following messageappears after you clickSet or Clear:
Folder operationwas unable tocomplete due to anerror.
To resolve this issue, attempt to set or clear the folder again.
Reports do not use theappropriate DaylightSaving Time start/enddates for years prior tothe Daylight Saving Timeschedule change.
Energy Essentials reports use the new schedule, regardless of the yearused for the report.
For example, in 2006, Daylight Saving Time started on April 2 (the firstSunday in April) in the United States. In 2007 and later, Daylight SavingTime started on the second Sunday of March. If you run a report, itincludes 24 hours of data for April 2, 2006, and only 23 hours for thesecond Sunday in March, 2006.
117Advanced Reporting System and Energy Essentials Help Guide

Table 58: Energy Essentials Troubleshooting
Problem DescriptionNo charts appear in yourProduction reports.
This problem occurs when you select Other for a meter’s Utility in theEnergy/Utility Meter view.
To resolve this issue, select an appropriate Utility for the meter and tryto run the report again. See Energy/Utility Meter View Content.
After you route trends tothe ADX or ODS, the newtrends to not appear inthe Energy Essentialsreports immediately.
New trend samples do not appear in Energy Essentials reports until thestart of the next hour. For example:• If the ADX or ODS receives new trend data at 3:55, this data is not
available for reporting until 4:00.• If the ADX or ODS receives new trend data at 3:01, this data is not
available until 4:00.
You are not able toexport a report orexpand and contractfields.
Your session may have timed out, even though the report remainsdisplayed on the screen. See Timeout Period for details.
You change the unitsfor a point but the newunits do not appear inthe Energy Essentialsreports immediately.
Changing units requires additional steps before the new units appear inthe Energy Essentials reports.
If you would like unit changes to appear immediately, all incomingtrend information must use the new units. To achieve this result, routetrend information manually to the ADX or ODS database 3 to 4 timesuntil all new trend information uses the new units.
Note:• If you do not use the manual Route command, you also can wait
until 3 to 4 automatic trend routings occur.• New trends do not appear in the Energy Essentials reports until
the start of the next hour.
Some meters do notappear in the SimpleEnergy Cost Report.
You can select meters. However, some of the meter values are notincluded because the Billing Rate filter is excluding these meters. TheMeters are still listed in the Meter summary table.
Problem exporting largeProduction reports intoMicrosoft Excel.
If you export a large Production report (which includes all meter data)using Microsoft Excel, a website error message appears. This error isdue to the row size limitations of Microsoft Excel.
Advanced Reporting System and Energy Essentials Help Guide118

Table 58: Energy Essentials Troubleshooting
Problem DescriptionProblem exportingreports to PDF.
A website error message appears if you attempt to export a report toPDF and the reports contains large amounts of data. To export a largereport to PDF, you need to increase the session timeouts within SQLServer Reporting Services (SSRS). Use the query tool as follows:use ReportServerexec SetConfigurationInfo‘SessionAccessTimeout’, ‘3600’exec SetConfigurationInfo‘SessionTimeout’, ‘3600’SessionAccessTimeout corresponds to how long to wait when tryingto access session information before timing out. SessionTimeoutcorresponds to how long the session is kept alive between requests.
Note: By using this solution, the sessions within SSRS are keptalive longer. This configuration results in a higher usage ofresources over time, since more information must be retained.Also, these values affect all of SSRS, so any other applications thatuse SSRS may experience a change in session handling.
Energy Essentials Advanced Configuration Questions
This section contains information on complex scenarios and calculations used to generateinformation for Energy Essentials reports.Table 59: Advanced Configuration Questions
Question AnswerI have a meter with afluctuating Area Served Sizevalue. How do varying areavalues appear in reports andfactor into calculations?
In this scenario, the area appears in the header (Functional AreaServed) and Meter section of a report as the last value reported forthe meter. For calculations of energy intensity, the system uses aweighted average of the various area values.
For example:
In 2009, Meter 1 has an area of 500 for January, 100 for February,and 600 for March. For a report on this meter from 1/1/2009 -3/31/2009, the header and Meter section of the report show an areaof 600 (the last value reported), but the energy intensity calculationuses a weighted average of all three values (410).
119Advanced Reporting System and Energy Essentials Help Guide

Table 59: Advanced Configuration Questions
Question AnswerI am reporting on a meterfor a period that startsbefore a rate was associatedwith the meter and endsafter a rate is associated.What rate does the systemuse for the period?
In this scenario, the report uses the same first rate for the entireperiod.
For example:
A meter is associated with a rate of 1.0 on March 15. You want toreport from 3/1/09 to 3/31/09. The report uses the rate of 1.0 for theentire period, including the time from 3/1/09 to 3/14/09 when norate was associated with the meter.
Note: The Simple Energy Cost report Rate(s) table shows a rowfor each change to the rate. Changes include associations tometers, base rate changes, consumption rate changes, anddemand rate changes. In the preceding example, two rowswith a rate of 1.0 appear. The first row shows the rate used atthe start of the report. The second row shows the associationbetween the meter and a rate of 1.0.
I am reporting on a meterwith a start date definedfor its billing rate that startslater in time than the startdate defined in the billingrate itself and the metercollected data for thatearlier time frame. Howdoes the report handle this?
In this scenario, the report uses the billing rate for the earlier timeframe and ignores the meter setting for billing rate start date.
Advanced Reporting System and Energy Essentials Help Guide120
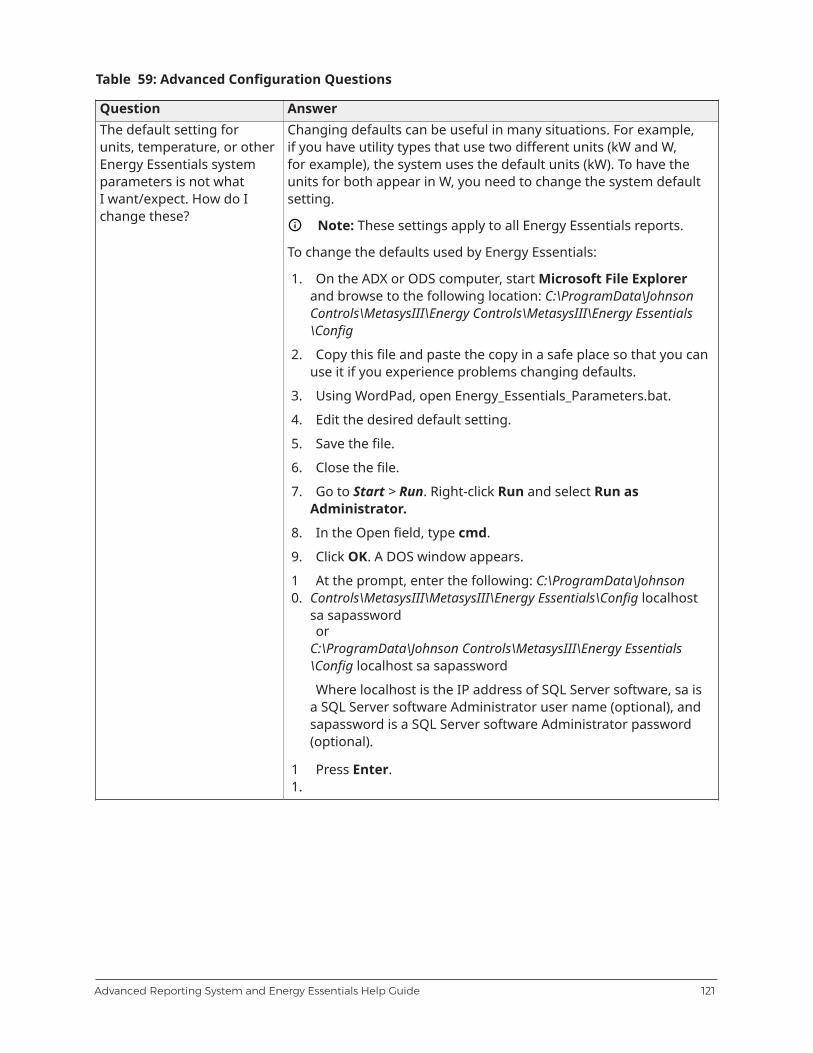
Table 59: Advanced Configuration Questions
Question AnswerThe default setting forunits, temperature, or otherEnergy Essentials systemparameters is not whatI want/expect. How do Ichange these?
Changing defaults can be useful in many situations. For example,if you have utility types that use two different units (kW and W,for example), the system uses the default units (kW). To have theunits for both appear in W, you need to change the system defaultsetting.
Note: These settings apply to all Energy Essentials reports.
To change the defaults used by Energy Essentials:
1. On the ADX or ODS computer, start Microsoft File Explorerand browse to the following location: C:\ProgramData\JohnsonControls\MetasysIII\Energy Controls\MetasysIII\Energy Essentials\Config
2. Copy this file and paste the copy in a safe place so that you canuse it if you experience problems changing defaults.
3. Using WordPad, open Energy_Essentials_Parameters.bat.
4. Edit the desired default setting.
5. Save the file.
6. Close the file.
7. Go to Start > Run. Right-click Run and select Run asAdministrator.
8. In the Open field, type cmd.
9. Click OK. A DOS window appears.
10.
At the prompt, enter the following: C:\ProgramData\JohnsonControls\MetasysIII\MetasysIII\Energy Essentials\Config localhostsa sapasswordor
C:\ProgramData\Johnson Controls\MetasysIII\Energy Essentials\Config localhost sa sapassword
Where localhost is the IP address of SQL Server software, sa isa SQL Server software Administrator user name (optional), andsapassword is a SQL Server software Administrator password(optional).
11.
Press Enter.
121Advanced Reporting System and Energy Essentials Help Guide
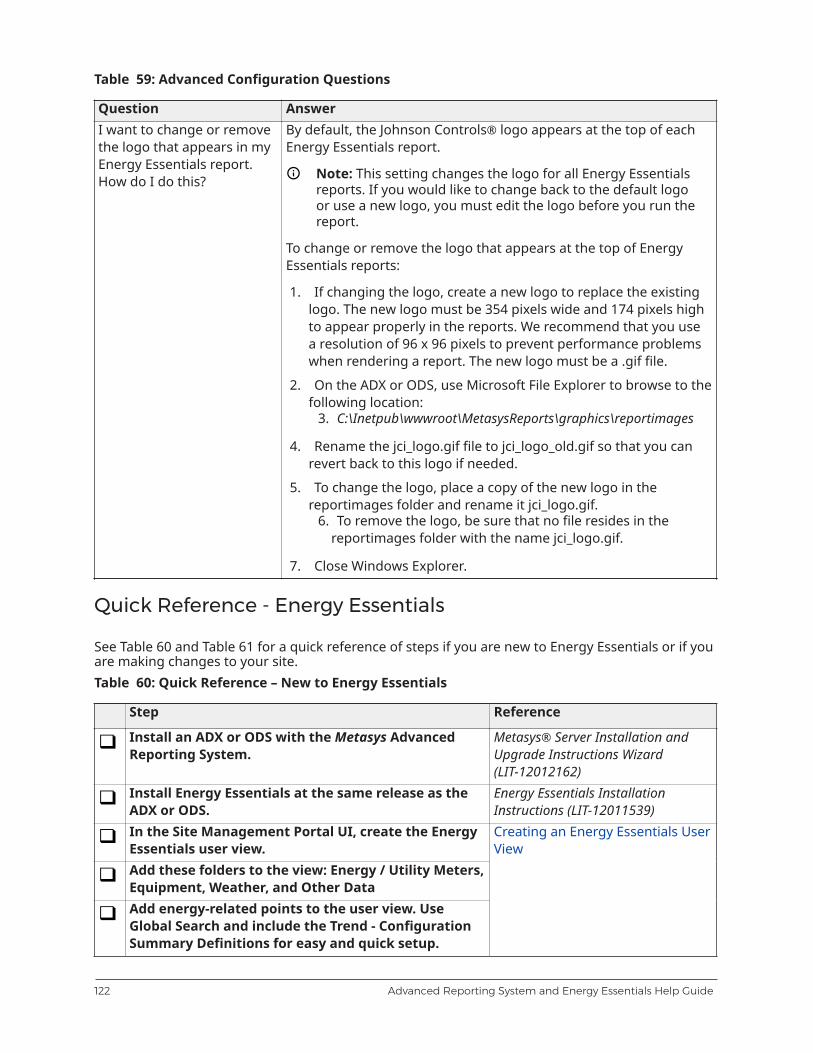
Table 59: Advanced Configuration Questions
Question AnswerI want to change or removethe logo that appears in myEnergy Essentials report.How do I do this?
By default, the Johnson Controls® logo appears at the top of eachEnergy Essentials report.
Note: This setting changes the logo for all Energy Essentialsreports. If you would like to change back to the default logoor use a new logo, you must edit the logo before you run thereport.
To change or remove the logo that appears at the top of EnergyEssentials reports:
1. If changing the logo, create a new logo to replace the existinglogo. The new logo must be 354 pixels wide and 174 pixels highto appear properly in the reports. We recommend that you usea resolution of 96 x 96 pixels to prevent performance problemswhen rendering a report. The new logo must be a .gif file.
2. On the ADX or ODS, use Microsoft File Explorer to browse to thefollowing location:
3. C:\Inetpub\wwwroot\MetasysReports\graphics\reportimages
4. Rename the jci_logo.gif file to jci_logo_old.gif so that you canrevert back to this logo if needed.
5. To change the logo, place a copy of the new logo in thereportimages folder and rename it jci_logo.gif.
6. To remove the logo, be sure that no file resides in thereportimages folder with the name jci_logo.gif.
7. Close Windows Explorer.
Quick Reference - Energy Essentials
See Table 60 and Table 61 for a quick reference of steps if you are new to Energy Essentials or if youare making changes to your site.Table 60: Quick Reference – New to Energy Essentials
Step Reference
Install an ADX or ODS with the Metasys AdvancedReporting System.
Metasys® Server Installation andUpgrade Instructions Wizard(LIT-12012162)
Install Energy Essentials at the same release as theADX or ODS.
Energy Essentials InstallationInstructions (LIT-12011539)
In the Site Management Portal UI, create the EnergyEssentials user view.Add these folders to the view: Energy / Utility Meters,Equipment, Weather, and Other DataAdd energy-related points to the user view. UseGlobal Search and include the Trend - ConfigurationSummary Definitions for easy and quick setup.
Creating an Energy Essentials UserView
Advanced Reporting System and Energy Essentials Help Guide122

Table 60: Quick Reference – New to Energy Essentials
Step Reference
Upload the database archive to the SCT.
Wait for the default reporting system refresh (3:15A.M.) or perform a manual refresh.In the reporting system user interface, on the EnergySetup tab Energy Folders view, map folders in theEnergy Essentials view.Click Populate.
Mapping Energy Essentials Points
In the reporting system user interface, on the EnergySetup tab Billing Period view, set the billing periodsfor the site.In the reporting system user interface, on the EnergySetup tab Billing Rate view, set the billing rates forthe site.Verify values exist in the Energy/Utility Meter viewfor the following:• Category• Subcategory• Utility• Physical Location• Billing Rate (using values configured in the Billing
Rate view)• Billing Period (using values configured in the
Billing Period view)• Outdoor Air Humidity• Outdoor Air TemperatureUse the multi-edit feature to configure values asneeded.Verify the Equipment view has a Physical Locationvalue.
Configuring Energy EssentialsReport Information
Table 61: Quick Reference - Changes to Energy Essentials
Step Reference
Note: Changes you might make to your site configuration include expansion of buildings andaddition of new meters. If you make these changes, use this checklist to make sure that yourchanges follow through to the Energy Essentials reports.
Complete your configuration changes in the onlineSite Management Portal UI or SCT.If you made your changes in the online user interface,upload your changes to the SCT archive.Wait for the default reporting system refresh at 3:15A.M. or perform a reporting system manual refresh.
ADX/ODS and SCT Interaction
123Advanced Reporting System and Energy Essentials Help Guide

Table 61: Quick Reference - Changes to Energy Essentials
Step Reference
In the reporting system user interface, on the EnergySetup tab Energy Folders view, click Populate.
Report Screen Content
Related Documentation
The following table lists documentation related to the Metasys Advanced Reporting System andEnergy Essentials.Table 62: Advanced Reporting System and Energy Essentials Documentation
For Information On See DocumentUnderstanding the Metasys System Metasys® System Configuration Guide (LIT-12011832)
Metasys® SMP Help (LIT-1201793)Note: This LIT number represents a printer-friendlyversion of the Help.
Using the Metasys System SiteManagement Portal User Interface
Open Data Server Help (LIT-12011942)Using the SCT Metasys® SCT Help (LIT-12011964)
Metasys® Server Installation and Upgrade InstructionsWizard (LIT-12012162)
Note: Use the wizard to generate instructionsspecific to your system.
Installing and Configuring theMetasys Advanced Reporting Systemor Upgrading the Metasys AdvancedReporting System
ODS Installation and Upgrade Instructions Wizard(LIT-12011945)
Note: Use the wizard to generate instructionsspecific to your system.
Adding Language Support for theReporting System
Language Installation Program Help (LIT-12011349)
Installing Energy Essentials Energy Essentials Installation Instructions (LIT-12011539)Backing up and Restoring theMetasys Reporting Database
Metasys® Database Manager Help (LIT-12011202)Note: This LIT number represents a printer-friendlyversion of the Help.
ADS/ADX Commissioning Guide (LIT-1201645)Changing the Timeout PeriodODS Commissioning Guide (LIT-12011944)
Setting up User Accountsand Authorization for theReporting System in the SecurityAdministration System
Security Administrator System Technical Bulletin(LIT-1201528)
Installing the Launcher Application Launcher Installation Instructions (LIT-12011783)Using the Launcher Launcher Tool Help (LIT-12011742)
© 2018 Johnson Controls. All rights reserved. All specifications and other information shown were current as of documentrevision and are subject to change without notice.
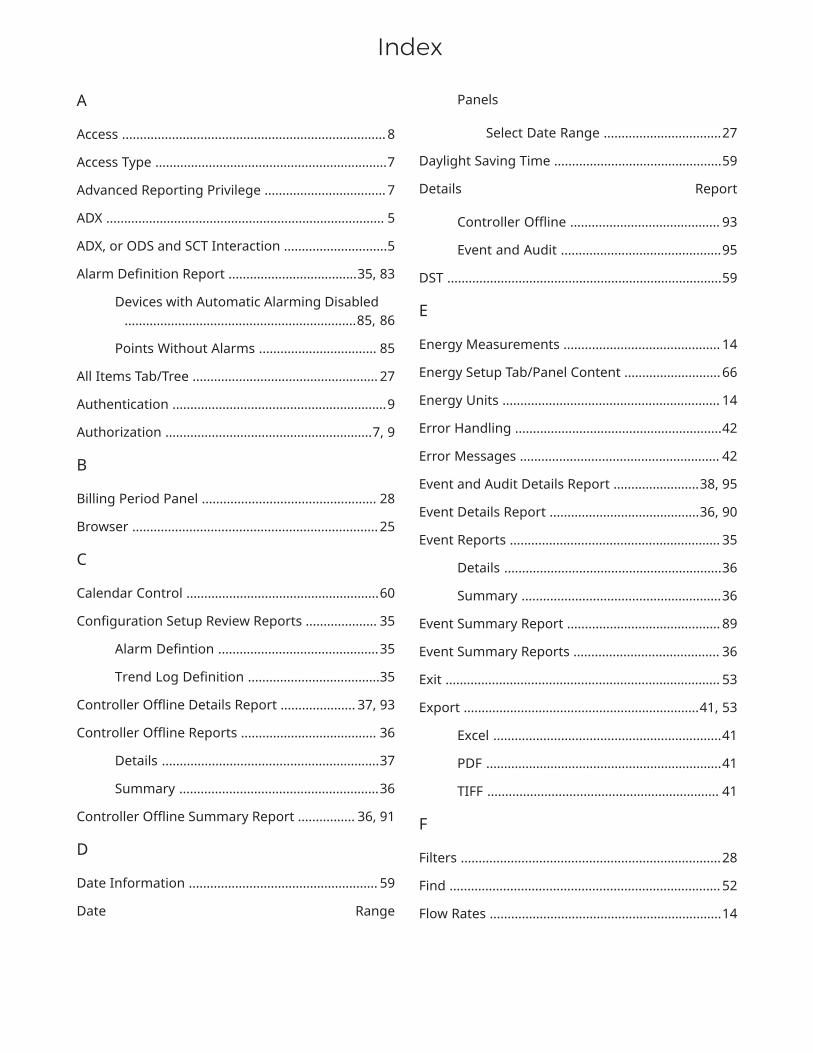
IndexA
Access .......................................................................... 8
Access Type .................................................................7
Advanced Reporting Privilege .................................. 7
ADX .............................................................................. 5
ADX, or ODS and SCT Interaction .............................5
Alarm Definition Report ....................................35, 83
Devices with Automatic Alarming Disabled.................................................................85, 86
Points Without Alarms ................................. 85
All Items Tab/Tree .................................................... 27
Authentication ............................................................9
Authorization ..........................................................7, 9
B
Billing Period Panel ................................................. 28
Browser ..................................................................... 25
C
Calendar Control ......................................................60
Configuration Setup Review Reports .................... 35
Alarm Defintion .............................................35
Trend Log Definition .....................................35
Controller Offline Details Report ..................... 37, 93
Controller Offline Reports ...................................... 36
Details .............................................................37
Summary ........................................................36
Controller Offline Summary Report ................ 36, 91
D
Date Information ..................................................... 59
Date Range
Panels
Select Date Range .................................27
Daylight Saving Time ...............................................59
Details Report
Controller Offline .......................................... 93
Event and Audit .............................................95
DST .............................................................................59
E
Energy Measurements ............................................ 14
Energy Setup Tab/Panel Content ........................... 66
Energy Units ............................................................. 14
Error Handling ..........................................................42
Error Messages ........................................................ 42
Event and Audit Details Report ........................38, 95
Event Details Report ..........................................36, 90
Event Reports ........................................................... 35
Details .............................................................36
Summary ........................................................36
Event Summary Report ........................................... 89
Event Summary Reports ......................................... 36
Exit ............................................................................. 53
Export ..................................................................41, 53
Excel ................................................................41
PDF ..................................................................41
TIFF ................................................................. 41
F
Filters .........................................................................28
Find ............................................................................ 52
Flow Rates .................................................................14
Index

I
Intervals .................................................................... 17
L
Log off ....................................................................... 54
Login ......................................................................9, 44
Login Screen .............................................................55
M
Metasys Advanced Reporting System ..................... 5
Multipliers .................................................................39
O
Objects ...................................................................... 59
ODS ..............................................................................5
Other Filters Panel ...................................................28
Other Filters Panel Content ....................................62
P
Panels
Billing Period ................................................. 29
Other Filters ...................................................28
Other Filters Panel Content ......................... 62
Report Selection ............................................57
Select Date Range Panel Content ............... 59
Select Objects ................................................ 27
Select Objects Panel Content ...................... 59
Password ...................................................................44
Persistence ............................................................... 42
Point Mapping ..........................................................47
Points without Trends ............................................. 88
Preferences ...............................................................42
Print ........................................................................... 53
Privileges .....................................................................7
R
Report ........................................................................34
Report Screen ...........................................................32
Report Screen Content ............................................83
Report Selection Panel ............................................ 26
Report Selection Panel Content ............................. 57
Report Selection Screen ..........................................23
Report Selection Tree .............................................. 26
Report Services ...........................................................7
Report Steps
Cancel Report ................................................ 52
Exit a Report .................................................. 53
Export a Report ............................................. 53
Print Report ................................................... 53
Read Reports ................................................. 36
Refresh Advanced Reporting SystemManually ...................................................... 54
Run Report .....................................................50
Save Report ....................................................53
Search Reports .............................................. 52
View Report ................................................... 51
Report Toolbar ......................................................... 34
Report Types .............................................................35
Report Window ........................................................ 32
Reports ................................................................26, 35
Alarm Definition ............................................35
Configuration Setup Review ........................ 35
Controller Offline Details Reports ...............37
Controller Offline Reports ............................36
Index
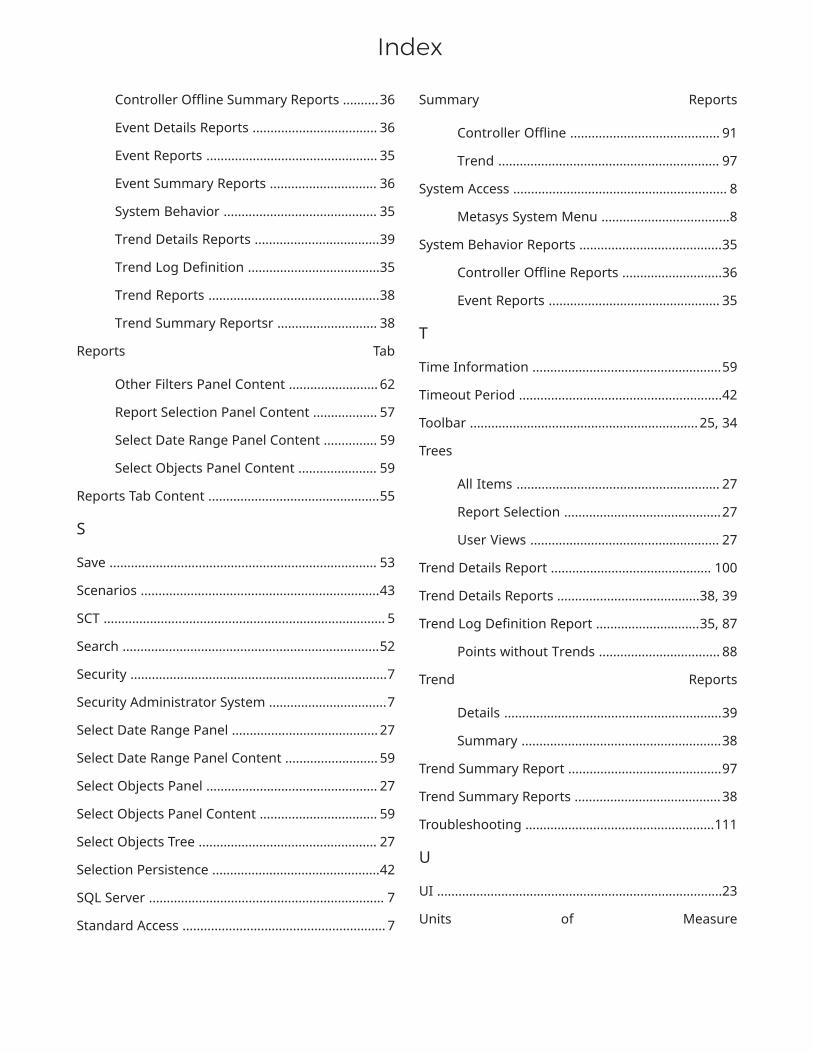
Controller Offline Summary Reports ..........36
Event Details Reports ................................... 36
Event Reports ................................................ 35
Event Summary Reports .............................. 36
System Behavior ........................................... 35
Trend Details Reports ...................................39
Trend Log Definition .....................................35
Trend Reports ................................................38
Trend Summary Reportsr ............................ 38
Reports Tab
Other Filters Panel Content ......................... 62
Report Selection Panel Content .................. 57
Select Date Range Panel Content ............... 59
Select Objects Panel Content ...................... 59
Reports Tab Content ................................................55
S
Save ........................................................................... 53
Scenarios ...................................................................43
SCT ............................................................................... 5
Search ........................................................................52
Security ........................................................................7
Security Administrator System .................................7
Select Date Range Panel ......................................... 27
Select Date Range Panel Content .......................... 59
Select Objects Panel ................................................ 27
Select Objects Panel Content ................................. 59
Select Objects Tree .................................................. 27
Selection Persistence ...............................................42
SQL Server .................................................................. 7
Standard Access ......................................................... 7
Summary Reports
Controller Offline .......................................... 91
Trend .............................................................. 97
System Access ............................................................ 8
Metasys System Menu ....................................8
System Behavior Reports ........................................35
Controller Offline Reports ............................36
Event Reports ................................................ 35
T
Time Information .....................................................59
Timeout Period .........................................................42
Toolbar ................................................................ 25, 34
Trees
All Items ......................................................... 27
Report Selection ............................................27
User Views ..................................................... 27
Trend Details Report ............................................. 100
Trend Details Reports ........................................38, 39
Trend Log Definition Report .............................35, 87
Points without Trends .................................. 88
Trend Reports
Details .............................................................39
Summary ........................................................38
Trend Summary Report ...........................................97
Trend Summary Reports .........................................38
Troubleshooting .....................................................111
U
UI ................................................................................23
Units of Measure
Index
Electricity ........................................................14
Energy ............................................................ 14
Flow Rate ........................................................14
Weather Units ............................................... 14
URL ...............................................................................8
User Interface .......................................................... 23
Toolbar ........................................................... 25
Web Browser Tools .......................................25
User name .................................................................. 9
User Views Tab/Tree ................................................ 27
W
Weather Units .......................................................... 14
Web Browser Tools .................................................. 25
Week Numbering .....................................................59
Workflow ...................................................................43
Energy Essentials ............................................ 9
Index