Embed Size (px)
Citation preview
MichiganMichigan TourismTourism 2002:2002: YearYear InIn ReviewReview
LoriLori A.A. MartinMartin && CharlesCharles ShihShih
MichiganMichigan Travel,Travel, TourismTourism && RecreationRecreation ResourceResource

CenterCenter
MarchMarch 5,5, 20032003
Perc
ent C
hang
e
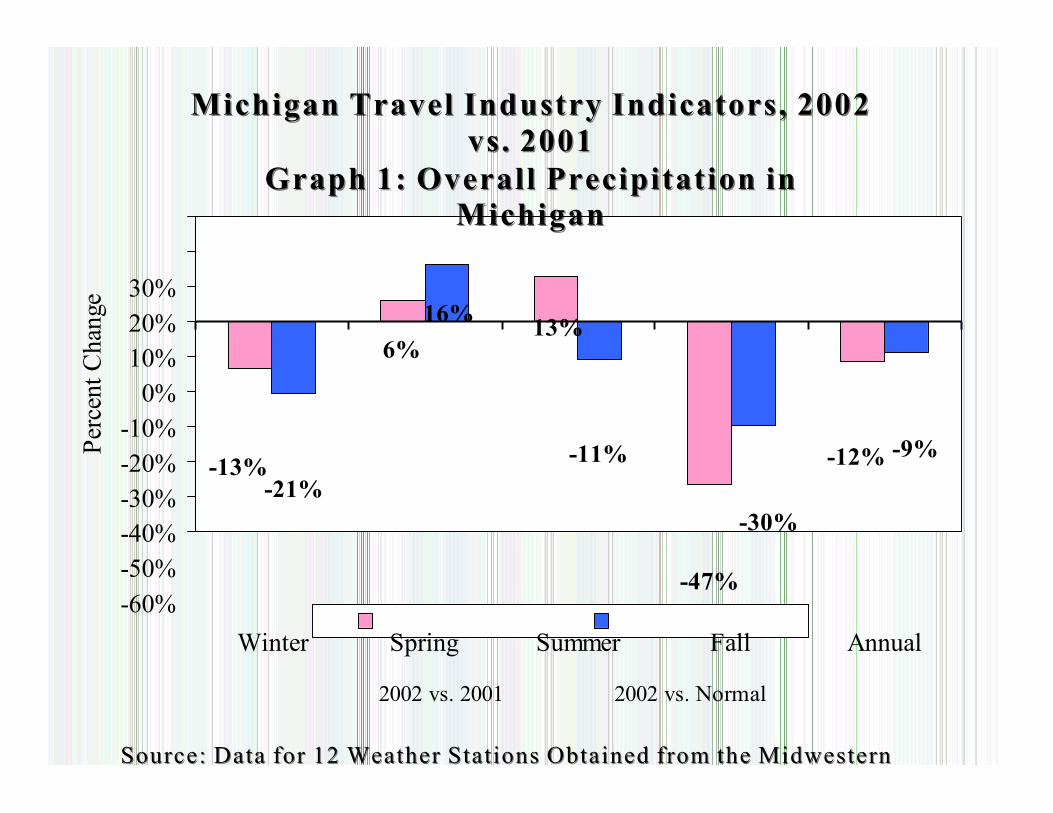
MichiganMichigan TravelTravel IndustryIndustry Indicators,Indicators, 20022002 vs.vs. 20012001
GraphGraph 1:1: OverallOverall PrecipitationPrecipitation inin MichiganMichigan
30% 20% 10%
0% -10% -20% -30% -40% -50% -60%
-13% -21%
16%
6%
13%
-11%
-30% -47%
-12% -9%
Winter Spring Summer Fall Annual
2002 vs. 2001 2002 vs. Normal
Source:Source: DataData forfor 1212 WeatherWeather StationsStations ObtainedObtained fromfrom thethe MidwesteMidweste rrnn
ClimateClimate CenterCenter
March 5, 2003 Michigan Travel, Tourism & Recreation Resource Center 2
Perc
ent C
hang
e
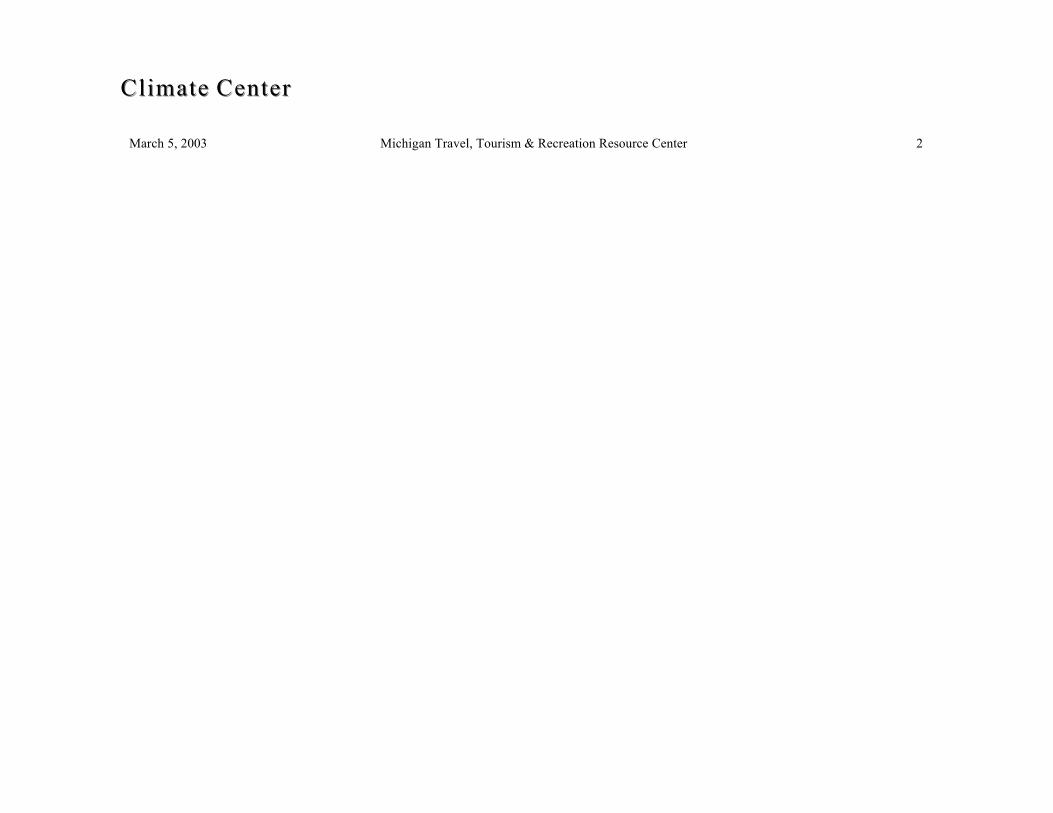
MichiganMichigan TravelTravel IndustryIndustry Indicators,Indicators, 20022002 vs.vs. 20012001
GraphGraph 2:2: AverageAverage MaximumMaximum TemperaturesTemperatures inin MichiganMichigan
30% 25% 20% 15% 10% 5% 0%
-5% -10% -15%
22%
5%
-8%
-6%
1% 3%
-4%
-1%
2%
-2%
Winter Spring Summer Fall Annual
2002 vs. 2001 2002 vs. Normal
Source:Source: DataData forfor 1212 WeatherWeather StationsStations ObtainedObtained fromfrom thethe MidwesteMidweste rrnn

ClimateClimate CenterCenter
March 5, 2003 Michigan Travel, Tourism & Recreation Resource Center 3
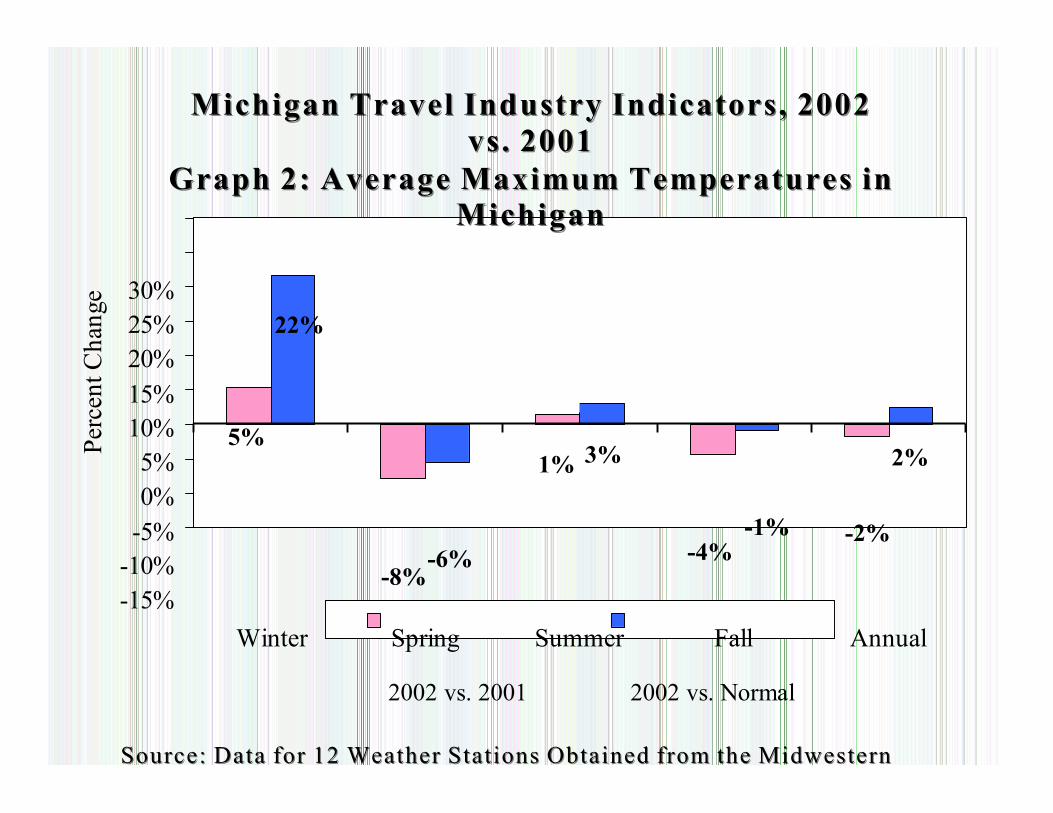
MichiganMichigan TravelTravel IndustryIndustry Indicators,Indicators, 20022002 vs.vs. 20012001
GraphGraph 3:3: EconomicEconomic IndicatorsIndicators
-33.1%
-7.6%
-7.1%
-1.0% -9.2%
2.2%
1.3%
17.7%
MichiganMichigan RegularRegular UnUn ll ee adedaded GasolineGasoline PricesPrices
(Nominal)(Nominal) NationalNational RegularRegular UnleadedUnleaded GasolineGasoline
PricesPrices (Real)(Real) RestaurantRestaurant PricesPrices (Detroit/Ann(Detroit/Ann
ArboArbo rr /Flint)/Flint)
LodgingLodging PrPr ii cesces (U.S.(U.S. CityCity
Average)Average) ExpecExpec tt ationsations IndexIndex
(EI)(EI)
PresentPresent SituationSituation IndexIndex (P(P SSI)I)
ConsuConsu mmerer ConfidenConfidencc ee IndexIndex (((CCCooommmpppooosssiiittteee ofof EIEI
andand PSI)PSI) ExchangeExchange RateRate $Can/$US$Can/$US ($($ UUSS
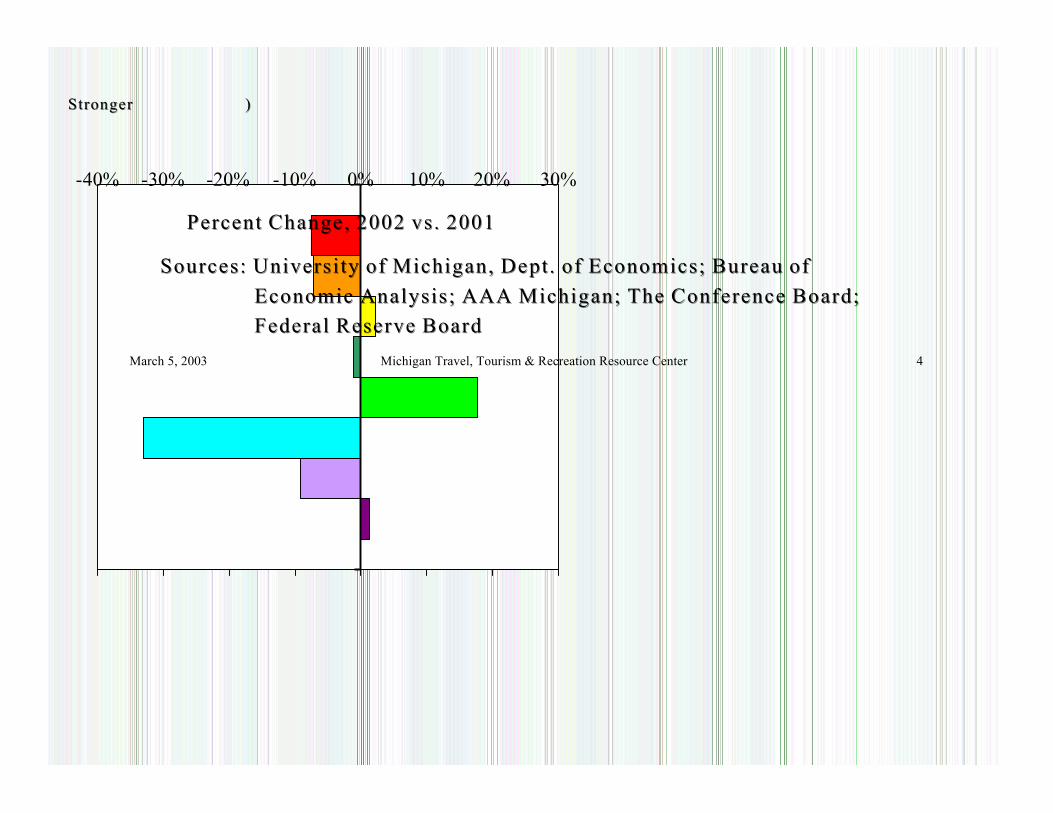
StrongerStronger ))
-40% -30% -20% -10% 0% 10% 20% 30%
PercentPercent CC hh ange,ange, 20022002 vs.vs. 20012001
Sources:Sources: UniversityUniversity ofof Michigan,Michigan, DD ee pt.pt. ofof EE cc onomics;onomics; BureauBureau ofof EE conomicconomic AnalysiAnalysi ss ;; AAAAAA Michigan;Michigan; TheThe ConferenceConference Board;Board; FederalFederal ReserveReserve BoardBoard
March 5, 2003 Michigan Travel, Tourism & Recreation Resource Center 4
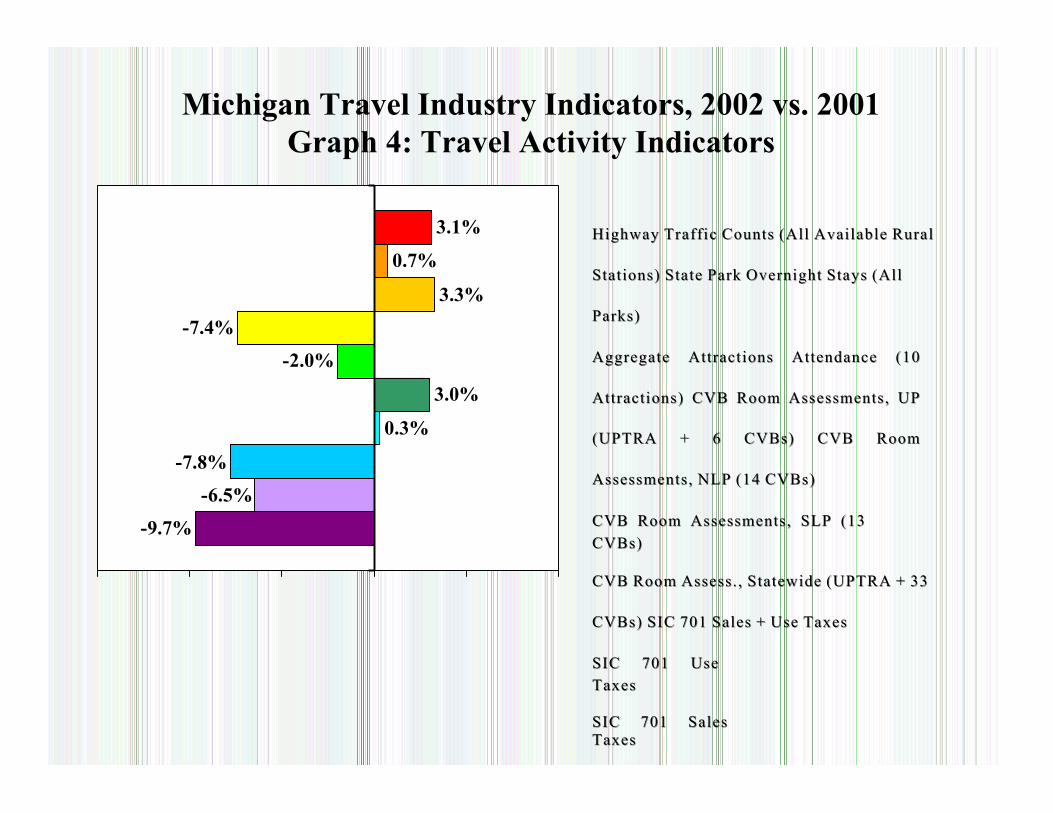
Michigan Travel Industry Indicators, 2002 vs. 2001 Graph 4: Travel Activity Indicators
-7.4%
-7.8%
-6.5%
-9.7%
-2.0%
3.1%
0.7%
3.3%
3.0%
0.3%
HighwayHighway TTrr affaff ii cc CountsCounts (All(All AvailAvail aa bleble RurRur aa ll
Stations)Stations) StateState ParkPark OvernightOvernight StSt aa ysys (All(All
Parks)Parks)
AggregateAggregate AttracAttrac tt ii onsons AttendanAttendancc ee (10(10
AttractAttract ii ons)ons) CVBCVB RoRo oo mm Assessments,Assessments, UPUP
(( UUPTRAPTRA ++ 66 CVBs)CVBs) CVBCVB RoRo oo mm
Assessments,Assessments, NLPNLP (14(14 CVBs)CVBs)
CVBCVB RoRo oo mm Assessments,Assessments, SLPSLP (13(13 CVBs)CVBs) CVBCVB RoRo oo mm Assess.,Assess., StatewideStatewide (UP(UP TT RARA ++ 3333
CVBs)CVBs) SICSIC 701701 SalesSales ++ UUsese TTaa xesxes
SICSIC 701701 UUsese TaxesTaxes SICSIC 701701 SalesSales TaxesTaxes
-15% -10% -5% 0% 5% 10%
PercentPercent CC hh ange,ange, 20022002 vs.vs. 20012001
SoSo uurr ces:ces: MDOT;MDOT; MDNR,MDNR, ParksParks && Recreation;Recreation; MM ii chiganchigan HiHi ss toricaltorical MM uu ss ee uu m;m; USUS NPS;NPS; SooSoo Locks;Locks; FlintFlint CulturalCultural Center;Center; MSUMSU TourismTourism Center;Center; MM ii chiganchigan DeptDept ofof Treasury,Treasury, OfficeOffice ofof RevenueRevenue && TaxTax AnalysisAnalysis
March 5, 2003 Michigan Travel, Tourism & Recreation Resource Center 5
Perc
ent C
hang
e
Jan
Feb
Mar
A
pr
May
Ju
n Jul
Aug
Se
p O
ct
Nov
D
ec
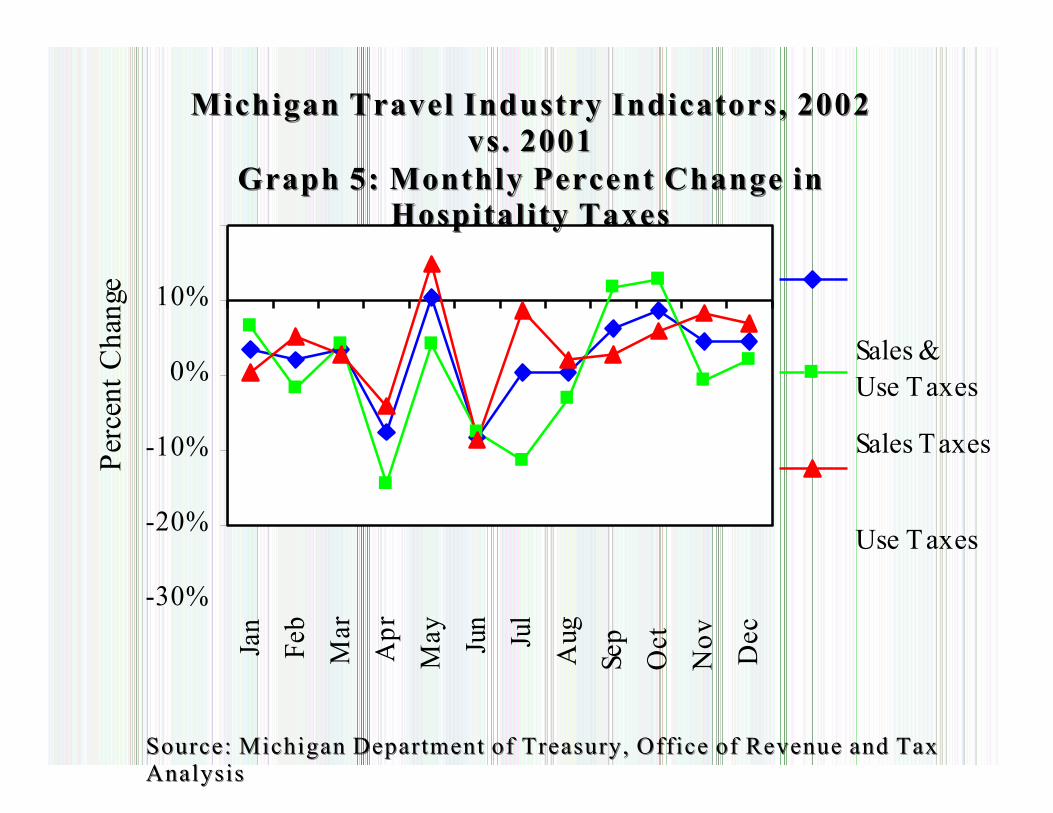
MichiganMichigan TravelTravel IndustryIndustry Indicators,Indicators, 20022002 vs.vs. 20012001
GraphGraph 5:5: MonthlyMonthly PercentPercent ChangeChange inin HospitalityHospitality TaxesTaxes
10%
0%
-10%
-20%
-30%
Sales & Use T axes
Sales T axes
Use T axes
Source:Source: MichiganMichigan DepartmentDepartment ofof Treasury,Treasury, OfficeOffice ofof RevenueRevenue andand TTaxax AnalysisAnalysis

March 5, 2003 Michigan Travel, Tourism & Recreation Resource Center 6
P e r c
e n t C
h a ng
e
Ja n
Fe b
M a r
A p r
M a y
Ju n Ju l
A u g
Se
p
O c
t
N o v
D e c
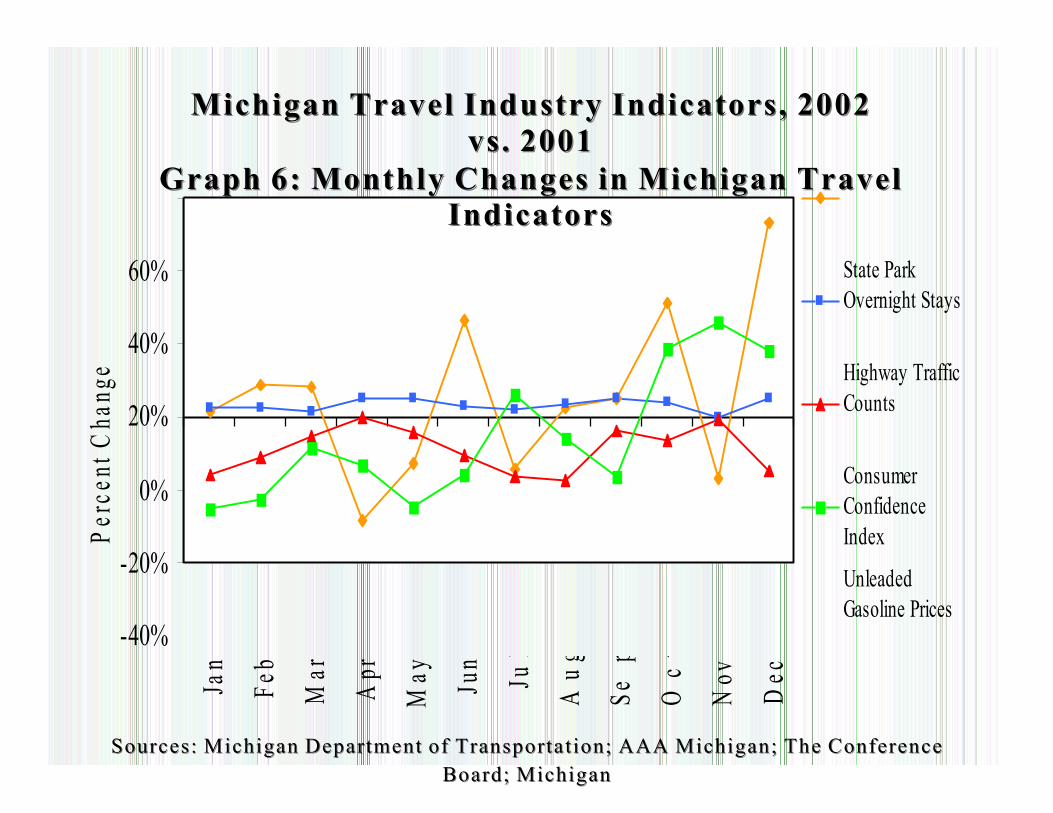
MichiganMichigan TravelTravel IndustryIndustry Indicators,Indicators, 20022002 vs.vs. 20012001
GraphGraph 6:6: MonthlyMonthly ChangesChanges inin MichiganMichigan TravelTravel IndicatorsIndicators
60%
40%
20%
0%
-20%
-40%
State Park Overnight Stays Highway Traffic Counts Consumer Confidence Index
Unleaded Gasoline Prices
Sources:Sources: MM ichiganichigan DepartmentDepartment ofof TransportTransport aa tt ion;ion; AAAAAA Michigan;Michigan; TT hh ee CoCo nferencenference BB oo aa rr d;d; MichiganMichigan
DepartmentDepartment ofof NaturalNatural ReRe ss ources,ources, BB uu reaureau ofof ParksParks andand RecreationRecreation
March 5, 2003 Michigan Travel, Tourism & Recreation Resource Center 7
Perc
ent C
hang
e
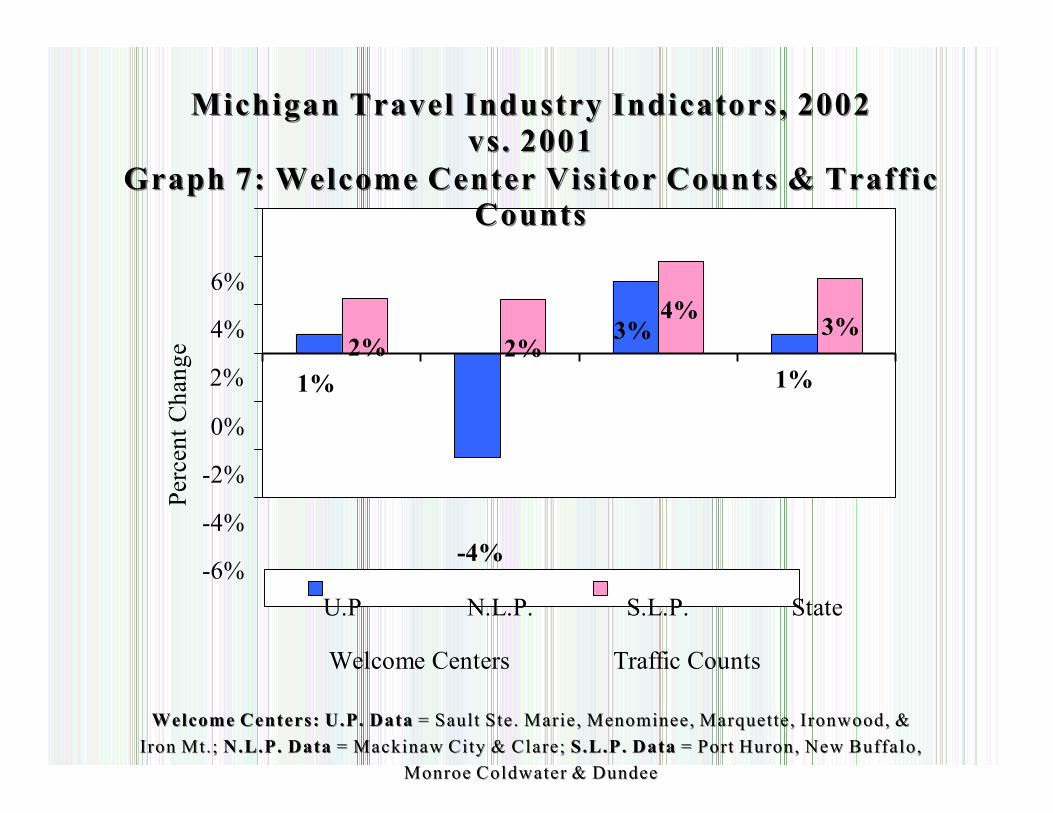
MichiganMichigan TravelTravel IndustryIndustry Indicators,Indicators, 20022002 vs.vs. 20012001
GraphGraph 7:7: WelcomeWelcome CenterCenter VisitorVisitor CountsCounts && TrafficTraffic CountsCounts
6%
4% 2%
2% 1%
0%
-2%
-4%
-6%
4% 3% 3%
2% 1%
-4%
U.P N.L.P. S.L.P. State
Welcome Centers Traffic Counts
WW eelcomelcome Centers:Centers: U.P.U.P. DataData == SaultSault Ste.Ste. Marie,Marie, MM eenono mm inee,inee, Marquette,Marquette, Ironwood,Ironwood, && IronIron Mt.;Mt.; N.L.P.N.L.P. DataData == MaMa ckinawckinaw CityCity && CC ll are;are; S.L.P.S.L.P. DataData == PortPort Huron,Huron, NewNew Buffalo,Buffalo,
MonroeMonroe ColdwaterColdwater && DundeeDundee
Source:Source: TravelTravel Michigan,Michigan, MichiganMichigan DepartmentDepartment ofof TransportationTransportation
March 5, 2003 Michigan Travel, Tourism & Recreation Resource Center 8
Perc
ent C
hang
e
Jan
Feb
Mar
Apr
May
Jun
Jul
Aug
Sept
Oct
Nov
Dec
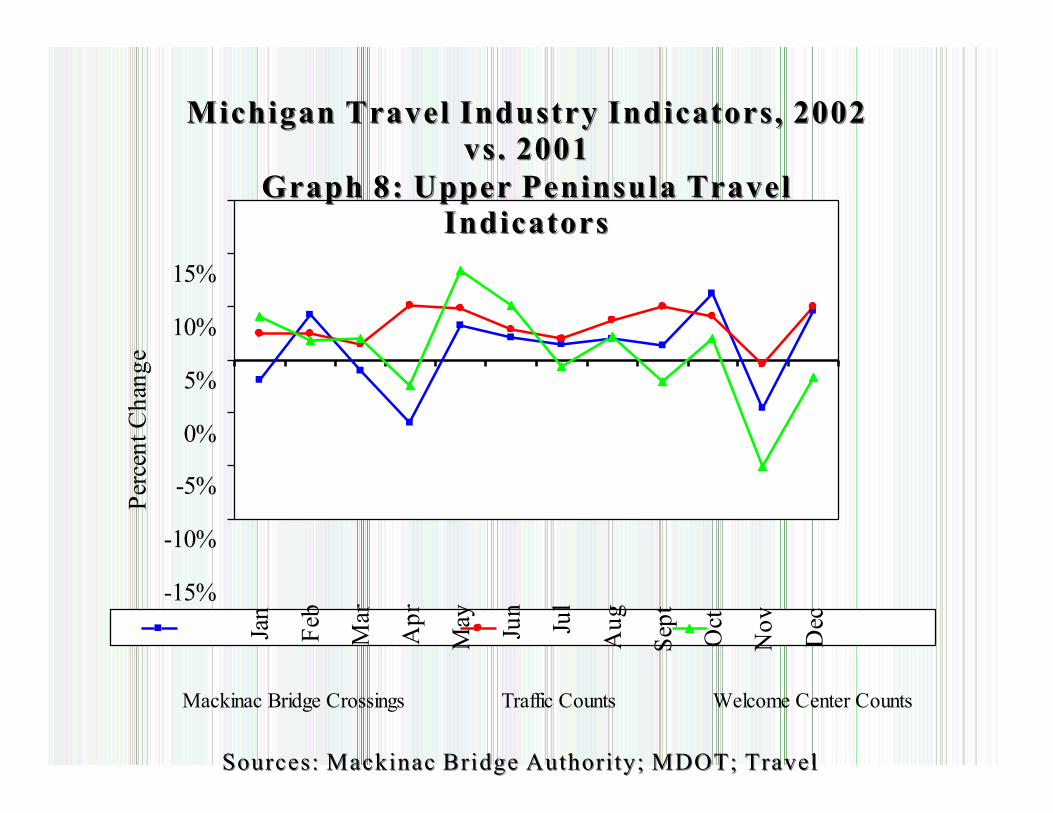
MichiganMichigan TravelTravel IndustryIndustry Indicators,Indicators, 20022002 vs.vs. 20012001
GraphGraph 8:8: UpperUpper PeninsulaPeninsula TravelTravel IndicatorsIndicators
15%
10%
5%
0%
-5%
-10%
-15%
Mackinac Bridge Crossings Traffic Counts Welcome Center Counts
Sources:Sources: MackinacMackinac BridgeBridge Authority;Authority; MDOT;MDOT; TravelTravel
MichiganMichigan
March 5, 2003 Michigan Travel, Tourism & Recreation Resource Center 9
Perc
ent C
hang
e
Jan
Feb
M ar
Ap r
M ay
Jun
July
Aug
Sep
Oct
Nov
Dec
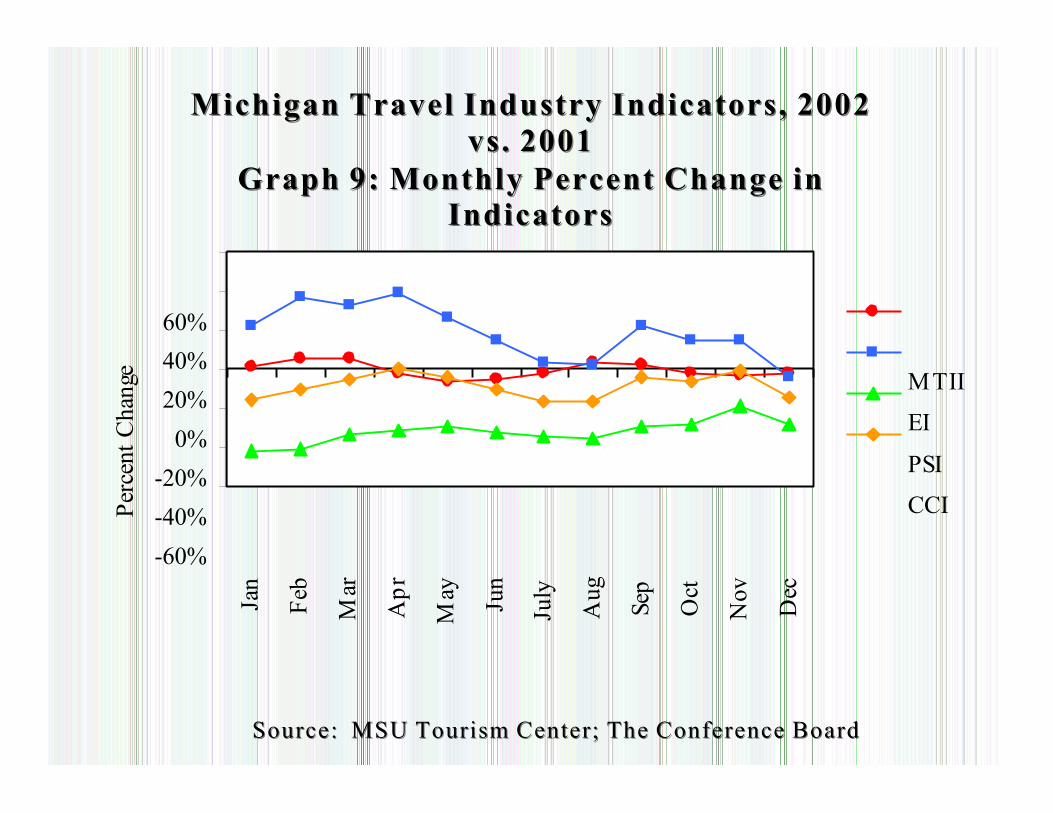
MichiganMichigan TravelTravel IndustryIndustry Indicators,Indicators, 20022002 vs.vs. 20012001
GraphGraph 9:9: MonthlyMonthly PercentPercent ChangeChange inin IndicatorsIndicators
60%
40%
20%
0%
-20%
-40%
-60%
MTII
EI
PSI
CCI
SouSou rce:rce: MSUMSU TourismTourism Center;Center; TheThe ConferenceConference BoardBoard
March 5, 2003 Michigan Travel, Tourism & Recreation Resource Center 10
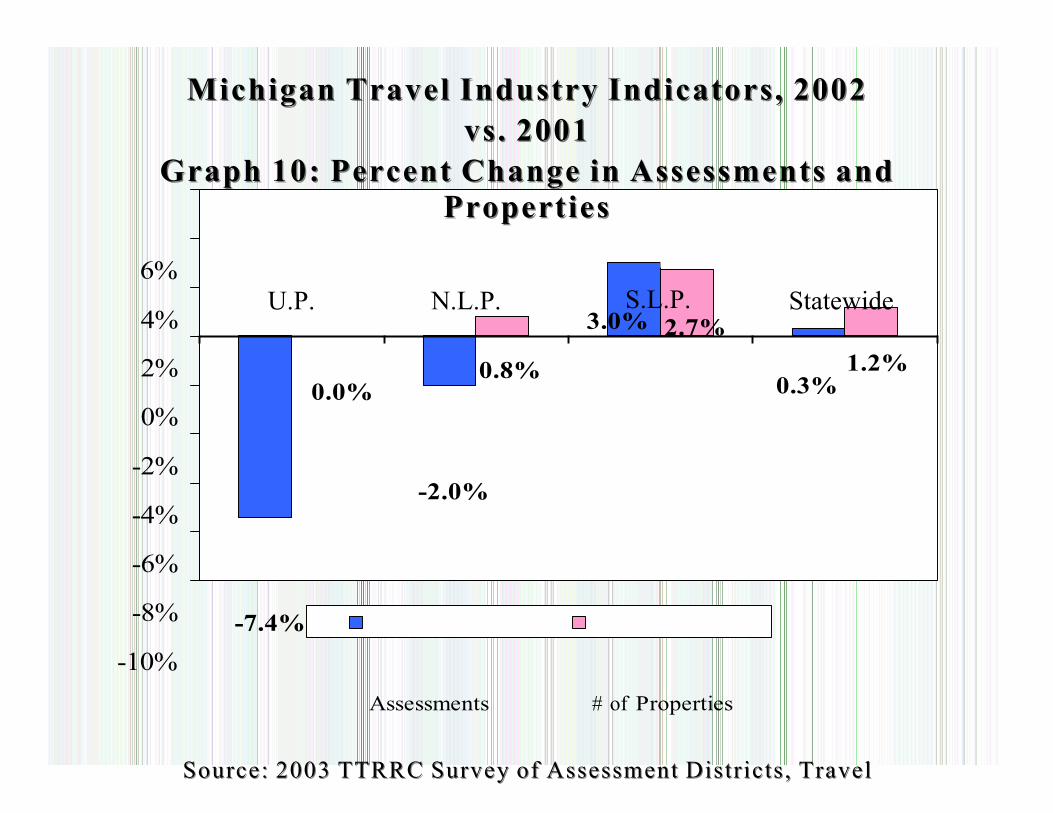
MichiganMichigan TravelTravel IndustryIndustry Indicators,Indicators, 20022002 vs.vs. 20012001
GraphGraph 10:10: PercentPercent ChangeChange inin AssessmentsAssessments andand PropertiesProperties
6% U.P. N.L.P. S.L.P. Statewide
4%
2%
0%
-2%
-4%
-6%
-8% -10%
-7.4%
0.0%
0.8%
-2.0%
3.0% 2.7%
0.3%
1.2%
Assessments # of Properties
Source:Source: 20032003 TTRRCTTRRC SurveySurvey ofof AssessmentAssessment Districts,Districts, TravelTravel
MichiMichigganan
March 5, 2003 Michigan Travel, Tourism & Recreation Resource Center 11
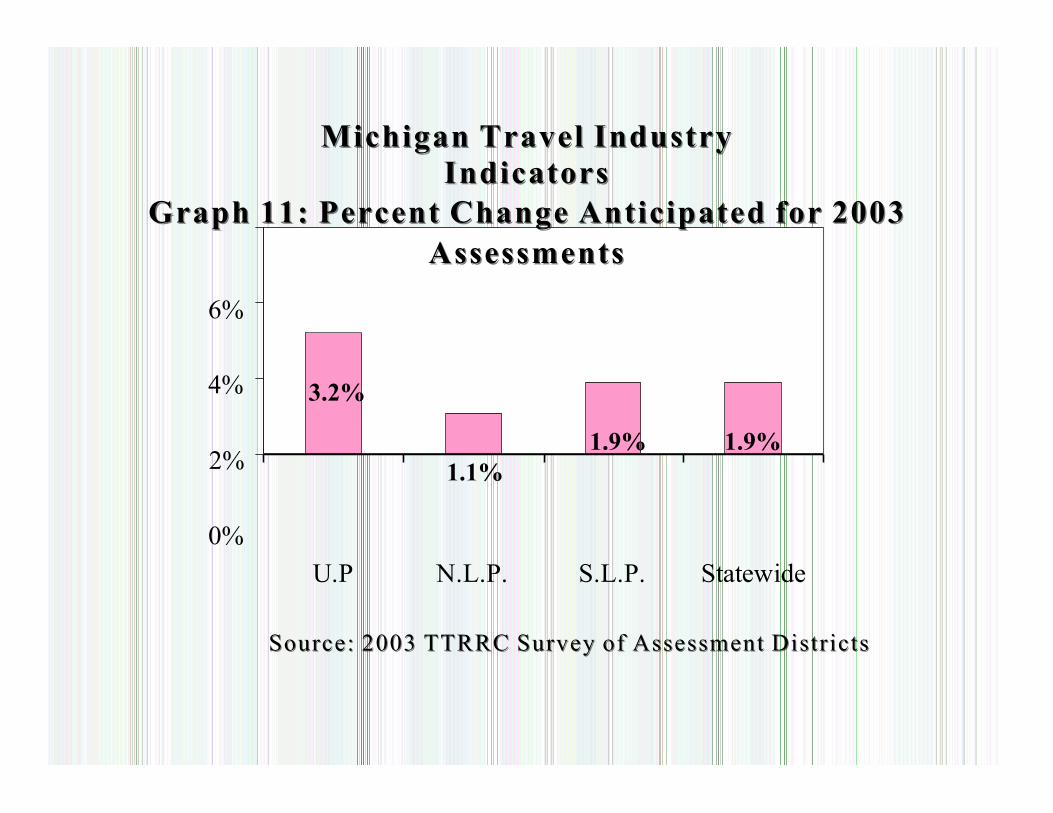
MichiganMichigan TravelTravel IndustryIndustry IndicatorsIndicators
GraphGraph 11:11: PercentPercent ChangeChange AnticipatedAnticipated forfor 20032003 AssessmentsAssessments
6%
4% 3.2%
2%
1.1%
1.9%
1.9%
0%
U.P N.L.P. S.L.P. Statewide
Source:Source: 20032003 TTRRCTTRRC SurveySurvey ofof AssessmentAssessment DistrictsDistricts
March 5, 2003 Michigan Travel, Tourism & Recreation Resource Center 12
Travel, Tourism & Recreation Resource Center, Michigan State University
East Lansin
Michigan Tourism Outlook Conference
March 5, 2003
Kellogg Center g, Michigan
Prepared by: Donald F. Holecek and Teresa Herbowicz Travel, Tourism and Recreation Resource Center
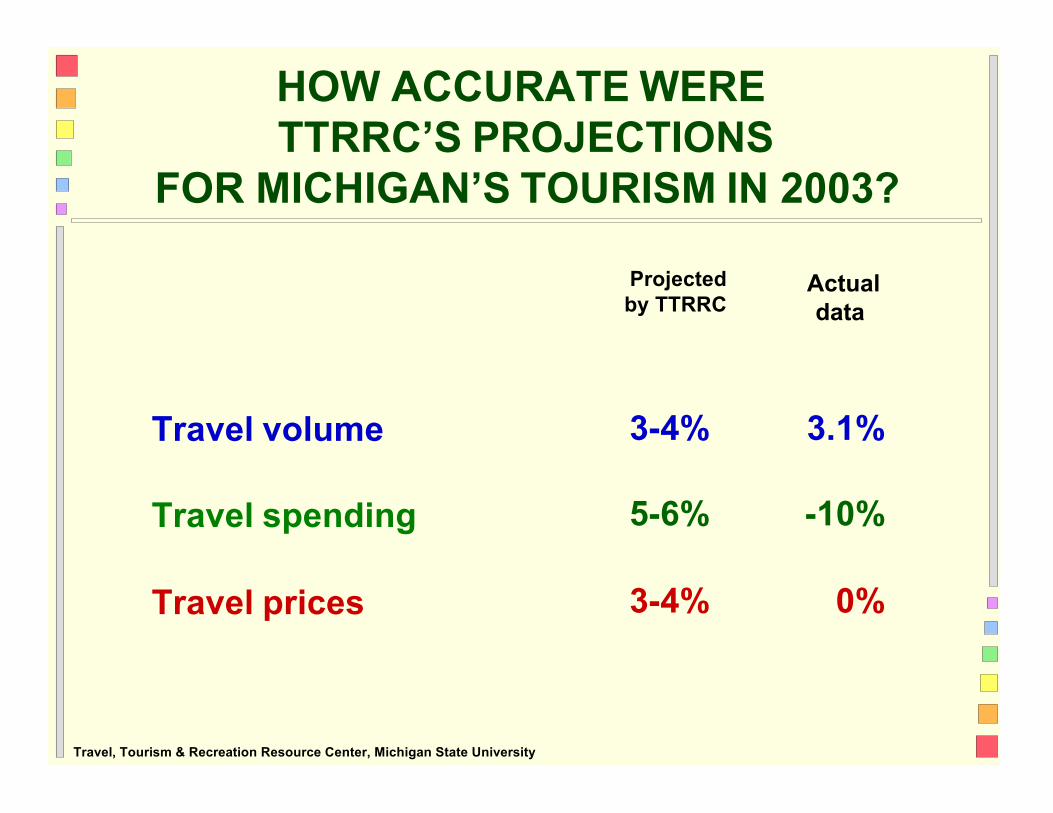
HOW ACCURATE WERE TTRRC’S PROJECTIONS
FOR MICHIGAN’S TOURISM IN 2003?
Projected by TTRRC
Actual data
Travel volume
Travel spending
Travel prices
3-4%
5-6%
3-4%
3.1%
-10%
0% Travel, Tourism & Recreation Resource Center, Michigan State University
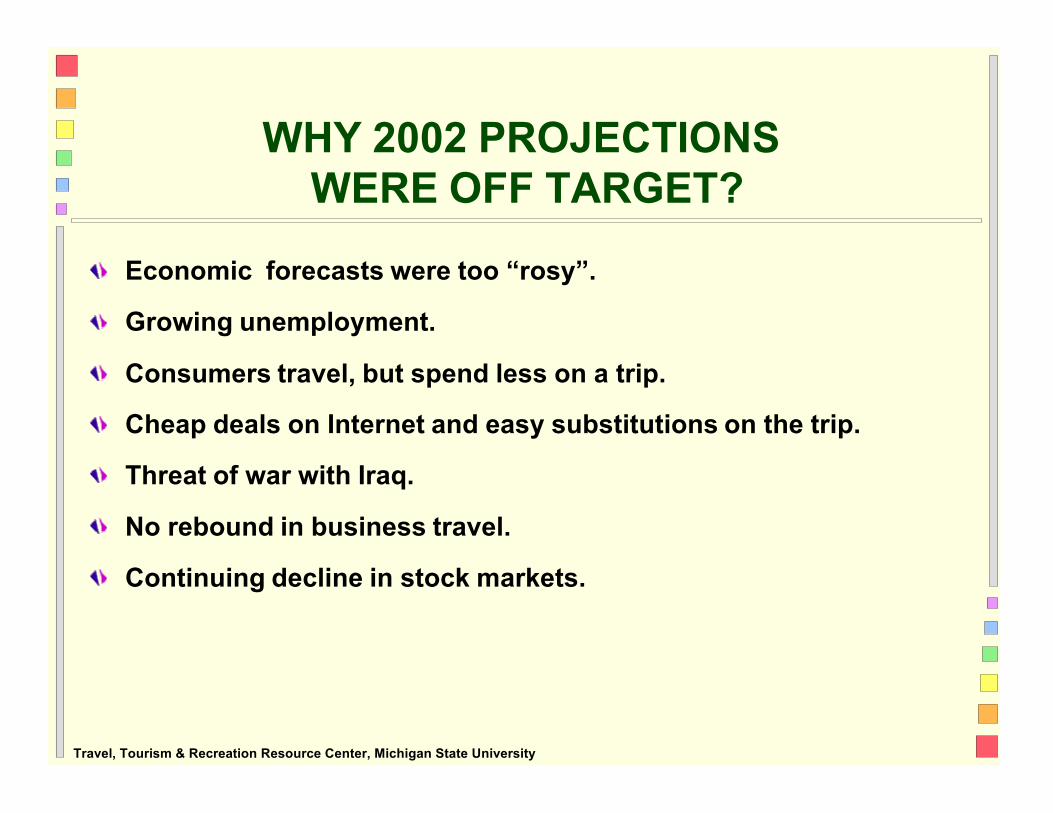
WHY 2002 PROJECTIONS WERE OFF TARGET?
Economic forecasts were too “rosy”.
Growing unemployment.
Consumers travel, but spend less on a trip.
Cheap deals on Internet and easy substitutions on the trip.
Threat of war with Iraq.
No rebound in business travel.
Continuing decline in stock markets. Travel, Tourism & Recreation Resource Center, Michigan State University
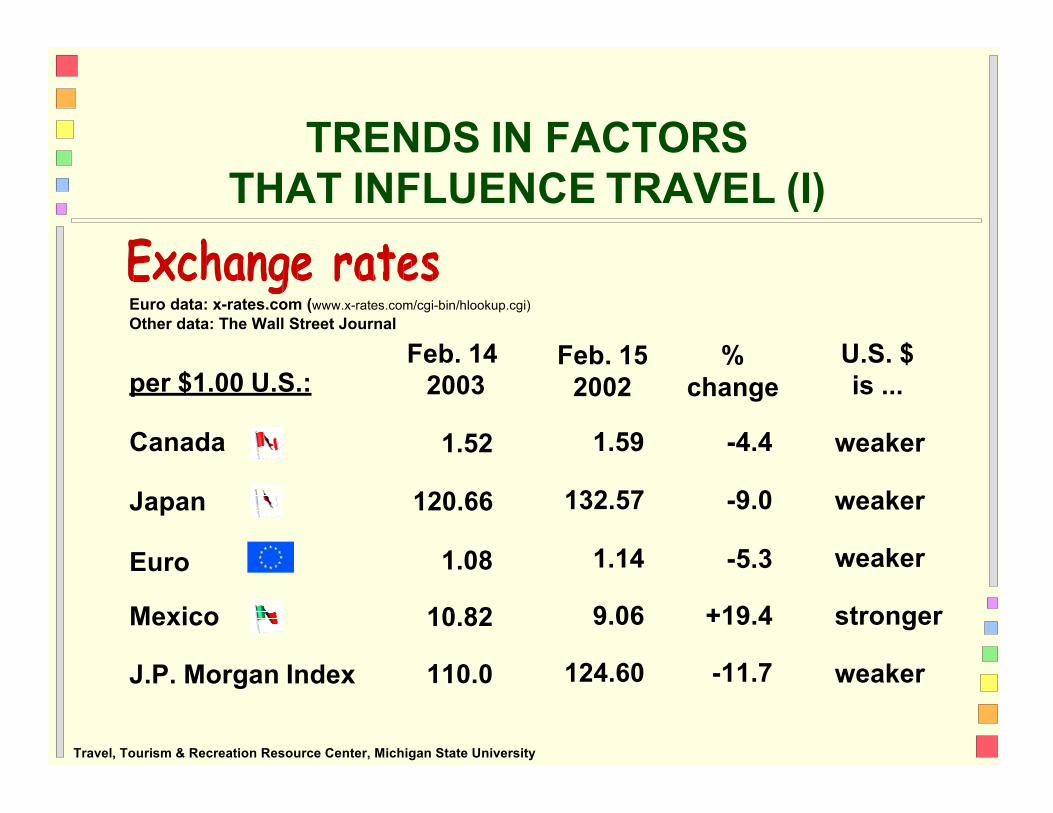
TRENDS IN FACTORS THAT INFLUENCE TRAVEL (I)
Euro data: x-rates.com (www.x-rates.com/cgi-bin/hlookup.cgi) Other data: The Wall Street Journal
per $1.00 U.S.:
Canada
Japan
Euro
Mexico
J.P. Morgan Index
Feb. 14 2003
1.52
120.66
1.08
10.82
110.0
Feb. 15 2002
1.59
132.57
1.14
9.06
124.60
% change
-4.4
-9.0
-5.3
+19.4
-11.7
U.S. $ is ...
weaker
weaker
weaker
stronger
weaker Travel, Tourism & Recreation Resource Center, Michigan State University
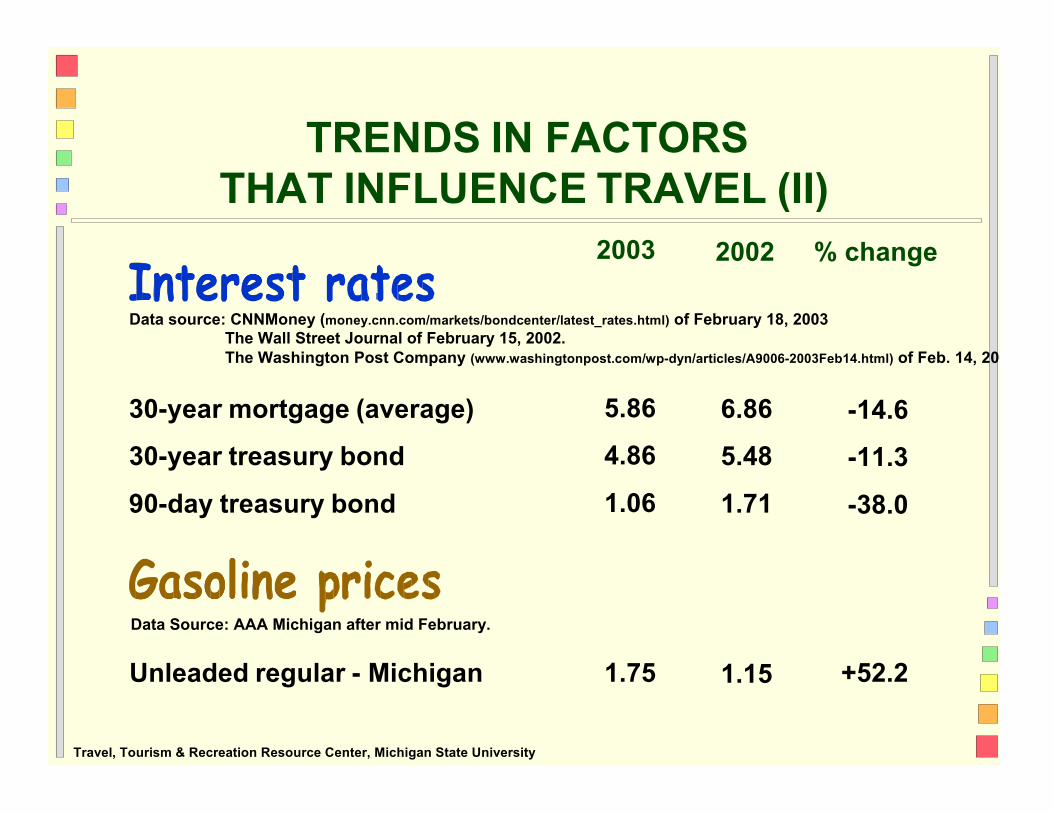
TRENDS IN FACTORS THAT INFLUENCE TRAVEL (II)
2003 2002 % change
Data source: CNNMoney (money.cnn.com/markets/bondcenter/latest_rates.html) of February 18, 2003 The Wall Street Journal of February 15, 2002. The Washington Post Company (www.washingtonpost.com/wp-dyn/articles/A9006-2003Feb14.html) of Feb. 14, 200
30-year mortgage (average)
30-year treasury bond
90-day treasury bond
5.86
4.86
1.06
6.86
5.48
1.71
-14.6
-11.3
-38.0
Data Source: AAA Michigan after mid February.
Unleaded regular - Michigan 1.75 1.15 +52.2 Travel, Tourism & Recreation Resource Center, Michigan State University
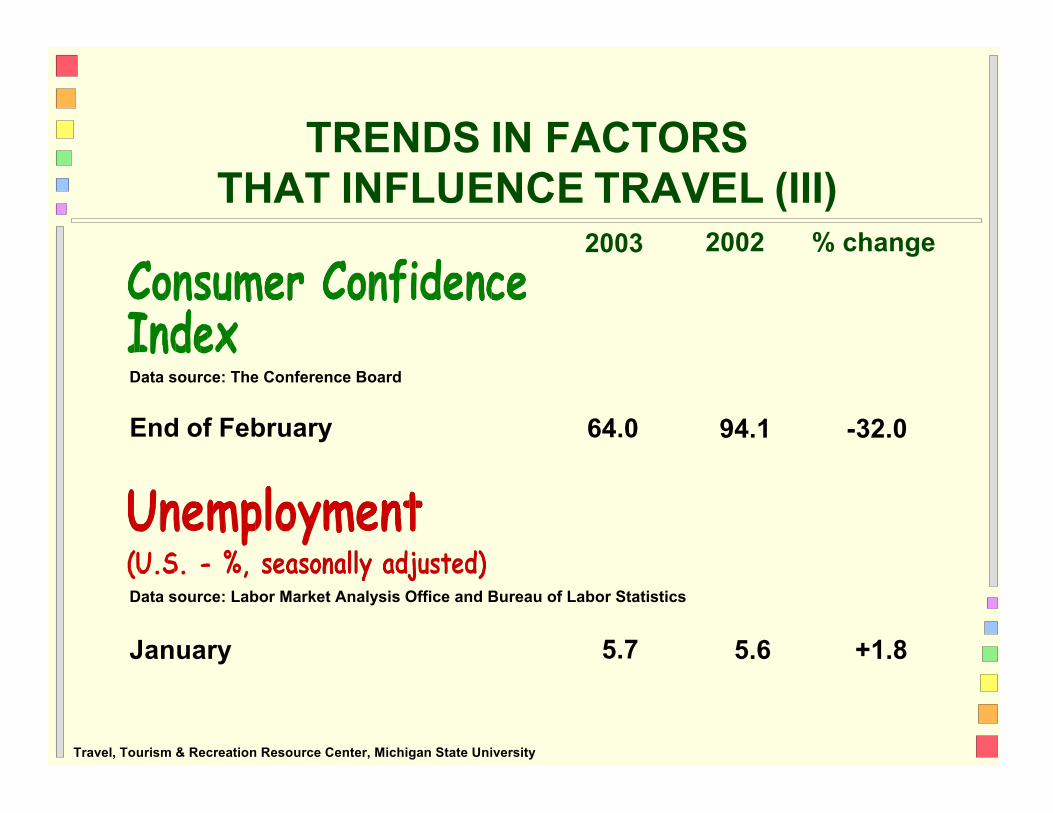
TRENDS IN FACTORS THAT INFLUENCE TRAVEL (III)
2003 2002 % change
Data source: The Conference Board
End of February 64.0 94.1 -32.0
Data source: Labor Market Analysis Office and Bureau of Labor Statistics
January 5.7 5.6 +1.8 Travel, Tourism & Recreation Resource Center, Michigan State University
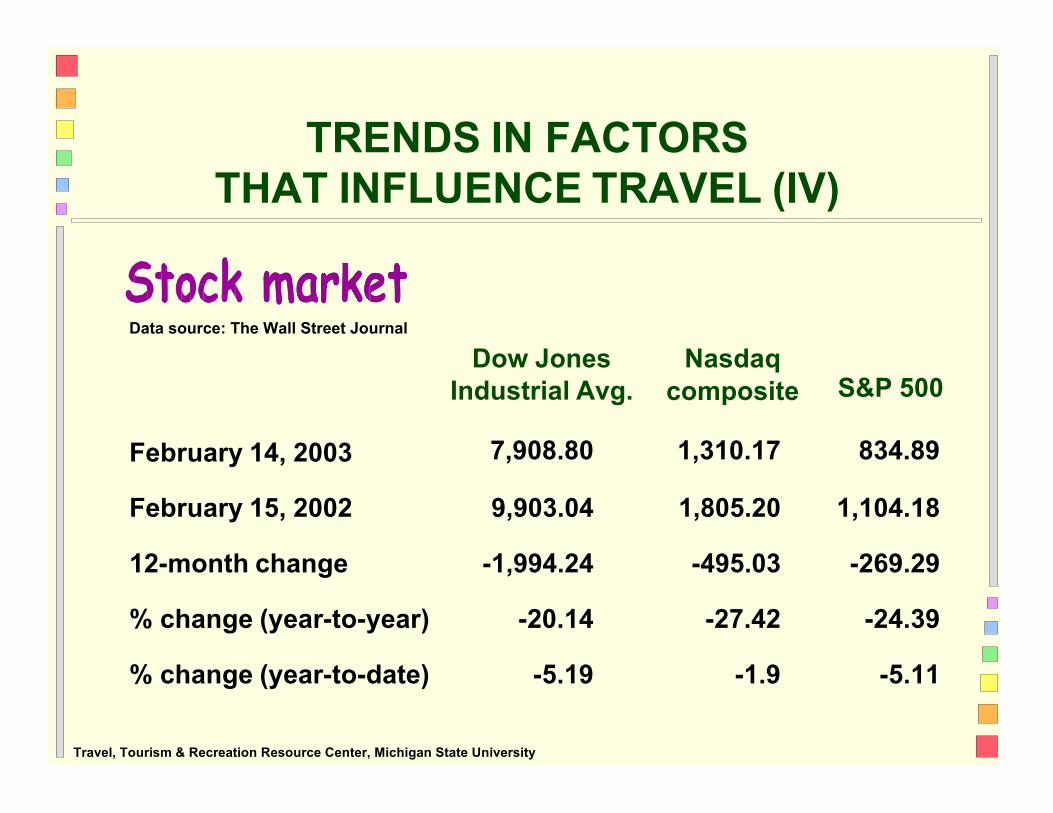
TRENDS IN FACTORS THAT INFLUENCE TRAVEL (IV)
Data source: The Wall Street Journal
Dow Jones Industrial Avg.
Nasdaq composite S&P 500
February 14, 2003 7,908.80 1,310.17 834.89
February 15, 2002
12-month change
% change (year-to-year)
% change (year-to-date)
9,903.04
-1,994.24
-20.14
-5.19
1,805.20
-495.03
-27.42
-1.9
1,104.18
-269.29
-24.39
-5.11 Travel, Tourism & Recreation Resource Center, Michigan State University
Perc
enta
ge
1990
1991
1992
f
1993
f
1994
f
1995
f
1996
f
1997
f
1998
f
1999
f
2000
f
2001
f
2002
f
2003
f
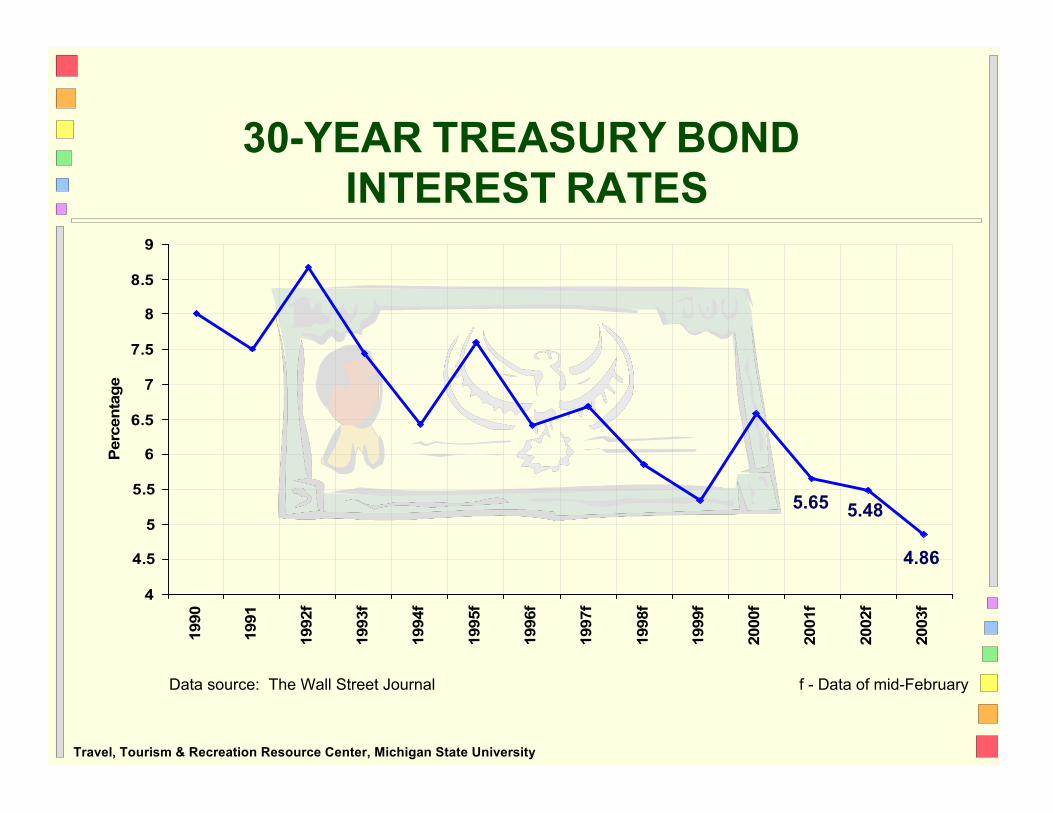
30-YEAR TREASURY BOND INTEREST RATES
9
8.5
8
7.5
7
6.5
6
5.5
5
4.5
5.65 5.48 4.86
4
Data source: The Wall Street Journal f - Data of mid-February Travel, Tourism & Recreation Resource Center, Michigan State University
Perc
enta
ge
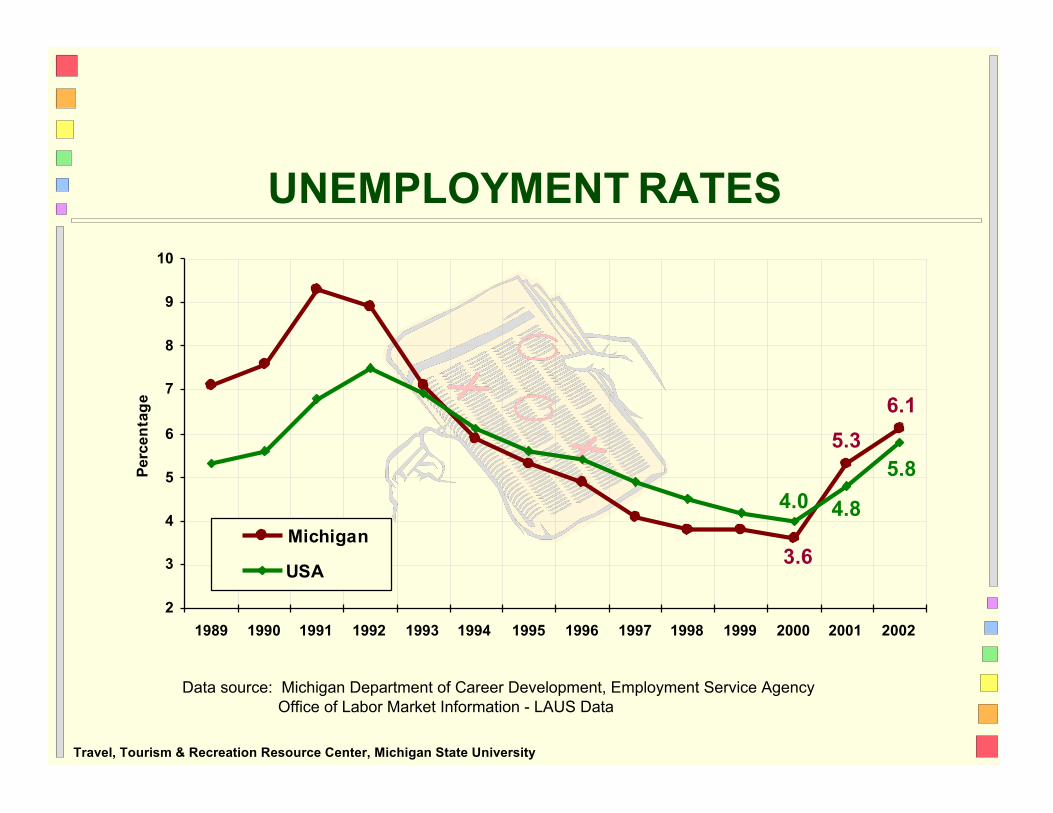
UNEMPLOYMENT RATES
10
9
8
7
6
5
4 Michigan
3 USA
4.0 3.6
5.3 4.8
6.1
5.8
2
1989 1990 1991 1992 1993 1994 1995 1996 1997 1998 1999 2000 2001 2002
Data source: Michigan Department of Career Development, Employment Service Agency Office of Labor Market Information - LAUS Data
Travel, Tourism & Recreation Resource Center, Michigan State University
Base
yea
r: 1
985
= 10
0
1978
19
79
1980
19
81
1982
19
83
1984
19
85
1986
19
87
1988
19
89
1990
19
91
1992
19
93
1994
19
95
1996
19
97
1998
19
99
2000
20
01
2002
20
03f
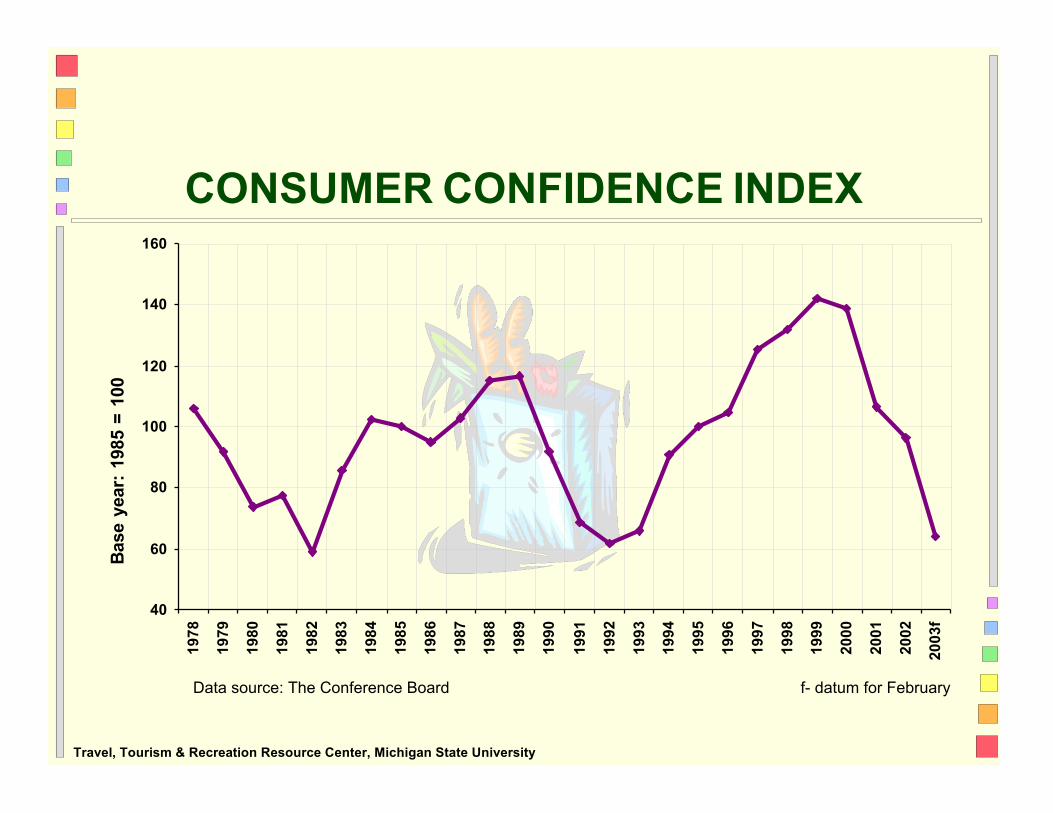
CONSUMER CONFIDENCE INDEX
160
140
120
100
80
60
40
Data source: The Conference Board f- datum for February Travel, Tourism & Recreation Resource Center, Michigan State University
Bas
e ye
ar: 1
985
= 10
0
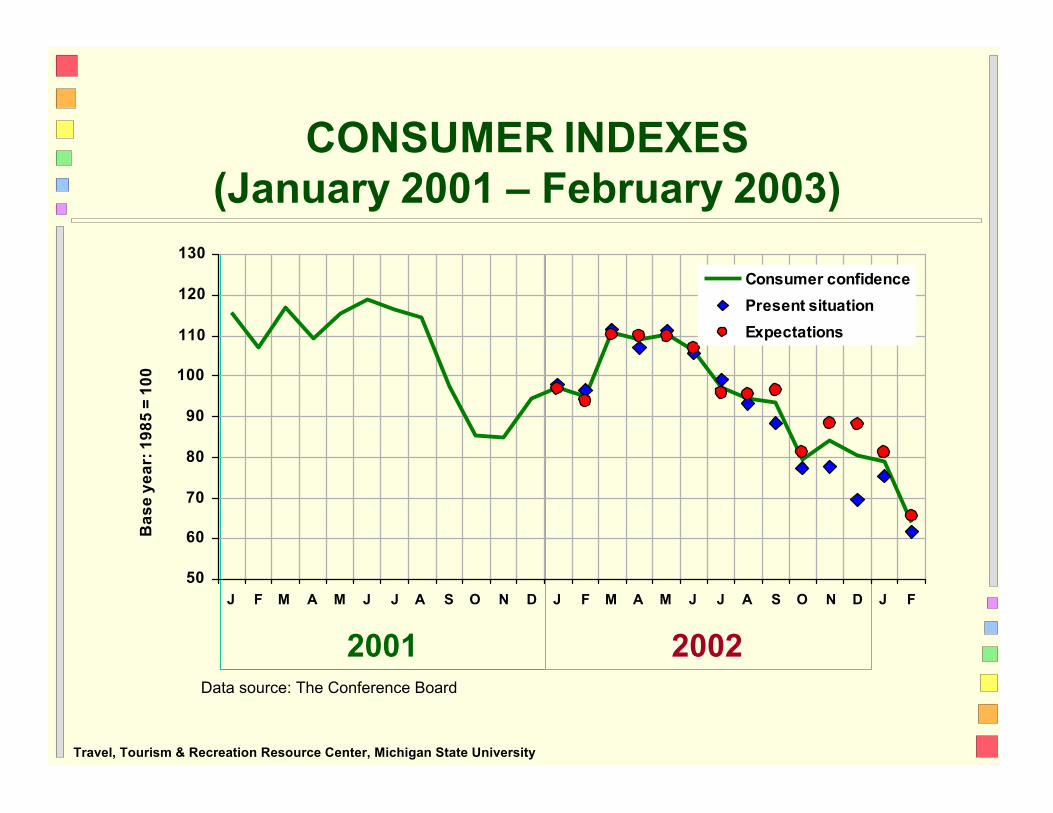
CONSUMER INDEXES (January 2001 – February 2003)
130
120
110
Consumer confidence
Present situation
Expectations
100
90
80
70
60
50
J F M A M J J A S O N D J F M A M J J A S O N D J F
2001 2002
Data source: The Conference Board Travel, Tourism & Recreation Resource Center, Michigan State University
Bas
e ye
ar: 1
985
= 10
0
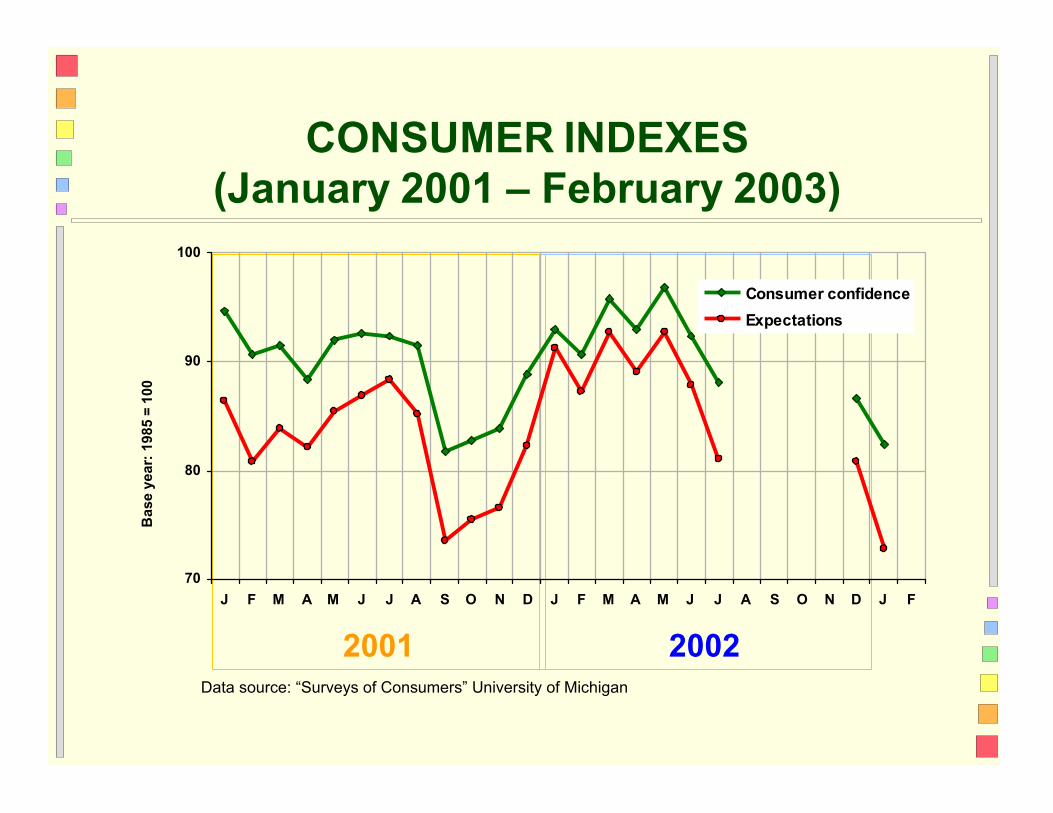
CONSUMER INDEXES (January 2001 – February 2003)
100
Consumer confidence
Expectations
90
80
70 J F M A M J J A S O N D J F M A M J J A S O N D J F
2001 2002
Data source: “Surveys of Consumers” University of Michigan
Dol
lars
1982
1983
1984
1985
19
86
1987
1988
19
89
1990
1991
1992
19
93
1994
1995
19
96
1997
1998
1999
20
00
2001
2002
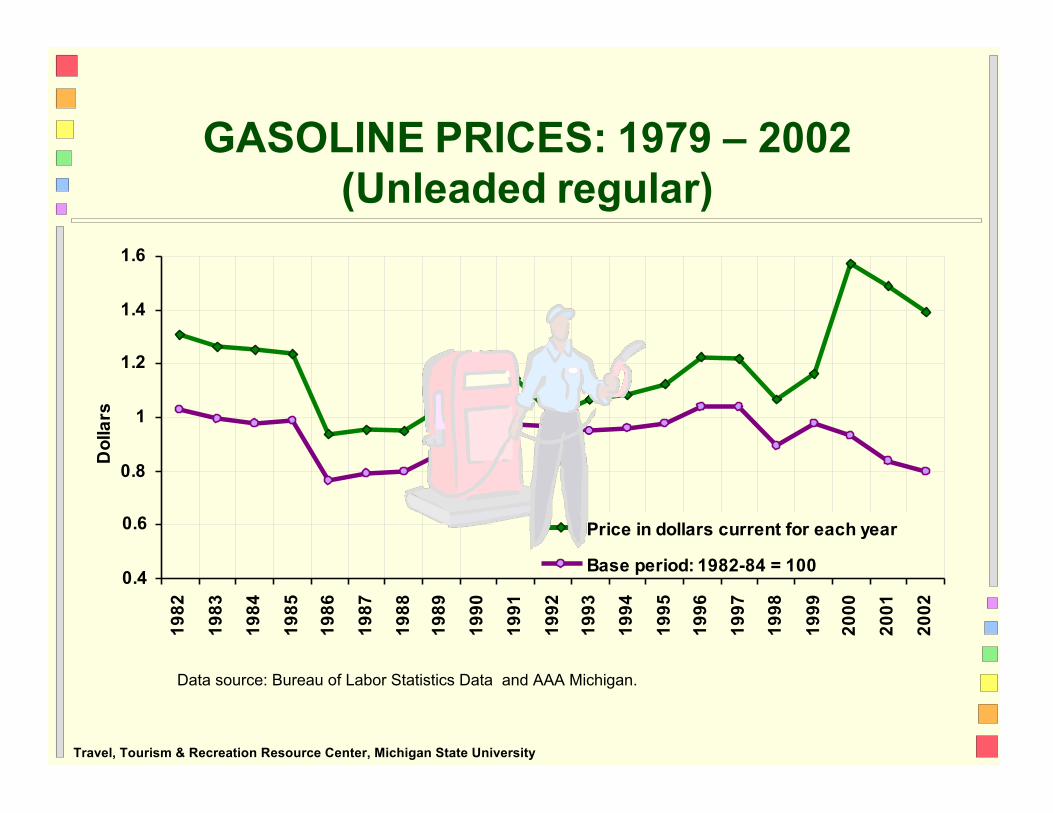
GASOLINE PRICES: 1979 – 2002 (Unleaded regular)
1.6
1.4
1.2
1
0.8
0.6
Price in dollars current for each year
0.4 Base period: 1982-84 = 100
Data source: Bureau of Labor Statistics Data and AAA Michigan. Travel, Tourism & Recreation Resource Center, Michigan State University
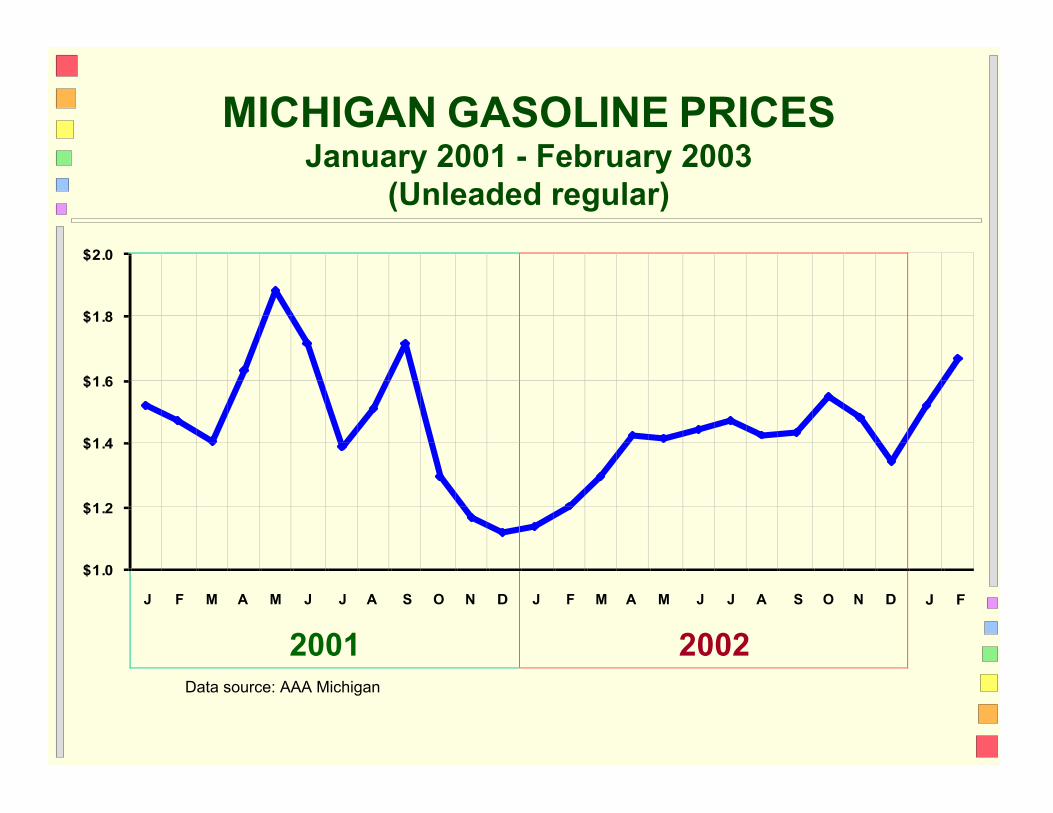
J F M A M J J A S O N D
2001
J F M A M J J A S O N D
2002
MICHIGAN GASOLINE PRICES January 2001 - February 2003
(Unleaded regular)
$2.0
$1.8
$1.6
$1.4
$1.2
$1.0
J F
Data source: AAA Michigan
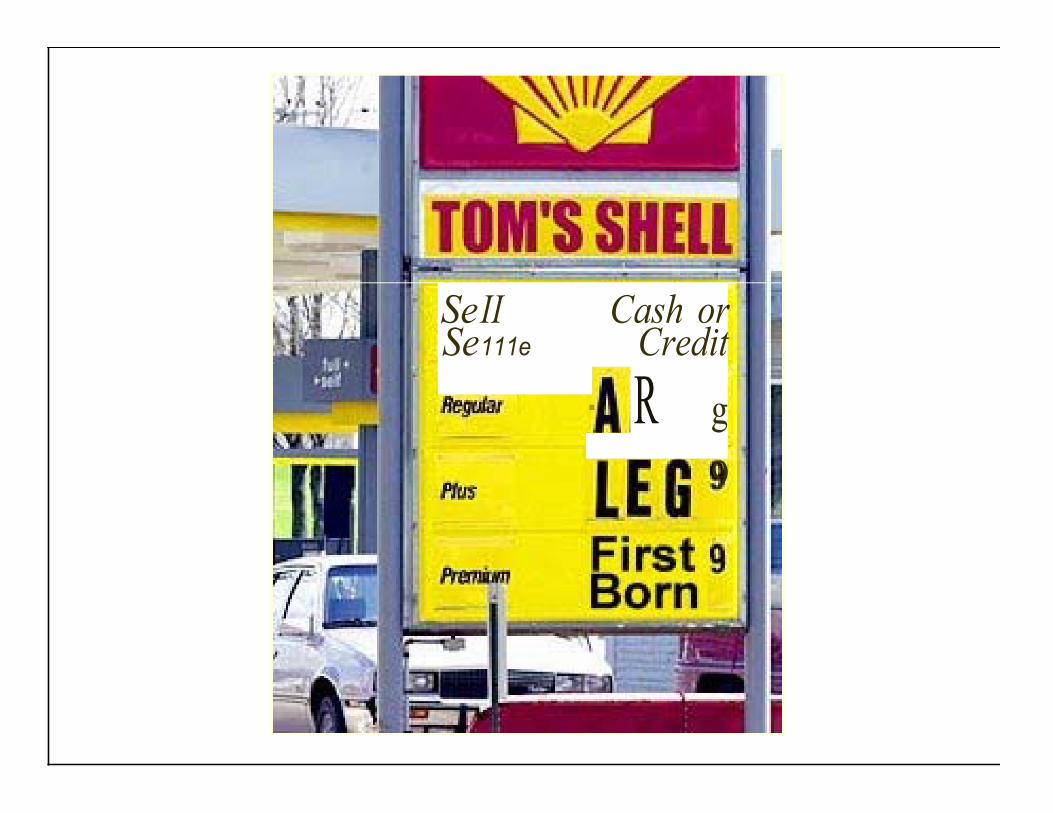
Se II Cash or Se111e Credit
- R g
9
Perc
enta
ge
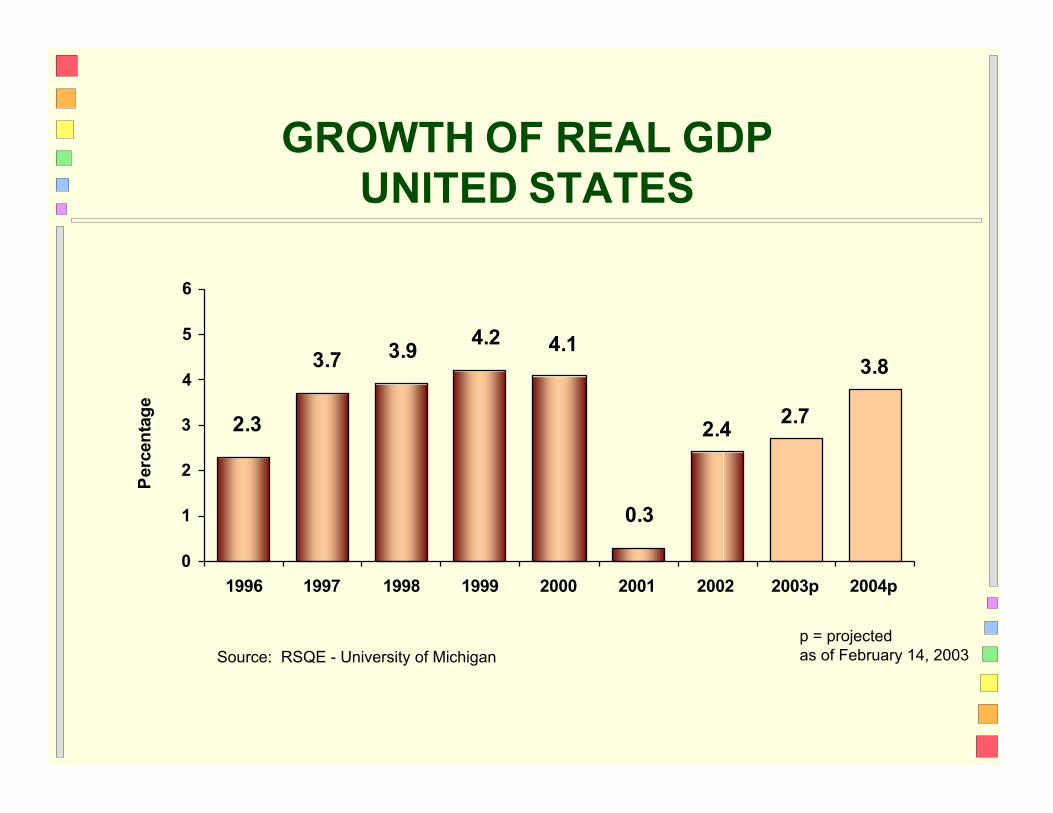
GROWTH OF REAL GDP UNITED STATES
6
5
4
3 2.3
3.7 3.9
4.2 4.1
2.4 2.7
3.8
2
1 0.3
0 1996 1997 1998 1999 2000 2001 2002 2003p 2004p
Source: RSQE - University of Michigan p = projected as of February 14, 2003
Perc
enta
ge
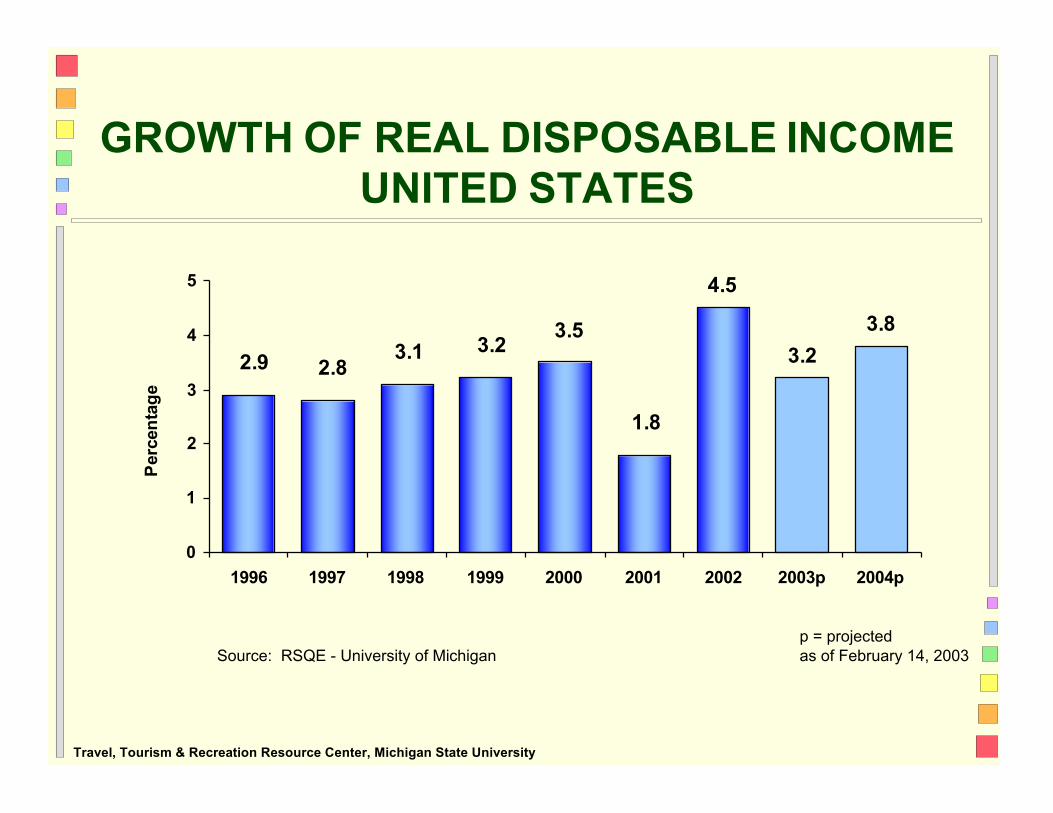
GROWTH OF REAL DISPOSABLE INCOME UNITED STATES
5
4 2.9
3
2
2.8
3.1
3.2
3.5
1.8
4.5
3.2
3.8
1
0 1996 1997 1998 1999 2000 2001 2002 2003p 2004p
Source: RSQE - University of Michigan
p = projected as of February 14, 2003
Travel, Tourism & Recreation Resource Center, Michigan State University
Perc
enta
ge
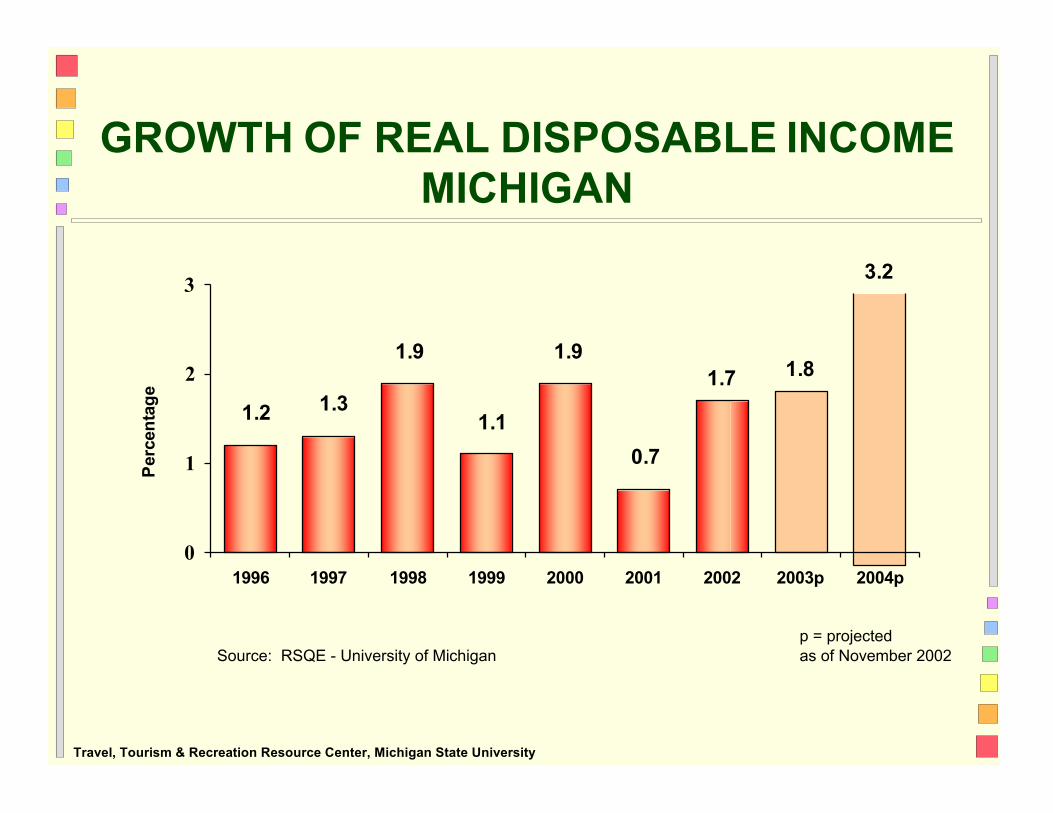
GROWTH OF REAL DISPOSABLE INCOME MICHIGAN
3 3.2
2
1.2
1
1.3
1.9 1.1
1.9
0.7
1.7 1.8
0 1996 1997 1998 1999 2000 2001 2002 2003p 2004p
Source: RSQE - University of Michigan
p = projected as of November 2002
Travel, Tourism & Recreation Resource Center, Michigan State University
Perc
enta
ge
3
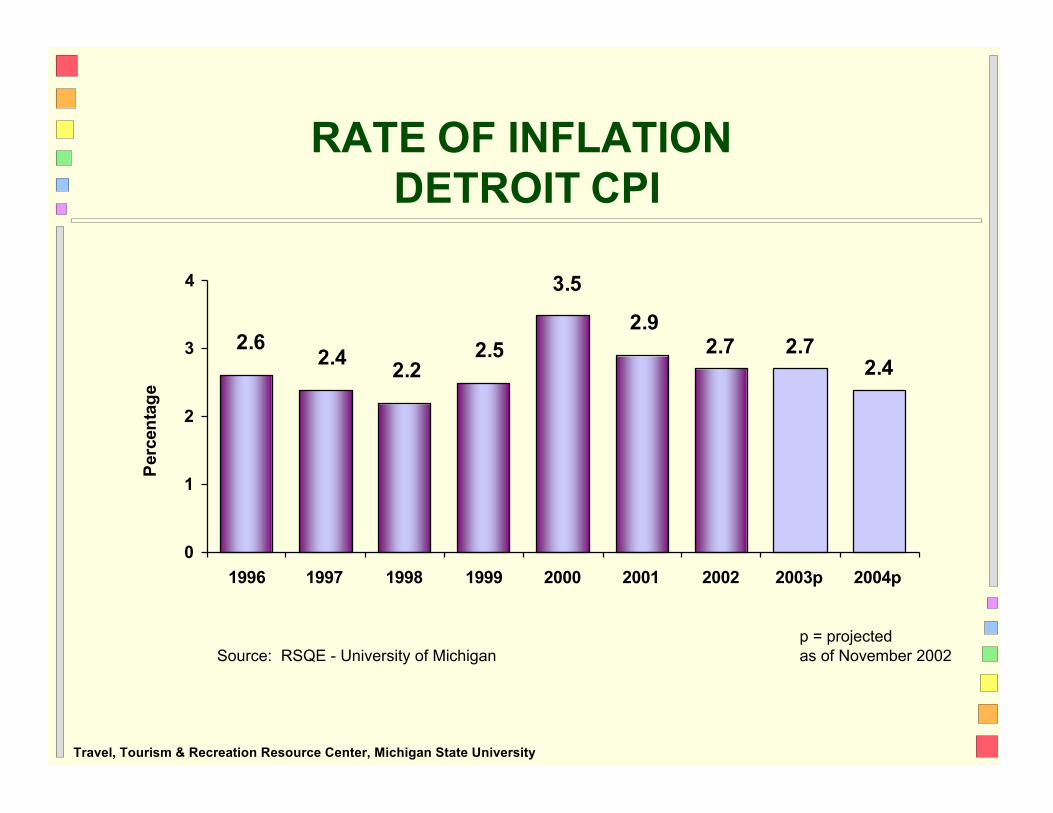
RATE OF INFLATION DETROIT CPI
4
2.6 2.4
2.2
2.5
3.5
2.9
2.7 2.7
2.4
2
1
0 1996 1997 1998 1999 2000 2001 2002 2003p 2004p
Source: RSQE - University of Michigan
p = projected as of November 2002
Travel, Tourism & Recreation Resource Center, Michigan State University
Perc
enta
ge
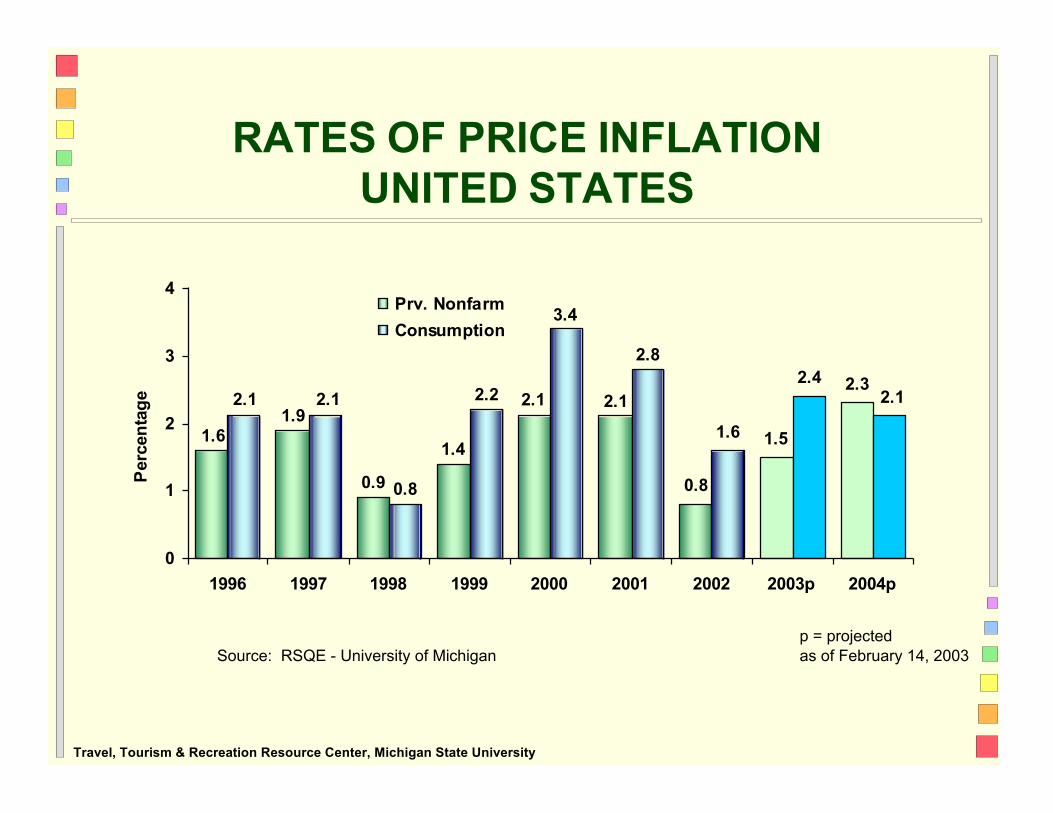
RATES OF PRICE INFLATION UNITED STATES
4 Prv. Nonfarm
Consumption 3
3.4
2.8
2.4
2.3
2.1 2.1 1.9
2.2 2.1 2.1 2.1 2
1.6
1
0.9
0.8
1.4
0.8
1.6 1.5
0 1996 1997 1998 1999 2000 2001 2002 2003p 2004p
Source: RSQE - University of Michigan
p = projected as of February 14, 2003
Travel, Tourism & Recreation Resource Center, Michigan State University
Perc
enta
ge
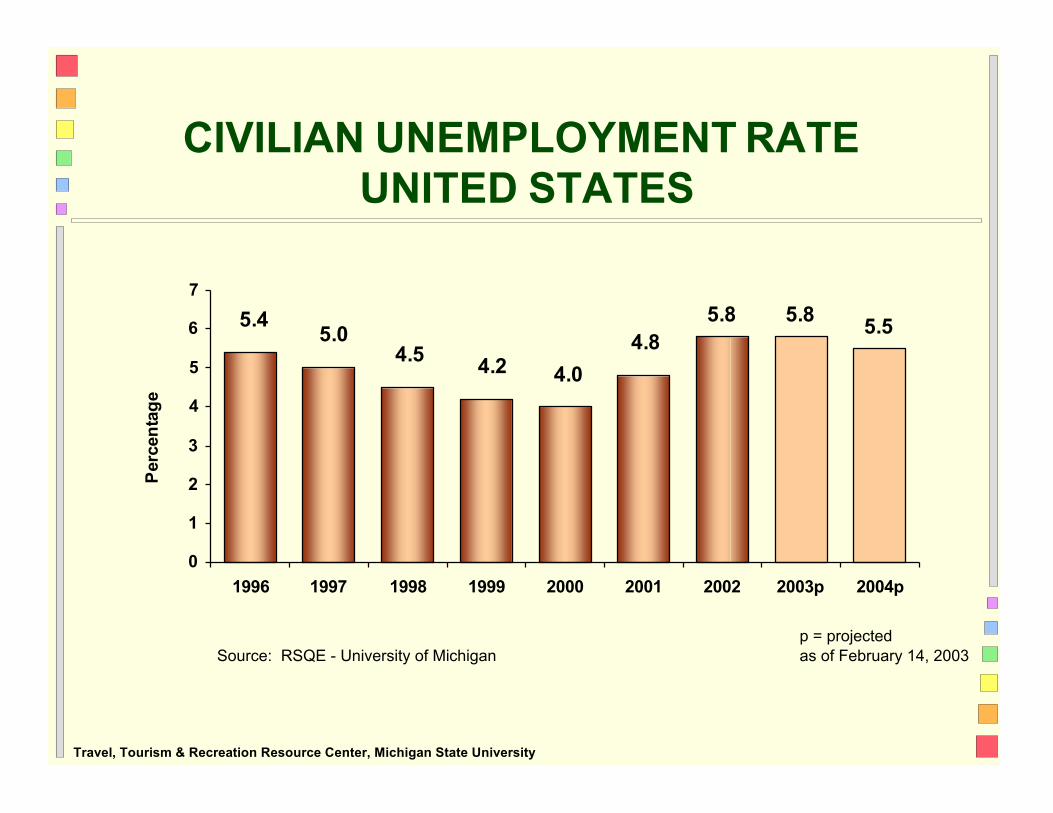
CIVILIAN UNEMPLOYMENT RATE UNITED STATES
7
6 5.4
5
4
5.0
4.5
4.2
4.0
4.8
5.8 5.8 5.5
3
2
1
0
1996 1997 1998 1999 2000 2001 2002 2003p 2004p
Source: RSQE - University of Michigan
p = projected as of February 14, 2003
Travel, Tourism & Recreation Resource Center, Michigan State University
Perc
enta
ge
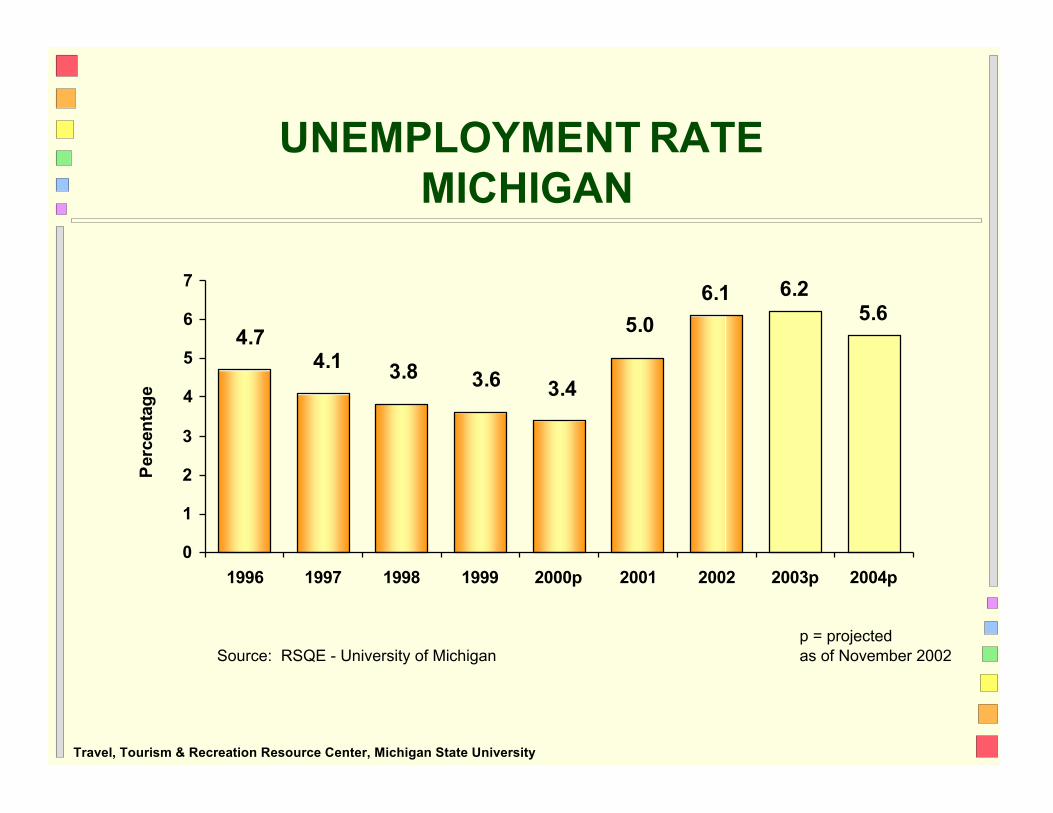
UNEMPLOYMENT RATE MICHIGAN
7
6 4.7
5
4
4.1
3.8
3.6
3.4
5.0
6.1 6.2 5.6
3
2
1
0
1996 1997 1998 1999 2000p 2001 2002 2003p 2004p
Source: RSQE - University of Michigan
p = projected as of November 2002
Travel, Tourism & Recreation Resource Center, Michigan State University
Thou
sand
s
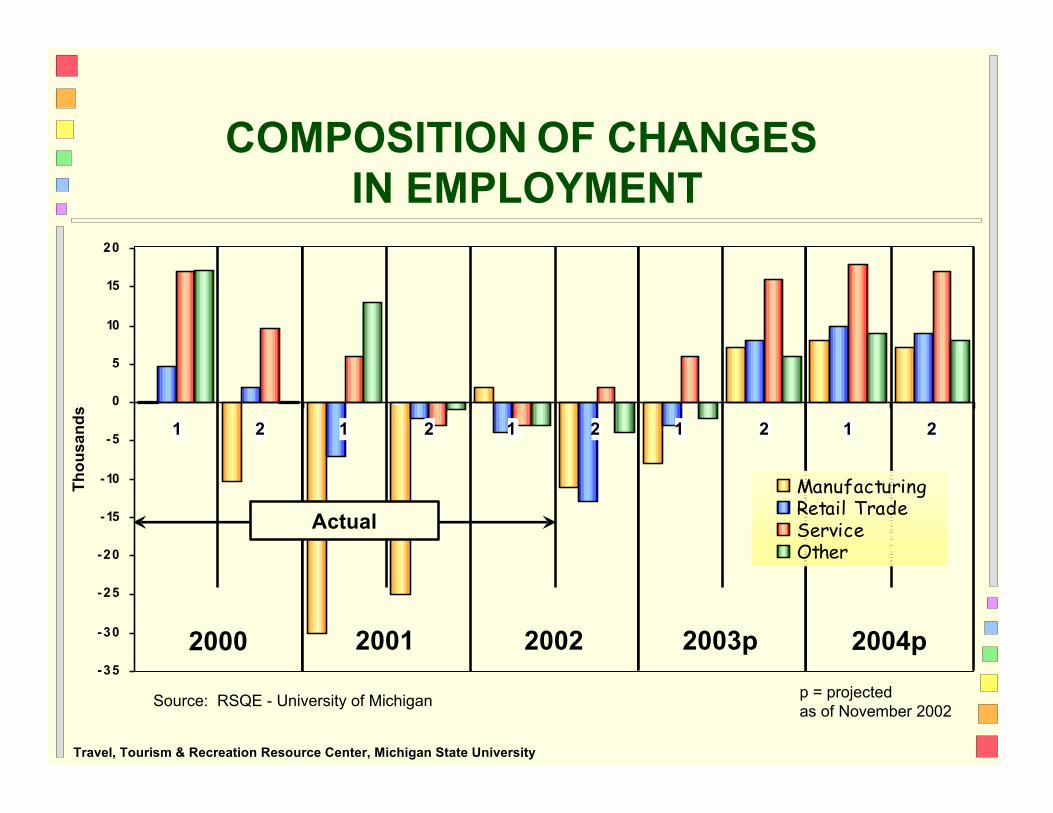
COMPOSITION OF CHANGES IN EMPLOYMENT
20
15
10
5
0
1 2 1 2 1 2 1 2 1 2 -5
- 10
- 15
-20
Actual
Manufacturing Retail Trade Service Other
-25
-30
-35
2000 2001 2002 2003p Source: RSQE - University of Michigan
2004p p = projected as of November 2002
Travel, Tourism & Recreation Resource Center, Michigan State University
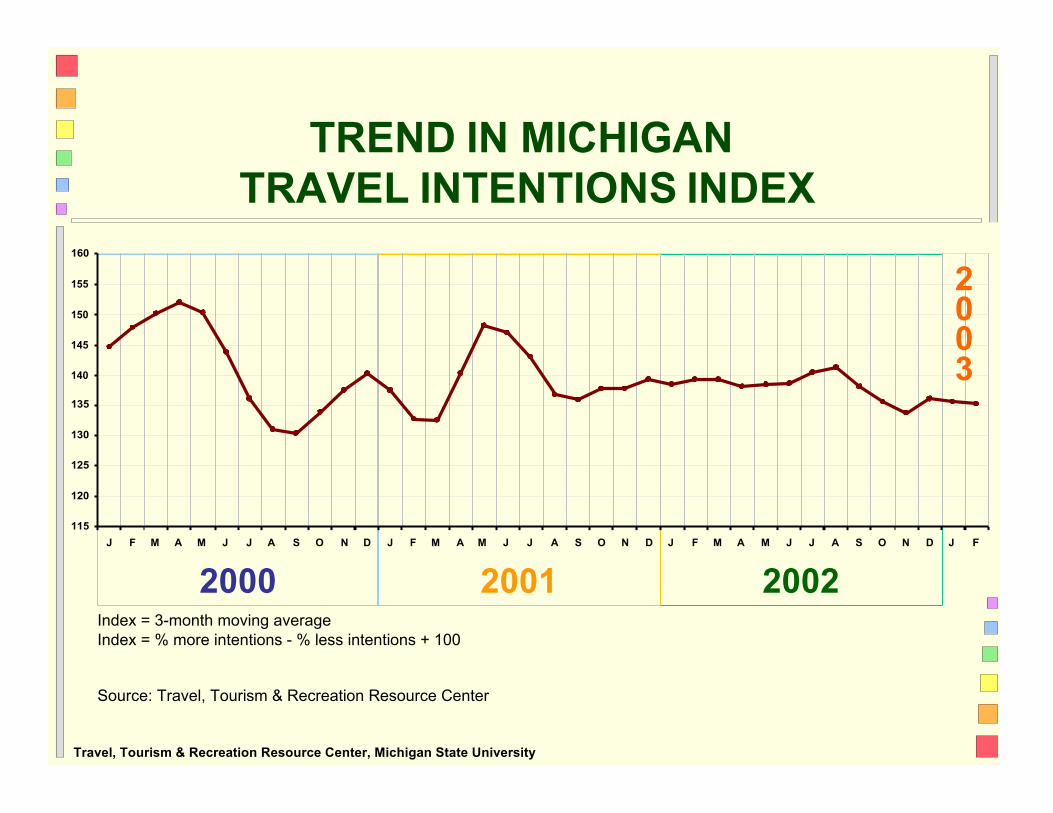
TREND IN MICHIGAN TRAVEL INTENTIONS INDEX
160
155 2 150 0 145 0 140 3
135
130
125
120
115 J F M A M J J A S O N D J F M A M J J A S O N D J F M A M J J A S O N D J F
2000 2001 2002 Index = 3-month moving average Index = % more intentions - % less intentions + 100
Source: Travel, Tourism & Recreation Resource Center
Travel, Tourism & Recreation Resource Center, Michigan State University
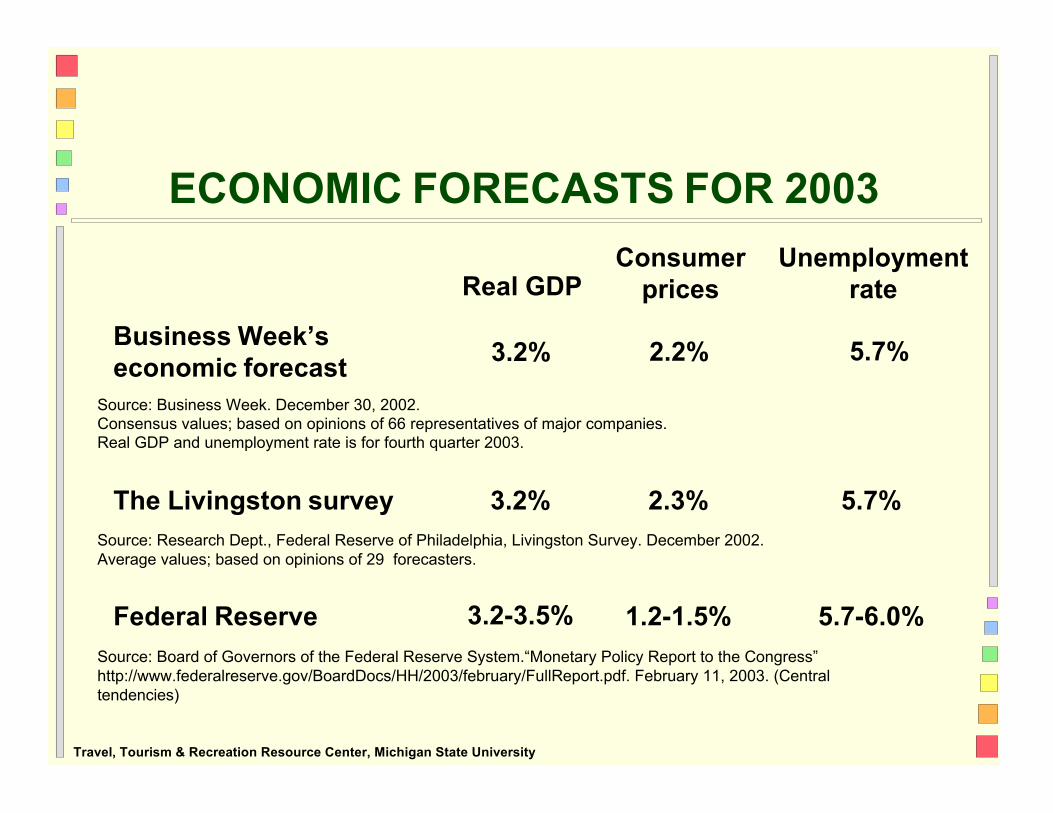
ECONOMIC FORECASTS FOR 2003
Business Week’s economic forecast
Source: Business Week. December 30, 2002.
Real GDP
3.2%
Consumer prices
2.2%
Unemployment rate
5.7%
Consensus values; based on opinions of 66 representatives of major companies. Real GDP and unemployment rate is for fourth quarter 2003.
The Livingston survey 3.2% 2.3% 5.7%
Source: Research Dept., Federal Reserve of Philadelphia, Livingston Survey. December 2002. Average values; based on opinions of 29 forecasters.
Federal Reserve 3.2-3.5% 1.2-1.5% 5.7-6.0%
Source: Board of Governors of the Federal Reserve System.“Monetary Policy Report to the Congress” http://www.federalreserve.gov/BoardDocs/HH/2003/february/FullReport.pdf. February 11, 2003. (Central tendencies)
Travel, Tourism & Recreation Resource Center, Michigan State University
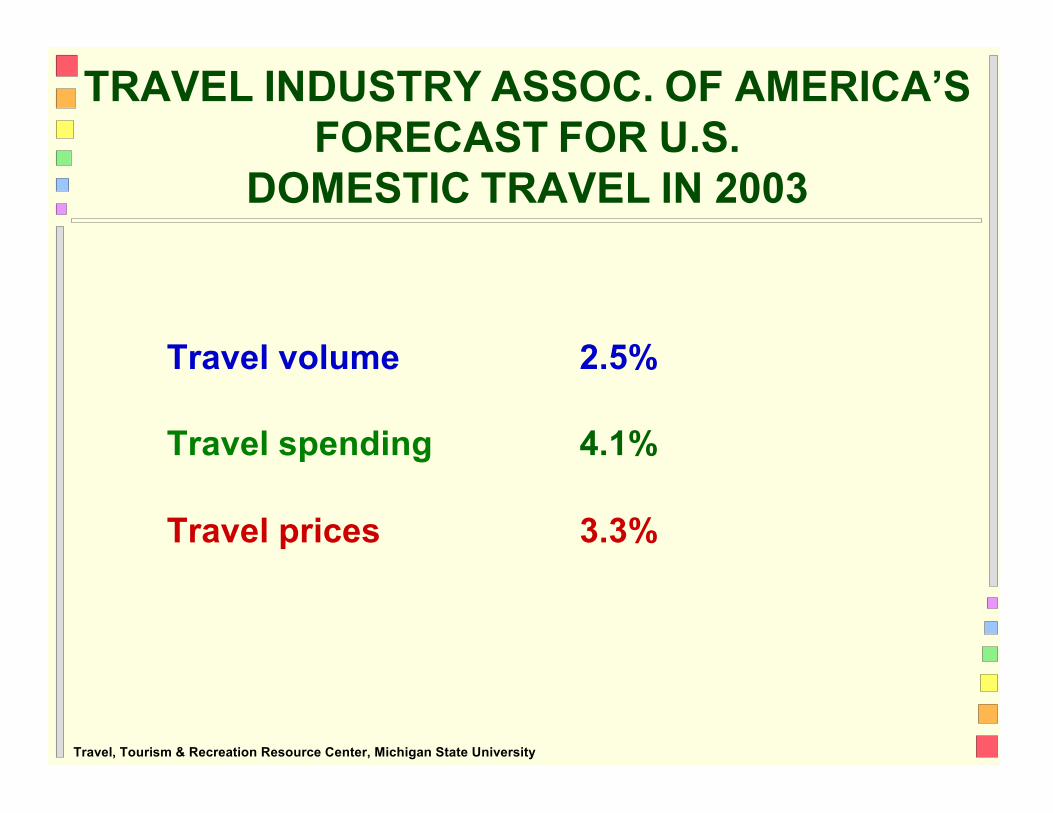
TRAVEL INDUSTRY ASSOC. OF AMERICA’S FORECAST FOR U.S.
DOMESTIC TRAVEL IN 2003
Travel volume 2.5%
Travel
spending
4.1%
Travel
prices
3.3%
Travel, Tourism & Recreation Resource Center, Michigan State University
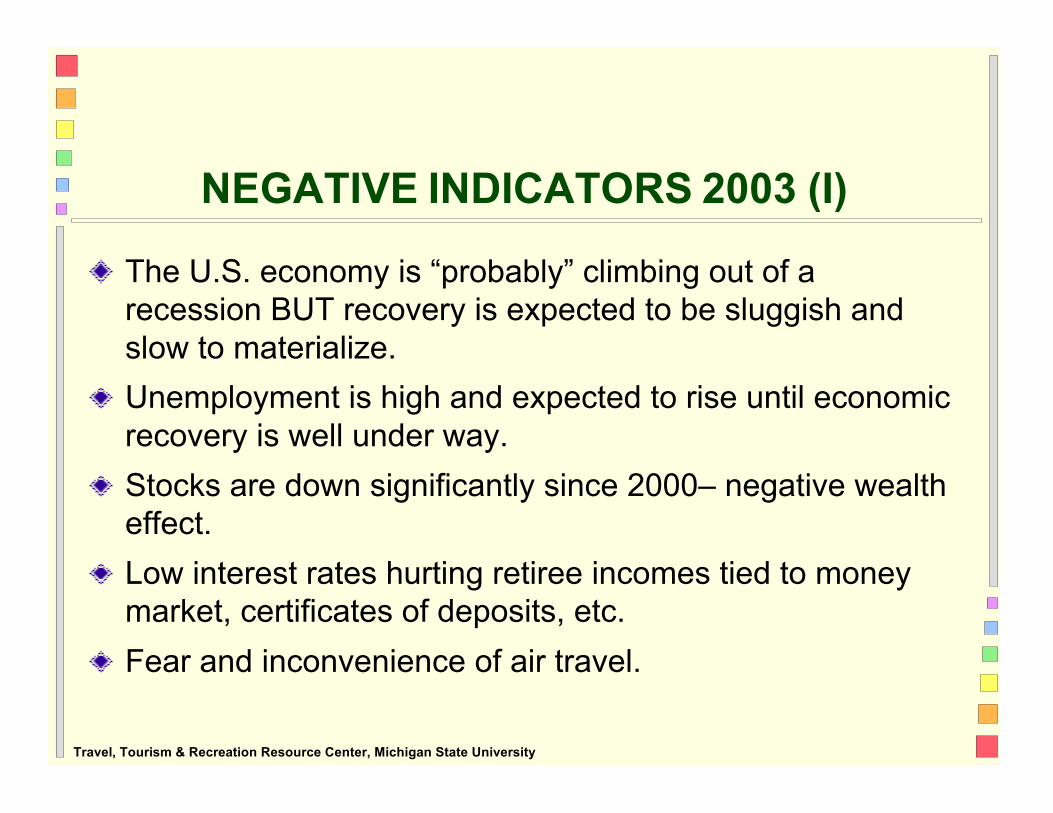
NEGATIVE INDICATORS 2003 (I)
The U.S. economy is “probably” climbing out of a recession BUT recovery is expected to be sluggish and slow to materialize.
Unemployment is high and expected to rise until economic recovery is well under way.
Stocks are down significantly since 2000– negative wealth effect.
Low interest rates hurting retiree incomes tied to money market, certificates of deposits, etc.
Fear and inconvenience of air travel. Travel, Tourism & Recreation Resource Center, Michigan State University
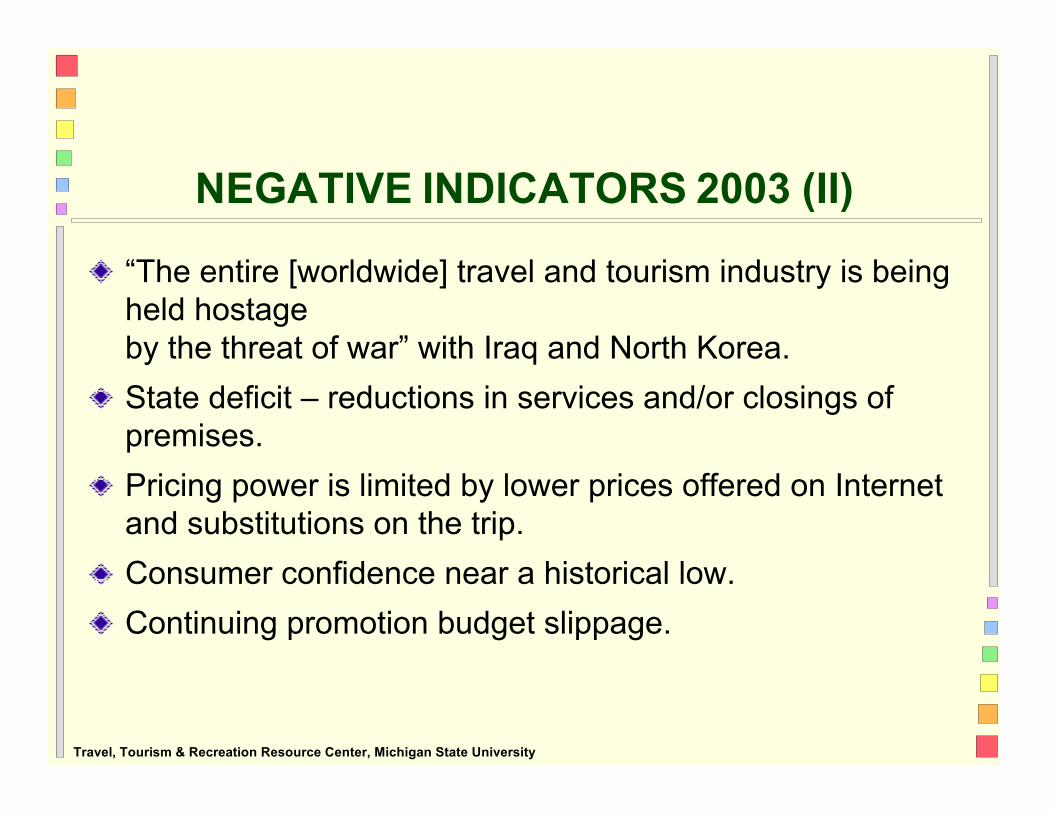
NEGATIVE INDICATORS 2003 (II)
“The entire [worldwide] travel and tourism industry is being held hostage by the threat of war” with Iraq and North Korea.
State deficit – reductions in services and/or closings of premises.
Pricing power is limited by lower prices offered on Internet and substitutions on the trip. Consumer confidence near a historical low. Continuing promotion budget slippage.
Travel, Tourism & Recreation Resource Center, Michigan State University

THE WILD CARDS
War with in Iraq and North Korea – When will uncertainty diminish?
Terrorism – will it strike again this year, especially if we go to war?
Disruption in fuel supply. Gasoline prices above $2.50? Weather – rarely “normal” in Michigan.
Travel, Tourism & Recreation Resource Center, Michigan State University
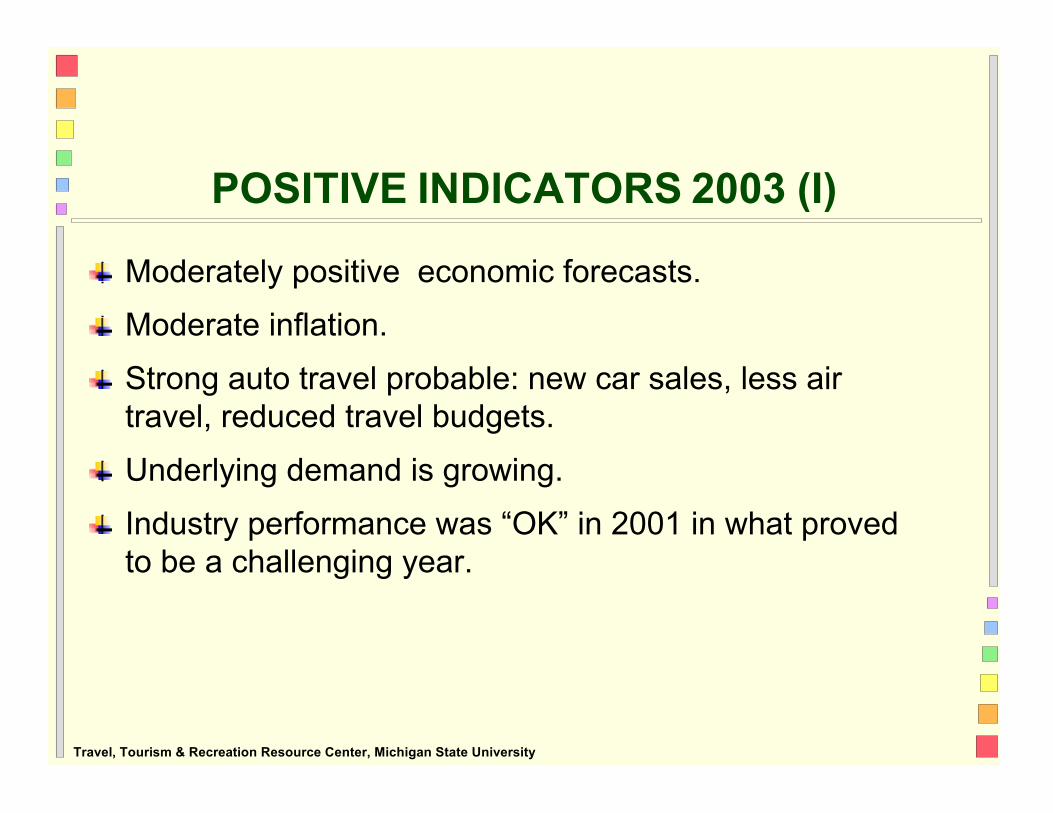
POSITIVE INDICATORS 2003 (I)
Moderately positive economic forecasts.
Moderate inflation.
Strong auto travel probable: new car sales, less air travel, reduced travel budgets.
Underlying demand is growing.
Industry performance was “OK” in 2001 in what proved to be a challenging year.
Travel, Tourism & Recreation Resource Center, Michigan State University
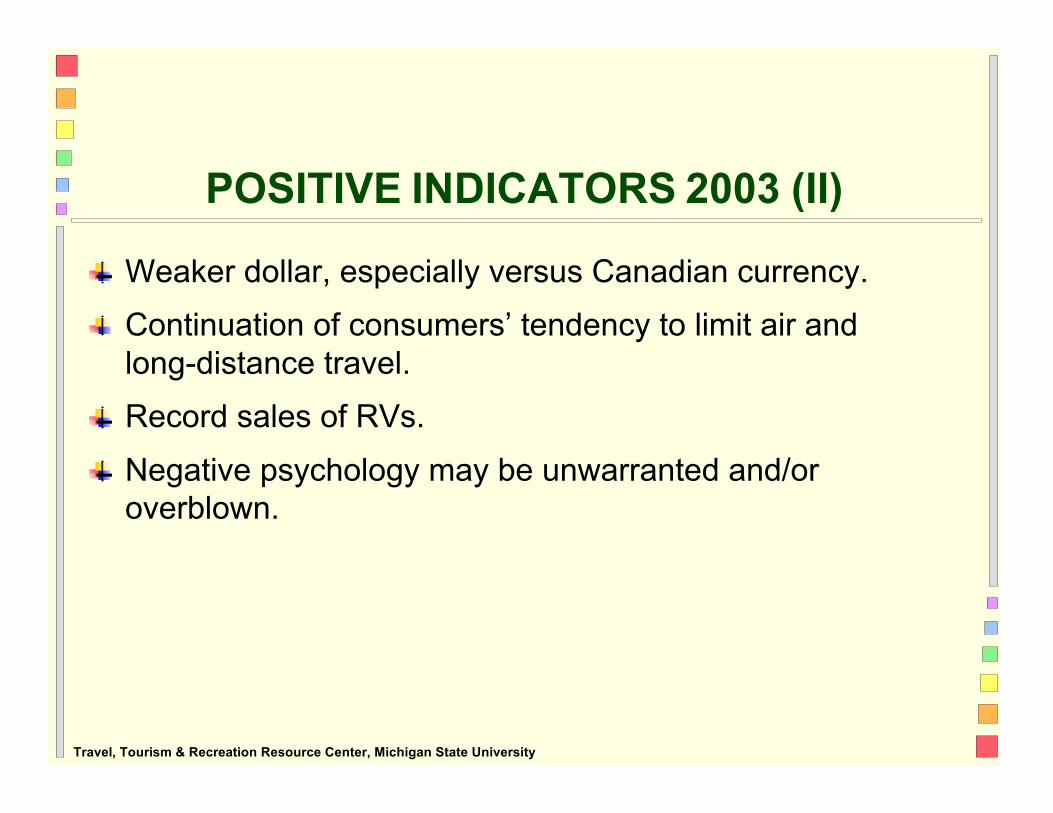
POSITIVE INDICATORS 2003 (II)
Weaker dollar, especially versus Canadian currency.
Continuation of consumers’ tendency to limit air and long-distance travel.
Record sales of RVs.
Negative psychology may be unwarranted and/or overblown.
Travel, Tourism & Recreation Resource Center, Michigan State University
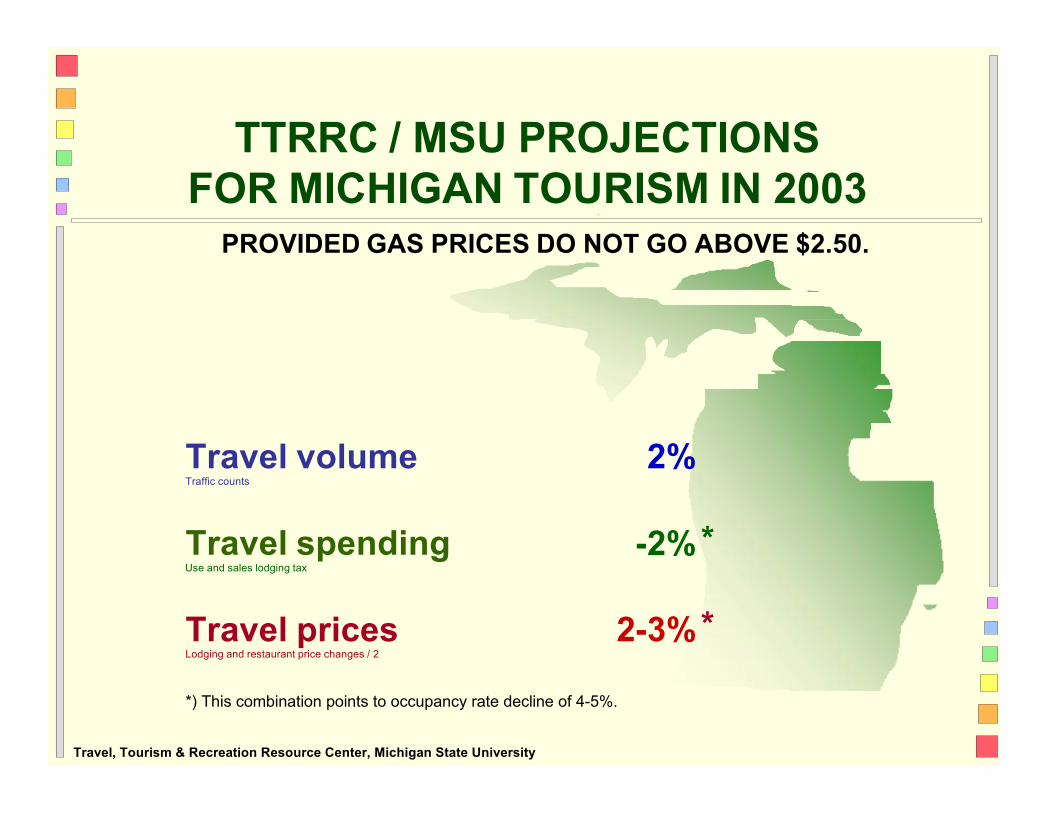
TTRRC / MSU PROJECTIONS FOR MICHIGAN TOURISM IN 2003
PROVIDED GAS PRICES DO NOT GO ABOVE $2.50.
Travel volume Traffic counts
Travel spending Use and sales lodging tax
Travel prices Lodging and restaurant price changes / 2
2%
-2% *
2-3% *
*) This combination points to occupancy rate decline of 4-5%. Travel, Tourism & Recreation Resource Center, Michigan State University
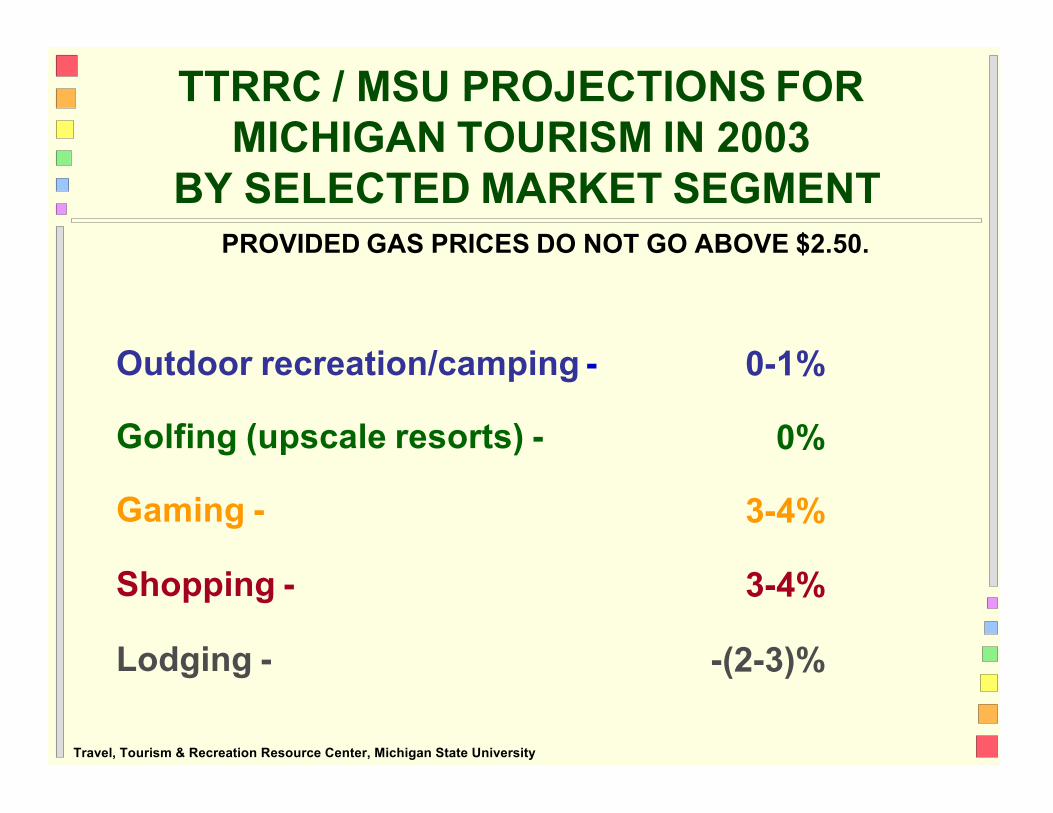
TTRRC / MSU PROJECTIONS FOR MICHIGAN TOURISM IN 2003
BY SELECTED MARKET SEGMENT
PROVIDED GAS PRICES DO NOT GO ABOVE $2.50.
Outdoor recreation/camping -
Golfing (upscale resorts) -
Gaming -
Shopping -
0-1%
0%
3-4%
3-4%
Lodging - -(2-3)% Travel, Tourism & Recreation Resource Center, Michigan State University
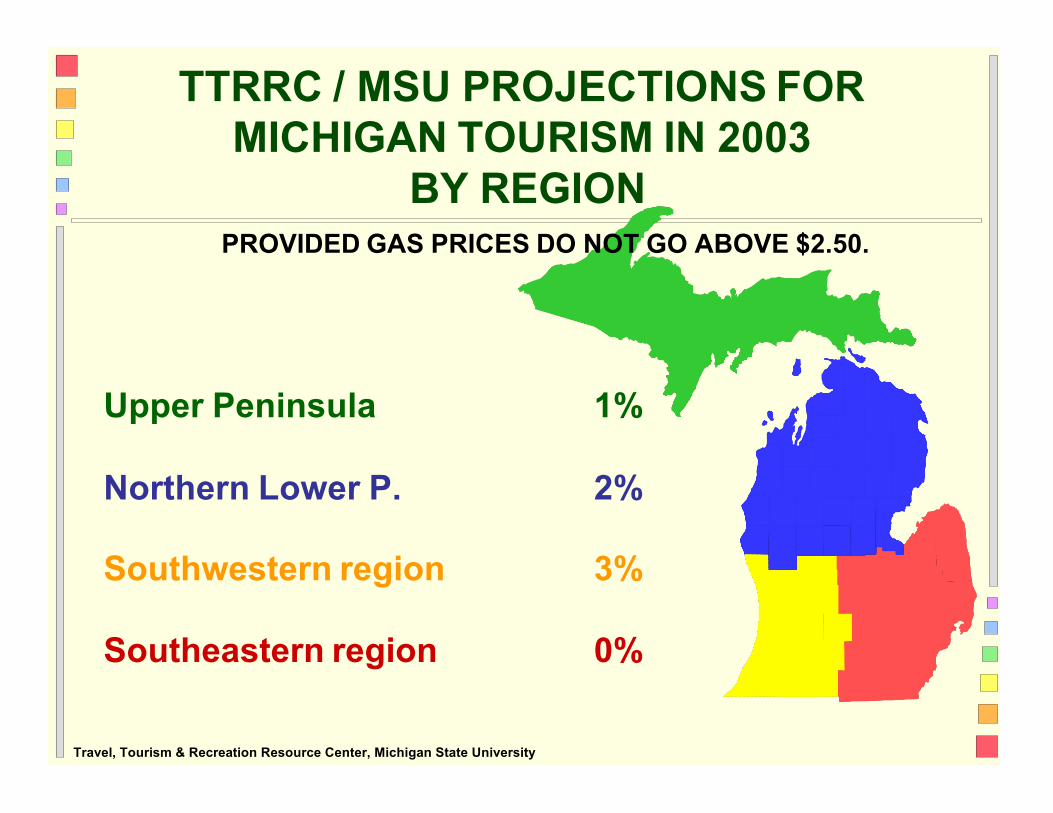
TTRRC / MSU PROJECTIONS FOR MICHIGAN TOURISM IN 2003
BY REGION
PROVIDED GAS PRICES DO NOT GO ABOVE $2.50.
Upper Peninsula 1%
Northern Lower P.
2%
Southwestern region
3%
Southeastern region
0% Travel, Tourism & Recreation Resource Center, Michigan State University
, f'L..d
Th r'5 A Glf'J. fiRS

Travel, Tourism & Recreation Resource Center, Michigan State University
CONTACT INFORMATION
Dr. Donald F. Holecek, Director
Travel, Tourism, and Recreation Resource Center Michigan State University 172 Natural Resources Bldg. East Lansing, MI 48824-1222
Phone: 517-353-0793 Fax: 517-432-2296 E-mail: [email protected]
Web site: www.tourismcenter.msu.edu Web site: www.tourism.msu.edu Web site: www.tourismcenter.msu.edu/MTVTA/ Web site: www.imakenews.com/tourism/