Embed Size (px)
Citation preview
ORIGINAL ARTICLE
Microfluidic assay of hemophilic blood clotting: distinctdeficits in platelet and fibrin deposition at low factor levels
T . V . COLACE ,* P . F . FOGARTY ,† K . A . PANCKER I ,† R . L I* and S . L . D IAMOND**Department of Chemical and Biomolecular Engineering, Institute for Medicine and Engineering, University of Pennsylvania; and
†Comprehensive Hemophilia and Thrombosis Program, Hospital of the University of Pennsylvania, Philadelphia, PA, USA
To cite this article: Colace TV, Fogarty PF, Panckeri KA, Li R, Diamond SL. Microfluidic assay of hemophilic blood clotting: distinct deficits in
platelet and fibrin deposition at low factor levels. J Thromb Haemost 2014; 12: 147–58.
Summary. Background: Coagulation factor deficiencies
create a range of bleeding phenotypes. Microfluidic
devices offer controlled hemodynamics and defined proco-
agulant triggers for measurement of clotting under flow.
Objectives: We tested a flow assay of contact pathway-
triggered clotting to quantify platelet and fibrin deposi-
tion distal of dysfunctional thrombin production. Micro-
fluidic metrics were then compared with PTT or % factor
activity assays. Methods: Whole blood (WB) treated with
low level corn trypsin inhibitor (4 lg mL�1) from nine
healthy donors and 27 patients (deficient in factor [F]
VIII, 19 patients; FIX, one patient; FXI, one patient;
VWF, six patients) was perfused over fibrillar collagen at
wall shear rate = 100 s�1. Results: Using healthy WB,
platelets deposited within 30 s, while fibrin appeared
within 6 min. Compared with healthy controls, WB from
patients displayed a 50% reduction in platelet deposition
only at < 1% factor activity. In contrast, striking defects
in fibrin deposition occurred for patients with < 13% fac-
tor activity (or PTT > 40 s). Full occlusion of the 60-lmhigh channel was completely absent over the 15-min test
in patients with < 1% factor activity, while an inter-
mediate defect was present in patients with > 1% factor.
Conclusion: Spontaneous bleeding in patients with < 1%
factor activity may be linked to deficits in both platelet
and fibrin deposition, a risk known to be mitigated
when factor levels are raised to > 1% activity (PTT of
~40–60 s), a level that does not necessarily rescue fibrin
formation under flow.
Keywords: blood coagulation; hemophilia; hemostasis;
microfluidics; platelets.
Introduction
Microfluidic platforms for the assessment of patient-
specific hemostatic function are finding new and diverse
applications [1–3]. Microfluidic devices are typically
casted in poly(dimethylsiloxane) (PDMS), utilize pressure-
driven flows, and are designed to perform multiple clot-
ting tests in parallel with relatively low volumes of blood
(< 1 mL) [4]. The main advantages of these systems are
control of the hemodynamic environment and the compo-
sition of the exposed procoagulant protein surface. For
example, by flowing whole blood over a surface of colla-
gen type 1 and lipidated tissue factor (TF), Colace et al.
[5,6] demonstrated robust activation of the extrinsic coag-
ulation system, resulting in rapid platelet adhesion and
fibrin deposition. With sufficient TF on a surface, platelet
and fibrin deposition on collagen/TF were insensitive to
function-blocking antibodies against factors VIII and IX
(FVIII and FIX) of the intrinsic coagulation pathway in
a model of acquired hemophilia [7]. Importantly, the
expression of TF varies in human tissues [8,9]. High TF
levels may compensate for impaired FVIII or FIX func-
tion in some, but not all, vasculature locations. In the
joints, for example, where bleeding in hemophilia is com-
mon, TF expression is low [8,9].
In hemophilia, the clinical severity of disease is defined
by the activity of the residual critical clotting factor,
although the bleeding phenotype can vary widely even
among patients with identical mutations [10–13]. This
suggests that quantitative assessment of coagulation fac-
tor levels or activities alone is not fully predictive of
bleeding risk. Traditional tests such as the partial throm-
boplastin time (PTT) use platelet-free plasma (PFP) to
obtain a clotting time in the presence of intrinsic activa-
tors such as kaolin or silica beads. While PTT accurately
evaluates the severity of the factor deficiency in plasma, it
does not always provide reliable predictions of bleeding
Correspondence: Scott L. Diamond, Department of Chemical and
Biomolecular Engineering, Institute for Medicine and Engineering,
1024 Vagelos Research Laboratories, University of Pennsylvania,
Philadelphia, PA 19104, USA.
Tel.: +1 215 573 5704; fax: +1 215 573 6815.
E-mail: [email protected]
Received 24 June 2013
Manuscript handled by: P. de Moerloose
Final decision: F. R. Rosendaal, 16 November 2013
© 2013 International Society on Thrombosis and Haemostasis
Journal of Thrombosis and Haemostasis, 12: 147–158 DOI: 10.1111/jth.12457
risk and the use of more global assays of whole blood
function under flow have been proposed [14]. During bleed-
ing episodes experienced by hemophiliacs, deficits in throm-
bin production may produce deficits in platelet activation/
deposition, fibrin polymerization or platelet-dependent
fibrin deposition. The relative priority of such dysfunc-
tional pathways, distal of FVIIIa/IXa formation, is not
fully resolved in hemophilia.
With the goal of assessing intrinsic coagulation in a low
tissue factor environment under flow, we developed a
model of hemostasis triggered by collagen (no exogenous
TF was added). In this system, whole blood lightly antico-
agulated with a low dose of the activated factor XII
(FXIIa) inhibitor, corn trypsin inhibitor (CTI), was per-
fused over a type 1 collagen surface at a venous shear rate
for 20 min. Platelet and fibrin accumulation were mea-
sured in real time using fluorescently conjugated monoclo-
nal antibodies. Healthy donors as well as hemophilic or
von Willebrand disease patients were studied and the assay
outputs were compared with clinical laboratory test results
such as residual coagulation factor activity level and PTT.
We observed that platelet deposition in the microfluidic
injury model correlated well with PTT. We found that
fibrin generation under flow was switch-like and occurred
only for residual factor levels ≥ 13%, a result that con-
trasts with the continuous range of PTT values. The quan-
tity of fibrin generated was not correlated with factor
activity (or PTT) above the critical value. These results
illustrate that the local generation of thrombin plays a crit-
ical role in the deposition of platelets (in the absence of
TF) and that a threshold level of thrombin is required for
fibrin production to proceed under flow. In regions of the
body where low TF conditions are expected, the attenua-
tion of thrombin generation potential has an impact on
both platelet accumulation and fibrin generation.
Materials and methods
Blood collection and preparation
Blood was drawn from healthy donors (n = 9) or patients
(n = 27) attending a routine visit at the Hemophilia Pro-
gram of the Hospital of the University of Pennsylvania
under Internal Review Board approval of the University
of Pennsylvania. All patient subjects were chronic patients
in a comprehensive bleeding disorders center and had in
most cases extensive duration of follow-up that enabled a
very good assessment of bleeding phenotype. All subjects’
bleeding phenotype was felt to be consistent with their he-
mostatic diagnosis. No correlation of bleeding phenotype
and plasma platelet/fibrinogen levels was attempted.
Healthy donors were self-reported as free of any oral
medications for at least 10 days. Information regarding
patient sex, age, diagnosed bleeding disorder, recent ther-
apy and HIV/HCV viral status was collected. Table 1
presents the demographics of the patient population. In
addition, laboratory values, which included platelet count,
residual coagulation factor activity and partial thrombo-
plastin time (PTT), were collected when available. The
residual coagulation factor of interest was FVIII in
Hemophilia A and VWD diagnoses, FIX in Hemophilia
B diagnoses and Factor XI (FXI) in Hemophilia C diag-
noses. The PTT test assesses the function of the intrinsic
coagulation pathways by measuring the time to clot for-
mation in platelet-free plasma (PFP) in the presence of a
contact activator. PTT values (normal reference range,
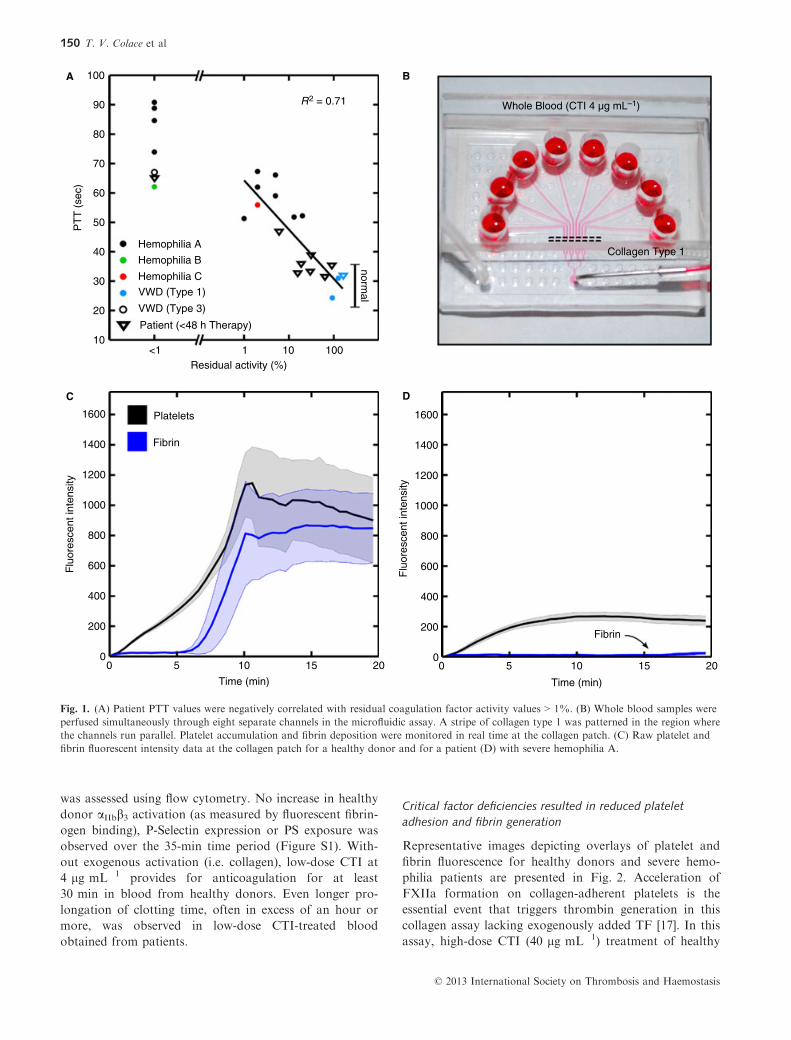
20.8–34.4 s) were negatively correlated with residual coag-
ulation factor activity levels, as expected (Fig. 1A).
Blood was drawn into 4 lg mL�1 corn trypsin inhibitor
(CTI; Haematologic Technologies, Essex Junction, VT,
USA), a low level that is a quantity sufficient to prevent
visible clotting in the test tube for ~30 min but not suffi-
cient to overcome contact activation at the model colla-
gen injury site. Blood samples were treated with
0.125 lg mL�1 fluorescently conjugated anti-CD41a anti-
body (clone VI-PL2; Becton Dickson, Franklin Lakes,
NJ, USA; 0.125 lg mL�1 final concentration) to label
platelets and fluorescently conjugated anti-fibrin antibody
(T2G1; gift from the Mortimer Poncz Laboratory, Chil-
dren’s Hospital of Philadelphia; 0.5 lg mL�1 final con-
centration) to label fibrin. Perfusion of whole blood
samples was started within 10–15 min of venipuncture.
Microfluidic hemostasis model
The microfluidic device used in this study consisted of eight
channels fed by individual inlets and perfused by with-
drawal into a syringe pump (PHD 2000; Harvard Appara-
tus, Holliston, MA, USA) through a single outlet [15]. The
device was casted in poly(dimethylsiloxane) (Sylgard; Ells-
worth Adhesives, Germantown, WI, USA) as previously
described [16]. A 250-lm wide strip of collagen type 1
(Chronopar; Chronolog, Havertown, PA, USA) was local-
ized to the region where the eight channels run parallel
using a microfluidic patterning technique (Fig. 1B). This
technique resulted in a 250 lm 9 250 lm collagen patch
in each channel. The device was blocked with 0.5% bovine
serum albumin in HEPES buffered saline (HBS, 20 mM
HEPES, 150 mM NaCl, pH 7.4) prior to perfusion with
whole blood. Blood samples were perfused at a local wall
shear rate of 100 s�1 (1 lL min�1 per channel), conditions
that are relevant to the hemodynamic environment of the
venous circulation. In some experiments the local wall
shear rate was increased to 1000 s�1 to mimic the condi-
tions of the arterial circulation. The microfluidic devices
were mounted on an inverted microscope (IX81; Olympus,
Center Valley, PA, USA) and the collagen patches were
imaged by a CCD at 30-s intervals (Hamamatsu, Bridge-
water, NJ, USA). The total perfusion time was 20 min.
Representative traces for platelet adhesion and fibrin gen-
eration for healthy donor blood and severe hemophilic
blood are shown in Fig. 1(C,D, respectively).
© 2013 International Society on Thrombosis and Haemostasis
148 T. V. Colace et al
Flow cytometric analysis of platelet activation
Whole blood (4 lg mL�1) CTI was separated into eight
separate 100 lL aliquots. One-microliter samples were
drawn at predefined time-points (0–35 min) from a single
aliquot and added to a well containing 30 nM Apixaban
(Selleck Chemicals, Houston, TX, USA) and 100 lMPPACK (Haematologic Technologies) in 100 lL of HBS.
An aliquot was briefly mixed before the sample was
drawn and discarded immediately after. To measure plate-
let activation, 20 lg mL�1 fluorescent fibrinogen (Life
Technologies, Grand Island, NY, USA), 1:100 fluores-
cently labeled anti-P-selectin (Becton Dickson), and 1:100
fluorescently labeled Annexin V (Life Technologies) were
added to the diluted whole blood. Samples were incu-
bated for 10 min with the fluorescent labels before read-
ing with the flow cytometer (Accuri C6; Becton Dickson).
Positive controls were activated with 5 nM convulxin
(Centerchem, Norwalk, CT, USA).
Statistical analysis
Total platelet and fibrin fluorescence, which are propor-
tional to platelet and fibrin mass, respectively, were
recorded at the 15-min time-point or at the first frame
that indicated full channel occlusion. Fifteen minutes was
chosen, as opposed to the full perfusion time of 20 min,
because most samples reached an endpoint (i.e. steady
state growth or full occlusion) in < 15 min. These values
represent the mean of eight individual clotting events per-
formed in parallel for each donor. Interdonor variability
was calculated as the ratio of the standard deviation to
the mean of the device averages for all donors multiplied
by 100 (% coefficient of variation). Intradonor variability
was calculated using the same formula considering the
eight individual channel readings for a single donor; that
value was then averaged over all donors. Platelet growth
rate was calculated assuming no fluorescence at the first
time-point. Fibrin growth rate was calculated using the
first frame at which fibrin fluorescence was > 100 fluores-
cence units (an arbitrary value). The final time-point for
both rates was either full channel occlusion, a non-occlusive
steady state platelet aggregate, or 15 min, depending
upon which event occurred first. The time to fibrin initia-
tion was extrapolated from the fibrin growth rate line at
a value of 100 fibrin fluorescence units. Statistical signifi-
cance was assessed using the two-tailed Student’s t-test.
Results
Low CTI prevents platelet activation under resting conditions
Platelet activation in healthy donor whole blood
(4 lg mL�1 CTI) aliquots incubated for up to 35 min
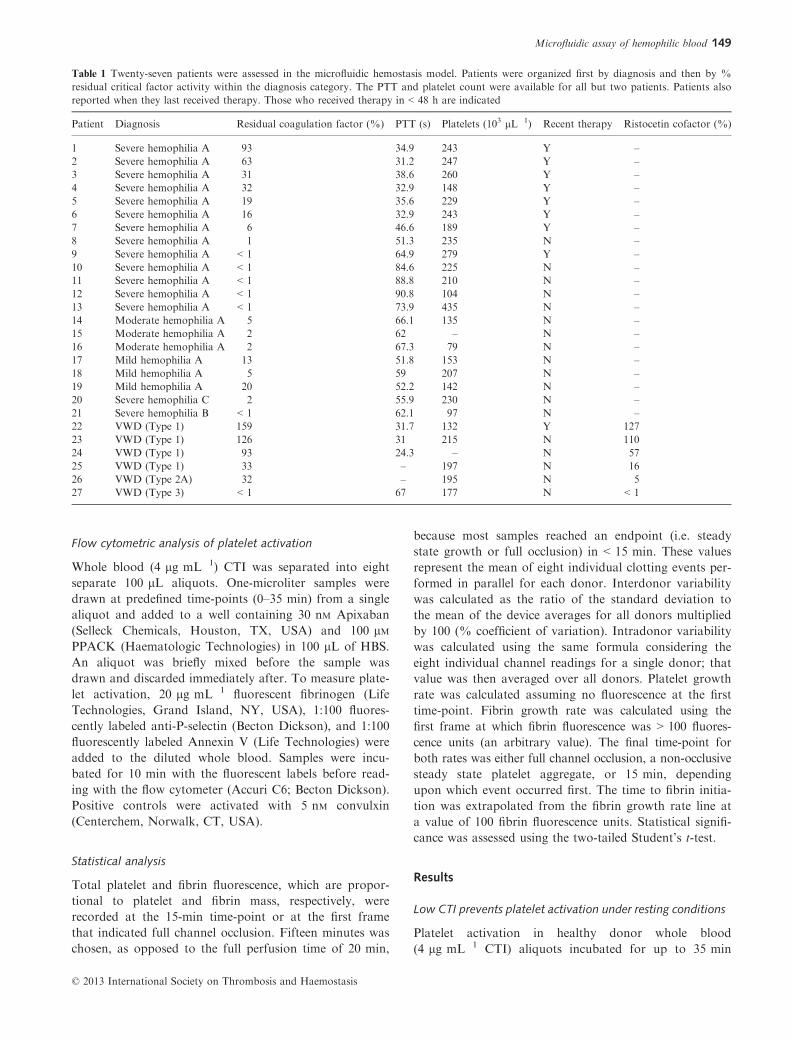
Table 1 Twenty-seven patients were assessed in the microfluidic hemostasis model. Patients were organized first by diagnosis and then by %
residual critical factor activity within the diagnosis category. The PTT and platelet count were available for all but two patients. Patients also
reported when they last received therapy. Those who received therapy in < 48 h are indicated
Patient Diagnosis Residual coagulation factor (%) PTT (s) Platelets (103 lL�1) Recent therapy Ristocetin cofactor (%)
1 Severe hemophilia A 93 34.9 243 Y –2 Severe hemophilia A 63 31.2 247 Y –3 Severe hemophilia A 31 38.6 260 Y –4 Severe hemophilia A 32 32.9 148 Y –5 Severe hemophilia A 19 35.6 229 Y –6 Severe hemophilia A 16 32.9 243 Y –7 Severe hemophilia A 6 46.6 189 Y –8 Severe hemophilia A 1 51.3 235 N –9 Severe hemophilia A < 1 64.9 279 Y –10 Severe hemophilia A < 1 84.6 225 N –11 Severe hemophilia A < 1 88.8 210 N –12 Severe hemophilia A < 1 90.8 104 N –13 Severe hemophilia A < 1 73.9 435 N –14 Moderate hemophilia A 5 66.1 135 N –15 Moderate hemophilia A 2 62 – N –16 Moderate hemophilia A 2 67.3 79 N –17 Mild hemophilia A 13 51.8 153 N –18 Mild hemophilia A 5 59 207 N –19 Mild hemophilia A 20 52.2 142 N –20 Severe hemophilia C 2 55.9 230 N –21 Severe hemophilia B < 1 62.1 97 N –22 VWD (Type 1) 159 31.7 132 Y 127
23 VWD (Type 1) 126 31 215 N 110
24 VWD (Type 1) 93 24.3 – N 57
25 VWD (Type 1) 33 – 197 N 16
26 VWD (Type 2A) 32 – 195 N 5
27 VWD (Type 3) < 1 67 177 N < 1
© 2013 International Society on Thrombosis and Haemostasis
Microfluidic assay of hemophilic blood 149
was assessed using flow cytometry. No increase in healthy
donor aIIbb3 activation (as measured by fluorescent fibrin-
ogen binding), P-Selectin expression or PS exposure was
observed over the 35-min time period (Figure S1). With-
out exogenous activation (i.e. collagen), low-dose CTI at
4 lg mL�1 provides for anticoagulation for at least
30 min in blood from healthy donors. Even longer pro-
longation of clotting time, often in excess of an hour or
more, was observed in low-dose CTI-treated blood
obtained from patients.
Critical factor deficiencies resulted in reduced platelet
adhesion and fibrin generation
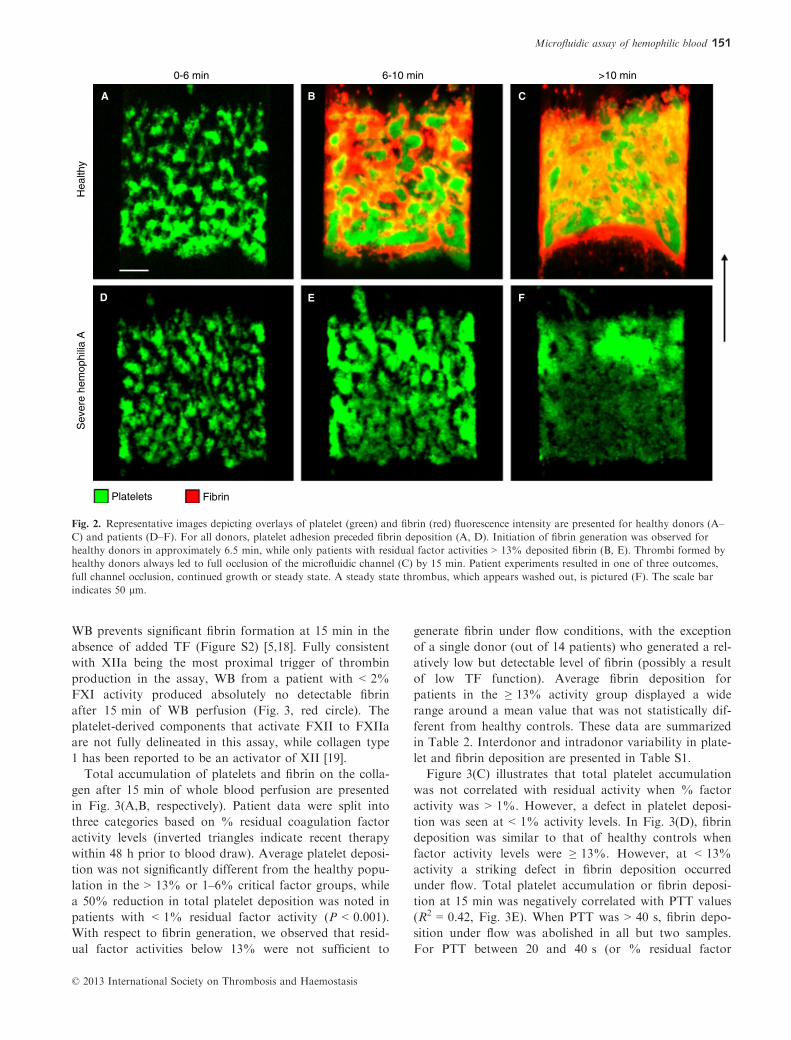
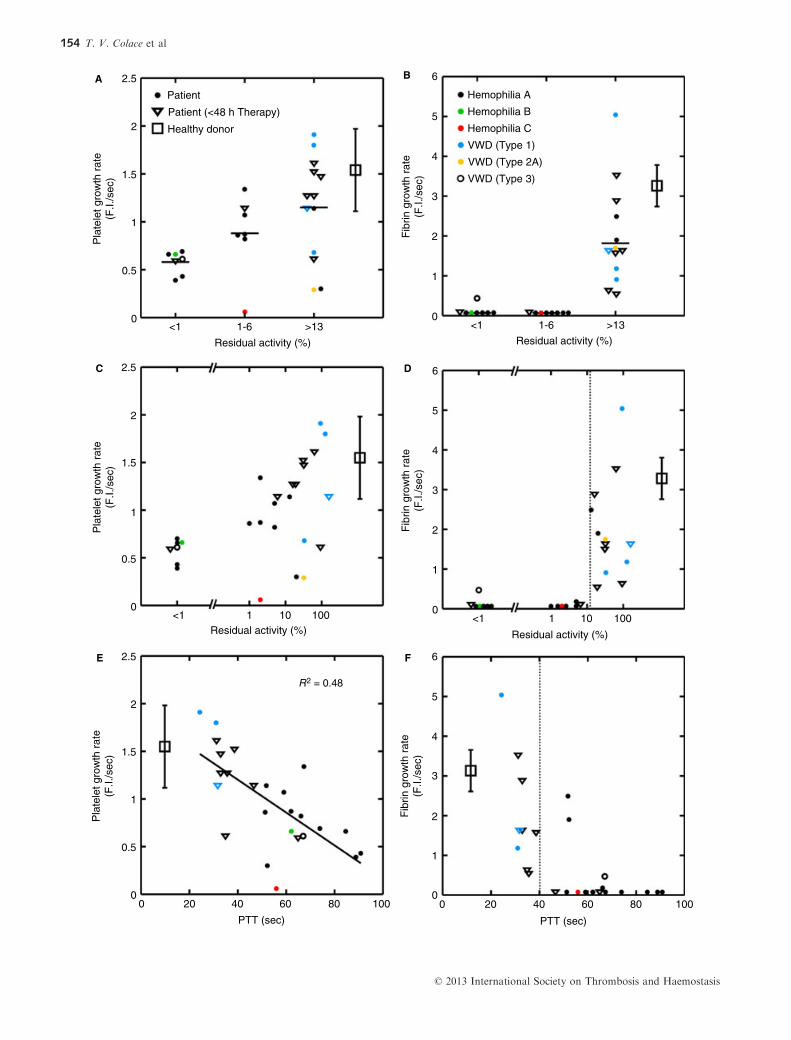
Representative images depicting overlays of platelet and
fibrin fluorescence for healthy donors and severe hemo-
philia patients are presented in Fig. 2. Acceleration of
FXIIa formation on collagen-adherent platelets is the
essential event that triggers thrombin generation in this
collagen assay lacking exogenously added TF [17]. In this
assay, high-dose CTI (40 lg mL�1) treatment of healthy
100
90
80
70
60
50PT
T (
sec)
40Hemophilia A
Whole Blood (CTI 4 µg mL–1)
Collagen Type 1
R2 = 0.71
Hemophilia B
Hemophilia C
VWD (Type 1)
VWD (Type 3)
Patient (<48 h Therapy)
Residual activity (%)
Platelets1600
1400
1200
1000
800 800
Flu
ores
cent
inte
nsity
600
400
200
0
1600
1400
1200
1000
Flu
ores
cent
inte
nsity
600
400
200
00 5 10
Time (min)
15 20 0 5 10
Fibrin
Time (min)
15 20
Fibrin
<1 1 10 100
normal
30
20
10
A
C
B
D
Fig. 1. (A) Patient PTT values were negatively correlated with residual coagulation factor activity values > 1%. (B) Whole blood samples were
perfused simultaneously through eight separate channels in the microfluidic assay. A stripe of collagen type 1 was patterned in the region where
the channels run parallel. Platelet accumulation and fibrin deposition were monitored in real time at the collagen patch. (C) Raw platelet and
fibrin fluorescent intensity data at the collagen patch for a healthy donor and for a patient (D) with severe hemophilia A.
© 2013 International Society on Thrombosis and Haemostasis
150 T. V. Colace et al
WB prevents significant fibrin formation at 15 min in the
absence of added TF (Figure S2) [5,18]. Fully consistent
with XIIa being the most proximal trigger of thrombin
production in the assay, WB from a patient with < 2%
FXI activity produced absolutely no detectable fibrin
after 15 min of WB perfusion (Fig. 3, red circle). The
platelet-derived components that activate FXII to FXIIa
are not fully delineated in this assay, while collagen type
1 has been reported to be an activator of XII [19].
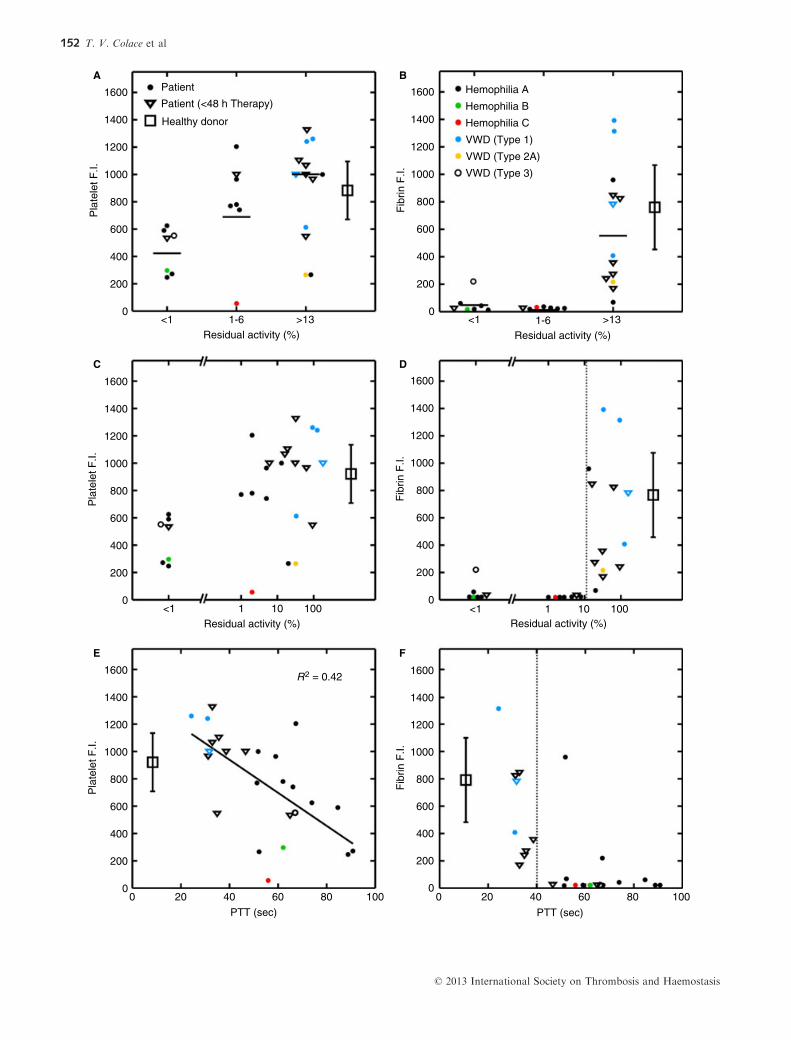
Total accumulation of platelets and fibrin on the colla-
gen after 15 min of whole blood perfusion are presented
in Fig. 3(A,B, respectively). Patient data were split into
three categories based on % residual coagulation factor
activity levels (inverted triangles indicate recent therapy
within 48 h prior to blood draw). Average platelet deposi-
tion was not significantly different from the healthy popu-
lation in the > 13% or 1–6% critical factor groups, while
a 50% reduction in total platelet deposition was noted in
patients with < 1% residual factor activity (P < 0.001).
With respect to fibrin generation, we observed that resid-
ual factor activities below 13% were not sufficient to
generate fibrin under flow conditions, with the exception
of a single donor (out of 14 patients) who generated a rel-
atively low but detectable level of fibrin (possibly a result
of low TF function). Average fibrin deposition for
patients in the ≥ 13% activity group displayed a wide
range around a mean value that was not statistically dif-
ferent from healthy controls. These data are summarized
in Table 2. Interdonor and intradonor variability in plate-
let and fibrin deposition are presented in Table S1.
Figure 3(C) illustrates that total platelet accumulation
was not correlated with residual activity when % factor
activity was > 1%. However, a defect in platelet deposi-
tion was seen at < 1% activity levels. In Fig. 3(D), fibrin
deposition was similar to that of healthy controls when
factor activity levels were ≥ 13%. However, at < 13%
activity a striking defect in fibrin deposition occurred
under flow. Total platelet accumulation or fibrin deposi-
tion at 15 min was negatively correlated with PTT values
(R2 = 0.42, Fig. 3E). When PTT was > 40 s, fibrin depo-
sition under flow was abolished in all but two samples.
For PTT between 20 and 40 s (or % residual factor
0-6 min
Platelets Fibrin
Hea
lthy
Sev
ere
hem
ophi
lia A
6-10 min >10 min
A B C
D E F
Fig. 2. Representative images depicting overlays of platelet (green) and fibrin (red) fluorescence intensity are presented for healthy donors (A–C) and patients (D–F). For all donors, platelet adhesion preceded fibrin deposition (A, D). Initiation of fibrin generation was observed for
healthy donors in approximately 6.5 min, while only patients with residual factor activities > 13% deposited fibrin (B, E). Thrombi formed by
healthy donors always led to full occlusion of the microfluidic channel (C) by 15 min. Patient experiments resulted in one of three outcomes,
full channel occlusion, continued growth or steady state. A steady state thrombus, which appears washed out, is pictured (F). The scale bar
indicates 50 lm.
© 2013 International Society on Thrombosis and Haemostasis
Microfluidic assay of hemophilic blood 151
1600
1400
1200
1000
Pla
tele
t F.I.
800
600
400
200
0
1600
1400
1200
1000
Pla
tele
t F.I.
800
600
400
200
0
1600
1400
1200
1000
Pla
tele
t F.I.
800
600
400
200
00 20
PTT (sec)
6040 80 100 0 20 40
PTT (sec)
60 80 100
Patient (<48 h Therapy)
Patient
Healthy donor
<1 1-6 >13Residual activity (%)
1600
1400
1200
1000
Fib
rin F
.I.F
ibrin
F.I.
800
600
400
200
0<1 1-6 >13
Residual activity (%)
Hemophilia A
Hemophilia B
Hemophilia C
VWD (Type 1)
VWD (Type 3)
VWD (Type 2A)
Residual activity (%)<1 1 10 100
1600
1400
1200
1000
800
600
400
200
0
Fib
rin F
.I.
1600
1400
1200
1000
800
600
400
200
0
Residual activity (%)<1 1 10 100
R2 = 0.42
A B
C D
E F
© 2013 International Society on Thrombosis and Haemostasis
152 T. V. Colace et al
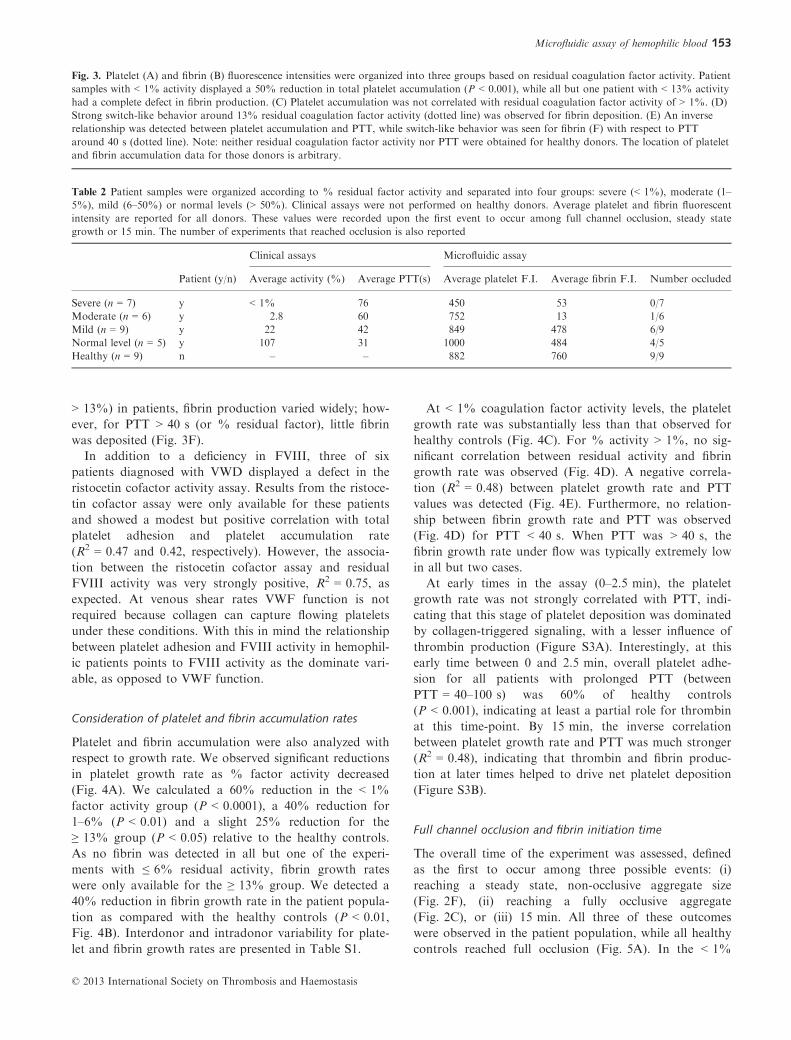
> 13%) in patients, fibrin production varied widely; how-
ever, for PTT > 40 s (or % residual factor), little fibrin
was deposited (Fig. 3F).
In addition to a deficiency in FVIII, three of six
patients diagnosed with VWD displayed a defect in the
ristocetin cofactor activity assay. Results from the ristoce-
tin cofactor assay were only available for these patients
and showed a modest but positive correlation with total
platelet adhesion and platelet accumulation rate
(R2 = 0.47 and 0.42, respectively). However, the associa-
tion between the ristocetin cofactor assay and residual
FVIII activity was very strongly positive, R2 = 0.75, as
expected. At venous shear rates VWF function is not
required because collagen can capture flowing platelets
under these conditions. With this in mind the relationship
between platelet adhesion and FVIII activity in hemophil-
ic patients points to FVIII activity as the dominate vari-
able, as opposed to VWF function.
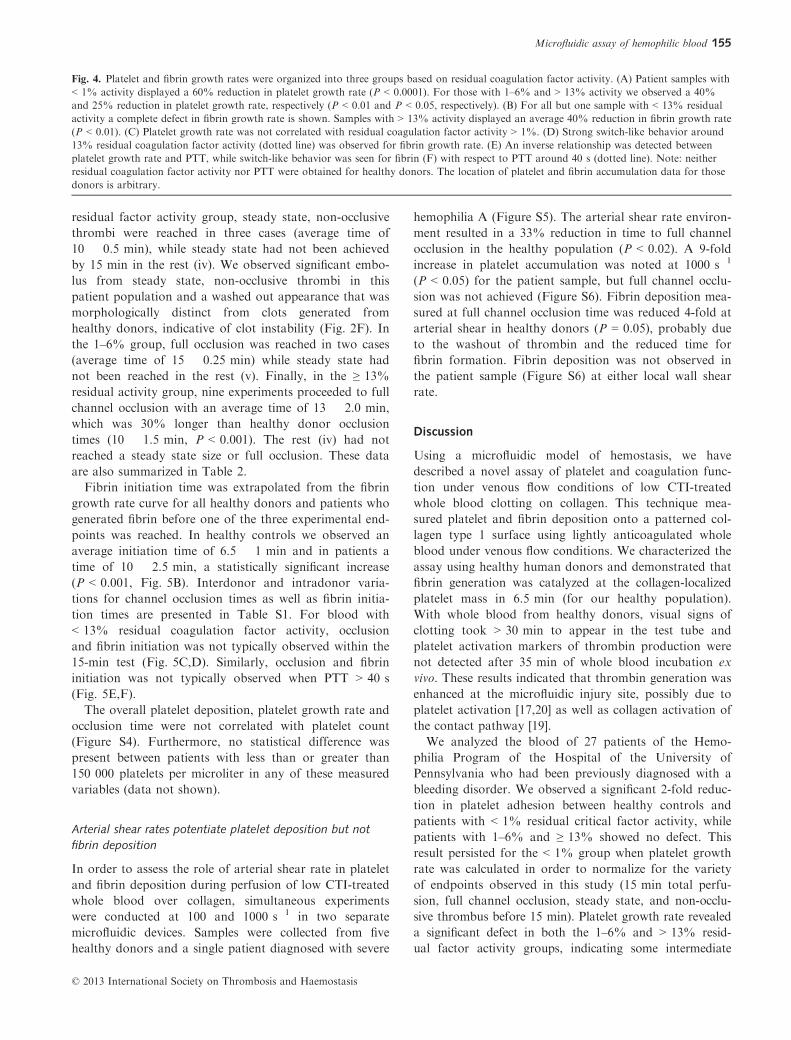
Consideration of platelet and fibrin accumulation rates
Platelet and fibrin accumulation were also analyzed with
respect to growth rate. We observed significant reductions
in platelet growth rate as % factor activity decreased
(Fig. 4A). We calculated a 60% reduction in the < 1%
factor activity group (P < 0.0001), a 40% reduction for
1–6% (P < 0.01) and a slight 25% reduction for the
≥ 13% group (P < 0.05) relative to the healthy controls.
As no fibrin was detected in all but one of the experi-
ments with ≤ 6% residual activity, fibrin growth rates
were only available for the ≥ 13% group. We detected a
40% reduction in fibrin growth rate in the patient popula-
tion as compared with the healthy controls (P < 0.01,
Fig. 4B). Interdonor and intradonor variability for plate-
let and fibrin growth rates are presented in Table S1.
At < 1% coagulation factor activity levels, the platelet
growth rate was substantially less than that observed for
healthy controls (Fig. 4C). For % activity > 1%, no sig-
nificant correlation between residual activity and fibrin
growth rate was observed (Fig. 4D). A negative correla-
tion (R2 = 0.48) between platelet growth rate and PTT
values was detected (Fig. 4E). Furthermore, no relation-
ship between fibrin growth rate and PTT was observed
(Fig. 4D) for PTT < 40 s. When PTT was > 40 s, the
fibrin growth rate under flow was typically extremely low
in all but two cases.
At early times in the assay (0–2.5 min), the platelet
growth rate was not strongly correlated with PTT, indi-
cating that this stage of platelet deposition was dominated
by collagen-triggered signaling, with a lesser influence of
thrombin production (Figure S3A). Interestingly, at this
early time between 0 and 2.5 min, overall platelet adhe-
sion for all patients with prolonged PTT (between
PTT = 40–100 s) was 60% of healthy controls
(P < 0.001), indicating at least a partial role for thrombin
at this time-point. By 15 min, the inverse correlation
between platelet growth rate and PTT was much stronger
(R2 = 0.48), indicating that thrombin and fibrin produc-
tion at later times helped to drive net platelet deposition
(Figure S3B).
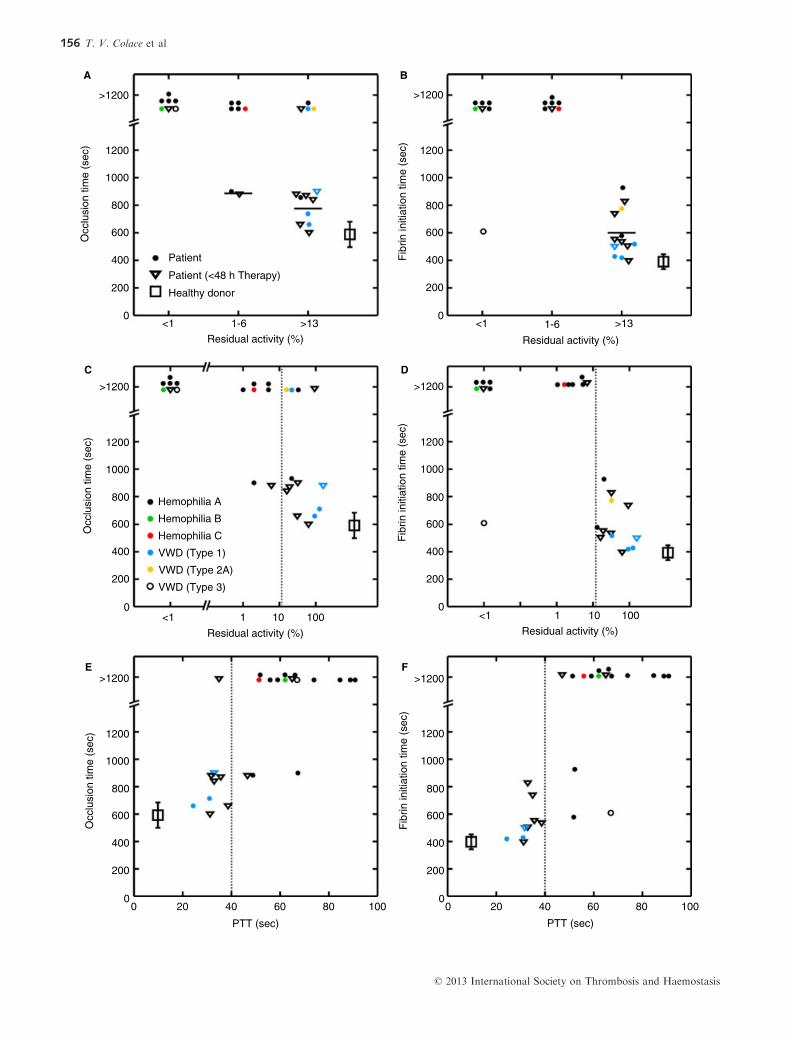
Full channel occlusion and fibrin initiation time
The overall time of the experiment was assessed, defined
as the first to occur among three possible events: (i)
reaching a steady state, non-occlusive aggregate size
(Fig. 2F), (ii) reaching a fully occlusive aggregate
(Fig. 2C), or (iii) 15 min. All three of these outcomes
were observed in the patient population, while all healthy
controls reached full occlusion (Fig. 5A). In the < 1%
Table 2 Patient samples were organized according to % residual factor activity and separated into four groups: severe (< 1%), moderate (1–5%), mild (6–50%) or normal levels (> 50%). Clinical assays were not performed on healthy donors. Average platelet and fibrin fluorescent
intensity are reported for all donors. These values were recorded upon the first event to occur among full channel occlusion, steady state
growth or 15 min. The number of experiments that reached occlusion is also reported
Patient (y/n)
Clinical assays Microfluidic assay
Average activity (%) Average PTT(s) Average platelet F.I. Average fibrin F.I. Number occluded
Severe (n = 7) y < 1% 76 450 53 0/7
Moderate (n = 6) y 2.8 60 752 13 1/6
Mild (n = 9) y 22 42 849 478 6/9
Normal level (n = 5) y 107 31 1000 484 4/5
Healthy (n = 9) n – – 882 760 9/9
Fig. 3. Platelet (A) and fibrin (B) fluorescence intensities were organized into three groups based on residual coagulation factor activity. Patient
samples with < 1% activity displayed a 50% reduction in total platelet accumulation (P < 0.001), while all but one patient with < 13% activity
had a complete defect in fibrin production. (C) Platelet accumulation was not correlated with residual coagulation factor activity of > 1%. (D)
Strong switch-like behavior around 13% residual coagulation factor activity (dotted line) was observed for fibrin deposition. (E) An inverse
relationship was detected between platelet accumulation and PTT, while switch-like behavior was seen for fibrin (F) with respect to PTT
around 40 s (dotted line). Note: neither residual coagulation factor activity nor PTT were obtained for healthy donors. The location of platelet
and fibrin accumulation data for those donors is arbitrary.
© 2013 International Society on Thrombosis and Haemostasis
Microfluidic assay of hemophilic blood 153
2.5
2
1
0<1 >131-6
1.5
0.5
Pla
tele
t gro
wth
rat
e(F
.I./s
ec)
2.5
2
1
0
1.5
0.5
Pla
tele
t gro
wth
rat
e(F
.I./s
ec)
2.5
2
1
0
1.5
0.5
Pla
tele
t gro
wth
rat
e(F
.I./s
ec)
Fib
rin g
row
th r
ate
(F.I.
/sec
)
Residual activity (%)
<1 >131-6
Residual activity (%)
Patient (<48 h Therapy)
Patient
6
5
4
3
2
1
0
Fib
rin g
row
th r
ate
(F.I.
/sec
)
6
5
4
3
2
1
0
Fib
rin g
row
th r
ate
(F.I.
/sec
)
6
5
4
3
2
1
0
Healthy donor
Hemophilia A
Hemophilia B
Hemophilia C
VWD (Type 1)
VWD (Type 3)
VWD (Type 2A)
Residual activity (%)<1 1 10 100
Residual activity (%)
<1 1 10 100
0 20
PTT (sec)
6040 80 100 0 20 40
PTT (sec)
60 80 100
R2 = 0.48
A B
C D
E F
© 2013 International Society on Thrombosis and Haemostasis
154 T. V. Colace et al
residual factor activity group, steady state, non-occlusive
thrombi were reached in three cases (average time of
10 � 0.5 min), while steady state had not been achieved
by 15 min in the rest (iv). We observed significant embo-
lus from steady state, non-occlusive thrombi in this
patient population and a washed out appearance that was
morphologically distinct from clots generated from
healthy donors, indicative of clot instability (Fig. 2F). In
the 1–6% group, full occlusion was reached in two cases
(average time of 15 � 0.25 min) while steady state had
not been reached in the rest (v). Finally, in the ≥ 13%
residual activity group, nine experiments proceeded to full
channel occlusion with an average time of 13 � 2.0 min,
which was 30% longer than healthy donor occlusion
times (10 � 1.5 min, P < 0.001). The rest (iv) had not
reached a steady state size or full occlusion. These data
are also summarized in Table 2.
Fibrin initiation time was extrapolated from the fibrin
growth rate curve for all healthy donors and patients who
generated fibrin before one of the three experimental end-
points was reached. In healthy controls we observed an
average initiation time of 6.5 � 1 min and in patients a
time of 10 � 2.5 min, a statistically significant increase
(P < 0.001, Fig. 5B). Interdonor and intradonor varia-
tions for channel occlusion times as well as fibrin initia-
tion times are presented in Table S1. For blood with
< 13% residual coagulation factor activity, occlusion
and fibrin initiation was not typically observed within the
15-min test (Fig. 5C,D). Similarly, occlusion and fibrin
initiation was not typically observed when PTT > 40 s
(Fig. 5E,F).
The overall platelet deposition, platelet growth rate and
occlusion time were not correlated with platelet count
(Figure S4). Furthermore, no statistical difference was
present between patients with less than or greater than
150 000 platelets per microliter in any of these measured
variables (data not shown).
Arterial shear rates potentiate platelet deposition but not
fibrin deposition
In order to assess the role of arterial shear rate in platelet
and fibrin deposition during perfusion of low CTI-treated
whole blood over collagen, simultaneous experiments
were conducted at 100 and 1000 s�1 in two separate
microfluidic devices. Samples were collected from five
healthy donors and a single patient diagnosed with severe
hemophilia A (Figure S5). The arterial shear rate environ-
ment resulted in a 33% reduction in time to full channel
occlusion in the healthy population (P < 0.02). A 9-fold
increase in platelet accumulation was noted at 1000 s�1
(P < 0.05) for the patient sample, but full channel occlu-
sion was not achieved (Figure S6). Fibrin deposition mea-
sured at full channel occlusion time was reduced 4-fold at
arterial shear in healthy donors (P = 0.05), probably due
to the washout of thrombin and the reduced time for
fibrin formation. Fibrin deposition was not observed in
the patient sample (Figure S6) at either local wall shear
rate.
Discussion
Using a microfluidic model of hemostasis, we have
described a novel assay of platelet and coagulation func-
tion under venous flow conditions of low CTI-treated
whole blood clotting on collagen. This technique mea-
sured platelet and fibrin deposition onto a patterned col-
lagen type 1 surface using lightly anticoagulated whole
blood under venous flow conditions. We characterized the
assay using healthy human donors and demonstrated that
fibrin generation was catalyzed at the collagen-localized
platelet mass in 6.5 min (for our healthy population).
With whole blood from healthy donors, visual signs of
clotting took > 30 min to appear in the test tube and
platelet activation markers of thrombin production were
not detected after 35 min of whole blood incubation ex
vivo. These results indicated that thrombin generation was
enhanced at the microfluidic injury site, possibly due to
platelet activation [17,20] as well as collagen activation of
the contact pathway [19].
We analyzed the blood of 27 patients of the Hemo-
philia Program of the Hospital of the University of
Pennsylvania who had been previously diagnosed with a
bleeding disorder. We observed a significant 2-fold reduc-
tion in platelet adhesion between healthy controls and
patients with < 1% residual critical factor activity, while
patients with 1–6% and ≥ 13% showed no defect. This
result persisted for the < 1% group when platelet growth
rate was calculated in order to normalize for the variety
of endpoints observed in this study (15 min total perfu-
sion, full channel occlusion, steady state, and non-occlu-
sive thrombus before 15 min). Platelet growth rate revealed
a significant defect in both the 1–6% and > 13% resid-
ual factor activity groups, indicating some intermediate
Fig. 4. Platelet and fibrin growth rates were organized into three groups based on residual coagulation factor activity. (A) Patient samples with
< 1% activity displayed a 60% reduction in platelet growth rate (P < 0.0001). For those with 1–6% and > 13% activity we observed a 40%
and 25% reduction in platelet growth rate, respectively (P < 0.01 and P < 0.05, respectively). (B) For all but one sample with < 13% residual
activity a complete defect in fibrin growth rate is shown. Samples with > 13% activity displayed an average 40% reduction in fibrin growth rate
(P < 0.01). (C) Platelet growth rate was not correlated with residual coagulation factor activity > 1%. (D) Strong switch-like behavior around
13% residual coagulation factor activity (dotted line) was observed for fibrin growth rate. (E) An inverse relationship was detected between
platelet growth rate and PTT, while switch-like behavior was seen for fibrin (F) with respect to PTT around 40 s (dotted line). Note: neither
residual coagulation factor activity nor PTT were obtained for healthy donors. The location of platelet and fibrin accumulation data for those
donors is arbitrary.
© 2013 International Society on Thrombosis and Haemostasis
Microfluidic assay of hemophilic blood 155
0 20
PTT (sec)
6040 80 100 0 20 40
PTT (sec)
60 80 100
<1
>1200
1200
Occ
lusi
on ti
me
(sec
)
1000
800
600
400
200
0
>1200
1200
Occ
lusi
on ti
me
(sec
)
1000
800
600
400
200
0
>1200
1200
Occ
lusi
on ti
me
(sec
)
1000
800
600
400
200
0
>1200
1200
Fib
rin in
itiat
ion
time
(sec
)
1000
800
600
400
200
0
>1200
1200
Fib
rin in
itiat
ion
time
(sec
)
1000
800
600
400
200
0
>1200
1200
Fib
rin in
itiat
ion
time
(sec
)
1000
800
600
400
200
0
1-6 >13
Residual activity (%)
<1 1-6 >13
Residual activity (%)
Residual activity (%)
<1 1 10 100Residual activity (%)
<1 1 10 100
Patient (<48 h Therapy)
Patient
Healthy donor
Hemophilia A
Hemophilia B
Hemophilia C
VWD (Type 1)
VWD (Type 3)
VWD (Type 2A)
A B
C D
E F
© 2013 International Society on Thrombosis and Haemostasis
156 T. V. Colace et al
deficiency in thrombin generation potential for these
groups. Taken together, these results indicate that intrin-
sically generated thrombin enhances platelet deposition in
this assay of platelet adhesion to collagen in the absence
of exogenously added TF.
Fibrin deposition revealed a more striking result as all
but one donor with < 13% of factor activity levels dis-
played a complete defect. Fibrin deposition in the ≥ 13%
group was not significantly different from healthy con-
trols. Fibrin accumulation and fibrin growth displayed
switch-like behavior, which has been reported before for
surfaces of collagen and TF [6,7]. In the case of the
extrinsic pathway, a critical level of TF was required to
overcome the effects of flow-mediated washout of acti-
vated coagulation factors and fibrin monomer, as well as
endogenous inhibitors, such as TFPI [6]. We found that a
minimum level of 13% residual FVIII activity (in hemo-
philia A patients) was required to overcome these effects
in our microfluidic assay. Our group has previously dem-
onstrated the importance of thrombin flux and washout
in a model of fibrin deposition under flow using purified
proteins [21]. Interestingly, our results indicate that an
intermediate level of thrombin generation may exist for
the 1–6% residual coagulation factor activity group that
is capable of enhancing platelet deposition but not of gen-
erating fibrin.
Severe hemophilia is associated with < 1% of normal
coagulation factor activity. Based upon the findings with
microfluidic tests, the bleeding in patients with < 1% fac-
tor activity may be linked to deficits in both platelet and
fibrin deposition. During treatment or in patients with
moderate to mild hemophilia, the spontaneous bleeding
risk is mitigated when factor levels are raised to > 1%
activity [22]. Here we demonstrated that the ability to
generate low levels of thrombin under flow at 1–6% of
normal FVIII may potentiate platelet deposition and
aggregate stability to maintain hemostasis via PAR1/
PAR4 signaling [16]. However, a > 1% activity level
(PTT of ~40–60 s) does not necessarily rescue fibrin for-
mation under flow. Recently our group has demonstrated
that the polymerization of fibrin into a growing thrombus
provides stability against increasing shear rates [7]. In
patients with severe hemophilia A we observed a com-
plete defect in the ability to achieve full microfluidic chan-
nel occlusion. In fact three of four samples produced
steady state clots that appeared to embolize after the ini-
tial collagen-driven platelet deposition phase. These
results suggest the need for further evaluation of the
maintenance of elevated trough levels to reduce the varia-
tion of bleeding phenotypes observed in patients on pro-
phylactic therapy [23].
In this study we set out to investigate the role of
thrombin generated via the contact pathway in thrombus
growth in a microfluidic assay of vessel injury under flow
conditions in a low TF environment. We observed that
whole blood flow over exposed collagen type 1 could sup-
port platelet aggregation and fibrin generation in a man-
ner influenced by the activation of intrinsic coagulation.
Defects in the function of FVIII, FIX or FXI led to mea-
surable reductions in overall accumulation of platelets
and fibrin, as well as in their growth rates. Changes in
the microfluidic platelet function in patient samples could
be predicted by the PTT test, highlighting an important
role for thrombin in aggregate growth and stability.
Intrinsic coagulation was enhanced at the microfluidic
injury site, occurring in just 6.5 min for healthy donors,
as compared to > 30 min in the test tube. The generation
of measurable quantities of fibrin in patient samples was
switch-like with respect to residual coagulation factor
activity as well as PTT, suggesting a requirement for
threshold levels of thrombin generation. In the future,
whole blood microfluidic assays to assess platelet and
coagulation function may replace static assays as they
capture more details of the hemostatic mechanism.
Addendum
Experiments were designed by T.V. Colace, P.F. Fogarty
and S.L. Diamond. T.V. Colace, K.A. Panckeri and R.
Li collected the data. K.A. Panckeri was responsible for
patient enrollment. Data analysis was performed by T.V.
Colace, R. Li and S.L. Diamond. The manuscript was
written by T.V. Colace, R. Li and S.L. Diamond. All
authors participated in manuscript revision and final
approval.
Acknowledgement
This work was supported by the National Institutes of
Health NIH R01 HL103419 (S.L. Diamond), a predoc-
toral training grant (5T32HL007439-33) to T.V. Colace
from the NIH, and in part through HHS Federal Region
III Hemophilia Treatment Centers MCHB grant
#H30MC24050 to P.F. Forgarty.
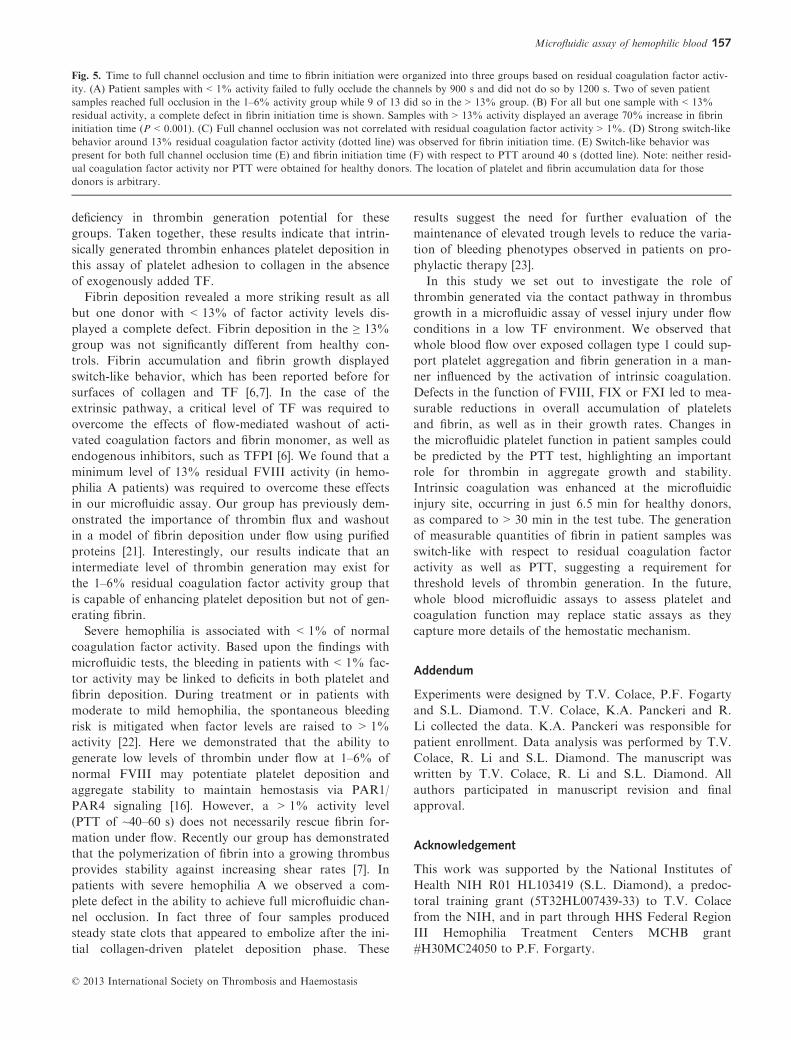
Fig. 5. Time to full channel occlusion and time to fibrin initiation were organized into three groups based on residual coagulation factor activ-
ity. (A) Patient samples with < 1% activity failed to fully occlude the channels by 900 s and did not do so by 1200 s. Two of seven patient
samples reached full occlusion in the 1–6% activity group while 9 of 13 did so in the > 13% group. (B) For all but one sample with < 13%
residual activity, a complete defect in fibrin initiation time is shown. Samples with > 13% activity displayed an average 70% increase in fibrin
initiation time (P < 0.001). (C) Full channel occlusion was not correlated with residual coagulation factor activity > 1%. (D) Strong switch-like
behavior around 13% residual coagulation factor activity (dotted line) was observed for fibrin initiation time. (E) Switch-like behavior was
present for both full channel occlusion time (E) and fibrin initiation time (F) with respect to PTT around 40 s (dotted line). Note: neither resid-
ual coagulation factor activity nor PTT were obtained for healthy donors. The location of platelet and fibrin accumulation data for those
donors is arbitrary.
© 2013 International Society on Thrombosis and Haemostasis
Microfluidic assay of hemophilic blood 157
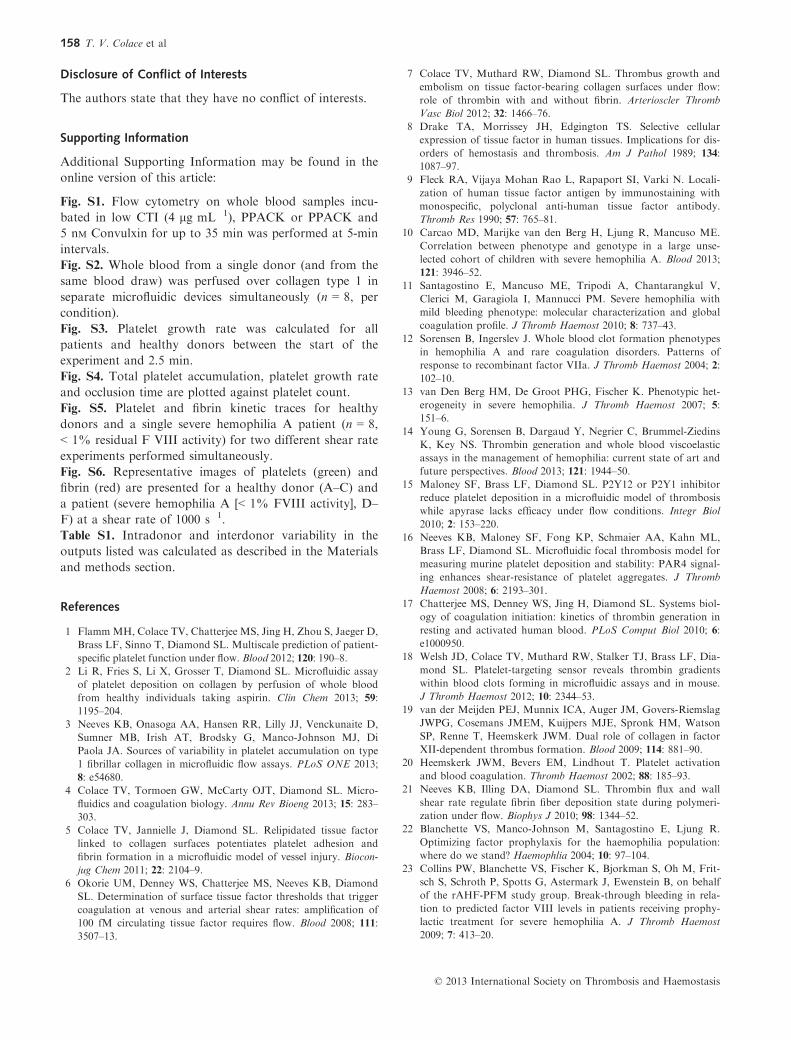
Disclosure of Conflict of Interests
The authors state that they have no conflict of interests.
Supporting Information
Additional Supporting Information may be found in the
online version of this article:
Fig. S1. Flow cytometry on whole blood samples incu-
bated in low CTI (4 lg mL�1), PPACK or PPACK and
5 nM Convulxin for up to 35 min was performed at 5-min
intervals.
Fig. S2. Whole blood from a single donor (and from the
same blood draw) was perfused over collagen type 1 in
separate microfluidic devices simultaneously (n = 8, per
condition).
Fig. S3. Platelet growth rate was calculated for all
patients and healthy donors between the start of the
experiment and 2.5 min.
Fig. S4. Total platelet accumulation, platelet growth rate
and occlusion time are plotted against platelet count.
Fig. S5. Platelet and fibrin kinetic traces for healthy
donors and a single severe hemophilia A patient (n = 8,
< 1% residual F VIII activity) for two different shear rate
experiments performed simultaneously.
Fig. S6. Representative images of platelets (green) and
fibrin (red) are presented for a healthy donor (A–C) anda patient (severe hemophilia A [< 1% FVIII activity], D–F) at a shear rate of 1000 s�1.
Table S1. Intradonor and interdonor variability in the
outputs listed was calculated as described in the Materials
and methods section.
References
1 FlammMH, Colace TV, Chatterjee MS, Jing H, Zhou S, Jaeger D,
Brass LF, Sinno T, Diamond SL. Multiscale prediction of patient-
specific platelet function under flow. Blood 2012; 120: 190–8.2 Li R, Fries S, Li X, Grosser T, Diamond SL. Microfluidic assay
of platelet deposition on collagen by perfusion of whole blood
from healthy individuals taking aspirin. Clin Chem 2013; 59:
1195–204.3 Neeves KB, Onasoga AA, Hansen RR, Lilly JJ, Venckunaite D,
Sumner MB, Irish AT, Brodsky G, Manco-Johnson MJ, Di
Paola JA. Sources of variability in platelet accumulation on type
1 fibrillar collagen in microfluidic flow assays. PLoS ONE 2013;
8: e54680.
4 Colace TV, Tormoen GW, McCarty OJT, Diamond SL. Micro-
fluidics and coagulation biology. Annu Rev Bioeng 2013; 15: 283–303.
5 Colace TV, Jannielle J, Diamond SL. Relipidated tissue factor
linked to collagen surfaces potentiates platelet adhesion and
fibrin formation in a microfluidic model of vessel injury. Biocon-
jug Chem 2011; 22: 2104–9.6 Okorie UM, Denney WS, Chatterjee MS, Neeves KB, Diamond
SL. Determination of surface tissue factor thresholds that trigger
coagulation at venous and arterial shear rates: amplification of
100 fM circulating tissue factor requires flow. Blood 2008; 111:
3507–13.
7 Colace TV, Muthard RW, Diamond SL. Thrombus growth and
embolism on tissue factor-bearing collagen surfaces under flow:
role of thrombin with and without fibrin. Arterioscler Thromb
Vasc Biol 2012; 32: 1466–76.8 Drake TA, Morrissey JH, Edgington TS. Selective cellular
expression of tissue factor in human tissues. Implications for dis-
orders of hemostasis and thrombosis. Am J Pathol 1989; 134:
1087–97.9 Fleck RA, Vijaya Mohan Rao L, Rapaport SI, Varki N. Locali-
zation of human tissue factor antigen by immunostaining with
monospecific, polyclonal anti-human tissue factor antibody.
Thromb Res 1990; 57: 765–81.10 Carcao MD, Marijke van den Berg H, Ljung R, Mancuso ME.
Correlation between phenotype and genotype in a large unse-
lected cohort of children with severe hemophilia A. Blood 2013;
121: 3946–52.11 Santagostino E, Mancuso ME, Tripodi A, Chantarangkul V,
Clerici M, Garagiola I, Mannucci PM. Severe hemophilia with
mild bleeding phenotype: molecular characterization and global
coagulation profile. J Thromb Haemost 2010; 8: 737–43.12 Sorensen B, Ingerslev J. Whole blood clot formation phenotypes
in hemophilia A and rare coagulation disorders. Patterns of
response to recombinant factor VIIa. J Thromb Haemost 2004; 2:
102–10.13 van Den Berg HM, De Groot PHG, Fischer K. Phenotypic het-
erogeneity in severe hemophilia. J Thromb Haemost 2007; 5:
151–6.14 Young G, Sorensen B, Dargaud Y, Negrier C, Brummel-Ziedins
K, Key NS. Thrombin generation and whole blood viscoelastic
assays in the management of hemophilia: current state of art and
future perspectives. Blood 2013; 121: 1944–50.15 Maloney SF, Brass LF, Diamond SL. P2Y12 or P2Y1 inhibitor
reduce platelet deposition in a microfluidic model of thrombosis
while apyrase lacks efficacy under flow conditions. Integr Biol
2010; 2: 153–220.16 Neeves KB, Maloney SF, Fong KP, Schmaier AA, Kahn ML,
Brass LF, Diamond SL. Microfluidic focal thrombosis model for
measuring murine platelet deposition and stability: PAR4 signal-
ing enhances shear-resistance of platelet aggregates. J Thromb
Haemost 2008; 6: 2193–301.17 Chatterjee MS, Denney WS, Jing H, Diamond SL. Systems biol-
ogy of coagulation initiation: kinetics of thrombin generation in
resting and activated human blood. PLoS Comput Biol 2010; 6:
e1000950.
18 Welsh JD, Colace TV, Muthard RW, Stalker TJ, Brass LF, Dia-
mond SL. Platelet-targeting sensor reveals thrombin gradients
within blood clots forming in microfluidic assays and in mouse.
J Thromb Haemost 2012; 10: 2344–53.19 van der Meijden PEJ, Munnix ICA, Auger JM, Govers-Riemslag
JWPG, Cosemans JMEM, Kuijpers MJE, Spronk HM, Watson
SP, Renne T, Heemskerk JWM. Dual role of collagen in factor
XII-dependent thrombus formation. Blood 2009; 114: 881–90.20 Heemskerk JWM, Bevers EM, Lindhout T. Platelet activation
and blood coagulation. Thromb Haemost 2002; 88: 185–93.21 Neeves KB, Illing DA, Diamond SL. Thrombin flux and wall
shear rate regulate fibrin fiber deposition state during polymeri-
zation under flow. Biophys J 2010; 98: 1344–52.22 Blanchette VS, Manco-Johnson M, Santagostino E, Ljung R.
Optimizing factor prophylaxis for the haemophilia population:
where do we stand? Haemophlia 2004; 10: 97–104.23 Collins PW, Blanchette VS, Fischer K, Bjorkman S, Oh M, Frit-
sch S, Schroth P, Spotts G, Astermark J, Ewenstein B, on behalf
of the rAHF-PFM study group. Break-through bleeding in rela-
tion to predicted factor VIII levels in patients receiving prophy-
lactic treatment for severe hemophilia A. J Thromb Haemost
2009; 7: 413–20.
© 2013 International Society on Thrombosis and Haemostasis
158 T. V. Colace et al