Embed Size (px)
Citation preview
ORIGINAL PAPER
Modeling the contribution of pig farming to pollutionof the Thachin River
Monika Schaffner Æ Hans-Peter Bader ÆRuth Scheidegger
Received: 15 May 2009 / Accepted: 6 August 2009 / Published online: 22 August 2009
� Springer-Verlag 2009
Abstract Rapid growth of the livestock production sector
in South-East Asia during recent decades has led to a
widespread degradation of ground and surface waters. The
Thachin River Basin in Central Thailand serves as a case
study for investigating the origins and pathways of nutrient
loads produced by intensive pig farming. A mathematical
material flow analysis is used to identify key nitrogen flows
and the main parameters determining them. Scenarios of
the potential for reducing these flows and achieving com-
pliance with current discharge regulations are investigated.
The results show that liquid waste discharged from large
pig farms and directly discharged waste from small farms
are the key nitrogen flows to the river system. The key
driving forces are not only the treatment coverage and
efficiencies but also the rate of reuse and recycling of the
treated product.
Keywords Material flow analysis � Nitrogen � River
water pollution control � Pig manure management �Thachin River � Thailand
Introduction
Livestock production in Asia has intensified greatly in
recent decades (Steinfeld et al. 2006). The rising incomes
of a growing population, furnished by a strong economic
development, are generating increasing demand for animal
products. In Thailand, pig production grew by over 50%
between 1988 and 1998, and this growth is expected to
continue (Rattanarajcharkul et al. 2000). It is particularly
apparent around urban centers such as in Thailand’s central
basin (Gerber et al. 2004). Mismanagement of livestock
excreta, together with lack of proper treatment provisions
and waste reuse, has led to widespread degradation of
ground and surface waters (Gerber 2006). Studies on large-
scale regional nutrient balances in South-East Asia (Bad-
ayos and Dorado 2004; Gerber et al. 2004) have shown an
imbalance in regional nutrient flows caused by intensive
livestock production, underlining the importance of reusing
livestock waste as nutrients in crop agriculture.
In the Thachin River Basin (TRB), an intensively
developed area in the central plains of Thailand and one of
the country’s major regions for livestock production (DLD
2004), the degradation of surface water quality has become
of great governmental and public concern during recent
years (Office of Natural Resources and Environmental
Policy and Planning 2002; Simachaya 2003). A water
quality crisis in May 2000, associated with a major fish
death due to a sudden drop in oxygen levels in the river,
was the trigger to introduce river water quality remediation
efforts (Simachaya 2003). The crisis is attributed to un-
seasonal heavy rainfall which caused extensive pollution
discharge from non-point sources. Until then, government
policies had only covered pollution from point sources.
A widely held view, underscored by several estimates of
organic and nutrient loading throughout the basin (PCD
M. Schaffner (&)
Institute of Geography, University of Bern, Hallerstrasse 12,
3012 Bern, Switzerland
e-mail: [email protected]
M. Schaffner � H.-P. Bader � R. Scheidegger
Eawag, Swiss Federal Institute of Aquatic Science and
Technology, Ueberlandstrasse 133, P.O. Box 611, 8600
Duebendorf, Switzerland
e-mail: [email protected]
R. Scheidegger
e-mail: [email protected]
123
Clean Techn Environ Policy (2010) 12:407–425
DOI 10.1007/s10098-009-0255-y
et al. 1997; Simachaya 1999; Simachaya 2003), is that
primarily point sources are a problem and that pig farms
are among the main pollution sources. This hypothesis is
easily believed considering the number of pigs in Nakhon
Pathom Province, a major pig production province located
in the center of the TRB (DLD and PCD 2002), alone. The
pig population was 0.85 million in 2001 (DLD and PCD
2002)—close to one pig per inhabitant. A study by the
Pollution Control Department of Thailand (PCD) estimates
a daily wastewater discharge of 125 t from pig farms in
Nakhon Pathom province, several orders of magnitude
greater than that of duck and aquaculture farms, with 10.6
and 1.5 t respectively (PCD 1996, in: Kwanmeung 2002).
However, no study has yet explicitly compared the nutrient
loads produced at the origins of the various point sources
such as households, industries, pig, poultry, and fish farms
with diffuse sources such as rice, fieldcrop, fruit, and
vegetable production.
The current approach to address river water pollution in
the TRB is based on conventional, catchment-based water
quality models, such as WASP (Simachaya 1999), QUAL2E
(PCD and Pro-En Technologies 2002), and MIKE11 models
(PCD and Environmental Consultant 2004). These models
estimate the quantity of pollution discharge to the river from
the various point- and non-point pollution sources on the
basis of per-capita pollution discharge (point sources) and
GIS-based land-use-specific runoff estimations (non-point
sources). However, the models fail to address the question of
the origin of these various pollution loads; and the simulated
scenarios for river water quality remediation do not suffi-
ciently specify concrete remediation measures.
Knowledge about the pollution inputs is crucial, in
particular for all the river quality models, since their
accuracy directly determines the uncertainty of the model
results. A regional research project aimed at re-linking
livestock waste generation with agricultural production
(DLD and FAO 2004) developed a nutrient flow model for
livestock production (NuFlux) (Menzi et al. 2002). This
excel-based model uses input and output values as well as
transfer coefficients to quantify the nutrient flows on a
specific pig or poultry farm. To a certain extent, the model
allows tracing the origins of nutrient loads from pig and
poultry production. However, the calculations are limited
to the farm scale and are not designed to compare different
waste management options with the aim of reducing
nutrient loads to surface water bodies on a basin scale.
In order to gain a solid basis for possible water-quality
remediation measures in the TRB, it is necessary to obtain
an overview of the pollution flows from their origin, fol-
lowing their flow path to their discharge into the river. The
key parameters influencing these flows need to be identified
to determine the most effective remediation. The objective
of this study is to quantify and model the nutrient flows from
pig farms into the Thachin River. The following questions
provided the starting point for the research presented here:
– Is pig farming as polluting as it is believed to be?
– What are the key nutrient flows of the system of pig
farming to the surface waters in the TRB; and what are
the key parameters driving these flows?
– What are the possible measures that could be taken to
most effectively reduce nutrient pollution from pig
farming?
This study is part of a more comprehensive research
project that aimed to quantify the main pollution sources
and their contributions to the overall TRB (Schaffner et al.
2005, 2009; Schaffner 2007).
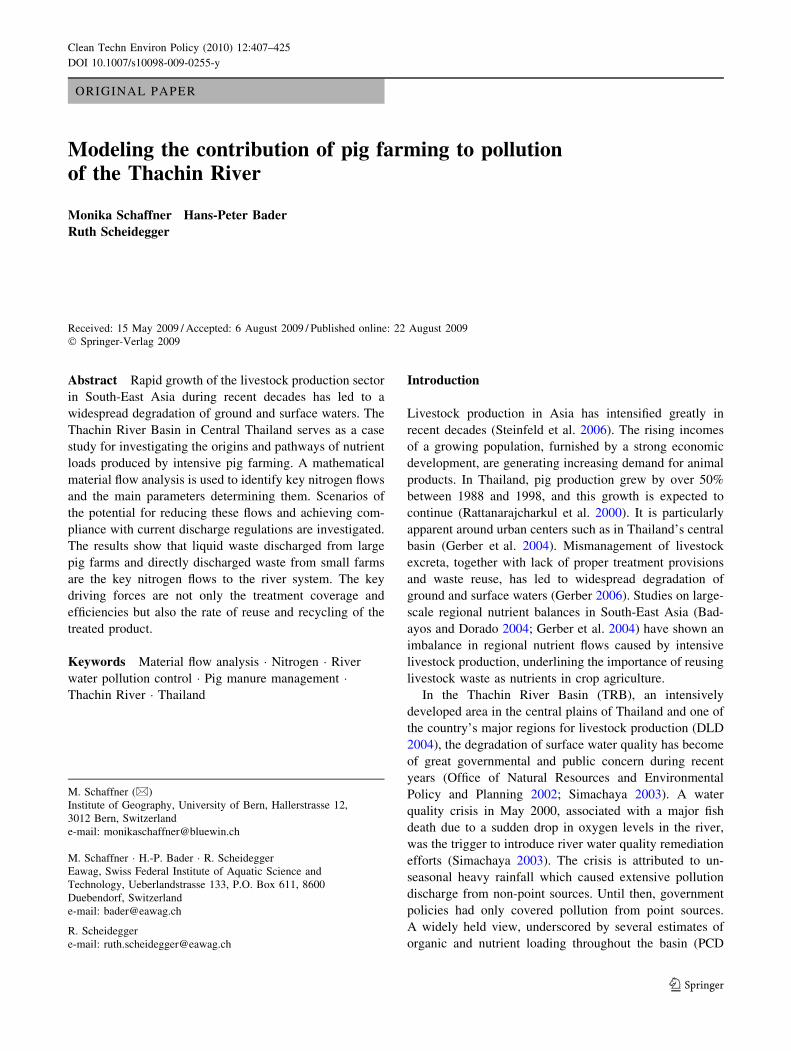
Study area
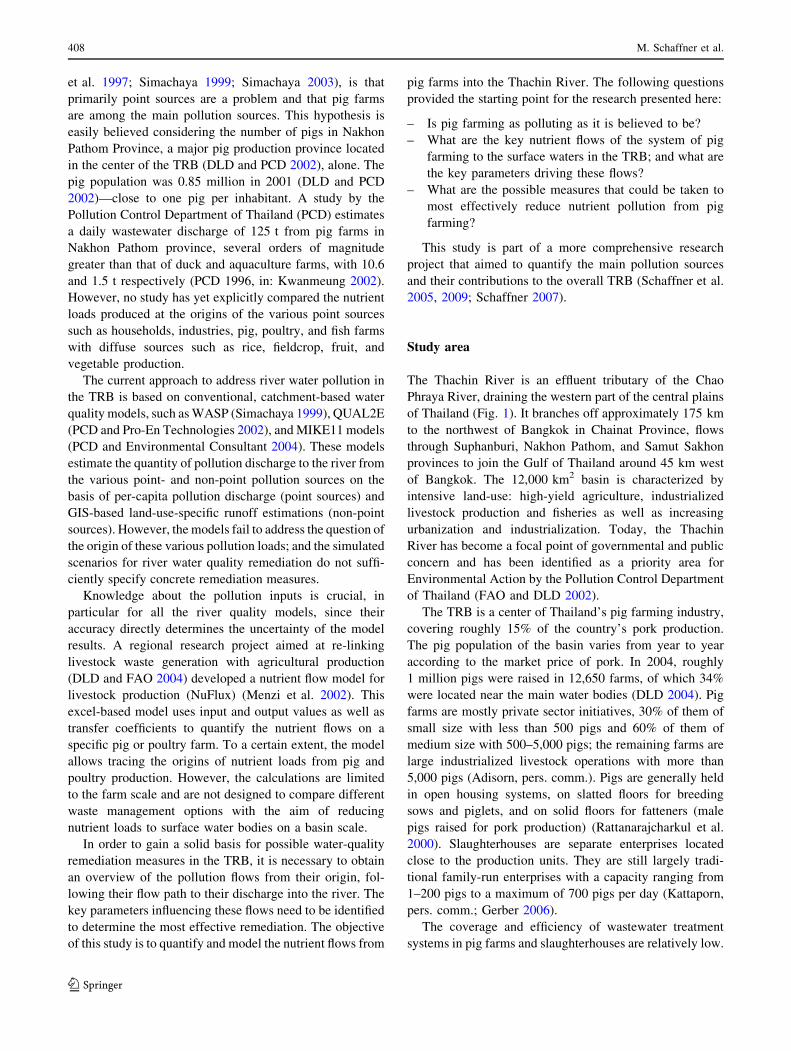
The Thachin River is an effluent tributary of the Chao
Phraya River, draining the western part of the central plains
of Thailand (Fig. 1). It branches off approximately 175 km
to the northwest of Bangkok in Chainat Province, flows
through Suphanburi, Nakhon Pathom, and Samut Sakhon
provinces to join the Gulf of Thailand around 45 km west
of Bangkok. The 12,000 km2 basin is characterized by
intensive land-use: high-yield agriculture, industrialized
livestock production and fisheries as well as increasing
urbanization and industrialization. Today, the Thachin
River has become a focal point of governmental and public
concern and has been identified as a priority area for
Environmental Action by the Pollution Control Department
of Thailand (FAO and DLD 2002).
The TRB is a center of Thailand’s pig farming industry,
covering roughly 15% of the country’s pork production.
The pig population of the basin varies from year to year
according to the market price of pork. In 2004, roughly
1 million pigs were raised in 12,650 farms, of which 34%
were located near the main water bodies (DLD 2004). Pig
farms are mostly private sector initiatives, 30% of them of
small size with less than 500 pigs and 60% of them of
medium size with 500–5,000 pigs; the remaining farms are
large industrialized livestock operations with more than
5,000 pigs (Adisorn, pers. comm.). Pigs are generally held
in open housing systems, on slatted floors for breeding
sows and piglets, and on solid floors for fatteners (male
pigs raised for pork production) (Rattanarajcharkul et al.
2000). Slaughterhouses are separate enterprises located
close to the production units. They are still largely tradi-
tional family-run enterprises with a capacity ranging from
1–200 pigs to a maximum of 700 pigs per day (Kattaporn,
pers. comm.; Gerber 2006).
The coverage and efficiency of wastewater treatment
systems in pig farms and slaughterhouses are relatively low.
408 M. Schaffner et al.
123
Dung is considered a valuable resource (Rattanarajcharkul
et al. 2000) and is largely collected separately to fertilize
adjacent cropland or fish ponds or to sell within and outside
the region. Liquid waste is collected and treated in natural
pond systems (earth lagoons) or discharged directly into the
nearby canals (Kwanmeung 2002); few farms use more
advanced anaerobic digester treatment systems. Reuse of
liquid manure is rare due to its low fertilizing value and high
handling and transportation costs (DLD and FAO 2004).
Methods
The method used in this study is a mathematical material
flow analysis (MMFA) which is an extension of the tradi-
tional material flow analysis (MFA) by modeling concepts.
The MFA was introduced and adapted to regional studies
in the 1980s by Brunner et al. (1990) and Baccini and
Brunner (1991). The first regional study in the Bunz valley
of Switzerland (Brunner et al. 1990) gave an overview of
the regional substance flows of N, Cl, P, Cu, Zn, Cd, and Pb
and showed its potential as a basis for river basin pollution
control. Similar studies were performed on a larger scale in
the Danube Basin, Austria (Lampert and Brunner 1999;
Sarikaya et al. 1999; Somlyody et al. 1999; Zessner and
Kroiss 1999).
The MFA was extended to MMFA by Baccini and
Bader (1996). In the last decade, it has been applied in
many different studies in various fields (Bader et al. 2006).
The method has been used in developing and emerging
countries for several purposes, such as to establish a
regional water balance (Binder et al. 1997), to model
resource management for agricultural systems in Nicaragua
(Pfister et al. 2005), and to simulate the water and nutrient
flows (N and P) for urban wastewater in Kunming, China
(Huang et al. 2007).
An MFA-based model describes and quantifies the
material (e.g., water and nutrient) flows through a system. Its
application to analyze pig farming allows nutrient flows and
their transformations to be traced from their input as feed or
water, through waste production, separation, treatment, and
finally to their output as reusable fertilizer/manure, or as
discharge into receiving waters. The approach attempts to
obtain an overview of the system and focuses on the main
processes involved in the nutrient pollution generation
chain. An MMFA is carried out in six steps:
– System analysis: define temporal and spatial bound-
aries; identify the balance volumes and flows of the
system;
– Model approach: formulate the equations to describe
the system in mathematical terms;
– Data acquisition and calibration: collect and calibrate
the input data set for the model;
– Simulate the Current state, including Uncertainty;
– Sensitivity analysis;
– Scenario calculation: simulate measures to decrease
the most polluting flows.
System analysis
The geographical area considered for the analysis of this
study is the upper-to-mid part of the TRB, including the
three provinces of Chainat, Suphanburi, and Nakhon
Pathom (Fig. 1, dark gray area). The southern-most prov-
ince of the basin, Samut Sakhon, is excluded because pig
farming is negligible in that area (0.25% of total pigs in the
basin). The system includes the receiving water bodies
(Thachin River and Canals), and all the activities related to
pig farming (balance volumes) and their interlinkages
(flows). However, soil and groundwater are not included.
In order to account for eutrophication as an important
aspect of water quality deterioration in the Thachin River,
the nutrients of total nitrogen (N) and total phosphorus (P)
Tha
Chin R
iver
Tha
Chin R
iver
Chao Phraya R
iver
Chao Phraya R
iver
Bangko kBangko k
Tha
Chin R
iver
Thachin R
iverC
hao Phraya River
Chao Phraya R
iver
Bangkok
Gulf of Thailand
Nakhon PathomNakhon Pathom
Suphanburi
Chainat
Samut SakhonSamut Sakhon
Uthai Thani
Kanchanaburi
Thailand
Cambodia
MyanmarLaos
0 25 km
Fig. 1 Thachin River Basin and its main provinces, located in
Central Thailand; dark gray = modeled area, light gray = total basin
area [GIS sources: PCD (1995), Kasetsart University and IRD (1996)]
Modeling the contribution of pig farming to pollution of the River 409
123
were chosen as indicators. Water-related mass flows are
also quantified, as they are the basis for understanding the
nutrient flows. The time scale is 1 year (stationary mod-
eling), simulated for current conditions (year 2006) using
the most recent available data. This system is designed for
the scale of the overall basin, but can subsequently be
downscaled to any smaller spatial unit (e.g., provincial or
sub-basin level).
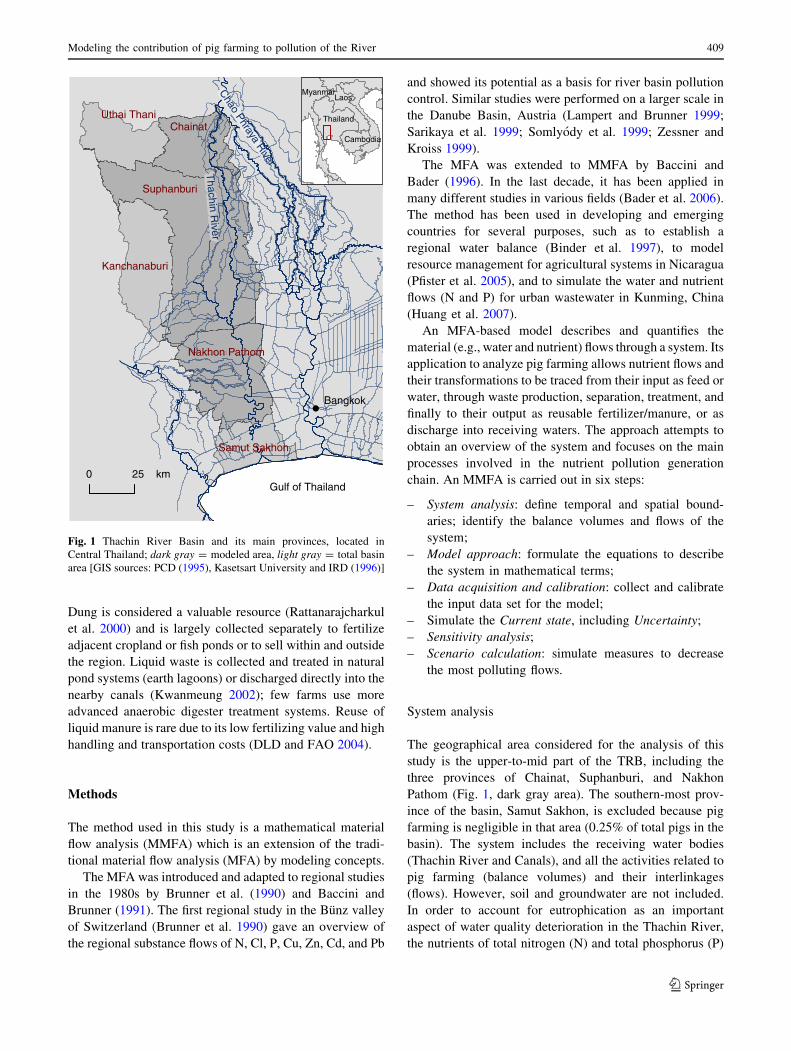
Figure 2 shows the system for pig farming. The boxes
represent the balance volumes of the system, and the
arrows represent the mass and nutrient flows (inputs, out-
puts, and interlinking flows). The pig system is composed
of three independent pig subsystems linked to the slaugh-
terhouse subsystem (SH). The three pig subsystems repre-
sent pig production (PIGsml, PIGmed, PIGlrg) according
to the farm size categories of the DLD (small, medium,
large) because the farm size generally determines the level
of waste treatment technology involved. Table 1 summa-
rizes the abbreviations used in the model.
Model approach
In order to describe this system, a total of 303 system
variables are used: 84 variables per pig farm subsystem
model and 51 for the slaughterhouse subsystem model. The
variables are interlinked to the other variables and the
parameters by equations, on the basis of the acquired sys-
tem knowledge. The equations describe either demands
(such as the water and food demand for pigs) or input–
output relationships (such as the waste distribution). In
mathematical terms, the set of equations is a parameteri-
zation (nonlinear) of the relevant flows and stock change
rates by a set of 133 parameters. The parameters represent
production parameters (such as the number of pig places),
operating parameters (such as transfer coefficients), spe-
cific physiological parameters (such as the food needed per
pig and day) and biological parameters (such as N, P
concentrations). The model presented here is a first
approximation describing the current system knowledge.
The aim was to develop a model which quantifies the N and
P inputs to the Thachin River from pig farms in a first
approximation, rather than to develop a highly detailed
process-based model that would be able to describe all the
processes very accurately.
The model is implemented in the SIMBOX simulation
program (Baccini and Bader 1996). A detailed description
of the system analysis and model approach is presented in
Schaffner (2007).
Data acquisition and calibration
The input data for the model parameters is drawn from
statistics, regional and international research reports, sci-
entific literature, regional monitoring data and expert
opinions. These data are combined to produce best esti-
mates for the parameters used.
dirdis du
ng
slur
ry
ro ff
oflow
slur
ryA
D
oflow AD
recy recyAD
sldg
sldg
dirdis
dung
slur
ry
ro ff
oflow
slurryAD
oflow AD
recyAD
sldg
sldg
dirdis
slur
ry
ro ff oflow
oflow AD
recyAD
sldg
sldg
dirdis
slurry SH
oflowS H
slurrySHAD
oflow SHAD
pig
pig pig
wat feed wat feed wat
feed watSH
liqr e
liqreA D
emis
liqr e
liqreA D
emis emis AD
solr e
liqr e
liqreA D
por k
emis
SH
pond
em
isS
HA
D
sldgS H
Thachin River & Canals
PIG sml
heap
pond
AD
PIG med
heap
pond
AD
PIG lrg
heap
pond
AD
SH
SHpond
SHAD
dung
emis
slurryAD
sldg
emis
AD emis
solr e
recy
emis
AD
emis
emis
emis
solr e
emis
recy
emis
Fig. 2 System analysis for pig farming in the Thachin River Basin (boxes = balance volumes; arrows = mass and nutrient flows; sml small,
med medium, lrg large, SH slaughterhouse, AD anaerobic digester)
410 M. Schaffner et al.
123
Regarding pig farming in Thailand, comprehensive
data and information is already available. A long-term
international research project with a focus on South-East
Asia (DLD and FAO 2004) has been studying options to
relink intensive livestock with crop production activities
to close the regional nutrient cycle. Carried out in the
framework of an international initiative on ‘‘Livestock,
Environment and Development’’ (LEAD) and coordinated
by the Food and Agriculture Organization of the United
Nations (FAO), the project aims at developing and testing
Area-Wide Integration (AWI) options for specialized
livestock production and crop agriculture (Rat-
tanarajcharkul et al. 2000). As one main project activity, a
detailed assessment of pig production and waste man-
agement systems was carried out in pilot areas in South-
East Thailand. We consider the studies of South-East
Thailand to be equally representative for the TRB. As this
is the pioneer pig-raising area in Thailand, its production
and waste management methods were transferred from
there to other pig-raising areas (Somchai, pers. comm). A
key outcome of the project was an Excel-based decision-
making tool for enhanced nutrient management in pig
farming, NuFlux (Menzi et al. 2002). NuFlux provides a
set of standard values (defined in NuFlux as default val-
ues) for nutrient-related pig production parameters for
Thailand, compiled in collaboration with local experts.
This database was used as a starting point for our study,
and was complemented by other regional and interna-
tional literature sources and adjusted to reflect the specific
conditions of the TRB. In a final round of expert con-
sultations, the data set was discussed and accepted by the
experts. A detailed account of the derivation rationales for
the input data is presented in Schaffner (2007).
Tables 2 and 3 show the data set used (average, uncer-
tainty distribution, and source) for our status quo model of
small, medium, and large farms, respectively. The three pig
farm sub-models differ primarily in their comparative local
size (number of pigs) and their treatment coverage and
type. Changes apply only for mass parameters, while N and
P parameters are kept constant for all the farm types due to
a lack of more detailed information. Table 4 gives the
parameters used for slaughterhouses. Values are indicated
in fresh matter (FM), unless otherwise stated.
The uncertainty distributions of each parameter are
defined as normal, lognormal or uniform depending on
the knowledge of the parameter range and its possible
distribution. For fluctuating quantities such as the number
of pigs, a normal distribution is assumed. It is known
from chemical measurements that quantities such as
concentrations and emissions usually have a lognormal
distribution. In cases where, according to the current
system knowledge, the values are uniformly distributed,
such as for transfer coefficients determining manure
reuse, a uniform distribution is assumed as a first
approximation. In the following text, unless otherwise
indicated, the uncertainty was determined on the basis of
the assumed accuracy of the data source. Thus 10% is a
high assumed accuracy, 25% is a moderate assumed
accuracy, and 50% a low assumed accuracy. The average
value and standard deviation are indicated as ð�x; rÞ for
normal distributions and as ð�x; rÞ for lognormal distri-
butions. The range for uniform distributions is indicated
as [xMin - xMax].
Results and discussion
In this article, the simulation results for the MFA model
of the pig farming system in the TRB are analyzed and
Table 1 Abbreviations used in the model
Abbreviation Description
Balance volumes (boxes)
SH Slaughterhouse
PIGsml Small pig farms
PIGmed Medium pig farms
PIGlrg Large pig farms
pond Liquid waste treatment systems (earth lagoons, waste
stabilization ponds)
AD Anaerobic digester treatment systems for liquid and/or
solid waste
heap Solid waste treatment systems (covered or open heaps)
Mass and nutrient flows (arrows)
pig Pigs brought to the slaughterhouse for slaughtering
pork Usable parts of the slaughtered pigs (meat, skin, bones,
etc.)
wat Water supply to the pig farms and slaughterhouses
feed Feed supply to the pig farms
slurry Slurry (mixture of liquid and solid waste) brought to
treatment
dung Solid waste brought to the treatment
sldg Sludge resulting from the treatment process
recy Treated liquid waste recycled in the farm as cleaning/
cooling water
liqre Treated liquid waste to be reused as fertilizer/irrigation
water in agriculture
solre Treated solid waste to be reused as manure in
agriculture/aquaculture
oflow Overflow/discharge from the treatment system to the
surface water
roff Runoff from the solid waste treatment system to the
surface waters
dirdis Direct discharge of untreated wastewater to the surface
waters
emis Water and nitrogen emissions to the atmosphere
Modeling the contribution of pig farming to pollution of the River 411
123
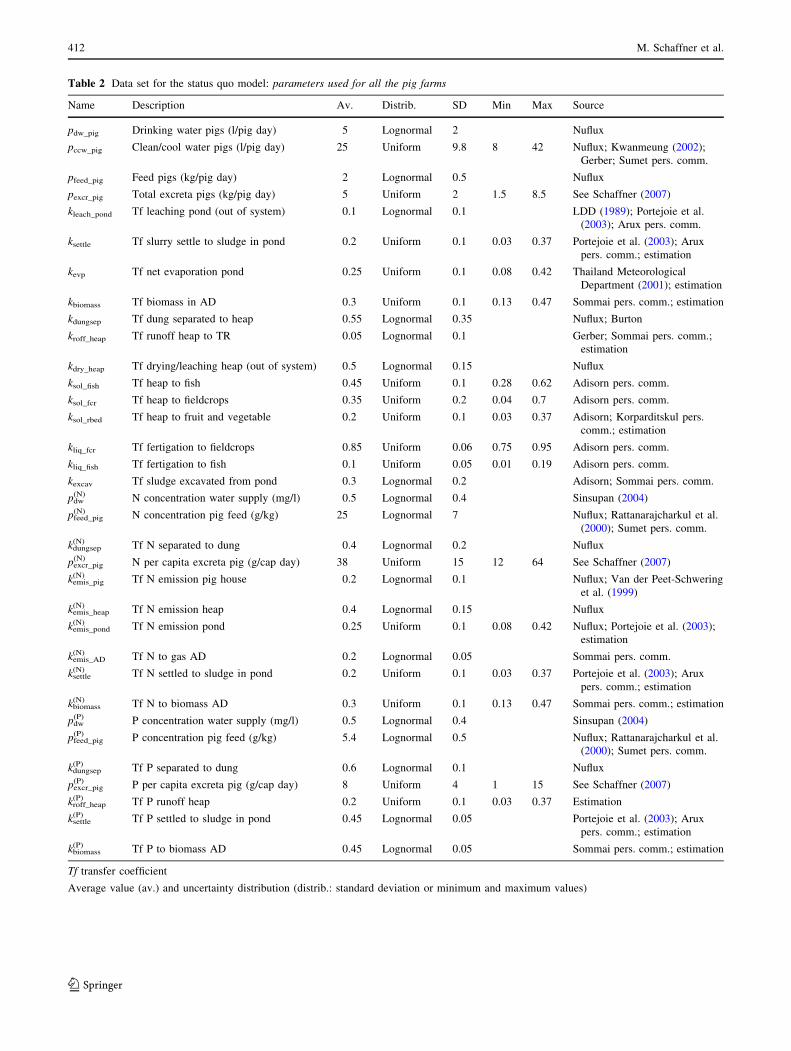
Table 2 Data set for the status quo model: parameters used for all the pig farms
Name Description Av. Distrib. SD Min Max Source
pdw_pig Drinking water pigs (l/pig day) 5 Lognormal 2 Nuflux
pccw_pig Clean/cool water pigs (l/pig day) 25 Uniform 9.8 8 42 Nuflux; Kwanmeung (2002);
Gerber; Sumet pers. comm.
pfeed_pig Feed pigs (kg/pig day) 2 Lognormal 0.5 Nuflux
pexcr_pig Total excreta pigs (kg/pig day) 5 Uniform 2 1.5 8.5 See Schaffner (2007)
kleach_pond Tf leaching pond (out of system) 0.1 Lognormal 0.1 LDD (1989); Portejoie et al.
(2003); Arux pers. comm.
ksettle Tf slurry settle to sludge in pond 0.2 Uniform 0.1 0.03 0.37 Portejoie et al. (2003); Arux
pers. comm.; estimation
kevp Tf net evaporation pond 0.25 Uniform 0.1 0.08 0.42 Thailand Meteorological
Department (2001); estimation
kbiomass Tf biomass in AD 0.3 Uniform 0.1 0.13 0.47 Sommai pers. comm.; estimation
kdungsep Tf dung separated to heap 0.55 Lognormal 0.35 Nuflux; Burton
kroff_heap Tf runoff heap to TR 0.05 Lognormal 0.1 Gerber; Sommai pers. comm.;
estimation
kdry_heap Tf drying/leaching heap (out of system) 0.5 Lognormal 0.15 Nuflux
ksol_fish Tf heap to fish 0.45 Uniform 0.1 0.28 0.62 Adisorn pers. comm.
ksol_fcr Tf heap to fieldcrops 0.35 Uniform 0.2 0.04 0.7 Adisorn pers. comm.
ksol_rbed Tf heap to fruit and vegetable 0.2 Uniform 0.1 0.03 0.37 Adisorn; Korparditskul pers.
comm.; estimation
kliq_fcr Tf fertigation to fieldcrops 0.85 Uniform 0.06 0.75 0.95 Adisorn pers. comm.
kliq_fish Tf fertigation to fish 0.1 Uniform 0.05 0.01 0.19 Adisorn pers. comm.
kexcav Tf sludge excavated from pond 0.3 Lognormal 0.2 Adisorn; Sommai pers. comm.
pdw(N) N concentration water supply (mg/l) 0.5 Lognormal 0.4 Sinsupan (2004)
pfeed_pig(N) N concentration pig feed (g/kg) 25 Lognormal 7 Nuflux; Rattanarajcharkul et al.
(2000); Sumet pers. comm.
kdungsep(N) Tf N separated to dung 0.4 Lognormal 0.2 Nuflux
pexcr_pig(N) N per capita excreta pig (g/cap day) 38 Uniform 15 12 64 See Schaffner (2007)
kemis_pig(N) Tf N emission pig house 0.2 Lognormal 0.1 Nuflux; Van der Peet-Schwering
et al. (1999)
kemis_heap(N) Tf N emission heap 0.4 Lognormal 0.15 Nuflux
kemis_pond(N) Tf N emission pond 0.25 Uniform 0.1 0.08 0.42 Nuflux; Portejoie et al. (2003);
estimation
kemis_AD(N) Tf N to gas AD 0.2 Lognormal 0.05 Sommai pers. comm.
ksettle(N) Tf N settled to sludge in pond 0.2 Uniform 0.1 0.03 0.37 Portejoie et al. (2003); Arux
pers. comm.; estimation
kbiomass(N) Tf N to biomass AD 0.3 Uniform 0.1 0.13 0.47 Sommai pers. comm.; estimation
pdw(P) P concentration water supply (mg/l) 0.5 Lognormal 0.4 Sinsupan (2004)
pfeed_pig(P) P concentration pig feed (g/kg) 5.4 Lognormal 0.5 Nuflux; Rattanarajcharkul et al.
(2000); Sumet pers. comm.
kdungsep(P) Tf P separated to dung 0.6 Lognormal 0.1 Nuflux
pexcr_pig(P) P per capita excreta pig (g/cap day) 8 Uniform 4 1 15 See Schaffner (2007)
kroff_heap(P) Tf P runoff heap 0.2 Uniform 0.1 0.03 0.37 Estimation
ksettle(P) Tf P settled to sludge in pond 0.45 Lognormal 0.05 Portejoie et al. (2003); Arux
pers. comm.; estimation
kbiomass(P) Tf P to biomass AD 0.45 Lognormal 0.05 Sommai pers. comm.; estimation
Tf transfer coefficient
Average value (av.) and uncertainty distribution (distrib.: standard deviation or minimum and maximum values)
412 M. Schaffner et al.
123
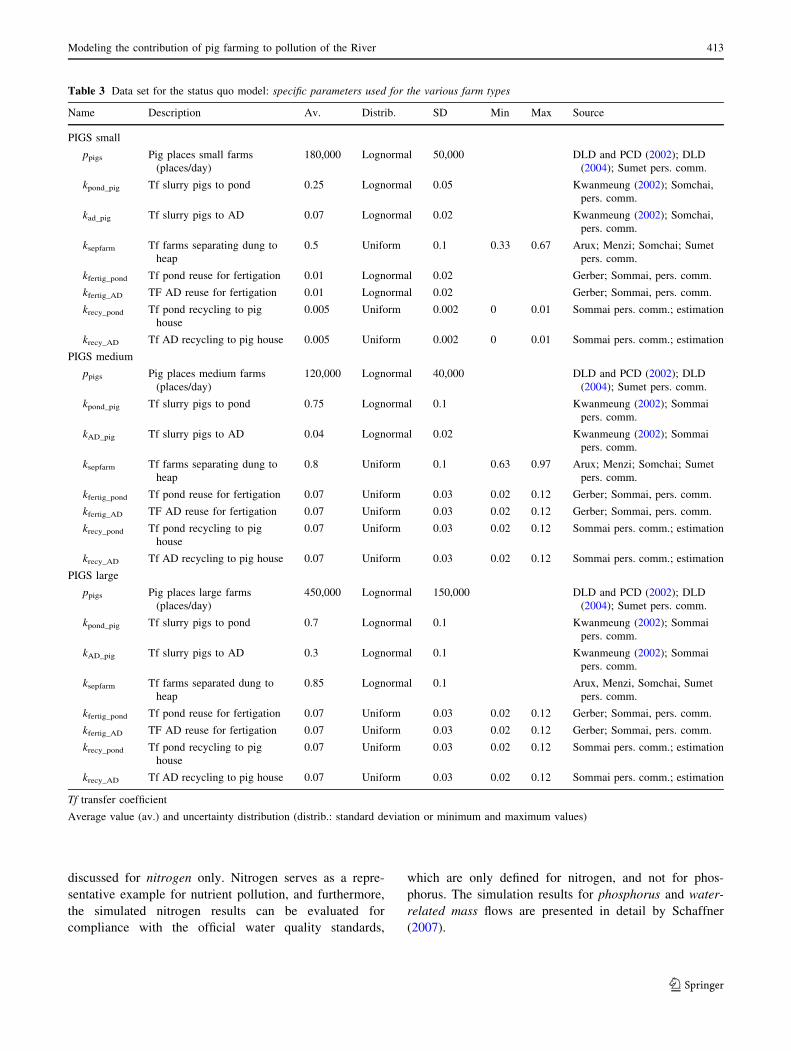
discussed for nitrogen only. Nitrogen serves as a repre-
sentative example for nutrient pollution, and furthermore,
the simulated nitrogen results can be evaluated for
compliance with the official water quality standards,
which are only defined for nitrogen, and not for phos-
phorus. The simulation results for phosphorus and water-
related mass flows are presented in detail by Schaffner
(2007).
Table 3 Data set for the status quo model: specific parameters used for the various farm types
Name Description Av. Distrib. SD Min Max Source
PIGS small
ppigs Pig places small farms
(places/day)
180,000 Lognormal 50,000 DLD and PCD (2002); DLD
(2004); Sumet pers. comm.
kpond_pig Tf slurry pigs to pond 0.25 Lognormal 0.05 Kwanmeung (2002); Somchai,
pers. comm.
kad_pig Tf slurry pigs to AD 0.07 Lognormal 0.02 Kwanmeung (2002); Somchai,
pers. comm.
ksepfarm Tf farms separating dung to
heap
0.5 Uniform 0.1 0.33 0.67 Arux; Menzi; Somchai; Sumet
pers. comm.
kfertig_pond Tf pond reuse for fertigation 0.01 Lognormal 0.02 Gerber; Sommai, pers. comm.
kfertig_AD TF AD reuse for fertigation 0.01 Lognormal 0.02 Gerber; Sommai, pers. comm.
krecy_pond Tf pond recycling to pig
house
0.005 Uniform 0.002 0 0.01 Sommai pers. comm.; estimation
krecy_AD Tf AD recycling to pig house 0.005 Uniform 0.002 0 0.01 Sommai pers. comm.; estimation
PIGS medium
ppigs Pig places medium farms
(places/day)
120,000 Lognormal 40,000 DLD and PCD (2002); DLD
(2004); Sumet pers. comm.
kpond_pig Tf slurry pigs to pond 0.75 Lognormal 0.1 Kwanmeung (2002); Sommai
pers. comm.
kAD_pig Tf slurry pigs to AD 0.04 Lognormal 0.02 Kwanmeung (2002); Sommai
pers. comm.
ksepfarm Tf farms separating dung to
heap
0.8 Uniform 0.1 0.63 0.97 Arux; Menzi; Somchai; Sumet
pers. comm.
kfertig_pond Tf pond reuse for fertigation 0.07 Uniform 0.03 0.02 0.12 Gerber; Sommai, pers. comm.
kfertig_AD TF AD reuse for fertigation 0.07 Uniform 0.03 0.02 0.12 Gerber; Sommai, pers. comm.
krecy_pond Tf pond recycling to pig
house
0.07 Uniform 0.03 0.02 0.12 Sommai pers. comm.; estimation
krecy_AD Tf AD recycling to pig house 0.07 Uniform 0.03 0.02 0.12 Sommai pers. comm.; estimation
PIGS large
ppigs Pig places large farms
(places/day)
450,000 Lognormal 150,000 DLD and PCD (2002); DLD
(2004); Sumet pers. comm.
kpond_pig Tf slurry pigs to pond 0.7 Lognormal 0.1 Kwanmeung (2002); Sommai
pers. comm.
kAD_pig Tf slurry pigs to AD 0.3 Lognormal 0.1 Kwanmeung (2002); Sommai
pers. comm.
ksepfarm Tf farms separated dung to
heap
0.85 Lognormal 0.1 Arux, Menzi, Somchai, Sumet
pers. comm.
kfertig_pond Tf pond reuse for fertigation 0.07 Uniform 0.03 0.02 0.12 Gerber; Sommai, pers. comm.
kfertig_AD TF AD reuse for fertigation 0.07 Uniform 0.03 0.02 0.12 Gerber; Sommai, pers. comm.
krecy_pond Tf pond recycling to pig
house
0.07 Uniform 0.03 0.02 0.12 Sommai pers. comm.; estimation
krecy_AD Tf AD recycling to pig house 0.07 Uniform 0.03 0.02 0.12 Sommai pers. comm.; estimation
Tf transfer coefficient
Average value (av.) and uncertainty distribution (distrib.: standard deviation or minimum and maximum values)
Modeling the contribution of pig farming to pollution of the River 413
123
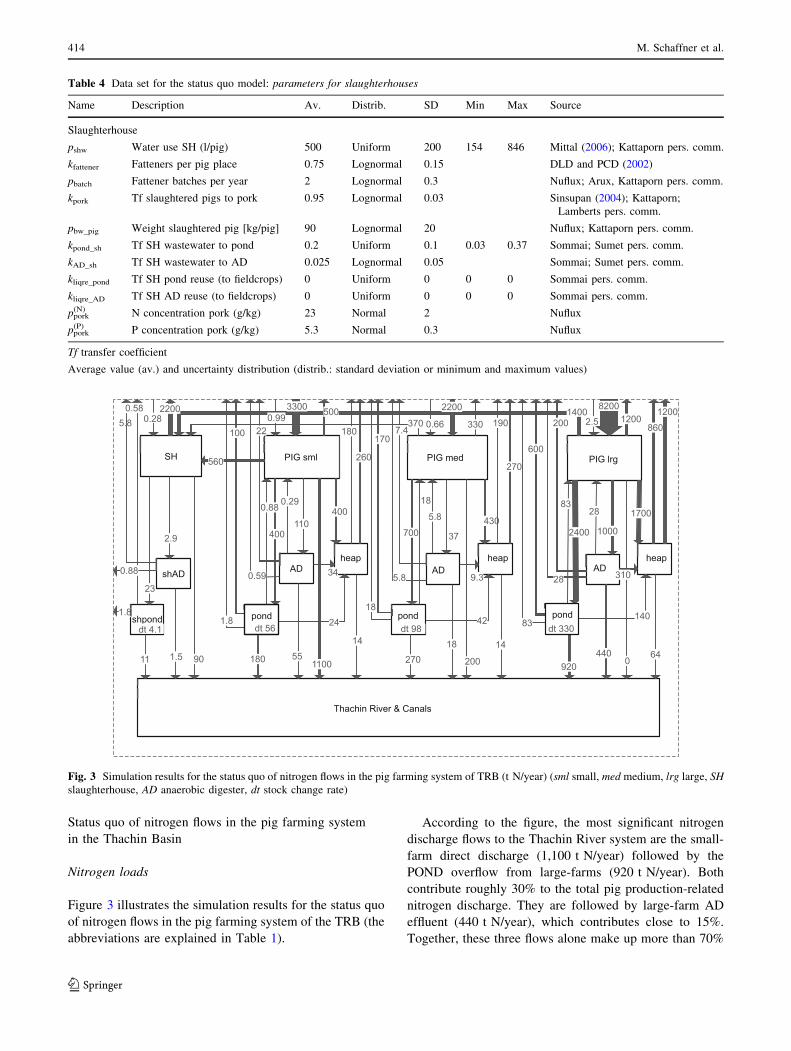
Status quo of nitrogen flows in the pig farming system
in the Thachin Basin
Nitrogen loads
Figure 3 illustrates the simulation results for the status quo
of nitrogen flows in the pig farming system of the TRB (the
abbreviations are explained in Table 1).
According to the figure, the most significant nitrogen
discharge flows to the Thachin River system are the small-
farm direct discharge (1,100 t N/year) followed by the
POND overflow from large-farms (920 t N/year). Both
contribute roughly 30% to the total pig production-related
nitrogen discharge. They are followed by large-farm AD
effluent (440 t N/year), which contributes close to 15%.
Together, these three flows alone make up more than 70%
Table 4 Data set for the status quo model: parameters for slaughterhouses
Name Description Av. Distrib. SD Min Max Source
Slaughterhouse
pshw Water use SH (l/pig) 500 Uniform 200 154 846 Mittal (2006); Kattaporn pers. comm.
kfattener Fatteners per pig place 0.75 Lognormal 0.15 DLD and PCD (2002)
pbatch Fattener batches per year 2 Lognormal 0.3 Nuflux; Arux, Kattaporn pers. comm.
kpork Tf slaughtered pigs to pork 0.95 Lognormal 0.03 Sinsupan (2004); Kattaporn;
Lamberts pers. comm.
pbw_pig Weight slaughtered pig [kg/pig] 90 Lognormal 20 Nuflux; Kattaporn pers. comm.
kpond_sh Tf SH wastewater to pond 0.2 Uniform 0.1 0.03 0.37 Sommai; Sumet pers. comm.
kAD_sh Tf SH wastewater to AD 0.025 Lognormal 0.05 Sommai; Sumet pers. comm.
kliqre_pond Tf SH pond reuse (to fieldcrops) 0 Uniform 0 0 0 Sommai pers. comm.
kliqre_AD Tf SH AD reuse (to fieldcrops) 0 Uniform 0 0 0 Sommai pers. comm.
ppork(N) N concentration pork (g/kg) 23 Normal 2 Nuflux
ppork(P) P concentration pork (g/kg) 5.3 Normal 0.3 Nuflux
Tf transfer coefficient
Average value (av.) and uncertainty distribution (distrib.: standard deviation or minimum and maximum values)
1100
400
400
14
180
110
55
0.88 0.29
24
34
200
430700
14270
37
18
18
5.8
42
9.3
0
1700
2400
64920
1000
440
8328
140
310
90
23
11
2.9
1.5
560
37014000.99
3300
0.66
22002.5
82000.28
500
180100 22
260
1.8
0.59
330 190
1707.4
270
18
5.8
1200860
600
2001200
83
28
22005.8
0.58
1.8
0.88
Thachin River & Canals
PIG sml
heap
pond dt 56
AD
PIG med
heap
pond dt 98
AD
PIG lrg
heap
pond dt 330
AD
SH
shpond dt 4.1
shAD
Fig. 3 Simulation results for the status quo of nitrogen flows in the pig farming system of TRB (t N/year) (sml small, med medium, lrg large, SHslaughterhouse, AD anaerobic digester, dt stock change rate)
414 M. Schaffner et al.
123
of the total nitrogen waste discharge to the Thachin River
from pig farming.
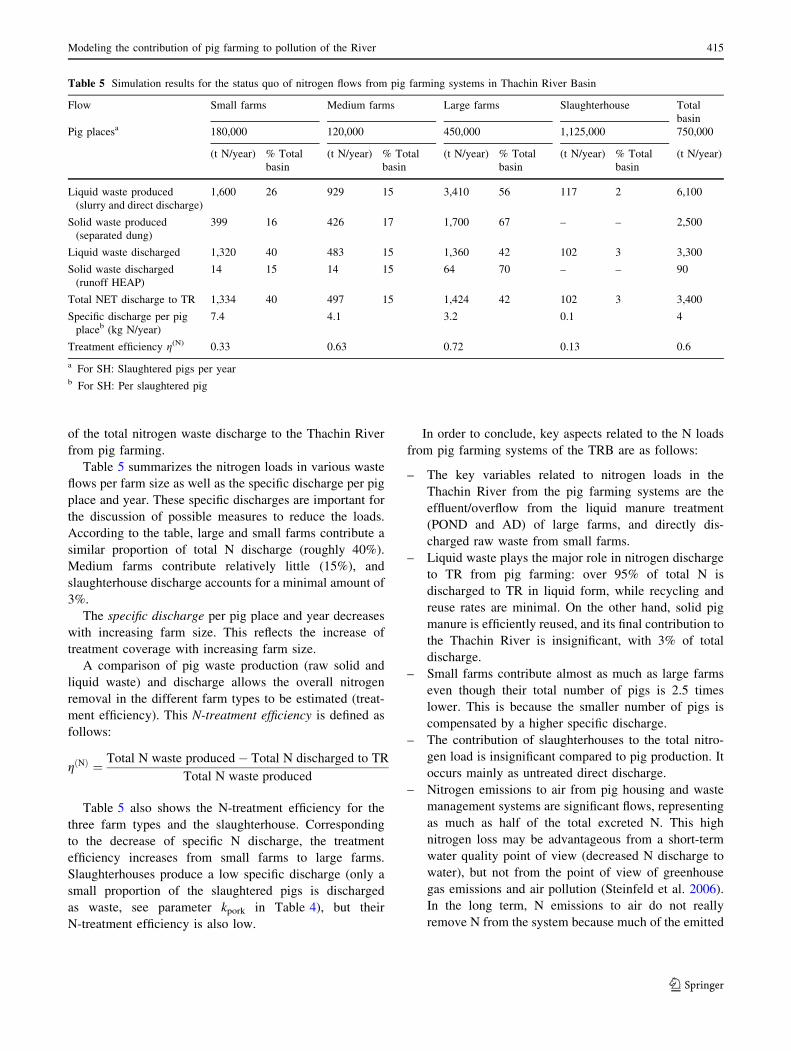
Table 5 summarizes the nitrogen loads in various waste
flows per farm size as well as the specific discharge per pig
place and year. These specific discharges are important for
the discussion of possible measures to reduce the loads.
According to the table, large and small farms contribute a
similar proportion of total N discharge (roughly 40%).
Medium farms contribute relatively little (15%), and
slaughterhouse discharge accounts for a minimal amount of
3%.
The specific discharge per pig place and year decreases
with increasing farm size. This reflects the increase of
treatment coverage with increasing farm size.
A comparison of pig waste production (raw solid and
liquid waste) and discharge allows the overall nitrogen
removal in the different farm types to be estimated (treat-
ment efficiency). This N-treatment efficiency is defined as
follows:
gðNÞ ¼ Total N waste produced� Total N discharged to TR
Total N waste produced
Table 5 also shows the N-treatment efficiency for the
three farm types and the slaughterhouse. Corresponding
to the decrease of specific N discharge, the treatment
efficiency increases from small farms to large farms.
Slaughterhouses produce a low specific discharge (only a
small proportion of the slaughtered pigs is discharged
as waste, see parameter kpork in Table 4), but their
N-treatment efficiency is also low.
In order to conclude, key aspects related to the N loads
from pig farming systems of the TRB are as follows:
– The key variables related to nitrogen loads in the
Thachin River from the pig farming systems are the
effluent/overflow from the liquid manure treatment
(POND and AD) of large farms, and directly dis-
charged raw waste from small farms.
– Liquid waste plays the major role in nitrogen discharge
to TR from pig farming: over 95% of total N is
discharged to TR in liquid form, while recycling and
reuse rates are minimal. On the other hand, solid pig
manure is efficiently reused, and its final contribution to
the Thachin River is insignificant, with 3% of total
discharge.
– Small farms contribute almost as much as large farms
even though their total number of pigs is 2.5 times
lower. This is because the smaller number of pigs is
compensated by a higher specific discharge.
– The contribution of slaughterhouses to the total nitro-
gen load is insignificant compared to pig production. It
occurs mainly as untreated direct discharge.
– Nitrogen emissions to air from pig housing and waste
management systems are significant flows, representing
as much as half of the total excreted N. This high
nitrogen loss may be advantageous from a short-term
water quality point of view (decreased N discharge to
water), but not from the point of view of greenhouse
gas emissions and air pollution (Steinfeld et al. 2006).
In the long term, N emissions to air do not really
remove N from the system because much of the emitted
Table 5 Simulation results for the status quo of nitrogen flows from pig farming systems in Thachin River Basin
Flow Small farms Medium farms Large farms Slaughterhouse Total
basin
Pig placesa 180,000 120,000 450,000 1,125,000 750,000
(t N/year) % Total
basin
(t N/year) % Total
basin
(t N/year) % Total
basin
(t N/year) % Total
basin
(t N/year)
Liquid waste produced
(slurry and direct discharge)
1,600 26 929 15 3,410 56 117 2 6,100
Solid waste produced
(separated dung)
399 16 426 17 1,700 67 – – 2,500
Liquid waste discharged 1,320 40 483 15 1,360 42 102 3 3,300
Solid waste discharged
(runoff HEAP)
14 15 14 15 64 70 – – 90
Total NET discharge to TR 1,334 40 497 15 1,424 42 102 3 3,400
Specific discharge per pig
placeb (kg N/year)
7.4 4.1 3.2 0.1 4
Treatment efficiency g(N) 0.33 0.63 0.72 0.13 0.6
a For SH: Slaughtered pigs per yearb For SH: Per slaughtered pig
Modeling the contribution of pig farming to pollution of the River 415
123
N will return to the area in some form (e.g., as N
deposition by rain).
– According to Jonsson and Vinneras (2003), the specific
nutrient excretion of human beings is roughly 11 g of
nitrogen per person and day. In comparison, the specific
nitrogen discharge from pig farming to the TRB is in
the same range, with an average of 13 g/pig day
(ranging between 8.7 g from large farms and 20 g
from small farms).
Uncertainty analysis
Two different methods for the calculation of the uncer-
tainty were applied:
– Gaussian error propagation: the standard deviation of
the variables is calculated using the Gaussian error
propagation formula (first-order error propagation).
– Monte Carlo simulation: the probability density distri-
bution of each parameter is described by a sample size
of 100,000 each. The corresponding probability density
distribution of the variables is then derived by calcu-
lating the variable values for each parameter sample.
The probability density distribution of each parameter
(see Tables 2, 3, 4) was estimated on the basis of the
range of values found in various literature sources and
expert opinions, and complemented by plausible
reasoning.
Our prime interest is the water quality of the Thachin
River and its canals. Two aspects are important in this
context:
– The nutrient loads to the Thachin River and canals, and
– The nutrient concentrations in the discharge flows to
the river and canals.
Concentrations are important because they can be
measured and must comply with the regulations. They are
discussed below. The loads are important for the environ-
mental impact and, in particular, to determine efficient
ways of water quality remediation. It is important to keep
in mind that concentrations can easily be decreased by
diluting the outflows, whereas the overall nutrient loads
would remain the same.
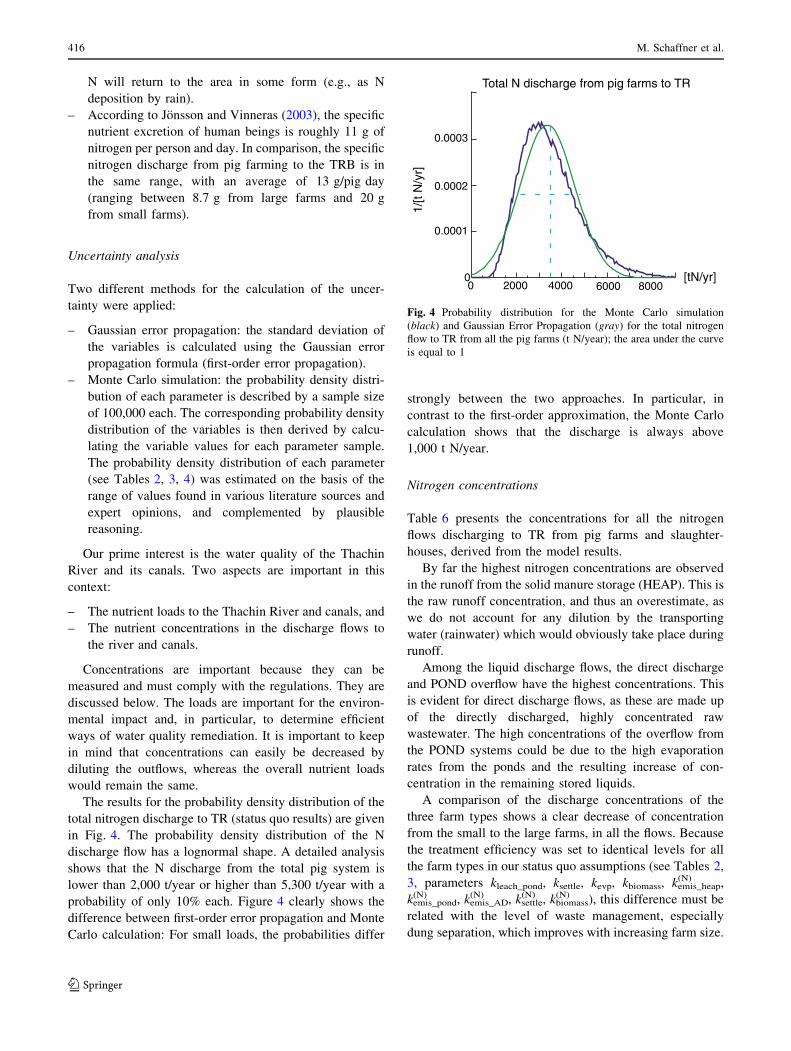
The results for the probability density distribution of the
total nitrogen discharge to TR (status quo results) are given
in Fig. 4. The probability density distribution of the N
discharge flow has a lognormal shape. A detailed analysis
shows that the N discharge from the total pig system is
lower than 2,000 t/year or higher than 5,300 t/year with a
probability of only 10% each. Figure 4 clearly shows the
difference between first-order error propagation and Monte
Carlo calculation: For small loads, the probabilities differ
strongly between the two approaches. In particular, in
contrast to the first-order approximation, the Monte Carlo
calculation shows that the discharge is always above
1,000 t N/year.
Nitrogen concentrations
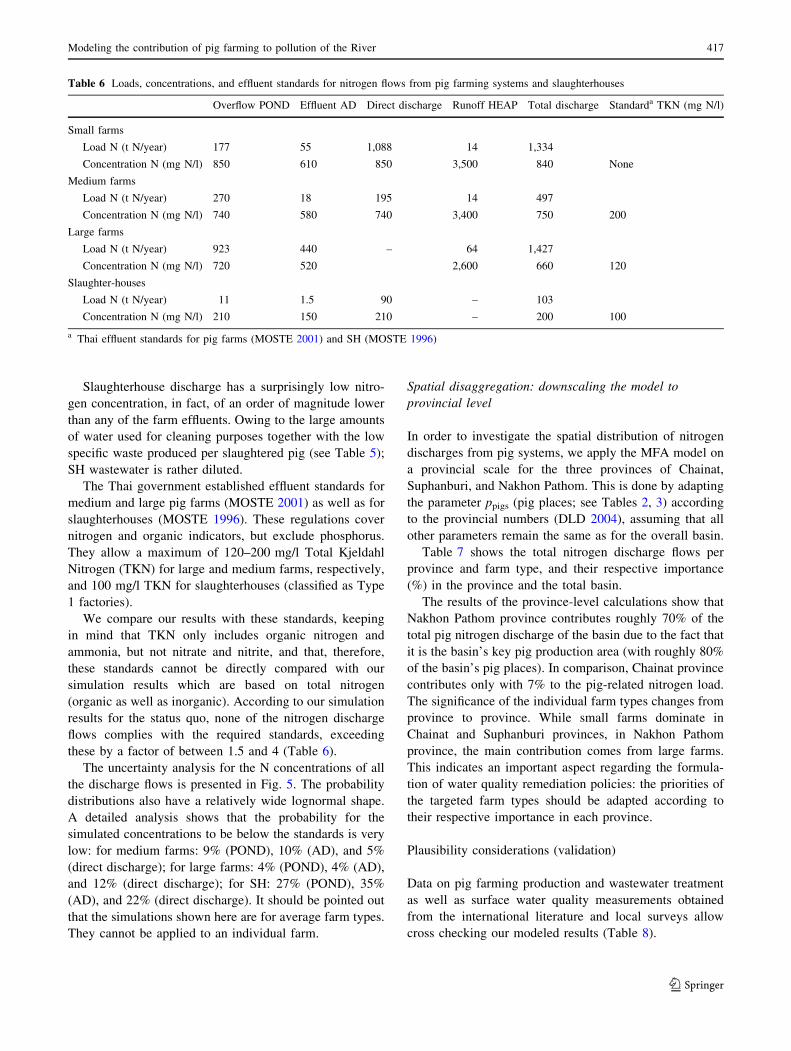
Table 6 presents the concentrations for all the nitrogen
flows discharging to TR from pig farms and slaughter-
houses, derived from the model results.
By far the highest nitrogen concentrations are observed
in the runoff from the solid manure storage (HEAP). This is
the raw runoff concentration, and thus an overestimate, as
we do not account for any dilution by the transporting
water (rainwater) which would obviously take place during
runoff.
Among the liquid discharge flows, the direct discharge
and POND overflow have the highest concentrations. This
is evident for direct discharge flows, as these are made up
of the directly discharged, highly concentrated raw
wastewater. The high concentrations of the overflow from
the POND systems could be due to the high evaporation
rates from the ponds and the resulting increase of con-
centration in the remaining stored liquids.
A comparison of the discharge concentrations of the
three farm types shows a clear decrease of concentration
from the small to the large farms, in all the flows. Because
the treatment efficiency was set to identical levels for all
the farm types in our status quo assumptions (see Tables 2,
3, parameters kleach_pond, ksettle, kevp, kbiomass, kemis_heap(N) ,
kemis_pond(N) , kemis_AD
(N) , ksettle(N) , kbiomass
(N) ), this difference must be
related with the level of waste management, especially
dung separation, which improves with increasing farm size.
0 2000 4000 6000 8000
Total N discharge from pig farms to TR
0.0001
0.0002
0.0003
0 [tN/yr]
1/[t
N/y
r]
Fig. 4 Probability distribution for the Monte Carlo simulation
(black) and Gaussian Error Propagation (gray) for the total nitrogen
flow to TR from all the pig farms (t N/year); the area under the curve
is equal to 1
416 M. Schaffner et al.
123
Slaughterhouse discharge has a surprisingly low nitro-
gen concentration, in fact, of an order of magnitude lower
than any of the farm effluents. Owing to the large amounts
of water used for cleaning purposes together with the low
specific waste produced per slaughtered pig (see Table 5);
SH wastewater is rather diluted.
The Thai government established effluent standards for
medium and large pig farms (MOSTE 2001) as well as for
slaughterhouses (MOSTE 1996). These regulations cover
nitrogen and organic indicators, but exclude phosphorus.
They allow a maximum of 120–200 mg/l Total Kjeldahl
Nitrogen (TKN) for large and medium farms, respectively,
and 100 mg/l TKN for slaughterhouses (classified as Type
1 factories).
We compare our results with these standards, keeping
in mind that TKN only includes organic nitrogen and
ammonia, but not nitrate and nitrite, and that, therefore,
these standards cannot be directly compared with our
simulation results which are based on total nitrogen
(organic as well as inorganic). According to our simulation
results for the status quo, none of the nitrogen discharge
flows complies with the required standards, exceeding
these by a factor of between 1.5 and 4 (Table 6).
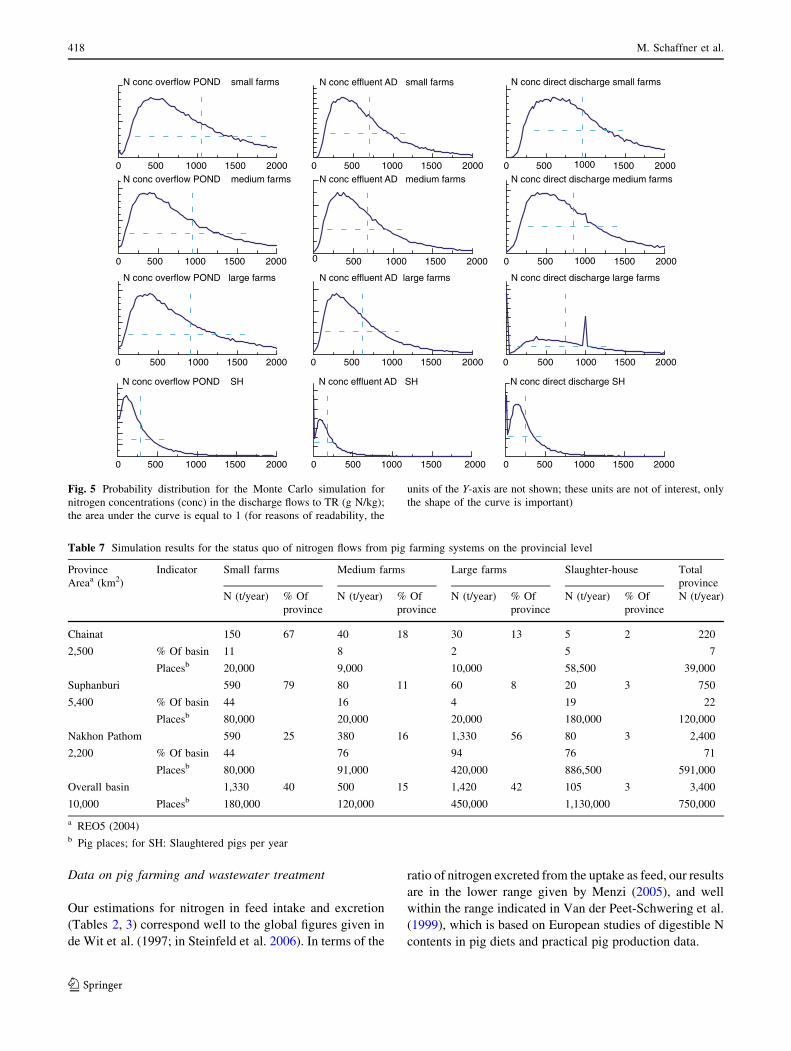
The uncertainty analysis for the N concentrations of all
the discharge flows is presented in Fig. 5. The probability
distributions also have a relatively wide lognormal shape.
A detailed analysis shows that the probability for the
simulated concentrations to be below the standards is very
low: for medium farms: 9% (POND), 10% (AD), and 5%
(direct discharge); for large farms: 4% (POND), 4% (AD),
and 12% (direct discharge); for SH: 27% (POND), 35%
(AD), and 22% (direct discharge). It should be pointed out
that the simulations shown here are for average farm types.
They cannot be applied to an individual farm.
Spatial disaggregation: downscaling the model to
provincial level
In order to investigate the spatial distribution of nitrogen
discharges from pig systems, we apply the MFA model on
a provincial scale for the three provinces of Chainat,
Suphanburi, and Nakhon Pathom. This is done by adapting
the parameter ppigs (pig places; see Tables 2, 3) according
to the provincial numbers (DLD 2004), assuming that all
other parameters remain the same as for the overall basin.
Table 7 shows the total nitrogen discharge flows per
province and farm type, and their respective importance
(%) in the province and the total basin.
The results of the province-level calculations show that
Nakhon Pathom province contributes roughly 70% of the
total pig nitrogen discharge of the basin due to the fact that
it is the basin’s key pig production area (with roughly 80%
of the basin’s pig places). In comparison, Chainat province
contributes only with 7% to the pig-related nitrogen load.
The significance of the individual farm types changes from
province to province. While small farms dominate in
Chainat and Suphanburi provinces, in Nakhon Pathom
province, the main contribution comes from large farms.
This indicates an important aspect regarding the formula-
tion of water quality remediation policies: the priorities of
the targeted farm types should be adapted according to
their respective importance in each province.
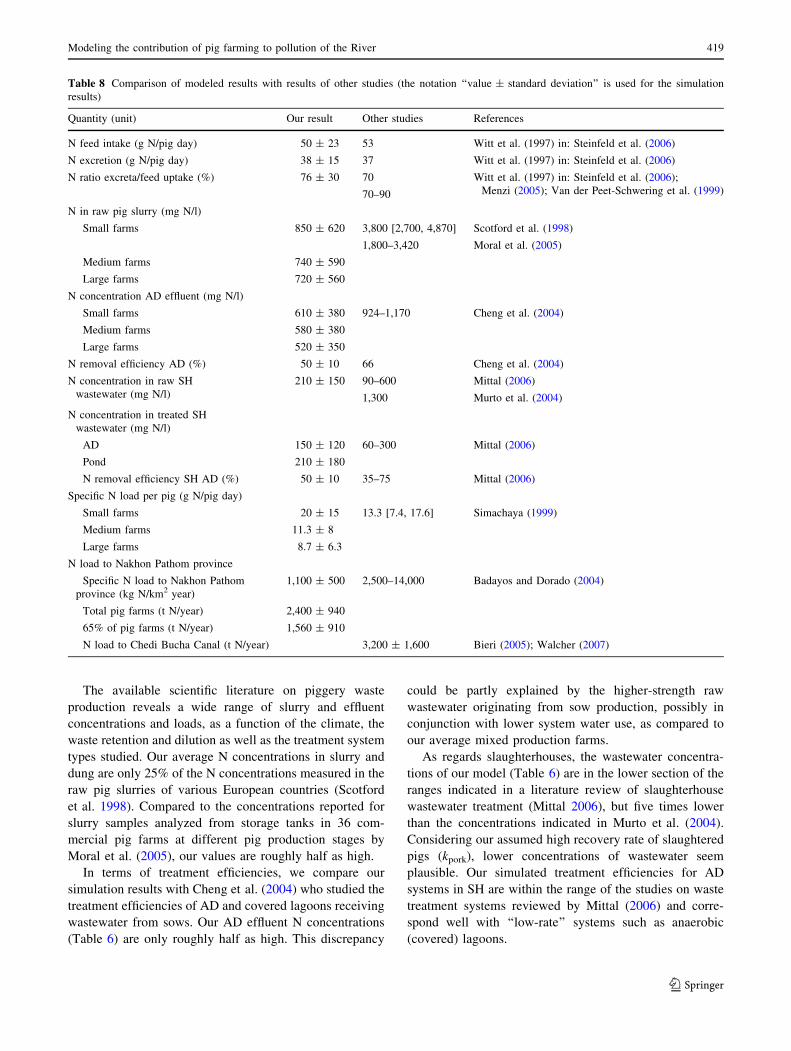
Plausibility considerations (validation)
Data on pig farming production and wastewater treatment
as well as surface water quality measurements obtained
from the international literature and local surveys allow
cross checking our modeled results (Table 8).
Table 6 Loads, concentrations, and effluent standards for nitrogen flows from pig farming systems and slaughterhouses
Overflow POND Effluent AD Direct discharge Runoff HEAP Total discharge Standarda TKN (mg N/l)
Small farms
Load N (t N/year) 177 55 1,088 14 1,334
Concentration N (mg N/l) 850 610 850 3,500 840 None
Medium farms
Load N (t N/year) 270 18 195 14 497
Concentration N (mg N/l) 740 580 740 3,400 750 200
Large farms
Load N (t N/year) 923 440 – 64 1,427
Concentration N (mg N/l) 720 520 2,600 660 120
Slaughter-houses
Load N (t N/year) 11 1.5 90 – 103
Concentration N (mg N/l) 210 150 210 – 200 100
a Thai effluent standards for pig farms (MOSTE 2001) and SH (MOSTE 1996)
Modeling the contribution of pig farming to pollution of the River 417
123
Data on pig farming and wastewater treatment
Our estimations for nitrogen in feed intake and excretion
(Tables 2, 3) correspond well to the global figures given in
de Wit et al. (1997; in Steinfeld et al. 2006). In terms of the
ratio of nitrogen excreted from the uptake as feed, our results
are in the lower range given by Menzi (2005), and well
within the range indicated in Van der Peet-Schwering et al.
(1999), which is based on European studies of digestible N
contents in pig diets and practical pig production data.
0 500 1000 1500 2000
N conc overflow POND small farms
0
N conc effluent AD small farms
0
N conc direct discharge small farms
0 0 0
0 0 0
0 0 0
N conc overflow POND medium farms
N conc overflow POND large farms
N conc overflow POND SH
500 1000 1500 2000 500 1000 1500 2000
500 1000 1500 2000
500 1000 1500 2000
500 1000 1500 2000500 1000 1500 2000
500 1000 1500 2000
500 1000 1500 2000500 1000 1500 2000
500 1000 1500 2000
500 1000 1500 2000
N conc effluent AD medium farms
N conc effluent AD large farms
N conc effluent AD SH
N conc direct discharge medium farms
N conc direct discharge large farms
N conc direct discharge SH
Fig. 5 Probability distribution for the Monte Carlo simulation for
nitrogen concentrations (conc) in the discharge flows to TR (g N/kg);
the area under the curve is equal to 1 (for reasons of readability, the
units of the Y-axis are not shown; these units are not of interest, only
the shape of the curve is important)
Table 7 Simulation results for the status quo of nitrogen flows from pig farming systems on the provincial level
Province
Areaa (km2)
Indicator Small farms Medium farms Large farms Slaughter-house Total
province
N (t/year) % Of
province
N (t/year) % Of
province
N (t/year) % Of
province
N (t/year) % Of
province
N (t/year)
Chainat
2,500
150 67 40 18 30 13 5 2 220
% Of basin 11 8 2 5 7
Placesb 20,000 9,000 10,000 58,500 39,000
Suphanburi
5,400
590 79 80 11 60 8 20 3 750
% Of basin 44 16 4 19 22
Placesb 80,000 20,000 20,000 180,000 120,000
Nakhon Pathom
2,200
590 25 380 16 1,330 56 80 3 2,400
% Of basin 44 76 94 76 71
Placesb 80,000 91,000 420,000 886,500 591,000
Overall basin
10,000
1,330 40 500 15 1,420 42 105 3 3,400
Placesb 180,000 120,000 450,000 1,130,000 750,000
a REO5 (2004)b Pig places; for SH: Slaughtered pigs per year
418 M. Schaffner et al.
123
The available scientific literature on piggery waste
production reveals a wide range of slurry and effluent
concentrations and loads, as a function of the climate, the
waste retention and dilution as well as the treatment system
types studied. Our average N concentrations in slurry and
dung are only 25% of the N concentrations measured in the
raw pig slurries of various European countries (Scotford
et al. 1998). Compared to the concentrations reported for
slurry samples analyzed from storage tanks in 36 com-
mercial pig farms at different pig production stages by
Moral et al. (2005), our values are roughly half as high.
In terms of treatment efficiencies, we compare our
simulation results with Cheng et al. (2004) who studied the
treatment efficiencies of AD and covered lagoons receiving
wastewater from sows. Our AD effluent N concentrations
(Table 6) are only roughly half as high. This discrepancy
could be partly explained by the higher-strength raw
wastewater originating from sow production, possibly in
conjunction with lower system water use, as compared to
our average mixed production farms.
As regards slaughterhouses, the wastewater concentra-
tions of our model (Table 6) are in the lower section of the
ranges indicated in a literature review of slaughterhouse
wastewater treatment (Mittal 2006), but five times lower
than the concentrations indicated in Murto et al. (2004).
Considering our assumed high recovery rate of slaughtered
pigs (kpork), lower concentrations of wastewater seem
plausible. Our simulated treatment efficiencies for AD
systems in SH are within the range of the studies on waste
treatment systems reviewed by Mittal (2006) and corre-
spond well with ‘‘low-rate’’ systems such as anaerobic
(covered) lagoons.
Table 8 Comparison of modeled results with results of other studies (the notation ‘‘value ± standard deviation’’ is used for the simulation
results)
Quantity (unit) Our result Other studies References
N feed intake (g N/pig day) 50 ± 23 53 Witt et al. (1997) in: Steinfeld et al. (2006)
N excretion (g N/pig day) 38 ± 15 37 Witt et al. (1997) in: Steinfeld et al. (2006)
N ratio excreta/feed uptake (%) 76 ± 30 70
70–90
Witt et al. (1997) in: Steinfeld et al. (2006);
Menzi (2005); Van der Peet-Schwering et al. (1999)
N in raw pig slurry (mg N/l)
Small farms 850 ± 620 3,800 [2,700, 4,870] Scotford et al. (1998)
1,800–3,420 Moral et al. (2005)
Medium farms 740 ± 590
Large farms 720 ± 560
N concentration AD effluent (mg N/l)
Small farms 610 ± 380 924–1,170 Cheng et al. (2004)
Medium farms 580 ± 380
Large farms 520 ± 350
N removal efficiency AD (%) 50 ± 10 66 Cheng et al. (2004)
N concentration in raw SH
wastewater (mg N/l)
210 ± 150 90–600 Mittal (2006)
1,300 Murto et al. (2004)
N concentration in treated SH
wastewater (mg N/l)
AD 150 ± 120 60–300 Mittal (2006)
Pond 210 ± 180
N removal efficiency SH AD (%) 50 ± 10 35–75 Mittal (2006)
Specific N load per pig (g N/pig day)
Small farms 20 ± 15 13.3 [7.4, 17.6] Simachaya (1999)
Medium farms 11.3 ± 8
Large farms 8.7 ± 6.3
N load to Nakhon Pathom province
Specific N load to Nakhon Pathom
province (kg N/km2 year)
1,100 ± 500 2,500–14,000 Badayos and Dorado (2004)
Total pig farms (t N/year) 2,400 ± 940
65% of pig farms (t N/year) 1,560 ± 910
N load to Chedi Bucha Canal (t N/year) 3,200 ± 1,600 Bieri (2005); Walcher (2007)
Modeling the contribution of pig farming to pollution of the River 419
123
Field studies on nutrient discharge from pig farms in
Thailand confirm our results for specific loads. Simachaya
(1999) found an average total nitrogen load in the same
range as our estimated specific nitrogen loads for the three
farm types. A rough nutrient load estimation for pig pro-
duction in Thailand (Badayos and Dorado 2004) classifies
the area of Nakhon Pathom province under the highest
nitrogen load-receiving category. Our simulated N loads
(Table 7) are significantly lower than those estimates.
In order to conclude, the cross-check of our model
results for pig waste production and treatment shows that
generally our figures are lower than those of other studies.
This is explained and justified by the fact that our results
are conservative estimates and averages over the whole
year, and not actual or peak emissions. In contrast, the
experimental results of other authors are mainly based on
point measurements.
Data on surface water quality
The Chedi Bucha Canal is an important and heavily polluted
canal in Nakhon Pathom province, discharging from an area
of highly concentrated pig farming. According to the sta-
tistics (DLD and PCD 2002), 65% of the pig farming in
Nakhon Pathom is concentrated in this area. Estimations of
N loads in this canal on the basis of the water quality data of
Bieri (2005) and the discharge measurements of Walcher
(2007) amount to a daily load of roughly 8.8 t N or an annual
nutrient load of 3,200 t N from this canal (Table 8). These
load estimations must be considered very carefully, assum-
ing an uncertainty of not less than 50–100%: the extrapola-
tions are based on water quality point measurements made in
2004 and point discharge estimations made in 2006.
The difference between simulated and estimated loads
may be due to the following three reasons: (1) Domestic
areas (provincial capital and rural settlements) and crop
agriculture (mainly rice and sugar cane) also contribute
considerably to the nitrogen discharge in the catchment
area; (2) Sedimentation is responsible for a certain ‘‘loss’’
of N from the water body, and thus not all the discharged
nutrients can be measured in the surface water; (3)
Potential denitrification in surface waters due to high
temperatures and slow-moving water. Based on Reinhardt
et al. (2006), Muller (pers. comm.) estimates a denitrifi-
cation-N loss from slow-flowing surface waters in warm
climates of up to 30%.
The first reason would increase whereas the second and
third ones would decrease the simulated loads.
Sensitivity analysis and scenario discussion
The sensitive parameters of the nitrogen loads to TR are
determined and evaluated with regard to possible measures
to reduce the environmental impact. The procedure for
deriving possible measures is as follows (see also
Kwonpongsagoon et al. 2007):
(1) Determine which parameters are sensitive to the key
variable of interest
(2) For the sensitive parameters simulate the highest
possible reduction (reduction potential)
(3) Determine the realistic reduction potential on the
basis of the current system knowledge
(4) Discuss and compare the various possible measures.
Scenario discussion: realistic reduction potential of N load
to Thachin River Basin
We present three possible scenarios which target different
aspects of potential nutrient mitigation related to the sen-
sitive parameters identified. The scenarios are applied to all
the farm types. Note that our selection of possible scenarios
is not complete. Although other scenarios may also pro-
duce significant effects, we selected those that we consider
to have the greatest potential [for a detailed analysis of
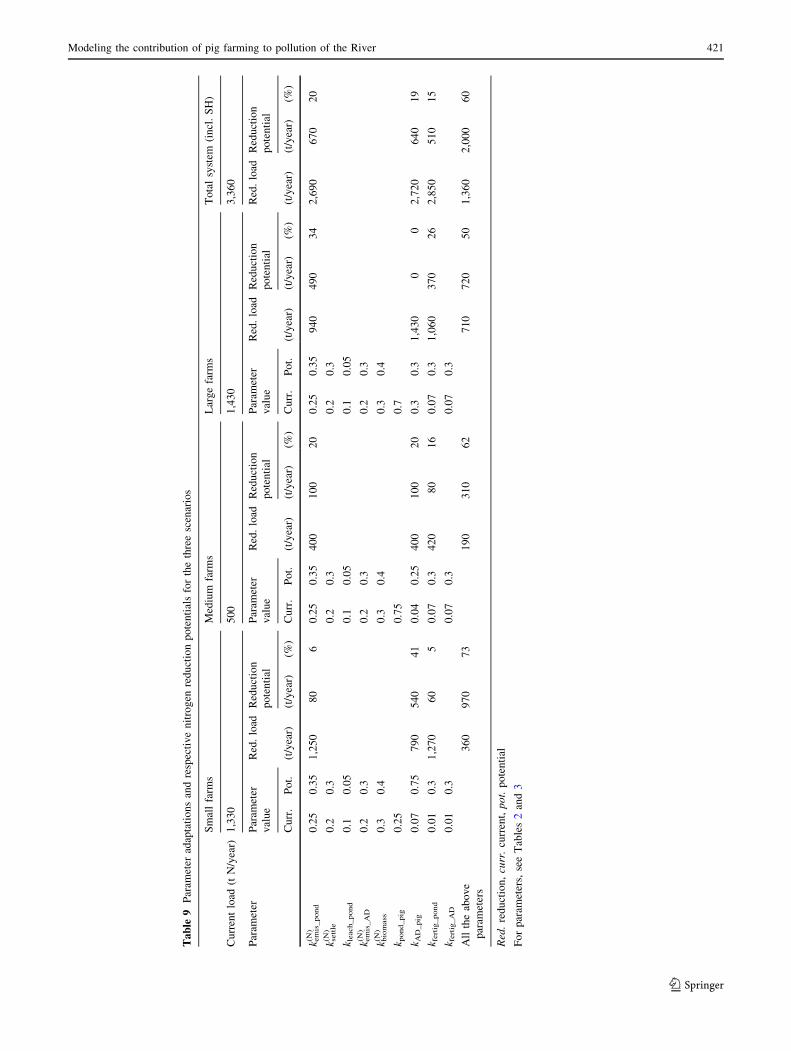
steps 1 and 2 above see Schaffner (2007)]. Table 9 sum-
marizes the three scenarios, showing the altered parameters
and the respective N load reduction potential for the indi-
vidual farm types and the total pig system (including SH)
compared with the status quo conditions.
Scenario 1: Increase treatment efficiency
Liquid waste management systems (POND and AD) of
all the farms, with present treatment coverage: kemis_pond(N) ;
ksettle(N) ; kleach_pond; kemis_AD
(N) , and kbiomass(N)
In the first scenario, we investigate the potential of
reducing N loads by increasing the treatment efficiency of
liquid waste management systems (POND and AD). For
the corresponding POND parameters, we adopt the maxi-
mum rates indicated by DLD experts, assuming these
reflect the upper level of realistic treatment efficiency
achievable in local (TRB) conditions. A reduced leaching
rate is considered an implicit aspect of technological
improvement of the system. For AD systems, the treatment
efficiency of our status quo model already exceeds the
DLD expert indications. Therefore, to simulate the opti-
mum N-treatment efficiency, we adopt the maximum of
70% given in Yang and Gan (1998) and accordingly
increase the N emissions to 30% and the biomass N to
40%.
The simulations with the altered parameters indicate a
potential N load reduction of 20% for the total pig system
in the Thachin Basin. The effect is the greatest for large
farms (34%), lowest for small farms (6%), and average for
medium farms. This discrepancy is due to the different
degrees of treatment coverage: only farms with treatment
systems can benefit by improving their efficiency. The
420 M. Schaffner et al.
123
Ta
ble
9P
aram
eter
adap
tati
on
san
dre
spec
tiv
en
itro
gen
red
uct
ion
po
ten
tial
sfo
rth
eth
ree
scen
ario
s
Sm
all
farm
sM
ediu
mfa
rms
Lar
ge
farm
sT
ota
lsy
stem
(in
cl.
SH
)
Cu
rren
tlo
ad(t
N/y
ear)
1,3
30
50
01
,43
03
,36
0
Par
amet
erP
aram
eter
val
ue
Red
.lo
adR
edu
ctio
n
po
ten
tial
Par
amet
er
val
ue
Red
.lo
adR
edu
ctio
n
po
ten
tial
Par
amet
er
val
ue
Red
.lo
adR
edu
ctio
n
po
ten
tial
Red
.lo
adR
edu
ctio
n
po
ten
tial
Cu
rr.
Po
t.(t
/yea
r)(t
/yea
r)(%
)C
urr
.P
ot.
(t/y
ear)
(t/y
ear)
(%)
Cu
rr.
Po
t.(t
/yea
r)(t
/yea
r)(%
)(t
/yea
r)(t
/yea
r)(%
)
k em
is_pond
(N)
0.2
50
.35
1,2
50
80
60
.25
0.3
54
00
10
02
00
.25
0.3
59
40
49
03
42
,69
06
70
20
k sett
le(N
)0
.20
.30
.20
.30
.20
.3
k leach_pond
0.1
0.0
50
.10
.05
0.1
0.0
5
k em
is_A
D(N
)0
.20
.30
.20
.30
.20
.3
k bio
mass
(N)
0.3
0.4
0.3
0.4
0.3
0.4
k pond_pig
0.2
50
.75
0.7
k AD
_pig
0.0
70
.75
79
05
40
41
0.0
40
.25
40
01
00
20
0.3
0.3
1,4
30
00
2,7
20
64
01
9
k fert
ig_pond
0.0
10
.31
,27
06
05
0.0
70
.34
20
80
16
0.0
70
.31
,06
03
70
26
2,8
50
51
01
5
k fert
ig_A
D0
.01
0.3
0.0
70
.30
.07
0.3
All
the
abo
ve
par
amet
ers
36
09
70
73
19
03
10
62
71
07
20
50
1,3
60
2,0
00
60
Red
.re
du
ctio
n,
curr
.cu
rren
t,p
ot.
po
ten
tial
Fo
rp
aram
eter
s,se
eT
able
s2
and
3
Modeling the contribution of pig farming to pollution of the River 421
123
treatment coverage is consequently addressed as the second
aspect in Scenario 2.
Scenario 2: Increase treatment coverage
All farms, with present treatment efficiency: kAD_pig
Many of the pig farms in the Thachin Basin, small
farms, in particular, still lack treatment systems and dis-
charge their raw waste directly to water bodies. Therefore,
for Scenario 2, we increase the treatment coverage to an
optimum of 100% for all the farm types. However, it is
unrealistic to introduce any more POND systems in
addition to the current ones due to a lack of sufficient extra
land in the areas of intensive pig production (POND sys-
tems require considerable space). New treatment systems
are therefore introduced in the form of AD, and we
increase the AD coverage parameter (kAD_pig) so that
kAD_pig ? kPond_pig = 1.
This scenario results in a potential total N load reduction
equivalent to Scenario 1 (20%). In terms of individual farm
contributions, however, the effects are opposite: N load
reduction with Scenario 2 is the highest for small farms
(over 40%) and average for medium farms (20%), while
large farms remain at the status quo level (0% reduction).
Scenario 3: Increase liquid manure reuse
All farms, with present treatment coverage and effi-
ciency: kfertig_pond, kfertig_AD
This scenario reflects the principle of closing the nutri-
ent loop. We increase the rate of liquid manure reuse from
POND and AD systems to crop agriculture and aquaculture
(kfertig_pond and kfertig_AD). According to Gerber and Stein-
feld (2006), a high reuse rate of liquid waste would be
desirable but is difficult to implement with the current
spatial distribution of livestock and crop production
activities in the central plains of Thailand. Owing to the
considerable distance between pig production sites and
agricultural cropland, transferring liquid waste to crops
requires costly transportation. Reusing liquid manure is
more realistic in rural areas, where sufficient agricultural
cropland is available to accommodate the nutrients from
liquid manure. In the Thachin Basin, such rural areas exist
to the north (in Chainat and Suphanburi provinces), which
generate roughly 20% of the total pig production of the
basin (see Table 7), and in the northern areas of Nakhon
Pathom province. Assuming all of the liquid manure pro-
duced could be reused in these rural areas, we increase the
recycling rate of POND and AD end-products to 30%,
according to this spatial distribution of pig production in
the basin.
The scenario calculations show a basin-wide potential N
load reduction of 15%, somewhat lower than for Scenarios
1 and 2. The largest reduction potential is achieved in large
farms (25%), while the smallest farms show the least
response (5%). This scenario is again related to the ratio of
farms connected to treatment systems, as the reuse rate
applies only for treated liquid waste, and not for direct
discharge.
Scenario comparison
From an overall system perspective, all the three scenarios
show a considerable N load reduction potential of 15–20%.
However, depending on the farm type, the N load reduction
effects of the studied scenarios vary greatly (Table 9). As
regards the viability of implementation, the three scenarios
require different basic conditions.
Treatment efficiency: For Scenario 1, existing treatment
schemes are upgraded. From a technological perspective,
this would be feasible considering that the improved effi-
ciency is in line with the maximum value indicated by local
experts. Menzi (2005) however, questions such an attempt,
noting that treatment can hardly solve a nutrient surplus
problem, at least not at a reasonable cost. A valuable
alternative would be to reuse this effluent as a nutrient
resource in crop agriculture (see Scenario 3), especially in
areas where the irrigation water supply is limited (Rat-
tanarajcharkul et al. 2000). Also, increasing the rate of
dung separation would reduce liquid manure concentra-
tions. However, the current trend in the Thachin Basin is
rather the opposite: Somchai (pers. comm.) has observed a
steady increase of AD systems which do not require dung
separation, as the whole pig waste is collected and treated
as slurry.
Treatment coverage: The Thai government is well aware
of the problem of the direct discharge of raw pig waste.
Discussions of how to include this farm category within the
regulations are under way. The limited land area is often
cited as a key obstacle in the attempt to increase treatment
coverage (Gerber 2006), especially if the farms are located
within a gradually urbanizing area such as the Thachin
Basin. Scenario 2 addresses this constraint by promoting AD
systems which enable high potential treatment efficiency on
little space. Nevertheless, to achieve 100% treatment cov-
erage in the basin is a very optimistic aim. Significant pro-
motion activities and economic incentives would certainly
be needed to induce all the farmers in the area to establish
AD treatment systems with their associated costs. The
small-scale household enterprises in particular may lack the
economic basis for such an investment, a fact which may
explain the low treatment coverage in this farm category.
However, if AD systems include biogas production, the
electricity produced could be used to meet on-farm energy
requirements and thus produce a return on investment costs.
A combination with Scenario 3 (increased liquid manure
reuse) may also generate economic benefits in the long term
(where sufficient crop land is available).
Liquid manure reuse: The lack of liquid manure reuse
has been well identified by the AWI project as ‘‘the main
422 M. Schaffner et al.
123
environmental threat of intensive livestock production’’
(DLD and FAO 2004). However, the economic benefit of
reusing liquid waste is low, except for farms with sufficient
adjacent agricultural land. Owing to the high dilution of the
slurry by cleaning and cooling water, transport volumes
and corresponding costs are high, and fertilizing quality is
low. Simply upgrading logistics and coordinative
arrangements between livestock and crop farming activities
will not be sufficient to compensate for such drawbacks.
Thus, the extent to which the liquid manure reuse rate can
be increased is dependent on the crop land available in the
vicinity of the pig production units. In order to achieve a
100% reuse rate of all of the liquid manure produced in the
Thachin Basin would imply relocating farms from urban-
ized, confined spaces to rural areas (Gerber and Steinfeld
2006). This is not considered practicable in the short and
medium terms.
In order to conclude, from the point of view of nitrogen
load reduction, all the scenarios have a significant effect of
over 15–20% (liquid manure reuse, treatment efficiency
and coverage). In contrast, the effluent N concentrations
are still high above the required standards. However, the
crucial target to improve the quality of the receiving waters
at a regional level is the reduction of the nutrient load;
while the quality of the effluents remains a local-level
issue.
Conclusions
This study shows that with an MFA model based on pro-
found system knowledge, it is possible to gain an overview
of the dimensions of the various pollution flows from pig
farms to surface waters, to identify the key flows, and to
discuss possible and effective remediation scenarios. For
such a first-hand overview, the above-presented model is
accurate enough. The comparison of our results with other
studies shows that our figures are conservative in the sense
that the total N load to the Thachin River could even be
higher. The MMFA model aims at quantifying the orders
of magnitude of pollution flows, to determine the key pri-
orities for mitigation. Thus our model is complementary to
other more detailed studies, such as process-based models,
which can consequently be carried out to specifically
investigate those priority flows identified.
Within the pig production system of the TRB, liquid
waste discharge produces the bulk of surface water nitro-
gen pollution. This occurs as direct discharge of raw pig
waste, mainly from small farms, and as overflow/effluent
from large-farm liquid treatment systems. Medium farms
contribute little to the nitrogen load, and the input from
slaughterhouses is negligible. Potential measures to effec-
tively reduce these flows are: (1) to increase the treatment
efficiency for all the farm types, (2) to increase the treat-
ment coverage for small and medium farm types or (3) to
increase the reuse of liquid manure for all the farm types.
The simulations show that each of these measures would
have an approximate 20% reduction potential for the net
nitrogen load to the basin.
Finally, a more balanced pig diet may reduce nitrogen
excretion by as much as 30–39% depending on the initial
diet composition (Steinfeld et al. 2006). This would
directly lower the nitrogen excretion of pigs (at the source),
with a linear effect on the resulting nitrogen load to the
TRB.
Acknowledgments The research for this article was carried out
within Work Package 3 of the Swiss National Centre of Competence
in Research (NCCR) North–South: Research Partnerships for Miti-
gating Syndromes of Global Change. The project is co-funded by the
Swiss National Science Foundation (SNF), and the Swiss Agency for
Development and Cooperation (SDC), and part of a partnership
between the Asian Institute of Technology (AIT), the Swiss Federal
Institute of Aquatic Science and Technology (EAWAG), and the
Hydrology Group of the University of Berne. The authors would like
to express their sincere gratitude to the following local and interna-
tional experts for generously sharing their knowledge and experiences
on the pig farming system in Thailand: Dr. Arux Chaiyakul,
Dr. Adisorn Chanprapalert, Dr. Somchai Chantsavang, Dr. Sommai
Chatsanguthai, Dr. Pierre Gerber, Dr. Roongnapa Korparditskul,
Dr. Dirk Lamberts, Dr. Harald Menzi, Dr. Sumet Mettasart, Dr. Beat
Muller, and Dr. Kattaporn Poopej.
References
Baccini P, Bader H-P (1996) Regionaler Stoffhaushalt. Erfassung,
Bewertung und Steuerung. Spektrum Akademischer Verlag,
Heidelberg
Baccini P, Brunner PH (1991) Metabolism of the anthroposphere.
Springer, New York
Badayos R, Dorado M (2004) Environmental baseline study (EBS):
nutrients migration to South China Sea. World Bank/GEF
Bader H-P, Scheidegger R, Real M (2006) Global renewable energies:
a dynamic study of implementation time, greenhouse gas
emissions and financial needs. Clean Technol Environ Policy
8(3):159–173
Bieri F (2005) Water quality assessment and analysis in Thachin
River Basin, Thailand. Masters Thesis, University of Bern
Binder C, Schertenleib R, Diaz J, Bader H-P, Baccini P (1997)
Regional water balance as a tool for water management in
developing countries. Int J Water Resour Dev 13(1):5–20
Brunner PH, Daxbeck H, Henseler G, von Steiger B, Beer B, Piepke
G (1990) RESUB - der Regionale Stoffhaushalt im Unteren
Bunztal: die Entwicklung einer Methodik zur Erfassung des
regionalen Stoffhaushaltes. EAWAG, Dubendorf
Cheng J, Shearin TE, Peet MM, Willits DH (2004) Utilization of
treated swine wastewater for greenhouse tomato production.
Water Sci Technol 50(2):77–82
DLD (2004) Effect of piggery farms to Thachin River (in Thai).
Department of Livestock Development, Bangkok
DLD, FAO (2004) Area wide integration (AWI) of specialised crop
and livestock activities. Department of Livestock Development,
Ministry of Agriculture and Cooperatives, Bangkok
DLD, PCD (2002) Plan and procedure for pig farm wastewater
management in Thachin and Maeklong River Basins (in Thai).
Modeling the contribution of pig farming to pollution of the River 423
123
Department of Livestock Development and Pollution Control
Department, Bangkok
FAO, DLD (2002) Policy implications of area-wide integration
(AWI) of specialized crop and livestock activities: identification
of technology and policy options in Eastern Thailand. Food and
Agriculture Organization of the United Nations and Department
of Livestock Development/Ministry of Agriculture and Cooper-
atives, Bangkok
Gerber P (2006) Putting pigs in their place, environmental policies for
intensive livestock production in rapidly growing economies,
with reference to pig farming in Central Thailand. PhD Thesis,
Swiss Federal Institute of Technology, Zurich
Gerber P, Steinfeld H (2006) Regional planning or pollution control?
Policy options addressing livestock waste, with reference to
industrial pig production in Thailand. In: Gerber P (2006)
Putting pigs in their place, environmental policies for intensive
livestock production in rapidly growing economies, with refer-
ence to pig farming in Central Thailand. PhD Thesis, Swiss
Federal Institute of Technology, Zurich
Gerber P, Chilonda P, Franceschini G, Menzi H (2004) Geographical
determinants and environmental implications of livestock pro-
duction intensification in Asia. Bioresour Technol 96(6):263–
276
Huang D-B, Bader H-P, Scheidegger R, Schertenleib R, Gujer W
(2007) Confronting limitations: new solutions required in urban
water management of a Chinese mega-city. J Environ Manage
84(1):49–61
Jonsson H, Vinneras B (2003) Adapting the nutrient content of urine
and faeces in different countries using FAO and Swedish data.In: Proceedings from the 2nd international symposium on
ecological sanitation, Luebeck, Germany
Kasetsart University, IRD (1996) Agricultural and irrigation patterns
in the Central Plain of Thailand: preliminary analysis and
prospects for agricultural development. Kasetsart University,
DORAS Centre, Bangkok
Kwanmeung S (2002) Geographic information system for assessing
land and subsurface water sensitivity to nitrate and phosphate
contamination from swine farms in Muang District, Nakhon
Pathom Province. Masters Thesis, Mahidol University, Bangkok
Kwonpongsagoon S, Bader H-P, Scheidegger R (2007) Modelling
cadmium flows in Australia on the basis of a Substance Flow
Analysis. Clean Technol Environ Policy 9(4):313–323
Lampert C, Brunner PH (1999) Materials accounting as a policy tool
for nutrient management in the Danube basin. Water Sci Technol
40(10):43–49
LDD (1989) Soil map scale 1:50’000. Department of Land Devel-
opment, Bangkok
Menzi H (2005) Need and implications of good manure and nutrient
management in extensive livestock production in developing
countries. In: Livestock waste management in East Asia project
preparation Report. FAO, Rome
Menzi H, Ruettimann L, Gerber P (2002) NuFlux-AWI: a calculation
model to quantify nutrient fluxes and balances of intensive
livestock production in developing countries. In: Proceedings
from the 10th international conference of the RAMIRAN
network, High Tatras, Slovak Republic
Mittal GS (2006) Treatment of wastewater from abattoirs before land
application—a review. Bioresour Technol 97(9):1119–1135
Moral R, Perez-Murcia MD, Perez-Espinosa A, Moreno-Caselles J,
Paredes C (2005) Estimation of nutrient values of pig slurries in
Southeast Spain using easily determined properties. Waste
Manage 25(7):719–725
MOSTE (1996) Notification of the Ministry of Science, Technology
and Environment, No. 3, 4 (1996), issued under the Enhance-
ment and Conservation of National Environmental Quality Act
(1992), published in the Royal Government Gazette, vol 113,
Part 13 D, dated February 13, 1996. Ministry of Science,
Technology and Environment, Bangkok
MOSTE (2001) Notification of the Ministry of Science, Technology
and Environment, issued under the Enhancement and Conserva-
tion of National Environmental Quality Act (1992), published in
the Royal Government Gazette, vol 118, Special Part 8, dated
February 23, 2001. Ministry of Science, Technology and
Environment, Bangkok
Murto M, Bjornsson L, Mattiasson B (2004) Impact of food industrial
waste on anaerobic co-digestion of sewage sludge and pig
manure. J Environ Manage 70(2):101–107
Office of Natural Resources and Environmental Policy and Planning
(2002) Thailand State of the environment report 2002: executive
summary. Ministry of Natural Resources and Environment,
Bangkok
PCD (1995) GIS database for Thachin River Basin. Pollution Control
Department of Thailand, Bangkok
PCD, Environmental Consultant (2004) Project to improve the water
quality of industrial waste water in Thachin River Basin (in
Thai). Pollution Control Department, Bangkok
PCD, Pro-En Technologies (2002) Assessment of water reservoir’s
capacity in coping with pollution generated from trivial activities
in conservative area—executive summary. Pollution Control
Department, Bangkok
PCD, Thailand Environment Foundation, Montgomery Watson Asia,
Coastal Consultancy International Pty Ltd. (1997) Development
of an action plan to improve water quality in the Central River
Basin, Thailand. Ministry of Science, Technology and Environ-
ment, Bangkok
Pfister F, Bader H-P, Scheidegger R, Baccini P (2005) Dynamic
modelling of resource management for farming systems. Agric
Syst 86(1):1–28
Portejoie S, Gerber P, Steinfeld H, Junelamate W, Liang JB, Salazar
F, Salazar GG (2003) Manure management decision support
tool. Process, design, references. AWI, Bangkok
Rattanarajcharkul R, Rucha W, Sommer S, Menzi H (2000) Area-
wide integration of specialised livestock and crop production in
Eastern Thailand. In: Proceedings from the conference of the
FAO/ESCORENA network on recycling agricultural, municipal
and industrial residues in agriculture (RAMIRAN), Gargnano,
Italy
Reinhardt M, Muller B, Gachter R, Wehrli B (2006) Nitrogen
removal in a small constructed wetland: an isotope mass balance
approach. Environ Sci Technol 40:3313–3319
Sarikaya HZ, Sevimli MF, Citil E (1999) Region-wide assessment ofthe land-based sources of pollution of the black sea. Water Sci
Technol 39(8):193–200
Schaffner M (2007) Applying a material flow analysis model to assess
river water pollution and mitigation potentials—a case study in
the Thachin River Basin, Central Thailand. PhD Thesis,
University of Bern. http://www.north-south.unibe.ch/content.
php/publication/id/2093
Schaffner M, Koottatep T, Bader H-P, Montangero A, Scheidegger R,
Schertenleib R (2005) Assessment of water quality problems and
mitigation potentials by using material flow analysis—a case-
study in the Tha Chin River Basin, Thailand. In: Proceedings
from the international symposium on the role of water sciences
in transboundary river basin management, Ubon Ratchathani,
Thailand
Schaffner M, Bader H-P, Scheidegger R (2009) Modeling the
contribution of point sources and non-point sources to Thachin
River water pollution. Sci Total Environ 407(2009):4902–4915
Scotford IM, Cumby TR, White RP, Carton OT, Lorenz F, Hatterman
U, Provolo G (1998) Estimation of the nutrient value of
agricultural slurries by measurement of physical and chemical
properties. J Agric Eng Res 71(3):291–305
424 M. Schaffner et al.
123
Simachaya W (1999) Integrated approaches to water quality man-
agement using geographical information systems and the
WASP5 simulation model: application to the Thachin River
Basin, Thailand. PhD Thesis, University of Guelph
Simachaya W (2003) Lessons learned on integrated watershed and
water quality management in the Thachin River Basin, Thailand.In: Proceedings from the first Southeast Asia water forum,
Chiang Mai, Thailand
Sinsupan T (2004) Material flux analysis (MFA) for Planning of
domestic wastes and wastewater management: case study in
Pakkret Municipality, Nonthaburi, Thailand. Masters Thesis,
Asian Institute of Technology, Bangkok
Somlyody L, Brunner PH, Kroiss H (1999) Nutrient balances for
danube countries: a strategic analysis. Water Sci Technol
40(10):9–16
Steinfeld H, Gerber P, Wassenaar T, Castel V, Rosales M, de Haan C
(2006) Livestock’s long shadow—environmental issues and
constraints. FAO, Rome
Thailand Meteorological Department (2001) Meteorological data for
Suphanburi Station (1971–2000). Thailand Meteorological
Department, Bangkok
Van der Peet-Schwering CMC, Jongbloed AW, Aarnink AJA (1999)
Nitrogen and phosphorus consumption, utilisation and losses in
pig production: The Netherlands. Livest Prod Sci 58(3):213–224
Walcher C (2007) Hydrological patterns in the Thachin River Basin,
Thailand. Masters Thesis, University of Bern
Yang PY, Gan C (1998) An on-farm swine waste management system
in Hawaii. Bioresour Technol 65(1–2):21–27
Zessner M, Kroiss H (1999) Retention and losses of nutrients in the
hydrosphere of Austria. Water Sci Technol 40(10):59–66
Modeling the contribution of pig farming to pollution of the River 425
123