Embed Size (px)
Citation preview
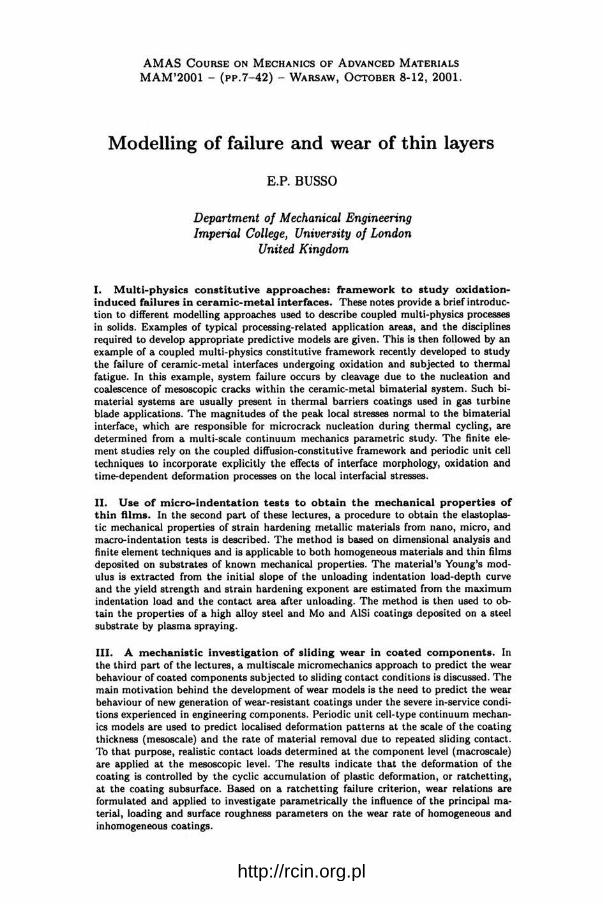
AMAS COURSE ON MECHANICS OF ADVANCED MATERIALS
MAM'2001 - (PP.7-42) -WARSAW, OCTOBER 8-12, 2001.
Modelling of failure and wear of thin layers
E.P. BUSSO
Department of Mechanical Engineering Imperial College, University of London
United Kingdom
I. Multi-physics constitutive approaches: framework to study oxidationinduced failures in ceramic-metal interfaces. These notes provide a brief introduction to different modelling approaches used to describe coupled multi-physics processes in solids. Examples of typical processing-related application areas, and the disciplines required to develop appropriate predictive models are given. This is then followed by an example of a coupled multi-physics constitutive framework recently developed to study the failure of ceramic-metal interfaces undergoing oxidation and subjected to thermal fatigue. In this example, system failure occurs by cleavage due to the nucleation and coalescence of mesoscopic cracks within the ceramic-metal bimaterial system. Such himaterial systems are usually present in thermal barriers coatings used in gas turbine blade applications. The magnitudes of the peak local stresses normal to the bimaterial interface, which are responsible for microcrack nucleation during thermal cycling, are determined from a multi-scale continuum mechanics parametric study. The finite element studies rely on the coupled diffusion-constitutive framework and periodic unit cell techniques to incorporate explicitly the effects of interface morphology, oxidation and time-dependent deformation processes on the local interfacial stresses.
II. Use of micro-indentation tests to obtain the mechanical properties of thin films. In the second part of these lectures, a procedure to obtain the elastoplastic mechanical properties of strain hardening metallic materials from nano, micro, and macro-indentation tests is described. The method is based on dimensional analysis and finite element techniques and is applicable to both homogeneous materials and thin films deposited on substrates of known mechanical properties. The material's Young's modulus is extracted from the initial slope of the unloading indentation load-depth curve and the yield strength and strain hardening exponent are estimated from the maximum indentation load and the contact area after unloading. The method is then used to obtain the properties of a high alloy steel and Mo and AlSi coatings deposited on a steel substrate by plasma spraying.
III. A mechanistic investigation of sliding wear in coated components. In the third part of the lectures, a multiscale micromechanics approach to predict the wear behaviour of coated components subjected to sliding contact conditions is discussed. The main motivation behind the development of wear models is the need to predict the wear behaviour of new generation of wear-resistant coatings under the severe in-service conditions experienced in engineering components. Periodic unit cell-type continuum mechanics models are used to predict localised deformation patterns at the scale of the coating thickness (mesoscale) and the rate of material removal due to repeated sliding contact. To that purpose, realistic contact loads determined at the component level (macroscale) are applied at the mesoscopic level. The results indicate that the deformation of the coating is controlled by the cyclic accumulation of plastic deformation, or ratchetting, at the coating subsurface. Based on a ratchetting failure criterion, wear relations are formulated and applied to investigate parametrically the influence of the principal material, loading and surface roughness parameters on the wear rate of homogeneous and inhomogeneous coatings.
http://rcin.org.pl

8 E.P. Bussa
I. Multi-physics constitutive approaches: framework to study oxidation-induced failures in ceramic-metal interfaces
1. Introduction
The main goals of multi-physics modelling approaches based on continuum mechanics principles are to improve:
• product performance, quality and productivity, • the understanding of complex processes (e.g. decouple parts of complex multi
physics problems).
The study of complex coupled phenomena may involve different disciplines, for instance:
1. solid mechanics,
2. material science, e.g. solidification, phase transformation, 3. fluid mechanics, 4. heat transfer,
5. field problems, e.g. magnetism.
Thus the building blocks required to develop a predictive framework can be quite diverse. In general, the following steps are typically required when developing a multy-physics framework:
1. identify the relevant physical phenomena, 2. develop the analytical formulation, 3. obtain the required data, 4. develop predictive models, 5. develop solution methods, particularly:
(a) robust numerical algorithms, (b) user interfaces.
Three types of multi-physics processes can be identified, namely those addressing interacting, concurrent, and coupled problems.
Interacting problems involve two different regions which interact at their bound-aries. For instance, transfer of, e.g.
• motion, • forces,
• heat. Examples are: ingot cooling, air bags, fluid flow in a pipe, etc.
Concurrent problems, on the other hand, are those requiring that multiple independent physical phenomena be simulated together. This enables considerable savings in computational time and costs to be made. Examples of concurrent problems are:
• metal forming, where the modelling of the actual process and the subsequent prediction of the component integrity during service are required,
• casting, where the solidification of the material and the resulting microstructural inhomogeneities which affect its mechanical properties are linked.
http://rcin.org.pl

MODELLING OF FAILURE AND WEAR OF THIN LAYERS 9
Finally, coupled problems are those where simultaneous physical phenomena develop in the same geometric region. Some of these depend on one another, e.g.:
• thermal stresses, • oxidation processes,
• coupled field problems: e.g. magnetism, piezo-electricity. The typical interactions that occur between different processes involving solid and interfaces are illustrated in Fig. 1. Here, the effect of the materials composition, manufacturing processes, environmental effects and deformation processes all contribute to define the microstructures of the system and its mechanical properties. The resulting microstructures, together with the applied loads, will thereafter control the mechanical integrity of either the solid or the system interfaces during service.
FIGURE 1. Illustration of the typical interactions found between chemical compositions and different processes with the resulting system properties and overall degradation.
Typical applications which exhibit such types of coupled processes include:
• diffusion-bonded systems, • high temperature composites, • manufacturing of LSI systems, • high temperature protective coatings, • coatings for biomechanical applications.
2. A coupled oxidation-constitutive formulation to study metalceramic interfacial failure
2.1. Introduction
An important factor leading to local crack nucleation in metal-ceramic interfaces exposed to high temperatures is the oxidation of the metallic material. Examples of oxidized interfaces are bimaterial systems present in thermal barrier coatings widely used in both aerospace and land-based gas turbines (1, 2, 3), and selectively coated single crystal silicon wafers used in the manufacture of LSI devices by the microelectronics industry. A proper description of the evolution of oxidation-induced
http://rcin.org.pl
10 E.P. Bussa
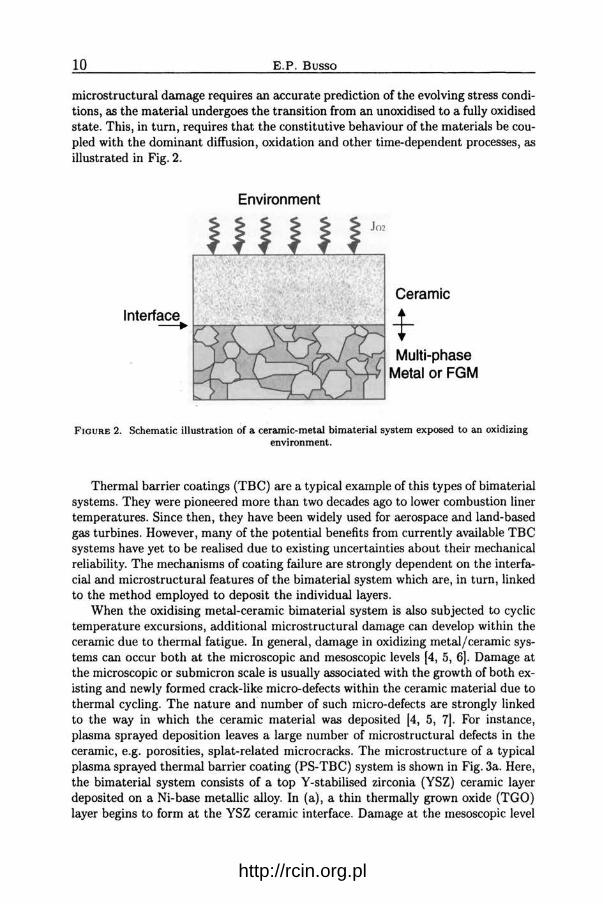
microstructural damage requires an accurate prediction of the evolving stress conditions, as the material undergoes the transition from an unoxidised to a fully oxidised state. This, in turn, requires that the constitutive behaviour of the materials be coupled with the dominant diffusion, oxidation and other time-dependent processes, as illustrated in Fig. 2.
Environment
Ceramic
Multi-phase Metal or FGM
FIGURE 2. Schematic illustration of a ceramic-metal bimaterial system exposed to an oxidizing environment.
Thermal barrier coatings (TBC) are a typical example of this types of bimaterial systems. They were pioneered more than two decades ago to lower combustion liner temperatures. Since then, they have been widely used for aerospace and land-based gas turbines. However, many of the potential benefits from currently available TBC systems have yet to be realised due to existing uncertainties about their mechanical reliability. The mechanisms of coating failure are strongly dependent on the interfacial and microstructural features of the bimaterial system which are, in turn, linked to the method employed to deposit the individual layers.
When the oxidising metal-ceramic bimaterial system is also subjected to cyclic temperature excursions, additional microstructural damage can develop within the ceramic due to thermal fatigue. In general, damage in oxidizing metal/ ceramic systems can occur both at the microscopic and mesoscopic levels [4, 5, 6]. Damage at the microscopic or submicron scale is usually associated with the growth of both existing and newly formed crack-like micro-defects within the ceramic material due to thermal cycling. The nature and number of such micro-defects are strongly linked to the way in which the ceramic material was deposited [4, 5, 7]. For instance, plasma sprayed deposition leaves a large number of microstructural defects in the ceramic, e.g. porosities, splat-related microcracks. The microstructure of a typical plasma sprayed thermal barrier coating (PS-TBC) system is shown in Fig. 3a. Here, the bimaterial system consists of a top Y-stabilised zirconia (YSZ) ceramic layer deposited on aNi-base metallic alloy. In (a), a thin thermally grown oxide (TGO) layer begins to form at the YSZ ceramic interface. Damage at the mesoscopic level
http://rcin.org.pl

MODELLING OF FAILURE AND WEAR OF THIN LAYERS
(a)
(b)
Mesocracks YSZ
TGO
Bond Coat
11
FIGURE 3. (a) Microstructure of a typical plasma-sprayed thermal barrier coating after 500 hrs oxidation at 950°C, and (b) schematics of mesoscopic crack nucleation in the ceramic (YSZ) [6).
is linked to the nucleation and growth of mesoscopic cracks. This is schematically shown in Fig. 3b. When the coalescence of such mesoscopic cracks occur, then delamination along the bimaterial interface typically follows (6, 10].
2.2. Oxidation model
The high oxidation resistance which At-containing alloys and intermetallics, in particular, can exhibit derives mainly from the formation of protective Al20 3 scales (8, 9]. The ability of the alumina-based TGO scale to grow depends on the total amount of Al available both within the metallic coating and in the underlying substrate. The rate of growth of the oxide layer is controlled by both the inward diffusion of oxygen (i.e. internal oxidation) [10], and by the outward diffusion of Al
http://rcin.org.pl

12 E.P. Busso
cations through the existing oxide layer, i.e., external oxidation Ill, 12). A schematic representation of the different diffusing elements associated with the internal and external oxidation mechanisms is given in Fig. 4, which shows that the internal oxide growth also depends on the interdiffusion of AI and Ni within the metall5, 13). The internal oxidation zone will extend into the metallic coating until the concentration of dissolved oxygen becomes too small for the primary alumina oxide to form. The external oxidation mechanism, in contrast, will continue as long as AI cations can diffuse outwardly through the alumina layer, and the 0 2 partial pressure at the ceramic- TGO interface is maintained at the required level.
0 ~
3 ,..1
FIGURE 4. Schematic representation of the internal and external oxidation processes in the ceramic-metal system in an oxidised interface.
The computation of the local concentrations of AI, Ni and oxygen require the solution of a ternary diffusion problem. Details of such formulation is outside the scope intended for these notes. However, in its most simple form, a diffusion problem in one dimension requires the simultaneous solution of:
• a mass balance equation,
• the atomic flux (Fick's First Law),
J = -DVC,
• and transient conditions (Fick's Second Law),
ac - =-VJ = -V(DVC). 8t
(2.1)
(2.2)
(2.3)
Here, C is the element concentration, D is the diffusivity, J the element flux, and n the normal to the surface S associated with the flux.
http://rcin.org.pl

MODELLING OF FAILURE AND WEAR OF THIN LAYERS 13
The dilatational strain caused by the oxidation of the Al-rich phase within the metallic coating can be determined from the corresponding chemical reaction. For instance, for a NiAl-rich material, the following chemical reaction applies,
(2.4)
The ratio between the volume of the oxidized material, V, and that before the chemical reaction takes place, ~~~ can be used to determine the mean volumetric strain, e~. Let nA12031 nNi and nNiAtbe the atomic volumes of alumina, Ni and NiAl, respectively. Then, the corresponding Pilling-Bedworth ratio is
n _ l 3 T _ {1Al20s + 20Ni 4 - + ey - n = 1.4 , 2~'NiAI
(2.5)
and the mean dilatational strain [5]
T 1 V 1 ev = 3 Ln Vo = 3 Ln ll. (2.6)
The magnitude of e~ can be used to compute the overall transformation strain rate tensor, as it will be shown later in the notes.
2.3. Coupled constitutive equations for the oxidising material
A coupled diffusion-constitutive formulation is required to describe the behaviour of a multi-phase metallic coating undergoing oxidation, in particular the coupling between the local expansion associated with the formation of the oxide and the generation of the local stresses. In the coupled oxidation-constitutive material framework recently proposed by Busso [4, 5], the diffusion of oxidant species through the multi-phase material and the subsequent oxidation of its Al-rich phase are accounted for. It also incorporates the effect that the local volumetric expansion of the newly formed oxide (i.e. e~ in Eq. (2.6)) has in the generation of inelastic volumetric strains and residual stresses. It relies on the level of oxygen concentration at each material point to identify whether oxide particles have formed, in which case, the material at that location is treated, through a self-consistent approach, as an homogeneous equivalent material consisting of multi-metallic phases and oxide products. Note that the critical oxygen concentration required in the finite element model to trigger the onset of oxidation should be calibrated from oxide thickness measurement data.
A hypoelastic formulation for the oxidising metal in terms of the Jaumann derivative of the overall aggregate Cauchy stress, T, is
v . T = L(D- DP)- 3~a81, (2.7)
where D and DP are the total and inelastic stretching tensors, iJ the time rate of change of the absolute temperature, L is the fourth order elastic moduli, 1 - the second order unit tensor, and a - the thermal expansion coefficient. The inelastic stretching tensor associated with the deformation, DP, is expressed in terms of the
http://rcin.org.pl

14 E.P. Busso
average inelastic stretching rate due to slip, ncr and a transformation term, ntr' which represents the non-recoverable deformation rate induced by the oxidation of one of the metallic phases. Then, ·
(2.8)
The inelastic deformation rate tensor caused by the phase transformation is given by
tr _ · ( T T' ) n - ffvo eyl + P IITII , (2.9)
where: j - time rate of change of an internal state variable associated with the kinetic (oxidation) process, P - oxide shape parameter ( = 0 for a spherical grains), fvo - initial volume fraction of the oxidizing phase in the metallic alloy.
Note that the first term in Eq. (2.9} is purely volumetric and the second a deviatoric one which incorporates the effects of grain/particle shape.
The average stretching rate tensor is defined as the volume fraction weighted sum of the individual components of each phase. In functional form,
ncr = f>cr {T, S, J, 8} , (2.10}
where Sis a scalar internal state variable representing the overall isotropic deformation resistance of the material. For inhomogeneous, multi-phase materials, Eq. (2.10} can be derived using homogenisation (e.g. Eshelby-type self-consistent) techniques (see [5, 14, 15]}.
The evolution of the internal oxidation state variable f, which represents the fraction of oxidised material, is controlled by the kinetics of the oxidation process. A general functional relation is,
j = j {!,8}. (2.11}
Similarly for the evolutionary behaviour of the slip resistance, once finds that
S = S {S, J,8,ncr}. (2.12)
Specific forms for the above functions for a typical two-phase metallic alloy can be found in [5).
2.4. Periodic unit cell finite element models
After formulating and calibrating the coupled diffusion-constitutive formulation, the finite element model of the PS-TBC system can now be defined. After close inspection of representative sections of the TGO-ceramic interface, its morphology can be idealised as a periodic array of wavy-type segments. The relevant interfacial length scales can be extracted from SEM micrographs of oxidised PS-TBCs such as that given in Fig. 3a. The corresponding periodic unit cells FE models must account for the symmetry of the problem as well as for its periodicity (e.g. see [5, 16)}. Due
http://rcin.org.pl

MODELLING OF FAILURE AND WEAR OF THIN LAYERS 15
to symmetry, only one-half of the unit cell of width required to be modelled to reproduce an idealised periodic interface morphology.
The TBC temperature was assumed to be spatially homogeneous and to vary cyclically with time. The peak cycle temperature of 950°C was identified as a typical TBC metal/ceramic interface temperature from heat transfer FE analyses. For simplicity, oxidation processes may be assumed to be active only during the dwell part of the cycle due to the relatively fast cooling and heating periods of typical gas turbine thermal cycles.
2.5. Predicted stress distributions obtained from periodic unit cell FE calculations and thermal barrier coating lifetimes
The parametric investigation conducted in [5) based on the results of finite element (FE) periodic unit calculations, enabled the local stresses responsible for microcrack nucleation within the PS-TBC (i.e. the out-of-plane components) to be quantified. Figure 5 shows a typical distribution of the FE calculated out-of-plane stress (along the X 2 axis) at 25°C after 50 thermal cycles. This corresponds to an equivalent accumulated oxidation time of 600 hrs at 950°C.
1. a=24 J.lm .1
822 MPa -1. 70E+03 +2.22E-16 +6.25E+01 +1. 25E+02 +1. 87E+02 +2 . 50E+02 +3. 38E+02
FIGURE 5. Typical contour plot of the stress component along the X 2 axis (T22 ) at 25°C after 50 thermal cycles (950°C to 25°C)
It can be seen that the interface morphology has been idealised as a periodic array of wavy-type segments characterised by a representative peak-to-peak amplitude/ half period ratio {b/a) for the oxidised interface.
At the oxidising interfacial temperature of 950°C, the magnitude of the out-ofplane stresses was found to be relatively low. The most highly stressed YSZ condition was always identified at the lowest cycle temperature (viz. 25°C). The region where the maximum out-of-plane tensile stresses were found, viz. at the off-peak location indicated by the arrow in Fig. 5, is consistent with those where mesocracks are known to nucleate. Furthermore, the out-of-plane stresses were found to be strongly
http://rcin.org.pl

16 E.P. Bussa
affected by the thickness of the TGO, the sintering of the top ceramic coating, stress relaxation due to creep and time-independent plasticity, and more weakly by the local aspect ratio (a/b) of the oxidised interface.
Figure 6 presents typically predicted FE unit cell results, showing the effects of the YSZ sintering and the interface morphology on the maximum value of the T22 stress component within the YSZ for different oxide thicknesses after cooling to 25°C. It can be seen that the T22 max stresses decrease when the effects of YSZ sintering are removed and increase with the TGO curvature (i.e. higher b /a ratios) and oxide thickness. From these results, it is clear that the dependency of T22 max
on the sintering of the YSZ is considerably greater than on the TGO morphology, and increases as the cycle temperature reaches 25°C due to the additional TBC property mismatch effects.
350 ••
300 ll.O
250
~ ~ 200
:.1
.... ~ 150 -
100
50 0.0
YSZ Sintering _,.-b/a = 0. 71
No YSZ Si ntering
"" ~, .............._ b/a = 1.42
--~ ~,. ... . ; .. ~ • ••••• /b/a = 0.71
. -:···DOD-~ .DDDD ~- ""bl-142 A ~ A A AAAAM a - .
1.0 2.0 3.0 4.0 Oxide Thickness [J.tm]
FIGURE 6. Effect of the oxide thickness on the maximum T22 stress in the YSZ for different interface morphologies and ceramic sintering conditions at 25°C
2.6. Multi-scale damage mechanics framework
2.6.1. General considerations. A natural way to incorporate the irreversible effect of the microscopic degradation of the ceramic material is through a suitably defined damage variable within a continuum mechanics based constitutive formulation. However, some difficulties arise when defining such type of damage variable:
• microscopic (i.e. sub-micron) and mesoscopic defects within the YSZ are dif-ficult to observe and quantify,
• the initial and the critical states cannot be easily characterised, • the damage is anisotropic due to the nature of PS deposition. The description of such complex features unavoidably requires the definition of
a phenomenological damage variable which can be used in structural predictions.
http://rcin.org.pl

MODELLING OF FAILURE AND WEAR OF THIN LAYERS 17
Considerable developments have been made on anisotropic continuum damage formulations based on the thermodynamic theory of irreversible processes with internal state variables (e.g., see (17, 18]). Such formulations require that a suitable elastic potential which incorporates the coupling between elasticity, damage and other relevant physical processes be defined. The coupling between elasticity and anisotropic damage in brittle materials was recently addressed in (18]. However, the definition of a thermodynamically-based formulation which can yield a closed form constitutive formulation for the YSZ may prove to be incompatible with the complex physical processes involved [6]. This is particularly the case for the coupling between the kinetics processes (e.g. diffusion, interdiffusion, oxidation, sintering, creep) in the oxidising TBC system as a whole, and the YSZ stresses which constitute the driving force for microscopic fatigue damage accumulation within the YSZ.
Consider a PS-TBC system exposed to a generic thermal load which gives rise to a temperature history at the metal/ YSZ interface region characterised by a maximum and a minimum cycle temperature, flmax and flmin, respectively, a period tcy, and a dwell time, thotd· The parametric study reported in (6] revealed that the magnitude of the maximum out-of-plane stress within the YSZ, T22 max, can functionally be expressed in terms of flmax, the current temperature, fJ, the peakto-peak/ half-period interfacial morphology ratio, bja, and the accumulated time at which the TBC is exposed at the maximum cycle temperature, tacc· Then
T22 max = T22 max {f), flmax, tacc, b / ~} · (2.13)
Here, the micromechanics information implicit in the functional dependency of the driving force for damage evolution given by Eq. (2.13) will be combined with a damage mechanics approach. An advantage of expressing the microscopic damage evolution explicitly in terms of T22 max is that the tensorial nature of microscopic damage within the ceramic is reduced to a scalar. Although the resulting formulation can readily be used within a continuum mechanics framework, here it will be restricted to life prediction under thermal fatigue.
Out of the two different levels of damage considered, only the microscopic damage is assumed to be associated with thermal fatigue. The onset of damage at the mesoscopic level, that is the nucleation of mesoscopic cracks, is assumed to be triggered by the attainment of a critical microscopic damage state under the prevailing local stress conditions. Thus microscopic damage controls the intrinsic cleavage strength of the material and therefore the stress conditions require to trigger the nucleation of mesoscopic damage.
2.6.2. Damage evolution. Consider a scalar internal damage variable associated with the microscopic fatigue damage so that, D = 0 at the beginning of thermal cycling, and D = 1, when thermal fatigue failure caused by the nucleation and coalescence of mesocracks occurs.
The continuous evolution of microscopic damage with thermal cycles, N, can be expressed in functional form in terms of the maximum cycle stress, T22 max, the mean cycle stress, T22 max, and the current microscopic damage state, D,
dD = iJ {T22max, T22max, D} dN. (2.14)
http://rcin.org.pl

18 E.P. Busso
Note that T22 max depends, in turn, on interface morphology, thermal cycle parameters and cycle number (see Eq. {2.13)). The specific form selected for the non-linear microscopic damage evolution in Eq. (2.14) is [6, 19),
dD = nm(T22max) [ A T22max ] p dN, F(T22max)
{2.15)
where m and F are functions of the driving force for microscopic damage evolution, viz. T22 max. Here, the mean stress was approximated as T22 max ~ T22 max /2. Note that Eq. (2.15) introduces an explicit coupling between the damage at the microscale, ~he unit cell stresses at the mesoscale, and the macroscopic failure of the coating. Such link constitutes a one-way coupling as the unit cell stresses are assumed to be unaffected by the YSZ microscopic fatigue damage. This is reasonable to a first approximation due to the microscopic nature of thermal fatigue induced damage when compared with the mesoscopic unit cell scale. As Eq. (2.15) can only be integrated analytically if T22 max remains constant between D = 0 to D = 1, which is not the case here since T22 max is a function of the number of cycles, N, the integration of Eq. (2.15) needs to be performed numerically.
The choice of the functions in Eq. (2.15) are (19)
m = 1 _ C [T22max] q-p,
uco
F = Fo (1- FtT22max),
{2.16)
(2.17)
where uco represents the maximum or initial cleavage strength of the material, and p, q, C, F1 , and F2 are material parameters. For a broad range of materials, p = 0.55 (19). The other four independent materials parameters need to be calibrated from experimental thermal fatigue data.
Implicit in the proposed formulation is the understanding that the internal microscopic damage variable D controls thermal fatigue failure (i.e., D = 1), and that the out-of-plane stress when thermal fatigue failure occurs defines to some extent the macroscopically averaged cleavage strength of the YSZ.
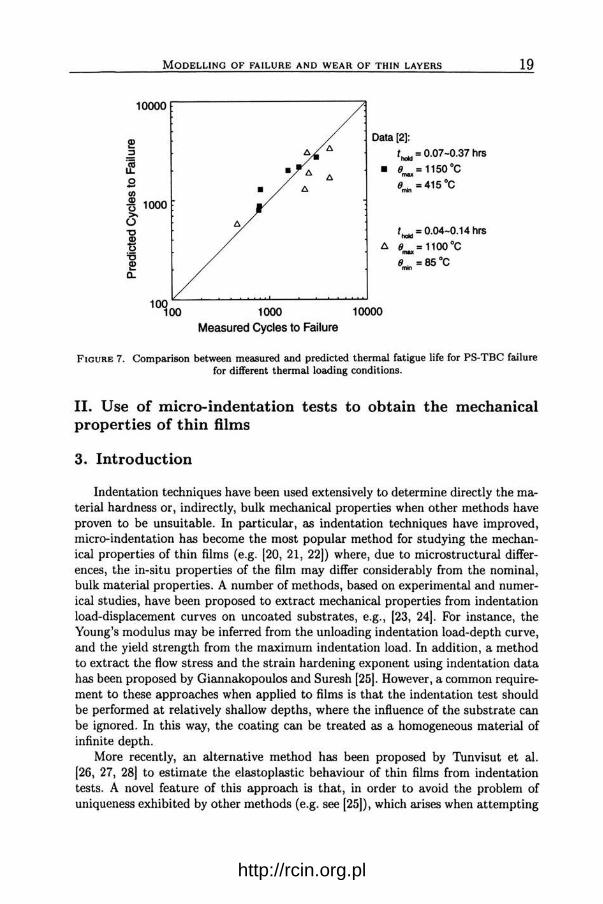
2.6.3. Typical TBC life predictions. A comparison between the measured and predicted cycles to failure in PS-TBCs tested under different thermal loading conditions is given in Fig. 7. The data corresponds to thermal cycles with holding times ranging from 0.04 to 0.37 hours, and maximum and minimum cycle temperatures of 1100°C to 1150°C, and 85 to 415°C, respectively. In all cases, 2 minutes heating and cooling stages are assumed. It can be seen that the TBC model describes the range of data with a reasonable accuracy. Here the thermal cycles with long dwell times will give rise to oxidation and sintering dominated TBC failures. In contrast, cycles with short dwell times will result in TBC failures dominated by the cyclic accumulation of microscopic damage.
http://rcin.org.pl
MODELLING OF FAILURE AND WEAR OF THIN LAYERS
10000
10~00
•
1000
• A A A
Measured Cycles to Failure
Data [2]:
t hold = 0.07-0.37 hrs • (J = 1150 °C max
(Jmln = 415 °C
thokl = 0.04-0.14 hrs
6 (Jmu = 1100 °C
(Jmln = 85 °C
10000
19
FIGURE 7. Comparison between measured and predicted thermal fatigue life for PS-TBC failure for different thermal loading conditions.
II. Use of micro-indentation tests to obtain the mechanical properties of thin films
3. Introduction
Indentation techniques have been used extensively to determine directly the material hardness or, indirectly, bulk mechanical properties when other methods have proven to be unsuitable. In particular, as indentation techniques have improved, micro-indentation has become the most popular method for studying the mechanical properties of thin films (e.g. (20, 21, 22]) where, due to microstructural differences, the in-situ properties of the film may differ considerably from the nominal, bulk material properties. A number of methods, based on experimental and numerical studies, have been proposed to extract mechanical properties from indentation load-displacement curves on uncoated substrates, e.g., (23, 24). For instance, the Young's modulus may be inferred from the unloading indentation load-depth curve, and the yield strength from the maximum indentation load. In addition, a method to extract the flow stress and the strain hardening exponent using indentation data has been proposed by Giannakopoulos and Suresh (25). However, a common requirement to these approaches when applied to films is that the indentation test should be performed at relatively shallow depths, where the influence of the substrate can be ignored. In this way, the coating can be treated as a homogeneous material of infinite depth.
More recently, an alternative method has been proposed by Thnvisut et al. (26, 27, 28) to estimate the elastoplastic behaviour of thin films from indentation tests. A novel feature of this approach is that, in order to avoid the problem of uniqueness exhibited by other methods (e.g. see (25]), which arises when attempting
http://rcin.org.pl

20 E.P. Bussa
to determine the elastoplastic material properties from the indentation curve alone, it relies on the contact area after the material has been unloaded in addition to the indentation load-displacement curve. FUrthermore, the method takes into account the effect of the substrate on the indentation response and therefore can be used to analyse indentation tests on thin films performed at both shallow and deep depths.
These notes summarise the work published in references (26, 27) and [28). There, close-form relationships for conical indentation are developed using dimensional analysis in conjunction with finite element-based parametric studies of coated systems. Although the results presented here are based on a conical indenter, it will be shown that they are also applicable to analysis of indentation curves produced by indenters of the Vickers and Berkovich types.
4. Indentation of a coated substrate
Consider the rigid, conical indenter shown in Fig. 8 with a half angle, (}, indenting into an elastic-plastic coating, characterised by a Young's modulus (Ee), yield strength (aye), Poisson's ratio (ve), and work hardening exponent (ne)· The tensile behaviour of the thin film material, of thickness h0 , is described by a power law relation of the form,
- ( - ) nc
c:e = O":e {4.1)
where € and jj are the von Mises strain and stress, respectively, and eye(= ayc/Ec), the material yield strain. The substrate material is, in turn, assumed to be linear elastic, characterised by a Young's modulus (E8 ), and Poisson's ratio (v8 ). Thus it is implicitly assumed that the substrate yield strength is much greater than that of the coating material. It is also assumed that there is no friction between the indenter and the coating surface, i.e., the coating and indenter are considered to be both microscopically smooth.
h
coating
z
Lx FIGURE 8. Illustration of the conical indenter.
http://rcin.org.pl

MODELLING OF FAILURE AND WEAR OF THIN LAYERS 21
A typical load-indentation curve is illustrated in Fig. 9, identifying the loading and unloading portions of the curve. The maximum indentation depth, hm, the corresponding maximum load, Fmax, and the indentation depth after unloading, h 1, are also shown.
40.0
30.0
loading curve z " ..g 20.0
.3
10.0
h, 0.0 l--==::Jc::___j _ ___....L _ ____l. _ __.L._---'-:-L..---'---'-'--___.J._--'
0.0 20.0 40.0 60.0 80.0 100.0
Indentation depth, h(J.lm)
FIGURE 9. Typical indentation curve for a ductile material.
In thin film-substrate systems of this type, there are seven known quantities, namely
h0 - film thickness, (} - half-angle of indenter,
Vc -Poisson's ratio of film, v. - Poisson's ratio of substrate, E. - Young's modulus of substrate, F - applied force, h - indentation depth,
and three unknown quantities,
Ec - Young's modulus of the film, a yc - yield strength of the film, nc - hardening exponent of the film.
To reduce the number of variables, the indenter angle, 8, is fixed, and Vc = v. = 0.3. By applying the Buckingham PI Theorem and choosing the normalisation so that unknown quantities are normalised by known quantities, the following dimensionless relationship can be obtained. For the loading part of the indentation curve,
(4.2)
http://rcin.org.pl

22 E.P. Bussa
The unloading slope of the indentation curve is not constant due to the large geometry changes on unloading, see Fig. 9. Then, if one considers the initial slope, dF / dh, at the onset of unloading, the following relationship is obtained,
{4.3)
To determine a unique set of yield stress and hardening behaviour for the indentation curves, an additional piece of information must be obtained from the test, namely the area of the indentation after unloading, A 1 . Thus the corresponding functional dependency of A 1 on the indentation, geometrical and material parameters for the thin film-substrate bimaterial system is,
{4.4)
Having obtained these dimensionless forms, numerical analyses can be performed to quantify the functional relationships given by Eqs. ( 4.2) to ( 4.4). The numerical procedures used to carry out the analyses are next discussed and some results are presented.
5. Finite element modelling
The coated system can be modelled as a cylinder with a thin film on its surface, as illustrated in Fig. lOa. The indenter angle chosen in the analysis was (J = 70°. A very fine mesh must be used in the contact region to ensure a high degree of numerical accuracy and a gradually coarser mesh may be employed both at the surface and in the interior of the specimen. Mesh resolution studies were carried out in order to obtain a convergent solution. A typical FE mesh used in the analyses, which contains 8000 four-noded axisymmetric element, is shown in Fig. lOb. The loading and unloading curves were obtained directly from the FE output of the normal reaction force on the rigid indenter, as a function of the vertical displacement of the node directly beneath the tip of the indenter.
6. Results of parametric FE studies
6.1. Indentation of coated substrates
Parametric FE analyses of the indentation of a range of coating-substrate systems for a maximum indentation depth of hm = 0.33ho were performed to calibrate the functions given in Eqs. (4.2) to (4.4). Typical results are shown in Fig. 11 to 13. Figure 11 can be used to determine the Young's modulus of the coating from the initial unloading slope and the yield strength and strain hardening exponent can be obtained from Figs. 12 and 13.
An accurate calibration of the relationship defined in Eq. ( 4.3) from the types of FE results shown in Fig. 11 gives
http://rcin.org.pl

MODELLING OF FAILURE AND WEAR OF THIN LAYERS 23
(a)
Elastic substrate
Axis of symme~ R>>%
(b)
FIGURE 10. (a) Geometry of the indentation problem (not to scale) and (b) typical FE mesh.
( dF I dh) = 2E0.8644 Es ho h=hrn '
.E ~ 1,
(dF/dh) = _7E-o.32 + 14.Eo.oo2 _ 27.Eo.oos + 22, Es ho h=hrn
where - Ec E=-.
E.
.E > 1,
The film's elastic modulus can then be estimated from these relations.
(6.1)
(6.2)
(6.3)
http://rcin.org.pl

24 E.P. Bussa
1.0 -~: ~ 0.5 1-----------::~
'a !!! c
__;>
:; 0.0
~ "0
~ -0.5
-1.0
-1.5 L-...-.l-..-...L--...I---'--1-_._ _ _..L... _ __,_ _ __,_ _ __. _ __.
-2.0 -1.0 0.0 1.0 2.0 3.0
Log(E/Es)
FIGURE 11. Typical results from the FE parametric study of indentation of the film/substrate system showing the dF / dh at h = hm vs. Ec/ Es curve.
r4 0.50 N 0
..c -~ 0.40 ~
-d' (IS
..9 0.30
- - 0.1, non-hardening -- 1, non-hardening, Rc=lO, Rc=5 ------ 10, non-hardening ----------·;;on-hardening --· -··
... -----
s ::s s ·~ 0.20
s "'0 cu non-hardening .fa 0.10 ~ e nc = I 0 non-harden~ -------------- -0 z
50.0 1 .
Normalised coating yield strength, a yc I Es
FIGURE 12. Typical results from the FE parametric study of indentation of the film/substrate system showing the Fm/h~E8 vs. u 71c/ Es curves.
http://rcin.org.pl
coi ~ N = 8
MODELLING OF FAILURE AND WEAR OF THIN LAYERS
5.0 r----"T"""----r------.----r--------........ Ec!E
5 nc hot I h0 =0.33
4.0 - - 0.1, non-hardening
3.0
-- 1, non-hardening, nc=IO, nc=5 • •• • · • 10, non-hardening
·-.... ••••• nc= 10 ··. ·-.....
(; 2.0 = 1+:::
1.0
0.0 ...._ __ _._ __ ___., ___ ......._ __ --'-___ ...._ __ _. -3
0.0 50.0 100.0 t50.0xl0
Normalised coating yield strength, aye I Es
25
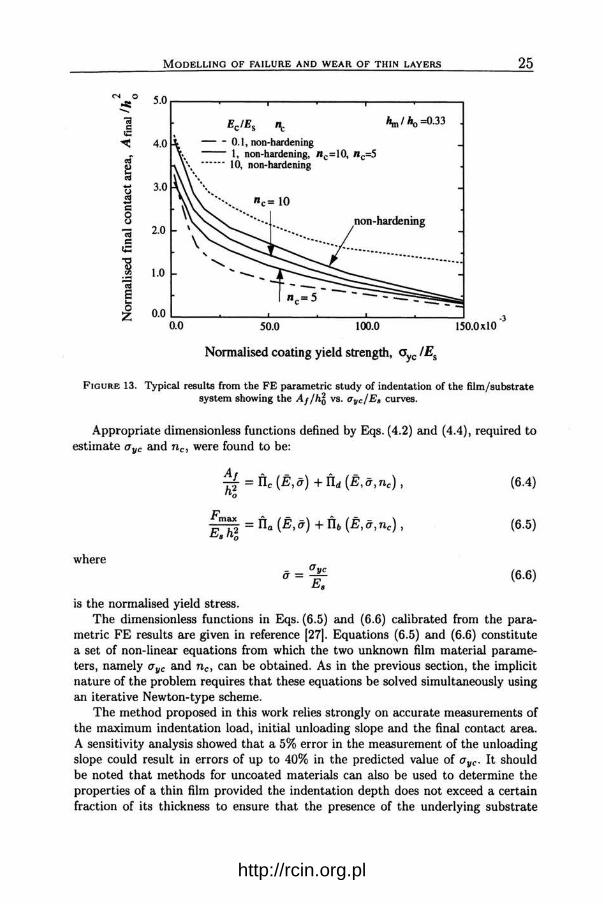
FIGURE 13. Typical results from the FE parametric study of indentation of the film/substrate system showing the Aflh'5 vs. u11c/Es curves.
Appropriate dimensionless functions defined by Eqs. (4.2) and (4.4), required to estimate u yc and nc, were found to be:
A, A (- -) A (- - ) h2 = Ilc E,u +lid E,u,nc , 0
(6.4)
:m;:; = fia (E, u) +fib (E, u, nc), B 0
(6.5)
where (6.6)
is the normalised yield stress. The dimensionless functions in Eqs. (6.5) and (6.6) calibrated from the para
metric FE results are given in reference [27] . Equations (6.5) and (6.6) constitute a set of non-linear equations from which the two unknown film material parameters, namely u11c and nc, can be obtained. As in the previous section, the implicit nature of the problem requires that these equations be solved simultaneously using an iterative Newton-type scheme.
The method proposed in this work relies strongly on accurate measurements of the maximum indentation load, initial unloading slope and the final contact area. A sensitivity analysis showed that a 5% error in the measurement of the unloading slope could result in errors of up to 40% in the predicted value of Uyc· It should be noted that methods for uncoated materials can also be used to determine the properties of a thin film provided the indentation depth does not exceed a certain fraction of its thickness to ensure that the presence of the underlying substrate
http://rcin.org.pl

26 E.P. Busso
does not affect the indentation curve. As discussed in (26) and (27), the indentation depth under which the effect of the substrate is negligible depends on the relative mechanical properties of the coating and the substrate. In [27), the conditions under which either approach may be used to predict the film properties for a wide range of film/substrate systems are given.
7. Experimental validation
7 .1. Indentation tests
Indentation tests have been carried out on an alloy steel (AISI D2) and on AlSi and Mo coatings deposited on a case hardened steel by plasma spraying. Prior to performing the tests, all samples were polished and the coating thicknesses were measured. The thickness of the AlSi and Mo coatings were found to be 295 and 270 p,m, respectively. Indentation tests were carried out up to different depths, the details of which are given in (27), an average of 2 to 10 tests were performed for the same maximum indentation depth on each material.
Shallow indentation tests up to a maximum depth of less than 0.5 p,m were carried out using a typical nanoindenter instrument with a diamond Berkovich indenter. A typical indentation curve measured in the A lSi coating system is shown in Fig. 14a. The image of the indentation after unloading was obtained using a digital instrument nanoscope. The shape of a typical impression produced by the Berkovich indenter is shown in Fig. 14b. The final contact area after unloading for a perfectly sharp indenter, A1, can be calculated directly from the image (e.g. see (27]).
Deep indentation tests, namely for 0.5 p,m < hm < 10 p,m, were also performed using a Fisherscope Dynamic Hardness Tester with a Vickers indenter. The maximum load available was 1 N, thus for larger indentations, a macro-hardness tester was used. For the macro hardness tester only the indentation load and the image of the indented region could be recorded. Thus for these measurements, the indentation depth (h) was estimated from the mean value of the two impression diagonals.
7.2. Determination of the films' mechanical properties
Based on the proposed indentation method, the procedure to determine the mechanical properties of a film from indentation tests is as follows:
1. Measure the coating thickness h0 ;
2. Measure h 1 / hm, dF / dh at h = hm, F m and A 1 from the indentation data; 3. Calculate 1/(Es ho), Fm/(Es h5) and At/h6 from the available data; 4. Determine Ec from either Eq. (6.1) and {6.2), depending on the value of Eel E 8 ;
5. Determine the values of aye and nc by finding numerically the roots ofEqs. (6.4) and (6.5).
Note that the calibration equations (Eqs. (6.1) to (6.5)) correspond to a maximum indentation depth of 33% of the coating thickness. If the indentation depth is significantly different from this, these equations will not be applicable.
The results from indentation tests on the Mo and AlSi coatings were analysed using the proposed methods. For tests with maximum indentation depths < 0.5 p,m,
http://rcin.org.pl

MODELLING OF FAILURE AND WEAR OF THIN LAYERS
(a)
6000.0
5000.0
~ 4000.0
~ ,g c::
3000.0 0 ·a cU = 2000.0 4.)
"0 .s 1000.0
0.0 0.0
(b'
Fmax
100.0 200.0 300.0
lJ.lm
--dt ··········d2 -----d3
Indentation depth,h (om)
dF dhh~
lam 400.0
27
FIGURE 14. Typical results from nanoindentation test of AlSi coating: (a) indentation curve, (b) image of indentation after unloading.
which is relatively shallow compared with the coating thickness, the film can be treated as if it were a homogeneous substrate for the purpose of determining the film properties from indentation data. For AlSi and Mo coatings indented up to depths of 97 J.Lm and 89 J.Lm, respectively (hm/ho = 0.33%), the substrate exhibited a strong effect on the indentation test results and therefore the method proposed here must be used. The calculated Young's modulus, yield strength and hardening exponent for the AlSi coatings at different depths are presented in Table 1. Similar
http://rcin.org.pl

28 E.P. Busso .. ·
observations as for the uncoated steel substrate can be made from these results (27). It can be seen that there is good agreement in the predicted Young's moduli as well as a strong depth dependence of the yield strength values. Here, a0.2 is the experimentally measured 0.2% proof stress for the bulk material in uniaxial tests.
TABLE 1. Predicted elasto-plastic properties for the A lSi thin film (ho = 295 JLm).
hm Ind. type E CTJI l10.2
(JLmJ (GPa) (MPa) n (MPa)
0.115 Berk. 73±5 1460±100 9±1 1475±102 0.3 Vic. 70±6 470±30 2.3±0.7 526±57 3.5 Vic. 65±2 354±23 6±5 373±134 8.4 Vic. - 258±25 10±3 270±30
For additional results and a detailed discussion, refer to (27).
7 .3. Indentation size effects
Comparison of load-displacement curves obtained with different instruments and indenters is often problematic due to the effect of tip rounding of the indenter, material buckling at the rim of the indent, and uncertainties in the zero point detection. However, it has been shown that experimentally determined hardness, i.e. the ratio of applied load to contact area, from Vicker and Berkovich indenters are in good agreement with each other. It is therefore believed that the variation in yield strength and strain hardening with indentation depth shown in Table 1 are a real effect and not a result of the different indentation methods used.
It is known that plastic deformation under small indentation loads leads to large local strain gradients that cause enhanced strain hardening due to the additional contribution from geometrically necessary dislocations. Such effects will lead to an indentation size effect (hardness and apparent yield strength increasing with decreasing depth). Recently, strain gradient plasticity analytical formulations have been developed (e.g. see Busso et al., 2000 (29]) which can relate the material flow stress to intrinsic microstructural length scales, such as the mean spacing between dislocations, and to local deformation gradients induced by deformation incompatibilities. Such models has been shown to be able to account for the depth dependence of material hardness (see (30]). Finally, it should be pointed out that typically size effects become significant at indentations of less than approximately 2 JLm, consistent with the results obtained in this work.
III. A mechanistic investigation of sliding wear in coated components
8. Introduction
Surface coatings are used extensively to improve the wear resistance of a broad variety of engineering components. It is estimated that the life of a component can
http://rcin.org.pl

MODELLING OF FAILURE AND WEAR OF THIN LAYERS 29
be improved by up to a factor of ten if coated with an appropriate material. Traditionally, hard, brittle coatings such as TiN have been the most commonly used wear-resistant coatings. Over the last decade, however, a new generation of coating materials and processing techniques have emerged as a result of the technological growth fuelled by new industrial applications [31). These coatings are generally strong and ductile in nature, relatively thick (e.g. 100 to 300 J.Lm) and exhibit beneficial self-lubricating properties, which have led to considerable improvements in their wear resistance. Typical of these new coatings are Mo-based systems deposited by thermal and plasma spraying techniques [32, 33).
These notes will summarise the mechanistic multi-scale studies of sliding wear on both homogeneous and inhomogeneous wear resistant coatings recently published in references [34, 35, 36).
9. Mechanistic aspects of sliding wear
To predict the wear behaviour of coating systems accurately, an understanding of the dominant wear mechanisms during service is crucial. Sliding wear between two bodies generally involves three steps as illustrated in Fig. 15 [37, 38). Initially,
Sliding contact
Sliding contact
Sliding contact
FIGURE 15. Proposed mechanism of sliding wear in thick ductile coatings.
http://rcin.org.pl
30 E.P. Bussa
localised deformation patterns develop beneath the coating surface as a result of the sliding contact loads. Such localised deformation can be the precursor of microcracks, which form as a result of the coalescence of micro-voids nucleated at inclusions in highly deformed regions at the coating subsurface, as shown in Fig.15. Continued sliding contact promotes crack growth and causes neighbouring cracks to coalesce. Eventually, cracks propagate towards the surface at weak points and wear debris is formed [39).
10. Periodic unit cell models
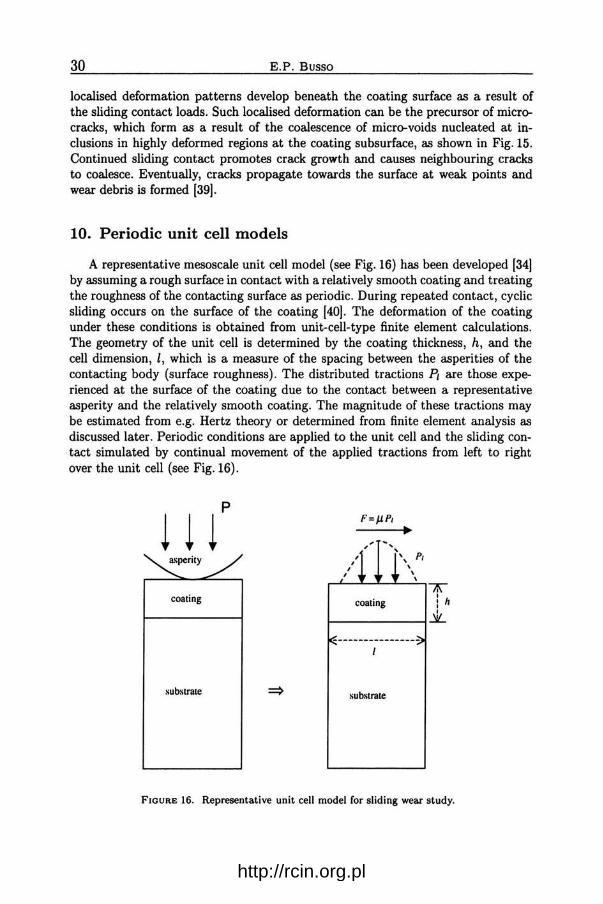
A representative mesoscale unit cell model (see Fig. 16) has been developed [34) by assuming a rough surface in contact with a relatively smooth coating and treating the roughness of the contacting surface as periodic. During repeated contact, cyclic sliding occurs on the surface of the coating [40). The deformation of the coating under these conditions is obtained from unit-cell-type finite element calculations. The geometry of the unit cell is determined by the coating thickness, h, and the cell dimension, l, which is a measure of the spacing between the asperities of the contacting body (surface roughness). The distributed tractions Pz are those experienced at the surface of the coating due to the contact between a representative asperity and the relatively smooth coating. The magnitude of these tractions may be estimated from e.g. Hertz theory or determined from finite element analysis as discussed later. Periodic conditions are applied to the unit cell and the sliding contact simulated by continual movement of the applied tractions from left to right over the unit cell (see Fig.16).
p
l l l 7f\
coating coating ! h
1-------lil..
substrate substrate
FIGURE 16. Representative unit cell model for sliding wear study.
http://rcin.org.pl

MODELLING OF FAILURE AND WEAR OF THIN LAYERS 31
Under realistic contact conditions typical of a stamping process, finite element analyses show that the peak plastic strain accumulates at some distance below the surface (see Fig. 17). The location of the peak plastic strain is designated in Fig. 17 by the depth b. A plot of plastic strain versus stress within this region is provided in Fig. 18. It is seen that after a number of sliding cycles, the plastic strain accumulated within the coating over each sliding cycle becomes constant. This steady state value is designated the plastic ratchetting strain, <5e:ff (An effective strain is used as all components of plastic strain evolve and an overall (effective) strain must therefore be used. Here the effective strain used is the von Mises strain).
-0.0002
+0.0 .. 90
+0.0983
+0.1480
FIGURE 17. Contours of plastic strain in the Mo-based coating after 100 sliding cycles.
Loading history N = 100 1.5
normalised shear strain
FIGURE 18. Accumulation of plastic strain at a point within the coating.
http://rcin.org.pl

32 E.P. Busso
Based on these observations, a relationship to describe wear rate W' (wear volume W, divided by slip distance, S) is obtained, viz.
W' = W = ac:ffb. S cj
(10.1)
The parameter b and ac:ff in the wear equation are obtained from the unit cell finite element analysis and will depend on the coating material properties and the applied load. The quantity cf is the failure strain of the material and can be calibrated from e.g. pin on disc data. Provided the conditions experienced in service are sufficiently close to those experienced in the pin on disc test, the model can be applied to predict the in-service life of the coating.
Parametric studies of the wear problem have been carried out and some results are presented below. Further details of the model are available in [34).
(a)
-.Jil ~ 0 --it;
-1
-20 -10 0 10 20 30 40 50 60
f,/t;y
(b) 3
-'62 -X -- plk. = 1.63 :::;. ,t.;) R/l = 1.95 ~1 h/1 = 0.42
J..L = 0.1
0 5.0 7.5 10.0 12.5 15.0 17.5 20.0
FIGURE 19. (a) Coating uniaxial stress-strain behaviour for different values of nand (b) effect of n on the wear rate.
http://rcin.org.pl
MODELLING OF FAILURE AND WEAR OF THIN LAYERS 33
11. Influence of the coating strain hardening behaviour on the wear rate
Based on the established wear model, the effect of the coating strain hardening behaviour on the wear rate has been investigated. Computations were performed for coatings with different cyclic stress-strain properties, as shown in Fig. 19a. Thus the range of idealised coating materials are assumed to have a common yield stress but different hardening behaviour. In Fig. 19, kc is the shear strength of the coating (which is related to the yield strength, a y, by the relation kc = a y / V3).
For simplicity, the curves shown in Fig.19a are identified by the exponent, n, which would be required to fit the hardening behaviour of each curve monotonically using an equivalent power law. The predicted effect of varying n within this range on the wear rate is shown in Fig. 19b. It is seen from Fig.19b that the normalised wear rate increases with strain hardening exponent. Thus if two materials have the same failure strain, the higher the strain hardening exhibited by the coating material, the better wear resistance properties.
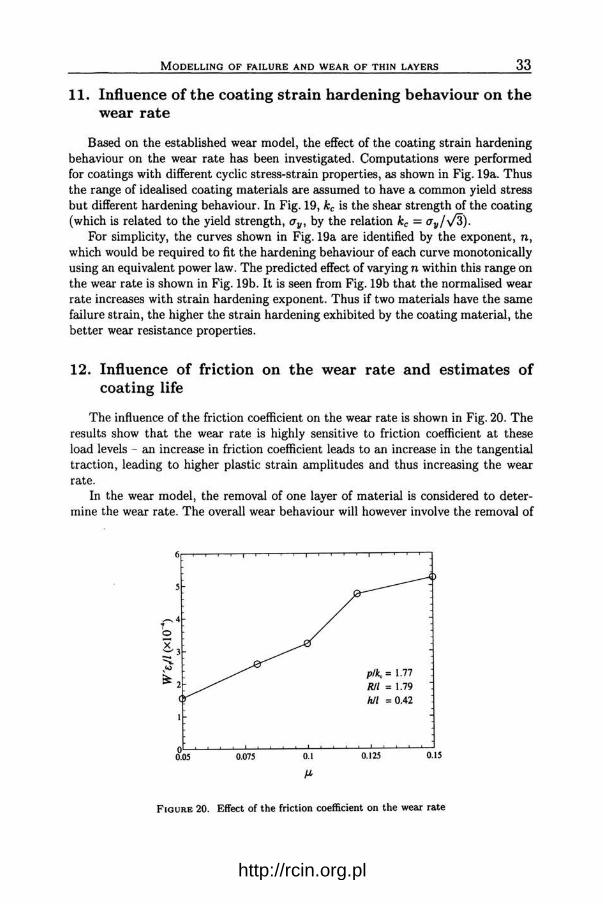
12. Influence of friction on the wear rate and estimates of coating life
The influence of the friction coefficient on the wear rate is shown in Fig. 20. The results show that the wear rate is highly sensitive to friction coefficient at these load levels - an increase in friction coefficient leads to an increase in the tangential traction, leading to higher plastic strain amplitudes and thus increasing the wear rate.
In the wear model, the removal of one layer of material is considered to determine the wear rate. The overall wear behaviour will however involve the removal of
,-....4 r 0 x '-'3 :::::.. ,"'l
~2 p/k< = 1.77 Rll = 1.79 hll = 0.42
FIGURE 20. Effect of the friction coefficient on the wear rate
http://rcin.org.pl

34 E.P. Bussa
successive layers of material until the coating is completely worn away. The wear rate will then be different for each successive layer, as the coating thickness reduces, on removal of each layer. Based on the current wear model, it is expected that the number of sliding cycles to failure will decrease for the second and successive layers due to the reduction in the coating thickness, which in turn increases the wear rate. It is also possible that some amount of damage will have occurred below the surface by the time the first layer is removed leading to a further increase in wear rate for the second and subsequent layers. However, it has been found that the latter effect is secondary and was therefore not accounted for in this study.
The total number of sliding cycles to failure is given by
no. layers bi
NT= L W!' i=l '
(12.1)
where bi is the depth of layer removed and w; the corresponding wear rate, and the number of layers is given by h/Ebi and is not known a priori. The total number of sliding cycles required to wear away coatings of different thicknesses in a typical sliding wear analysis are given in Fig. 21. It is worth noting that, for the load level considered, a near-linear dependence of life on his predicted.
2.5
2.0 -b &1.5 :c:
100 ISO 200 250
h (j.l.m)
R= 0.86mm I = 0.48 mm p = 2.36GPa
J-1-= 0.1
300 350 400
FIGURE 21. Estimated life of the coating as a function of the coating thickness.
13. Generalised wear model for inhomogeneous (porous) coatings
So far, the coating has been assumed to be homogeneous. However, the coating deposition methods may leave inhomogeneities within the material, such as porosities during plasma-spraying. Furthermore, the coating may also be composed of two
http://rcin.org.pl

MODELLING OF FAILURE AND WEAR OF THIN LAYERS 35
or more metallic phases, e.g. Mo + AlSi, with differing properties. Here, a generalised wear model has been developed to deal with inhomogeneous coatings, which is described as follows (Further details are provided in (35]).
Two variables, 6€etr(x) and b(x), are introduced; 6€etr(x) is the maximum cyclic plastic strain at a given position x and b(x) is the depth where 6€etr(x) appears. It is assumed that the material will be removed along the 6€etr(x) path. The wear law discussed earlier is applied to estimate the life of the material. Thus, two averaged quantities need to be defined:
l l
I b(x) dx I 6€etr(X) dx b= _o __ _ and 6€etr = -0-----:--- (13.1)
where l is the distance over which wear occurs. The wear rate can finally be expressed as
W' = b6€etr. Ef
(13.2)
A micrograph of a porous Mo coating is shown in Fig. 22a. This configuration was studied to assess the effect of the porosities on the wear rate of the coating. The
(a)
(b)
-5. 20E-04
+1. 29E-02
+2. 63E-02
+3. 97E-02
+5. 32E-02
+6. 66E-02
+8. OOE-02
+2. 53E-01
100 llil1
FtGURE 22. Case study of a porous Mo coating: (a) micrograph of the coating, (b) accumulated plastic deformation.
http://rcin.org.pl

36 E.P. Busso
accumulated plastic deformation in the coating after 160 loading cycles is illustrated in Fig. 22b. It is found that the overall wear rate is considerably enhanced by the existence of the porosities, with the increased wear rate near the inhomogeneities more than balancing the reduced wear rate far away from the asperities (typically the overall wear rate increases approximately by a factor of 2). In practice it is expected that this effect could be accounted for in the simplified wear model by the inclusion of an effective failure strain c~, which depends on the volume fraction and distribution of inhomogeneities, thus avoiding the need for the complicated mesoscale finite element analysis.
14. Numerical study of sliding wear caused by a loaded pin on a rotating disc
In this section, the computational approach recently proposed in (36) to predict the sliding wear caused by a loaded spherical pin contacting a rotating disc is described. Such a condition is typical of the so-called pin-on-disc test widely used in tribological studies (41, 42]. A schematic of the pin on disc test is illustrated in Fig. 23. The test is inherently three dimensional and hence three dimensional analyses are required to obtain the boundary conditions for the unit cell illustrated in Fig.16. Furthermore, a conversion factor is required to convert the 2D (plane strain) wear rate obtained from the unit cell analysis to a 3D wear rate to allow direct comparison with the pin on disc data.
Wear track
Disc
I i i i i i ~
!
Pin
FIGURE 23. Schematic of the pin on disc test.
Figure 24 illustrates a typical three dimensional mesh used in the finite element analysis - in this case the FE mesh consists of approximately 18 000 linear isoparametric 3D solid elements. A very fine mesh is employed in the contact zone of the disc where the deformation gradients are the highest. The normal load is applied through the axis of the rigid pin head and the friction force exerted on the disc due to sliding is realised by applying a moment to the pin about the x3 axis (see Fig. 21),
http://rcin.org.pl

MODELLING OF FAILURE AND WEAR OF THIN LAYERS
F -----, .. - .......... ........
Pin ( M3 ------- \-- ......
2l: 3
~ ----' '
FIGURE 24. 3D finite element mesh for the pin-on-disc contact problem.
37
defined as, M3 = J.l. F Rp , where Rp is the radius of the pin head. These conditions correspond to the case when the pin is at the point of sliding on the disc. This boundary value problem was solved using the commercial finite element program, ABAQUS [43].
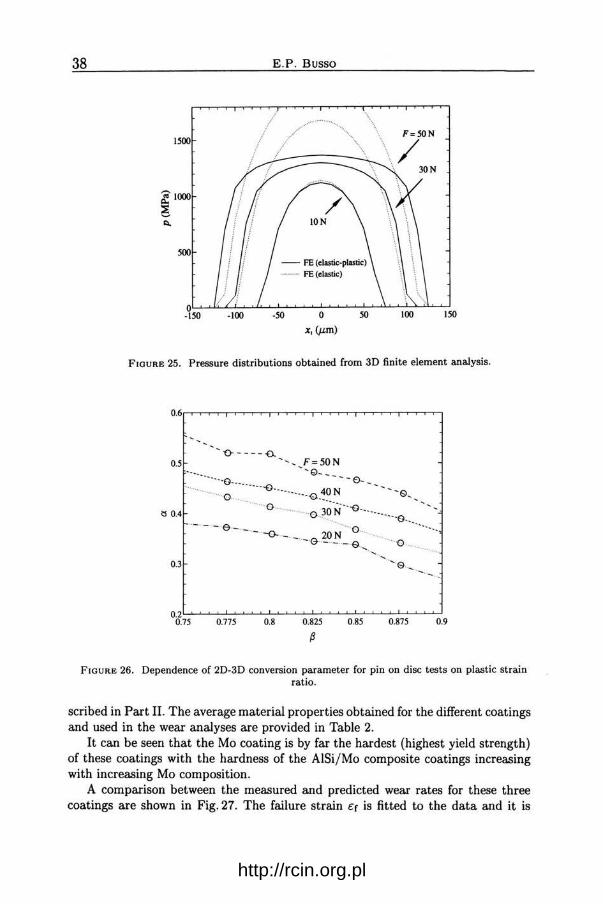
The pressure distributions at the central region of the mesh, obtained from the three dimensional analysis, for three different load cases, are illustrated in Fig. 25. Also illustrated for comparison are the results from an elastic analysis. These distributions are applied to the 2D unit cell as described in the previous section and the normalised 2D wear rate obtained as a function of pin load.
In order to compare with pin-on-disc data, a conversion factor must be introduced. The overall wear rate, W', is obtained from the unit cell wear rate, W~D, from the following relation,
(14.1)
where 2a is the contact area obtained from the numerical analysis and a is the conversion factor, which is obtained from a comparison of the predicted wear track areas under 2D and 3D conditions. The area of the predicted wear track depends on the parameter {3, which specifies at what fraction of the maximum strain experienced in the coating wear occurs with {3 expected to be close to 1. The dependence of a on {3 for four different pin loads is illustrated in Fig. 26. It can be seen that the calibrated conversion factor a varies by approximately 30% over the range 0. 75 ~ {3 ~ 0.9. There is some uncertainty as to the precise value of {3 that is appropriate for different materials and therefore it must be calibrated form experimental data. This is discussed in more detail in [36].
As discussed for the thin coatings, it was first necessary to obtain uniaxial stress strain data for the coating and substrate to use in the finite element model. This information was extracted from micro-indentation data following the approach de-
http://rcin.org.pl
38 E.P. Busso
1500
500
o~~~~~~~~~~~~~~~~~~~
-150 -100 -50 0 50 100 150
X1 (urn)
FIGURE 25. Pressure distributions obtained from 3D finite element analysis.
'-o------o.
~ 0.4
F=50N
--:-:-------:--- ---~-::~~:--:_-____ --=: 0.5
- - - 6 - - - -o- - _ 20 N ° -e---e o
0.3 ..... . G .. _
0.2 ~-'--'~~-'--L....l.._....L...i.--'-..L......J..._j__;L....J.._..J.......J.._J_..L......J...--'--'--'--..L....J..--'--'--' 0.75 0.775 0.8 0.825 0.85 0.875 0.9
{3
FIGURE 26. Dependence of 2D-3D conversion parameter for pin on disc tests on plastic strain ratio.
scribed in Part II. The average material properties obtained for the different coatings and used in the wear analyses are provided in Table 2.
It can be seen that the Mo coating is by far the hardest (highest yield strength) of these coatings with the hardness of the AlSi/Mo composite coatings increasing with increasing Mo composition.
A comparison between the measured and predicted wear rates for these three coatings are shown in Fig. 27. The failure strain cr is fitted to the data and it is
http://rcin.org.pl

MODELLING OF FAILURE AND WEAR OF THIN LAYERS 39
(a)
--e- Prediction with {3=0.15 and &,=0.5 250 · o · Prediction with {3=0.90 and &,=0.5 • e Experimental data
0 1200 • 1150
! ~100
0
0 10 20 30 40 50 60
F(N)
{b) 300.0
e Experimental Dela G---B Prediction with p..o.90 and e,-o.s
2SO.O 0 0 Prediction with p..o.7S and t,-(J.S
0
200.0 • e ~ ISO.O 0
~
~ 0
' 100.0
so.o
0 .0 0.0 10.0 20.0 30.0 40.0 so.o 60.0
F(N)
(c) 200.0
• Experimenlal Dela • G---B Prediction with p..o. 90 and t,-(1.6 0 0 Prediction with p..o.7S and t,-(1.6
ISO.O 0
e e
1 100.0.
I 0
' • so.o
• 0.0
0.0 10.0 20.0 30.0 40.0 so.o 60.0
F(N)
FIGURE 27. Comparison of wear model predictions with pin-on-disc data for (a) AlSi coating, {b) A1Si/10%Mo and (c) A1Si/30%Mo.
http://rcin.org.pl

40 E.P. Busso
TABLE 2. Mechanical properties for thick ductile coatings.
I Mo I AISi I AISi/IO%Mo I A1Si30%Mo
Young's modulus [GPa] 230 65 65 78 Yield strength (MPa] 2300 650 750 950 Strain hardening 12 7.5 9 9
seen that good agreement is obtained over the full range of loading for the three coatings.
The model was thus considered to be calibrated and was then applied to analyse the actual wear behaviour of a gear box synchroniser [44). It was found that the loads experienced by the synchro ring are somewhat higher than in the pin-on-disc test. At the synchro load levels, sufficient levels of plastic strain are generated to give a finite strain rate.
References
References for Part I
1. A. BENNET, F.C. TOR.IZ and A.B. THAKLEER., Surface and Coating Tech., Vol.32, p.359, 1987.
2. W. LACKEY, D.P. STINTON, G.A. CERNY, A. SHAFFHAUSER. and L. FEHRENBACHER., Adv. Ceram. Mat., Vol.2, p.24, 1987.
3. J.-T. MASSI-MARCIN and D.K. GuPTA, Surface and Coating Tech., Vol.68/69, p.1, 1994.
4. E.P. Busso, Journal de Physique IV, Vol.9, pp.287-296, 1999.
5. E.P. Busso, J. LIN, S. SAKURAI and M. NAKAYAMA, Acta Materialia, Vol.49/9, pp.1515-1528, 2001.
6. E.P. Busso, ,J. LIN, and S. SAKURAI, Acta Materialia, Vol.49/9, pp.1529-1536, 2001.
7. J. CHENG, E.H. JORDAN, B. BARBER. and M. GELL, Acta Materialia, Vol.46, pp.5839-5850, 1999.
8. E. ScHUMANN and M. RuHLE, Acta Metall., Vol.42, pp.1481-1487, 1994.
9. J. DoYCHAK, and M. RuHLE, Oxid. Metals, Vol.31, pp.431-452, 1989.
10. J. BALMAIN, M.K. LouDJANI and A.M. HuNTZ, Mat. Science Eng. A, Vol.224, pp.87-100, 1997.
11. D. MoNCEAU, (in:) Mechanics and Multiphysics Processes in Solids, E. Busso and G. Cailletaud [eds.J, MECAMAT, Paris 1998.
12. D.P. GAR.R.IGA-MAJO, B.A. SHOLLOCK, D.S. McPHAIL, R.J. CHATER. and J.F. WALKER., J. Inorganic Materials, Vol.l, 325-336, 1999.
13. M. BoBETH, W. PoMPE, E. SHUMANN and M. RuHLE, Acta Metall., Vol.40, pp.2669-2676, 1992.
14. B. BuDIANSKI and T.Y. Wu, Proc. 4th US Nat. Gong. Applied Mech., p.l175, 1962.
15. G. CAILLETAUD and P. PILVIN, Revue Europeenne des Elements Finis, Vol.3, pp.515-541, 1995.
16. A.M. FR.EBOR.G, B.L. FERGUSON, W.J. BRINDLEY and G.J. PETRus, Mat. Sci. Eng., Vol.A245, pp.182-190, 1998.
http://rcin.org.pl

MODELLING OF FAILURE AND WEAR OF THIN LAYERS 41
17. D. KRACJNOVJC, J. Appl. Mech., Vol.52, pp.829-834, 1985.
18. J .LEMAJTRE, R. DESMORAT and M. SAUZAY, Eur. J. Mech. A/ Solids, Vol.l9, pp.187-208, 2000.
19. J-L. CHABOCHE and P.M. LESNE, Fatigue Fract. Eng. Mater. Struct., Vol.ll, pp.1-17, 1988.
References for Part II
20. J. VLASSAK, T.Y. TsUJ and W.O. N1x, Mat. Res. Soc. Symp. Proc., Vol.505, p.71, 1998.
21. M.F. DoERNER and W.O. N1x, J. Mat. Res., Vol.l, p.601, 1986.
22. W.C. OLIVER and G.M. PHARR, J. Mat. Res., Vol.7, p.1564, 1992.
23. Y.T. CHENG and C.M. CHENG, Int. J. Solids and Structures, Vol.36, p.1231, 1999.
24. A.E. GIANNAKOPOULOS and S. SuRESH, Scripta Materiallia, Vol.40, p.1191, 1999.
25. A.K. BHATTAEHARYA and W.O. N1x, Int . J. Solids and Structures, Vol.24, p.881, 1988.
26. K. TuNVISUT, N.P. O'Dowo and E.P . Busso, Int. J. Solids and Structures, Vol.38, pp.335-351, 2001.
27. K. TuNVISUT, E.P. Busso, N.P. O'Dowo and H.-P. BRANTNER, Phil. Mag. A., 2001 [submitted].
28. K. TuNVISUT, N.P . O'Dowo and E .P. Busso, [in:J Modern Practice in Stress and Vibration Analysis, A.A. Becker (ed.J, EMAS Ltd. (publ.], pp.89-100, UK 2000.
29. W.O . N1x and H. GAo, J. Mech. Phys. Solids, Vol.46, p.411, 1998.
30. E.P . Busso, F. MEISSONNIER.and N .P. O'Dowo, J. Mech. and Phys. Solids, Vol.48,p.2333, 2000.
References for Part III
31. D.P. MoNAGHAN, K.C. LAING, P.A. LOGAN and D.C. TEER, Finishing, Vol.17, No.6, 1993.
32. H. HAFERKAMP, J. GERKEN, H.K. ToENSHOFF and M. MARQUERING, Proc. of the 9th International Conference on Surface Modification Technologies {1995}, T.S. Sudarshan, W. Reitz and J.J. Stiglich [eds.], Warrendale: The Minerals, Metals and Mats. Soc. (publ.], pp.547-564, 1996.
33. S .f'.WAYNE, S. SAMPATH and V.ANAND, Tribology Trans., Vol.37, pp.636-640, 1994.
34. W.YAN, E.P. Busso and N.P. O'Dowo, Proc. Royal Soc. London A, Vol.456, pp.2387-2407, 2000.
35. E.P.Busso, W. YAN and N.P. O'Dowo, Journal de Physique IV, Vol.ll, pp.257-266, 2001.
36. W. YAN, N.P. O'Dowo and E.P. Busso, Journal of the Mechanics and Physics of Solids, 2001 (in press].
37. J .H. DAUTZENBER.G and J .H. ZAAT, Wear, Vol.23, pp.9-l9, 1973.
38. D. A. RIGNEY, R . DIVAKAR and S.M . Kuo, Scripta Met. Et. Mat., Vol.27, pp.975-980, 1992.
39. A. KAPOOR, K.L. JoHNSON and J.A. WILLIAMS, Wear, Vol.200, pp.38-44, 1996.
40. S. JAHANMIR and N.P. SuH, Wear, Vol.44, pp.87-99, 1977.
41. M.G. GEE, Guidelines for unlubricated sliding wear tests. DMM(A), pp.96-97, National Physical Laboratory, UK 1993.
42. ASTM and ASM, Friction and Wear Testing: Selected References from ASTM Standards and ASM Handbooks, 1997.
http://rcin.org.pl
42 E.P. Busso
43. ABAQUS V.5.8, Hibbitt, Karlsson and Sorensen Inc., Providence, Rl., USA 1998.
44. COMPWERC, Final Report of "Computational Modelling of Wear Resistant Coatings", Brite EuRam project, BE97-4283, 2001.
http://rcin.org.pl