Embed Size (px)
Citation preview
Molecular interaction study of flavonoid derivative 3d with humanserum albumin using multispectroscopic and molecularmodeling approach
Juntong Wei a,b,c,1, Feng Jin b,d,1, Qin Wu a,b,c, Yuyang Jiang b,e, Dan Gao b,c,n, Hongxia Liu b,c,n
a Department of Chemistry, Tsinghua University, Beijing 100084, Chinab State Key Laboratory Breeding Base-Shenzhen Key Laboratory of Chemical Biology, Graduate School at Shenzhen, Tsinghua University,Shenzhen 518055, Chinac Key Laboratory of Metabolomics at Shenzhen, Shenzhen 518055, Chinad Neptunus Pharmaceutical Technology Center, Shenzhen 518057, Chinae School of Medicine, Tsinghua University, Beijing 100084, China
a r t i c l e i n f o
Article history:Received 19 November 2013Received in revised form15 March 2014Accepted 18 March 2014Available online 24 March 2014
Keywords:Human serum albumin (HSA)SpectrumMolecular dockingFlavonoid derivative
a b s t r a c t
Human serum albumin (HSA) has been developed as a model protein to study drug–protein interaction.In the present work, the interaction between our synthesized flavonoid derivative 3d (possessing potentantitumor activity against HepG2 cells) and HSA was investigated using fluorescence spectroscopy,circular dichroism spectroscopy, UV–vis spectroscopy and molecular modeling approach. Fluorescencespectroscopy showed that the fluorescence of HSA can be quenched remarkably by 3d underphysiological condition with a slight shift of maximum fluorescence emission bands from 360 nm to363 nm. Calculated results from Stern–Volmer equation and modified Stern–Volmer equation indicatedthat the fluorescence was quenched by static quenching processing with association constant5.2670.04�104 L mol�1 at 298 K. After comprehensive consideration of the free energy change ΔG,enthalpy change ΔH and entropy change ΔS, electrostatic interactions were confirmed as the main factorthat participate in stabilizing the 3d–HSA complex. Both dichroism spectroscopy and UV–vis spectro-scopy indicated conformational change of HSA after binding to 3d. Moreover, the structure of HSA wasloosened and the percentage of α-helix decreased with increasing concentration of 3d. Molecularmodeling results demonstrated that 3d could bind to HSAwell into subdomain IIA, which is related to itscapability of deposition and delivery. Three cation–π interactions and three hydrogen bonds occurredbetween 3d and amino acid residuals ARG218, ARG222 and LYS199. In conclusion, flavonoid derivative3d can bind to HSA with noncovalent bond in a relatively stable way, so it can be delivered by HSA in acirculatory system.
& 2014 Elsevier B.V. All rights reserved.
1. Introduction
Recently, the interaction between macromolecules such as proteinand drugs has attracted increasing interest [1–4]. Serum albumins, themajor transport protein in the blood circulatory system (accountingabout half of the proteins in human blood), act as the transportationand disposition factor of various ligands, such as dyes, fatty acids, anddrugs [5,6]. Human serum albumin (HSA) is the most abundantglobular protein existing in plasma. It is made up of 585 amino acids
and its polypeptide chain folds into a heart-shaped molecule. Its threedimensional (3D) structure was studied through X-ray crystallo-graphic measurement [7]. 3D crystal structure shows that HSAconsists of three homologous domains (namely I, II, and III):I (residuals 1–195), II (196–383) and III (384–585) and each domainhas two subdomains (denoted by A and B) [8,9]. The main role of HSAis to maintain the blood pH and colloid osmotic blood pressure.Moreover, HSA can bind to various ligands (endogenous and exogen-ous), such as lipids, amino acids, nutrients, metal ions, drugs etc.[10–12]. Due to this capability, HSA is known to play an importantrole in transport and disposition of drugs. After entering the circula-tory system (oral administration or injection), drugs bind to HSAmoreor less. It is easy to understand that binding affects pharmacokineticsand pharmacodynamics of drugs as it can prolong the action timefrom being metabolized [13]. Moreover, drug–HSA complex blocksdrugs from penetrating blood capillary walls, blood–brain barrier and
Contents lists available at ScienceDirect
journal homepage: www.elsevier.com/locate/talanta
Talanta
http://dx.doi.org/10.1016/j.talanta.2014.03.0460039-9140/& 2014 Elsevier B.V. All rights reserved.
n Corresponding authors at: State Key Laboratory Breeding Base-Shenzhen KeyLaboratory of Chemical Biology, Graduate School at Shenzhen, Tsinghua University,Shenzhen 518055, China. Tel. /fax: þ86 755 26036035.
E-mail addresses: [email protected] (D. Gao),[email protected] (H. Liu).
1 These authors contributed equally to this work.
Talanta 126 (2014) 116–121
glomerulus. Therefore, the binding force cannot be too strong or tooweak [12], for that if it is too strong, drugs cannot dissociate from HSAsmoothly, resulting in low concentration of free drugs in plasma.While if it is too weak, patients have to keep taking in drugs to holdthe concentration because its half-time is too short. Therefore, it isnecessary to evaluate the binding affinity of lead compounds to HSAduring the development of new drugs at an early stage.
Flavonoids containing the same skeleton of two aromatic ringslinked by an oxygenated heterocycle are a huge family includingflavones, flavonols, iso-flavones, anthocyanidins, anthocyanins,proanthocyanidins and catechins [14]. In the past two decades, theyare considerably preferred more by researchers due to their diversityin nature and their biological effects and pharmacological activities,such as antitumor, anti-inflammatory, antiviral and cardio-protectiveproperties [15–22]. Among these properties, the antitumor activityhas attracted increasing interest in the development of flavonoids andtheir derivatives as new drugs. Researchers have already known thatflavonoids from vegetables and fruits can reduce the risk of cancer[17,23]. This may be resulted from their ability of antioxidant activitybecause they could obliterate free radicals or be beneficial to thisprocedure [24]. In our previous work, a synthesized flavonoidsderivative, 1-(3-chloro-4-(6-ethyl-4-oxo-4H-chromen-2-yl)phenyl)-3-(4-chloro-phenyl)urea (3d) (Fig. 1), possessed potential antitumoractivity against HepG2 cells, while low toxicity against normal cellsHL7702 and QSG7701. The antitumor mechanism had been investi-gated by conventional molecular biological methods and metabolo-mics approaches [25]. In light of 3d had the potential for further drugdevelopment, we further investigated the interaction between 3d andHSA to better understand the transport and distribution of 3din blood.
To date, plenty of techniques have been applied to investigate theinteraction of small molecules with protein, such as nuclear magneticresonance (NMR) [2], fluorescence [26], UV–vis, circular dichroism(CD) [9] and Fourier transform infrared spectroscopy (FTIR) [8].As time goes on, some methods also have been introduced such asmass spectrometry [27,28], capillary electrophoresis [29–31], high-performance liquid chromatography (HPLC) [32], surface-enhancedRaman scattering [33], electrochemistry methods [34] and molecularmodeling [8,35] to elucidate the binding character. In this paper, theinteraction of 3d with HSA was investigated using fluorescencespectroscopy, CD, UV–vis and molecular modeling methods. We chosethe first three techniques because of their easy accessibility, sensitivityand abundant theoretical foundation. As to molecular modeling, it isviewed as the most useful tool to simulate conformation under thesituation of no real cocrystallization. The aim of our study is to explorethe binding mechanism of 3d to HSA and the effect of the complexa-tion on the protein structure in detail by multispectroscopic methods.We hope this study can provide significant insight into the theoreticalbasis for pharmacology.
2. Material and methods
2.1. Reagents and materials
Human serum albumin (99%), Tris-base, NaH2PO4, Na2HPO4
and ammonium acetate (analytical grade) were purchased from
Sigma-Aldrich (St. Louis, MO, USA). Acetonitrile (HPLC grade) wassupplied by Merck (Darmstadt, Germany). Water used throughoutthis experiment was prepared by Milli-Q water purification system(Millipore, USA). Other reagents used were of analytical grade. ThepH of 10 mM Tris–HCl buffer and 100 mM phosphate buffer wereadjusted to 7.4 using hydrochloric acid and phosphoric acidrespectively.
2.2. Fluorescence spectroscopy
Fluorescence spectra were performed on a Fluorolog-3 fluor-escence spectrophotometer (HORIBA JobinYvon, France) using a1.0 cm quartz cell equipped with a thermostatic bath. The excita-tion wavelength was 280 nm while the emission spectra wererecorded from 300 nm to 450 nm. Both the excitation and emis-sion slit widths were set at 5 nm. The scan speed was600 nm min�1. HSA was dissolved in 10 mM Tris–HCl solution toobtain the protein concentration of 2.5 μM, with physiologicalpH 7.4. Titrate HSA with the prepared compound 3d to make surethat its final concentration ranged from 0 to 25 μM. Because thedrug concentration of stock solution was far greater than HSA, thetitration of drug can hardly change the final concentration of HSA.In order to let solution reach the setting temperature, data werecollected after 3 min balance time when the quartz cell was placedin the thermostatic bath. The fluorescence emission spectra wererecorded at 288 K, 298 K and 310 K, respectively. The appropriateblank corresponding to the buffer solution was subtracted tocorrect the background of fluorescence. The association constantsof the HSA–3d system were calculated by the fluorescence data.
2.3. Circular dichroism (CD) spectroscopy
CD spectra were measured using a J-815 spectrometer (JASCO,Japan) with a 0.1 cm quartz cell. HSA was dissolved in 100 mMphosphate buffer (pH 7.4) as mentioned above and the signal wasrecorded at room temperature in the presence and absence ofdrugs from 200 nm to 250 nm at a scan speed of 200 nm min�1.The concentration of HSA was 5 μM and drugs were dissolved inDMSO with the concentration of 10 mM. The molar ratios of drugsto HSA were varied as 0:1, 1:1, 2:1. Each of the CD spectra was anaverage of three times scanning after subtracting backgroundvalue of phosphate buffer. All results were recorded as CDellipticity in mdeg.
2.4. UV–vis absorption spectroscopy
UV–vis absorption spectra were measured on a BeckmanCoulter DU-800 spectrophotometer (USA) at room temperaturein 1.0 cm path length. The UV–vis absorption spectra of HSA in thepresent and absence of 3d were recorded in the range of 190–320 nm. The final concentrations of drugs used for absorptionspectra changed from 0 to 25 μM, while the concentration of HSAwas fixed at 2.5 μM.
2.5. Molecular modeling
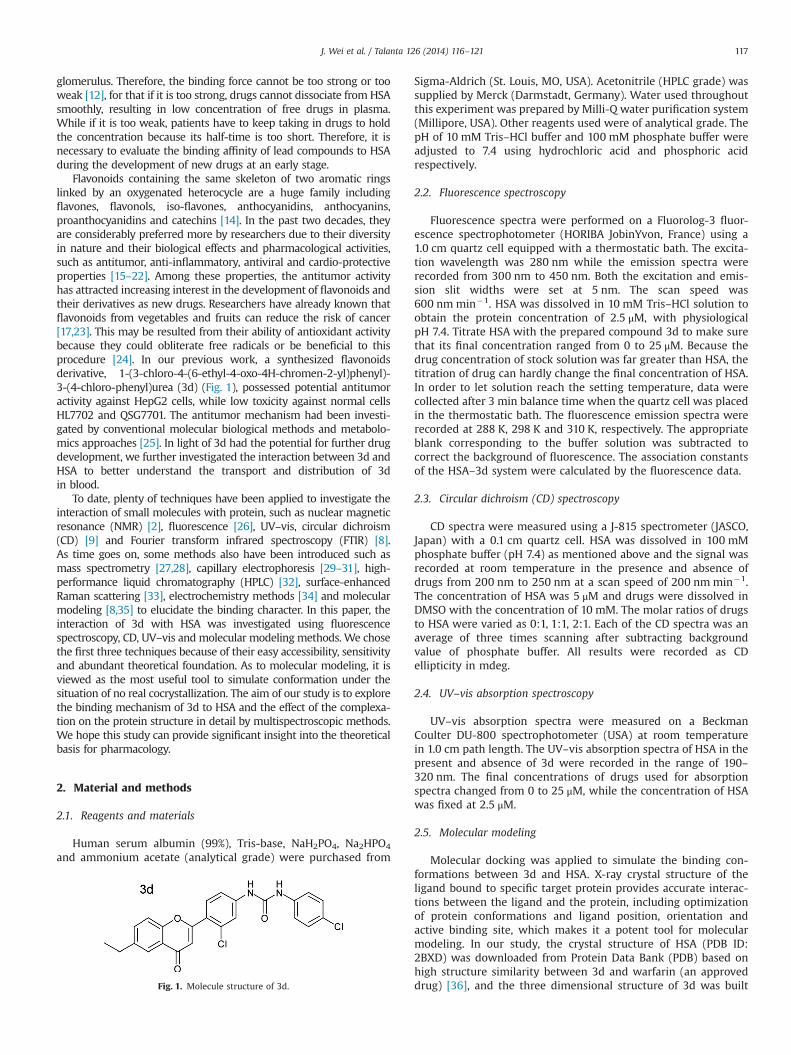
Molecular docking was applied to simulate the binding con-formations between 3d and HSA. X-ray crystal structure of theligand bound to specific target protein provides accurate interac-tions between the ligand and the protein, including optimizationof protein conformations and ligand position, orientation andactive binding site, which makes it a potent tool for molecularmodeling. In our study, the crystal structure of HSA (PDB ID:2BXD) was downloaded from Protein Data Bank (PDB) based onhigh structure similarity between 3d and warfarin (an approveddrug) [36], and the three dimensional structure of 3d was builtFig. 1. Molecule structure of 3d.
J. Wei et al. / Talanta 126 (2014) 116–121 117
using Discovery Studio.3.1/CDOCK protocol (Accelrys SoftwareInc.). The processing of molecular docking was as follows: firstly,water crystallization was removed from the X-ray crystal structureof HSA; secondly, binding domain of warfarin was defined as thecandidate binding sphere, then small molecular ligand warfarinwas removed from the defined sphere, and HSA crystal structure(2BXD) was simulated with CHARMm force flied as the receptor;thirdly, 3d was applied by CHARMm force field, then was selectedas the ligand. Finally, 3d was docked into the defined sphere. Thepossible conformation could be calculated and evaluated accord-ing to CDOCKER energy, and the top rank conformation wasselected for further analysis.
3. Results and discussion
3.1. Fluorescence spectra analysis
In recent years, fluorescence spectroscopy has been widelyused as a powerful tool for the study of interaction betweenbiomolecules and ligands since it can provide significant para-meters such as binding constant, binding sites, binding forces,interaction distance, and so on [37]. Due to its high sensitivity andnon-intrusive measurement, fluorescence spectroscopy is highlyappropriate for low concentration detection under physiologicalconditions. Generally, the emission fluorescence of HSA is mainlyderived from the residues of tryptophan, tyrosine and phenylala-nine. In fact, people usually take the fluorescence of tryptophanresidues as the inherent fluorescence of HSA because phenylala-nine has a relatively low quantum yield and the fluorescence oftyrosine is almost completely quenched if it is ionized or presentnear to an amino group, a carboxyl group or a tryptophan [38].
Fig. 2A shows the fluorescence quenching spectra of HSAinduced by different concentrations of 3d in Tris–HCl solutionwith pH 7.4 at the excitation wavelength of 280 nm. It is obvious
that the fluorescence intensity of HSA gradually decreased alongwith increasing Cdrug/CHSA from 1 to 10 and the maximumfluorescence emission bands had a red-shift from 360 nm to363 nm. It indicated that 3d could interact with HSA and quenchits intrinsic fluorescence. Protein fluorescence is sensitive tomicroenvironment and its structure. As we know, the fluorescenceemission wavelength of protein in polar solvent is longer than thatin nonpolar solvent. In other words, it will result in red-shift withthe increase of solvent polarity. The red-shift of the maximumfluorescence emission indicated that the microenvironment oftryptophan residue in HSA was changed, leading to an increaseof hydrophilicity in the vicinity of this residue [39].
Fluorescence quenching mainly takes place by two differentmechanisms, namely dynamic quenching and static quenching.In order to clarify the quenching mechanism of 3d–HSA system,the fluorescence spectra data were analyzed by the followingStern–Volmer equation to calculate the quenching constant KSV:
F0F¼ 1þKqτ0½Q � ¼ 1þKSV½Q � ð1Þ
where F0 and F are the fluorescence intensities of HSA in the absenceand presence of different concentrations of 3d, respectively. Kq isbimolecular quenching rate constant, τ0 is the average lifetime of thefluorophore before addition of drugs (the HSA fluorophore lifetime isapproximately 10�8 s); [Q] is the concentration of quencher (3d).In order to find out which mechanism plays the dominant role in thisquenching process, the fluorescence intensities of 3d–HSA systemanalyzed by plotting F0/F versus [Q] at three different temperatures(288 K, 298 K and 310 K) are shown in Fig. 2B, and the calculated Ksvvalues are listed in Table 1.
As shown in Fig. 2B, the regression lines under each detectiontemperature reveal quite a good linear relationship and their slope(Ksv) decreases from 570.05�104 to 3.5770.03�104 L mol�1
when the temperature rises from 288 K to 310 K. Generally,dynamic quenching and static quenching can be distinguished
Fig. 2. (A) Fluorescence quenching curves of HSA induced by different concentrations of 3d in 10 mM Tris–HCl buffer, pH 7.4 at 298 K upon excitation at 280 nm and slitwidth of 5 nm. The concentration of HSA was 2.5 μM, whereas 3d concentrations were 0 – 25.0 μM at regular increments of 2.5 μM from top to bottom (a–k). (B) Stern–Volmer plot for fluorescence quenching data of HSA–3d system at three different temperatures (288 K, 298 K and 310 K). (C) Modified Stern–Volmer plot for fluorescencequenching data of HSA–3d system at three different temperatures as mentioned in B.
J. Wei et al. / Talanta 126 (2014) 116–121118
by different Ksv at different temperatures. As to dynamic quench-ing, the rise of temperature will increase the number of effectivecollision, which promotes the quenching process, leading to theincrease of Ksv. On the other hand, higher temperature willdecrease the stability of drug–HSA complex, inducing the decreaseof Ksv. Hence the decrease of Ksv in this experiment indicated thatthe fluorescence quenching came out of the formation of 3d–HSAcomplex rather than dynamic collision, that is to say, 3d bound toHSA. Table 1 gathers all the calculated Ksv at each temperature.
The modified Stern–Volmer equation is used to achieve theassociation constant (Ka)
F0F0�F
¼ 1f Ka
1½Q �þ
1f
ð2Þ
where f is the fraction of accessible fluorescence, Ka is an effectivequenching constant and here it can be viewed as equal toassociation constant in our quencher–acceptor system [40,41].Fig. 2C shows a plot of F0/(F0�F) against 1/([Q]) and correspondingresults are shown in Table 1. It can be seen that a good linearrelationship was matched too, indicating that 3d interacts withHSA in a one-to-one ratio. The calculated association constantsbetween 3d and HSA are all in the order of magnitude larger than104 M�1. This result was in accordance with plenty of earlierreports, and such value of Ka was considered to be good for thedrug to diffuse from circulatory system to its target sites [10].Moreover, the value of Ka decreased as the temperature rose,which coincided with the change of Ksv and supported the staticquenching mechanism for 3d–HSA system. This information sug-gested that 3d and HSA have a noncovalent binding with moderateaffinity so that 3d can be carried by HSA in the circulatory systemand transferred to target tissue.
Since 3d and HSA have noncovalent interactions, we can movetoward to determine which force plays the dominant role in thatprocess. As is well known, weak interactions include hydrogenbonds, Van der Waals interaction, electrostatic interaction, hydro-phobic force, etc. [42]. In this research, the type of weak interac-tions can be determined by calculating relevant thermodynamicparameters.
Because temperature did not change in a wide range under ourexperimental method, the enthalpy change could be considered tobe a constant value. Thus, the thermodynamic parameters can becalculated by the van't Hoff equation
LnK ¼ �ΔHRT
þΔSR
ð3Þ
where K is a binding constant at corresponding temperature, ΔH isthe enthalpy change, ΔS is the entropy change, and R is a gasconstant. From the LnK versus 1/T plot we can obtain the values ofΔH and ΔS.
As known, the free energy change (ΔG), enthalpy change (ΔH)and entropy change (ΔS) have the following relationship:
ΔG¼ΔH�TΔS ð4Þ
From Eqs. (3) and (4), corresponding thermodynamic parameterswas acquired, as shown in Table 1. It can be seen that all thefree energies are about �26 kJ mol�1, indicating that the binding
process does not need extra addition of energy and can take placespontaneously. ΔHo0 and ΔS40 mean that the electrostaticinteractions may play a leading role in the 3d–HSA complexformation.
From fluorescence quenching results we know that 3d can bindto HSA spontaneously with relatively high association constant.This property endows 3d the capability that it can be deposited byHSA and be transferred to tumor in the circulatory system so as toproduce antitumor action. This good property allows 3d movetoward to being an efficient antitumor lead compound.
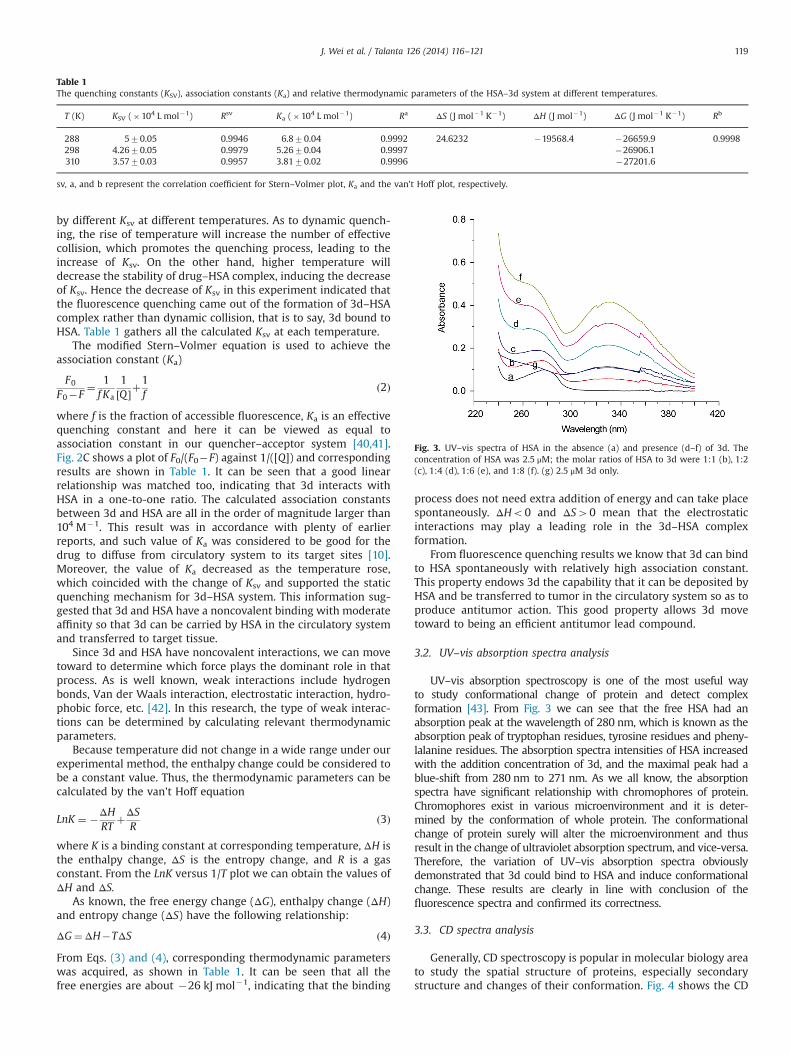
3.2. UV–vis absorption spectra analysis
UV–vis absorption spectroscopy is one of the most useful wayto study conformational change of protein and detect complexformation [43]. From Fig. 3 we can see that the free HSA had anabsorption peak at the wavelength of 280 nm, which is known as theabsorption peak of tryptophan residues, tyrosine residues and pheny-lalanine residues. The absorption spectra intensities of HSA increasedwith the addition concentration of 3d, and the maximal peak had ablue-shift from 280 nm to 271 nm. As we all know, the absorptionspectra have significant relationship with chromophores of protein.Chromophores exist in various microenvironment and it is deter-mined by the conformation of whole protein. The conformationalchange of protein surely will alter the microenvironment and thusresult in the change of ultraviolet absorption spectrum, and vice-versa.Therefore, the variation of UV–vis absorption spectra obviouslydemonstrated that 3d could bind to HSA and induce conformationalchange. These results are clearly in line with conclusion of thefluorescence spectra and confirmed its correctness.
3.3. CD spectra analysis
Generally, CD spectroscopy is popular in molecular biology areato study the spatial structure of proteins, especially secondarystructure and changes of their conformation. Fig. 4 shows the CD
Table 1The quenching constants (KSV), association constants (Ka) and relative thermodynamic parameters of the HSA–3d system at different temperatures.
T (K) KSV (�104 L mol�1) Rsv Ka (�104 L mol�1) Ra ΔS (J mol�1 K�1) ΔH (J mol�1) ΔG (J mol�1 K�1) Rb
288 570.05 0.9946 6.870.04 0.9992 24.6232 �19568.4 �26659.9 0.9998298 4.2670.05 0.9979 5.2670.04 0.9997 �26906.1310 3.5770.03 0.9957 3.8170.02 0.9996 �27201.6
sv, a, and b represent the correlation coefficient for Stern–Volmer plot, Ka and the van't Hoff plot, respectively.
Fig. 3. UV–vis spectra of HSA in the absence (a) and presence (d–f) of 3d. Theconcentration of HSA was 2.5 μM; the molar ratios of HSA to 3d were 1:1 (b), 1:2(c), 1:4 (d), 1:6 (e), and 1:8 (f). (g) 2.5 μM 3d only.
J. Wei et al. / Talanta 126 (2014) 116–121 119
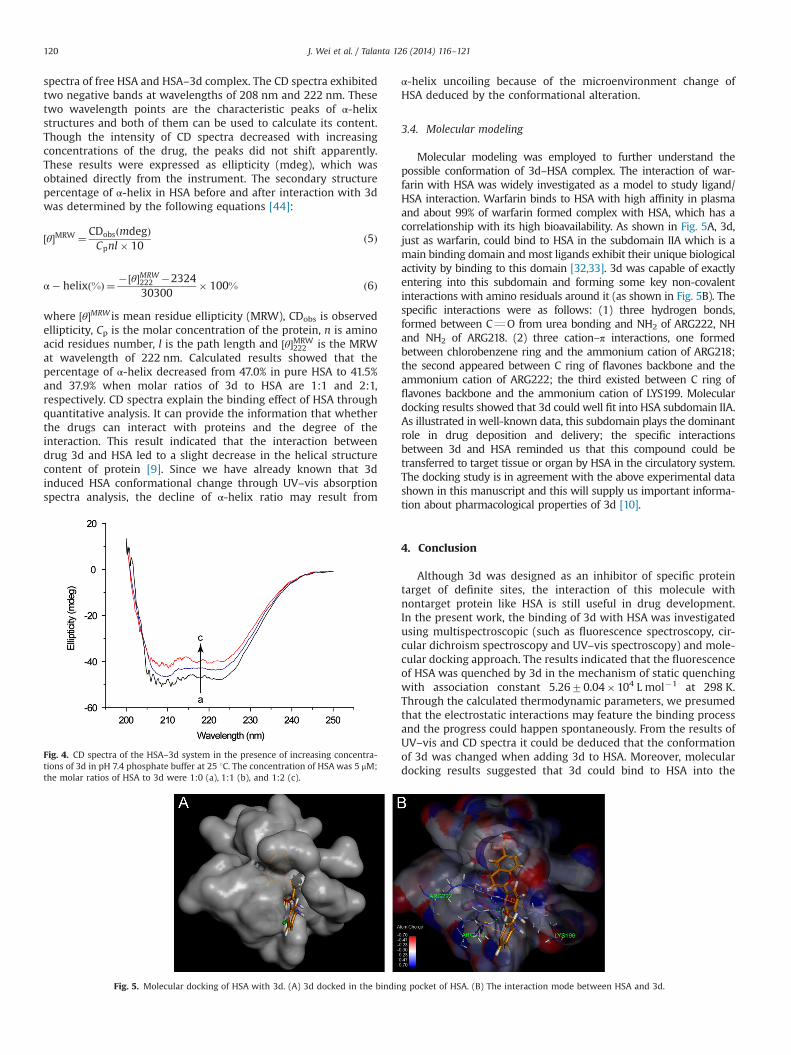
spectra of free HSA and HSA–3d complex. The CD spectra exhibitedtwo negative bands at wavelengths of 208 nm and 222 nm. Thesetwo wavelength points are the characteristic peaks of α-helixstructures and both of them can be used to calculate its content.Though the intensity of CD spectra decreased with increasingconcentrations of the drug, the peaks did not shift apparently.These results were expressed as ellipticity (mdeg), which wasobtained directly from the instrument. The secondary structurepercentage of α-helix in HSA before and after interaction with 3dwas determined by the following equations [44]:
½θ�MRW ¼ CDobsðmdegÞCpnl� 10
ð5Þ
α� helixð%Þ ¼ �½θ�MRW222 �232430300
� 100% ð6Þ
where ½θ�MRW is mean residue ellipticity (MRW), CDobs is observedellipticity, Cp is the molar concentration of the protein, n is aminoacid residues number, l is the path length and ½θ�MRW
222 is the MRWat wavelength of 222 nm. Calculated results showed that thepercentage of α-helix decreased from 47.0% in pure HSA to 41.5%and 37.9% when molar ratios of 3d to HSA are 1:1 and 2:1,respectively. CD spectra explain the binding effect of HSA throughquantitative analysis. It can provide the information that whetherthe drugs can interact with proteins and the degree of theinteraction. This result indicated that the interaction betweendrug 3d and HSA led to a slight decrease in the helical structurecontent of protein [9]. Since we have already known that 3dinduced HSA conformational change through UV–vis absorptionspectra analysis, the decline of α-helix ratio may result from
α-helix uncoiling because of the microenvironment change ofHSA deduced by the conformational alteration.
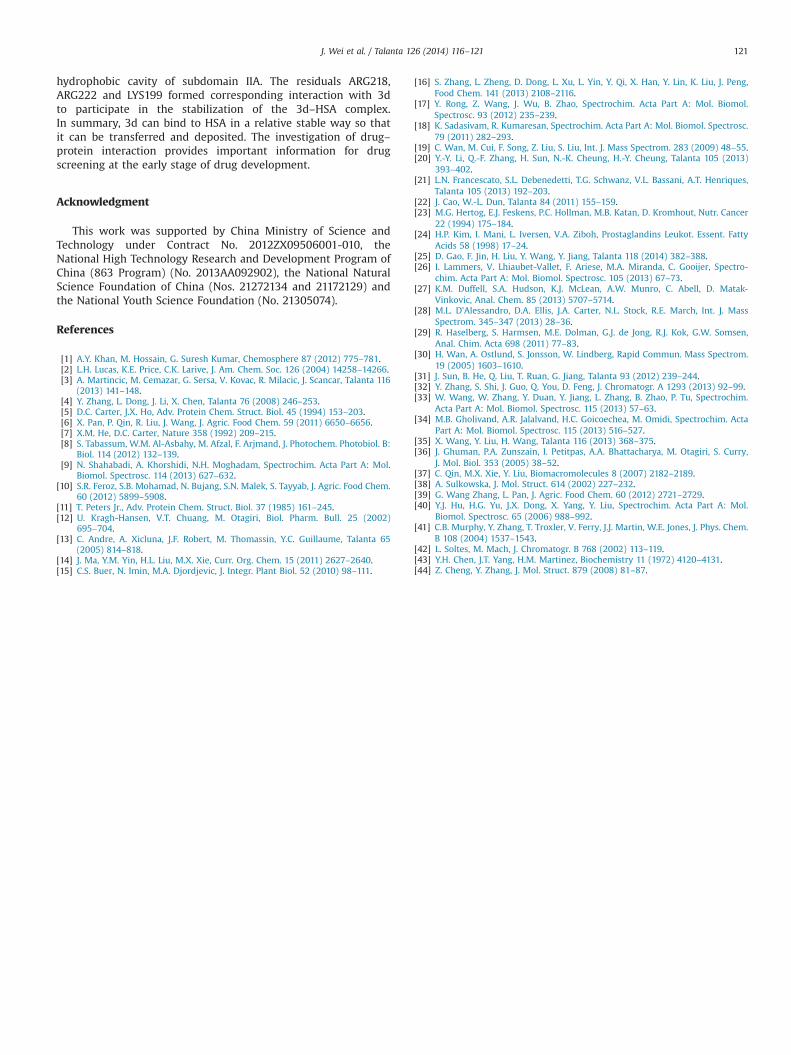
3.4. Molecular modeling
Molecular modeling was employed to further understand thepossible conformation of 3d–HSA complex. The interaction of war-farin with HSA was widely investigated as a model to study ligand/HSA interaction. Warfarin binds to HSA with high affinity in plasmaand about 99% of warfarin formed complex with HSA, which has acorrelationship with its high bioavailability. As shown in Fig. 5A, 3d,just as warfarin, could bind to HSA in the subdomain IIA which is amain binding domain andmost ligands exhibit their unique biologicalactivity by binding to this domain [32,33]. 3d was capable of exactlyentering into this subdomain and forming some key non-covalentinteractions with amino residuals around it (as shown in Fig. 5B). Thespecific interactions were as follows: (1) three hydrogen bonds,formed between CQO from urea bonding and NH2 of ARG222, NHand NH2 of ARG218. (2) three cation–π interactions, one formedbetween chlorobenzene ring and the ammonium cation of ARG218;the second appeared between C ring of flavones backbone and theammonium cation of ARG222; the third existed between C ring offlavones backbone and the ammonium cation of LYS199. Moleculardocking results showed that 3d could well fit into HSA subdomain IIA.As illustrated in well-known data, this subdomain plays the dominantrole in drug deposition and delivery; the specific interactionsbetween 3d and HSA reminded us that this compound could betransferred to target tissue or organ by HSA in the circulatory system.The docking study is in agreement with the above experimental datashown in this manuscript and this will supply us important informa-tion about pharmacological properties of 3d [10].
4. Conclusion
Although 3d was designed as an inhibitor of specific proteintarget of definite sites, the interaction of this molecule withnontarget protein like HSA is still useful in drug development.In the present work, the binding of 3d with HSA was investigatedusing multispectroscopic (such as fluorescence spectroscopy, cir-cular dichroism spectroscopy and UV–vis spectroscopy) and mole-cular docking approach. The results indicated that the fluorescenceof HSA was quenched by 3d in the mechanism of static quenchingwith association constant 5.2670.04�104 L mol�1 at 298 K.Through the calculated thermodynamic parameters, we presumedthat the electrostatic interactions may feature the binding processand the progress could happen spontaneously. From the results ofUV–vis and CD spectra it could be deduced that the conformationof 3d was changed when adding 3d to HSA. Moreover, moleculardocking results suggested that 3d could bind to HSA into the
Fig. 5. Molecular docking of HSA with 3d. (A) 3d docked in the binding pocket of HSA. (B) The interaction mode between HSA and 3d.
Fig. 4. CD spectra of the HSA–3d system in the presence of increasing concentra-tions of 3d in pH 7.4 phosphate buffer at 25 1C. The concentration of HSA was 5 μM;the molar ratios of HSA to 3d were 1:0 (a), 1:1 (b), and 1:2 (c).
J. Wei et al. / Talanta 126 (2014) 116–121120
hydrophobic cavity of subdomain IIA. The residuals ARG218,ARG222 and LYS199 formed corresponding interaction with 3dto participate in the stabilization of the 3d–HSA complex.In summary, 3d can bind to HSA in a relative stable way so thatit can be transferred and deposited. The investigation of drug–protein interaction provides important information for drugscreening at the early stage of drug development.
Acknowledgment
This work was supported by China Ministry of Science andTechnology under Contract No. 2012ZX09506001-010, theNational High Technology Research and Development Program ofChina (863 Program) (No. 2013AA092902), the National NaturalScience Foundation of China (Nos. 21272134 and 21172129) andthe National Youth Science Foundation (No. 21305074).
References
[1] A.Y. Khan, M. Hossain, G. Suresh Kumar, Chemosphere 87 (2012) 775–781.[2] L.H. Lucas, K.E. Price, C.K. Larive, J. Am. Chem. Soc. 126 (2004) 14258–14266.[3] A. Martincic, M. Cemazar, G. Sersa, V. Kovac, R. Milacic, J. Scancar, Talanta 116
(2013) 141–148.[4] Y. Zhang, L. Dong, J. Li, X. Chen, Talanta 76 (2008) 246–253.[5] D.C. Carter, J.X. Ho, Adv. Protein Chem. Struct. Biol. 45 (1994) 153–203.[6] X. Pan, P. Qin, R. Liu, J. Wang, J. Agric. Food Chem. 59 (2011) 6650–6656.[7] X.M. He, D.C. Carter, Nature 358 (1992) 209–215.[8] S. Tabassum, W.M. Al-Asbahy, M. Afzal, F. Arjmand, J. Photochem. Photobiol. B:
Biol. 114 (2012) 132–139.[9] N. Shahabadi, A. Khorshidi, N.H. Moghadam, Spectrochim. Acta Part A: Mol.
Biomol. Spectrosc. 114 (2013) 627–632.[10] S.R. Feroz, S.B. Mohamad, N. Bujang, S.N. Malek, S. Tayyab, J. Agric. Food Chem.
60 (2012) 5899–5908.[11] T. Peters Jr., Adv. Protein Chem. Struct. Biol. 37 (1985) 161–245.[12] U. Kragh-Hansen, V.T. Chuang, M. Otagiri, Biol. Pharm. Bull. 25 (2002)
695–704.[13] C. Andre, A. Xicluna, J.F. Robert, M. Thomassin, Y.C. Guillaume, Talanta 65
(2005) 814–818.[14] J. Ma, Y.M. Yin, H.L. Liu, M.X. Xie, Curr. Org. Chem. 15 (2011) 2627–2640.[15] C.S. Buer, N. Imin, M.A. Djordjevic, J. Integr. Plant Biol. 52 (2010) 98–111.
[16] S. Zhang, L. Zheng, D. Dong, L. Xu, L. Yin, Y. Qi, X. Han, Y. Lin, K. Liu, J. Peng,Food Chem. 141 (2013) 2108–2116.
[17] Y. Rong, Z. Wang, J. Wu, B. Zhao, Spectrochim. Acta Part A: Mol. Biomol.Spectrosc. 93 (2012) 235–239.
[18] K. Sadasivam, R. Kumaresan, Spectrochim. Acta Part A: Mol. Biomol. Spectrosc.79 (2011) 282–293.
[19] C. Wan, M. Cui, F. Song, Z. Liu, S. Liu, Int. J. Mass Spectrom. 283 (2009) 48–55.[20] Y.-Y. Li, Q.-F. Zhang, H. Sun, N.-K. Cheung, H.-Y. Cheung, Talanta 105 (2013)
393–402.[21] L.N. Francescato, S.L. Debenedetti, T.G. Schwanz, V.L. Bassani, A.T. Henriques,
Talanta 105 (2013) 192–203.[22] J. Cao, W.-L. Dun, Talanta 84 (2011) 155–159.[23] M.G. Hertog, E.J. Feskens, P.C. Hollman, M.B. Katan, D. Kromhout, Nutr. Cancer
22 (1994) 175–184.[24] H.P. Kim, I. Mani, L. Iversen, V.A. Ziboh, Prostaglandins Leukot. Essent. Fatty
Acids 58 (1998) 17–24.[25] D. Gao, F. Jin, H. Liu, Y. Wang, Y. Jiang, Talanta 118 (2014) 382–388.[26] I. Lammers, V. Lhiaubet-Vallet, F. Ariese, M.A. Miranda, C. Gooijer, Spectro-
chim. Acta Part A: Mol. Biomol. Spectrosc. 105 (2013) 67–73.[27] K.M. Duffell, S.A. Hudson, K.J. McLean, A.W. Munro, C. Abell, D. Matak-
Vinkovic, Anal. Chem. 85 (2013) 5707–5714.[28] M.L. D’Alessandro, D.A. Ellis, J.A. Carter, N.L. Stock, R.E. March, Int. J. Mass
Spectrom. 345–347 (2013) 28–36.[29] R. Haselberg, S. Harmsen, M.E. Dolman, G.J. de Jong, R.J. Kok, G.W. Somsen,
Anal. Chim. Acta 698 (2011) 77–83.[30] H. Wan, A. Ostlund, S. Jonsson, W. Lindberg, Rapid Commun. Mass Spectrom.
19 (2005) 1603–1610.[31] J. Sun, B. He, Q. Liu, T. Ruan, G. Jiang, Talanta 93 (2012) 239–244.[32] Y. Zhang, S. Shi, J. Guo, Q. You, D. Feng, J. Chromatogr. A 1293 (2013) 92–99.[33] W. Wang, W. Zhang, Y. Duan, Y. Jiang, L. Zhang, B. Zhao, P. Tu, Spectrochim.
Acta Part A: Mol. Biomol. Spectrosc. 115 (2013) 57–63.[34] M.B. Gholivand, A.R. Jalalvand, H.C. Goicoechea, M. Omidi, Spectrochim. Acta
Part A: Mol. Biomol. Spectrosc. 115 (2013) 516–527.[35] X. Wang, Y. Liu, H. Wang, Talanta 116 (2013) 368–375.[36] J. Ghuman, P.A. Zunszain, I. Petitpas, A.A. Bhattacharya, M. Otagiri, S. Curry,
J. Mol. Biol. 353 (2005) 38–52.[37] C. Qin, M.X. Xie, Y. Liu, Biomacromolecules 8 (2007) 2182–2189.[38] A. Sulkowska, J. Mol. Struct. 614 (2002) 227–232.[39] G. Wang Zhang, L. Pan, J. Agric. Food Chem. 60 (2012) 2721–2729.[40] Y.J. Hu, H.G. Yu, J.X. Dong, X. Yang, Y. Liu, Spectrochim. Acta Part A: Mol.
Biomol. Spectrosc. 65 (2006) 988–992.[41] C.B. Murphy, Y. Zhang, T. Troxler, V. Ferry, J.J. Martin, W.E. Jones, J. Phys. Chem.
B 108 (2004) 1537–1543.[42] L. Soltes, M. Mach, J. Chromatogr. B 768 (2002) 113–119.[43] Y.H. Chen, J.T. Yang, H.M. Martinez, Biochemistry 11 (1972) 4120–4131.[44] Z. Cheng, Y. Zhang, J. Mol. Struct. 879 (2008) 81–87.
J. Wei et al. / Talanta 126 (2014) 116–121 121


![Preparation of titania/hydroxyapatite (TiO2/HAp) composite ...or.nsfc.gov.cn/bitstream/00001903-5/77915/1/1000007277269.pdf · Pentachlorophenol (PCP) ... synthesis of TiO ... [17]](https://img.pdfslide.net/doc/110x75/5a7333487f8b9a9d538e6543/preparation-of-titaniahydroxyapatite-tio2hap-composite-ornsfcgovcnbitstream00001903-5779151.jpg)