Embed Size (px)
Citation preview

Molecular Phylogenetics and Evolution 92 (2015) 181–192
Contents lists available at ScienceDirect
Molecular Phylogenetics and Evolution
journal homepage: www.elsevier .com/ locate /ympev
Life history lability underlies rapid climate niche evolutionin the angiosperm clade Montiaceae q
http://dx.doi.org/10.1016/j.ympev.2015.06.0061055-7903/� 2015 Elsevier Inc. All rights reserved.
q This paper was edited by the Associate Editor Jocelyn C. Hall.⇑ Corresponding author at: Department of Biology, Southern Utah University, 351
West University Boulevard, Cedar City, UT 84720, USA.E-mail addresses: [email protected] (R. Matthew Ogburn), erika_edwards@
brown.edu (E.J. Edwards).
R. Matthew Ogburn a,b,⇑, Erika J. Edwards b
a Department of Biology, Southern Utah University, 351 West University Boulevard, Cedar City, UT 84720, USAb Department of Ecology and Evolutionary Biology, Brown University, Providence, RI 02909, USA
a r t i c l e i n f o a b s t r a c t
Article history:Received 12 September 2014Revised 26 March 2015Accepted 11 June 2015Available online 2 July 2015
Keywords:AnnualEvolutionary labilityLife historyMontiaceaePerennialPortulacineae
Despite the recent focus on phylogenetic niche conservatism in macroevolutionary studies, many cladeshave diversified widely along multiple niche dimensions. The factors underlying lineage-specific nichelability are still not well understood. We examined morphological and climate niche evolution inMontiaceae (Caryophyllales), an ecologically variable plant lineage distributed primarily along the moun-tain chains of the western Americas. Montiaceae inhabit a broader range of temperatures than their rel-atives, with an increase in the evolutionary rate of temperature niche diversification at the nodesubtending this clade. Within Montiaceae, life history is highly labile and significantly correlated withtemperature, with perennials consistently occurring in cooler environments. This elevated evolutionarylability facilitated repeated shifts between habitats as new environments were created by post-Eoceneorogenic events and aridification in the western Americas. The shifts between annual and perennial formsare elaborations of an underlying rosette body plan in most cases, and may involve simple alterations inbiomass allocation. Montiaceae stand as another clear counterexample to phylogenetic niche conser-vatism, and demonstrate a mechanism by which pronounced ecological shifts may occur frequentlyand rapidly among closely related species.
� 2015 Elsevier Inc. All rights reserved.
1. Introduction
A longstanding question in evolutionary biology concerns theextent and frequency with which lineages colonize novel climaticniches (Cronquist, 1968; Stebbins, 1974; Hallé et al., 1978;Donoghue, 2008). Studies documenting rapid adaptive divergence(Carr, 1987; Baldwin and Sanderson, 1998) or plasticity (Dudleyand Schmitt, 1996; Cordell et al., 1998; Price et al., 2003) at popu-lation or higher levels previously led many researchers to supposethat ecological niches, especially the abiotic niche, must in generalbe highly labile. In contrast, a number of more recent studies haveargued that ‘‘phylogenetic niche conservatism’’, the tendency forclosely related species to share a similar ecological niche (synthe-sized in Wiens et al., 2010), is pervasive, and has played a predom-inant role in shaping geographical distribution patterns (Good,1974; Hallé et al., 1978; Wiens and Donoghue, 2004; Donoghue,2008; Crisp et al., 2009). Questions remain about how to reconcile
these two apparently conflicting views of niche evolution, includ-ing the relevant scale for assessing niche shifts and what an appro-priate null expectation for niche lability should be (Edwards andDonoghue, 2013).
There has also been relatively little attempt at integrating anorganismal perspective on these questions, namely, howlineage-specific accessibility of phenotypes may influence patternsof niche evolution (Edwards and Donoghue, 2013; Donoghue andEdwards, 2014). The relative evolutionary lability of traits or traitsyndromes underlying the niche depends quite directly on organ-ismal context. Important factors include species-specific differ-ences in genetic variation (Lynch and Walsh, 1998), potentialbiophysical constraints (Osborne et al., 2004), ‘‘epistatic’’ traitinteractions due to functional or developmental integration (i.e.,‘‘trait burden’’) (Riedl, 1978; Wagner and Laubichler, 2004;Ogburn and Edwards, 2009), and the relative complexity of thenew adaptive phenotypes, which might require multiple evolu-tionary steps for which some lineages already have acquired cer-tain ‘precursor’ traits (e.g., CAM and C4 photosynthesis) (Sage,2004; Edwards and Ogburn, 2012; Christin et al., 2013, 2015).Depending on the specific organismal context, some shifts in func-tionally important traits may happen readily while others may not,
182 R. Matthew Ogburn, E.J. Edwards / Molecular Phylogenetics and Evolution 92 (2015) 181–192
and this in turn could contribute to a lineage-specific propensityfor niche lability or stasis.
The angiosperm clade Montiaceae presents an excellent case inwhich to consider questions of niche lability and evolutionaryaccessibility. This group comprises the bulk of taxa previously cir-cumscribed in the traditional Portulacaceae (Nyffeler and Eggli,2010). Montiaceae are widespread and ecologically diverse, inhab-iting a range of disparate habitats in the Americas, Australia, NewZealand, and Europe (Hershkovitz and Zimmer, 2000; Applequistand Wallace, 2001; Applequist et al., 2006; Nyffeler et al., 2008).Along with their geographic and ecological variation, Montiaceaeshow a wide array of linked growth form and life history states:succulent-leaved annual herbs, thick tap-rooted acaulescentrosette perennials, stem-succulent shrubs, compact cushion plants,and filamentous aquatic herbs (Eggli and Ford-Werntz, 2002;Nyffeler et al., 2008). In spite of their high degree of ecological, geo-graphic, and morphological variation, Montiaceae comprise onlyabout 200 species (Nyffeler and Eggli, 2010), facilitating compre-hensive comparisons across the whole group.
Morphological and life history traits appear to co-vary inMontiaceae, and also appear to be quite labile, with markedly sim-ilar forms evolving multiple times in parallel among subclades.Two forms are particularly common within Montiaceae: thicktap-rooted perennials with often linear or strap-like leaves andminimal above ground stem growth (Fig. 1a–d), and low, rosetteannuals with moderately to highly succulent leaves, multiple laxstems originating from the base of the plant, and relatively littleinvestment in root tissue (Fig. 1e–h). Representatives of both formscan be found within multiple subclades (e.g., Claytonia, Cistanthes.s., Montiopsis, Calandrinia s.s., and Calyptridium) (Fig. 1), implying
Claytonia megarhiza
Claytonia exigua
Cistanthe picta
Cistanthe cephalophora
(a) (b) (
(e) (f) (
Fig. 1. Repeated evolution of stereotyped rosette forms in Montiaceae. Each of the uppermegarhiza, Wenatchee National Forest, WA, USA. (b) Cistanthe picta, Región MetropolitaRegión Metropolitana, Chile. (e) Claytonia exigua, Rockaway Beach, OR, USA. (f) CiMetropolitana, Chile. (h) Calandrinia compressa, Región O’Higgins, Chile.
repeated evolutionary shifts between them. Field and herbariumobservations suggest that life history and growth form variationin Montiaceae tends to sort along altitudinal and/or latitudinal gra-dients, with annual forms tending to occur in warmer lowlandhabitats and perennials occurring at colder, higher-elevationhabitats.
We chose to investigate relationships between climate nicheevolution and life history (annual versus perennial) rather thangrowth form for several reasons. First, assigning life history strat-egy is less subjective than assigning plants to typological growthform categories; while most annual and perennial forms appearas in Fig. 1, there are slight variations on these themes that preventstraight-forward categorization. In contrast, nearly all of thegrowth form categories we have assessed here can be assignedunambiguously as either annuals or perennials. The variation in lifehistory in Montiaceae stands in contrast to other clades ofPortulacineae, which are entirely perennial (e.g., Cactaceae,Didiereaceae, Basellaceae), or are predominantly annual (e.g.,Portulaca) (Eggli and Ford-Werntz, 2002). We hypothesized thatMontiaceae have an elevated lability in life history strategy relativeto other Portulacineae due to an increased flexibility in biomassallocation, and this lability in turn is a key to their exploitationof new environments.
Montiaceae also exhibit substantial variation in succulent waterstorage. Most Portulacineae are typically found in arid or semi-aridenvironments, and are known for their moderate to high succu-lence in either leaves (e.g., Anacampserotaceae, Portulacaria),stems (e.g., Cactaceae, Didiereaceae), or roots (e.g., Talinaceae,Basellaceae) (Nyffeler et al., 2008). While pronounced succulence,especially of leaves, is common in Montiaceae as well (e.g.,
Montiopsis capitata
Montiopsis sericea Calandrinia affinis
Calandrinia compressa
c) (d)
g) (h)
and lower pairs are closely related members of well-supported lineages. (a) Claytoniana, Chile. (c) Montiopsis sericea, Región Metropolitana, Chile. (d) Calandrinia affinis,stanthe cephalophora, Región Antofagasta, Chile. (g) Montiopsis capitata, Región

R. Matthew Ogburn, E.J. Edwards / Molecular Phylogenetics and Evolution 92 (2015) 181–192 183
Phemeranthus, Cistanthe s.s.; Fig. 1f), there are also some taxa withnegligible water storage (e.g., Montiopsis) (Fig. 1c and g) (Nyffeleret al., 2008; Ogburn and Edwards, 2013), and some which inhabitmore mesic habitats (e.g., Montia fontana, Claytonia sibirica). Arecently validated metric of succulence, saturated water content(SWC), allowed us to treat this trait quantitatively, facilitating itsanalysis in a comparative phylogenetic framework (Ogburn andEdwards, 2012). The presumed adaptive value of storage strategiessuch as succulence is that they act as a buffering mechanism froman environment with unpredictable resource availability (Chapinet al., 1990). We hypothesized that succulence would be negativelycorrelated with mean annual precipitation, but positively with pre-cipitation seasonality, mean annual temperature, and also with anannual life history, due to our casual observations of more succu-lent leaves in annual plants.
With the exceptions of Parakeelya, Hectorelleae, Phemeranthus,and a few species of Claytonia and Montia, Montiaceae are dis-tributed primarily along the backbone of the American cordillera,extending from Chile and Argentina as far northward as Alaskaand into eastern Siberia. These regions have undergone extensiveepisodes of mountain-building and aridification from the Eoceneonward (Axelrod, 1958; Simpson, 1983; Graham, 2009), and thecurrent distribution and ecology of Montiaceae imply that thesetaxa diversified into novel habitats as they arose. We incorporatedrecent analyses of divergence times in Portulacineae (Arakaki et al.,2011) to address hypotheses about biogeographic and evolutionaryevents in the context of a dated phylogeny.
2. Materials and methods
2.1. Phylogenetic analysis
In a previous study of Portulacineae (Ogburn and Edwards,2013), we assembled available sequences and generated newsequences for a three-gene dataset consisting of the chloroplastmarkers trnK–matK and ndhF and the nuclear marker phyC. Treesinferred with this dataset are well-supported and highly congruentbetween maximum likelihood (ML) and Bayesian analyses. Whilethis dataset is reasonably well-sampled for Montiaceae (89 speciesout of approximately 200 species total), greater sampling is avail-able for the markers ITS and ycf3 based on the efforts of previousstudies focused exclusively on Montiaceae (Hershkovitz andZimmer, 1997; O’Quinn and Hufford, 2005; Applequist et al.,2006; Hershkovitz, 2006; Guilliams, 2009; Price, 2012).Combining these sequences with the three-gene dataset resultedin 289 terminal taxa from Portulacineae and otherCaryophyllales, increasing coverage within Montiaceae to 142 ter-minal taxa (Appendix).
Prior to phylogenetic analysis, we used the programPartitionFinder v.1.1.0 (Lanfear et al., 2012) to simultaneously findthe best fitting nucleotide substitution models and partitioningscheme for the dataset, which we then applied for both RAxMLand BEAST analyses. We inferred the ML tree for thethree-marker and five-marker datasets with RAxML v7.4.2(Stamatakis, 2006) with 1000 nonparametric bootstrap replicatesto estimate branch support. Ultrametric trees with dated diver-gence times were estimated with BEAST v1.8.1 (Drummond andRambaut, 2007). For divergence times we used an uncorrelatedlognormal relaxed clock model with an age prior for the crowngroup of Portulacineae + Molluginaceae of 53.3 my, with a nor-mally distributed standard deviation of 2.1 my based on datesobtained by Arakaki et al. (2011). We chose this node because itwas included in the angiosperm-wide analysis that utilized 13carefully placed fossil calibrations. We incorporated the uncer-tainty of the node age estimates with a normally distributed
standard deviation because unlike a fossil calibration, which bydefinition represents a minimum age, with a secondary calibrationthe prior could equally be too old or too young. We recognize thatthis ‘‘secondary calibration’’ approach is not ideal, as it compoundserrors generated during the primary analysis, and underestimatesthe uncertainty associated with age estimates. Nevertheless it isthe only way to approximate ages of clades with no utilizable fossilrecord, as is the case here. Sampling chains were run for 2 ⁄ 107
generations and sampled every 2000 steps, with an appropriateburn-in phase assessed by examining convergences of parametervalues in Tracer 1.6.0. (generally the first 10% of trees sampled).BEAST analyses were run six times for the three-marker datasetand eight times for the five-marker dataset to achieve sufficient(>200) effective sample sizes for all posterior parameter estimates.In all cases independent runs converged on similar parameter dis-tributions and were therefore pooled. We used logCombiner v1.8.1to thin the posterior tree distributions for generating maximumclade credibility (MCC) trees for both datasets and to sample1000 trees from the five marker dataset for use in further compar-ative analyses. Analyses were conducted on the Brown UniversityOSCAR and CIPRES Science Gateway clusters (Miller et al., 2010).
2.2. Locality and climate data
We downloaded georeferenced records for Portulacineae andMolluginaceae from the Global Biodiversity Information Facility(www.gbif.org) on 7 January 2013 by searching at the family andgenus levels. We followed a number of quality control steps onthese records: first we updated taxonomic circumscriptionsaccording to accepted names in the Tropicos and InternationalPlant Names (IPNI) databases. We removed records for taxa notsampled in the phylogenetic tree, records with identical coordi-nates for a given species, records with latitude and longitude coor-dinates of 0�, 0�, and records matching a list of coordinates formajor herbaria or political centroids at all administrative divisions(Edwards et al., 2015). The remaining localities were overlain onthe GADM 2.0 global administrative map obtained from gadm.orgusing the ‘‘over’’ function in the R package sp 1.0.8 (Pebesma andBivand, 2005), and any records with the ‘‘country’’ field conflictingwith the map overlay were discarded. Finally, any taxa with fewerthan five locality records were removed. After cleaning, we wereleft with 50,118 unique records for 214 taxa, of which 116 wereMontiaceae.
Even with such steps, a geo-referenced dataset is prone tonumerous sources of error that are not possible to check on arecord-by-record basis. The effect of any error in locality onextracted climate data is likely to be more serious for taxa growingin mountainous, topographically heterogeneous regions such as isthe case for many records here. To assess the robustness of our cli-mate analysis to the effects of spatial error in records, we gener-ated a number of quasilocality datasets. For each specimenrecord, we generated a new quasilocality by drawing a randomsample from within a circle with a five kilometer (km) radius cen-tered at the recorded locality. Five hundred such quasilocalitydatasets were generated and matched to a subset of trees fromthe Bayesian posterior tree sample, thus incorporating uncertaintyin the tree topology in climate analyses as well. Analyses were con-ducted on the original locality dataset with the MCC tree, then oneach quasilocality dataset with a unique tree from the posteriortree sample, with results obtained integrated over all trees anddatasets. This procedure was then repeated with additionalquasilocality sets with sampling radii of 10 km, 50 km, and100 km, allowing us to assess the robustness of observed patternsto increased noise.
The R package raster (Hijmans and van Etten, 2012) was used toextract data for each locality or quasilocality point for the 19

184 R. Matthew Ogburn, E.J. Edwards / Molecular Phylogenetics and Evolution 92 (2015) 181–192
bioclim variables plus altitude from the WORLDCLIM database(Hijmans et al., 2005). Due to the worldwide scale of the datasetand difficulty in verifying locality accuracy for such a large numberof herbarium records, we chose a medium-scale spatial resolutionof 2.5 min. Species means for each of these climate and geograph-ical variables were calculated for use in comparative analyses.Because many of the bioclim variables are correlated, we generallyfocused our analyses of ecological hypotheses on mean annualtemperature (MAT), mean annual precipitation (MAP), and precip-itation seasonality. Exploratory principal components analysisshowed that these variables explained a significant portion of thevariation in the data, and are more or less orthogonal on the firsttwo principal components axes.
To visualize the climate space of Montiaceae relative to otherPortulacineae, we mapped mean species values for MAT and MAPonto the five-marker consensus topology, pruned to the 214 taxafor which climate data are available. We used the traitMEDUSAmethod to test for rate shifts with respect to the climate tolerancesfor MAT and MAP using the function transformPhylo.ML from the Rpackage MOTMOT v1.1.2, using the ‘‘tm2’’ model and a minimumclade size of 6 (Thomas and Freckleton, 2012). This function firstcalculates a single-rate Brownian motion model for the trait overthe entire tree, and then compares the fit of this model to a seriesof two-rate models with shifts localized at each successive node.The best-fitting two-rate model is kept and the process is repeatedby adding additional shifts, until further shifts do not result in asignificantly improved size-corrected Akaike InformationCriterion (AICc) score. We chose a conservative threshold of 10AICc units as a cutoff to stop adding shifts (Thomas andFreckleton, 2012). Based on trait mappings in which a subset ofMontiaceae appear to occupy a substantially cooler temperatureniche, we also tested for evidence of significant departure fromBrownian motion evolution in temperature tolerances with aLévy process (i.e., discrete leaps into novel climate space) underthe jump-normal model utilizing the software creepy-jerk(Landis et al., 2013).
2.3. Growth form/life history reconstructions
Taxa were coded as either annual or perennial based on litera-ture surveys and personal observation in the field and herbarium(Reiche, 1898; Johnston, 1929; Carolin, 1987; Hershkovitz, 1991;Ford, 1992; Eggli and Ford-Werntz, 2002; Packer, 2003; O’Quinnand Hufford, 2005). A few widespread, polymorphic taxa (e.g., C.sibirica; O’Quinn and Hufford, 2006) have both annual and peren-nial populations, but most species fall clearly into one of the twocategories. In the former case, we assessed which form was morewidespread and scored the species accordingly. We also assignedtaxa to growth form categories based on field and herbariumobservations and mapped these characters on the MCC topologyto visualize the relationship of growth form to life history.
We reconstructed ancestral states for life history, comparingresults from a number of approaches that model evolution of dis-crete binary characters. We first used the R package corHMM(Beaulieu et al., 2013) to compare fit of Markov process models(Pagel, 1994) with either one or two transition rate categoriesand marginal state reconstructions. We then compared resultsfrom this method with the threshold model (Felsenstein, 2012;Revell, 2014) as implemented using a Bayesian Markov chainMonte Carlo (MCMC) approach in the function ancThresh of theR package phytools (Revell, 2012). The threshold model estimatesan underlying continuous ‘‘liability’’ character conditioned on thetip states for the discrete character that is then used to modelancestral states at internal nodes. When values for the liabilitycross an arbitrary threshold value (for binary characters this isset at zero), this is taken as a state change in the discrete trait.
MCMC chains were run for 5 ⁄ 106 steps under a Brownian motionmodel. We also inferred the most parsimonius ancestral statereconstruction for life history using the mpr function in the R pack-age APE (Swofford and Maddison, 1987; Paradis et al., 2011).
2.4. Trait correlations
To test for correlations between life history and the climatevariables MAT and MAP we used the analysis of traits (aot) func-tion in Phylocom 4.1 (Webb et al., 2008). Among other metrics,aot performs phylogenetically independent contrast (PIC) correla-tions between discrete and continuous traits by assessing contrastsof continuous variables on nodes of the tree for which all daughtertaxa have contrasting values for the discrete trait. We adopted aconservative approach by only using nodes for which all descen-dent branches on each side of a bifurcation were contrasting forthe discrete trait (i.e., ‘‘sister taxon’’ nodes of Webb et al., 2008),rather than simply requiring that no paths of any two contrastpairs not cross as described by Maddison (2000). Furthermore,because we hypothesize that the relationship between life historyand climate variables is specific to Montiaceae (i.e., other groupssuch as cacti seem to explore variation in climate based on differ-ent underlying traits), we removed all outgroups prior to analysis.Contrasts were analyzed with annuals as state ‘‘0’’ and perennialsas state ‘‘1’’, such that continuous variables that were higher inperennial taxa gave positive contrasts; this is not an assertionregarding the direction of evolutionary shifts. To account for uncer-tainty in the phylogenetic topology as well to assess the effects ofspatial error, analyses were run using the posterior tree subsampleof 500 trees, with each tree assigned a quasilocality dataset asdescribed above.
Because the ‘‘sister taxon’’ approach in Phylocom is conserva-tive and uses only a small portion of the data, we also used thephytools function threshBayes (Revell, 2012) to analyze the rela-tionship of life history with MAT and MAP. Like ancThresh,threshBayes estimates a continuous liability trait underlying a dis-crete trait, which can then be used to model correlations withother continuous traits. Four separate MCMC chains were run for107 generations, with the first 10% of steps on each chain discardedas burn-in.
2.5. Succulence
We applied the dataset of leaf saturated water content (SWC)(Ogburn and Edwards, 2013) to analyze potential climatic driversof leaf succulence across Portulacineae. SWC is a simple proxyfor succulence, measured as the mass of water in a fully hydratedleaf, divided by leaf dried mass (Ogburn and Edwards, 2012).Pruning the five-marker tree to only include species with datafor leaf SWC and climate variables resulted in a dataset with 71species. We modeled the relationship between leaf SWC and cli-mate using phylogenetic generalized least squares (PGLS)(Pinheiro et al., 2012), with Pagel’s lambda parameter to estimatethe strength of phylogenetic signal in the model residuals (Revell,2010) We hypothesized that leaf succulence is negatively relatedto MAP and positively related to precipitation seasonality(Burgess and Schmida, 1988). We also predicted a positive rela-tionship of leaf succulence to MAT and mean temperature of thecoldest quarter, as the global distribution of highly succulentplants is primarily subtropical, and temperature lows in the coldestpart of the year may be limiting to succulence at more extreme lat-itudes (Nobel, 1982; Burgess and Schmida, 1988). The associationof leaf succulence with life history was tested using the aot func-tion in phylocom 4.1 (Webb et al., 2008) and the threshBayes func-tion of the R package phytools with the same commands asdescribed above (Revell, 2012).

R. Matthew Ogburn, E.J. Edwards / Molecular Phylogenetics and Evolution 92 (2015) 181–192 185
3. Results
3.1. Phylogenetic analysis
The three-marker combined analysis of matK, ndhF, and phyCproduced a well supported backbone topology within Montiaceaethat was largely congruent between the best ML tree and theBayesian MCC tree (Fig. 2a; Fig. S1). This topology placesPhemeranthus sister to two main Montiaceae lineages (hereafter‘‘core Montiaceae’’): the first is an essentially South Americangroup consisting of Cistanthe sections Philippiamra andAmarantoideae + North American Calyptridium (hereafter ‘‘thePhilippiamra lineage’’) sister to Montiopsis + Cistanthe s.s. (Fig. 2a).The second core Montiaceae lineage consists of a predominantlyNorth American clade of Montieae (=Montia + Claytonia) + Lewisiasister to Hectorelleae, and finally Calandrinia s.s. sister to all ofthese. The backbone topology agrees with most published phyloge-nies for Montiaceae, although with increased taxon sampling andmuch improved support values.
The five-marker combined analysis, which includes sequencesof ITS and ycf3 and features more complete sampling ofMontiaceae, produced trees that were largely congruent with thebackbone topology of the three-gene analysis, but with somewhatreduced support for major clades (Fig. 2b; Fig. S2). Conflict
1
1
1
1
1
1
1
1
1
1
1
1
1
0.94
1
1
1
Claytonia
Montia
Lewisia
Hectorelleae
Parakeelya
Calandrinia s.s.
Cistanthe s.s.
Montiopsis
Phemeranthus
Philippiamra
lineage
1
100
100 100
100
100
100
98
100
100
63
100
90
99
96
97
93
100
100
(a) (
Fig. 2. Summary trees depicting relationships of major clades in Montiaceae. Bayesianbelow. (a) Three-marker tree, Bayesian consensus topology. (b) Five-marker tree, Bayesiaconflicting placement of Parakeelya on Bayesian and likelihood trees.
between Bayesian and ML analyses in the five-marker datasetwas largely concentrated toward the tips, which may be due tolow sequence divergence among certain closely related taxa(Hershkovitz, 2006).
Our analyses clearly indicate the paraphyly of South AmericanCistanthe with respect to both Montiopsis and Calyptridium.Another taxon of uncertain relationships, Lewisiopsis tweedyi, isstrongly placed as sister to Lewisia in all analyses. The primarysource of conflict between the three-marker and five-markerMCC topologies lies in the placement of the Australian cladeParakeelya, which remains problematic across datasets and analy-ses. The only genetic data for Parakeelya available in thethree-marker dataset, a single ndhF sequence of P. volubilis, groupswith Calandrinia s.s. with moderate support (0.94 PP, 63 BS). BothML and Bayesian analyses of the five-marker dataset recover amoderately supported main group of Parakeelya species (0.87 PP,68 BS) with variable placement: either weakly as sister to theHectorelleae + Lewisia s.l. + Montieae clade (0.71 PP Bayesian), ormore strongly as sister to Calandrinia s.s. + Hectorelleae + Lewisias.l. + Montieae (92 BS ML). In the five-marker ML analysis,Parakeelya volubilis groups weakly with Calandrinia s.s., as in thethree-marker analyses (59 BS) (Fig. S2). In general, more data areneeded to verify the placement of Parakeelya and to ascertainwhether they are monophyletic. Because this lineage is endemic
1
1Claytonia
Montia
Lewisia
Hectorelleae
Parakeelya
Calandrinia s.s.
Cistanthe s.s.
Montiopsis
Phemeranthus
Philippiamra
lineage
1
1
1
1
0.99
1
1
1
0.94
10.95
0.71
0.87
0.98
11
1
100
98
92
96
85
100
99
69
100
-
-
68
78
98
93
84
100
100
100
b)
posterior probabilities above branches, maximum likelihood bootstrap percentagesn consensus topology. Missing bootstrap support values on some branches reflects
186 R. Matthew Ogburn, E.J. Edwards / Molecular Phylogenetics and Evolution 92 (2015) 181–192
to Australia, a well-supported placement of Parakeelya will haveimportant implications for a more complete understanding of bio-geographic history in Montiaceae.
3.2. Climate space
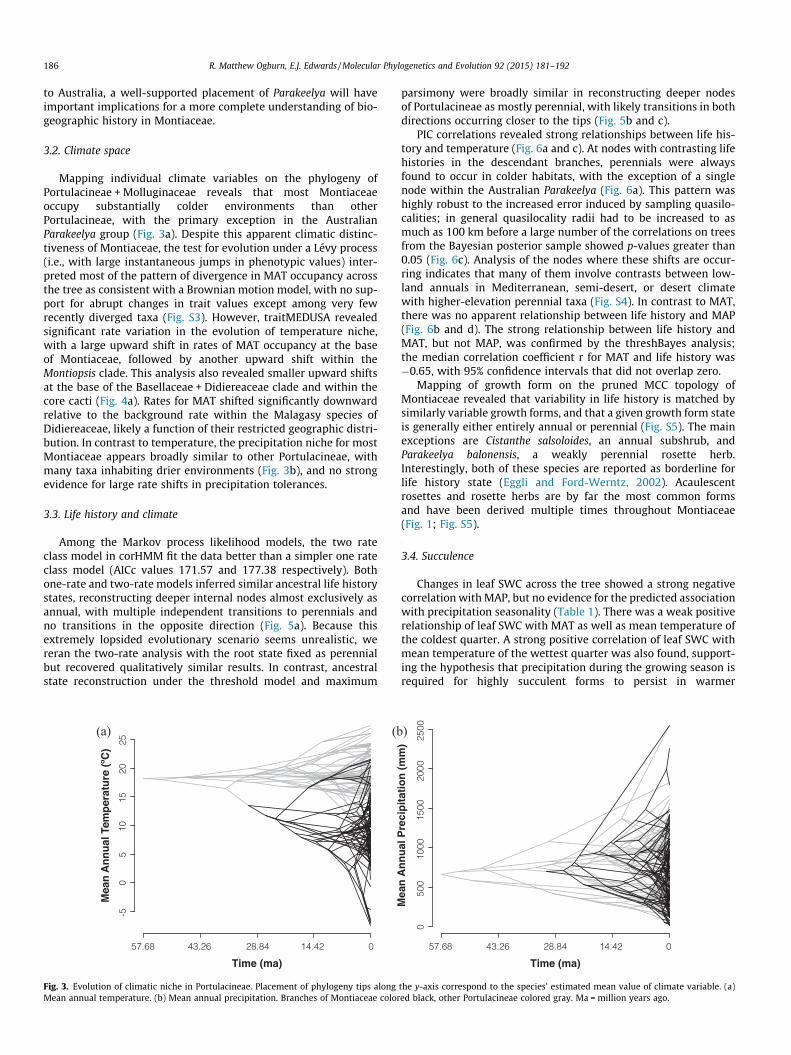
Mapping individual climate variables on the phylogeny ofPortulacineae + Molluginaceae reveals that most Montiaceaeoccupy substantially colder environments than otherPortulacineae, with the primary exception in the AustralianParakeelya group (Fig. 3a). Despite this apparent climatic distinc-tiveness of Montiaceae, the test for evolution under a Lévy process(i.e., with large instantaneous jumps in phenotypic values) inter-preted most of the pattern of divergence in MAT occupancy acrossthe tree as consistent with a Brownian motion model, with no sup-port for abrupt changes in trait values except among very fewrecently diverged taxa (Fig. S3). However, traitMEDUSA revealedsignificant rate variation in the evolution of temperature niche,with a large upward shift in rates of MAT occupancy at the baseof Montiaceae, followed by another upward shift within theMontiopsis clade. This analysis also revealed smaller upward shiftsat the base of the Basellaceae + Didiereaceae clade and within thecore cacti (Fig. 4a). Rates for MAT shifted significantly downwardrelative to the background rate within the Malagasy species ofDidiereaceae, likely a function of their restricted geographic distri-bution. In contrast to temperature, the precipitation niche for mostMontiaceae appears broadly similar to other Portulacineae, withmany taxa inhabiting drier environments (Fig. 3b), and no strongevidence for large rate shifts in precipitation tolerances.
3.3. Life history and climate
Among the Markov process likelihood models, the two rateclass model in corHMM fit the data better than a simpler one rateclass model (AICc values 171.57 and 177.38 respectively). Bothone-rate and two-rate models inferred similar ancestral life historystates, reconstructing deeper internal nodes almost exclusively asannual, with multiple independent transitions to perennials andno transitions in the opposite direction (Fig. 5a). Because thisextremely lopsided evolutionary scenario seems unrealistic, wereran the two-rate analysis with the root state fixed as perennialbut recovered qualitatively similar results. In contrast, ancestralstate reconstruction under the threshold model and maximum
Time (ma)
57.68 43.26 28.84 14.42 0
0
-5
5
1
0
15
2
0
25
(a) (b
Fig. 3. Evolution of climatic niche in Portulacineae. Placement of phylogeny tips alongMean annual temperature. (b) Mean annual precipitation. Branches of Montiaceae color
parsimony were broadly similar in reconstructing deeper nodesof Portulacineae as mostly perennial, with likely transitions in bothdirections occurring closer to the tips (Fig. 5b and c).
PIC correlations revealed strong relationships between life his-tory and temperature (Fig. 6a and c). At nodes with contrasting lifehistories in the descendant branches, perennials were alwaysfound to occur in colder habitats, with the exception of a singlenode within the Australian Parakeelya (Fig. 6a). This pattern washighly robust to the increased error induced by sampling quasilo-calities; in general quasilocality radii had to be increased to asmuch as 100 km before a large number of the correlations on treesfrom the Bayesian posterior sample showed p-values greater than0.05 (Fig. 6c). Analysis of the nodes where these shifts are occur-ring indicates that many of them involve contrasts between low-land annuals in Mediterranean, semi-desert, or desert climatewith higher-elevation perennial taxa (Fig. S4). In contrast to MAT,there was no apparent relationship between life history and MAP(Fig. 6b and d). The strong relationship between life history andMAT, but not MAP, was confirmed by the threshBayes analysis;the median correlation coefficient r for MAT and life history was�0.65, with 95% confidence intervals that did not overlap zero.
Mapping of growth form on the pruned MCC topology ofMontiaceae revealed that variability in life history is matched bysimilarly variable growth forms, and that a given growth form stateis generally either entirely annual or perennial (Fig. S5). The mainexceptions are Cistanthe salsoloides, an annual subshrub, andParakeelya balonensis, a weakly perennial rosette herb.Interestingly, both of these species are reported as borderline forlife history state (Eggli and Ford-Werntz, 2002). Acaulescentrosettes and rosette herbs are by far the most common formsand have been derived multiple times throughout Montiaceae(Fig. 1; Fig. S5).
3.4. Succulence
Changes in leaf SWC across the tree showed a strong negativecorrelation with MAP, but no evidence for the predicted associationwith precipitation seasonality (Table 1). There was a weak positiverelationship of leaf SWC with MAT as well as mean temperature ofthe coldest quarter. A strong positive correlation of leaf SWC withmean temperature of the wettest quarter was also found, support-ing the hypothesis that precipitation during the growing season isrequired for highly succulent forms to persist in warmer
Mea
n A
nn
ual
Pre
cip
itat
ion
(m
m)
Time (ma)
57.68 43.26 28.84 14.42 0
0
500
1
000
1
500
2
000
2
500
)
the y-axis correspond to the species’ estimated mean value of climate variable. (a)ed black, other Portulacineae colored gray. Ma = million years ago.

Fig. 4. Correspondence between the rate of temperature niche evolution and life history lability. Shaded background indicates Montiaceae. Taxa coded in black are perennial;in gray are annual. (a) Variation in evolutionary rate for mean annual temperature occupancy; the largest and most strongly favored shift occurs at the node subtendingMontiaceae. Legend indicates rate within colored clades relative to background evolutionary rate; for example, the rate of temperature niche evolution was estimated toincrease 9.5-fold at the base of Montiaceae. (b) Absolute value of life history liability, as estimated from the threshold model; low values are closest to the threshold,indicating taxa in which life history is most labile. (For interpretation of the references to color in this figure legend, the reader is referred to the web version of this article.)
R. Matthew Ogburn, E.J. Edwards / Molecular Phylogenetics and Evolution 92 (2015) 181–192 187
environments (Burgess and Schmida, 1988). Contrary to our fieldobservations, leaf SWC was not correlated with life history ineither the PIC or threshBayes analyses. While there did appear tobe a trend toward less succulent leaves in perennial taxa withinMontiaceae – this was the case for four of five nodes with contrast-ing life histories in the descendants in the PIC analysis, and thethreshBayes analysis had a median correlation coefficient of�0.299 with 95% confidence intervals that included zero – it islikely that our statistical power was simply too low to detect anypattern in the reduced SWC dataset.
4. Discussion
4.1. Ancestral state reconstructions
Based on the distribution of states at the tree tips, Montiaceaeappear to show substantial lability in life history relative to theirnearest relatives in Portulacineae (Fig. 5). While our sampling hereis more concentrated within Montiaceae than other Portulacineae,this pattern is not simply an artifact of sampling; most otherPortulacineae clades such as Cactaceae, Didiereaceae, Basellaceae,and Anacampserotaceae are entirely perennial, and while the pre-dominantly annual Portulaca does feature some perennial species,this variation is captured in our sampling.
Maximum likelihood ancestral reconstruction methods allow-ing for multiple evolutionary rate classes fit a model with two rates
that favors a scenario of an ancestrally annual clade that has mademultiple nonreversible transitions to a perennial strategy. Whilethis scenario is possible, it would require the perennial clades ofPortulacineae, many of which are highly woody as well, to havebeen derived repeatedly from annual ancestors (Fig. 5a).Although there are well-documented examples of woody taxaevolving repeatedly from annual, herbaceous ancestors (silver-swords and tarweeds, Plantago, Scaevola) these transitions are rel-atively rare and typically restricted to special cases such as longdistance dispersal to islands (Carlquist, 1969, 1970; Baldwin,2007). Furthermore, the presence in Montiaceae of annual taxawith vestigial tubers (independently found in nonsister speciesClaytonia saxosa and C. arenicola; Packer, 2003) hints that thesespecies were likely derived from perennial ancestors, indicatingthat a perennial-to-annual transition does in fact occur. It seemsmore likely that the result of an annual backbone is a function ofa (relatively) small tree with insufficient statistical power to accu-rately fit such a parameter-rich evolutionary model.
Another recently developed ancestral state reconstructionmethod, the threshold approach, models discrete character evolu-tion as a function of an underlying but unobserved continuous ‘‘lia-bility’’ character conditioned on the tip states of the discrete trait(Felsenstein, 2012; Revell, 2014). Contrary to Markov process mod-els in which the discrete state may change instantaneously along abranch according to its transition rate, the probability of a shift inthe discrete state depends on the distance of the liability from the
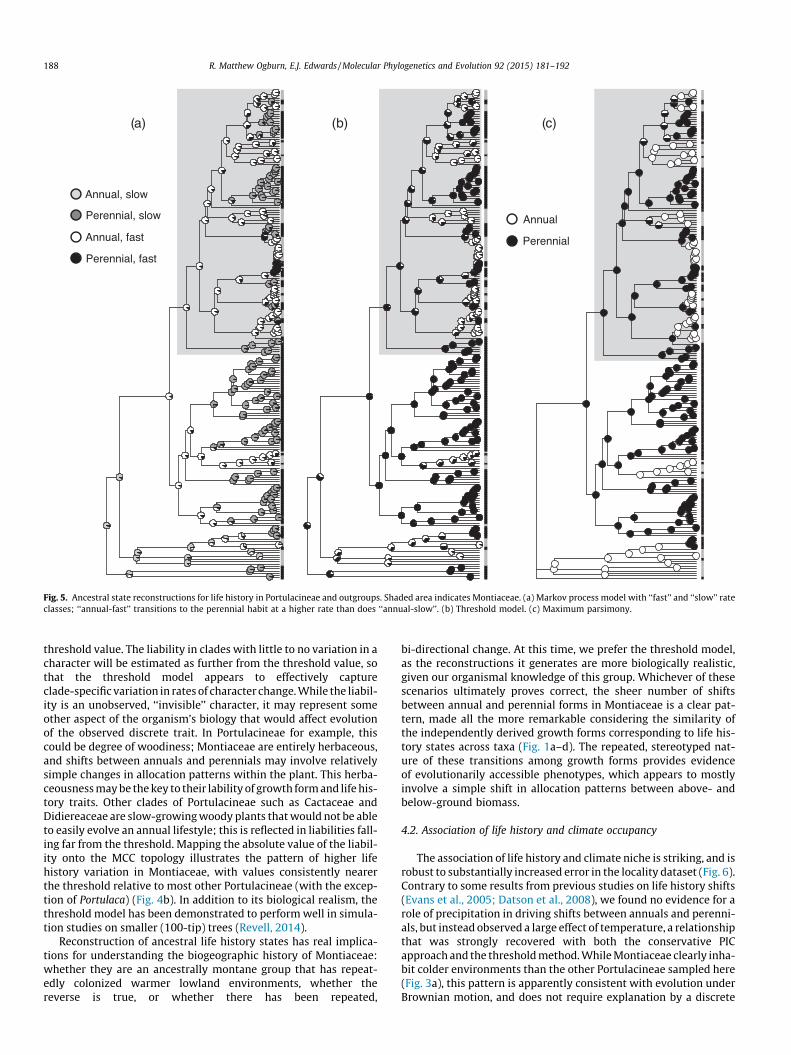
Fig. 5. Ancestral state reconstructions for life history in Portulacineae and outgroups. Shaded area indicates Montiaceae. (a) Markov process model with ‘‘fast’’ and ‘‘slow’’ rateclasses; ‘‘annual-fast’’ transitions to the perennial habit at a higher rate than does ‘‘annual-slow’’. (b) Threshold model. (c) Maximum parsimony.
188 R. Matthew Ogburn, E.J. Edwards / Molecular Phylogenetics and Evolution 92 (2015) 181–192
threshold value. The liability in clades with little to no variation in acharacter will be estimated as further from the threshold value, sothat the threshold model appears to effectively captureclade-specific variation in rates of character change. While the liabil-ity is an unobserved, ‘‘invisible’’ character, it may represent someother aspect of the organism’s biology that would affect evolutionof the observed discrete trait. In Portulacineae for example, thiscould be degree of woodiness; Montiaceae are entirely herbaceous,and shifts between annuals and perennials may involve relativelysimple changes in allocation patterns within the plant. This herba-ceousness may be the key to their lability of growth form and life his-tory traits. Other clades of Portulacineae such as Cactaceae andDidiereaceae are slow-growing woody plants that would not be ableto easily evolve an annual lifestyle; this is reflected in liabilities fall-ing far from the threshold. Mapping the absolute value of the liabil-ity onto the MCC topology illustrates the pattern of higher lifehistory variation in Montiaceae, with values consistently nearerthe threshold relative to most other Portulacineae (with the excep-tion of Portulaca) (Fig. 4b). In addition to its biological realism, thethreshold model has been demonstrated to perform well in simula-tion studies on smaller (100-tip) trees (Revell, 2014).
Reconstruction of ancestral life history states has real implica-tions for understanding the biogeographic history of Montiaceae:whether they are an ancestrally montane group that has repeat-edly colonized warmer lowland environments, whether thereverse is true, or whether there has been repeated,
bi-directional change. At this time, we prefer the threshold model,as the reconstructions it generates are more biologically realistic,given our organismal knowledge of this group. Whichever of thesescenarios ultimately proves correct, the sheer number of shiftsbetween annual and perennial forms in Montiaceae is a clear pat-tern, made all the more remarkable considering the similarity ofthe independently derived growth forms corresponding to life his-tory states across taxa (Fig. 1a–d). The repeated, stereotyped nat-ure of these transitions among growth forms provides evidenceof evolutionarily accessible phenotypes, which appears to mostlyinvolve a simple shift in allocation patterns between above- andbelow-ground biomass.
4.2. Association of life history and climate occupancy
The association of life history and climate niche is striking, and isrobust to substantially increased error in the locality dataset (Fig. 6).Contrary to some results from previous studies on life history shifts(Evans et al., 2005; Datson et al., 2008), we found no evidence for arole of precipitation in driving shifts between annuals and perenni-als, but instead observed a large effect of temperature, a relationshipthat was strongly recovered with both the conservative PICapproach and the threshold method. While Montiaceae clearly inha-bit colder environments than the other Portulacineae sampled here(Fig. 3a), this pattern is apparently consistent with evolution underBrownian motion, and does not require explanation by a discrete

-15
-10
-50
mm
per
yea
r
-600
-200
020
0
0.0 0.2 0.4 0.6 0.8 1.0
010
2030
40 Sampling radius5 km10 km50 km100 km
0.0 0.2 0.4 0.6 0.8 1.0
01
23
4
Mean annual temperature Mean annual precipitation(a) (b)
(c) (d)
Den
sity
Den
sity
P-value P-value
Fig. 6. Relationship between life history and climate in Montiaceae. (a and b) Phylogenetic independent contrasts at 10 nodes on the pruned five-marker maximum cladecredibility topology with contrasting life history states. Values represent the values of the perennials relative to the annuals. (a) Mean annual temperature. In 9 of 10contrasts, perennials lived in colder environments. (b) Mean annual precipitation, with no clear differences between annuals and perennials. (c and d) Distributions of p-values over the Bayesian posterior tree sample for the relationship between life history and climate variables as a function of increased sampling error. Dotted vertical lineindicates p = 0.05. Colored lines represent sampling radii of quasilocality datasets for which climate data were extracted. (c) Mean annual temperature. (d) Mean annualprecipitation. (For interpretation of the references to color in this figure legend, the reader is referred to the web version of this article.)
Table 1Phylogenetic regressions of log leaf saturated water content (SWC) on climate variables.
Model: SWC� p-value k Log likelihood AIC Coefficient
Mean annual precipitation 0.0005 0.79 �51.32 110.64 �0.0005Precipitation seasonality 0.49 0.75 �57.18 122.36 0.0023Mean annual temperature 0.013 0.78 �54.32 116.64 0.0437Mean temperature of coldest quarter 0.028 0.79 �55.06 118.12 0.026Mean temperature of wettest quarter 0.0043 0.77 �53.23 114.54 0.031Life history 0.18 – – – –
k = Pagel’s lambda estimated on phylogenetic model residuals. AIC = Akaike information criterion.
R. Matthew Ogburn, E.J. Edwards / Molecular Phylogenetics and Evolution 92 (2015) 181–192 189
phenotypic jump into colder climate occupancy. Interestingly how-ever, there is a strong signal of an upward shift in the rate of evolu-tion for temperature occupancy at the base of Montiaceae (Fig. 4a),corresponding to the part of the tree where most of the lability in lifehistory is found (Fig. 4b). We interpret this as showing that life his-tory lability of Montiaceae is intimately connected to their expan-sion into new climate space. This connection of life history andclimate variability is specific to Montiaceae; the second largest shiftin rate of temperature occupancy is recovered at the base of theentirely perennial core cacti, which have their ownlineage-specific means of occupying a wide range of temperatureregimes (Nobel, 1982, 1988).
The strong association of life history and temperature is consis-tent with observations that in general annual plants are infrequentcomponents of high-elevation floras (Körner, 1999), and that over-all there is a trend across many plant taxa toward greater below-ground biomass allocation at higher elevations (Clausen et al.,1948; Körner and Renhardt, 1987), as is the observed case inperennial rosette forms in Montiaceae. Selection for divergent lifehistories is predicted to depend on relative differences in adultand seedling mortality: annuals are favored in environments
where seedling survival is high and adult survival is low(Charnov and Schaffer, 1973; Stearns, 1977), such as hot desertswhere seasonal rains open up a brief window of permissive condi-tions but are otherwise high-stress habitats. Substantial leaf succu-lence common in the annual Montiaceae of the Chilean, Australian,and North American deserts is likely to be especially advantageousin these conditions, slightly extending the period during whichthese plants may complete the life cycle. In contrast, in colder envi-ronments, especially those with short growing seasons, annualsmay be less able to complete the life cycle in the time available.To compound the problem of short growing seasons, inherent rel-ative growth rates (RGR) have been shown to be negatively depen-dent on ambient temperatures (Körner and Larcher, 1988),possibly mediated by temperature-dependent increases in leafmass per area (LMA) (Poorter, 1989; Atkin et al., 1996). Short,colder growing seasons and depressed RGR will thus selectstrongly against annual life histories. Our analyses are remarkablycongruent with two other recent phylogenetic studies, in lupines(Drummond et al., 2012) and a tribe of mustards (Karl and Koch,2013), and we suspect that this may be a very general evolutionarypattern for plants.
190 R. Matthew Ogburn, E.J. Edwards / Molecular Phylogenetics and Evolution 92 (2015) 181–192
Contrary to temperature niche, Montiaceae are broadly similarto other Portulacineae in their precipitation tolerances (Fig. 3b).Throughout Portulacineae, we found a significant negative correla-tion between leaf succulence and mean annual precipitation.Somewhat surprisingly, there was no evidence for increased succu-lence in environments with more strongly seasonal precipitation,which we had predicted from an economics standpoint to increasethe selective value of water storage (Chapin et al., 1990; vonWillert et al., 1992; Ogburn and Edwards, 2010). It may be thatthe scale of precipitation seasonality captured with the BIOCLIMvariable, defined as the standard deviation of monthly precipita-tion estimates as a percentage of the annual mean of estimates(Hijmans et al., 2005), is not matched to the temporal scale of rain-fall variability that drives the evolution of succulence. As predicted,leaf succulence shows a weak positive relationship to MAT andother temperature variables. Our results were equivocal for therelationship between leaf succulence and life history inMontiaceae, but to the extent that it exists, it is likely an indirectresult of the correlations of both life history and leaf SWC withtemperature.
4.3. Yet another counterexample to phylogenetic niche conservatism
Recent work in ecology, community assembly, and biogeogra-phy has emphasized the role of niche conservatism in determiningorganismal distributions at both local and global scales(Donoghue, 2008; Crisp et al., 2009; Wiens et al., 2010). This viewexplains current distributions of taxa on the basis of phylogeneti-cally conserved traits that constrain lineages to particular environ-ments (Wiens and Donoghue, 2004). It is an interesting frameworkin which to consider the evolution of plant groups such asMontiaceae, which have diversified within the context of geologi-cal change from the Eocene onward, a period that saw extensiveactivity resulting in episodic mountain building, aridification,and other events that resulted in a climatically and topographi-cally heterogeneous environment in the Americas (Axelrod,1958; Simpson, 1983; Graham, 2009). Clearly, there are plantgroups that have diversified in a manner at least superficially con-sistent with phylogenetic niche conservatism, for example theinstances of temperate clades that have radiated at higher alti-tudes in the tropical Andes (e.g., Valeriana, Calceolaria, theOreinotinus clade of Viburnum section, Alstroemeriaceae, Azorella)(Bell and Donoghue, 2005; Cosacov et al., 2009; Sklenar et al.,2011; Chacon et al., 2012; Nicolas and Plunkett, 2012; but seeSpriggs et al. (2015) for striking, repeated niche evolution acrossViburnum as a whole).
On the other hand, there are a growing number of studies doc-umenting lineages that have increased niche disparity in responseto environmental heterogeneity, often based in some underlyingpropensity to alter life history or growth form traits (Tank andOlmstead, 2008; Jara-Arancio et al., 2013; Evans et al., 2005,2014; Heibl and Renner, 2012; Sun et al., 2012; Drummond et al.,2012; Karl and Koch, 2013). Montiaceae clearly stand as an excel-lent exemplar of this latter category, and we have demonstrated astrong link here between climate niche variation and evolutionarylability in life history and growth form. While phylogenetic nicheconservatism has surely played some role in generating global bio-diversity patterns, the flip side of the coin – niche evolution –seems likely to be just as pervasive, and understanding the factorsunderlying and enabling niche evolution in different lineages isequally important in explaining why lineages live where they do.In Montiaceae and many other lineages, we propose that an herba-ceous lifestyle may permit relatively frequent evolution betweenannual and perennial life histories, which in turn provides greaterpotential to exploit new ecological opportunity accompanying cli-matic and geological change.
Acknowledgments
We thank M. Arakaki, P. Giraldo Ramírez, M.T.K. Arroyo, I.Peralta, R. Kiesling and the herbaria at Universidad deConcepción, Chile (CONC), Museo Nacional de Historia Natural deChile (SGO), Harvard University (GH), and the Missouri BotanicalGarden (MO) for support of field work and collections research. J.Schmitt, E. Brainerd, C. Dunn, R. Bhaskar, D. Chatelet, P.-A.Christin, F. Zapata, M. Donoghue, J. de Vos, and two anonymousreviewers provided insightful comments that improved the manu-script substantially. B. Park provided a crucial data recovery assist.This work was supported in part by National Science FoundationGrant Number DEB-1026611 to EJE.
Appendix A. Supplementary material
Supplementary data associated with this article can be found, inthe online version, at http://dx.doi.org/10.1016/j.ympev.2015.06.006.
References
Applequist, W.L., Wallace, R.S., 2001. Phylogeny of the portulacaceous cohort basedon ndhF sequence data. Syst. Bot. 26, 406–419.
Applequist, W.L., Wagner, W.L., Zimmer, E.A., Nepokroeff, M., 2006. Molecularevidence resolving the systematic position of Hectorella (Portulacaceae). Syst.Bot. 31, 310–319.
Arakaki, M., Christin, P.-A., Nyffeler, R., Lendel, A., Eggli, U., Ogburn, R.M., Spriggs, E.,Moore, M.J., Edwards, E.J., 2011. Contemporaneous and recent radiations of theworld’s major succulent plant lineages. Proc. Natl. Acad. U.S. 108, 8379–8384.
Atkin, O.K., Botman, B., Lambers, H., 1996. The causes of inherently slow growth inalpine plants: an analysis based on the underlying carbon economies of alpineand lowland Poa species. Funct. Ecol. 10, 698–707.
Axelrod, D.I., 1958. Evolution of the Madro-Tertiary geoflora. Bot. Rev. 7, 433–509.Baldwin, B.G., 2007. Adaptive radiation of shrubby tarweeds (Deinandra) in the
California Islands parallels diversification of the Hawaiian silversword alliance(Compositae-Madiinae). Am. J. Bot. 94, 237–248.
Baldwin, B.G., Sanderson, M.J., 1998. Age and rate of diversification of the Hawaiiansilversword alliance (Compositae). Proc. Natl. Acad. U.S. 95, 9402–9406.
Beaulieu, J.M., O’Meara, B.C., Donoghue, M.J., 2013. Identifying hidden rate changesin the evolution of a binary morphological character: the evolution of planthabit in campanulid angiosperms. Syst. Biol. 62, 725–737.
Bell, C.D., Donoghue, M.J., 2005. Phylogeny and biogeography of Valerianaceae(Dipsacales) with special reference to the South American valerians. Organ.,Divers. Evol. 5, 147–159.
Burgess, T.L., Schmida, A., 1988. Succulent growth forms in arid environments. In:Whitehead, E.E., Hutchinson, C.F., Timmermann, B.N., Varady, R.-G. (Eds.), AridLands Today and Tomorrow. Belhaven Press, London, pp. 383–395.
Carlquist, S., 1969. Wood anatomy of Goodeniaceae and the problem of insularwoodiness. Ann. Missouri Bot. Gard. 56, 358–390.
Carlquist, S., 1970. Wood anatomy of insular species of Plantago and the problem ofraylessness. Bull. Torrey Bot. Club 97, 353–361.
Carolin, R., 1987. A review of the family Portulacaceae. Aust. J. Bot. 35, 383–412.Carr, G.D., 1987. Beggar’s ticks and tarweeds: masters of adaptive radiation. Trends
Ecol. Evol. 2, 192–195.Chacon, J., de Assis, M.C., Meerow, A.W., Renner, S.S., 2012. From East Gondwana to
Central America: historical biogeography of the Alstroemeriaceae. J. Biogeogr.39, 1806–1818.
Chapin, F.S., Schultze, E.-D., Mooney, H.A., 1990. The ecology and economics ofstorage in plants. Annu. Rev. Ecol. Syst. 21, 423–447.
Charnov, E.L., Schaffer, W.M., 1973. Life-history consequences of natural selection:Cole’s result revisited. Am. Nat. 107, 791–793.
Christin, P.A. et al., 2013. Anatomical enablers and the evolution of C4photosynthesis in grasses. Proc. Natl. Acad. Sci. U.S.A. 110, 1381–1386.
Christin, P.A. et al., 2015. Genetic enablers underlying the clustered evolutionaryorigins of C4 photosynthesis in angiosperms. Mol. Biol. Evol. http://dx.doi.org/10.1093/molbev/msu410.
Clausen, J., Keck, D.D., Hiesey, W.M., 1948. Experimental Studies on the Nature ofSpecies. III. Environmental Responses of Climatic Races of Achillea. CarnegieInstitute of Washington, Washington, DC.
Cordell, S., Goldstein, G., Mueller-Dombois, D., Webb, D., Vitousek, P.M., 1998.Physiological and morphological variation in Metrosideros polymorpha, adominant Hawaiian tree species, along an altitudinal gradient: the role ofphenotypic plasticity. Oecologia 113, 188–196.
Cosacov, A., Sérsic, A.N., Sosa, V., De-Nova, J.A., Nylinder, S., Cocucci, A.A., 2009. Newinsights into the phylogenetic relationships, character evolution, andphytogeographic patterns of Calceolaria (Calceolariaceae). Am. J. Bot. 96,2240–2255.
R. Matthew Ogburn, E.J. Edwards / Molecular Phylogenetics and Evolution 92 (2015) 181–192 191
Crisp, M.D., Arroyo, M.T.K., Cook, L.G., Gandolfo, M.A., Jordan, G.J., McGlone, M.S.,Weston, P.H., Westoby, M., Wilf, P., Linder, H.P., 2009. Phylogenetic biomeconservatism on a global scale. Nature 458, 754–756.
Cronquist, A.C., 1968. The Evolution and Classification of Flowering Plants.Houghton Mifflin, Boston.
Datson, P.M., Murray, B.G., Steiner, K.E., 2008. Climate and the evolution of annual/perennial life-histories in Nemesia (Scrophulariaceae). Plant Syst. Evol. 270, 39–57.
Donoghue, M.J., 2008. A phylogenetic perspective on the distribution of plantdiversity. Proc. Natl. Acad. U.S. 105, 11549–11555.
Donoghue, M.J., Edwards, E.J., 2014. Biome transitions and niche evolution in plants.Annu. Rev. Ecol. Evol. Syst. 45, 547–572.
Drummond, A.J., Rambaut, A., 2007. BEAST: Bayesian evolutionary analysis bysampling trees. BMC Evol. Biol. 7, 214.
Drummond, C.S., Eastwood, R.J., Miotto, S.T.S., Hughes, C.E., 2012. Multiplecontinental radiations and correlates of diversification in Lupinus(Leguminosae): testing for key innovation with incomplete taxon sampling.Syst. Biol. 61, 443–460.
Dudley, S.A., Schmitt, J.A., 1996. Testing the adaptive plasticity hypothesis: density-dependent selection on manipulated stem length in Impatiens capensis. Am. Nat.147, 445–465.
Edwards, E.J., Donoghue, M.J., 2013. Is it easy to move and easy to evolve?Evolutionary accessibility and adaptation. J. Exp. Bot. 64, 4047–4052.
Edwards, E.J., Ogburn, R.M., 2012. Angiosperm responses to a low-CO2 world: CAMand C4 photosynthesis as parallel evolutionary trajectories. Int. J. Plant Sci. 173,724–733.
Edwards, E.J., de Vos, J.M., Donoghue, M.J., 2015. Brief communications arising:doubtful pathways to cold tolerance in plants. Nature 521. http://dx.doi.org/10.1038/nature14393.
Eggli, U., Ford-Werntz, D.I., 2002. Portulacaceae. In: Eggli, U. (Ed.), The IllustratedHandbook of Succulent Plants. Springer, Berlin, pp. 370–433.
Evans, M.E.K. et al., 2005. Climate and life-history evolution in evening primroses(Oenothera, Onagraceae): a phylogenetic comparative analysis. Evolution 59,1914–1927.
Evans, M.E.K. et al., 2014. Insights on the evolution of plant succulence from aremarkable radiation in Madagascar (Euphorbia). Syst. Biol. 63,697–711.
Felsenstein, J., 2012. A comparative method for both discrete and continuouscharacters using the threshold model. Am. Nat. 179, 145–156.
Ford, D.I., 1992. Systematics and evolution of Montiopsis subgenus Montiopsis. PhD.Dissertation, Washington University in St. Louis.
Good, R., 1974. The Geography of the Flowering Plants. Longman, London.Graham, A., 2009. The Andes: a geological overview from a biological perspective.
Ann. Missouri Bot. Gard. 96, 371–385.Guilliams, C.M., 2009. Phylogenetic reconstruction, character evolution, and
conservation in the genus Calyptridium (Montiaceae). Master’s Thesis, SanDiego State University, 106 p.
Hallé, F., Oldeman, R.A.A., Tomlinson, P.B., 1978. Tropical Trees and Forests: AnArchitectural Analysis. Springer, Berlin.
Heibl, C., Renner, S.S., 2012. Distribution models and a dated phylogeny for ChileanOxalis species reveal occupation of new habitats by different lineages, not rapidadaptive radiation. Syst. Biol. 61, 823–834.
Hershkovitz, M.A., 1991. Taxonomic notes in Cistanthe, Calandrinia, and Talinum(Portulacaceae). Phytologia 70, 209–225.
Hershkovitz, M.A., 2006. Ribosomal and chloroplast DNA evidence fordiversification of western American Portulacaceae in the Andean region.Gayana Bot. 63, 13–74.
Hershkovitz, M.A., Zimmer, E.A., 1997. On the evolutionary origins of the cacti.Taxon 46, 217–232.
Hershkovitz, M.A., Zimmer, E.A., 2000. Ribosomal DNA evidence and disjunctions ofwestern American Portulacaceae. Mol. Phylogenet. Evol. 15, 419–439.
Hijmans, R.J., van Etten, J., 2012. raster: Geographic analysis and modeling withraster data. R Package Version 2.0-12. Available from: <http://CRAN.R-project.org/package=raster>.
Hijmans, R.J., Cameron, S.E., Parra, J.L., Jones, P.G., Jarvis, A., 2005. Very highresolution interpolated climate surfaces for global land areas. Int. J. Climatol. 25,1965–1978.
Jara-Arancio, P., Arroyo, M.T.K., Guerrero, P.C., Hinojosa, L.F., Arancio, G., Méndez,M.A., 2013. Phylogenetic perspectives on biome shifts in Leucocoryne (Alliaceae)in relation to climatic niche evolution in western South America. J. Biogeogr. 41,328–338.
Johnston, I.M., 1929. Papers on the flora of northern Chile. Contrib. Gray Herb.Harvard Univ. 85, 1–137.
Karl, R., Koch, M.A., 2013. A world-wide perspective on crucifer speciation andevolution: phylogenetics, biogeography and trait evolution in tribe Arabideae.Ann. Bot. 112, 983–1001.
Körner, C., 1999. Alpine Plant Life. Springer, Berlin.Körner, C., Larcher, W., 1988. Plant life in cold climates. In: Long, S.P., Woodward, F.I.
(Eds.), Plants and temperature. Symp. Soc. Exp. Biol., vol. 42. Company ofBiologists, Ltd., Cambridge, pp. 25–57.
Körner, C., Renhardt, U., 1987. Dry matter partitioning and root length/leaf arearatios in herbaceous perennial plants with diverse altitudinal distribution.Oecologia 74, 411–418.
Landis, M.J., Schraiber, J.G., Liang, M., 2013. Phylogenetic analysis using Lévyprocesses: finding jumps in the evolution of continuous traits. Syst. Biol. 62,193–204.
Lanfear, R., Calcott, B., Ho, S.Y.W., Guindon, S., 2012. PartitionFinder: combinedselection of partitioning schemes and substitution models for phylogeneticanalyses. Mol. Biol. Evol. 29, 1695–1701.
Lynch, M., Walsh, B., 1998. Genetics and Analysis of Quantitative Traits. Sinauer,Sunderland, MA.
Maddison, W.P., 2000. Testing character correlation using pairwise comparisons ona phylogeny. J. Theor. Biol. 202, 195–204.
Miller, M.A., Pfeiffer, W., Schwartz, T., 2010. Creating the CIPRES science Gatewayfor inference of large phylogenetic trees. In: Proceedings of the GatewayComputing Environments Workshop (GCE), 14 November 2010, New Orleans,LA. p. 1–8.
Nicolas, A.N., Plunkett, G.M., 2012. Untangling generic limits in Azorella, Laretia, andMulinum (Apiaceae: Azorelloideae): insights from phylogenetics andbiogeography. Taxon 61, 826–840.
Nobel, P.S., 1982. Low-temperature tolerance and cold hardening of cacti. Ecology63, 1650–1656.
Nobel, P.S., 1988. Environmental Biology of Agaves and Cacti. Cambridge UniversityPress, New York.
Nyffeler, R., Eggli, U., 2010. Disintegrating Portulacaceae: a new familialclassification of the suborder Portulacineae (Caryophyllales) based onmolecular and morphological data. Taxon 59, 227–240.
Nyffeler, R., Eggli, U., Ogburn, M., Edwards, E., 2008. Variations on a theme: repeatedevolution of succulent life forms in the Portulacineae (Caryophyllales).Haseltonia 14, 26–36.
O’Quinn, R., Hufford, L., 2005. Molecular Systematics of Montieae (Portulacaceae):implications for taxonomy. Biogeogr. Ecol.. Syst. Bot. 30, 314–331.
O’Quinn, R., Hufford, L., 2006. Shoot morphology in the Claytonia sibirica complex(Portulacaceae). Madroño 53, 1–10.
Ogburn, R.M., Edwards, E.J., 2009. Anatomical variation in Cactaceae and relatives:trait lability and evolutionary innovation. Am. J. Bot. 96, 391–408.
Ogburn, R.M., Edwards, E.J., 2010. The ecological water use strategies of succulentplants. Adv. Bot. Res. 55, 179–225.
Ogburn, R.M., Edwards, E.J., 2012. Quantifying succulence: a rapid, physiologicallymeaningful metric of plant water storage. Plant, Cell Environ. 35, 1533–1542.
Ogburn, R.M., Edwards, E.J., 2013. Repeated origin of three-dimensional venationreleases constraints on the evolution of succulence in plants. Curr. Biol. 23, 722–726.
Osborne, C.P., Beerling, D.J., Lomax, B.H., Chaloner, W.G., 2004. Biophysicalconstraints on the origin of leaves inferred from the fossil record. Proc. Natl.Acad. Sci. 101, 10360–10362.
Packer, J.G. 2003. Portulacaceae. In: Flora of North America Editorial Committee(Eds.), 1993+. Flora of North America North of Mexico, vol. 4. Oxford UniversityPress, New York.
Pagel, M., 1994. Detecting correlated evolution on phylogenies: a general methodfor the comparative analysis of discrete characters. Proc. Roy. Soc. Lond. B: Biol.Sci.. 255, 37–45.
Paradis, E., Claude, J., Strimmer, K., 2011. APE: analyses of phylogenetics andevolution in R language. Bioinformatics 20, 289–290.
Pebesma, E.J., Bivand, R.S., 2005. Classes and Methods for Spatial Data in R. R News5. Available from: <http://cran.r-project.org/doc/Rnews/>.
Pinheiro, J., Bates, D., DebRoy, S., Sarkar, D., R Development Core Team, 2012. nlme:Linear and nonlinear mixed effects models. R Package Version 3.1-104.Available from: <http://CRAN.R-project.org/package=nlme>.
Poorter, H., 1989. Interspecific variation in relative growth rate: on ecologicalcauses and physiological consequences. In: Lambers, H. (Ed.), Causes andConsequences of Variation in Growth Rate and Productivity of Higher Plants.SPB Academic Publishing, The Hague, pp. 45–68.
Price, T., 2012. Phylogeny and evolution of Phemeranthus (Montiaceae) in NorthAmerican Xeric Habitats. Electronic Theses and Dissertations. Paper 724.<http://openscholarship.wustl.edu/etd/724>.
Price, T.D., Qvarnström, A., Irwin, D.E., 2003. The role of phenotypic plasticity indriving genetic evolution. Proc. Roy. Soc. Lond. B: Biol. Sci. 270, 1433–1440.
Reiche, C., 1898. Flora de Chile. Imprenta Cervantes, Santiago.Revell, L.J., 2010. Phylogenetic signal and linear regression on species data. Methods
Ecol. Evol. 1, 319–329.Revell, L.J., 2012. Phytools: an R package for phylogenetic comparative biology
(among other things). Methods Ecol. Evol. 3, 217–223.Revell, L.J., 2014. Ancestral character estimation under the threshold model from
quantitative genetics. Evolution 68, 743–759.Riedl, R., 1978. Order in Living Organisms: A Systems Analysis of Evolution. Wiley,
New York.Sage, R.F., 2004. The evolution of C4 photosynthesis. New Phytol. 161, 341–370.Simpson, B.B., 1983. A historical phytogeography of the high Andean flora. Rev. Chil.
Hist. Nat. 56, 109–122.Sklenar, P., Duskova, E., Balslev, H., 2011. Tropical and temperate: evolutionary
history of páramo flora. Bot. Rev. 77, 71–108.Spriggs, E.A., Clement, W.L., Sweeney, P.W., Madriñan, S., Edwards, E.J., Donoghue,
M.J., 2015. Temperate radiations and dying embers of a tropical past: thediversification of Viburnum. New Phytol. 207, 340–354.
Stamatakis, A., 2006. RAxML-VI-HPC: maximum likelihood-based phylogeneticanalyses with thousands of taxa and mixed models. Bioinformatics 22, 2688–2690.
Stearns, S.C., 1977. The evolution of life history traits: a critique of the theory and areview of the data. Annu. Rev. Ecol. Syst. 8, 145–171.
Stebbins, G.L., 1974. Flowering Plants: Evolution Above the Species Level. HarvardUniversity Press, Cambridge, MA.

192 R. Matthew Ogburn, E.J. Edwards / Molecular Phylogenetics and Evolution 92 (2015) 181–192
Sun, Y., Wang, A., Wan, D., Wang, Q., Liu, J., 2012. Rapid radiation of Rheum(Polygonaceae) and parallel evolution of morphological traits. Mol. Phylogenet.Evol. 63, 150–158.
Swofford, D.L., Maddison, W.P., 1987. Reconstructing ancestral character statesunder Wagner parsimony. Math. Biosci. 87 (199), 229.
Tank, D.C., Olmstead, R.G., 2008. From annuals to perennials: phylogeny of subtribeCastillejinae (Orobanchaceae). Am. J. Bot. 95, 608–625.
Thomas, G.H., Freckleton, R.P., 2012. MOTMOT: models of trait macroevolution ontrees. Methods Ecol. Evol. 3, 145–151.
Von Willert, D.J., Eller, B.M., Werger, M.J.A., Brinckmann, E., Ihlenfeldt, H.-D., 1992.Life Strategies of Succulents in Deserts: With Special Reference to the NamibDesert. Cambridge University Press, Cambridge.
Wagner, G.P., Laublicher, M.D., 2004. Rupert Riedl and the re-synthesis ofevolutionary biology: body plans and evolvability. J. Exp. Zool. 302b, 92–102.
Webb, C.O., Ackerly, D.D., Kembel, S.W., 2008. Phylocom: software for the analysisof phylogenetic community structure and trait evolution. Bioinformatics 24,2098–2100.
Wiens, J.J., Donoghue, M.J., 2004. Historical biogeography, ecology, and speciesrichness. Trends Ecol. Evol. 19, 639–644.
Wiens, J.J., Ackerly, D.D., Allen, A.P., Anacker, B.L., Buckley, L.B., Cornell, H.V.,Damaschen, E.I., Davis, T.J., Grytnes, J.-A., Harrison, S.P., et al., 2010. Nicheconservatism as an emerging principle in ecology and conservation biology.Ecol. Lett. 13, 1310–1324.


![[MP] 02 - Phylogenetics - biologia.campusnet.unito.it · Molecular Phylogenetics Basis of Molecular Phylogenies Overview ¾Phylogenetics Definitions ¾Genetic Variation and Evolution](https://img.pdfslide.net/doc/110x75/5c6216d809d3f238158b4601/mp-02-phylogenetics-molecular-phylogenetics-basis-of-molecular-phylogenies.jpg)