Embed Size (px)
Citation preview
Monitoring Road Works Contracts and Unit Costs
in Sub-Saharan Africa for Enhanced Governance
Cesar Queiroz Consultant, former World Bank
Highways Adviser Dar es Salaam, Tanzania
July 2, 2012
Tanzania Roads Fund Board
Construction and Maintenance Unit Costs Workshop
8/10/2012 2
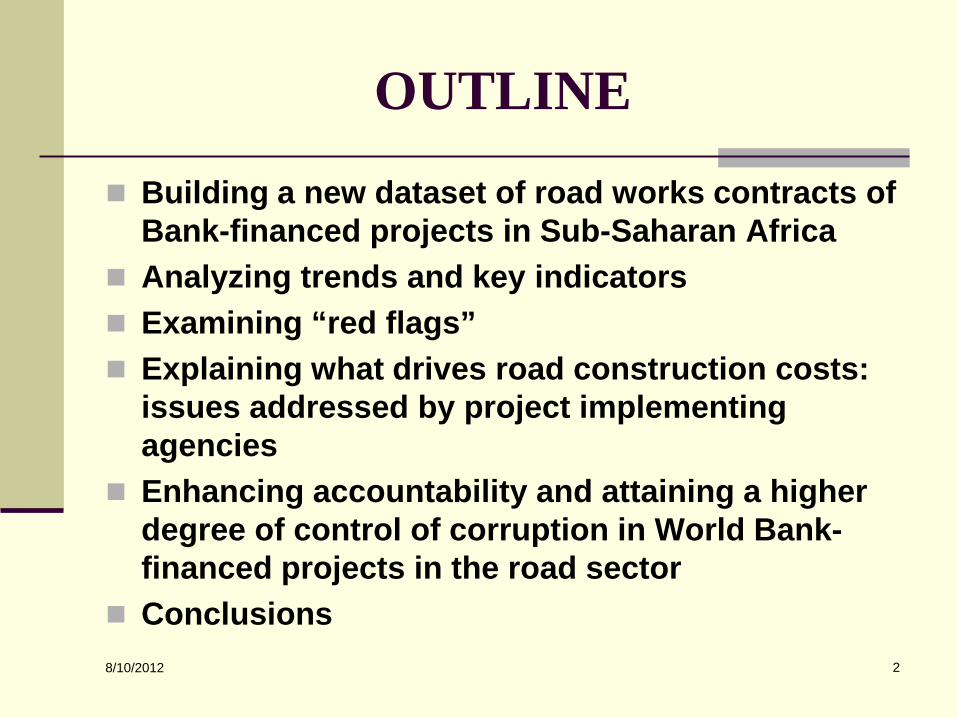
OUTLINE
Building a new dataset of road works contracts of Bank-financed projects in Sub-Saharan Africa
Analyzing trends and key indicators Examining “red flags” Explaining what drives road construction costs:
issues addressed by project implementing agencies
Enhancing accountability and attaining a higher degree of control of corruption in World Bank-financed projects in the road sector
Conclusions

8/10/2012 3
A SPECIALIZED DATABASE
109 completed and on-going road and bridge works contracts
76 supervision consultancy contracts for relevant road works
Signed between 1999 and 2007
From 22 projects financed by the World Bank
Range of works contracts: From US$595,518 to
US$58,436,429
For 13 countries in Sub-Saharan Africa:
Congo Democratic Republic of
Congo Ethiopia Ghana Kenya Malawi Mauritania Mozambique Madagascar Nigeria Tanzania Uganda Zambia
8/10/2012 4
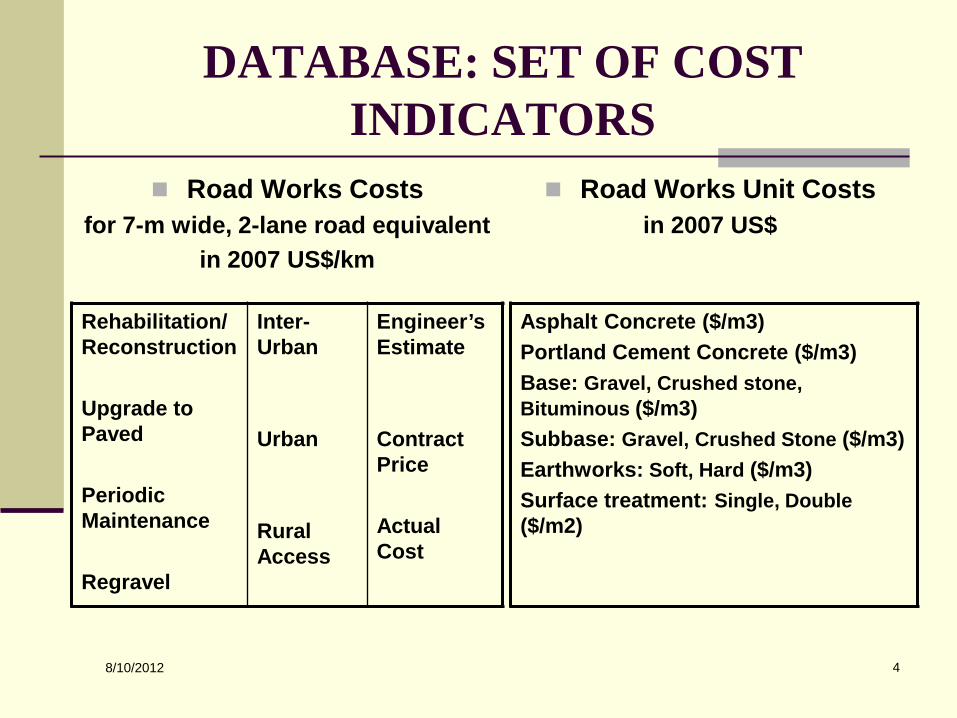
DATABASE: SET OF COST INDICATORS
Road Works Unit Costs in 2007 US$
Road Works Costs for 7-m wide, 2-lane road equivalent
in 2007 US$/km
Rehabilitation/Reconstruction Upgrade to Paved Periodic Maintenance Regravel
Inter-Urban Urban Rural Access
Engineer’sEstimate Contract Price Actual Cost
Asphalt Concrete ($/m3) Portland Cement Concrete ($/m3) Base: Gravel, Crushed stone, Bituminous ($/m3) Subbase: Gravel, Crushed Stone ($/m3) Earthworks: Soft, Hard ($/m3) Surface treatment: Single, Double ($/m2)
8/10/2012 5
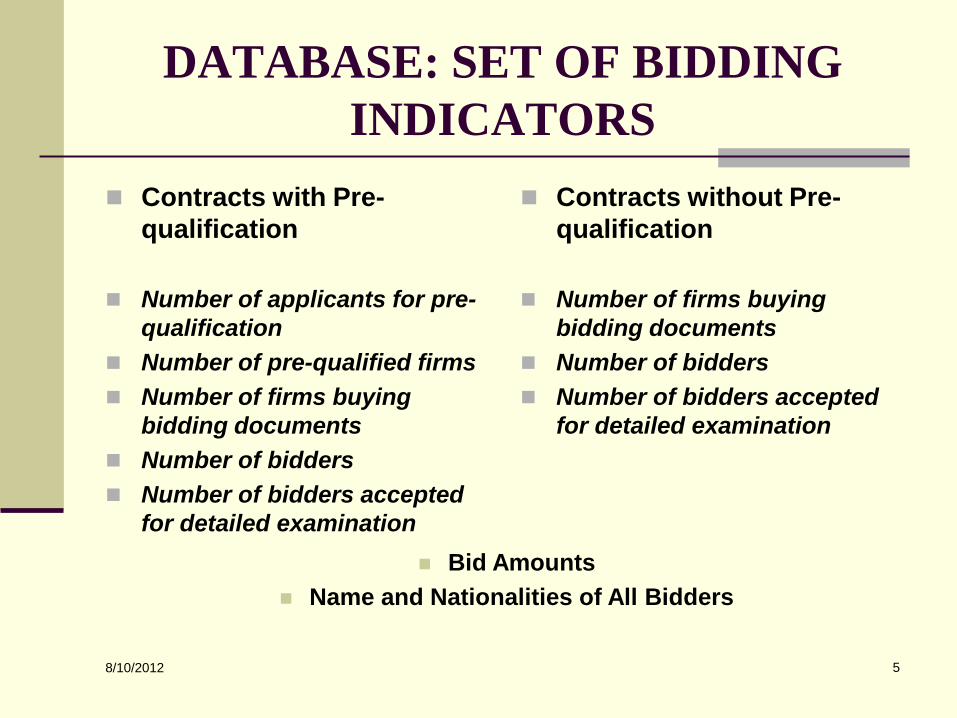
DATABASE: SET OF BIDDING INDICATORS
Contracts with Pre-qualification
Contracts without Pre-qualification
Number of applicants for pre-qualification
Number of pre-qualified firms Number of firms buying
bidding documents Number of bidders Number of bidders accepted
for detailed examination
Number of firms buying bidding documents
Number of bidders Number of bidders accepted
for detailed examination
Bid Amounts Name and Nationalities of All Bidders

8/10/2012 6
DATABASE: SET OF OTHER INDICATORS
DATES Bid Opening Date Contract Signing Date Contract Completion Date Delays in Completion of Work
SUPERVISION CONSULTANCY Names and Nationalities of Supervision Consultants
Supervision Contract Amount Actual Supervision Contract Amount

8/10/2012 7
KEY STATISTICAL TRENDS
The road sector contracting of Bank-financed operations is characterized by a limited number of firms dominating large-scale works
The market is split between African firms and mainly Chinese and European contractors
The largest contracts are generally awarded to international contractors, in particular Chinese
Percentage of Contracts by Geographical Group
Share of Contract Totals by Geographical Group
18%
45%
24%
4%8%
Local
China
OECD
Other African
Other

8/10/2012 8
KEY TRENDS: BIDDING PATTERN CONTRACTS WITH PRE-QUALIFICATION
About half of the pre-qualified firms do not bid The overall number of pre-qualified firms to bid for large works
seems competitive (more than 6 firms on average). However, the actual participation in tenders is quite low
Average Number of Pre-qualified Firms, Bidders, and Bidders Accepted for Detailed Examination
0
2
4
6
8
10
12
14
Ethiopia Ghana Kenya Nigeria Tanzania Uganda Congo (DRC)
Pre-qualif ied f irms Bidders Bidders accepted for detailed examination

8/10/2012 9
KEY TRENDS: BIDDING PATTERN CONTRACTS WITHOUT PRE-QUALIFICATION
Half or more firms buying bidding documents do not bid in the reviewed contracts in Mozambique, Madagascar, DRC, Zambia, and Malawi
Average Number of Firms Buying Bidding Documents, Bidders, and Bidders Accepted for Detailed Examination, by Country
0
5
10
15
20
25
Congo
Congo
(DRC)
Ethiopia
Ghana
Madaga
scar
Malawi
Mozam
bique
Nigeria
Tanza
nia
Zambia
Firms buying bidding documents Bidders Bidders accepted for detailed examination

8/10/2012 10
KEY TRENDS: BIDDING PATTERN CONTRACT VALUE AND ENGINEER’S ESTIMATE
Several road works contract values exceed the engineer’s estimate by more than 30 percent
Difference between Contract Values and Engineer’s Estimates, Averages and Ranges
(0.9% to 41.6%)
(-24.4% to 99.3)
(-0.8% to -19.5)
(3.6% to 57%) (-9.1% to 64.8%)
(-1.2% to 48.9%)
(-13% to 31.4%) (-15.7% to 69.9%)
(-47.1% to 39.5%)
(-18% to 40%)
8/10/2012 11
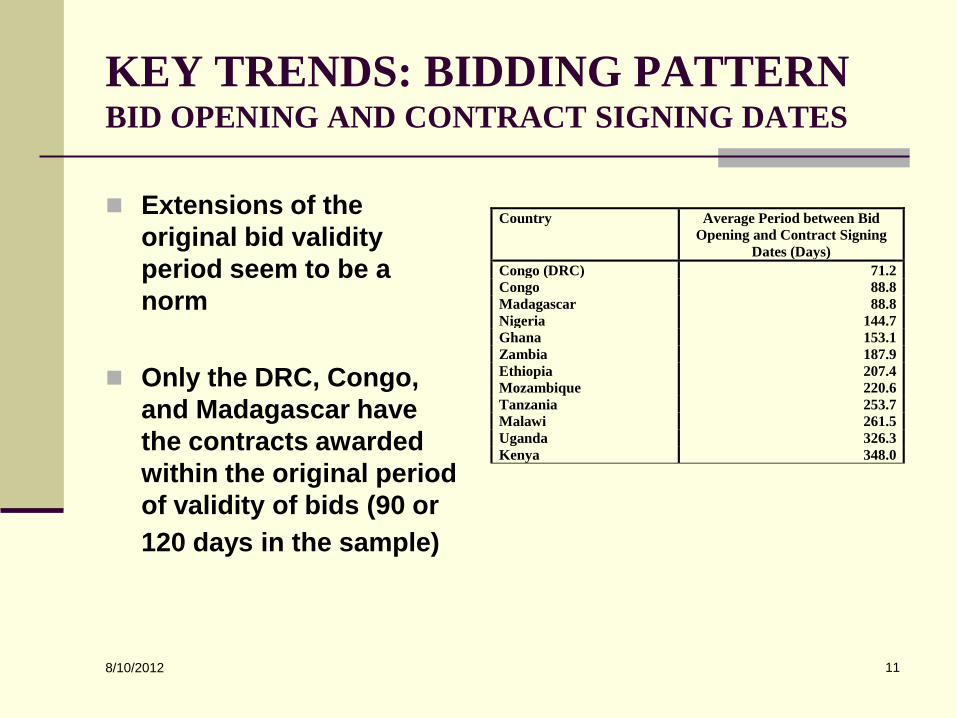
KEY TRENDS: BIDDING PATTERN BID OPENING AND CONTRACT SIGNING DATES
Extensions of the original bid validity period seem to be a norm
Only the DRC, Congo,
and Madagascar have the contracts awarded within the original period of validity of bids (90 or 120 days in the sample)
Country Average Period between Bid Opening and Contract Signing
Dates (Days) Congo (DRC) 71.2 Congo 88.8 Madagascar 88.8 Nigeria 144.7 Ghana 153.1 Zambia 187.9 Ethiopia 207.4 Mozambique 220.6 Tanzania 253.7 Malawi 261.5 Uganda 326.3 Kenya 348.0
8/10/2012 12
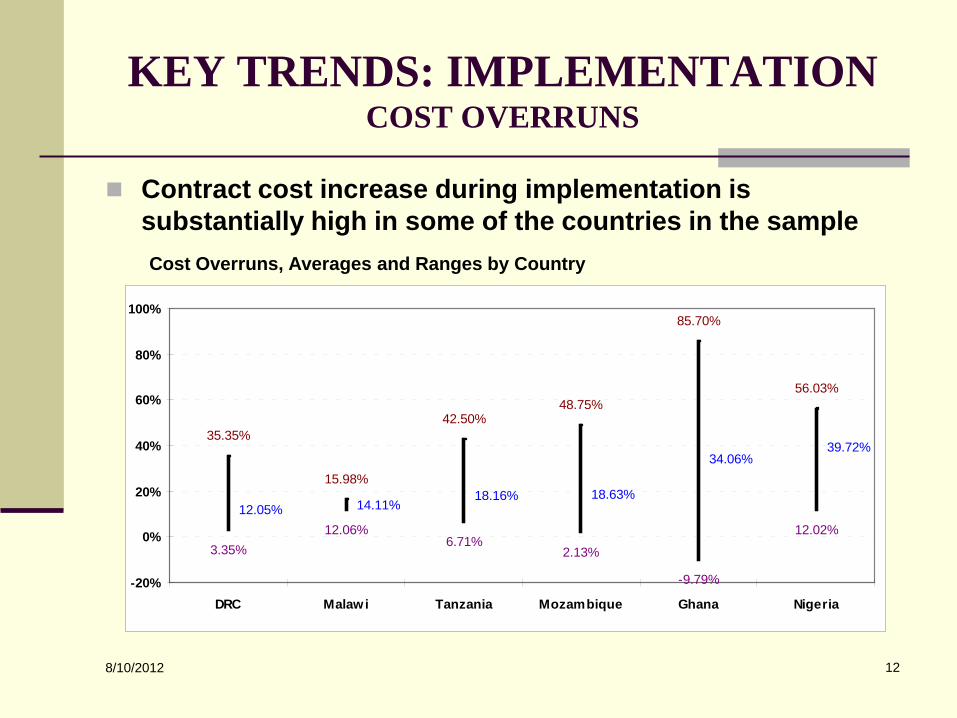
KEY TRENDS: IMPLEMENTATION COST OVERRUNS
Contract cost increase during implementation is substantially high in some of the countries in the sample
Cost Overruns, Averages and Ranges by Country
3.35%12.06%
6.71%2.13%
-9.79%
12.02%12.05% 14.11%
18.16% 18.63%
34.06%39.72%
35.35%
15.98%
42.50%48.75%
85.70%
56.03%
-20%
0%
20%
40%
60%
80%
100%
DRC Malawi Tanzania Mozambique Ghana Nigeria
8/10/2012 13
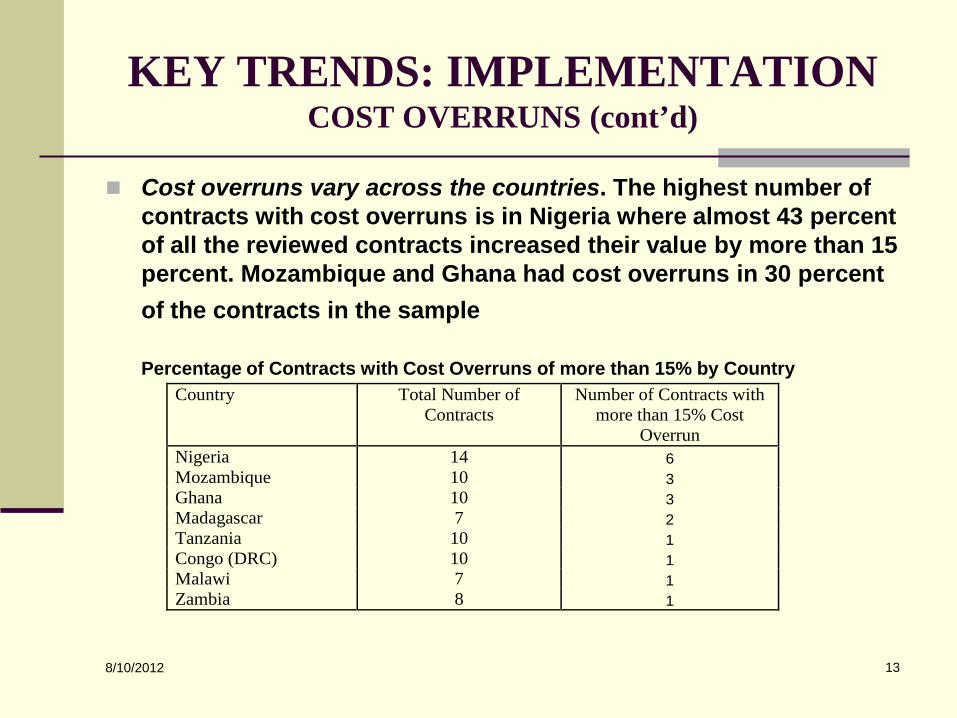
KEY TRENDS: IMPLEMENTATION COST OVERRUNS (cont’d)
Cost overruns vary across the countries. The highest number of contracts with cost overruns is in Nigeria where almost 43 percent of all the reviewed contracts increased their value by more than 15 percent. Mozambique and Ghana had cost overruns in 30 percent of the contracts in the sample
Percentage of Contracts with Cost Overruns of more than 15% by Country
Country Total Number of Contracts
Number of Contracts with more than 15% Cost
Overrun Nigeria 14 6 Mozambique 10 3 Ghana 10 3 Madagascar 7 2 Tanzania 10 1 Congo (DRC) 10 1 Malawi 7 1 Zambia 8 1
8/10/2012 14
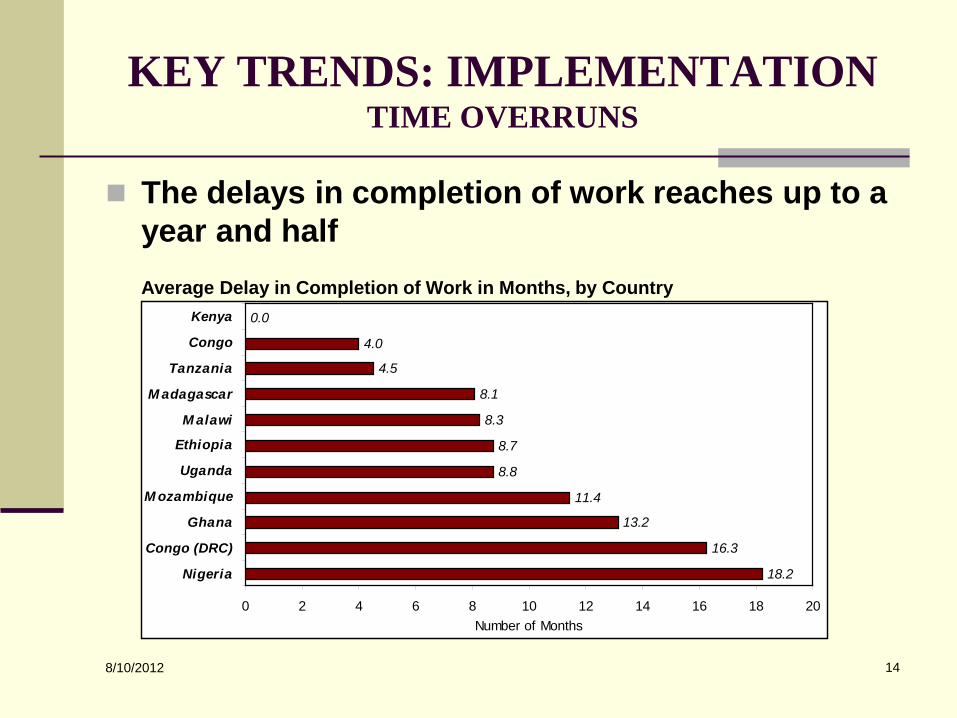
KEY TRENDS: IMPLEMENTATION TIME OVERRUNS
The delays in completion of work reaches up to a year and half
Average Delay in Completion of Work in Months, by Country
18.2
16.3
13.2
11.4
8.8
8.7
8.3
8.1
4.5
4.0
0.0
0 2 4 6 8 10 12 14 16 18 20
Nigeria
Congo (DRC)
Ghana
M ozambique
Uganda
Ethiopia
M alawi
M adagascar
Tanzania
Congo
Kenya
Number of Months
8/10/2012 15
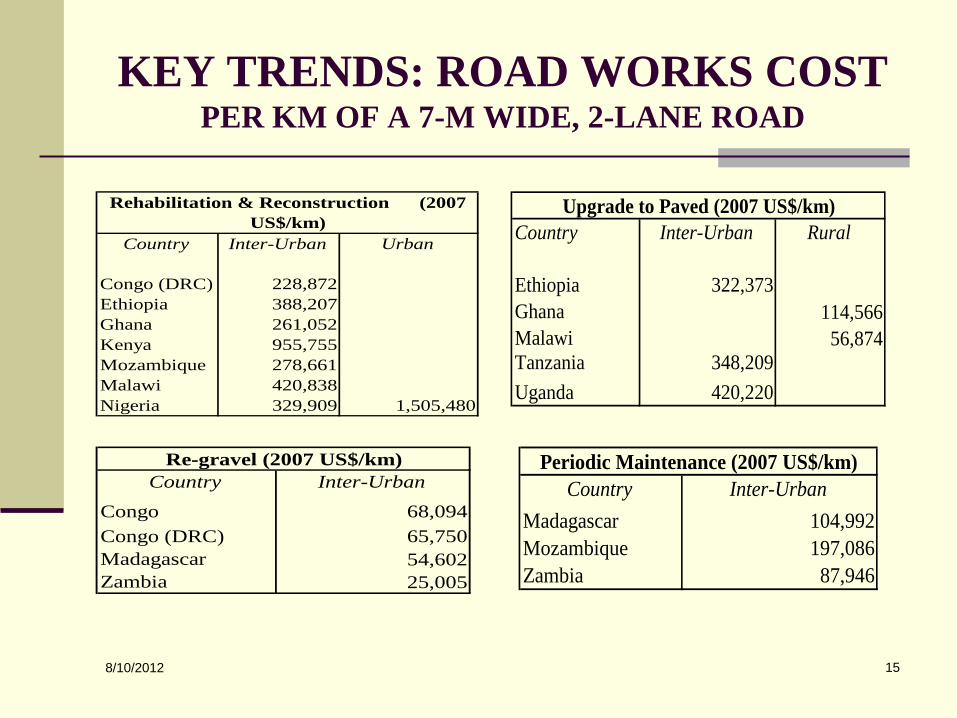
KEY TRENDS: ROAD WORKS COST PER KM OF A 7-M WIDE, 2-LANE ROAD
Country Inter-Urban Urban
Congo (DRC) 228,872Ethiopia 388,207Ghana 261,052Kenya 955,755Mozambique 278,661Malawi 420,838Nigeria 329,909 1,505,480
Rehabilitation & Reconstruction (2007 US$/km) Country Inter-Urban Rural
Ethiopia 322,373Ghana 114,566Malawi 56,874Tanzania 348,209Uganda 420,220
Upgrade to Paved (2007 US$/km)
Country Inter-Urban
Congo 68,094Congo (DRC) 65,750Madagascar 54,602Zambia 25,005
Re-gravel (2007 US$/km)
Country Inter-UrbanMadagascar 104,992Mozambique 197,086Zambia 87,946
Periodic Maintenance (2007 US$/km)

8/10/2012 16
KEY TRENDS: ROAD WORKS COST PER KM OF A 7-M WIDE, 2-LANE INTER-URBAN
ROAD A wider range of the average costs per km is observed for
the re-gravel and periodic maintenance works; the range is relatively narrower for the upgrade to paved and rehabilitation/reconstruction works
Cost per km of a 2-Lane Road by Type of Work for Inter-Urban Roads (2007 US$/km) Type of Work Q1 Mean Q3
Re-gravel 28,877 66,270 83,973 Rehabilitation/Reconstruction 221,823 397,899 450,801 Periodic Maintenance 78,065 133,135 183,838 Upgrade to Paved 296,516 360,071 403,830

8/10/2012 17
KEY TRENDS: UNIT COSTS ASPHALT CONCRETE AND PORTLAND
CEMENT CONCRETE (2007 US$/M3) Large variations are observed in the unit costs of road
works across the countries in the sample Asphalt Concrete Portland Cement
Concrete(US$/m3) (US$/m3)
Congo (DRC) 275.9Ethiopia 131.2 200.2Ghana 139.2 108.6Kenya 180 170.7Madagascar 146.2 191.9Mozambique 154.4 160.6Malawi 220.6 136.3Nigeria 290.2Tanzania 182.8 177.8Zambia 172.6Mauritania 212.3
8/10/2012 18
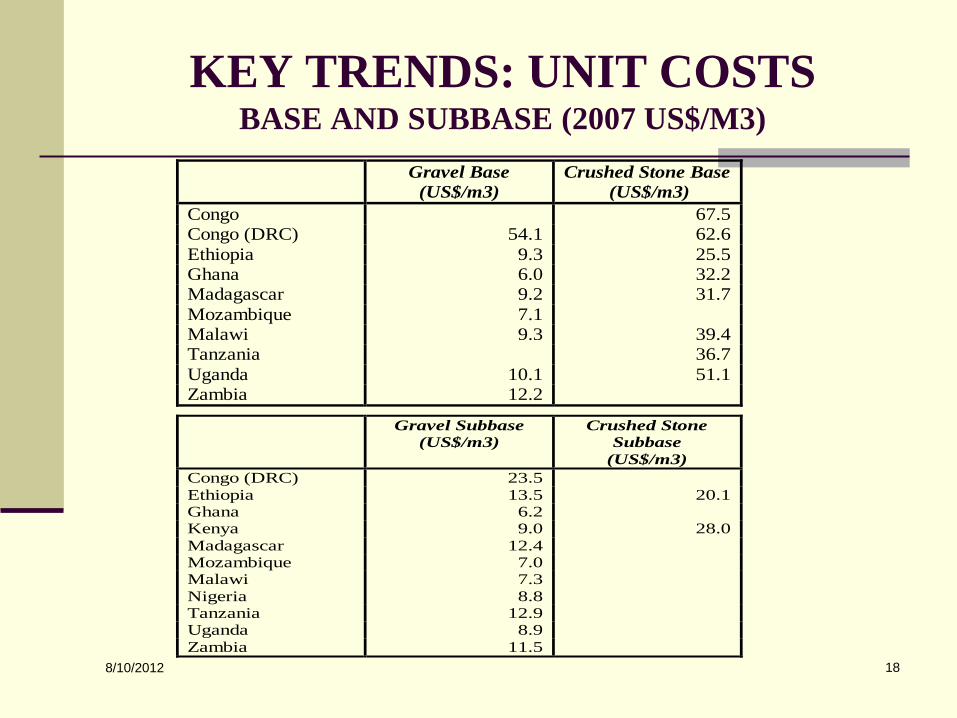
KEY TRENDS: UNIT COSTS BASE AND SUBBASE (2007 US$/M3)
Gravel Base (US$/m3)
Crushed Stone Base (US$/m3)
Congo 67.5 Congo (DRC) 54.1 62.6 Ethiopia 9.3 25.5 Ghana 6.0 32.2 Madagascar 9.2 31.7 Mozambique 7.1 Malawi 9.3 39.4 Tanzania 36.7 Uganda 10.1 51.1 Zambia 12.2
Gravel Subbase (US$/m3)
Crushed Stone Subbase
(US$/m3) Congo (DRC) 23.5 Ethiopia 13.5 20.1 Ghana 6.2 Kenya 9.0 28.0 Madagascar 12.4 Mozambique 7.0 Malawi 7.3 Nigeria 8.8 Tanzania 12.9 Uganda 8.9 Zambia 11.5
8/10/2012 19
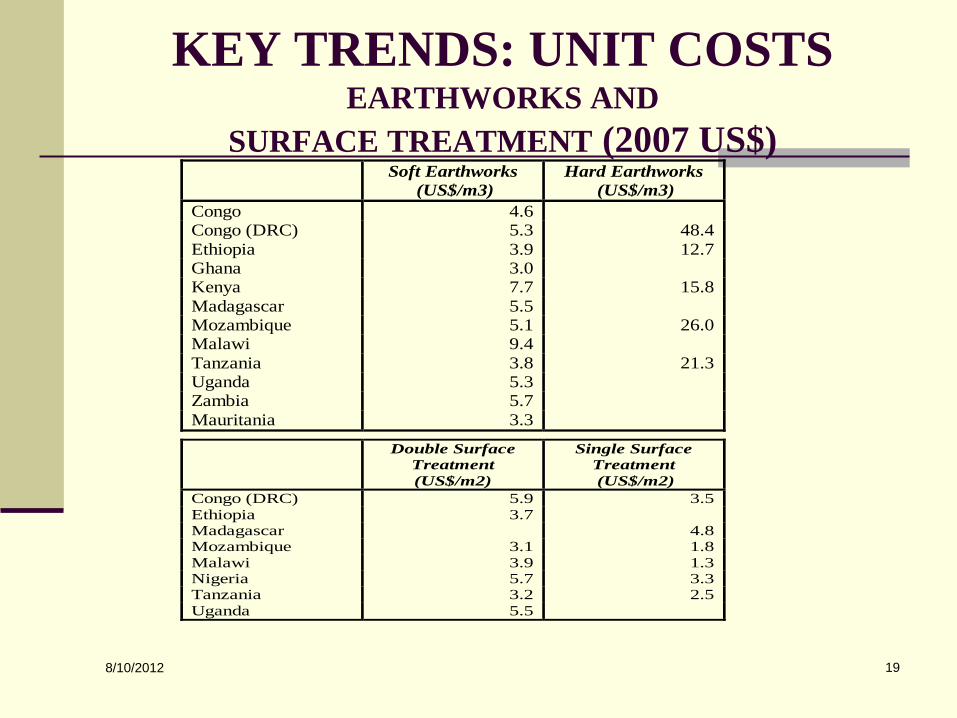
KEY TRENDS: UNIT COSTS EARTHWORKS AND
SURFACE TREATMENT (2007 US$) Soft Earthworks
(US$/m3) Hard Earthworks
(US$/m3) Congo 4.6 Congo (DRC) 5.3 48.4 Ethiopia 3.9 12.7 Ghana 3.0 Kenya 7.7 15.8 Madagascar 5.5 Mozambique 5.1 26.0 Malawi 9.4 Tanzania 3.8 21.3 Uganda 5.3 Zambia 5.7 Mauritania 3.3
Double Surface Treatment (US$/m2)
Single Surface Treatment (US$/m2)
Congo (DRC) 5.9 3.5 Ethiopia 3.7 Madagascar 4.8 Mozambique 3.1 1.8 Malawi 3.9 1.3 Nigeria 5.7 3.3 Tanzania 3.2 2.5 Uganda 5.5
8/10/2012 20
KEY STATISTICAL TRENDS BY GEOGRAPHICAL GROUP OF CONTRACTORS
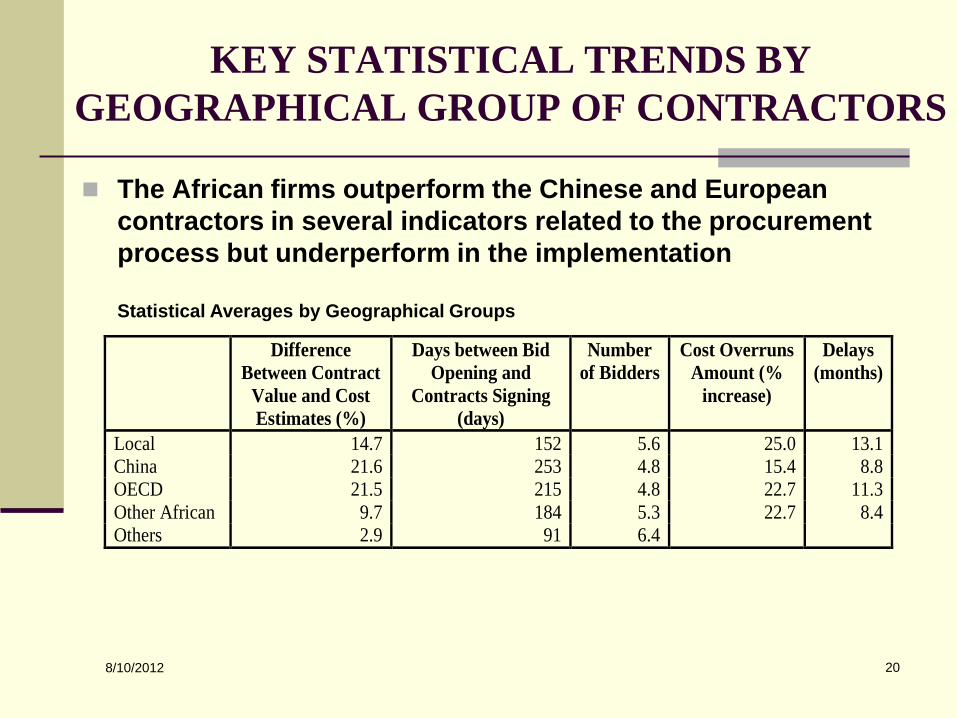
The African firms outperform the Chinese and European contractors in several indicators related to the procurement process but underperform in the implementation
Statistical Averages by Geographical Groups Difference
Between Contract Value and Cost Estimates (%)
Days between Bid Opening and
Contracts Signing (days)
Number of Bidders
Cost Overruns Amount (%
increase)
Delays (months)
Local 14.7 152 5.6 25.0 13.1 China 21.6 253 4.8 15.4 8.8 OECD 21.5 215 4.8 22.7 11.3 Other African 9.7 184 5.3 22.7 8.4 Others 2.9 91 6.4
8/10/2012 21
KEY TRENDS BY GEOGRAPHICAL GROUP OF CONTRACTORS:
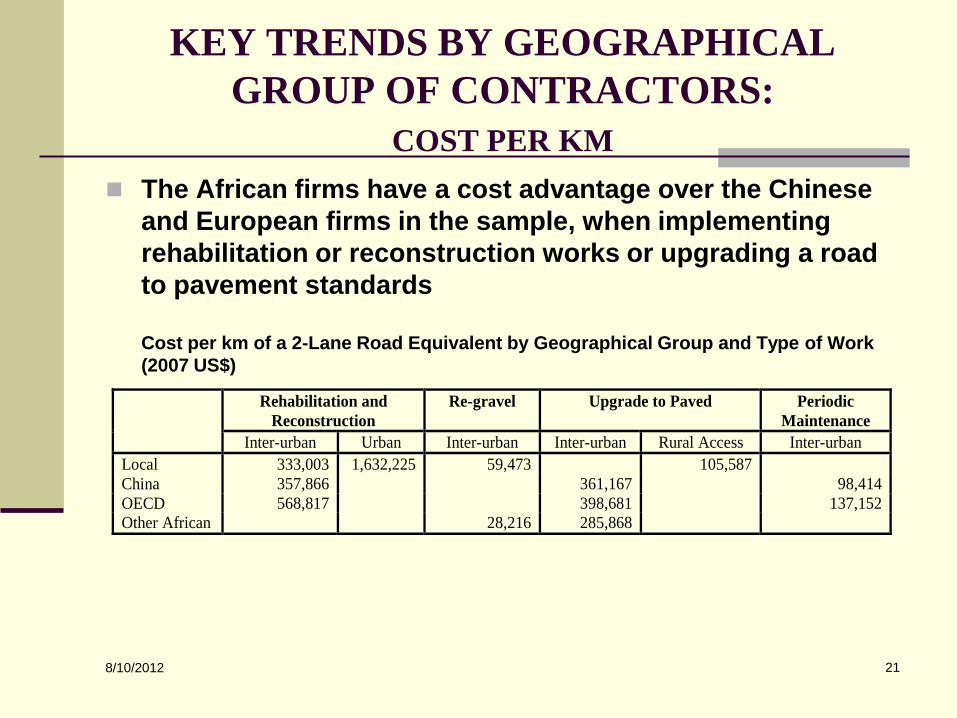
COST PER KM The African firms have a cost advantage over the Chinese
and European firms in the sample, when implementing rehabilitation or reconstruction works or upgrading a road to pavement standards
Cost per km of a 2-Lane Road Equivalent by Geographical Group and Type of Work
(2007 US$) Rehabilitation and
Reconstruction Re-gravel Upgrade to Paved Periodic
Maintenance
Inter-urban Urban Inter-urban Inter-urban Rural Access Inter-urban Local 333,003 1,632,225 59,473 105,587 China 357,866 361,167 98,414 OECD 568,817 398,681 137,152 Other African 28,216 285,868
8/10/2012 22
LEADING ROAD WORKS CONTRACTORS
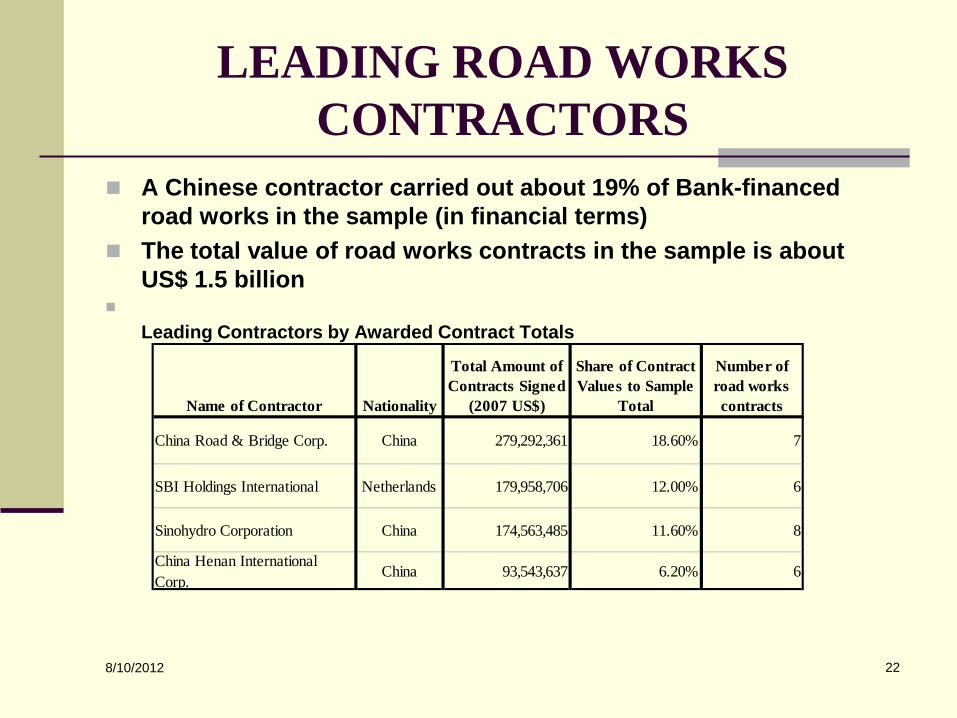
A Chinese contractor carried out about 19% of Bank-financed road works in the sample (in financial terms)
The total value of road works contracts in the sample is about US$ 1.5 billion
Leading Contractors by Awarded Contract Totals
Name of Contractor Nationality
Total Amount of Contracts Signed
(2007 US$)
Share of Contract Values to Sample
Total
Number of road works contracts
China Road & Bridge Corp. China 279,292,361 18.60% 7
SBI Holdings International Netherlands 179,958,706 12.00% 6
Sinohydro Corporation China 174,563,485 11.60% 8
China Henan International Corp.
China 93,543,637 6.20% 6
8/10/2012 23
SUPERVISION CONSULTANCY CONTRACTS: RATIOS
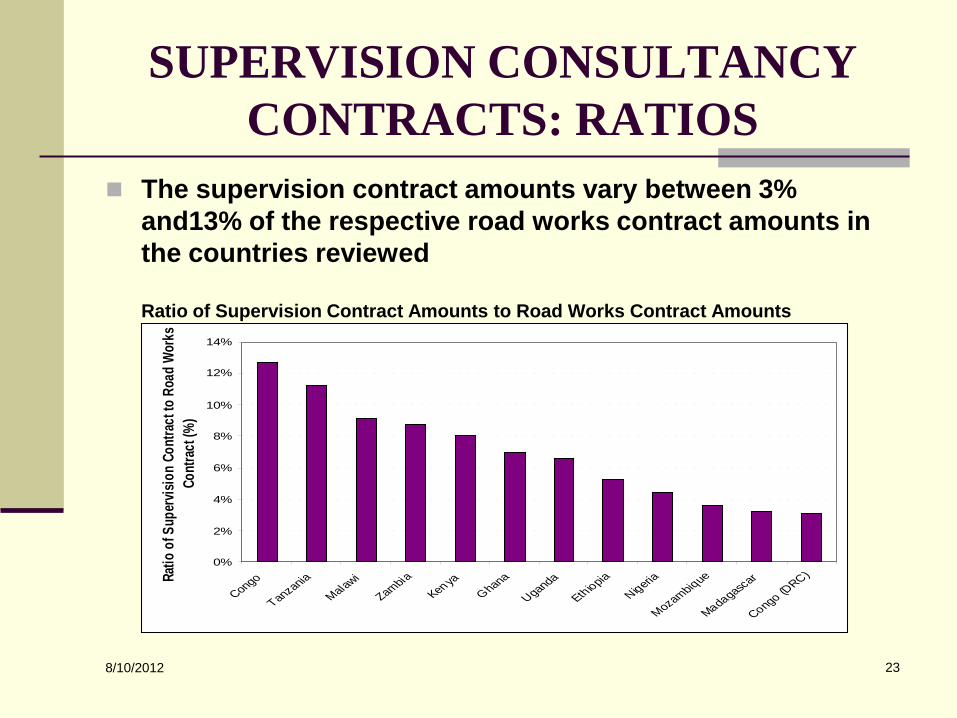
The supervision contract amounts vary between 3% and13% of the respective road works contract amounts in the countries reviewed
Ratio of Supervision Contract Amounts to Road Works Contract Amounts
0%
2%
4%
6%
8%
10%
12%
14%
Congo
TanzaniaMalawi
ZambiaKenya
Ghana
Uganda
EthiopiaNigeria
Mozambique
Madagascar
Congo (DRC)Ra
tio o
f Sup
ervis
ion
Cont
ract
to R
oad
Wor
ks
Cont
ract
(%)
8/10/2012 24
SUPERVISION CONSULTANCY CONTRACTS: COST PER KM
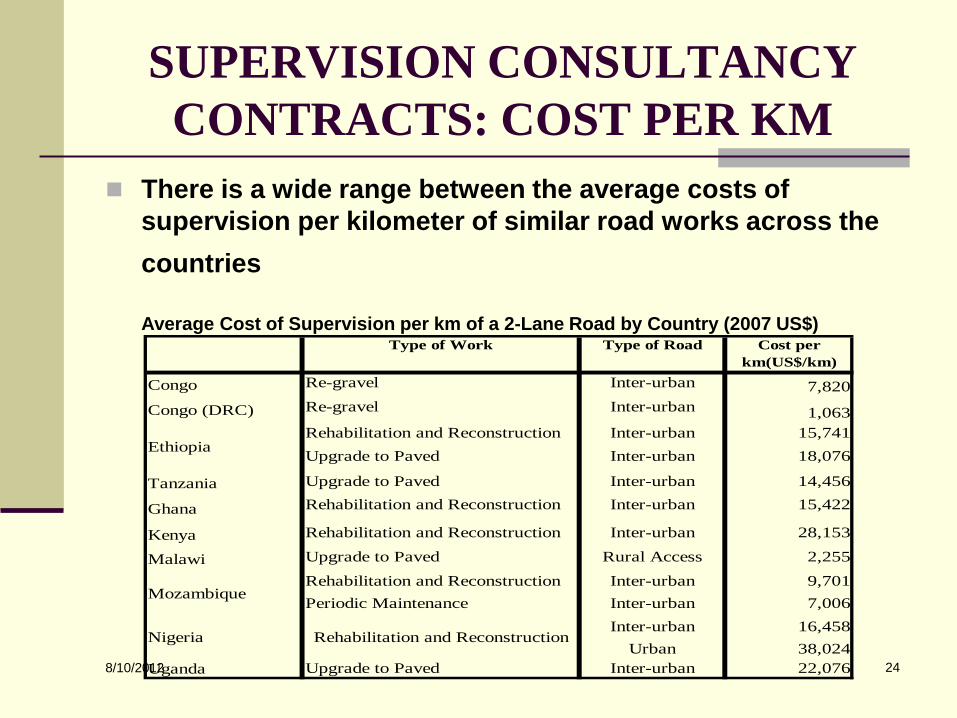
There is a wide range between the average costs of supervision per kilometer of similar road works across the countries
Average Cost of Supervision per km of a 2-Lane Road by Country (2007 US$)
Type of Work Type of Road Cost per km(US$/km)
Congo Re-gravel Inter-urban 7,820Congo (DRC) Re-gravel Inter-urban 1,063
Rehabilitation and Reconstruction Inter-urban 15,741Upgrade to Paved Inter-urban 18,076
Tanzania Upgrade to Paved Inter-urban 14,456
Ghana Rehabilitation and Reconstruction Inter-urban 15,422
Kenya Rehabilitation and Reconstruction Inter-urban 28,153
Malawi Upgrade to Paved Rural Access 2,255
Rehabilitation and Reconstruction Inter-urban 9,701Periodic Maintenance Inter-urban 7,006
Inter-urban 16,458Urban 38,024
Uganda Upgrade to Paved Inter-urban 22,076
Ethiopia
Mozambique
Nigeria Rehabilitation and Reconstruction

8/10/2012 25
SELECTION OF ‘RED FLAGS”
The following is a set of “red flags” that was selected under the study:
Period between bid opening and contract signing is more than 7 months Cost increases by more than 20% during implementation Time overrun is more than 30% of the originally contracted period Contract value is more than 20% above the Engineer’s Estimate Half or more firms buying bidding documents do not bid 20% or more of pre-qualified firms do not bid Difference between winning bid and next lowest bid is within 2% Difference between contract price and read-out bid price is more than
10% Winning bid is not the lowest bid accepted for detailed examination Only one or two bidders Cost per km for similar works and unit road works costs are higher than
the 75% percentile
8/10/2012 26
EXAMINATION OF ‘RED FLAGS”
An inventory of risks was performed for each road works contract using a checklist of “red flags”
The presence of “red flags” does not prove that corrupt or fraudulent practices have taken place in the procurement and implementation of a contract
A red flag is rather a warning sign of a potential procurement and implementation problem that may justify further investigation
Conversely, the absence of “red flags” does not imply that fraud or corruption did not occur
8/10/2012 27
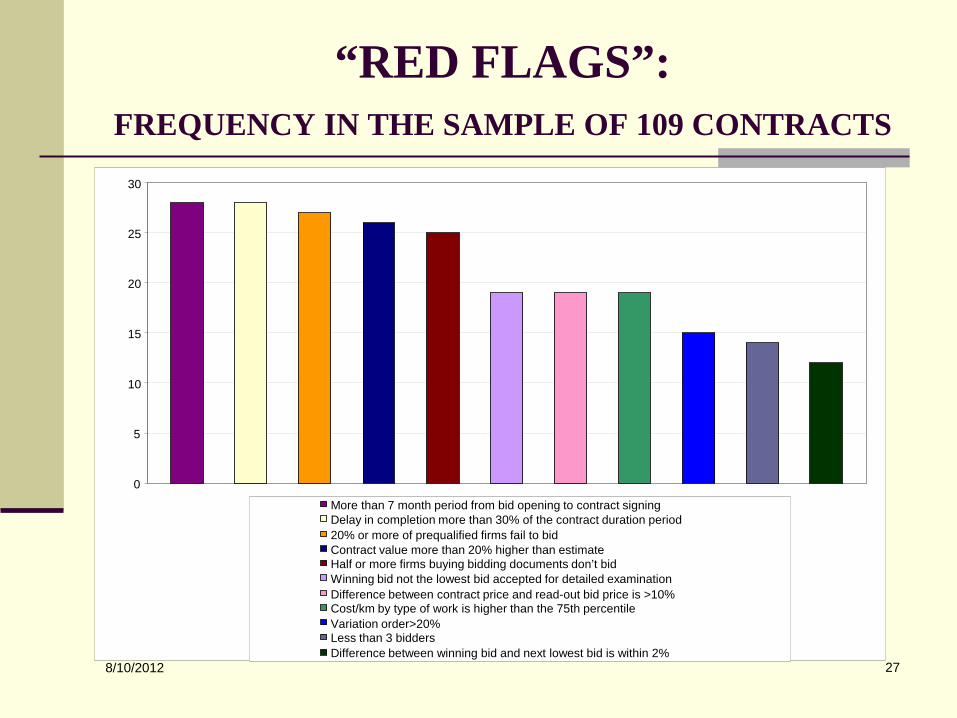
“RED FLAGS”: FREQUENCY IN THE SAMPLE OF 109 CONTRACTS
0
5
10
15
20
25
30
More than 7 month period from bid opening to contract signing Delay in completion more than 30% of the contract duration period 20% or more of prequalified firms fail to bid Contract value more than 20% higher than estimate Half or more firms buying bidding documents don’t bid Winning bid not the lowest bid accepted for detailed examination Difference between contract price and read-out bid price is >10% Cost/km by type of work is higher than the 75th percentile Variation order>20% Less than 3 bidders Difference between winning bid and next lowest bid is within 2%
8/10/2012 28
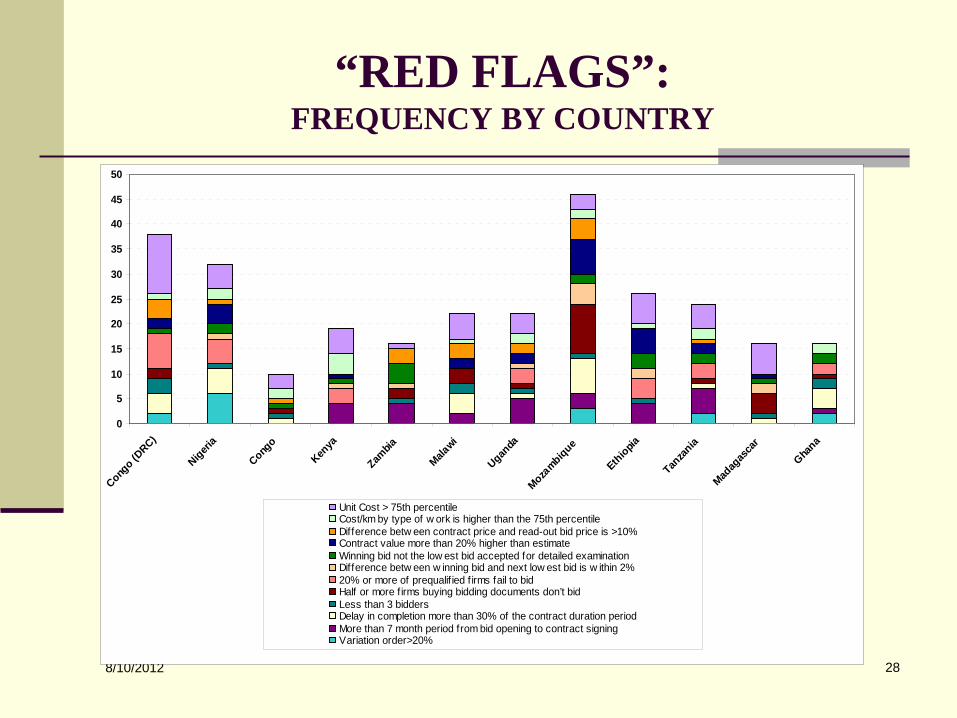
“RED FLAGS”: FREQUENCY BY COUNTRY
0
5
10
15
20
25
30
35
40
45
50
Congo (D
RC)
Nigeria
Congo
Kenya
Zambia
Malawi
Uganda
Mozambique
Ethiopia
Tanza
nia
Madag
asca
r
Ghana
Unit Cost > 75th percentileCost/km by type of w ork is higher than the 75th percentileDifference betw een contract price and read-out bid price is >10% Contract value more than 20% higher than estimateWinning bid not the low est bid accepted for detailed examinationDifference betw een w inning bid and next low est bid is w ithin 2%20% or more of prequalif ied f irms fail to bidHalf or more f irms buying bidding documents don’t bidLess than 3 biddersDelay in completion more than 30% of the contract duration periodMore than 7 month period from bid opening to contract signing Variation order>20%
8/10/2012 29
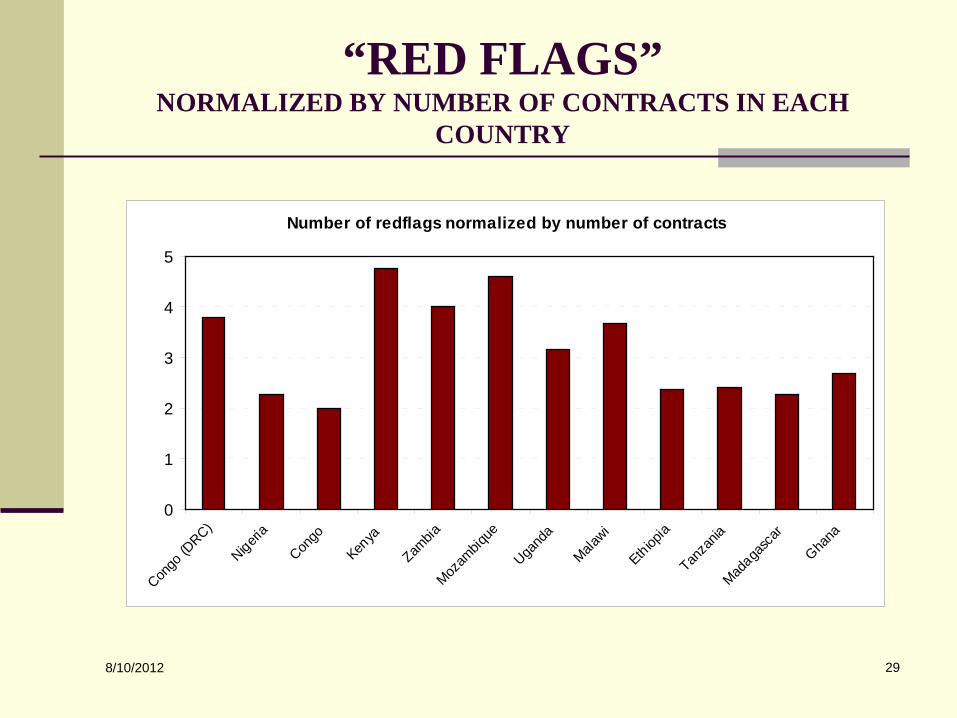
“RED FLAGS” NORMALIZED BY NUMBER OF CONTRACTS IN EACH
COUNTRY
Number of redflags normalized by number of contracts
0
1
2
3
4
5
Congo
(DRC)
Nigeria
Congo
Kenya
Zambia
Mozam
bique
Ugand
a
Malawi
Ethiopia
Tanza
nia
Madaga
scar
Ghana
8/10/2012 30
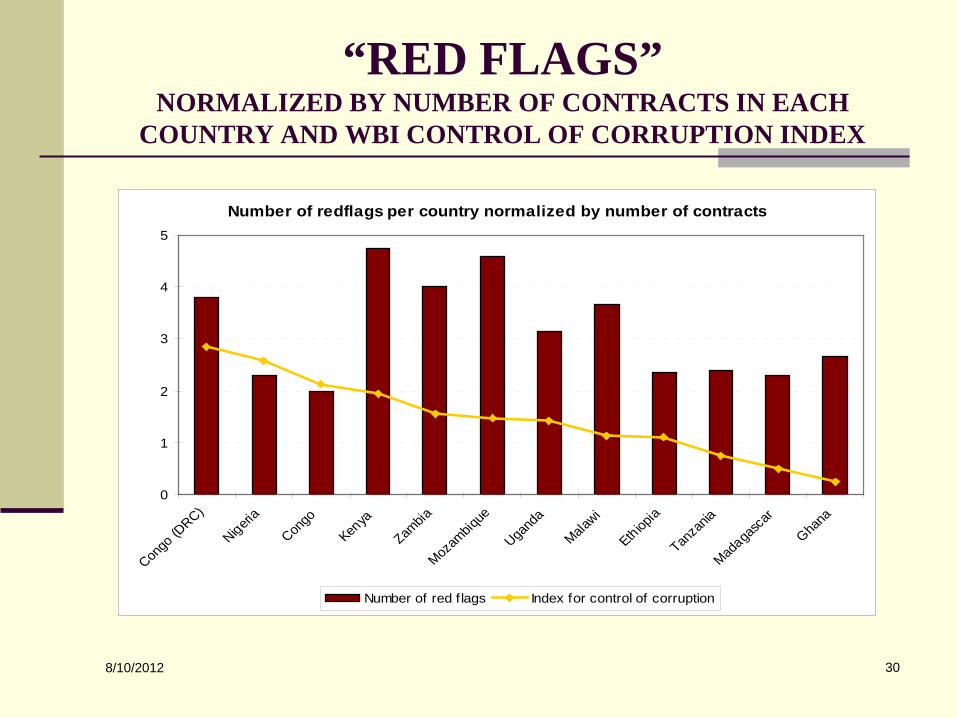
“RED FLAGS” NORMALIZED BY NUMBER OF CONTRACTS IN EACH
COUNTRY AND WBI CONTROL OF CORRUPTION INDEX
Number of redflags per country normalized by number of contracts
0
1
2
3
4
5
Congo
(DRC)
Nigeria
Congo
Kenya
Zambia
Mozam
bique
Ugand
a
Malawi
Ethiopia
Tanza
nia
Madaga
scar
Ghana
Number of red f lags Index for control of corruption

8/10/2012 31
“RED FLAGS”: IN THE CONTRACTS WITH COMPLAINTS
RECEIVED BY INT
The Department of Institutional Integrity (INT) received complaints on 14 contracts from the sample of 109 road works contracts (13% of total)
The nature of complaints was mainly related to allegations
of bidder collusion or bid rigging, paying bribes, and bidding irregularities
The pattern of “red flags” in the contracts with complaints
received by INT slightly differs from the overall pattern observed across all the contracts in the sample

8/10/2012 Governance and Anti-Corruption in Transport 32
“RED FLAGS”: PATTERN IN THE CONTRACTS WITH
COMPLAINTS RECEIVED BY INT
0%
10%
20%
30%
40%
50%
60%
70%
20% or more of prequalified firms fail to bid More than 7 month period from bid opening to contract signing Cost per km by type of work/type of road higher than the 75th percentile Contract Value more than 20% higher than the estimate Winning bid not the lowest bid accepted for detailed examination Delay in completion more than 30% of the contract duration period Less than 3 bidders Variation order more than 20% Half or more of firms buying bidding documents fail to bid Difference between winning bid and next lowest bid is within 2% Difference between contract price and read-out bid price is within 10%
8/10/2012 33
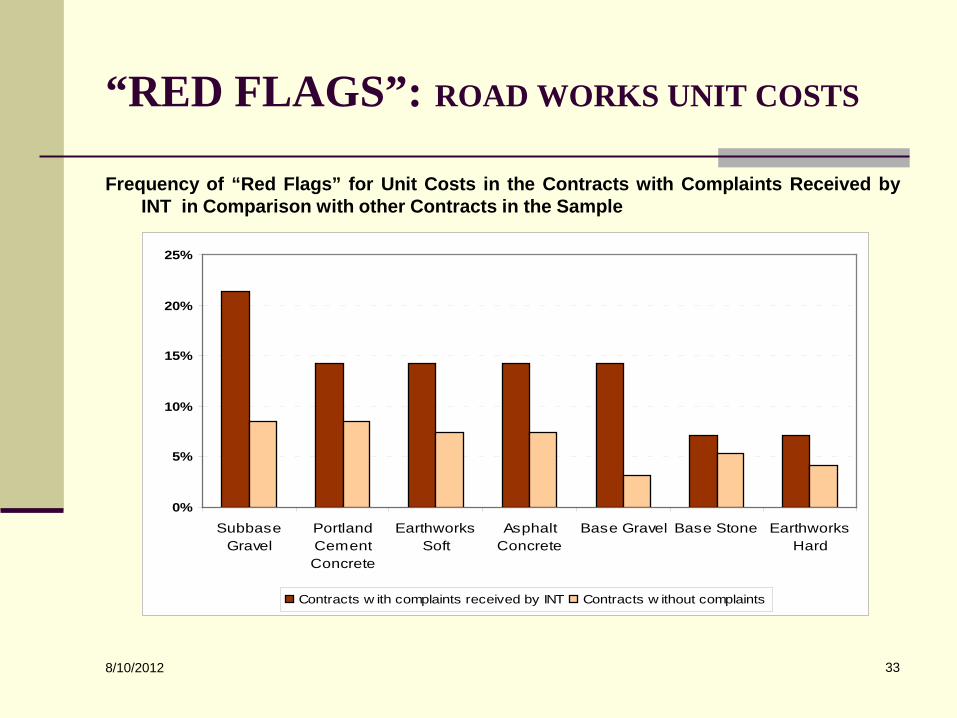
“RED FLAGS”: ROAD WORKS UNIT COSTS
Frequency of “Red Flags” for Unit Costs in the Contracts with Complaints Received by INT in Comparison with other Contracts in the Sample
0%
5%
10%
15%
20%
25%
SubbaseGravel
PortlandCementConcrete
EarthworksSoft
AsphaltConcrete
Base Gravel Base Stone EarthworksHard
Contracts w ith complaints received by INT Contracts w ithout complaints

8/10/2012 34
SELECTED ISSUES AS ADDRESSED BY PROJECT IMPLEMENTING AGENCIES Reasons for high bids: The effect of increase in prices of fuel, power, materials, and
equipment on major cost items of contracts A fixed price contract that is not subject to price adjustment Supply and demand effect Potential collusion by bidders Inadequate prediction of major market forces by the engineer’s
estimate Perception of risks incorporated by bidders in their bid prices
(e.g., provisions of extended contract procurement cycle time associated with price inflation risks)
Other factors (e.g., a delayed delivery of goods due to congestion and transport problems, the high cost of input taxes, political instability and insecurity)
8/10/2012 35
OTHER SELECTED ISSUES
Reasons for low response to invitation to bid: Increased demand for contractors’ services Insecure areas in a post-conflict country (DRC)
Reasons for cost overruns Global trend of rising oil prices Labor cost increase and impact of other regulatory measures
(taxation) Unsatisfactory contractor performance Time lag between design and contract execution dates Time extensions
8/10/2012 36
RECOMMENDED ACTIONS
The following is a set of selected recommendations geared to enhance accountability and attain a higher degree of control of corruption in Bank-financed projects in the road sector in Sub-Saharan Africa:
Consider establishing a tighter timeframe for contract signing. A
stricter adherence to the Bank’s procurement guidelines should be observed that provide for an extension of bid validity “if justified by exceptional circumstances” (Procurement Guidelines). A delayed bid evaluation process provides opportunities for corrupt practices and back-door negotiations.
Allow using a selection procedure of post-qualification in bidding
for large works instead of pre-qualification. Knowledge of other pre-qualified firms carries a potential risk of collusion. Also, other firms may choose not to bid due to a potential collusion of well-connected companies.
8/10/2012 37
RECOMMENDED ACTIONS
Create a system to monitor and assess contractors’ and consultants’ performance. Tracking of information on contractors and consultants in the road industry in the region could mitigate risks of misjudging on qualifications of firms as well as ensure due diligence on poor performers. The rankings of major contractors and consultants could identify strong performers who could be encouraged to bid or hired through direct contracting in case of emergencies.
Strengthen the monitoring over the procurement and
implementation processes to enhance detection of the risks to integrity. It is important to generate the data to increase accountability.
8/10/2012 38
CONCLUSIONS It is critical to continue collecting data on the procurement and
implementation processes of the road sector contracts to allow comparison of cost trends, bidding competition, and performance in the road sector. A standard framework (including a template) has been developed within this study to provide the platform for monitoring and evaluation of prices, bidding data, and contractor’s information to help improve governance.
Capturing costs and unit price information of road works is
important for evaluation of the trends across countries and regions. Empirical evidence could be built on such indicators as price increases relative to the engineer’s estimates, cost increases, and key roads input costs to investigate the sources of increased costs and possible factors behind the increase in bid prices.

8/10/2012 39
CONCLUSIONS Assessing bidding behavior is essential for measuring the level of
competition and road works activity financed by the Bank. Verifying the extent of competition in the bidding environment is an important tool for procurement decisions. Detailed bidding data could facilitate measuring if the procurement process is affected by collusion and bid rigging through detection of patterns and “red flags” in the structure of bids and firms.
Measuring performance more consistently would help to address
inefficiencies that arise in the current procurement and implementation practices. This would ensure that irregularities are properly captured in the observed trends in a specific country or area. It is important to link the performance measures to contractors and consultants as well as project implementing agencies for accountability.

8/10/2012 40
Thank you!
8/10/2012 41
References “Monitoring Road Works Contracts and Unit Costs for
Enhanced Governance in Sub-Saharan Africa.” World Bank Transport Paper No. TP-21. 2008 http://siteresources.worldbank.org/INTTRANSPORT/Resources/336291-1227561426235/5611053-1229359963828/tp_21.pdf
“Monitoring Road Works Contracts and Unit Costs for Enhanced Governance in Europe and Central Asia.” World Bank Transport Paper No. TP-33. 2011. http://go.worldbank.org/9XN7FBUCD0
“Prediction model for the cost of road rehabilitation and reconstruction works.” 2nd International Conference on Road and Rail Infrastructure, Dubrovnik, Croatia, 7-9 May 2012. http://www.grad.hr/cetra/ocs/index.php/cetra/cetra2012
Attachment
An example of a regression model to predict the cost of road works
Source: “Prediction model for the cost of road
rehabilitation and reconstruction works.” 2nd International Conference on Road and Rail Infrastructure, Dubrovnik, Croatia, 7-9 May 2012 http://www.grad.hr/cetra/ocs/index.php/cetra/cetra2012
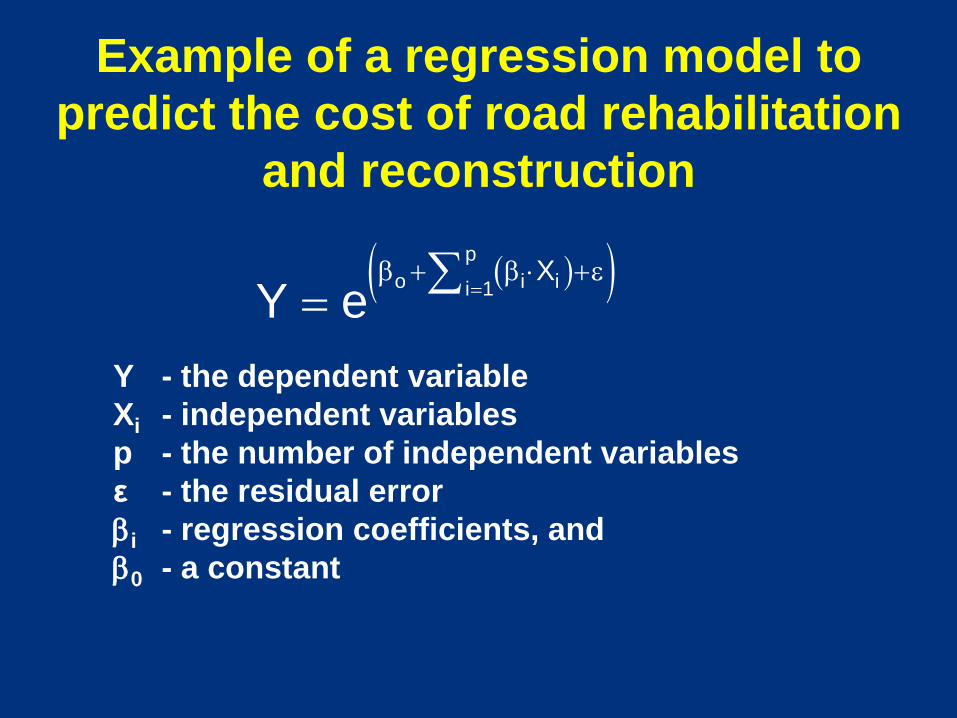
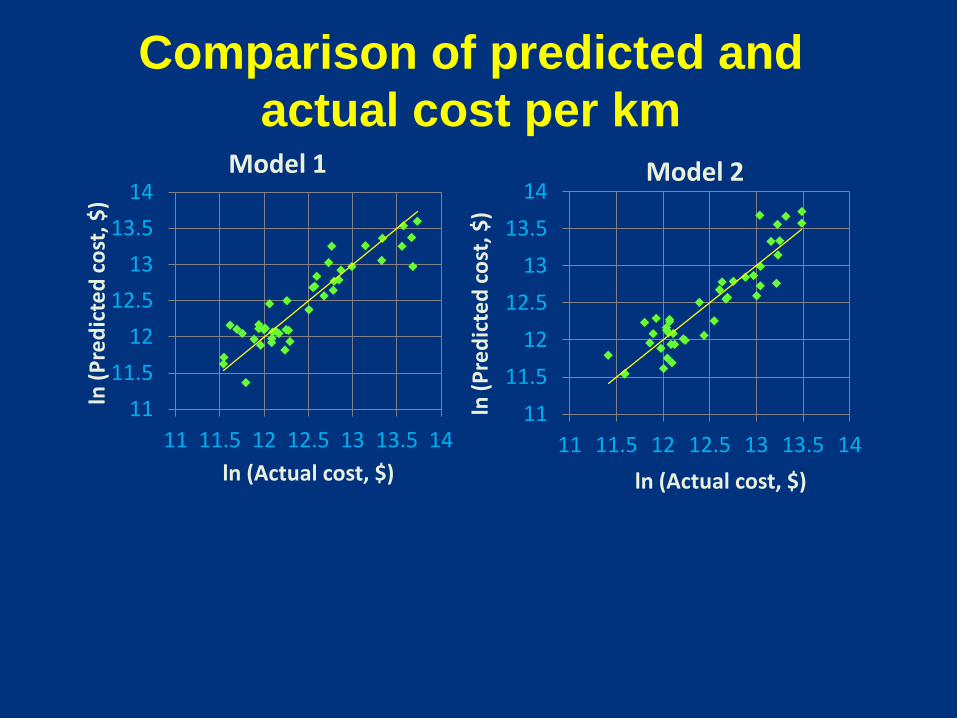
Example of a regression model to predict the cost of road rehabilitation
and reconstruction
Y - the dependent variable Xi - independent variables p - the number of independent variables ε - the residual error βi - regression coefficients, and β0 - a constant
( )( )po i ii 1
XY e =
β + β ⋅ +ε∑=
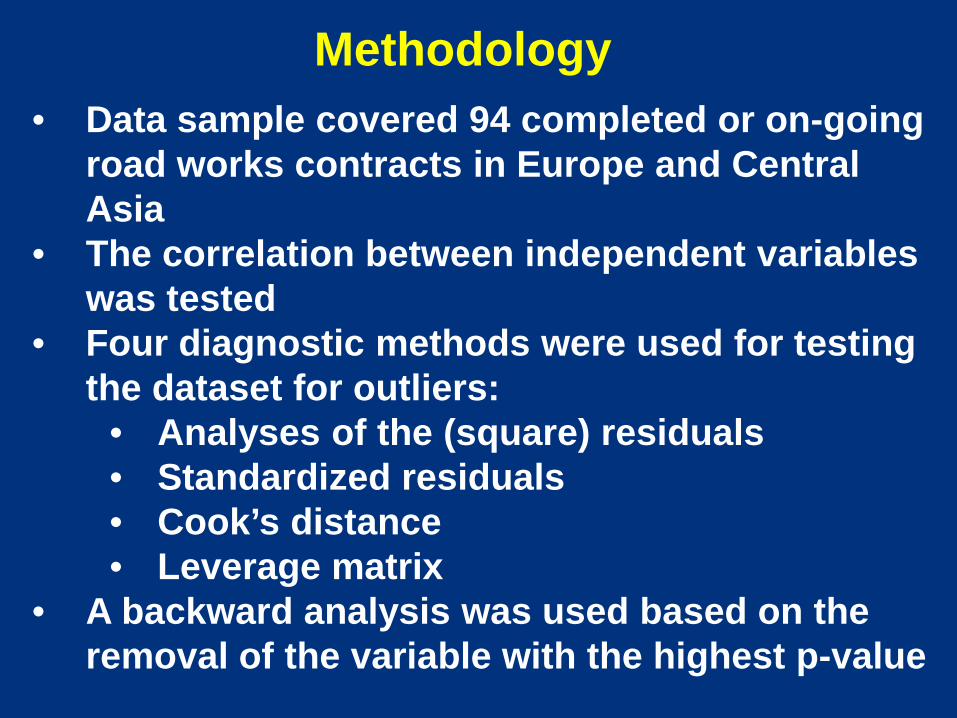
Methodology • Data sample covered 94 completed or on-going
road works contracts in Europe and Central Asia
• The correlation between independent variables was tested
• Four diagnostic methods were used for testing the dataset for outliers:
• Analyses of the (square) residuals • Standardized residuals • Cook’s distance • Leverage matrix
• A backward analysis was used based on the removal of the variable with the highest p-value
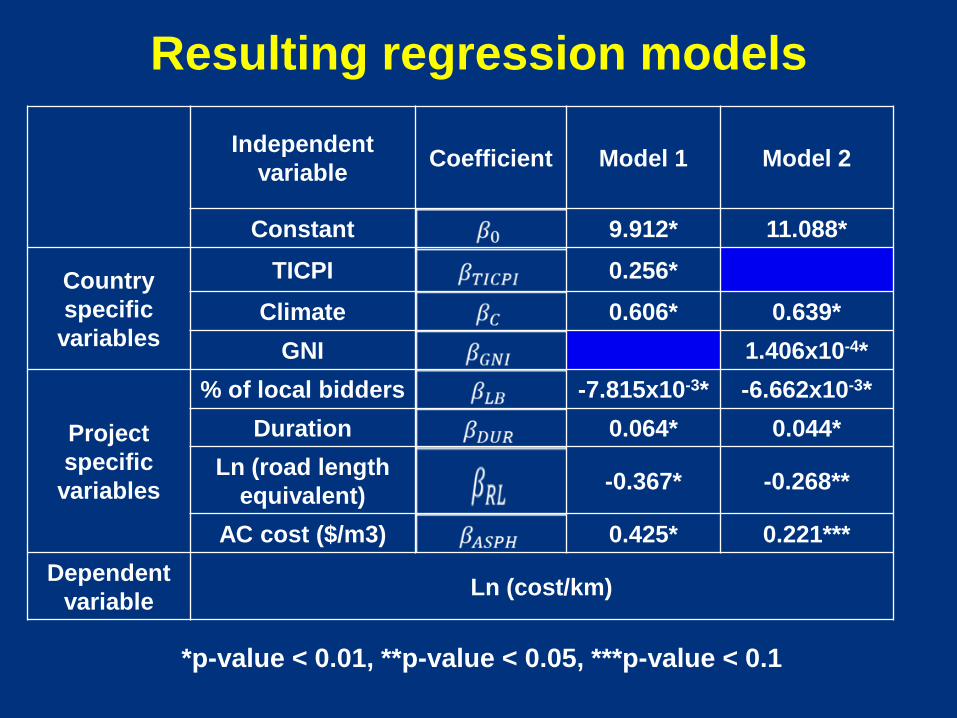
Resulting regression models
*p-value < 0.01, **p-value < 0.05, ***p-value < 0.1
Independent variable Coefficient Model 1 Model 2
Constant 9.912* 11.088*
Country specific
variables
TICPI 0.256* Climate 0.606* 0.639*
GNI 1.406x10⁻⁴*
Project specific
variables
% of local bidders -7.815x10⁻³* -6.662x10⁻³* Duration 0.064* 0.044*
Ln (road length equivalent) -0.367* -0.268**
AC cost ($/m3) 0.425* 0.221*** Dependent
variable Ln (cost/km)
11
11.5
12
12.5
13
13.5
14
11 11.5 12 12.5 13 13.5 14
ln (P
redi
cted
cos
t, $
)
ln (Actual cost, $)
Model 1
11
11.5
12
12.5
13
13.5
14
11 11.5 12 12.5 13 13.5 14
ln (P
redi
cted
cos
t, $
) ln (Actual cost, $)
Model 2
Comparison of predicted and actual cost per km
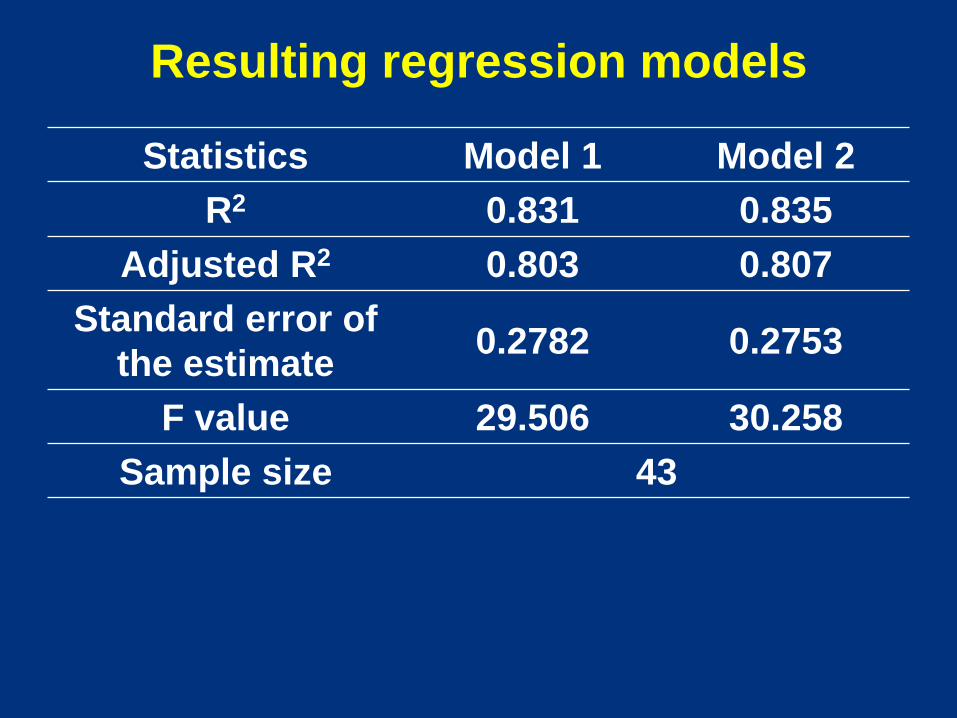
Statistics Model 1 Model 2 R2 0.831 0.835
Adjusted R2 0.803 0.807 Standard error of
the estimate 0.2782 0.2753
F value 29.506 30.258 Sample size 43
Resulting regression models

A particular form of collusive price-fixing behavior by which firms coordinate their bids on procurement or project contracts Context: There are two common forms of bid rigging. In the first, firms agree to submit common bids, thus eliminating price competition. In the second, firms agree on which firm will be the lowest bidder and rotate in such a way that each firm wins an agreed upon number or value of contracts. Bid rigging is one of the most widely prosecuted forms of collusion Source: http://stats.oecd.org/glossary/detail.asp?ID=3334
Bid Rigging

Cesar Queiroz Road and Transport Infrastructure Consultant Former World Bank Highways Adviser Tel +1 301 755 7591 [email protected] Washington, DC, USA

Cesar Queiroz, former World Bank Highways Adviser, is an international consultant on roads and transport infrastructure. His main expertise is in public-private partnerships in infrastructure, road maintenance, financing, management and development, performance-based contracts, improving governance, quality assurance and evaluation, research, teaching and training. Between 1986 and 2006, he held several positions with the World Bank, including Lead Highway Engineer and Principal Highway Engineer. Prior to joining the WB, Cesar was the deputy director of the Brazilian Road Research Institute in Rio de Janeiro, Brazil. He holds a Ph.D. in civil engineering from the University of Texas, a M.Sc. in production engineering from the Federal University of Rio de Janeiro, and a B.Sc. in civil engineering from the Federal University of Juiz de Fora, Brazil. Cesar has published two books and more than 130 papers and articles in more than 10 countries. His recent assignments include advisory/training services in countries such as Russia, Brazil, Latvia, Lithuania, Poland, Ukraine, Moldova, Philippines, Uganda, Tanzania, Sri Lanka, India, Laos, Yemen, Egypt, Saudi Arabia, Tunisia, Mozambique, Benin, Serbia, Sweden and Norway. He was a professor of transportation engineering at the Brazilian Military Institute of Engineering in Rio de Janeiro from 1983-1986.


![업무가빨라지는그룹웨어 다우오피스 [Works 샘플 …daouoffice.com/cloud_guide/works/Works18.pdf[Works 샘플] 택배반품관리앱적용가이드 업무가빨라지는그룹웨어,](https://img.pdfslide.net/doc/110x75/5f7c08a8be19ca0d5e1a2af4/eeeeeee-e-works-foe-works-foe-feeeeeeoe.jpg)