Embed Size (px)
Citation preview

Monitoring survey of Annex I sand
dune habitats in Ireland
Irish Wildlife Manuals No. 75
ISSN 1393 – 6670


Monitoring survey of Annex I sand dune habitats in Ireland
A. Delaney, F.M. Devaney, J.R. Martin, S.J. Barron
Citation:
Delaney, A., Devaney, F.M, Martin, J.M. and Barron, S.J. (2013). Monitoring survey of Annex I sand
dune habitats in Ireland. Irish Wildlife Manuals, No. 75. National Parks and Wildlife Service,
Department of Arts, Heritage and the Gaeltacht, Dublin, Ireland.
Keywords: Sand dunes, Ireland, coastal, monitoring, assessment, Habitats Directive, structure and
functions, conservation status
Site list: 000020, Black Head-Poulsallagh Complex SAC; 000091, Clonakilty Bay SAC; 000147, Horn
Head and Rinclevan SAC; 000164, Lough Nagreany Dunes SAC; 000190, Slieve Tooey/Tormore
Island/Loughros Beg Bay SAC; 000194, Tranarossan and Melmore Lough SAC; 000197, West of
Ardara/Maas Road SAC; 000199, Baldoyle Bay SAC; 000206, North Dublin Bay SAC; 000332,
Akeragh, Banna and Barrow Harbour SAC; 000343, Castlemaine Harbour SAC; 000370, Lough
Yganavan and Lough Nambrackdarraig SAC; 000458, Killala Bay/Moy Estuary SAC; 000470,
Mullet/Blacksod Bay Complex SAC; 000500, Glenamoy Bog Complex SAC; 000622, Ballysadare Bay
SAC; 000627, Cummeen Strand/Drumcliff Bay (Sligo Bay) SAC; 000671, Tramore Dunes and

Backstrand SAC; 000696, Ballyteige Burrow SAC; 000697 Bannow Bay SAC; 000700, Cahore Polders
and Dunes SAC; 000710, Raven Point Nature Reserve SAC; 000729 Buckroney-Brittas Dunes and
Fen SAC; 001040, Barley Cove to Ballyrisode Point SAC; 001061, Kilkieran Lake and Castlefreke
Dunes SAC; 001090, Ballyness Bay SAC; 001141, Gweedore Bay and Islands SAC; 001257, Dog’s
Bay SAC; 001309, Omey Island Machair SAC; 001932, Mweelrea/Sheeffry/Erriff Complex SAC;
001957, Boyne Coast and Estuary SAC; 002012, North Inishowen Coast SAC; 002070, Tralee Bay
and Magherees Peninsula, West to Cloghane SAC; 002074, Slyne Head Peninsula SAC
Cover photo: Dunes at Banna Strand, Co. Kerry © Aoife Delaney
The NPWS Project Officer for this report was: Karen Gaynor; [email protected]
Irish Wildlife Manuals Series Editors: R. Jeffrey and F. Marnell
© National Parks and Wildlife Service 2013
Sand dunes monitoring survey – BEC Consultants Ltd. 2013 ____________________________
Contents
Executive Summary ..................................................................................................................................1
Acknowledgements ..................................................................................................................................2
1 Introduction .......................................................................................................................................3
1.1 The Habitats Directive..............................................................................................................3
1.2 Rationale and context of the project ...............................................................................................3
1.3 Assessment of Annex I habitats ...............................................................................................4
1.4 Annex I sand dune habitats in Ireland ....................................................................................5
1.4.1 1210 Annual vegetation of drift lines ..................................................................................7
1.4.2 1220 Perennial vegetation of stony banks ...........................................................................8
1.4.3 2110 Embryonic shifting dunes ...........................................................................................9
1.4.4 2120 Shifting dunes along the shoreline with Ammophila arenaria (white dunes).........9
1.4.5 *2130 Fixed coastal dunes with herbaceous vegetation (grey dunes) ............................. 10
1.4.6 *2140 Decalcified fixed dunes with Empetrum nigrum ................................................... 11
1.4.7 *2150 Atlantic decalcified fixed dunes (Calluno-Ulicetea) .............................................. 11
1.4.8 2170 Dunes with Salix repens ssp. argentea (Salicion arenariae) .................................... 12
1.4.9 2190 Humid dune slacks .................................................................................................... 13
1.4.10 *21A0 Machairs .............................................................................................................. 14
1.5 Nomenclature of the Annex I habitats .................................................................................. 15
2 Methodology .................................................................................................................................... 16
2.1 Site Selection ........................................................................................................................... 16
2.2 Equipment............................................................................................................................... 18
2.3 Area ......................................................................................................................................... 18
2.3.1 Field survey ........................................................................................................................ 18
2.3.2 Digitisation ......................................................................................................................... 20
2.3.3 Calculating change in area ................................................................................................. 21
2.4 Structure and Functions ......................................................................................................... 22
2.4.1 Site-based assessment ........................................................................................................ 22
2.4.2 Habitat-based assessment .................................................................................................. 27
2.5 Future Prospects ..................................................................................................................... 28
2.6 Conservation Assessment ...................................................................................................... 30
3 Results .............................................................................................................................................. 31
3.1 1210 Annual vegetation of drift lines .................................................................................... 31
3.1.1 Area and distribution ......................................................................................................... 31
3.1.2 Structure and Functions ..................................................................................................... 33
Sand dunes monitoring survey – BEC Consultants Ltd. 2013 ____________________________
3.1.3 Future prospects ................................................................................................................. 35
3.1.4 Conservation assessment ................................................................................................... 37
3.2 1220 Perennial vegetation of stony banks ............................................................................. 39
3.2.1 Area and distribution ......................................................................................................... 39
3.2.2 Structure and Functions ..................................................................................................... 40
3.2.3 Future prospects ................................................................................................................. 42
3.2.4 Conservation assessment ................................................................................................... 44
3.3 2110 Embryonic shifting dunes ............................................................................................. 46
3.3.1 Area and distribution ......................................................................................................... 46
3.3.2 Structure and Functions ..................................................................................................... 48
3.3.3 Future Prospects ................................................................................................................. 50
3.3.4 Conservation assessment ................................................................................................... 51
3.4 2120 Marram dunes (white dunes) ........................................................................................ 53
3.4.1 Area and distribution ......................................................................................................... 53
3.4.2 Structure and Functions ..................................................................................................... 55
3.4.3 Future Prospects ................................................................................................................. 57
3.4.4 Conservation assessment ................................................................................................... 59
3.5 *2130 Fixed dunes (grey dunes) ............................................................................................. 61
3.5.1 Area and distribution ......................................................................................................... 61
3.5.2 Structure and Functions ..................................................................................................... 63
3.5.3 Future Prospects ................................................................................................................. 67
3.5.4 Conservation assessment ................................................................................................... 69
3.6 *2140 Decalcified Empetrum Dunes ....................................................................................... 71
3.6.1 Area and distribution ......................................................................................................... 71
3.6.2 Impacts and activities......................................................................................................... 72
3.7 *2150 Decalcified Dune Heath ............................................................................................... 73
3.7.1 Area and distribution ......................................................................................................... 73
3.7.2 Impacts and activities......................................................................................................... 76
3.8 2170 Dunes with creeping willow ......................................................................................... 79
3.8.1 Area and distribution ......................................................................................................... 79
3.8.2 Structure and Functions ..................................................................................................... 80
3.8.3 Future Prospects ................................................................................................................. 83
3.8.4 Conservation assessment ................................................................................................... 85
3.9 2190 Humid dune slacks ........................................................................................................ 87
3.9.1 Area and distribution ......................................................................................................... 87
3.9.2 Structure and Functions ..................................................................................................... 89
Sand dunes monitoring survey – BEC Consultants Ltd. 2013 ____________________________
3.9.3 Future Prospects ................................................................................................................. 92
3.9.4 Conservation assessment ................................................................................................... 94
3.10 *21A0 Machair ........................................................................................................................ 97
3.10.1 Area and distribution ..................................................................................................... 97
3.10.2 Structure and Functions ................................................................................................. 99
3.10.3 Impacts and activities .................................................................................................. 101
3.10.4 Conservation assessment ............................................................................................. 103
4. Discussion ...................................................................................................................................... 105
4.1 Complexity of sand dune systems....................................................................................... 105
4.2 Main reasons for habitats to fail the conservation assessments ........................................ 106
4.2.1 Interference with sediment dynamics ............................................................................. 106
4.2.2 Agriculture........................................................................................................................ 107
4.2.3 Succession ......................................................................................................................... 108
4.2.4 Rabbit activity ................................................................................................................... 109
4.2.5 Forestry ............................................................................................................................. 109
4.2.6 Disturbance due to human activity ................................................................................. 110
4.2.7 Climate change and coastal processes ............................................................................ 111
4.2.8 Invasive species ................................................................................................................ 112
4.3 Constraints of the methodology .......................................................................................... 113
4.3.1 1220 Perennial vegetation of stony banks ....................................................................... 113
4.3.2 *2140 Decalcified Empetrum dunes and *2150 Decalcified dune heath ....................... 113
4.3.3 *21A0 Machairs................................................................................................................. 114
4.4 Other Annex I habitats which may occur in Ireland .......................................................... 114
References .............................................................................................................................................. 115
Appendix I: Structure and functions assessment sheets for eight EU Annex I sand dune habitats 118
Appendix II: Calculation of percentage of 2170 Dunes with creeping willow in favourable condition ................................................................................................................................................ 135
Appendix III: BSBI Guidance notes for recording DAFOR scores ..................................................... 137
Appendix IV: Main changes to the conservation assessment criteria................................................ 138
Appendix V: Impacts and codes used for future prospects assessments (Ssymank 2010) ............... 139
Appendix VI: Future Prospects recording form .................................................................................. 149
Abbreviations:
SDM = Sand Dunes Monitoring Project (Delaney et al., 2013)
CMP = Coastal Monitoring Project (Ryle et al., 2009)
Sand dunes monitoring survey – BEC Consultants Ltd. 2013 ____________________________
List of tables
Table 1.1: Summary matrix of the parameters and conditions required to assess the conservation status of habitats. Modified from Evans and Arvela (2011). .................................................................4
Table 2.1: Area of Annex I sand dune habitats recorded during the CMP within all CMP sites and within the sites selected for survey during the SDM, and the proportion of each habitat accounted for by the sites selected for sample during the SDM. ........................................................................... 16
Table 2.2: Sites surveyed during the SDM, their counties and SAC(s) with which they coincide. .... 17
Table 2.3: The number of monitoring stops recorded in each Annex I sand dune habitat in 2011 and 2012. ......................................................................................................................................................... 23
Table 2.4: Criteria assessed as part of the Structure and Functions assessment during the Sand Dunes Monitoring Project and the habitats in which they were applied. ........................................... 25
Table 2.5: The Domin scale, the range each point on the scale represents and the associated percentage cover values. ......................................................................................................................... 26
Table 2.6: Scoring system used to quantify impacts in Annex I habitats (modified from O’Neill et al., 2010). Impact score is the mathematical product of all three attribute scores. ............................. 30
Table 3.1: Area of 1210 Annual vegetation of drift lines (surveyed and unsurveyed) on the revised CMP maps and the SDM maps. ............................................................................................................. 32
Table 3.2: Area of 1210 Annual vegetation of drift lines within the sample sites as represented on different maps. ........................................................................................................................................ 32
Table 3.3: Loss of area of 1210 Annual vegetation of drift lines since the baseline survey ................ 33
Table 3.4: Results of the Structure and Functions assessment at each site where 1210 Annual vegetation of drift lines was assessed showing which of the criteria passed and failed. Favourable, Unfavourable-Inadequate and Unfavourable-Bad are abbreviated to F, U-I and U-B respectively. . 34
Table 3.5: The percentage of sites at which each criterion failed in the Structure and Functions assessment of 1210 Annual vegetation of drift lines ............................................................................. 35
Table 3.6: The total assessed area and percentage of area of 1210 Annual vegetation of drift lines in Favourable and Unfavourable condition in 2011/2012. ........................................................................ 35
Table 3.7: Neutral impacts affecting 1210 Annual vegetation of drift lines, the percentage of sites (where the habitat occurs) which were affected, the degree of impact and the area of the habitat affected. .................................................................................................................................................... 36
Table 3.8: The five negative impacts affecting the greatest area of 1210 Annual vegetation of drift lines, the percentage of sites (where the habitat occurs) which were affected, the degree of impact and the area of the habitat affected. ....................................................................................................... 37
Table 3.9: Results of the conservation assessment of 1210 Annual vegetation of drift lines. ............. 38
Sand dunes monitoring survey – BEC Consultants Ltd. 2013 ____________________________
Table 3.10: Area of 1220 Perennial vegetation of stony banks (surveyed and unsurveyed) on the revised CMP maps and the SDM maps. ................................................................................................ 39
Table 3.11: Area of 1220 Perennial vegetation of stony banks within the sample sites as represented on different maps. ................................................................................................................................... 40
Table 3.12: Results of the Structure and Functions assessment at each site where 1220 Perennial vegetation of stony banks was assessed showing which of the criteria passed and failed. Favourable, Unfavourable-Inadequate and Unfavourable-Bad are abbreviated to F, U-I and U-B respectively. ............................................................................................................................................. 41
Table 3.13: The percentage of sites at which each criterion failed in the Structure and Functions assessment of 1220 Perennial vegetation of stony banks. ..................................................................... 42
Table 3.14: The total assessed area and percentage of area of 1220 Perennial vegetation of stony banks in Favourable and Unfavourable condition in 2011/2012. ......................................................... 42
Table 3.15: The five neutral impacts affecting 1220 Perennial vegetation of stony banks, the percentage of sites (where the habitat occurs) which were affected, the degree of impact and the area of the habitat affected...................................................................................................................... 43
Table 3.16. Negative impacts affecting 1220 Perennial vegetation of stony banks, the percentage of sites (where the habitat occurs) which were affected, the degree of impact and the area of the habitat affected. ....................................................................................................................................... 44
Table 3.17: Results of the conservation assessment of 1220 Perennial vegetation of stony banks. .... 45
Table 3.18: Area of 2110 Embryonic shifting dunes (surveyed and unsurveyed) on the revised CMP maps and the SDM maps. ....................................................................................................................... 46
Table 3.19: Area of 2110 Embryonic shifting dunes within the sample sites as represented on different maps. ........................................................................................................................................ 47
Table 3.20: Change of area of 2110 Embryonic shifting dunes since the baseline survey .................. 47
Table 3.21: Results of the Structure and Functions assessment at each site where 2110 Embryonic shifting dunes habitat was assessed showing which of the criteria passed and failed. Favourable, Unfavourable-Inadequate and Unfavourable-Bad are abbreviated to F, U-I and U-B respectively. . 48
Table 3.22: The percentage of sites at which each criterion failed in the Structure and Functions assessment. .............................................................................................................................................. 49
Table 3.23: The total assessed area and percentage of area of 2110 Embryonic shifting dunes in Favourable or Unfavourable condition in 2011/2012. ........................................................................... 49
Table 3.24: The five neutral impacts affecting the greatest area of 2110 Embryonic shifting dunes, the percentage of sites (where the habitat occurs) which were affected, the degree of impact and the area of the habitat affected...................................................................................................................... 50
Table 3.25: The five negative impacts affecting the greatest area of 2110 Embryonic shifting dunes, the percentage of sites (where the habitat occurs) which were affected, the degree of impact and the area of the habitat affected...................................................................................................................... 51
Sand dunes monitoring survey – BEC Consultants Ltd. 2013 ____________________________
Table 3.26: Results of the conservation assessment of 2110 Embryonic shifting dunes. .................... 52
Table 3.27: Area of 2120 Marram dunes (white dunes) (surveyed and unsurveyed) on the revised CMP maps and SDM maps. ................................................................................................................... 53
Table 3.28: Area of 2120 Marram dunes (white dunes) within the sample sites as represented on different maps. ........................................................................................................................................ 54
Table 3.29: Loss of area of 2120 Marram dunes (white dunes) since the baseline survey .................. 54
Table 3.30: The results of the Structure and Functions assessment at each site where 2120 Marram dunes (white dunes) habitat was assessed showing which of the criteria passed and failed. Favourable, Unfavourable-Inadequate and Unfavourable-Bad are abbreviated to F, U-I and U-B respectively. ............................................................................................................................................. 55
Table 3.31: The percentage of sites with 2120 Marram dunes (white dunes) at which each criterion failed in the Structure and Functions assessment. ................................................................................ 56
Table 3.32: The total assessed area and percentage of area of 2120 Marram dunes (white dunes) in Favourable and Unfavourable condition in 2011/2012. ........................................................................ 57
Table 3.33: Positive impacts affecting 2120 Marram dunes (white dunes), the percentage of sites (where the habitat occurs) which were affected, the degree of impact and the area of the habitat affected. .................................................................................................................................................... 57
Table 3.34: The five neutral impacts affecting the greatest area of 2120 Marram dunes (white dunes), the percentage of sites (where the habitat occurs) which were affected, the degree of impact and the area of the habitat affected. ....................................................................................................... 58
Table 3.35: The five negative impacts affecting the greatest area of 2120 Marram dunes (white dunes), the percentage of sites (where the habitat occurs) which were affected, the degree of impact and the area of the habitat affected. ....................................................................................................... 59
Table 3.36: Results of the conservation status assessment of 2120 Marram dunes (white dunes). .... 60
Table 3.37: Area of *2130 Fixed dunes (grey dunes) (surveyed and unsurveyed) on the revised CMP maps and the SDM maps. ....................................................................................................................... 61
Table 3.38: Area of *2130 Fixed dunes (grey dunes) within the sample sites as represented on different maps. ........................................................................................................................................ 62
Table 3.39: Change in area of *2130 Fixed dunes (grey dunes) since the baseline survey. ................. 62
Table 3.40: The percentage of sites at which each criterion failed in the Structure and Functions assessment of *2130 Fixed dunes (grey dunes) ..................................................................................... 64
Table 3.41: The total assessed area and percentage of area of *2130 Fixed dunes (grey dunes) in Favourable and Unfavourable in 2011/2012. ......................................................................................... 64
Table 3.42: Results of the Structure and Functions assessment for *2130 Fixed dunes (grey dunes) showing which of the criteria passed and failed. Target species refers to positive indicator species. Favourable, Unfavourable-Inadequate and Unfavourable-Bad are abbreviated to F, U-I and U-B respectively. ............................................................................................................................................. 65
Sand dunes monitoring survey – BEC Consultants Ltd. 2013 ____________________________
Table 3.43: The five positive impacts affecting the greatest area of *2130 Fixed dunes (grey dunes), the percentage of sites (where the habitat occurs) which were affected, the degree of impact and the area of the habitat affected...................................................................................................................... 67
Table 3.44: The five neutral impacts affecting the greatest area of *2130 Fixed dunes (grey dunes), the percentage of sites (where the habitat occurs) which were affected, the degree of impact and the area of the habitat affected...................................................................................................................... 68
Table 3.45: The five negative impacts affecting the greatest area of *2130 Fixed dunes (grey dunes), the percentage of sites (where the habitat occurs) which were affected, the degree of impact and the area of the habitat affected...................................................................................................................... 69
Table 3.46: Results of the conservation assessment of *2130 Fixed dunes (grey dunes)..................... 70
Table 3.47: Area of *2140 Decalcified Empetrum dunes (surveyed and unsurveyed) on the revised CMP maps and the SDM maps. ............................................................................................................. 71
Table 3.48: Area of *2140 Decalcified Empetrum dunes within the sample sites as represented on different maps. ........................................................................................................................................ 72
Table 3.49: Loss of area of *2140 Decalcified Empetrum dunes since the baseline survey .................. 72
Table 3.50: Area of *2150 Decalcified dune heath on the revised CMP maps and the SDM maps. ... 73
Table 3.51: Area of *2150 Decalcified dune heath within the sample sites as represented on different maps. ........................................................................................................................................................ 74
Table 3.52: Change in area of *2150 Decalcified dune heath since the baseline survey ...................... 76
Table 3.53: The positive impacts affecting *2150 Decalcified dune heath, the percentage of sites (where the habitat occurs) which were affected, the degree of impact and the area of the habitat affected. .................................................................................................................................................... 76
Table 3.54: The neutral impacts affecting *2150 Decalcified dune heath, the percentage of sites (where the habitat occurs) which were affected, the degree of impact and the area of the habitat affected. .................................................................................................................................................... 77
Table 3.55: Negative impacts affecting *2150 Decalcified dune heath, the percentage of sites (where the habitat occurs) which were affected, the degree of impact and the area of the habitat affected. 77
Table 3.56: Area of 2170 Dunes with creeping willow (surveyed and unsurveyed) on the revised CMP maps and the SDM maps. ............................................................................................................. 79
Table 3.57: Area of 2170 Dunes with creeping willow within the sample sites as represented on different maps. ........................................................................................................................................ 80
Table 3.58: Change in area of 2170 Dunes with creeping willow since the baseline survey .............. 80
Table 3.59: The percentage of sites at which each criterion failed in the Structure and Functions assessment of 2170 Dunes with creeping willow. ................................................................................. 81
Table 3.60: Results of the Structure and Functions assessment at each site where 2170 Dunes with creeping willow habitat was assessed showing which of the criteria passed and failed. Favourable, Unfavourable-Inadequate and Unfavourable-Bad are abbreviated to F, U-I and U-B respectively. . 82

Sand dunes monitoring survey – BEC Consultants Ltd. 2013 ____________________________
Table 3.61: The total assessed area and percentage of area of 2170 Dunes with creeping willow in Favourable and Unfavourable condition in 2011/2012. ........................................................................ 83
Table 3.62: Positive impacts affecting 2170 Dunes with creeping willow, the percentage of sites (where the habitat occurs) which were affected, the degree of impact and the area of the habitat affected. .................................................................................................................................................... 83
Table 3.63: Neutral impacts affecting 2170 Dunes with creeping willow, the percentage of sites (where the habitat occurs) which were affected, the degree of impact and the area of the habitat affected. .................................................................................................................................................... 84
Table 3.64: The five negative impacts affecting the greatest area of 2170 Dunes with creeping willow, the percentage of sites (where the habitat occurs) which were affected, the degree of impact and the area of the habitat affected. ....................................................................................................... 84
Table 3.65: Results of the conservation assessment of 2170 Dunes with creeping willow. ................ 86
Table 3.66: Area of 2190 Humid dune slacks (surveyed and unsurveyed) on the revised CMP maps and the SDM maps. ................................................................................................................................. 87
Table 3.67: Area of 2190 Humid dune slacks within the sample sites as represented on different maps. ........................................................................................................................................................ 88
Table 3.68: Loss of area of 2190 Humid dune slacks since the baseline survey. ................................. 88
Table 3.69: The percentage of sites at which each criterion failed in the Structure and Functions assessment of 2190 Humid dune slacks. ................................................................................................ 89
Table 3.70: Results of the Structure and Functions assessment at each site where 2190 Humid dune slacks were assessed showing which of the criteria passed and failed. Favourable, Unfavourable-Inadequate and Unfavourable-Bad are abbreviated to F, U-I and U-B respectively. ......................... 90
Table 3.71: The total assessed area and percentage of area of 2190 Humid dune slacks in Favourable and Unfavourable condition in 2011/2012. ............................................................................................ 92
Table 3.72: Positive impacts affecting 2190 Humid dune slacks, the percentage of sites (where the habitat occurs) which were affected, the degree of impact and the area of the habitat affected. ...... 93
Table 3.73: The five neutral impacts and activities affecting the greatest area of 2190 Humid dune slacks, the percentage of sites (where the habitat occurs) which were affected, the degree of impact and the area of the habitat affected. ....................................................................................................... 93
Table 3.74: The five negative impacts and activities affecting the greatest area of 2190 Humid dune slacks, the percentage of sites (where the habitat occurs) which were affected, the degree of impact and the area of the habitat affected. ....................................................................................................... 94
Table 3.75: Results of the conservation assessment of 2190 Humid dune slacks. ............................... 96
Table 3.76: Area of *21A0 Machair (surveyed and Unsurveyed) on the revised CMP maps and the SDM maps. .............................................................................................................................................. 97
Table 3.77: Area of *21A0 Machairs within the sample sites as represented on different maps. ....... 98
Table 3.78: Change in area of *21A0 Machairs since the baseline survey. ........................................... 99

Sand dunes monitoring survey – BEC Consultants Ltd. 2013 ____________________________
Table 3.79: The percentage of sites at which each criterion failed in the Structure and Functions assessment for *21A0 Machairs. ............................................................................................................. 99
Table 3.80: The results of the Structure and Functions assessment for *21A0 Machairs showing which of the criteria passed and failed. Favourable, Unfavourable-Inadequate and Unfavourable-Bad are abbreviated to F, U-I and U-B respectively. ........................................................................... 100
Table 3.81: The total assessed area and percentage of area of *21A0 Machairs in Favourable and Unfavourable condition in 2011/2012. ................................................................................................. 101
Table 3.82: Positive impacts affecting *21A0 Machairs, the percentage of sites (where the habitat occurs) which were affected, the degree of impact and the area of the habitat affected. ................. 101
Table 3.83: Five neutral impacts affecting the greatest area of *21A0 Machairs, the percentage of sites (where the habitat occurs) which were affected, the degree of impact and the area of the habitat affected. ..................................................................................................................................... 102
Table 3.84: Five negative impacts affecting the greatest area of *21A0 Machairs, the percentage of sites (where the habitat occurs) which were affected, the degree of impact and the area of the habitat affected. ..................................................................................................................................... 103
Table 3.85: Results of the conservation assessment of *21A0 Machairs. ............................................ 104

Sand dunes monitoring survey – BEC Consultants Ltd. 2013 ____________________________
List of Figures
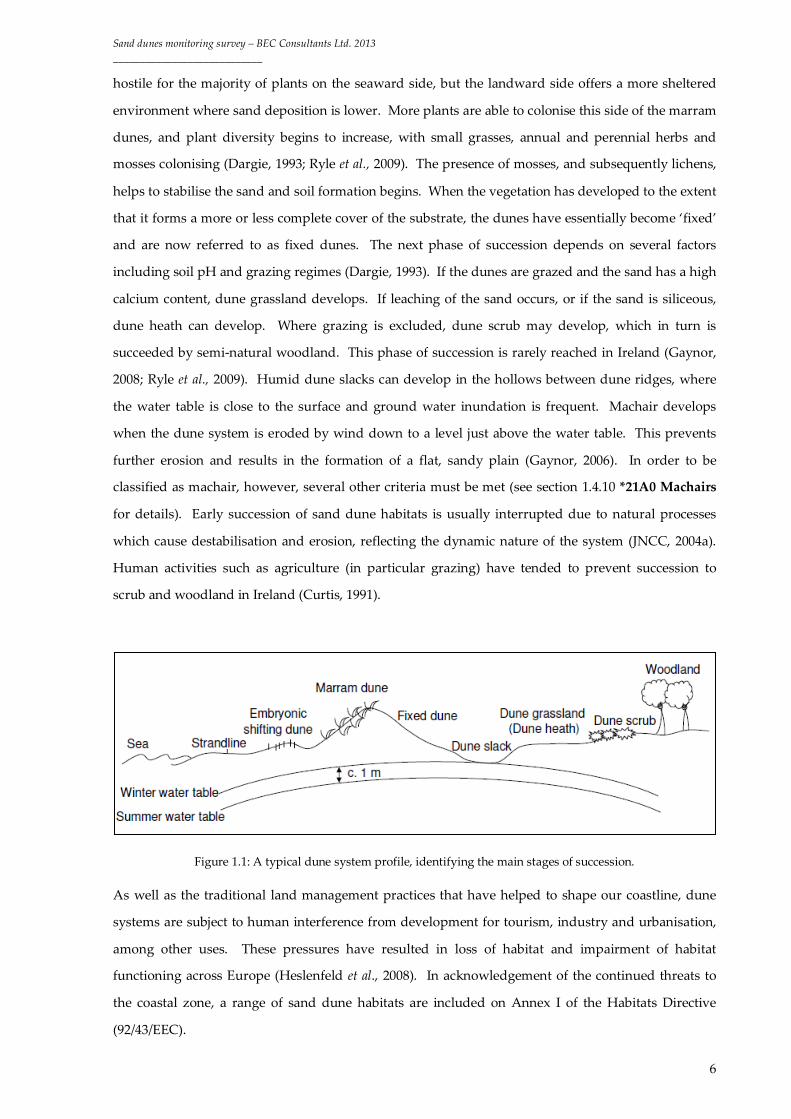
Figure 1.1: A typical dune system profile, identifying the main stages of succession. .........................6
Figure 1.2: 1210 Annual vegetation of drift lines at site 2 Baltray, Co Louth. .......................................8
Figure 1.3: 1220 Perennial vegetation of stony banks at site 133 Strandhill, Co. Sligo. ........................8
Figure 1.4: 2110 Embryonic shifting dunes at site 70 Inch, Co. Kerry....................................................9
Figure 1.5: 2120 Shifting dunes along the shoreline with Ammophila arenaria at site 160 Dooey, Co. Donegal. ................................................................................................................................................... 10
Figure 1.6: *2130 Fixed coastal dunes with herbaceous vegetation (grey dunes) at site 68 Rossbehy, Co. Kerry. ................................................................................................................................................. 10
Figure 1.7: *2140 Decalcified fixed dunes with Empetrum nigrum at site 148 Sheskinmore, Co. Donegal. ................................................................................................................................................... 11
Figure 1.8: *2150 Atlantic decalcified fixed dunes (Calluno-ulicetea) at site 147 Maghera, Co. Donegal. ................................................................................................................................................... 12
Figure 1.9: 2170 Dunes with Salix repens ssp. argentea (Salicion arenariae) at site 148 Sheskinmore, Co. Donegal. ................................................................................................................................................... 12
Figure 1.10: 2190 Humid dune slacks at site 162 Rinclevan, Co. Donegal, in summer (dry) and in spring (flooded). ...................................................................................................................................... 13
Figure 1.11: *21A0 Machairs at site 120 Doo Lough, Co. Mayo............................................................ 14
Figure 3.1: Distribution of SDM sites supporting 1210 Annual vegetation of drift lines with the area of the habitat indicated. .......................................................................................................................... 32
Figure 3.2: Distribution of SDM sites supporting 1220 Perennial vegetation of stony banks with the area of the habitat indicated. .................................................................................................................. 39
Figure 3.3: Distribution of SDM sites supporting 2110 Embryonic shifting dunes with the area of the habitat indicated. .............................................................................................................................. 46
Figure 3.4: Distribution of SDM sites supporting 2120 Marram dunes (white dunes) with the area of the habitat. ............................................................................................................................................... 53
Figure 3.5: Distribution of SDM sites supporting *2130 Fixed dunes (grey dunes) with the area of the habitat indicated. .............................................................................................................................. 61
Figure 3.6: Location of site 148, Sheskinmore, where *2140 Decalcified Empetrum dunes were found during the SDM with the area of the habitat indicated. ....................................................................... 71
Figure 3.7: Distribution of SDM sites supporting *2150 Decalcified dune heath with the area of the habitat indicated. ..................................................................................................................................... 74
Figure 3.8: Distribution of SDM sites supporting 2170 Dunes with creeping willow with the area of the habitat indicated. .............................................................................................................................. 79
Sand dunes monitoring survey – BEC Consultants Ltd. 2013 ____________________________
Figure 3.9: Distribution of SDM sites supporting 2190 Humid dune slacks with the area of the habitat indicated. ..................................................................................................................................... 87
Figure 3.10: Distribution of SDM sites supporting *21A0 Machairs with the area of the habitat indicated. ................................................................................................................................................. 97
Figure 4.1: Sea wall and rock armour at site 133 Strandhill, Co. Sligo. ............................................. 106
Figure 4.2: Different management regimes at Aghleam, Co Mayo, have resulted in a uniform sward in one field and a more tussocky structure on the other side of the fence. ....................................... 107
Figure 4.3: Scrub and woodland have developed due to past undergrazing at site 18 Mizen Head, Co. Wicklow. ......................................................................................................................................... 108
Figure 4.4: Damage due to overgrazing and burrowing by rabbits at site 64 Barley Cove, Co. Cork. ................................................................................................................................................................ 109
Figure 4.5: Pyrola rotundifolia growing in 2170 Dunes with creeping willow next to a conifer plantation at site 35 The Raven, Co. Wexford. .................................................................................... 110
Figure 4.6: Storm erosion at site 68 Rossbehy, Co. Kerry. Prior to 2010, the sand and shingle in the foreground was part of a long, vegetated sand spit which was attached to the dunes visible in the distance. ................................................................................................................................................. 111
Figure 4.7: Hippophae rhamnoides in *2130 Fixed dunes (grey dunes) at site 75 Castlegregory, Co. Kerry. ..................................................................................................................................................... 112

Sand dunes monitoring survey – BEC Consultants Ltd. 2013 ____________________________
1
Executive Summary
The Sand Dunes Monitoring Project (SDM) field survey commenced in June 2011 and was completed
in August 2012. The main aim of the project was to assess the conservation status of sand dune
habitats at a representative sample of sites to inform reporting under Article 17 of the Habitats
Directive. The next round of reporting, covering the period 2007-2012, is in 2013.
The National Parks and Wildlife Service (NPWS) selected 40 sites as a representative monitoring
sample. Annex I sand dune habitats were recorded from 39 sites. The remaining site (Lough
Yganavan, Co. Kerry) was investigated but no Annex I sand dune habitats were found there, so this
site is not dealt with in this report. The sites selected contained a substantial proportion of the total
national area for each habitat as assessed during the CMP, ranging from 19% for 1220 Perennial
vegetation of stony banks to 95% for 2170 Dunes with creeping willow.
This project focused on ten Annex I habitats. The number of sites (out of the 39 selected by NPWS)
where each Annex I habitat occurred and the total area recorded are shown in Table 1.
Table 1: Annex I habitats of Irish sand dunes, the number of sites where they were recorded during the SDM and the total area they occupy in the SDM sites. Priority Annex I habitats are indicated with an asterisk (*).
Annex I habitat Number of
sites
Total area
(ha)
1210 Annual vegetation of drift lines 21 14.12
1220 Perennial vegetation of stony banks 14 2.60
2110 Embryonic shifting dunes 36 90.27
2120 Shifting dunes along the shoreline with Ammophila arenaria (white dunes) 36 160.26
*2130 Fixed coastal dunes with herbaceous vegetation (grey dunes) 36 3368.04
*2140 Decalcified fixed dunes with Empetrum nigrum 1 <0.04
*2150 Atlantic decalcified fixed dunes (Calluno-Ulicetea) 4 31.52
2170 Dunes with Salix repens ssp. argentea (Salicion arenariae) 14 109.21
2190 Humid dune slacks 29 205.31
*21A0 Machairs 12 1139.56

Sand dunes monitoring survey – BEC Consultants Ltd. 2013 ____________________________
2
The conservation assessment methodology described in the Coastal Monitoring Project report was
refined to take the specific conditions affecting habitats in Ireland into account. This reduced the
requirement for expert judgement in assessing habitats, resulting in a more consistent approach.
The conservation status of each Annex I sand dune habitat present within each site was assessed, with
the exception of the two dune heath habitats (2140 and 2150), for which only the area and impacts
were noted. The conservation assessment took three parameters into account: Area, Structure and
Functions and Future Prospects.
*2130 Fixed coastal dunes with herbaceous vegetation (grey dunes) and *21A0 Machairs were
assessed as Unfavourable-Bad, while all the rest of the habitats were assessed as Unfavourable-
Inadequate. The conservation status of three habitats, 1220 Perennial vegetation of stony banks, 2170
Dunes with Salix repens ssp. argentea and *21A0 Machairs, had not changed since the CMP (their
trends remained stable), but the remainder were found to have deteriorating trends, although the
conservation status for each of these habitats remained the same. The most frequent reason for
deterioration was continued loss of habitat due to anthropogenic activities.
Area was assessed as Favourable for 2170 Dunes with Salix repens ssp. argentea and Unfavourable-
Inadequate for all the other habitats. Anthropogenic losses noted during the project were related to
recreation, development of land for housing, sports pitches, sea defences and water abstraction.
The Structure and Functions of *21A0 Machairs were assessed as Unfavourable-Bad, while Structure
and Functions were assessed as Unfavourable-Inadequate for the other habitats. Criteria which failed
frequently in the Structure and Functions assessments included damage due to disturbance,
alterations to the sediment dynamics, bare ground and sward height. Indicators of agricultural
improvement caused criteria to fail frequently in the four most landward habitats (*2130 Fixed coastal
dunes with herbaceous vegetation (grey dunes), 2170 Dunes with Salix repens ssp. argentea
(Salicion arenariae), 2190 Humid dune slacks and *21A0 Machairs).
The Future Prospects of two habitats, *2130 Fixed dunes (grey dunes) and *21A0 Machairs were
assessed as Unfavourable-Bad. The remaining habitats were assessed as Unfavourable-Inadequate.
The most frequently recorded impacts were associated with grazing (both appropriate and
inappropriate regimes), recreation, sea defences and encroachment by scrub, bracken and non-native
species. The effects of rabbit grazing were also important, being positive, neutral or negative
depending on the situation and rabbit population density.
Although the assessment showed that Annex I habitats of sand dunes in Ireland are in unfavourable
condition, many of the challenges faced by these habitats can be addressed with improved
management. Many sites would benefit from improved grazing regimes and a more structured
approach to recreational use of dunes. Encroachment by non-native species, in particular conifers and

Sand dunes monitoring survey – BEC Consultants Ltd. 2013 ____________________________
3
Hippophae rhamnoides, would require more targeted measures. In some cases, coastal constructions
and housing developments have resulted in permanent damage to sand dune habitats. The extent and
effects of water abstraction on 2190 Humid dune slacks and *21A0 Machairs are not fully understood.

Sand dunes monitoring survey – BEC Consultants Ltd. 2013 ____________________________
2
Acknowledgements
We are grateful for the contributions of Kristi Leyden, Kieran Connolly, Melinda Swann, Anne
Murray, Katharine Duff and George Smith in the field and for their comments regarding habitats and
methodology. Rachel Kavanagh and Rachel Merne provided invaluable support during the field
seasons. Thank you also to Orla Daly, Caoimhe Muldoon, Fionnuala O’Neill, Roisin Nash and Philip
Perrin for their assistance in the production of this report. Regional staff at NPWS gave background
information on sites which was much appreciated. Finally, we would like to thank Karen Gaynor,
Naomi Kingston and Deirdre Lynn who have been ready to answer questions and provide guidance
and data.
Sand dunes monitoring survey – BEC Consultants Ltd. 2013 ____________________________
3
1 Introduction
1.1 The Habitats Directive
The Habitats Directive was adopted in 1992 with the aim of conserving wild flora, fauna and habitats
and to maintain biodiversity within EU member states. Annex I habitats are habitats of European
importance which are listed under Annex I of the EU Habitats Directive (92/43/EEC). Under the
Directive, Ireland is obliged to report on the conservation status of Annex I habitats that occur within
its boundaries, and has committed to conserving these habitats (NPWS, 2008). The conservation
status of Annex I habitats is reported to the European Commission every six years under Article 17 of
the Directive. The next round of reporting, covering the period 2007-2012, will be in 2013.
1.2 Rationale and context of the project
The Coastal Monitoring Project (CMP) was a comprehensive national survey of all known sand dune
sites in Ireland. It was carried out between 2004 and 2006, and identified 181 sand dune sites of which
all but four were visited (Ryle et al., 2009). The results provided the basis for the first assessment of
Annex I sand dune habitats in Ireland under Article 17 of the Habitats Directive (NPWS, 2008). The
assessment criteria were derived primarily from the JNCC guidelines developed for use in the UK
(JNCC, 2004a), with some modifications for Irish conditions. This baseline report highlighted six
Annex I sand dune habitats that were not clearly defined in an Irish context, and suggested that
further research be carried out with a view to modifying the definitions and assessment criteria used
in future surveys (refer to Ryle et al. (2009) for more detail).
The Sand Dunes Monitoring Project (SDM) built on this original baseline survey with the aims of
reviewing and modifying the methodology used to collect and analyse conservation assessment data,
and assessing the conservation status of Irish Annex I sand dune habitats, thereby helping to fulfil the
reporting requirements for 2013. The SDM field survey commenced in June 2011 and was completed
in August 2012. A total of 40 sites were selected by the National Parks and Wildlife Service (NPWS),
to be used as a representative monitoring sample. The conservation status of each Annex I sand dune
habitat present within each site was assessed, with the exception of the two dune heath habitats.
Annex I sand dune habitats were recorded at 39 sites. The remaining site (Lough Yganavan, Co.
Kerry) was investigated but no Annex I sand dune habitats were found there, so it is not addressed in
this report. This report presents the refined assessment protocol developed in response to
recommendations made in the CMP, as well as the results of the conservation assessments carried out
in 2011/2012. It also makes recommendations for future monitoring work on Annex I sand dune
habitats.

Sand dunes monitoring survey – BEC Consultants Ltd. 2013 ____________________________
4
1.3 Assessment of Annex I habitats
Annex I habitats are assessed on the basis of their Range, Area, Structure and Functions, and Future
Prospects. An evaluation matrix for assessing the conservation status of Annex I habitats using these
four parameters is presented by Evans and Arvela (2011). A modified version of this matrix is given
in Table 1.1. Each of the aforementioned parameters can receive a score of “Favourable” (green),
“Unfavourable-Inadequate” (amber), or “Unfavourable-Bad” (red). “Favourable” is used when the
habitat can be expected to prosper without any change to existing management or policies.
“Unfavourable-Inadequate” is used in situations where a change in management or policy is required
to allow the habitat to prosper, but the danger of extinction is not high. “Unfavourable-Bad” is used
when the habitat is in danger of disappearance. Annex I habitats should be managed to attain and
maintain “Favourable” conservation status within their range in each Member State (NPWS, 2008).
Table 1.1: Summary matrix of the parameters and conditions required to assess the conservation status of
habitats. Modified from Evans and Arvela (2011).
Parameter Green Amber Red
Range Stable/increasing >0% - <1% decline/year >1% decline in range/year over specified period
Area Stable/increasing >0% - <1% decline/year >1% decline in area/year over specified period
Structure and Functions
Habitat structure in good condition and functioning normally; typical species present
Any combination other than those described under green or red
>25% of habitat has structure, function or species composition in unfavourable condition
Future Prospects Excellent, no significant impact from threats expected. Long-term viability assured
Between green and red Bad, severe impact from threats expected; habitat expected to decline or disappear
Overall assessment of conservation status
All green One or more amber but no red
One or more red
The guidance provided in Evans and Arvela (2011) relates to the national conservation assessments of
Annex I habitats. Annex I sand dune habitats can also be assessed at a site level using a similar
approach, based on the parameters Area, Structure and Functions and Future Prospects. For example,
a habitat on a particular site which has experienced no loss of area between this monitoring survey
and the CMP (Ryle et al., 2009) is assessed as Favourable for that parameter. If the area has decreased
by less than 1% per year since the previous assessment, the Area parameter is assessed as
Unfavourable-Inadequate and if it has decreased by more than that, it is assessed as Unfavourable-
Sand dunes monitoring survey – BEC Consultants Ltd. 2013 ____________________________
5
Bad. The Structure and Functions of the habitat are assessed using habitat-specific criteria (see
methodology). The last parameter, Future Prospects, is assessed on the basis of the current and
foreseeable effects of impacts and activities on the habitat at the individual site level. As with the
national assessment, the overall conservation status of the habitat for each site is determined by the
least positive score of the three parameters.
1.4 Annex I sand dune habitats in Ireland
Sand dune habitats occur in complex, dynamic systems, where hostile environmental conditions, such
as unstable substrate and exposure to wind and salt spray, can result in the presence of specialised
plant species and unique vegetation communities (JNCC, 2004a). The ecology and geomorphology of
sand dunes are also heavily influenced by past and current human activities including grazing, the
introduction of rabbits, crop growing, military use, recreation and coastal defences (Dargie, 1995).
Sand dune systems in Ireland have developed over the last 5,000 years and are primarily derived from
offshore glacial sediments that have been reworked by tides and wind. There has been no widespread
development of new dunes since the depletion of these offshore sediments, with current growth
restricted to the local reworking of existing sediments (Gaynor, 2008). When discussing succession
and the vegetation communities of sand dune habitats it is important to realise that the physical
components (e.g. edaphic factors, hydrology, climate) and biological components (i.e. plant species)
are directly linked to each other and the interactions between them help drive succession (Quigley,
1991).
Most sand dune systems provide good examples of the different stages of succession, from strandline
to mobile dune to fixed dune (Figure 1.1). Drift material and gravel along the high tide mark contains
nitrogenous organic matter and offer some shelter, which allows seeds of certain plants to germinate
and form strandline vegetation. Small patches of sand begin to accumulate around these strandline
plants and drift material, and salt- and drought-tolerant species, such as Elytrigia juncea and Leymus
arenarius, begin to colonise. These species impede airborne sand resulting in the initiation of
embryonic dune formation. Embryonic shifting dunes are transient in nature, either being removed
by storms or replaced by the next phase of succession (JNCC, 2004a; Gaynor, 2008). In the latter case,
the dunes continue to accumulate and grow with fresh sand deposits. As the sand is elevated above
the normal tide levels it becomes less salty and conditions become suitable for Ammophila arenaria
(marram grass) to colonise (Ryle et al., 2009). Marram dunes, so named due to the dominance of
Ammophila arenaria, are located just out of reach of the highest tide but where there is still active sand
movement. Ammophila arenaria is the main dune building species and can keep pace with up to 1 m of
fresh sand deposition per annum. By trapping sand and binding the dune together, Ammophila
arenaria allows dunes to build up to a considerable height (Dargie, 1993). Conditions are still too
Sand dunes monitoring survey – BEC Consultants Ltd. 2013 ____________________________
6
hostile for the majority of plants on the seaward side, but the landward side offers a more sheltered
environment where sand deposition is lower. More plants are able to colonise this side of the marram
dunes, and plant diversity begins to increase, with small grasses, annual and perennial herbs and
mosses colonising (Dargie, 1993; Ryle et al., 2009). The presence of mosses, and subsequently lichens,
helps to stabilise the sand and soil formation begins. When the vegetation has developed to the extent
that it forms a more or less complete cover of the substrate, the dunes have essentially become ‘fixed’
and are now referred to as fixed dunes. The next phase of succession depends on several factors
including soil pH and grazing regimes (Dargie, 1993). If the dunes are grazed and the sand has a high
calcium content, dune grassland develops. If leaching of the sand occurs, or if the sand is siliceous,
dune heath can develop. Where grazing is excluded, dune scrub may develop, which in turn is
succeeded by semi-natural woodland. This phase of succession is rarely reached in Ireland (Gaynor,
2008; Ryle et al., 2009). Humid dune slacks can develop in the hollows between dune ridges, where
the water table is close to the surface and ground water inundation is frequent. Machair develops
when the dune system is eroded by wind down to a level just above the water table. This prevents
further erosion and results in the formation of a flat, sandy plain (Gaynor, 2006). In order to be
classified as machair, however, several other criteria must be met (see section 1.4.10 *21A0 Machairs
for details). Early succession of sand dune habitats is usually interrupted due to natural processes
which cause destabilisation and erosion, reflecting the dynamic nature of the system (JNCC, 2004a).
Human activities such as agriculture (in particular grazing) have tended to prevent succession to
scrub and woodland in Ireland (Curtis, 1991).
Figure 1.1: A typical dune system profile, identifying the main stages of succession.
As well as the traditional land management practices that have helped to shape our coastline, dune
systems are subject to human interference from development for tourism, industry and urbanisation,
among other uses. These pressures have resulted in loss of habitat and impairment of habitat
functioning across Europe (Heslenfeld et al., 2008). In acknowledgement of the continued threats to
the coastal zone, a range of sand dune habitats are included on Annex I of the Habitats Directive
(92/43/EEC).
Sand dunes monitoring survey – BEC Consultants Ltd. 2013 ____________________________
7
Ten Annex I habitats occur within sand dune systems in Ireland:
1210 Annual vegetation of drift lines
1220 Perennial vegetation of stony banks
2110 Embryonic shifting dunes
2120 Shifting dunes along the shoreline with Ammophila arenaria (white dunes)
*2130 Fixed coastal dunes with herbaceous vegetation (grey dunes)
*2140 Decalcified fixed dunes with Empetrum nigrum
*2150 Atlantic decalcified fixed dunes (Calluno-Ulicetea)
2170 Dunes with Salix repens ssp. argentea (Salicion arenariae)
2190 Humid dune slacks
*21A0 Machairs
The four habitats with an asterisk are priority habitats, i.e. habitats whose range is mainly within the
EU and which are at risk of disappearing (Commission of the European Communities, 2007). Of the
ten habitats listed, eight are exclusively sand dune habitats while two, 1210 Annual vegetation of
drift lines and 1220 Perennial vegetation of stony banks, are also found in the absence of dune
systems. Each habitat is described in more detail below.
1.4.1 1210 Annual vegetation of drift lines
This type of vegetation occurs on sandy, shingle or stony substrate at the upper part of the strand,
around the high tide mark. Water-borne material including organic matter is deposited on the shore
and provides nutrients and a seed source. The vegetation predominantly consists of annual species,
such as Atriplex species, Cakile maritima and Salsola kali (JNCC, 2004a), which are highly specialised to
deal with the harsh conditions of high salinity, wind exposure and drought (NPWS, 2008). This
habitat is generally very species-poor, fragmented and tends not to occupy large areas due to its
narrow, linear nature (Dargie, 1995). It exists in a state of instability and may be absent in some years
due to natural and/or anthropogenic causes (JNCC, 2004a).
The habitat description of 1210 Annual vegetation of drift lines provided by the European
Commission changed in the years between the CMP and the SDM. When the CMP was carried out,
this habitat was defined as occurring on sand or shingle substrate (Ryle et al., 2009). In contrast, the
2007 Interpretation Manual of European Union Habitats states that gravel or shingle should provide at
least part of the substrate for 1210 Annual vegetation of drift lines and if the substrate is entirely
sandy, this type of vegetation should be considered under 2110 Embryonic shifting dunes where

Sand dunes monitoring survey – BEC Consultants Ltd. 2013 ____________________________
8
appropriate (Commission of the European Communities, 2007). Following consultation with staff at
NPWS, it was not considered appropriate to alter the interpretation of the habitat in an Irish context.
During the SDM, any vegetation occurring around the high tide mark, dominated by broadleaved
herbs and associated with organic drift line deposits was considered here, even if it occurred only on
sandy substrate. This is consistent with the approach taken during the baseline survey (Ryle et al.,
2009). Figure 1.2 shows 1210 Annual vegetation of drift lines growing at site 2 Baltray, Co. Louth.
Figure 1.2: 1210 Annual vegetation of drift lines at site 2 Baltray, Co Louth.
1.4.2 1220 Perennial vegetation of stony banks
This habitat occurs on shingle beaches (cobbles and pebbles) at and above the high tide mark. Similar
to 1210 Annual vegetation of drift lines, it is an unstable habitat that can move from year to year and
is affected by stormy weather. Beach fringing vegetation is a relatively species-poor and particularly
unstable version of this habitat (Moore and Wilson, 1999). It tends to be dominated by perennial
species, typically including Honckenya peploides, Rumex crispus, Beta vulgaris ssp. maritima, Crithmum
maritimum and Tripleurospermum maritimum. The rare plants Crambe maritima and Mertensia maritima
are also associated with this community (Fossitt, 2000). Species diversity is determined by the degree
of exposure and by substrate stability, coarseness and particle size (Moore and Wilson, 1999; NPWS,
2008). Figure 1.3 shows 1220 Perennial vegetation of stony banks at site 133 Strandhill, Co. Sligo.
Figure 1.3: 1220 Perennial vegetation of stony banks at site 133 Strandhill, Co. Sligo.
Sand dunes monitoring survey – BEC Consultants Ltd. 2013 ____________________________
9
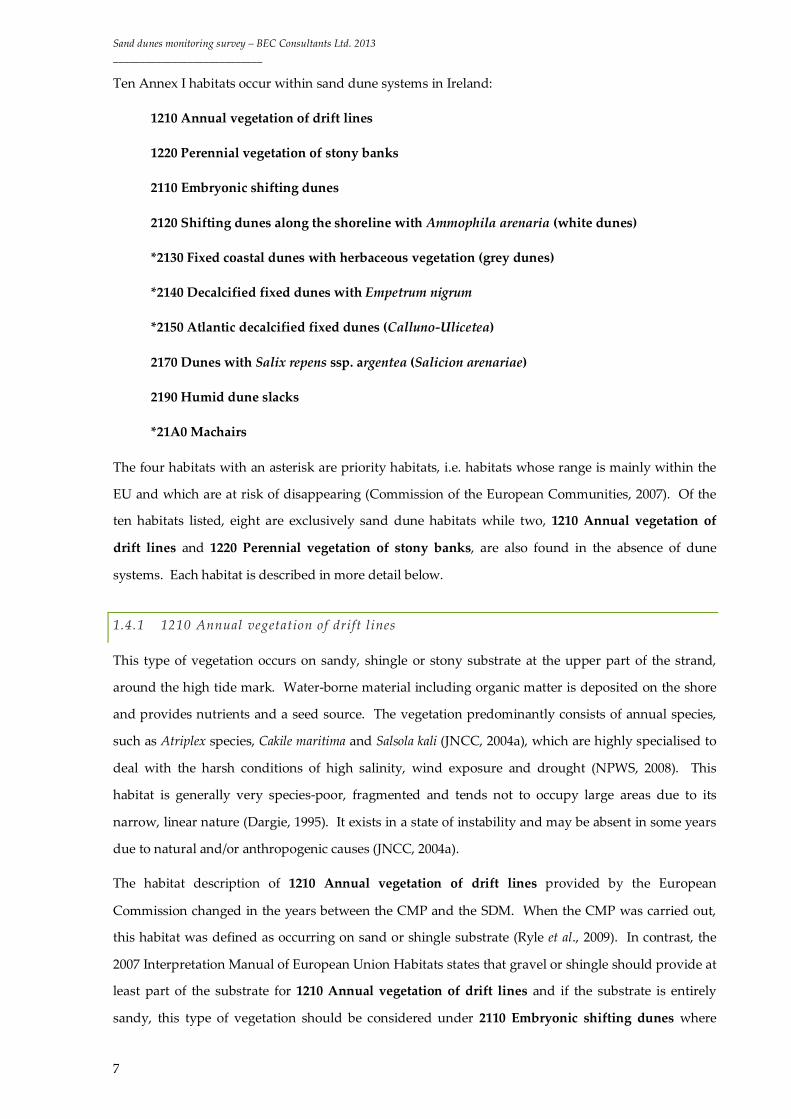
1.4.3 2110 Embryonic shifting dunes
Embryonic shifting dunes are low sand mounds (generally less than a metre high) found between the
high tide mark and 2120 Shifting dunes along the shoreline with Ammophila arenaria (white
dunes). They are unstable habitats that occur where wind-blown sand is common and they are still
vulnerable to saltwater intrusion (Radley, 1994). They represent the initial phase of dune formation
and are largely unvegetated (Fossitt, 2000). They typically form where sand gathers around salt-
tolerant species such as Leymus arenarius and Elytrigia juncea. Other plants such as Cakile maritima,
Honckenya peploides and Salsola kali may also occur and Ammophila arenaria is generally absent (Fossitt,
2000). They can be very short-lived habitats, which are subject to natural erosion processes and are
susceptible to removal by storms or high tides. Figure 1.4 shows 2110 Embryonic shifting dunes at
site 70 Inch.
Figure 1.4: 2110 Embryonic shifting dunes at site 70 Inch, Co. Kerry.
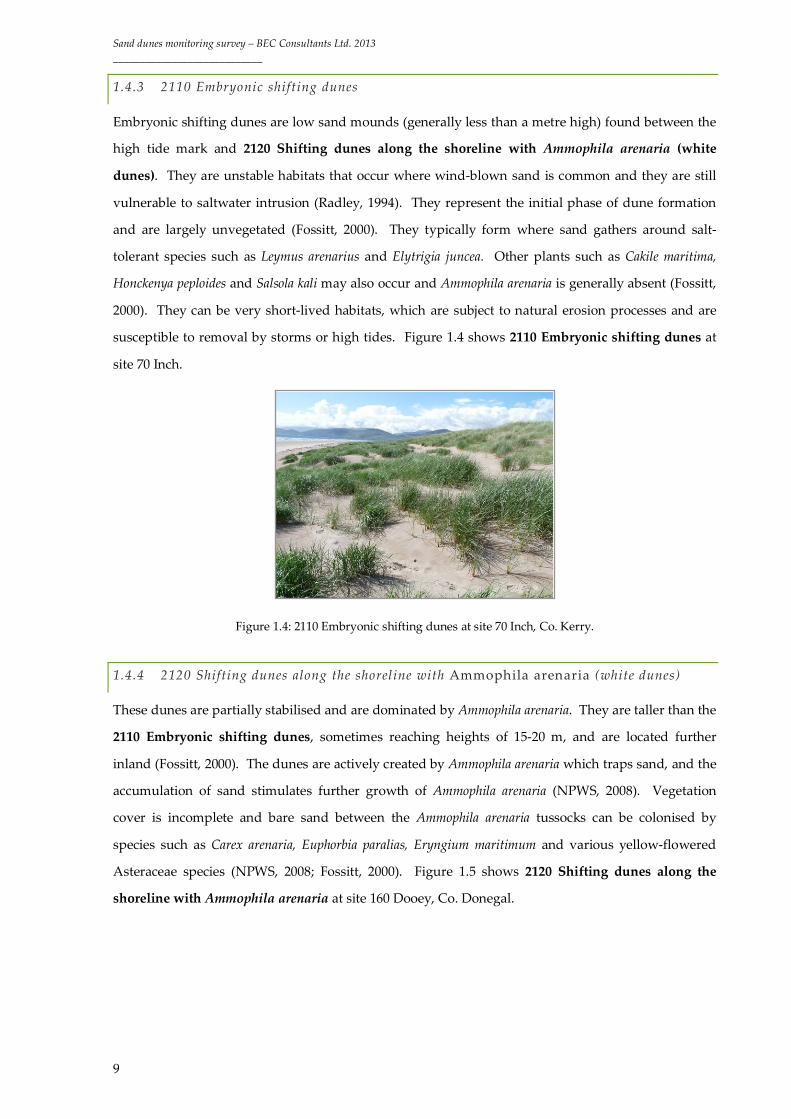
1.4.4 2120 Shifting dunes along the shoreline with Ammophila arenaria (white dunes)
These dunes are partially stabilised and are dominated by Ammophila arenaria. They are taller than the
2110 Embryonic shifting dunes, sometimes reaching heights of 15-20 m, and are located further
inland (Fossitt, 2000). The dunes are actively created by Ammophila arenaria which traps sand, and the
accumulation of sand stimulates further growth of Ammophila arenaria (NPWS, 2008). Vegetation
cover is incomplete and bare sand between the Ammophila arenaria tussocks can be colonised by
species such as Carex arenaria, Euphorbia paralias, Eryngium maritimum and various yellow-flowered
Asteraceae species (NPWS, 2008; Fossitt, 2000). Figure 1.5 shows 2120 Shifting dunes along the
shoreline with Ammophila arenaria at site 160 Dooey, Co. Donegal.
Sand dunes monitoring survey – BEC Consultants Ltd. 2013 ____________________________
10
Figure 1.5: 2120 Shifting dunes along the shoreline with Ammophila arenaria at site 160 Dooey, Co. Donegal.
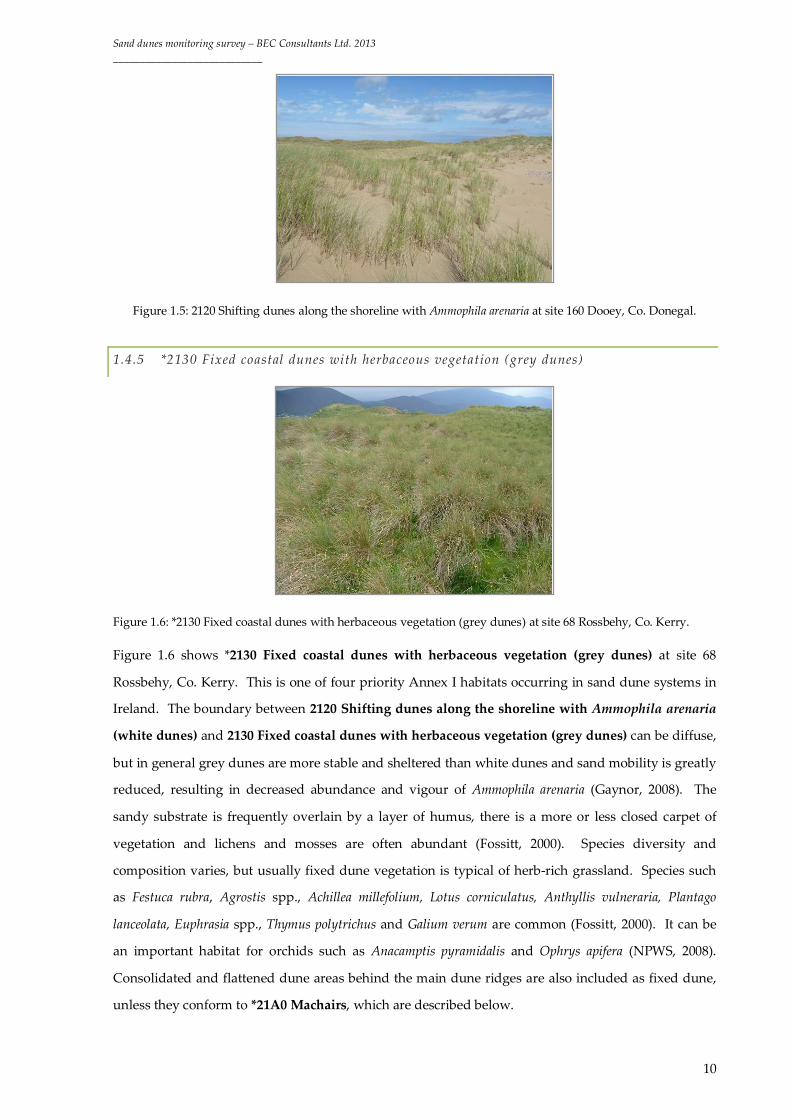
1.4.5 *2130 Fixed coastal dunes with herbaceous vegetation (grey dunes)
Figure 1.6: *2130 Fixed coastal dunes with herbaceous vegetation (grey dunes) at site 68 Rossbehy, Co. Kerry.
Figure 1.6 shows *2130 Fixed coastal dunes with herbaceous vegetation (grey dunes) at site 68
Rossbehy, Co. Kerry. This is one of four priority Annex I habitats occurring in sand dune systems in
Ireland. The boundary between 2120 Shifting dunes along the shoreline with Ammophila arenaria
(white dunes) and 2130 Fixed coastal dunes with herbaceous vegetation (grey dunes) can be diffuse,
but in general grey dunes are more stable and sheltered than white dunes and sand mobility is greatly
reduced, resulting in decreased abundance and vigour of Ammophila arenaria (Gaynor, 2008). The
sandy substrate is frequently overlain by a layer of humus, there is a more or less closed carpet of
vegetation and lichens and mosses are often abundant (Fossitt, 2000). Species diversity and
composition varies, but usually fixed dune vegetation is typical of herb-rich grassland. Species such
as Festuca rubra, Agrostis spp., Achillea millefolium, Lotus corniculatus, Anthyllis vulneraria, Plantago
lanceolata, Euphrasia spp., Thymus polytrichus and Galium verum are common (Fossitt, 2000). It can be
an important habitat for orchids such as Anacamptis pyramidalis and Ophrys apifera (NPWS, 2008).
Consolidated and flattened dune areas behind the main dune ridges are also included as fixed dune,
unless they conform to *21A0 Machairs, which are described below.

Sand dunes monitoring survey – BEC Consultants Ltd. 2013 ____________________________
11
Between the mobile and fixed dunes there is a zone of vegetation that is more open than fixed dune
vegetation, but is more species-rich than mobile dunes. Yellow composites, Linum catharticum and
bryophytes such as Syntrichia spp. can be frequent here, as well as grasses such as Ammophila arenaria
and Festuca rubra. This semi-fixed, transitional zone is considered part of the fixed dune habitat for
the purposes of this survey, for both mapping and assessment purposes.
1.4.6 *2140 Decalcified fixed dunes with Empetrum nigrum
These dunes are similar to *2130 Fixed coastal dunes with herbaceous vegetation (grey dunes) in that
sand mobility has decreased/ceased and some soil development is evident. This priority habitat is
extremely rare in Ireland, probably due to the long history of grazing on Irish sand dune systems and
also due to the highly calcareous nature of many of Ireland’s sand dune systems (Gaynor, 2008). It
develops when heath species colonise decalcified fixed dunes (Fossitt, 2000), with the substrate
becoming more acidic due to leaching of calcium over time (NPWS, 2008). This habitat is
characterised by Empetrum nigrum, in conjunction with Calluna vulgaris, Erica tetralix, Ulex spp. and
Carex arenaria. Lack of grazing plays an important role in the development and maintenance of this
habitat (Gaynor, 2008). Figure 1.7 shows *2140 Decalcified fixed dunes with Empetrum nigrum at site
148 Sheskinmore, Co. Donegal.
Figure 1.7: *2140 Decalcified fixed dunes with Empetrum nigrum at site 148 Sheskinmore, Co. Donegal.
1.4.7 *2150 Atlantic decalcified fixed dunes (Calluno-Ulicetea)
The second heath-dominated dune community is also a priority habitat. Again, it is found in dune
systems where the substrate has become decalcified or acidified. The species present within this
habitat are almost identical to those present in *2140 Decalcified fixed dunes with Empetrum nigrum,
but Empetrum nigrum is absent (NPWS, 2008). In fact, the distinction between the two habitats is very
weak (Gaynor, 2008). Calluna vulgaris, Erica spp., Ulex spp. and Carex arenaria are typical, and lichens,
especially Cladonia spp., can be locally abundant (NPWS, 2008). This habitat often forms a mosaic
with fixed dune vegetation communities, and although the presence of dwarf shrubs is the most

Sand dunes monitoring survey – BEC Consultants Ltd. 2013 ____________________________
12
distinguishing feature (Gaynor, 2008), they usually have a low cover (JNCC, 2004b). As with *2140
Decalcified fixed dunes with Empetrum nigrum, it is extremely rare, with only a few known sites in
Ireland (Gaynor, 2008; NPWS, 2008). Figure 1.8 shows *2150 Atlantic decalcified fixed dunes
(Calluno-ulicetea) at site 147 Maghera, Co. Donegal.
Figure 1.8: *2150 Atlantic decalcified fixed dunes (Calluno-ulicetea) at site 147 Maghera, Co. Donegal.
1.4.8 2170 Dunes with Salix repens ssp. argentea (Salic ion arenariae)
Figure 1.9: 2170 Dunes with Salix repens ssp. argentea (Salicion arenariae) at site 148 Sheskinmore, Co. Donegal.
Figure 1.9 shows 2170 Dunes with Salix repens ssp. argentea (Salicion arenariae) at site 148
Sheskinmore, Co. Donegal. The distinction between this habitat and 2190 Humid dune slacks is very
difficult to determine as the two are closely associated (Gaynor, 2008), and often form a complex
mosaic with each other and with fixed dunes (Ryle et al., 2009). This habitat is typically found either
on sandy hummocks within dune slacks, or on the sides of dune ridges adjacent to slacks. In order to
be classified as 2170 Dunes with Salix repens ssp. argentea (Salicion arenariae), the area in question
should be beyond the influence of the water table, either through elevation of the surface of the
ground (NPWS, 2008) or by a lowering of the water table (Gaynor, 2008). It is characterised by
dominance of Salix repens, which often forms a dense ground cover. Moisture-loving plant species
typically associated with dune slacks should be absent or noticeably reduced (NPWS, 2008). Other
Sand dunes monitoring survey – BEC Consultants Ltd. 2013 ____________________________
13
species associated with this habitat include Holcus lanatus, Carex flacca and Carex arenaria, Agrostis
stolonifera, Ononis repens and Lotus corniculatus (Ryle et al. 2009; NPWS 2008; Fossitt, 2000).
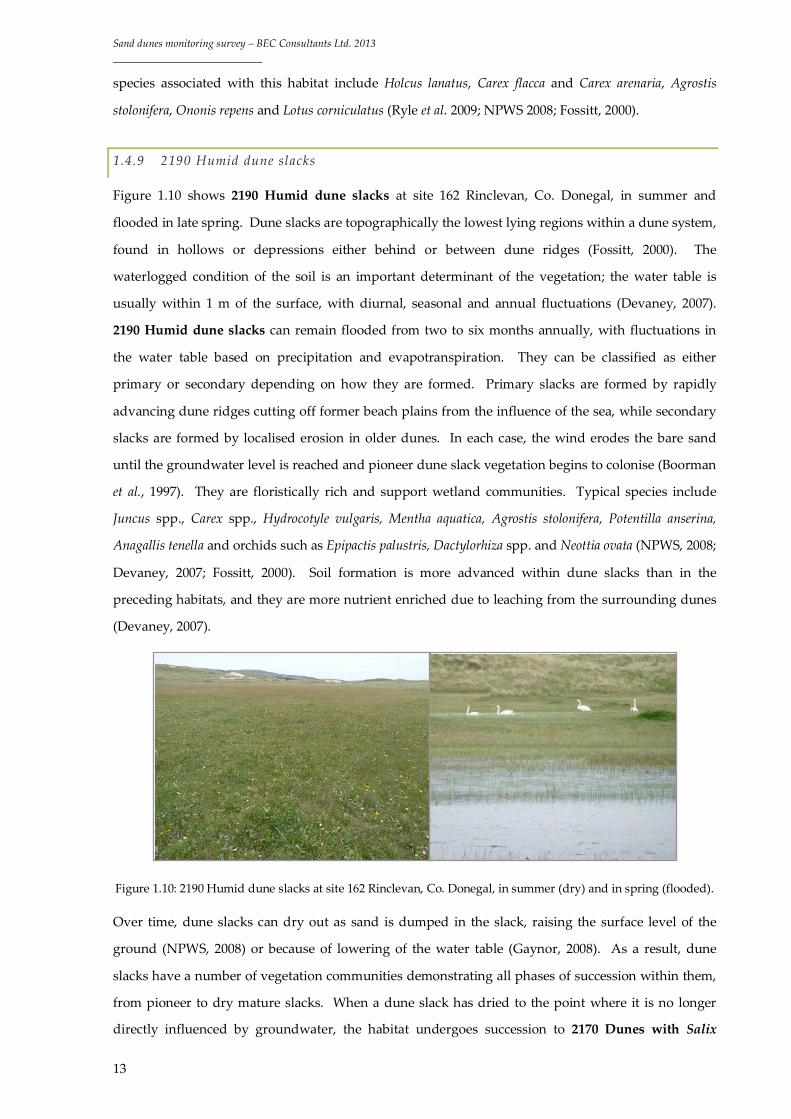
1.4.9 2190 Humid dune slacks
Figure 1.10 shows 2190 Humid dune slacks at site 162 Rinclevan, Co. Donegal, in summer and
flooded in late spring. Dune slacks are topographically the lowest lying regions within a dune system,
found in hollows or depressions either behind or between dune ridges (Fossitt, 2000). The
waterlogged condition of the soil is an important determinant of the vegetation; the water table is
usually within 1 m of the surface, with diurnal, seasonal and annual fluctuations (Devaney, 2007).
2190 Humid dune slacks can remain flooded from two to six months annually, with fluctuations in
the water table based on precipitation and evapotranspiration. They can be classified as either
primary or secondary depending on how they are formed. Primary slacks are formed by rapidly
advancing dune ridges cutting off former beach plains from the influence of the sea, while secondary
slacks are formed by localised erosion in older dunes. In each case, the wind erodes the bare sand
until the groundwater level is reached and pioneer dune slack vegetation begins to colonise (Boorman
et al., 1997). They are floristically rich and support wetland communities. Typical species include
Juncus spp., Carex spp., Hydrocotyle vulgaris, Mentha aquatica, Agrostis stolonifera, Potentilla anserina,
Anagallis tenella and orchids such as Epipactis palustris, Dactylorhiza spp. and Neottia ovata (NPWS, 2008;
Devaney, 2007; Fossitt, 2000). Soil formation is more advanced within dune slacks than in the
preceding habitats, and they are more nutrient enriched due to leaching from the surrounding dunes
(Devaney, 2007).
Figure 1.10: 2190 Humid dune slacks at site 162 Rinclevan, Co. Donegal, in summer (dry) and in spring (flooded).
Over time, dune slacks can dry out as sand is dumped in the slack, raising the surface level of the
ground (NPWS, 2008) or because of lowering of the water table (Gaynor, 2008). As a result, dune
slacks have a number of vegetation communities demonstrating all phases of succession within them,
from pioneer to dry mature slacks. When a dune slack has dried to the point where it is no longer
directly influenced by groundwater, the habitat undergoes succession to 2170 Dunes with Salix
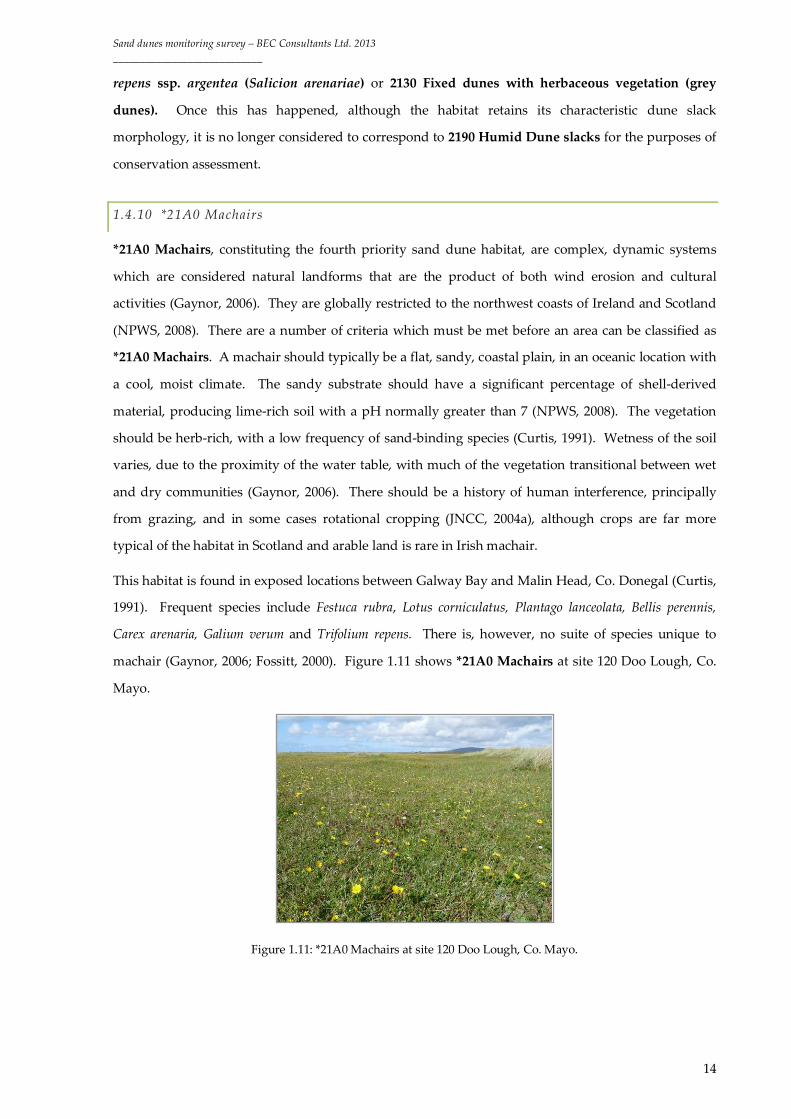
Sand dunes monitoring survey – BEC Consultants Ltd. 2013 ____________________________
14
repens ssp. argentea (Salicion arenariae) or 2130 Fixed dunes with herbaceous vegetation (grey
dunes). Once this has happened, although the habitat retains its characteristic dune slack
morphology, it is no longer considered to correspond to 2190 Humid Dune slacks for the purposes of
conservation assessment.
1.4.10 *21A0 Machairs
*21A0 Machairs, constituting the fourth priority sand dune habitat, are complex, dynamic systems
which are considered natural landforms that are the product of both wind erosion and cultural
activities (Gaynor, 2006). They are globally restricted to the northwest coasts of Ireland and Scotland
(NPWS, 2008). There are a number of criteria which must be met before an area can be classified as
*21A0 Machairs. A machair should typically be a flat, sandy, coastal plain, in an oceanic location with
a cool, moist climate. The sandy substrate should have a significant percentage of shell-derived
material, producing lime-rich soil with a pH normally greater than 7 (NPWS, 2008). The vegetation
should be herb-rich, with a low frequency of sand-binding species (Curtis, 1991). Wetness of the soil
varies, due to the proximity of the water table, with much of the vegetation transitional between wet
and dry communities (Gaynor, 2006). There should be a history of human interference, principally
from grazing, and in some cases rotational cropping (JNCC, 2004a), although crops are far more
typical of the habitat in Scotland and arable land is rare in Irish machair.
This habitat is found in exposed locations between Galway Bay and Malin Head, Co. Donegal (Curtis,
1991). Frequent species include Festuca rubra, Lotus corniculatus, Plantago lanceolata, Bellis perennis,
Carex arenaria, Galium verum and Trifolium repens. There is, however, no suite of species unique to
machair (Gaynor, 2006; Fossitt, 2000). Figure 1.11 shows *21A0 Machairs at site 120 Doo Lough, Co.
Mayo.
Figure 1.11: *21A0 Machairs at site 120 Doo Lough, Co. Mayo.

Sand dunes monitoring survey – BEC Consultants Ltd. 2013 ____________________________
15
1.5 Nomenclature of the Annex I habitats
The nomenclature of the ten Annex I sand dune habitats described above follows the Interpretation
Manual of European Union habitats (Commission of the European Communities, 2007). There is an
abbreviated version of some of the habitat names used in The Status of the EU Protected Habitats and
Species in Ireland (NPWS, 2008). These abbreviations have been adopted for the remainder of this
document so that 2120 Shifting dunes along the shoreline with Ammophila arenaria (white dunes)
are referred to as 2120 Marram dunes (white dunes), *2130 Fixed coastal dunes with herbaceous
vegetation (grey dunes) are referred to as *2130 Fixed dunes (grey dunes), and 2170 Dunes with
Salix repens ssp. argentea (Salicion arenariae) are referred to as 2170 Dunes with creeping willow.

Sand dunes monitoring survey – BEC Consultants Ltd. 2013 ____________________________
16
2 Methodology
The primary focus of this project was to assess the conservation status of eight Annex I sand dune
habitats in Ireland at a representative sample of sand dune sites. Habitat assessments were carried
out for 1210 Annual vegetation of drift lines, 1220 Perennial vegetation of stony banks, 2110
Embryonic shifting dunes, 2120 Marram dunes (white dunes), *2130 Fixed dunes (grey dunes), 2170
Dunes with creeping willow, 2190 Humid dune slacks and *21A0 Machairs. Information regarding
area and impacts that were relevant to the conservation assessment of *2140 Decalcified dunes with
Empetrum nigrum and *2150 Atlantic decalcified dunes (Calluno-Ulicetea) were also recorded, but
no assessment was carried out. The conservation assessment methodology was designed to
complement the EU guidelines on assessing conservation status under Article 17 of the Habitats
Directive (Evans and Arvela, 2011).
2.1 Site Selection
A sample of 40 sand dune sites was selected by NPWS from the 181 sites identified during the Coastal
Monitoring Project (CMP) (Ryle et al., 2009). The sites were chosen to be representative of the range of
habitat types and geographic locations of sand dune systems in Ireland and they contained a
substantial proportion of the total national area for each habitat as assessed during the CMP, ranging
from 19% for 1220 Perennial vegetation of stony banks to 95% for 2170 Dunes with creeping willow
(Table 2.1).
Table 2.1: Area of Annex I sand dune habitats recorded during the CMP within all CMP sites and within the sites
selected for survey during the SDM, and the proportion of each habitat accounted for by the sites selected for
sample during the SDM.
Annex I habitat Total habitat
area (ha) (n=181)
Area in the sample
sites (ha) (n=39)
Proportion in the
sample sites (%)
1210 Annual vegetation of drift lines 53.15 21.32 40.1
1220 Perennial vegetation of stony banks 31.40 5.96 19.0
2110 Embryonic shifting dunes 171.39 62.24 36.3
2120 Marram dunes (white dunes) 405.75 231.44 57.0
*2130 Fixed dunes (grey dunes) 7058.32 3296.31 46.7
*2140 Decalcified Empetrum dunes 1.73 1.26 72.8
*2150 Decalcified dune heath 77.78 66.73 85.8
2170 Dunes with creeping willow 103.59 97.97 94.6
2190 Humid dune slacks 212.25 159.23 75.0
*21A0 Machairs 2743.16 932.14 34.0

Sand dunes monitoring survey – BEC Consultants Ltd. 2013 ____________________________
17
Table 2.2 shows the sites visited in 2011/2012, the counties where they are located and Special Areas
of Conservation (SACs) with which they coincide. One site, Lough Yganavan, was listed in Ryle et al.
(2009), but no sand dune habitats were mapped there when it was visited during the SDM. Field
work was carried out in July to September 2011 (30 sites) and May to August 2012 (10 sites).
Table 2.2: Sites surveyed during the SDM, their counties and SAC(s) with which they coincide.
SDM site no.
Site name County SAC no.
SAC name Survey year
2 Baltray Louth 001957 Boyne Coast And Estuary 2011 3 Mornington Meath 001957 Boyne Coast And Estuary 2011 9 Portmarnock Dublin 000199 Baldoyle Bay 2011 10 North Bull Dublin 000206 North Dublin Bay 2011 11 South Bull Dublin 000206 North Dublin Bay 2011 17 Brittas Bay Wicklow 000729 Buckroney-Brittas Dunes And Fen 2011 18 Mizen Head Wicklow 000729 Buckroney-Brittas Dunes And Fen 2011 28 Cahore point Wexford 000700 Cahore Polders And Dunes 2011 35 The Raven Wexford 000710 Raven Point Nature Reserve 2011 41 Ballyteige
Burrow Wexford 000696 Ballyteige Burrow 2012
43 Grange Wexford 000697 Bannow Bay 2011 46 Tramore Waterford 000671 Tramore Dunes And Backstrand 2012 58 Inchydoney Cork 000091 Clonakilty Bay 2011 60 Castlefreke Cork 001061 Kilkeran Lake And Castlefreke Dunes 2011 64 Barley Cove Cork 001040 Barley Cove To Ballyrisode Point 2011 68 Rosbehy Kerry 000343 Castlemaine Harbour 2011 70 Inch Kerry 000343 Castlemaine Harbour 2012 75 Castlegregory Kerry 002070 Tralee Bay And Magharees Peninsula, West
To Cloghane 2011
77 Banna Strand Kerry 000332 Akeragh, Banna And Barrow Harbour 2011 87 Fanore Clare 000020 Black Head-Poulsallagh Complex 2011 97 Dog’s Bay Galway 001257 Dog's Bay 2011 100 Aillebrack Galway 002074 Slyne Head Peninsula 2011 101 Doonloughan Galway 002074 Slyne Head Peninsula 2011 104 Omey Island Galway 001309 Omey Island Machair 2011 108 Dooaghtry Mayo 001932 Mweelrea/Sheeffry/Erriff Complex 2012 120 Doo Lough Mayo 000470 Mullet/Blacksod Bay Complex 2011 124 Aghleam Mayo 000470 Mullet/Blacksod Bay Complex 2012 128 Garter Hill Mayo 000500 Glenamoy Bog Complex 2011 131 Bartragh Island Mayo 000458 Killala Bay/Moy Estuary 2011
†133 Strandhill Sligo 000627 Cummeen Strand/Drumcliff Bay (Sligo Bay) 2011 †133 Strandhill Sligo 000622 Ballysadare Bay 2011 147 Maghera Donegal 000190 Slieve Tooey/Tormore Island/Loughros Beg
Bay 2012
148 Sheskinmore Donegal 000197 West Of Ardara/Maas Road 2012 155 Kincaslough Donegal 001141 Gweedore Bay And Islands 2011 157 Derrybeg Donegal 001141 Gweedore Bay And Islands 2011 160 Dooey Donegal 001090 Ballyness Bay 2011 162 Rinclevan Donegal 000147 Horn Head And Rinclevan 2011
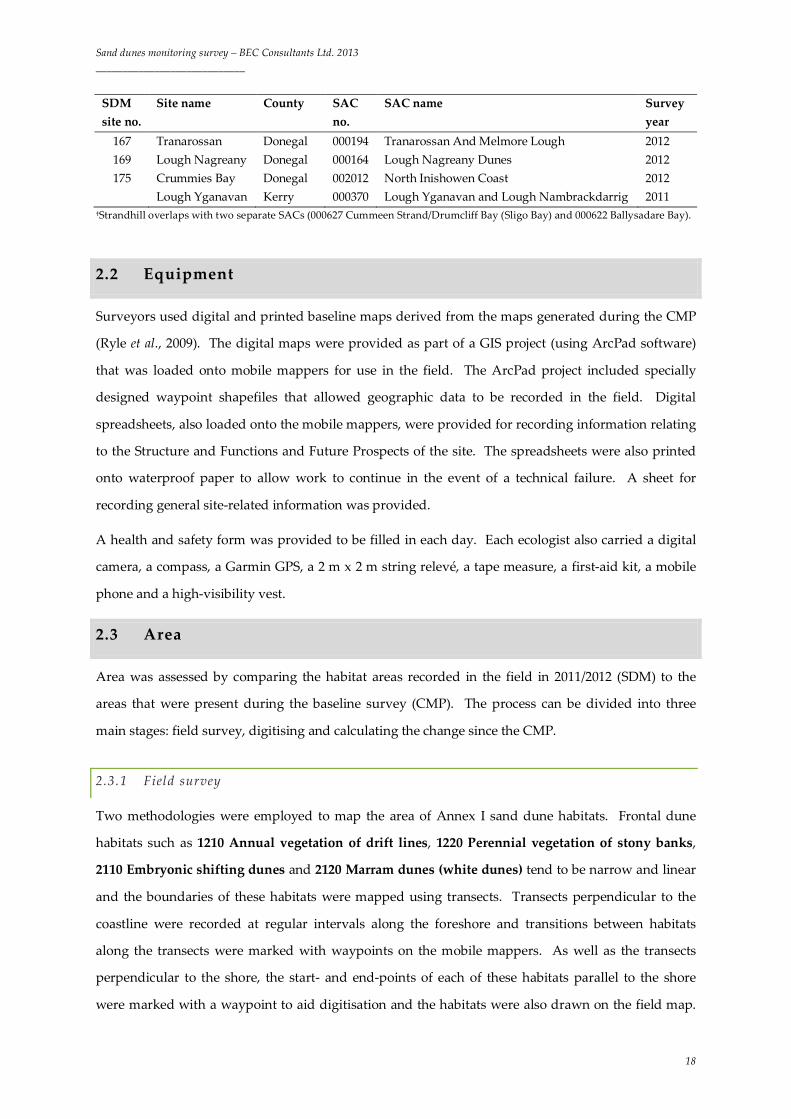
Sand dunes monitoring survey – BEC Consultants Ltd. 2013 ____________________________
18
SDM site no.
Site name County SAC no.
SAC name Survey year
167 Tranarossan Donegal 000194 Tranarossan And Melmore Lough 2012 169 Lough Nagreany Donegal 000164 Lough Nagreany Dunes 2012 175 Crummies Bay Donegal 002012 North Inishowen Coast 2012
Lough Yganavan Kerry 000370 Lough Yganavan and Lough Nambrackdarrig 2011 †Strandhill overlaps with two separate SACs (000627 Cummeen Strand/Drumcliff Bay (Sligo Bay) and 000622 Ballysadare Bay).
2.2 Equipment
Surveyors used digital and printed baseline maps derived from the maps generated during the CMP
(Ryle et al., 2009). The digital maps were provided as part of a GIS project (using ArcPad software)
that was loaded onto mobile mappers for use in the field. The ArcPad project included specially
designed waypoint shapefiles that allowed geographic data to be recorded in the field. Digital
spreadsheets, also loaded onto the mobile mappers, were provided for recording information relating
to the Structure and Functions and Future Prospects of the site. The spreadsheets were also printed
onto waterproof paper to allow work to continue in the event of a technical failure. A sheet for
recording general site-related information was provided.
A health and safety form was provided to be filled in each day. Each ecologist also carried a digital
camera, a compass, a Garmin GPS, a 2 m x 2 m string relevé, a tape measure, a first-aid kit, a mobile
phone and a high-visibility vest.
2.3 Area
Area was assessed by comparing the habitat areas recorded in the field in 2011/2012 (SDM) to the
areas that were present during the baseline survey (CMP). The process can be divided into three
main stages: field survey, digitising and calculating the change since the CMP.
2.3.1 Field survey
Two methodologies were employed to map the area of Annex I sand dune habitats. Frontal dune
habitats such as 1210 Annual vegetation of drift lines, 1220 Perennial vegetation of stony banks,
2110 Embryonic shifting dunes and 2120 Marram dunes (white dunes) tend to be narrow and linear
and the boundaries of these habitats were mapped using transects. Transects perpendicular to the
coastline were recorded at regular intervals along the foreshore and transitions between habitats
along the transects were marked with waypoints on the mobile mappers. As well as the transects
perpendicular to the shore, the start- and end-points of each of these habitats parallel to the shore
were marked with a waypoint to aid digitisation and the habitats were also drawn on the field map.
Sand dunes monitoring survey – BEC Consultants Ltd. 2013 ____________________________
19
For these frontal dune habitats, the minimum mapping area was 10 m long by 2 m wide to allow for
their fragmented, linear nature. The habitats occurring farther inland tend to be less linear, and a
different method was found to be more effective. *2130 Fixed dunes (grey dunes), *2140 Empetrum
nigrum dunes, *2150 Decalcified dune heath, 2190 Humid dune slacks, 2170 Dunes with creeping
willow and *21A0 Machairs indicated on the baseline maps were visited and the boundaries were
checked by walking along them. In addition, the 2005 aerial photographs for each site were examined
and specific locations which were likely to contain habitats of interest were visited, even if they were
not marked on the baseline maps. For these habitats, a minimum mapping area of 100 m2 was set.
Occasionally, well-developed habitats were found on sites where they had not previously been
recorded. If it was considered extremely unlikely that a habitat had developed since the CMP, it was
assumed that the habitat had been omitted erroneously. The 2005 aerial photographs were taken
around the period that the CMP was carried out, but were not available to the field workers at the
time. In 2011/2012, it was sometimes possible to use the 2005 photographs to confirm that habitats
that were not marked on the baseline maps were, in fact, present at the time of the CMP. There are
several reasons why a habitat may not have been represented on the baseline maps despite having
been present on the site at the time of the CMP. This could occur because (a) the interpretation of a
particular habitat has changed, (b) changes to the methodology resulted in more detailed maps in
2011/2012, (c) some locations were simply not visited during the CMP, or (d) errors were made
digitising the field maps from the CMP. The baseline maps were later revised to reflect these
discrepancies (see section 2.3.2 Digitisation).
Where a habitat mapped in 2011/2012 was believed to represent a genuine change in habitat, this was
noted as “change” in the waypoint’s attributes. For newly recorded habitats that were present six
years ago but not marked on the baseline map, the waypoints were marked “interpretation”.
Waypoints confirming unchanged boundaries were recorded occasionally to clarify complex
boundary alterations or to confirm that each part of the site was visited, and these waypoints were
recorded with the label “no change”.
Complex habitat mosaics occasionally occurred where the minimum mapping area was too large to
allow easy representation of all of the habitats present. To cater for this eventuality, a primary,
secondary and tertiary habitat could be entered at each waypoint. The habitat with the most cover
within a polygon was called the primary habitat and other habitats were entered as the secondary
and tertiary habitats. Features such as scrub, woodland and dense bracken can add structural
diversity to sand dune habitats, but they can also indicate lack of grazing or succession. They were

Sand dunes monitoring survey – BEC Consultants Ltd. 2013 ____________________________
20
retained within the sand dune habitat maps, but were indicated as secondary habitats using Fossitt
codes (e.g. 1° habitat: *2130, 2° habitat: WS1).
Each habitat mapped on the site during the SDM was represented as a closed, labelled polygon on the
field map. Mosaic polygons were labelled with the habitat codes of all the habitats within the
polygon. Where habitats or boundaries had changed in comparison to the baseline maps, the changes
were marked on the field map to facilitate subsequent digital mapping. Polygons which had been
altered from the baseline map were also labelled "c" (change) or "i" (interpretation) to indicate
whether or not there had been a genuine change since the CMP.
At some sites, the boundaries of a habitat could not be accessed due to the presence of livestock or
because permission to access the land could not be obtained. The area was retained in the SDM map
but marked as “ns” (not surveyed) if the surveyor could not see the habitat, or "e" (viewed externally)
if the surveyor was able to view the habitat from the boundaries.
The site boundary mapped during the CMP did not always correspond to the boundary of the sand
dune system. In some cases, this was because part of the system was occupied by a golf course. No
attempt was made to determine whether Annex I habitats were present within golf courses during the
SDM. Elsewhere, the site boundary sometimes reflected the point where the land use changed. For
example, the point where commonage ended and dunes had been enclosed within field boundaries.
Where this occurred, the sand dune habitat outside the site boundary was marked on the field map
and labelled "not surveyed" or "external" depending on whether the surveyor could view the area in
question. If the habitat had naturally moved beyond the previous site boundary due to erosion and
accretion, the new boundaries were mapped and surveyed.
Features that occupied an area smaller than the minimum mapping area were recorded with a single
waypoint and these included habitats, rare plants and impacts on the site. The locations of
monitoring stops and relevés were also recorded with waypoints. Photographs were taken at
monitoring stops, relevés and features.
2.3.2 Digitisation
The first step in the digitisation process was to assess and revise the GIS shapefiles produced during
the CMP. As discussed above, the changes to habitat boundaries that were labelled "interpretation"
were considered to improve the accuracy of the baseline maps rather than indicating genuine changes
since the CMP was carried out. The CMP habitat maps (baseline maps) were edited to reflect these
changes before any calculation of change in area was made. The resulting maps and areas were called
the revised baseline maps or revised CMP maps and revised baseline areas or revised CMP areas.
Sand dunes monitoring survey – BEC Consultants Ltd. 2013 ____________________________
21
Areas of bracken and scrub that were recorded as features of Annex I habitats in 2011/2012 were not
added to the revised CMP maps as there was only one column for recording the habitat. Habitat
mosaics were shown as containing only the dominant habitat. This is consistent with the digitisation
carried out during the CMP.
When the revised CMP maps had been completed, a second GIS shapefile was produced with up-to-
date habitat maps of all the Annex I sand dune habitats surveyed during the SDM in 2011/2012.
Mosaic polygons were digitised with the percentage cover of each of the habitats shown in the
attributes table for surveyed areas. Features such as scrub, woodland and dense bracken within
Annex I habitats were shown as secondary habitats in the attributes table. Each polygon was labelled
to indicate whether it had been fully surveyed ("Surveyed"), surveyed from the boundaries but not
accessed directly ("External") or had been totally inaccessible ("Not surveyed").
2.3.3 Calculating change in area
The Area assessment was carried out by subtracting the habitat area recorded on the revised CMP
maps from the corresponding areas on the final SDM maps. The difference was expressed as a
percentage of the revised CMP area. For each habitat where any change was recorded, the reason for
the change was examined. If there was no loss of area, or the change was due to natural processes
that affect coastal habitats, the loss of area was not considered to be negative and Area was assessed
as Favourable. However, if the loss of area was related to an anthropogenic factor, the habitat was
assessed as Unfavourable. If the reduction in area was less than 1% per year since the CMP, Area was
assessed as Unfavourable-Inadequate. If it had decreased by more than 1% per year since the CMP,
Area was assessed as Unfavourable-Bad. The last year of the CMP field survey was 2006, and all
calculations of the percentage of change per year were calculated for the period 2006 to 2012.
Increases in area were only taken into account in the Area assessment if they were the result of
human activities such as improved management or habitat restoration. Natural increases due to
accretion and succession were considered to be neither positive nor negative as they are part of the
natural processes affecting sand dunes. The terminology and thresholds used were chosen to be
consistent with the guidelines for assessing habitats under the Habitats Directive (Evans and Arvela,
2011). Parts of the site which were not visited ("Not surveyed") are included in the area tables for
each habitat, but were excluded from the Area assessment.
Sand dunes monitoring survey – BEC Consultants Ltd. 2013 ____________________________
22
2.4 Structure and Functions
Structure and Functions were assessed at two levels: within each Annex I habitat at each site and
within the entire area of each Annex I habitat that was present within the sample sites. The resulting
information can be used to develop site based management recommendations and contribute to the
national conservation assessments of sand dune habitats.
2.4.1 Site-based assessment
The Structure and Functions assessment method employed during the SDM differed from that used
during the CMP. During the SDM, monitoring stops contributed to an overall habitat assessment
within a site but did not pass or fail individually, whereas, during the CMP, each monitoring stop
could be assessed as an individual unit. A number of the monitoring criteria had been designed to be
applied across the whole Annex I habitat (JNCC, 2004a), and applying them on an individual stop
basis caused the habitats to fail some criteria despite being in good condition. For example, while
bare sand is desirable in *2130 Fixed dunes (grey dunes), it will not necessarily be present within
every monitoring stop in a healthy habitat. Applying each criterion on a stop basis also made it
difficult to allow for structural diversity across a habitat. The focus changed during the SDM to allow
some of the criteria to be assessed across the habitat as a whole rather than at each monitoring stop
individually. For example, the cover of bare ground was recorded at every stop in *21A0 Machairs,
but it was assessed on a habitat basis. If no bare ground was present within the habitat, or if the total
cover of bare ground was over 5%, the habitat was assessed as Unfavourable.
When assessing a criterion on a habitat-wide basis, the data from all of the monitoring stops and the
relevant mapping data contributed to a habitat-scale assessment. Total cover of bare ground, for
example, can be extrapolated from the percentage recorded within each monitoring stop or it can be
calculated using the mapping information. In some cases, a combination of monitoring stop data and
GIS data was used. The mapping of scrub, bracken and disturbed habitat during the field survey
allowed accurate calculation of the area of the habitat covered by these features, but the main source
of information regarding Structure and Functions remained the monitoring stop.
The number of monitoring stops recorded within each Annex I sand dune habitat was decided in the
field after some preliminary field mapping had taken place. Table 2.3 shows how the number of
stops recorded increased according to the habitat area. In some cases, the area of a habitat was
overestimated or underestimated in the field and more or fewer stops were recorded than were
indicated in Table 2.3. A minimum monitoring area of 0.04 ha was established to ensure that habitats
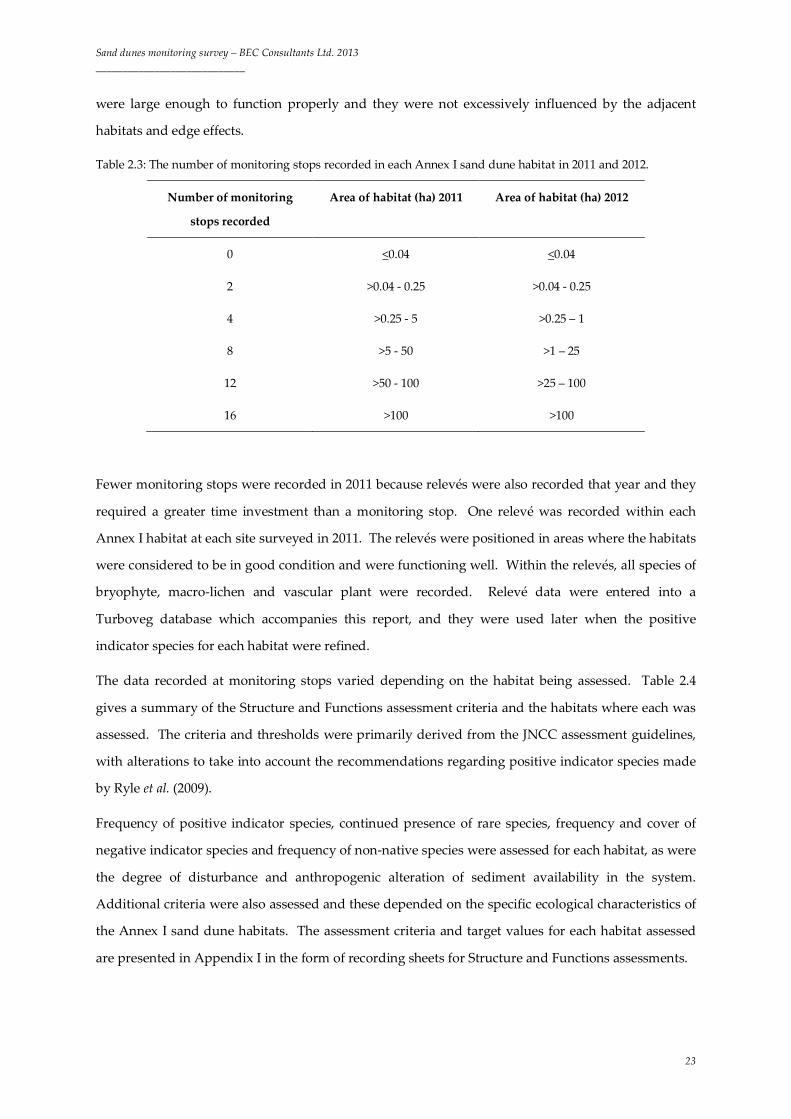
Sand dunes monitoring survey – BEC Consultants Ltd. 2013 ____________________________
23
were large enough to function properly and they were not excessively influenced by the adjacent
habitats and edge effects.
Table 2.3: The number of monitoring stops recorded in each Annex I sand dune habitat in 2011 and 2012.
Number of monitoring
stops recorded
Area of habitat (ha) 2011 Area of habitat (ha) 2012
0 <0.04 <0.04
2 >0.04 - 0.25 >0.04 - 0.25
4 >0.25 - 5 >0.25 – 1
8 >5 - 50 >1 – 25
12 >50 - 100 >25 – 100
16 >100 >100
Fewer monitoring stops were recorded in 2011 because relevés were also recorded that year and they
required a greater time investment than a monitoring stop. One relevé was recorded within each
Annex I habitat at each site surveyed in 2011. The relevés were positioned in areas where the habitats
were considered to be in good condition and were functioning well. Within the relevés, all species of
bryophyte, macro-lichen and vascular plant were recorded. Relevé data were entered into a
Turboveg database which accompanies this report, and they were used later when the positive
indicator species for each habitat were refined.
The data recorded at monitoring stops varied depending on the habitat being assessed. Table 2.4
gives a summary of the Structure and Functions assessment criteria and the habitats where each was
assessed. The criteria and thresholds were primarily derived from the JNCC assessment guidelines,
with alterations to take into account the recommendations regarding positive indicator species made
by Ryle et al. (2009).
Frequency of positive indicator species, continued presence of rare species, frequency and cover of
negative indicator species and frequency of non-native species were assessed for each habitat, as were
the degree of disturbance and anthropogenic alteration of sediment availability in the system.
Additional criteria were also assessed and these depended on the specific ecological characteristics of
the Annex I sand dune habitats. The assessment criteria and target values for each habitat assessed
are presented in Appendix I in the form of recording sheets for Structure and Functions assessments.

Sand dunes monitoring survey – BEC Consultants Ltd. 2013 ____________________________
24
Positive and negative indicator species were different for each habitat. The threshold values for the
frequency of positive and negative indicator species leading to a pass or fail score within a habitat are
derived from those stated in the UK Common Standards Monitoring Guidelines (JNCC, 2004a). A
minimum number of positive indicator species within a monitoring stop and a maximum Domin
value of any negative indicator species within a monitoring stop were introduced during the SDM to
ensure that localised degradation within the habitat was reflected in the assessment. A minimum
number of positive indicator species within a stop applied to *2130 Fixed dune (grey dunes), 2170
Dunes with creeping willow, 2190 Humid dune slacks and *21A0 Machairs, while a maximum
cover of negative indicator species within a stop applied to all of the habitats assessed.
The target for frequency of positive indicator species indicated in the JNCC guidelines for 1220
Perennial vegetation of stony banks was developed for large shingle bank systems, while the
examples of this habitat found during the SDM were smaller structures associated with beaches.
These beach fringing communities are more unstable and less diverse than the communities of larger,
more extensive areas of 1220 Perennial vegetation of stony banks (Moore and Wilson, 1999). To
avoid unnecessarily harsh assessments, an alternative, less stringent target was introduced for beach
fringing communities, while the original target was retained for use on large shingle banks.
Fewer criteria were assessed at the simple fore-dune habitats, where the exposed conditions and
unpalatable vegetation limit the damage done by invasive species and herbivore activity. The more
stable, landward habitats are more complex both in their internal ecology (e.g. inter-species
competition) and in their relationships with outside influences such as water availability. The
Structure and Functions of *2140 Decalcified Empetrum dunes and *2150 Decalcified dune heath
were not assessed within this report.
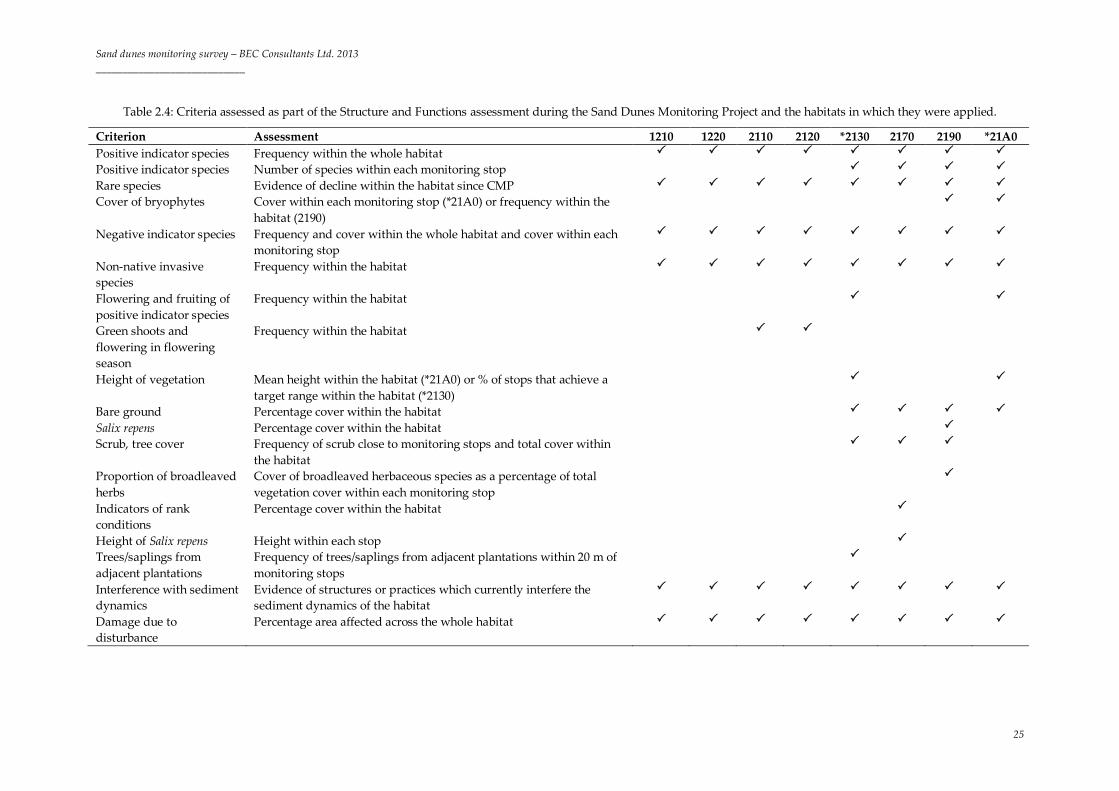
Sand dunes monitoring survey – BEC Consultants Ltd. 2013 ____________________________
25
Table 2.4: Criteria assessed as part of the Structure and Functions assessment during the Sand Dunes Monitoring Project and the habitats in which they were applied.
Criterion Assessment 1210 1220 2110 2120 *2130 2170 2190 *21A0 Positive indicator species Frequency within the whole habitat Positive indicator species Number of species within each monitoring stop Rare species Evidence of decline within the habitat since CMP Cover of bryophytes Cover within each monitoring stop (*21A0) or frequency within the
habitat (2190)
Negative indicator species Frequency and cover within the whole habitat and cover within each monitoring stop
Non-native invasive species
Frequency within the habitat
Flowering and fruiting of positive indicator species
Frequency within the habitat
Green shoots and flowering in flowering season
Frequency within the habitat
Height of vegetation Mean height within the habitat (*21A0) or % of stops that achieve a target range within the habitat (*2130)
Bare ground Percentage cover within the habitat Salix repens Percentage cover within the habitat Scrub, tree cover Frequency of scrub close to monitoring stops and total cover within
the habitat
Proportion of broadleaved herbs
Cover of broadleaved herbaceous species as a percentage of total vegetation cover within each monitoring stop
Indicators of rank conditions
Percentage cover within the habitat
Height of Salix repens Height within each stop Trees/saplings from adjacent plantations
Frequency of trees/saplings from adjacent plantations within 20 m of monitoring stops
Interference with sediment dynamics
Evidence of structures or practices which currently interfere the sediment dynamics of the habitat
Damage due to disturbance
Percentage area affected across the whole habitat
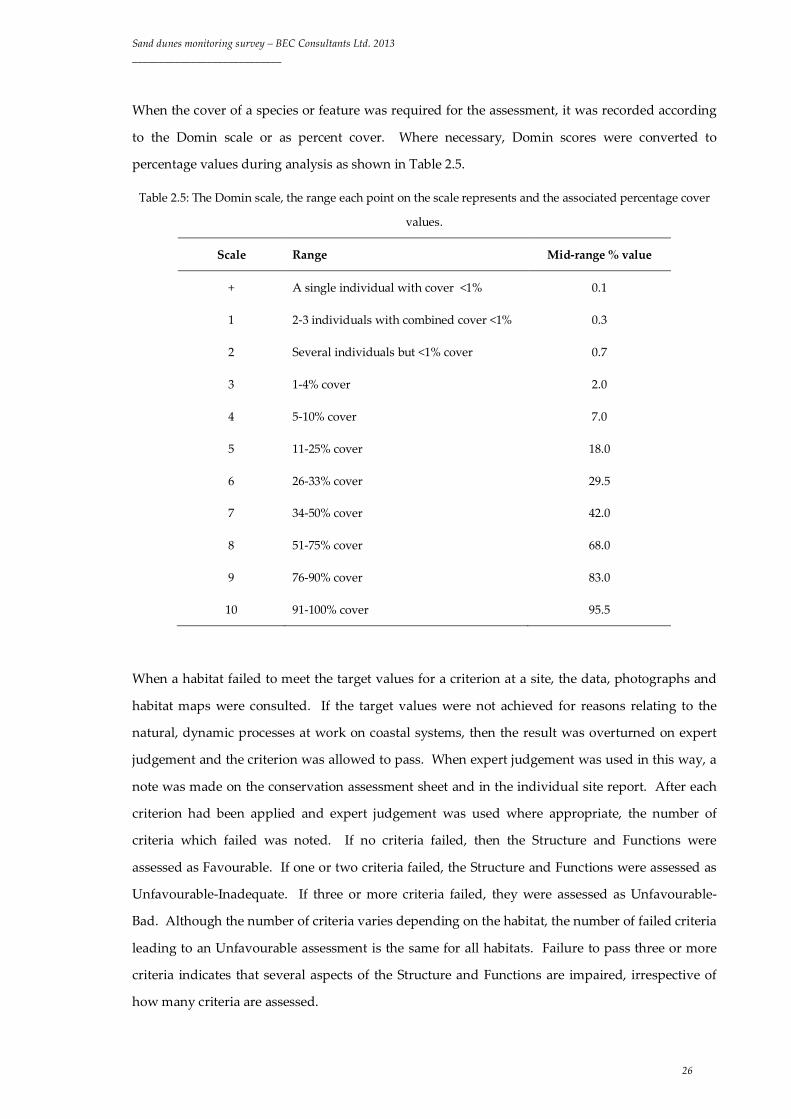
Sand dunes monitoring survey – BEC Consultants Ltd. 2013 ____________________________
26
When the cover of a species or feature was required for the assessment, it was recorded according
to the Domin scale or as percent cover. Where necessary, Domin scores were converted to
percentage values during analysis as shown in Table 2.5.
Table 2.5: The Domin scale, the range each point on the scale represents and the associated percentage cover
values.
Scale Range Mid-range % value
+ A single individual with cover <1% 0.1
1 2-3 individuals with combined cover <1% 0.3
2 Several individuals but <1% cover 0.7
3 1-4% cover 2.0
4 5-10% cover 7.0
5 11-25% cover 18.0
6 26-33% cover 29.5
7 34-50% cover 42.0
8 51-75% cover 68.0
9 76-90% cover 83.0
10 91-100% cover 95.5
When a habitat failed to meet the target values for a criterion at a site, the data, photographs and
habitat maps were consulted. If the target values were not achieved for reasons relating to the
natural, dynamic processes at work on coastal systems, then the result was overturned on expert
judgement and the criterion was allowed to pass. When expert judgement was used in this way, a
note was made on the conservation assessment sheet and in the individual site report. After each
criterion had been applied and expert judgement was used where appropriate, the number of
criteria which failed was noted. If no criteria failed, then the Structure and Functions were
assessed as Favourable. If one or two criteria failed, the Structure and Functions were assessed as
Unfavourable-Inadequate. If three or more criteria failed, they were assessed as Unfavourable-
Bad. Although the number of criteria varies depending on the habitat, the number of failed criteria
leading to an Unfavourable assessment is the same for all habitats. Failure to pass three or more
criteria indicates that several aspects of the Structure and Functions are impaired, irrespective of
how many criteria are assessed.

Sand dunes monitoring survey – BEC Consultants Ltd. 2013 ____________________________
27
2.4.2 Habitat-based assessment
As well as assessing the conservation status of Annex I sand dune habitats at individual sites, the
conservation status of each habitat across all sites was assessed. In accordance with the EU
guidelines for assessing Structure and Functions on a national basis (Evans and Arvela, 2011), this
was done by calculating the total area in Favourable and Unfavourable condition within the
sample sites. For sites where a habitat was assessed as Favourable, the entire area of that habitat
was considered to be in Favourable condition. For sites that were assessed as Unfavourable, the
area of the site where the Structure and Functions of the habitat were impaired was calculated
from the monitoring stop and GIS data. This part of the site was considered to be Unfavourable,
while the remaining area was recorded as Favourable. For example, the *2130 Fixed dunes (grey
dunes) were assessed as Unfavourable-Inadequate at site 175 Crummies Bay because of excessive
scrub cover and rank vegetation. When the GIS and monitoring stops were consulted, they
showed that scrub was present at 13% of the habitat, and this exceeds the target of a maximum of
5% scrub cover. Scrub cover was therefore considered to be excessive at 8% of the habitat. Rank
vegetation was present in 15% of the habitat. The target for the maximum proportion of the habitat
occupied by rank vegetation was 10%, so the target cover of rank vegetation was exceeded by 5%.
Adding up the areas of excessive scrub (8%) and rank vegetation (5%), the total proportion of the
habitat in Unfavourable condition was equal to 13%, an area of 1.55 ha. In some cases, the same
part of the site was affected by several negative factors, and this was taken into account to ensure
that the total area in Unfavourable condition was not overestimated.
The area in Favourable and Unfavourable condition of each habitat within the SDM sites was
calculated and expressed as a percentage of the total area of the habitat. Structure and Functions
were assessed as Favourable if 99-100% of the total habitat area was assessed as being in
Favourable condition. If 75-98% of the habitat was in Favourable condition, the habitat was
assessed as Unfavourable-Inadequate. If less than 75% of the habitat was in Favourable condition
and the remainder was in Unfavourable condition, Structure and Functions were assessed as
Unfavourable-Bad. Parts of the habitat which could not be accessed during the field survey were
excluded from the Structure and Functions assessment.
A worked example of the conservation assessment for 2170 Dunes with creeping willow is given
in Appendix II.
The methodology described above is the definitive methodology which was finalised after
fieldwork in 2011. Refinement of the methodology was undertaken in 2011 in response to
unresolved habitat characterisations identified during the CMP (Ryle et al., 2009). For most of the
assessment criteria, the changes in the finalised methodology only affected how the data were
Sand dunes monitoring survey – BEC Consultants Ltd. 2013 ____________________________
28
processed, and changes in how data were recorded in the field were not required. The assessments
presented here and the data in the MS Access database that accompanies this report were all
produced according to the finalised methodology with two exceptions. The percentage of the
vegetation flowering and fruiting in *2130 Fixed dunes (grey dunes) was not recorded from
monitoring stops in 2011, and was assessed later from photographs. Similarly, the total bryophyte
cover within each stop in 2190 Humid dune slacks was not recorded in 2011, but was assessed
later on the basis of photographs and species data recorded at monitoring stops. For these criteria
in these two habitats, only the pass or fail rate on a site basis is shown in the database.
During 2011, the DAFOR scale was used to record the cover scores at some sites, but this method
was changed as Domin provides more detailed information. An explanation of the DAFOR scale
following the guidelines recommended by the BSBI for recording flora is presented in Appendix III
along with details of how DAFOR categories were converted to percent cover when calculating the
total cover of species and features.
The criteria and thresholds for the Structure and Functions assessment for each Annex I sand dune
habitat were primarily derived from the JNCC assessment guidelines, with alterations to take into
account the recommendations regarding positive indicator species made by Ryle et al. (2009).
Additional sources of information used when the methodology was being refined included the
monitoring stops and relevés carried out during the SDM in 2011, relevé information gathered by
Gaynor (2008), the shingle beach survey (Moore and Wilson, 1999) and the Biomar survey of Irish
machair (Crawford et al., 1996). Differences between Structure and Functions criteria used during
the CMP and the SDM are shown in Appendix IV. Refer to the JNCC assessment guidelines
(JNCC, 2004a) for background information on the various assessment criteria and thresholds used
for the Structure and Functions assessment for each Annex I sand dune habitat.
2.5 Future Prospects
The Future Prospects assessment relates to the likely development and maintenance of Annex I
sand dune habitats in favourable condition for the foreseeable future (Ellmauer, 2010). The
“foreseeable future” is suggested by Ellmauer to be two reporting phases, i.e. 12 years. For
dynamic coastal habitats, this also refers to the potential for the habitat to continue to develop
according to coastal processes into the future.
After the field survey of each site had been completed and the entire site had been viewed, all of
the ecologists who had been present at the site discussed the impacts and activities. Each impact
was recorded using the standard EU code (Ssymank, 2010), and a brief description was given. A
full list of impact codes is presented in Appendix V. The following details were recorded for each
Sand dunes monitoring survey – BEC Consultants Ltd. 2013 ____________________________
29
impact: the intensity of the impact (high, medium or low), effect (positive, negative or neutral), the
percentage of each habitat affected, and the source of the impact (from inside or outside the Annex
I habitat). The data sheet for recording impacts is shown in Appendix VI.
The impacts and activities recorded during the survey allowed the ecologist to predict the future
trend of the habitat, that is, whether the site would improve or deteriorate over the 12 years
following the survey. This was used to predict the future Area and Structure and Functions status
of the habitat. If the impacts and activities were expected to maintain or improve the Area and
Structure and Functions of a habitat so that they would be in Favourable status in 12 years, the
Future Prospects were Favourable. However, if the impacts and activities affecting a site were
predicted to cause the habitat to be in Unfavourable-Inadequate condition in 12 years’ time, then
Future Prospects were assessed as Unfavourable-Inadequate. If the Area and Structure and
Functions of a habitat are expected to be Unfavourable-Bad in 12 years’ time on the basis of the
impacts and activities recorded during the survey, Future Prospects were assessed as
Unfavourable-Bad.
Structure and Functions data are required to assess the Future Prospects of a habitat. Although the
impacts and activities affecting *2140 Decalcified Empetrum dunes and *2150 Decalcified dune
heath were recorded, no Future Prospects assessment was carried out because their Structure and
Functions were not assessed.
A scoring system (Table 2.6) was developed to evaluate the impacts and activities affecting habitats
following the methodology described by O'Neill et al. (2010). This system allows each individual
impact at a site to be given a numerical score. Source, as a factor, is not included in the calculation,
as it is felt that this should have no bearing on the impact score. Low-intensity negative impacts
affecting up to 1% of the habitat were not considered to be significant and were not scored. The
Future Prospects score of an Annex I habitat within a site is the sum of its individual impact scores.
The range of impact scores which a habitat receives across all assessed sites gives a good indication
of the severity of impacts affecting it. Scores of zero or greater suggest the habitat has good Future
Prospects, scores below zero indicate poor Future Prospects and scores considerably below zero
indicate the Future Prospects of the habitat are bad. Although the impact score is a useful tool, the
individual impacts affecting each site must be examined before the Future Prospects for a site are
assessed because a positive impact score could potentially mask the presence of a negative impact.

Sand dunes monitoring survey – BEC Consultants Ltd. 2013 ____________________________
30
Table 2.6: Scoring system used to quantify impacts in Annex I habitats (modified from O’Neill et al., 2010).
Impact score is the mathematical product of all three attribute scores.
Attribute of impact Value Attribute score
1. Intensity of impact High 1.5
Medium 1
Low 0.5
2. Effect of impact Positive 1
Neutral 0
Negative -1
3. % Area of Annex I polygon impacted ≥1% 0.5
2-25% 1
26-50% 1.5
51-75% 2
>75% 2.5
100% 3
2.6 Conservation Assessment
Once Area, Structure and Functions and Future Prospects have been assessed, the overall
conservation status of a habitat can be determined. Following the EU guidelines for the assessment
of Annex I habitats (Evans and Arvela, 2011), the conservation status of a habitat is determined by
the least positive score of the three parameters. The assessment of each parameter and of the
conservation status of each habitat is qualified by the addition of a trend. The trend can be
improving (i.e. becoming more positive) or deteriorating (i.e. becoming less positive), or can be
described as stable, depending on whether the SDM assessment is more positive than, the same as,
or more negative than the CMP assessment. Hence, the area of a habitat may be assessed as, for
example, “Unfavourable-Inadequate (improving)” if habitat loss is still occurring but the rate of
loss has slowed from over 1% per year during the CMP to less than 1% per year during the SDM.

Sand dunes monitoring survey – BEC Consultants Ltd. 2013 ____________________________
31
3 Results
The results of the conservation assessments for each habitat are presented below. It should be
noted that the assessments in this report specifically refer to the area within the sites surveyed, and
therefore they do not correspond directly to the National Conservation Assessment for reporting
under Article 17 of the Habitats Directive. Areas recorded during the SDM are compared with the
revised CMP areas. Natural processes such as erosion, deposition and succession are primary
drivers of change on coastal habitats, and only losses or gains in area due to anthropogenic factors
are taken into account in the Area assessment. Comparisons to the data presented in Ryle et al.
(2009) have limitations due to changes in the methodology, but the CMP findings have been
considered where possible to determine trend.
3.1 1210 Annual vegetation of drift lines
3.1.1 Area and distribution
1210 Annual vegetation of drift lines was recorded at 21 sites distributed evenly around the coast
with no clear regional focus during the SDM (Figure 3.1). This tended to be a fragmented, linear
habitat, and it never occupied more than 4.55 ha at any site (Table 3.1). Areas of 1210 Annual
vegetation of drift lines from site 246 Tramore (a subsite of site 46 Tramore) were included in the
areas presented in Table 3.1.
The area of 1210 Annual vegetation of drift lines mapped during the baseline survey, the revised
baseline area and the area mapped in 2011/2012 are shown in Table 3.2 The small difference
between the baseline area and the revised baseline area (0.04 ha) is due to more refined habitat
mapping during the SDM.
Some areas of habitat mapped during the CMP could not be revisited in the 2011/2012 field seasons
because of access difficulties. These unsurveyed areas were retained in the SDM maps and marked
as “not surveyed”. Because the actual change in area could not be established for these parts of the
habitat, they were excluded from the change in area calculations. The total unsurveyed area of
1210 Annual vegetation of drift lines was 0.51 ha. The remaining area which was included in the
change in area calculations is shown in Table 3.2.
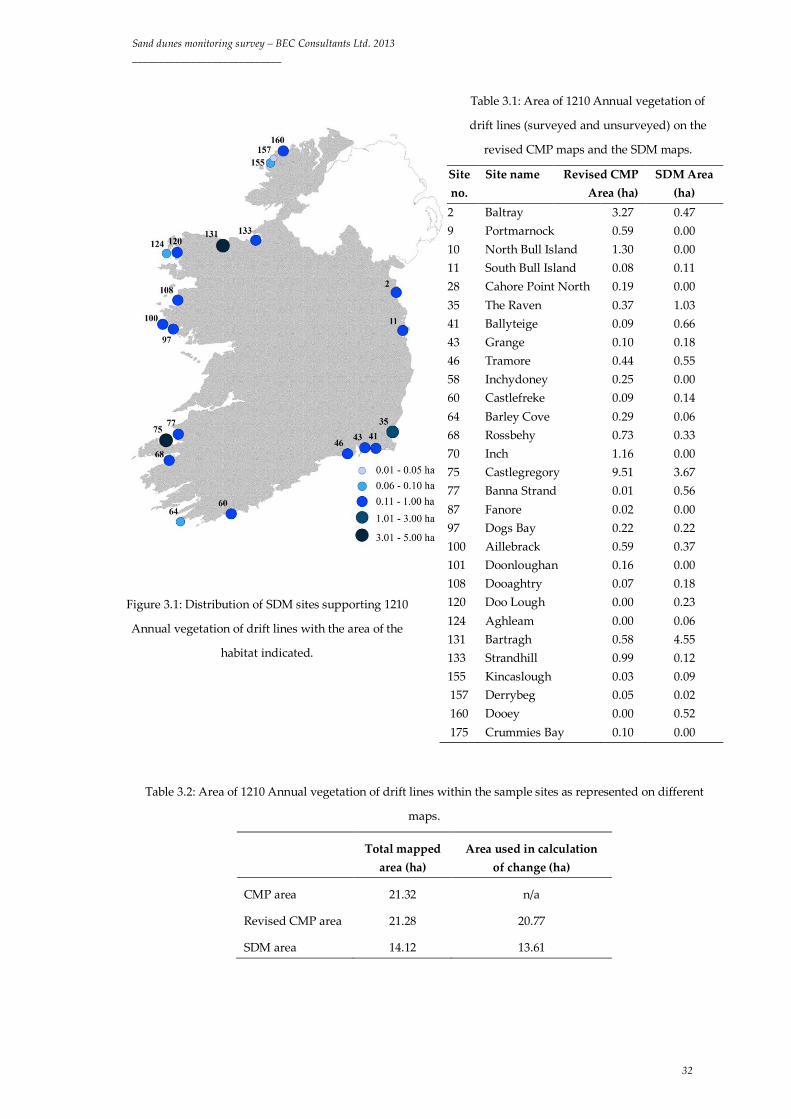
Sand dunes monitoring survey – BEC Consultants Ltd. 2013 ____________________________
32
Table 3.1: Area of 1210 Annual vegetation of
drift lines (surveyed and unsurveyed) on the
revised CMP maps and the SDM maps.
Site no.
Site name Revised CMP Area (ha)
SDM Area (ha)
2 Baltray 3.27 0.47 9 Portmarnock 0.59 0.00 10 North Bull Island 1.30 0.00 11 South Bull Island 0.08 0.11 28 Cahore Point North 0.19 0.00 35 The Raven 0.37 1.03 41 Ballyteige 0.09 0.66 43 Grange 0.10 0.18 46 Tramore 0.44 0.55 58 Inchydoney 0.25 0.00 60 Castlefreke 0.09 0.14 64 Barley Cove 0.29 0.06 68 Rossbehy 0.73 0.33 70 Inch 1.16 0.00 75 Castlegregory 9.51 3.67 77 Banna Strand 0.01 0.56 87 Fanore 0.02 0.00 97 Dogs Bay 0.22 0.22 100 Aillebrack 0.59 0.37 101 Doonloughan 0.16 0.00 108 Dooaghtry 0.07 0.18 120 Doo Lough 0.00 0.23 124 Aghleam 0.00 0.06 131 Bartragh 0.58 4.55 133 Strandhill 0.99 0.12 155 Kincaslough 0.03 0.09 157 Derrybeg 0.05 0.02 160 Dooey 0.00 0.52 175 Crummies Bay 0.10 0.00
Table 3.2: Area of 1210 Annual vegetation of drift lines within the sample sites as represented on different
maps.
Total mapped area (ha)
Area used in calculation of change (ha)
CMP area 21.32 n/a
Revised CMP area 21.28 20.77
SDM area 14.12 13.61
Figure 3.1: Distribution of SDM sites supporting 1210
Annual vegetation of drift lines with the area of the
habitat indicated.
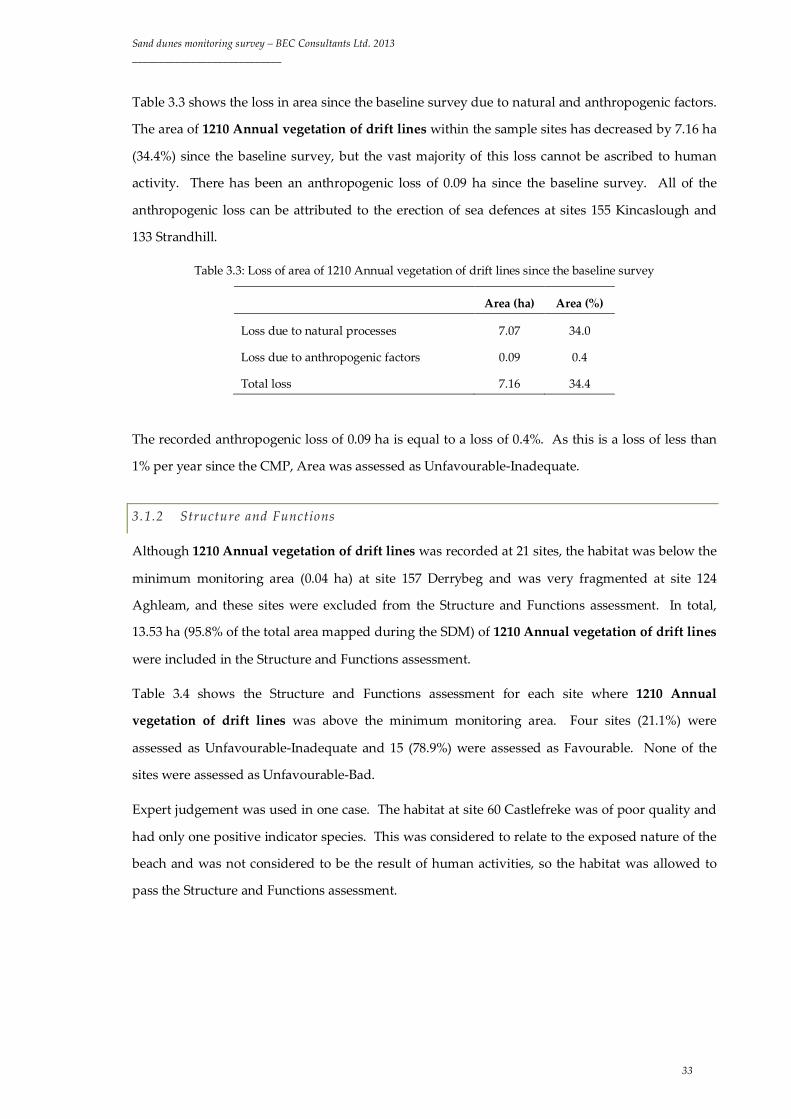
Sand dunes monitoring survey – BEC Consultants Ltd. 2013 ____________________________
33
Table 3.3 shows the loss in area since the baseline survey due to natural and anthropogenic factors.
The area of 1210 Annual vegetation of drift lines within the sample sites has decreased by 7.16 ha
(34.4%) since the baseline survey, but the vast majority of this loss cannot be ascribed to human
activity. There has been an anthropogenic loss of 0.09 ha since the baseline survey. All of the
anthropogenic loss can be attributed to the erection of sea defences at sites 155 Kincaslough and
133 Strandhill.
Table 3.3: Loss of area of 1210 Annual vegetation of drift lines since the baseline survey
Area (ha) Area (%)
Loss due to natural processes 7.07 34.0
Loss due to anthropogenic factors 0.09 0.4
Total loss 7.16 34.4
The recorded anthropogenic loss of 0.09 ha is equal to a loss of 0.4%. As this is a loss of less than
1% per year since the CMP, Area was assessed as Unfavourable-Inadequate.
3.1.2 Structure and Functions
Although 1210 Annual vegetation of drift lines was recorded at 21 sites, the habitat was below the
minimum monitoring area (0.04 ha) at site 157 Derrybeg and was very fragmented at site 124
Aghleam, and these sites were excluded from the Structure and Functions assessment. In total,
13.53 ha (95.8% of the total area mapped during the SDM) of 1210 Annual vegetation of drift lines
were included in the Structure and Functions assessment.
Table 3.4 shows the Structure and Functions assessment for each site where 1210 Annual
vegetation of drift lines was above the minimum monitoring area. Four sites (21.1%) were
assessed as Unfavourable-Inadequate and 15 (78.9%) were assessed as Favourable. None of the
sites were assessed as Unfavourable-Bad.
Expert judgement was used in one case. The habitat at site 60 Castlefreke was of poor quality and
had only one positive indicator species. This was considered to relate to the exposed nature of the
beach and was not considered to be the result of human activities, so the habitat was allowed to
pass the Structure and Functions assessment.
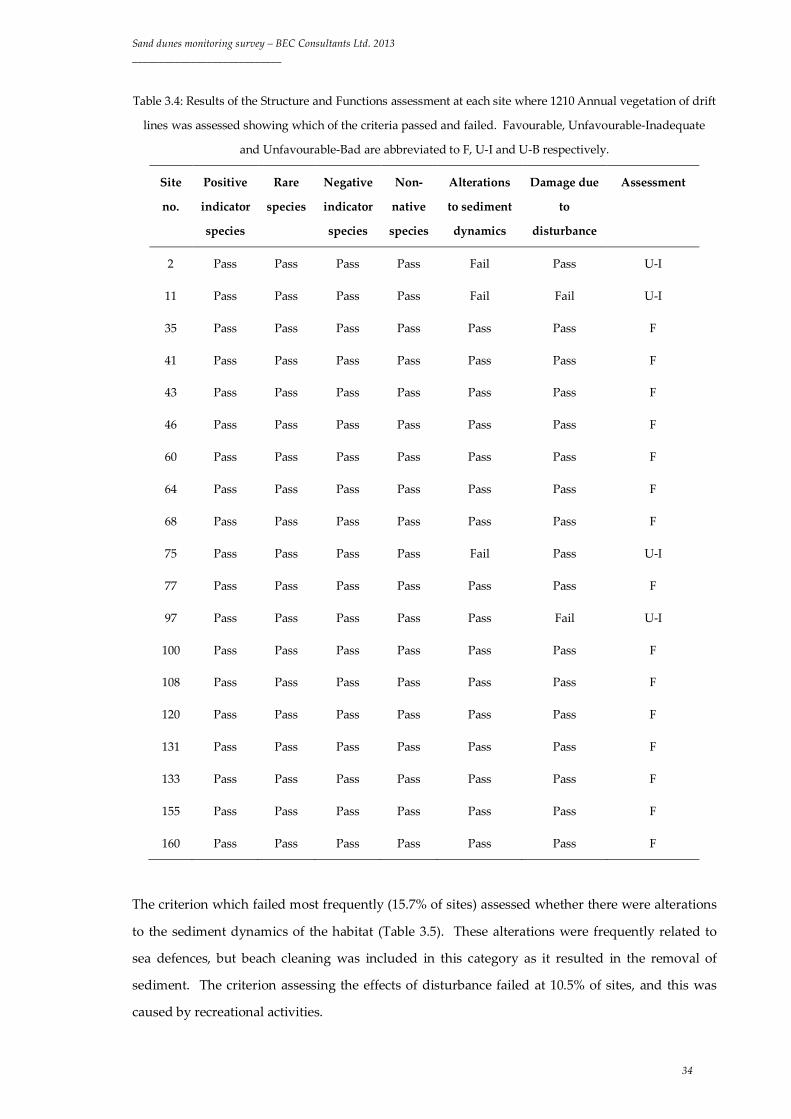
Sand dunes monitoring survey – BEC Consultants Ltd. 2013 ____________________________
34
Table 3.4: Results of the Structure and Functions assessment at each site where 1210 Annual vegetation of drift
lines was assessed showing which of the criteria passed and failed. Favourable, Unfavourable-Inadequate
and Unfavourable-Bad are abbreviated to F, U-I and U-B respectively.
Site
no.
Positive
indicator
species
Rare
species
Negative
indicator
species
Non-
native
species
Alterations
to sediment
dynamics
Damage due
to
disturbance
Assessment
2 Pass Pass Pass Pass Fail Pass U-I
11 Pass Pass Pass Pass Fail Fail U-I
35 Pass Pass Pass Pass Pass Pass F
41 Pass Pass Pass Pass Pass Pass F
43 Pass Pass Pass Pass Pass Pass F
46 Pass Pass Pass Pass Pass Pass F
60 Pass Pass Pass Pass Pass Pass F
64 Pass Pass Pass Pass Pass Pass F
68 Pass Pass Pass Pass Pass Pass F
75 Pass Pass Pass Pass Fail Pass U-I
77 Pass Pass Pass Pass Pass Pass F
97 Pass Pass Pass Pass Pass Fail U-I
100 Pass Pass Pass Pass Pass Pass F
108 Pass Pass Pass Pass Pass Pass F
120 Pass Pass Pass Pass Pass Pass F
131 Pass Pass Pass Pass Pass Pass F
133 Pass Pass Pass Pass Pass Pass F
155 Pass Pass Pass Pass Pass Pass F
160 Pass Pass Pass Pass Pass Pass F
The criterion which failed most frequently (15.7% of sites) assessed whether there were alterations
to the sediment dynamics of the habitat (Table 3.5). These alterations were frequently related to
sea defences, but beach cleaning was included in this category as it resulted in the removal of
sediment. The criterion assessing the effects of disturbance failed at 10.5% of sites, and this was
caused by recreational activities.

Sand dunes monitoring survey – BEC Consultants Ltd. 2013 ____________________________
35
Table 3.5: The percentage of sites at which each criterion failed in the Structure and Functions assessment of
1210 Annual vegetation of drift lines
Criterion Failed (% of sites)
Positive indicator species 0.0
Rare species 0.0
Negative indicator species 0.0
Non-native species 0.0
Alterations to sediment dynamics 15.7
Damage due to disturbance 10.5
Structure and Functions were assessed at a national level as Favourable during the baseline survey.
The area of 1210 Annual vegetation of drift lines which was assessed as Favourable or
Unfavourable in 2011/2012 is presented in Table 3.6. The Structure and Functions of most of the
habitat (94.8% of the area) were assessed as Favourable, but as 5.2% of the habitat was
Unfavourable, the Structure and Functions of 1210 annual vegetation of drift lines was assessed as
Unfavourable-Inadequate.
Table 3.6: The total assessed area and percentage of area of 1210 Annual vegetation of drift lines in Favourable
and Unfavourable condition in 2011/2012.
Area (ha) Area (%)
Favourable 12.83 94.8
Unfavourable 0.70 5.2
3.1.3 Future prospects
For the 21 sites where 1210 Annual vegetation of drift lines was recorded, negative impacts
occurred at eight sites, neutral impacts occurred at six sites and seven sites were recorded as
having no impacts or activities at all. No positive impacts or activities were recorded for this
habitat. The median impact score for the habitat was 0 and the most negative impact score was -6.
Three neutral impacts were recorded (Table 3.7), and these consisted of low-intensity recreational
activities (e.g. walking), erosion and coastal protection structures which pre-dated designation and
did not have a negative effect on the habitat at time of survey.

Sand dunes monitoring survey – BEC Consultants Ltd. 2013 ____________________________
36
Table 3.7: Neutral impacts affecting 1210 Annual vegetation of drift lines, the percentage of sites (where the
habitat occurs) which were affected, the degree of impact and the area of the habitat affected.
Impact code
Impact description Percentage of sites affected: Area affected
(ha)
Area affected (% of total
sample area) Low
intensity Medium intensity
High intensity
Total
G01.02 Walking, horse riding and non-motorised vehicles
14.3 0.0 0.0 14.3 0.58 4.1
K01.01 Erosion 0.0 0.0 14.3 14.3 0.48 3.4
J02.12.01 Sea defence or coast protection works, tidal barrages
4.8 0.0 0.0 4.8 0.03 0.2
Negative impacts affecting 1210 Annual vegetation of drift lines are presented in Table 3.8. The
negative impact which affected the greatest area was Sea defence or coastal protection works
(affecting 0.47 ha). These were recorded where rock gabions, sea walls and piers were constructed
or extended and these affected the patterns of sediment cycling. The impact affecting the second
greatest area was Reduction or loss of specific habitat features. This was caused by an exclosure at
site 2 Baltray which was erected as part of a Little Tern (Sterna albifrons) conservation programme.
The exclosure has reduced the mobility of the sediment and artificially stabilised the habitat in an
area of 0.33 ha. Sand extraction was noted at site 75 Castlegregory. At site 11 South Bull Island,
the sediment supply has been affected by beach cleaning which involves removal of the upper
layer of sand and algae, which is then deposited in mounds in the fore-dunes. Trampling was
recorded at site 11 South Bull Island and site 97 Dog's Bay, both of which receive heavy amenity
use.
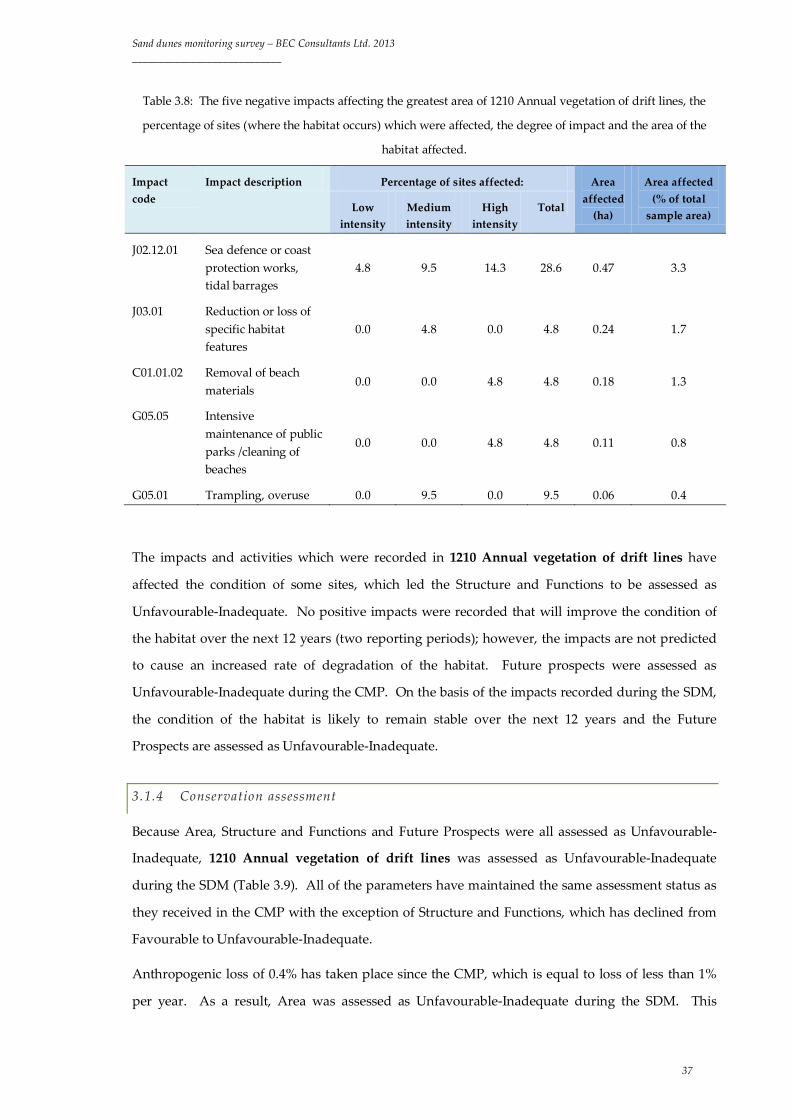
Sand dunes monitoring survey – BEC Consultants Ltd. 2013 ____________________________
37
Table 3.8: The five negative impacts affecting the greatest area of 1210 Annual vegetation of drift lines, the
percentage of sites (where the habitat occurs) which were affected, the degree of impact and the area of the
habitat affected.
Impact code
Impact description Percentage of sites affected: Area affected
(ha)
Area affected (% of total
sample area) Low
intensity Medium intensity
High intensity
Total
J02.12.01 Sea defence or coast protection works, tidal barrages
4.8 9.5 14.3 28.6 0.47 3.3
J03.01 Reduction or loss of specific habitat features
0.0 4.8 0.0 4.8 0.24 1.7
C01.01.02 Removal of beach materials
0.0 0.0 4.8 4.8 0.18 1.3
G05.05 Intensive maintenance of public parks /cleaning of beaches
0.0 0.0 4.8 4.8 0.11 0.8
G05.01 Trampling, overuse 0.0 9.5 0.0 9.5 0.06 0.4
The impacts and activities which were recorded in 1210 Annual vegetation of drift lines have
affected the condition of some sites, which led the Structure and Functions to be assessed as
Unfavourable-Inadequate. No positive impacts were recorded that will improve the condition of
the habitat over the next 12 years (two reporting periods); however, the impacts are not predicted
to cause an increased rate of degradation of the habitat. Future prospects were assessed as
Unfavourable-Inadequate during the CMP. On the basis of the impacts recorded during the SDM,
the condition of the habitat is likely to remain stable over the next 12 years and the Future
Prospects are assessed as Unfavourable-Inadequate.
3.1.4 Conservation assessment
Because Area, Structure and Functions and Future Prospects were all assessed as Unfavourable-
Inadequate, 1210 Annual vegetation of drift lines was assessed as Unfavourable-Inadequate
during the SDM (Table 3.9). All of the parameters have maintained the same assessment status as
they received in the CMP with the exception of Structure and Functions, which has declined from
Favourable to Unfavourable-Inadequate.
Anthropogenic loss of 0.4% has taken place since the CMP, which is equal to loss of less than 1%
per year. As a result, Area was assessed as Unfavourable-Inadequate during the SDM. This
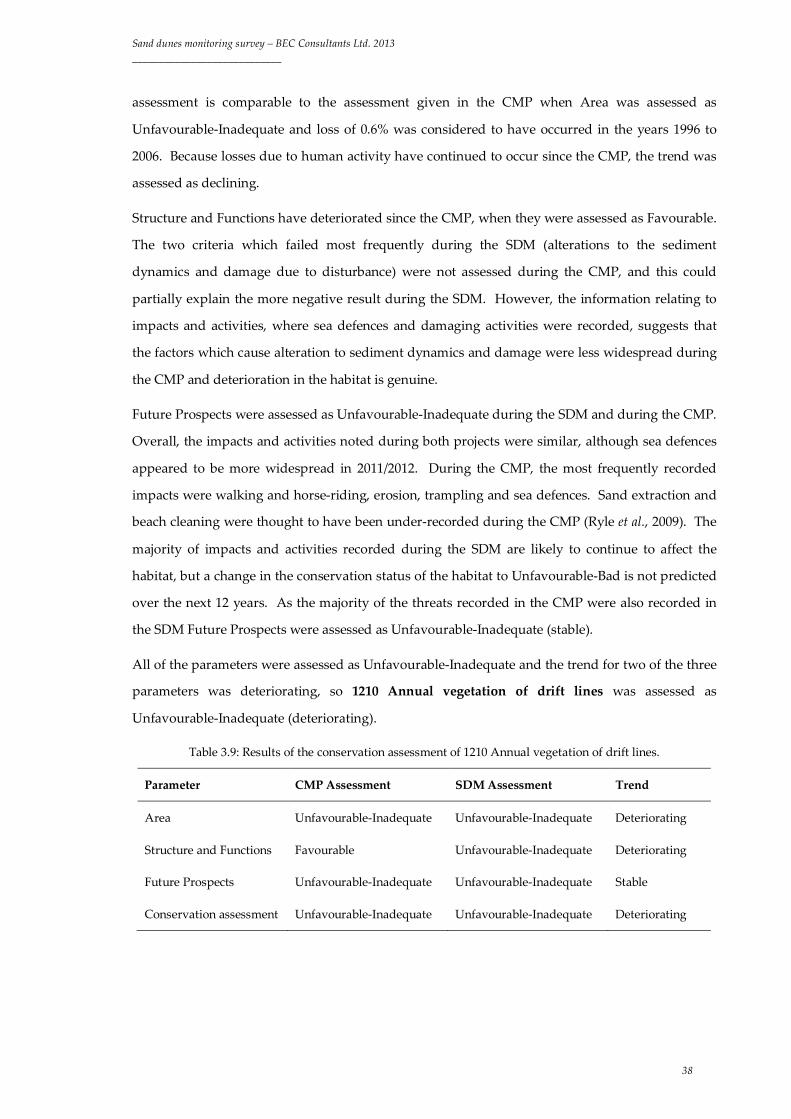
Sand dunes monitoring survey – BEC Consultants Ltd. 2013 ____________________________
38
assessment is comparable to the assessment given in the CMP when Area was assessed as
Unfavourable-Inadequate and loss of 0.6% was considered to have occurred in the years 1996 to
2006. Because losses due to human activity have continued to occur since the CMP, the trend was
assessed as declining.
Structure and Functions have deteriorated since the CMP, when they were assessed as Favourable.
The two criteria which failed most frequently during the SDM (alterations to the sediment
dynamics and damage due to disturbance) were not assessed during the CMP, and this could
partially explain the more negative result during the SDM. However, the information relating to
impacts and activities, where sea defences and damaging activities were recorded, suggests that
the factors which cause alteration to sediment dynamics and damage were less widespread during
the CMP and deterioration in the habitat is genuine.
Future Prospects were assessed as Unfavourable-Inadequate during the SDM and during the CMP.
Overall, the impacts and activities noted during both projects were similar, although sea defences
appeared to be more widespread in 2011/2012. During the CMP, the most frequently recorded
impacts were walking and horse-riding, erosion, trampling and sea defences. Sand extraction and
beach cleaning were thought to have been under-recorded during the CMP (Ryle et al., 2009). The
majority of impacts and activities recorded during the SDM are likely to continue to affect the
habitat, but a change in the conservation status of the habitat to Unfavourable-Bad is not predicted
over the next 12 years. As the majority of the threats recorded in the CMP were also recorded in
the SDM Future Prospects were assessed as Unfavourable-Inadequate (stable).
All of the parameters were assessed as Unfavourable-Inadequate and the trend for two of the three
parameters was deteriorating, so 1210 Annual vegetation of drift lines was assessed as
Unfavourable-Inadequate (deteriorating).
Table 3.9: Results of the conservation assessment of 1210 Annual vegetation of drift lines.
Parameter CMP Assessment SDM Assessment Trend
Area Unfavourable-Inadequate Unfavourable-Inadequate Deteriorating
Structure and Functions Favourable Unfavourable-Inadequate Deteriorating
Future Prospects Unfavourable-Inadequate Unfavourable-Inadequate Stable
Conservation assessment Unfavourable-Inadequate Unfavourable-Inadequate Deteriorating
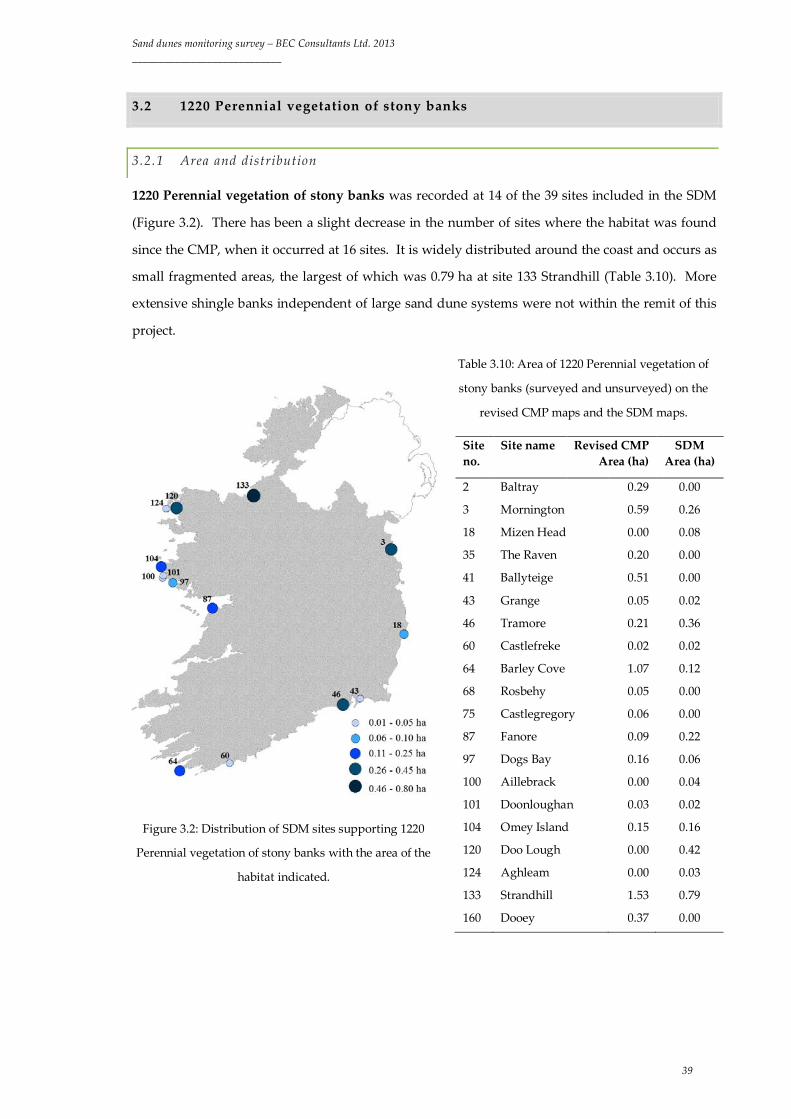
Sand dunes monitoring survey – BEC Consultants Ltd. 2013 ____________________________
39
3.2 1220 Perennial vegetation of stony banks
3.2.1 Area and distribution
1220 Perennial vegetation of stony banks was recorded at 14 of the 39 sites included in the SDM
(Figure 3.2). There has been a slight decrease in the number of sites where the habitat was found
since the CMP, when it occurred at 16 sites. It is widely distributed around the coast and occurs as
small fragmented areas, the largest of which was 0.79 ha at site 133 Strandhill (Table 3.10). More
extensive shingle banks independent of large sand dune systems were not within the remit of this
project.
Table 3.10: Area of 1220 Perennial vegetation of
stony banks (surveyed and unsurveyed) on the
revised CMP maps and the SDM maps.
Site no.
Site name Revised CMP Area (ha)
SDM Area (ha)
2 Baltray 0.29 0.00
3 Mornington 0.59 0.26
18 Mizen Head 0.00 0.08
35 The Raven 0.20 0.00
41 Ballyteige 0.51 0.00
43 Grange 0.05 0.02
46 Tramore 0.21 0.36
60 Castlefreke 0.02 0.02
64 Barley Cove 1.07 0.12
68 Rosbehy 0.05 0.00
75 Castlegregory 0.06 0.00
87 Fanore 0.09 0.22
97 Dogs Bay 0.16 0.06
100 Aillebrack 0.00 0.04
101 Doonloughan 0.03 0.02
104 Omey Island 0.15 0.16
120 Doo Lough 0.00 0.42
124 Aghleam 0.00 0.03
133 Strandhill 1.53 0.79
160 Dooey 0.37 0.00
Figure 3.2: Distribution of SDM sites supporting 1220
Perennial vegetation of stony banks with the area of the
habitat indicated.
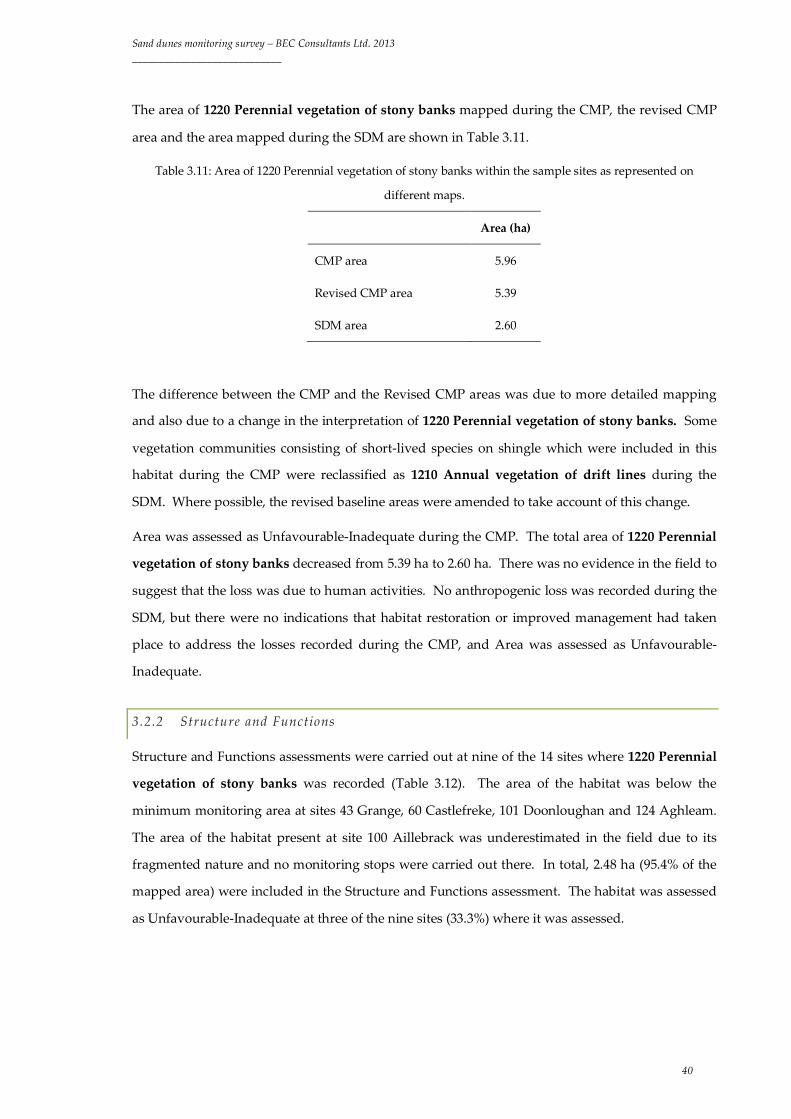
Sand dunes monitoring survey – BEC Consultants Ltd. 2013 ____________________________
40
The area of 1220 Perennial vegetation of stony banks mapped during the CMP, the revised CMP
area and the area mapped during the SDM are shown in Table 3.11.
Table 3.11: Area of 1220 Perennial vegetation of stony banks within the sample sites as represented on
different maps.
Area (ha)
CMP area 5.96
Revised CMP area 5.39
SDM area 2.60
The difference between the CMP and the Revised CMP areas was due to more detailed mapping
and also due to a change in the interpretation of 1220 Perennial vegetation of stony banks. Some
vegetation communities consisting of short-lived species on shingle which were included in this
habitat during the CMP were reclassified as 1210 Annual vegetation of drift lines during the
SDM. Where possible, the revised baseline areas were amended to take account of this change.
Area was assessed as Unfavourable-Inadequate during the CMP. The total area of 1220 Perennial
vegetation of stony banks decreased from 5.39 ha to 2.60 ha. There was no evidence in the field to
suggest that the loss was due to human activities. No anthropogenic loss was recorded during the
SDM, but there were no indications that habitat restoration or improved management had taken
place to address the losses recorded during the CMP, and Area was assessed as Unfavourable-
Inadequate.
3.2.2 Structure and Functions
Structure and Functions assessments were carried out at nine of the 14 sites where 1220 Perennial
vegetation of stony banks was recorded (Table 3.12). The area of the habitat was below the
minimum monitoring area at sites 43 Grange, 60 Castlefreke, 101 Doonloughan and 124 Aghleam.
The area of the habitat present at site 100 Aillebrack was underestimated in the field due to its
fragmented nature and no monitoring stops were carried out there. In total, 2.48 ha (95.4% of the
mapped area) were included in the Structure and Functions assessment. The habitat was assessed
as Unfavourable-Inadequate at three of the nine sites (33.3%) where it was assessed.
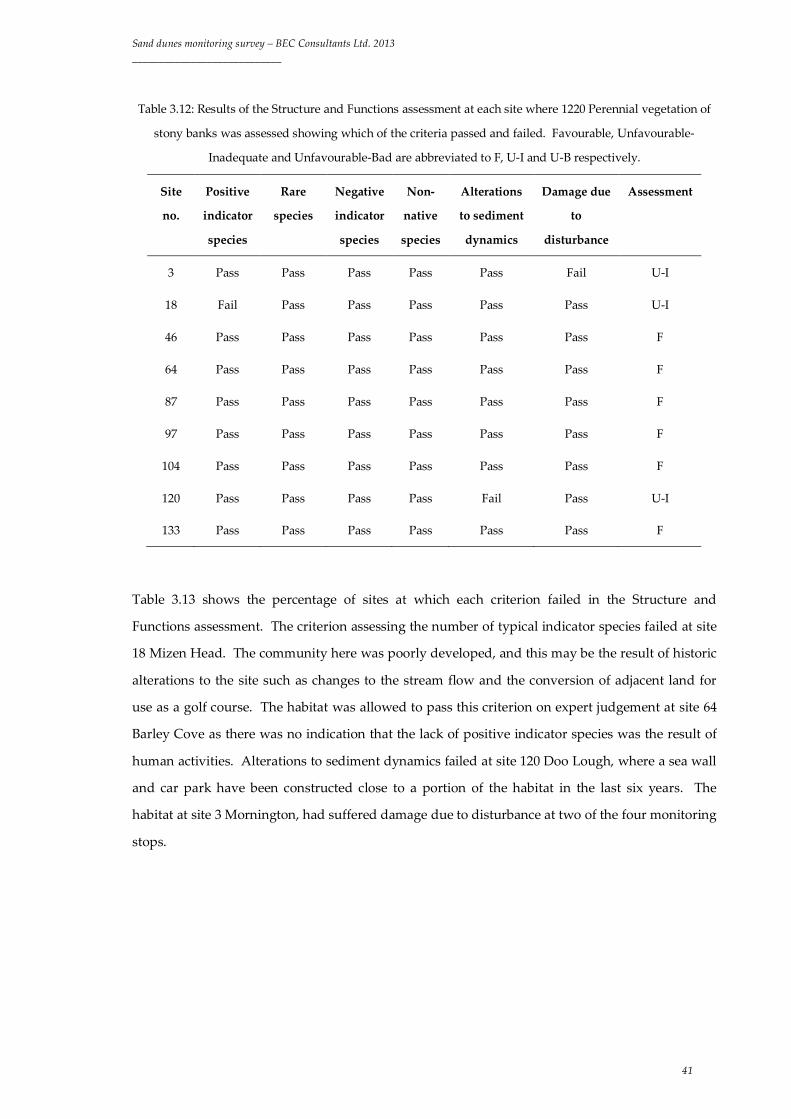
Sand dunes monitoring survey – BEC Consultants Ltd. 2013 ____________________________
41
Table 3.12: Results of the Structure and Functions assessment at each site where 1220 Perennial vegetation of
stony banks was assessed showing which of the criteria passed and failed. Favourable, Unfavourable-
Inadequate and Unfavourable-Bad are abbreviated to F, U-I and U-B respectively.
Table 3.13 shows the percentage of sites at which each criterion failed in the Structure and
Functions assessment. The criterion assessing the number of typical indicator species failed at site
18 Mizen Head. The community here was poorly developed, and this may be the result of historic
alterations to the site such as changes to the stream flow and the conversion of adjacent land for
use as a golf course. The habitat was allowed to pass this criterion on expert judgement at site 64
Barley Cove as there was no indication that the lack of positive indicator species was the result of
human activities. Alterations to sediment dynamics failed at site 120 Doo Lough, where a sea wall
and car park have been constructed close to a portion of the habitat in the last six years. The
habitat at site 3 Mornington, had suffered damage due to disturbance at two of the four monitoring
stops.
Site
no.
Positive
indicator
species
Rare
species
Negative
indicator
species
Non-
native
species
Alterations
to sediment
dynamics
Damage due
to
disturbance
Assessment
3 Pass Pass Pass Pass Pass Fail U-I
18 Fail Pass Pass Pass Pass Pass U-I
46 Pass Pass Pass Pass Pass Pass F
64 Pass Pass Pass Pass Pass Pass F
87 Pass Pass Pass Pass Pass Pass F
97 Pass Pass Pass Pass Pass Pass F
104 Pass Pass Pass Pass Pass Pass F
120 Pass Pass Pass Pass Fail Pass U-I
133 Pass Pass Pass Pass Pass Pass F
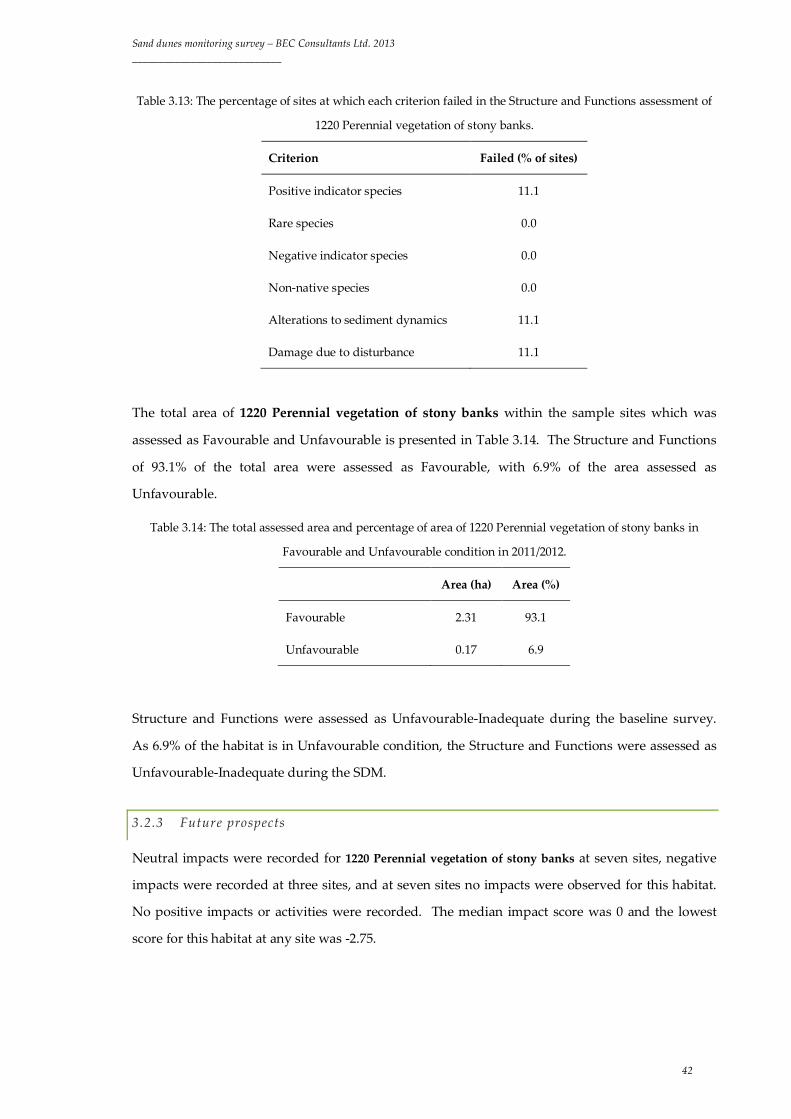
Sand dunes monitoring survey – BEC Consultants Ltd. 2013 ____________________________
42
Table 3.13: The percentage of sites at which each criterion failed in the Structure and Functions assessment of
1220 Perennial vegetation of stony banks.
Criterion Failed (% of sites)
Positive indicator species 11.1
Rare species 0.0
Negative indicator species 0.0
Non-native species 0.0
Alterations to sediment dynamics 11.1
Damage due to disturbance 11.1
The total area of 1220 Perennial vegetation of stony banks within the sample sites which was
assessed as Favourable and Unfavourable is presented in Table 3.14. The Structure and Functions
of 93.1% of the total area were assessed as Favourable, with 6.9% of the area assessed as
Unfavourable.
Table 3.14: The total assessed area and percentage of area of 1220 Perennial vegetation of stony banks in
Favourable and Unfavourable condition in 2011/2012.
Area (ha) Area (%)
Favourable 2.31 93.1
Unfavourable 0.17 6.9
Structure and Functions were assessed as Unfavourable-Inadequate during the baseline survey.
As 6.9% of the habitat is in Unfavourable condition, the Structure and Functions were assessed as
Unfavourable-Inadequate during the SDM.
3.2.3 Future prospects
Neutral impacts were recorded for 1220 Perennial vegetation of stony banks at seven sites, negative
impacts were recorded at three sites, and at seven sites no impacts were observed for this habitat.
No positive impacts or activities were recorded. The median impact score was 0 and the lowest
score for this habitat at any site was -2.75.
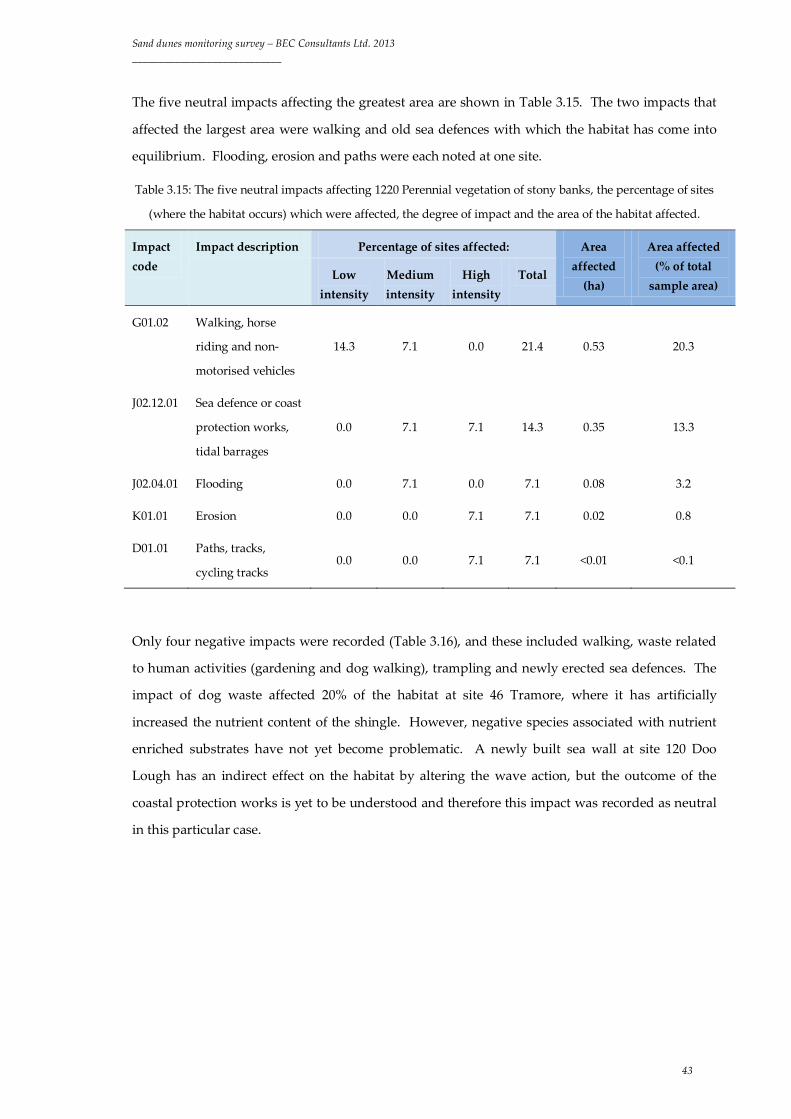
Sand dunes monitoring survey – BEC Consultants Ltd. 2013 ____________________________
43
The five neutral impacts affecting the greatest area are shown in Table 3.15. The two impacts that
affected the largest area were walking and old sea defences with which the habitat has come into
equilibrium. Flooding, erosion and paths were each noted at one site.
Table 3.15: The five neutral impacts affecting 1220 Perennial vegetation of stony banks, the percentage of sites
(where the habitat occurs) which were affected, the degree of impact and the area of the habitat affected.
Impact code
Impact description Percentage of sites affected: Area affected
(ha)
Area affected (% of total
sample area) Low
intensity Medium intensity
High intensity
Total
G01.02 Walking, horse
riding and non-
motorised vehicles
14.3 7.1 0.0 21.4 0.53 20.3
J02.12.01 Sea defence or coast
protection works,
tidal barrages
0.0 7.1 7.1 14.3 0.35 13.3
J02.04.01 Flooding 0.0 7.1 0.0 7.1 0.08 3.2
K01.01 Erosion 0.0 0.0 7.1 7.1 0.02 0.8
D01.01 Paths, tracks,
cycling tracks 0.0 0.0 7.1 7.1 <0.01 <0.1
Only four negative impacts were recorded (Table 3.16), and these included walking, waste related
to human activities (gardening and dog walking), trampling and newly erected sea defences. The
impact of dog waste affected 20% of the habitat at site 46 Tramore, where it has artificially
increased the nutrient content of the shingle. However, negative species associated with nutrient
enriched substrates have not yet become problematic. A newly built sea wall at site 120 Doo
Lough has an indirect effect on the habitat by altering the wave action, but the outcome of the
coastal protection works is yet to be understood and therefore this impact was recorded as neutral
in this particular case.
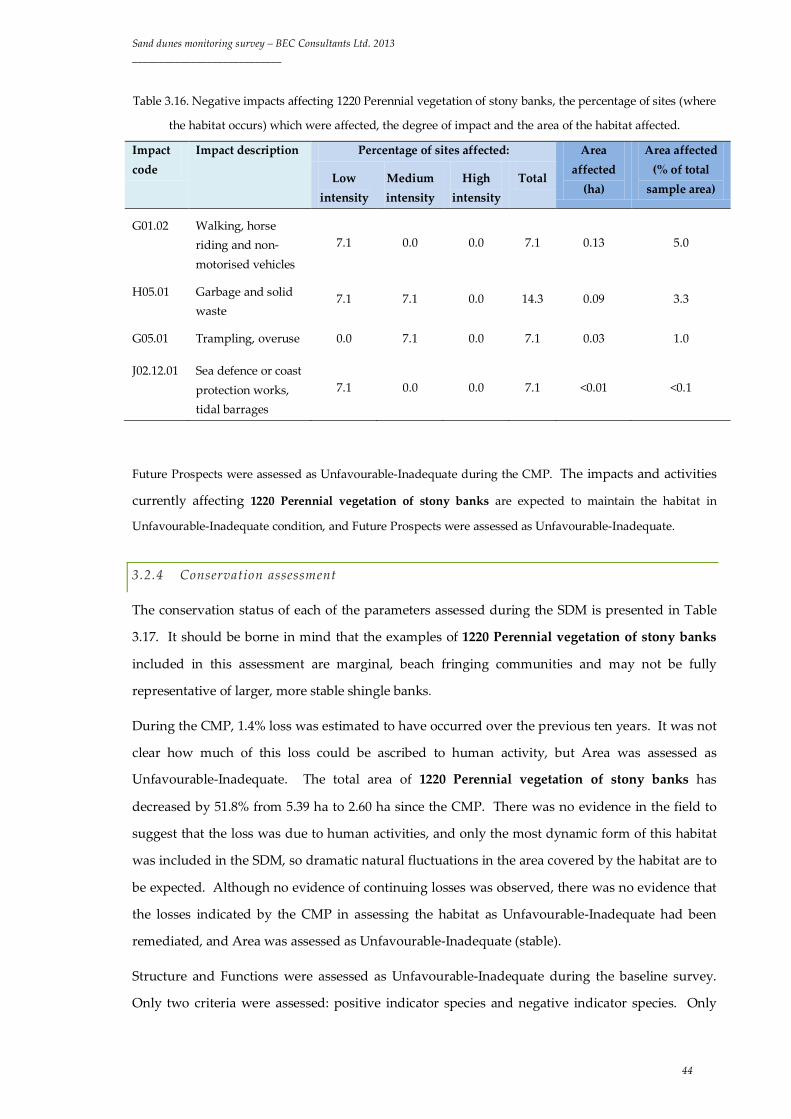
Sand dunes monitoring survey – BEC Consultants Ltd. 2013 ____________________________
44
Table 3.16. Negative impacts affecting 1220 Perennial vegetation of stony banks, the percentage of sites (where
the habitat occurs) which were affected, the degree of impact and the area of the habitat affected.
Impact code
Impact description Percentage of sites affected: Area affected
(ha)
Area affected (% of total
sample area) Low
intensity Medium intensity
High intensity
Total
G01.02 Walking, horse riding and non-motorised vehicles
7.1 0.0 0.0 7.1 0.13 5.0
H05.01 Garbage and solid waste
7.1 7.1 0.0 14.3 0.09 3.3
G05.01 Trampling, overuse 0.0 7.1 0.0 7.1 0.03 1.0
J02.12.01 Sea defence or coast protection works, tidal barrages
7.1 0.0 0.0 7.1 <0.01 <0.1
Future Prospects were assessed as Unfavourable-Inadequate during the CMP. The impacts and activities
currently affecting 1220 Perennial vegetation of stony banks are expected to maintain the habitat in
Unfavourable-Inadequate condition, and Future Prospects were assessed as Unfavourable-Inadequate.
3.2.4 Conservation assessment
The conservation status of each of the parameters assessed during the SDM is presented in Table
3.17. It should be borne in mind that the examples of 1220 Perennial vegetation of stony banks
included in this assessment are marginal, beach fringing communities and may not be fully
representative of larger, more stable shingle banks.
During the CMP, 1.4% loss was estimated to have occurred over the previous ten years. It was not
clear how much of this loss could be ascribed to human activity, but Area was assessed as
Unfavourable-Inadequate. The total area of 1220 Perennial vegetation of stony banks has
decreased by 51.8% from 5.39 ha to 2.60 ha since the CMP. There was no evidence in the field to
suggest that the loss was due to human activities, and only the most dynamic form of this habitat
was included in the SDM, so dramatic natural fluctuations in the area covered by the habitat are to
be expected. Although no evidence of continuing losses was observed, there was no evidence that
the losses indicated by the CMP in assessing the habitat as Unfavourable-Inadequate had been
remediated, and Area was assessed as Unfavourable-Inadequate (stable).
Structure and Functions were assessed as Unfavourable-Inadequate during the baseline survey.
Only two criteria were assessed: positive indicator species and negative indicator species. Only

Sand dunes monitoring survey – BEC Consultants Ltd. 2013 ____________________________
45
one monitoring stop at one site failed the Structure and Functions assessment during the CMP, but
several other sites were assessed as Unfavourable on expert judgement. According to the CMP
report (Ryle et al. 2009), the "presence of man-made structures" was indicated for several sites, but
it was not an assessment criterion for Structure and Functions. Sea defences, walking, motorised
vehicles and trampling were noted as negative impacts and these indicate that the criteria which
failed during the SDM may well have failed during the CMP if the same methodology had been
applied. Although the criteria assessing positive indicator species was assessed during the CMP, it
is not clear what the target value was for this criterion and the more negative assessment is most
likely to be the result of a stricter approach rather than a genuine deterioration in the habitat.
Structure and Functions were assessed as Unfavourable-Inadequate (stable).
Future Prospects were assessed as Unfavourable-Inadequate during the CMP. All of the negative
impacts noted during the SDM were also noted during the CMP, assuming that H05.01 Garbage
and solid waste corresponds to the previous code 423 Disposal of inert materials. Two impacts
were noted during the CMP but were not noted during the SDM, and these related to driving in
the habitat and removal of beach materials. The fact that these were not noted during the SDM
cannot be taken as a sign of improvement as the reduced number of negative impacts may be due
to the smaller sample size. No change in the conservation status of the habitat is predicted over the
next 12 years, and Future Prospects were assessed as Unfavourable-Inadequate (stable).
On the basis of the sites surveyed during the SDM, the conservation status of 1220 Perennial
vegetation of stony banks was assessed as Unfavourable-Inadequate (stable).
Table 3.17: Results of the conservation assessment of 1220 Perennial vegetation of stony banks.
Parameter CMP Assessment SDM Assessment Trend
Area Unfavourable-Inadequate Unfavourable-Inadequate Stable
Structure and Functions Unfavourable-Inadequate Unfavourable-Inadequate Stable
Future Prospects Unfavourable-Inadequate Unfavourable-Inadequate Stable
Conservation assessment Unfavourable-Inadequate Unfavourable-Inadequate Stable
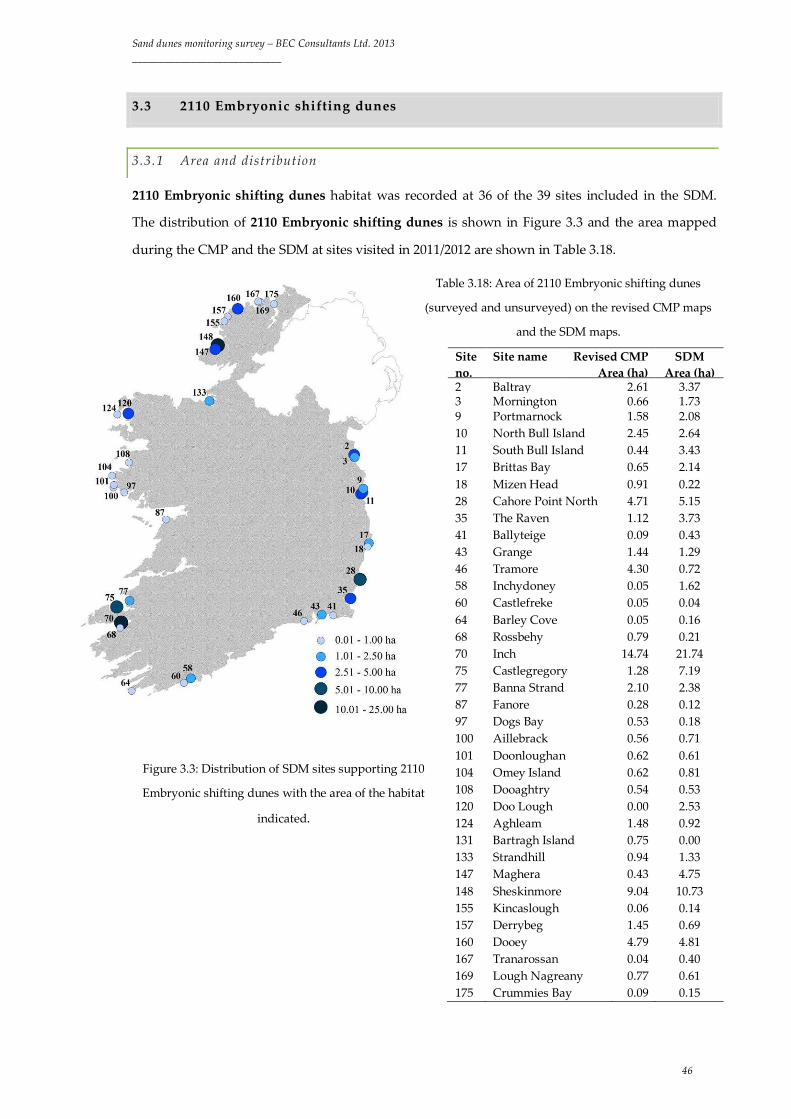
Sand dunes monitoring survey – BEC Consultants Ltd. 2013 ____________________________
46
3.3 2110 Embryonic shifting dunes
3.3.1 Area and distribution
2110 Embryonic shifting dunes habitat was recorded at 36 of the 39 sites included in the SDM.
The distribution of 2110 Embryonic shifting dunes is shown in Figure 3.3 and the area mapped
during the CMP and the SDM at sites visited in 2011/2012 are shown in Table 3.18.
Table 3.18: Area of 2110 Embryonic shifting dunes
(surveyed and unsurveyed) on the revised CMP maps
and the SDM maps.
Figure 3.3: Distribution of SDM sites supporting 2110
Embryonic shifting dunes with the area of the habitat
indicated.
Site no.
Site name Revised CMP Area (ha)
SDM Area (ha)
2 Baltray 2.61 3.37 3 Mornington 0.66 1.73 9 Portmarnock 1.58 2.08 10 North Bull Island 2.45 2.64 11 South Bull Island 0.44 3.43 17 Brittas Bay 0.65 2.14 18 Mizen Head 0.91 0.22 28 Cahore Point North 4.71 5.15 35 The Raven 1.12 3.73 41 Ballyteige 0.09 0.43 43 Grange 1.44 1.29 46 Tramore 4.30 0.72 58 Inchydoney 0.05 1.62 60 Castlefreke 0.05 0.04 64 Barley Cove 0.05 0.16 68 Rossbehy 0.79 0.21 70 Inch 14.74 21.74 75 Castlegregory 1.28 7.19 77 Banna Strand 2.10 2.38 87 Fanore 0.28 0.12 97 Dogs Bay 0.53 0.18 100 Aillebrack 0.56 0.71 101 Doonloughan 0.62 0.61 104 Omey Island 0.62 0.81 108 Dooaghtry 0.54 0.53 120 Doo Lough 0.00 2.53 124 Aghleam 1.48 0.92 131 Bartragh Island 0.75 0.00 133 Strandhill 0.94 1.33 147 Maghera 0.43 4.75 148 Sheskinmore 9.04 10.73 155 Kincaslough 0.06 0.14 157 Derrybeg 1.45 0.69 160 Dooey 4.79 4.81 167 Tranarossan 0.04 0.40 169 Lough Nagreany 0.77 0.61 175 Crummies Bay 0.09 0.15
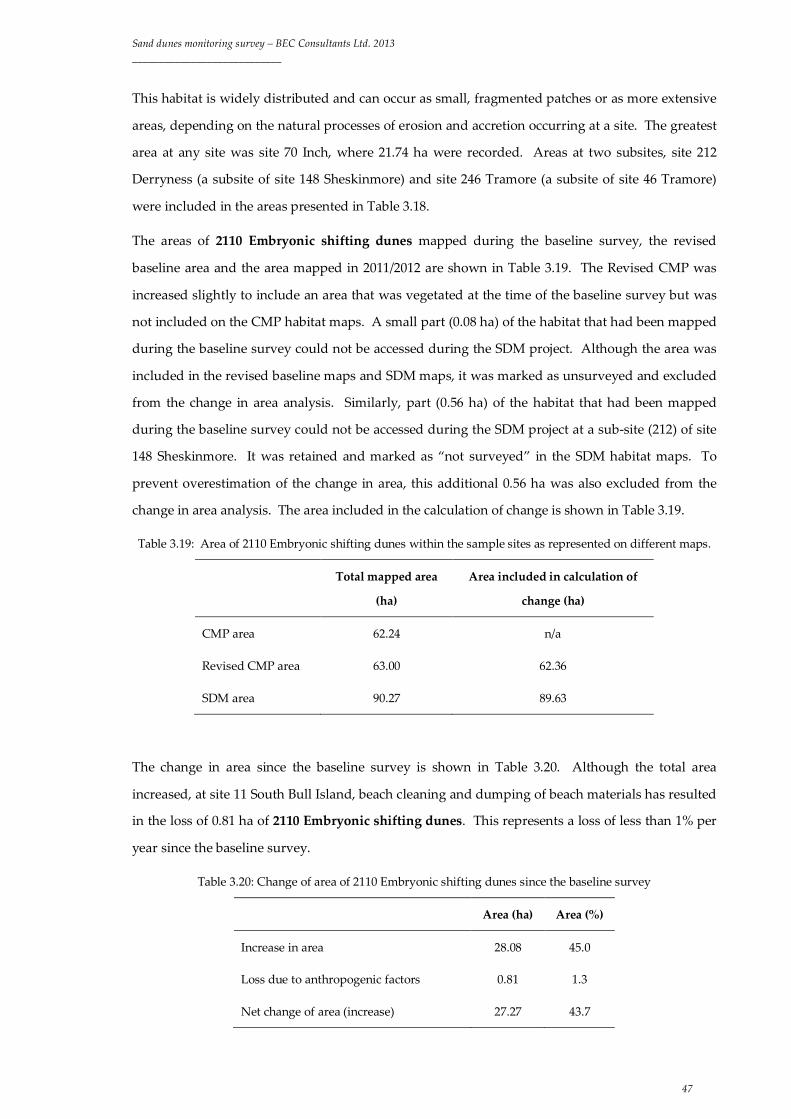
Sand dunes monitoring survey – BEC Consultants Ltd. 2013 ____________________________
47
This habitat is widely distributed and can occur as small, fragmented patches or as more extensive
areas, depending on the natural processes of erosion and accretion occurring at a site. The greatest
area at any site was site 70 Inch, where 21.74 ha were recorded. Areas at two subsites, site 212
Derryness (a subsite of site 148 Sheskinmore) and site 246 Tramore (a subsite of site 46 Tramore)
were included in the areas presented in Table 3.18.
The areas of 2110 Embryonic shifting dunes mapped during the baseline survey, the revised
baseline area and the area mapped in 2011/2012 are shown in Table 3.19. The Revised CMP was
increased slightly to include an area that was vegetated at the time of the baseline survey but was
not included on the CMP habitat maps. A small part (0.08 ha) of the habitat that had been mapped
during the baseline survey could not be accessed during the SDM project. Although the area was
included in the revised baseline maps and SDM maps, it was marked as unsurveyed and excluded
from the change in area analysis. Similarly, part (0.56 ha) of the habitat that had been mapped
during the baseline survey could not be accessed during the SDM project at a sub-site (212) of site
148 Sheskinmore. It was retained and marked as “not surveyed” in the SDM habitat maps. To
prevent overestimation of the change in area, this additional 0.56 ha was also excluded from the
change in area analysis. The area included in the calculation of change is shown in Table 3.19.
Table 3.19: Area of 2110 Embryonic shifting dunes within the sample sites as represented on different maps.
Total mapped area
(ha)
Area included in calculation of
change (ha)
CMP area 62.24 n/a
Revised CMP area 63.00 62.36
SDM area 90.27 89.63
The change in area since the baseline survey is shown in Table 3.20. Although the total area
increased, at site 11 South Bull Island, beach cleaning and dumping of beach materials has resulted
in the loss of 0.81 ha of 2110 Embryonic shifting dunes. This represents a loss of less than 1% per
year since the baseline survey.
Table 3.20: Change of area of 2110 Embryonic shifting dunes since the baseline survey
Area (ha) Area (%)
Increase in area 28.08 45.0
Loss due to anthropogenic factors 0.81 1.3
Net change of area (increase) 27.27 43.7
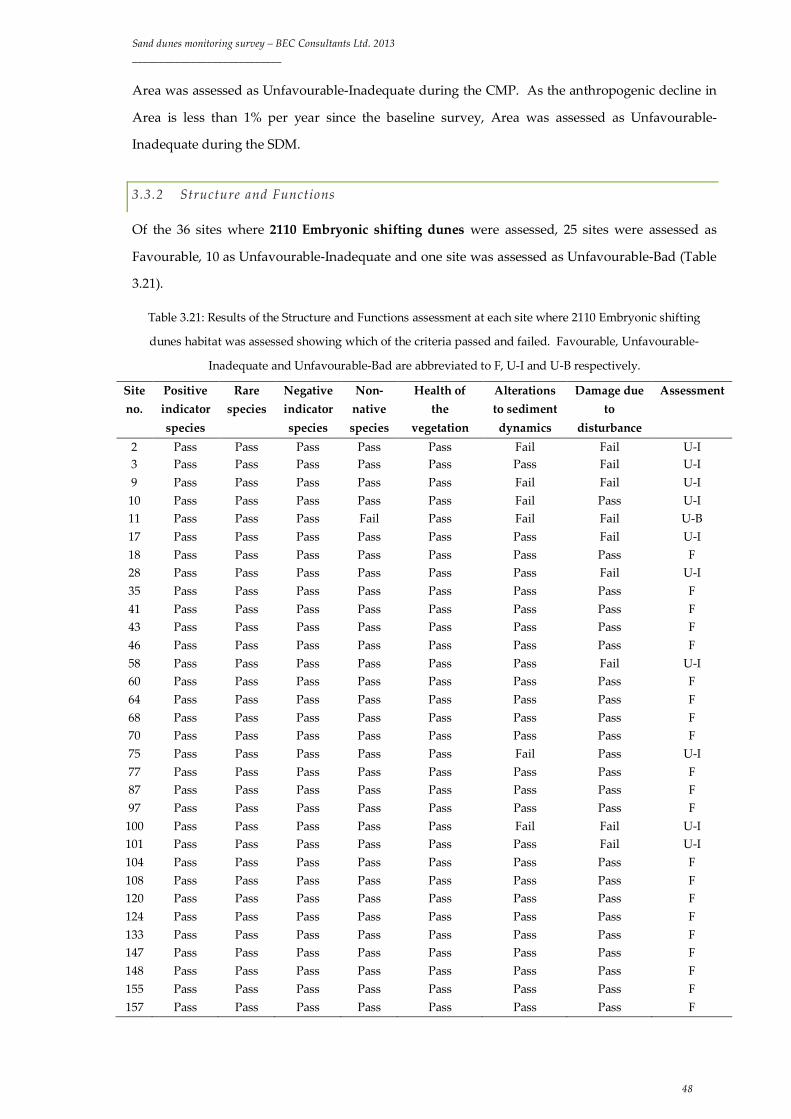
Sand dunes monitoring survey – BEC Consultants Ltd. 2013 ____________________________
48
Area was assessed as Unfavourable-Inadequate during the CMP. As the anthropogenic decline in
Area is less than 1% per year since the baseline survey, Area was assessed as Unfavourable-
Inadequate during the SDM.
3.3.2 Structure and Functions
Of the 36 sites where 2110 Embryonic shifting dunes were assessed, 25 sites were assessed as
Favourable, 10 as Unfavourable-Inadequate and one site was assessed as Unfavourable-Bad (Table
3.21).
Table 3.21: Results of the Structure and Functions assessment at each site where 2110 Embryonic shifting
dunes habitat was assessed showing which of the criteria passed and failed. Favourable, Unfavourable-
Inadequate and Unfavourable-Bad are abbreviated to F, U-I and U-B respectively.
Site no.
Positive indicator species
Rare species
Negative indicator species
Non-native species
Health of the
vegetation
Alterations to sediment dynamics
Damage due to
disturbance
Assessment
2 Pass Pass Pass Pass Pass Fail Fail U-I 3 Pass Pass Pass Pass Pass Pass Fail U-I 9 Pass Pass Pass Pass Pass Fail Fail U-I 10 Pass Pass Pass Pass Pass Fail Pass U-I 11 Pass Pass Pass Fail Pass Fail Fail U-B 17 Pass Pass Pass Pass Pass Pass Fail U-I 18 Pass Pass Pass Pass Pass Pass Pass F 28 Pass Pass Pass Pass Pass Pass Fail U-I 35 Pass Pass Pass Pass Pass Pass Pass F 41 Pass Pass Pass Pass Pass Pass Pass F 43 Pass Pass Pass Pass Pass Pass Pass F 46 Pass Pass Pass Pass Pass Pass Pass F 58 Pass Pass Pass Pass Pass Pass Fail U-I 60 Pass Pass Pass Pass Pass Pass Pass F 64 Pass Pass Pass Pass Pass Pass Pass F 68 Pass Pass Pass Pass Pass Pass Pass F 70 Pass Pass Pass Pass Pass Pass Pass F 75 Pass Pass Pass Pass Pass Fail Pass U-I 77 Pass Pass Pass Pass Pass Pass Pass F 87 Pass Pass Pass Pass Pass Pass Pass F 97 Pass Pass Pass Pass Pass Pass Pass F 100 Pass Pass Pass Pass Pass Fail Fail U-I 101 Pass Pass Pass Pass Pass Pass Fail U-I 104 Pass Pass Pass Pass Pass Pass Pass F 108 Pass Pass Pass Pass Pass Pass Pass F 120 Pass Pass Pass Pass Pass Pass Pass F 124 Pass Pass Pass Pass Pass Pass Pass F 133 Pass Pass Pass Pass Pass Pass Pass F 147 Pass Pass Pass Pass Pass Pass Pass F 148 Pass Pass Pass Pass Pass Pass Pass F 155 Pass Pass Pass Pass Pass Pass Pass F 157 Pass Pass Pass Pass Pass Pass Pass F
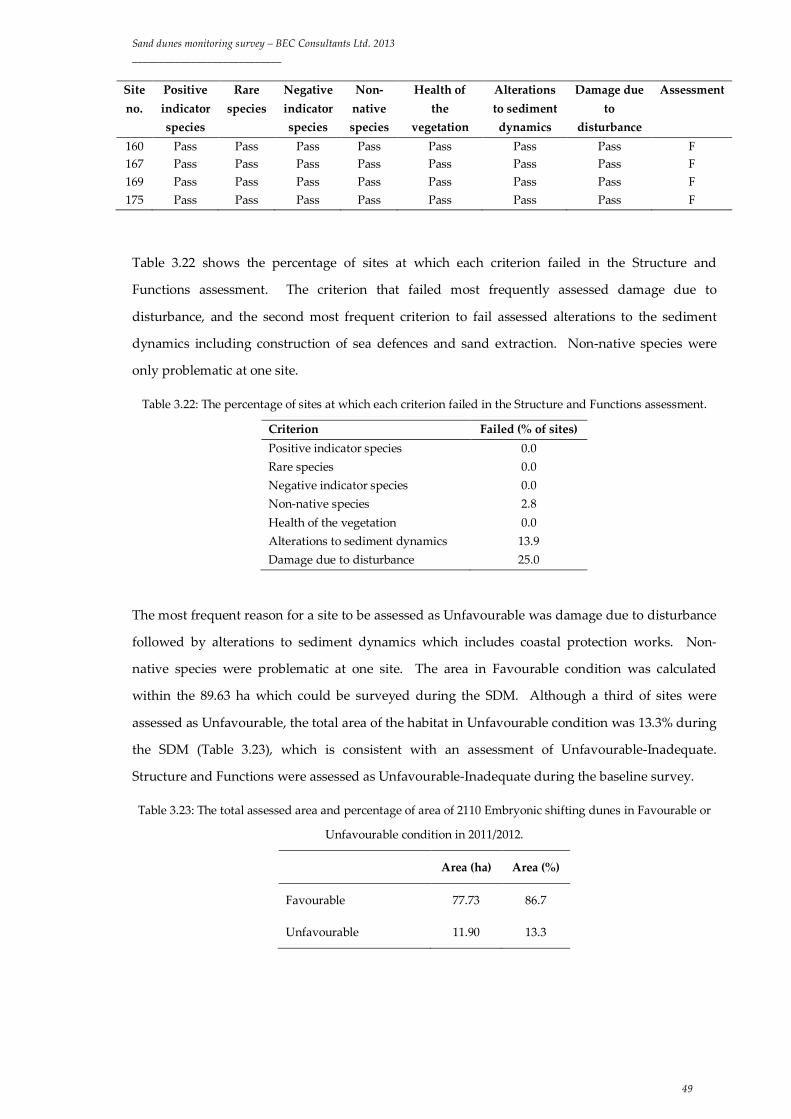
Sand dunes monitoring survey – BEC Consultants Ltd. 2013 ____________________________
49
Site no.
Positive indicator species
Rare species
Negative indicator species
Non-native species
Health of the
vegetation
Alterations to sediment dynamics
Damage due to
disturbance
Assessment
160 Pass Pass Pass Pass Pass Pass Pass F 167 Pass Pass Pass Pass Pass Pass Pass F 169 Pass Pass Pass Pass Pass Pass Pass F 175 Pass Pass Pass Pass Pass Pass Pass F
Table 3.22 shows the percentage of sites at which each criterion failed in the Structure and
Functions assessment. The criterion that failed most frequently assessed damage due to
disturbance, and the second most frequent criterion to fail assessed alterations to the sediment
dynamics including construction of sea defences and sand extraction. Non-native species were
only problematic at one site.
Table 3.22: The percentage of sites at which each criterion failed in the Structure and Functions assessment.
Criterion Failed (% of sites) Positive indicator species 0.0 Rare species 0.0 Negative indicator species 0.0 Non-native species 2.8 Health of the vegetation 0.0 Alterations to sediment dynamics 13.9 Damage due to disturbance 25.0
The most frequent reason for a site to be assessed as Unfavourable was damage due to disturbance
followed by alterations to sediment dynamics which includes coastal protection works. Non-
native species were problematic at one site. The area in Favourable condition was calculated
within the 89.63 ha which could be surveyed during the SDM. Although a third of sites were
assessed as Unfavourable, the total area of the habitat in Unfavourable condition was 13.3% during
the SDM (Table 3.23), which is consistent with an assessment of Unfavourable-Inadequate.
Structure and Functions were assessed as Unfavourable-Inadequate during the baseline survey.
Table 3.23: The total assessed area and percentage of area of 2110 Embryonic shifting dunes in Favourable or
Unfavourable condition in 2011/2012.
Area (ha) Area (%)
Favourable 77.73 86.7
Unfavourable 11.90 13.3
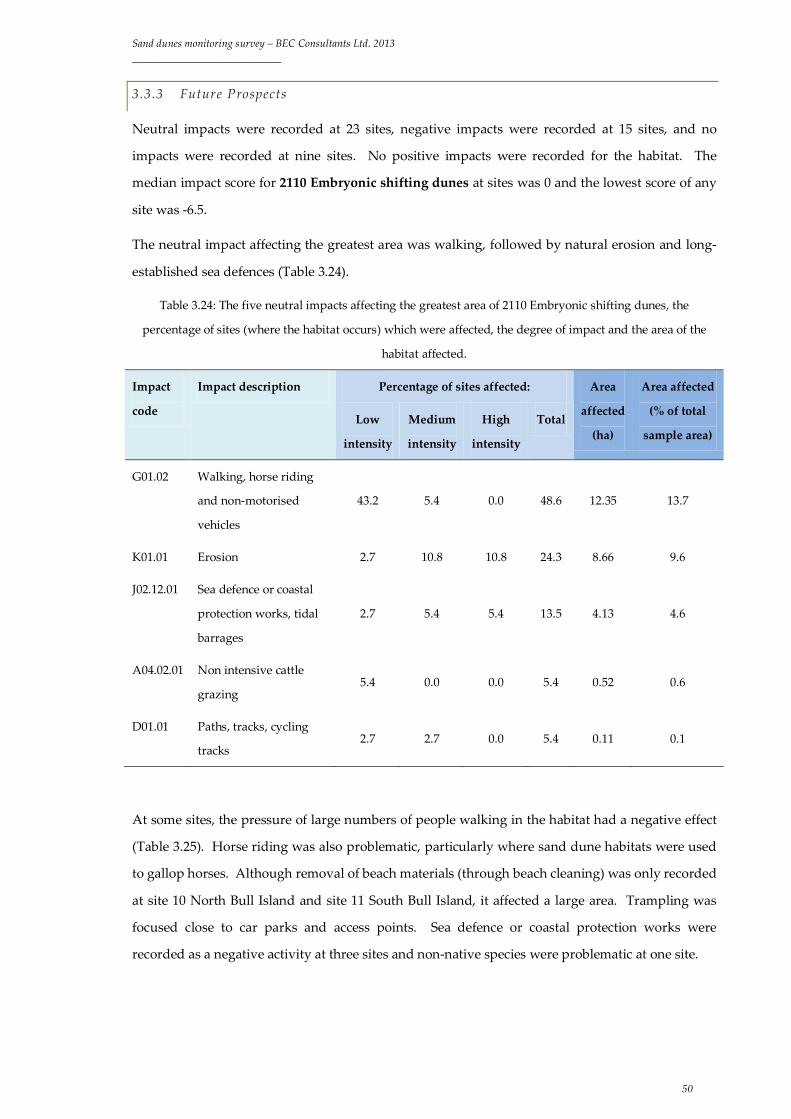
Sand dunes monitoring survey – BEC Consultants Ltd. 2013 ____________________________
50
3.3.3 Future Prospects
Neutral impacts were recorded at 23 sites, negative impacts were recorded at 15 sites, and no
impacts were recorded at nine sites. No positive impacts were recorded for the habitat. The
median impact score for 2110 Embryonic shifting dunes at sites was 0 and the lowest score of any
site was -6.5.
The neutral impact affecting the greatest area was walking, followed by natural erosion and long-
established sea defences (Table 3.24).
Table 3.24: The five neutral impacts affecting the greatest area of 2110 Embryonic shifting dunes, the
percentage of sites (where the habitat occurs) which were affected, the degree of impact and the area of the
habitat affected.
Impact
code
Impact description Percentage of sites affected: Area
affected
(ha)
Area affected
(% of total
sample area) Low
intensity
Medium
intensity
High
intensity
Total
G01.02 Walking, horse riding
and non-motorised
vehicles
43.2 5.4 0.0 48.6 12.35 13.7
K01.01 Erosion 2.7 10.8 10.8 24.3 8.66 9.6
J02.12.01 Sea defence or coastal
protection works, tidal
barrages
2.7 5.4 5.4 13.5 4.13 4.6
A04.02.01 Non intensive cattle
grazing 5.4 0.0 0.0 5.4 0.52 0.6
D01.01 Paths, tracks, cycling
tracks 2.7 2.7 0.0 5.4 0.11 0.1
At some sites, the pressure of large numbers of people walking in the habitat had a negative effect
(Table 3.25). Horse riding was also problematic, particularly where sand dune habitats were used
to gallop horses. Although removal of beach materials (through beach cleaning) was only recorded
at site 10 North Bull Island and site 11 South Bull Island, it affected a large area. Trampling was
focused close to car parks and access points. Sea defence or coastal protection works were
recorded as a negative activity at three sites and non-native species were problematic at one site.

Sand dunes monitoring survey – BEC Consultants Ltd. 2013 ____________________________
51
Table 3.25: The five negative impacts affecting the greatest area of 2110 Embryonic shifting dunes, the
percentage of sites (where the habitat occurs) which were affected, the degree of impact and the area of the
habitat affected.
Impact code
Impact description Percentage of sites affected: Area affected
(ha)
Area affected (% of total
sample area) Low
intensity Medium intensity
High intensity
Total
G01.02 Walking, horse riding and
non-motorised vehicles 13.5 2.7 0.0 16.2 6.19 6.9
G05.05 Intensive maintenance of
public parks /cleaning of
beaches
0.0 5.4 0.0 5.4 6.07 6.7
G05.01 Trampling, overuse 0.0 10.8 13.5 24.3 4.92 5.5
J02.12.01 Sea defence or coast
protection works, tidal
barrages
2.7 5.4 0.0 8.1 1.83 2.0
I01 Invasive non-native
species 2.7 0.0 0.0 2.7 0.69 0.8
If the impacts affecting 2110 Embryonic shifting dunes remain unchanged over the next 12 years,
the habitat will remain in Unfavourable condition, but is not expected to deteriorate. Future
Prospects were assessed as Unfavourable-Inadequate during the baseline survey. The current
assessment is Unfavourable-Inadequate.
3.3.4 Conservation assessment
Table 3.26 shows the conservation assessment of 2110 Embryonic shifting dunes during the SDM.
During the CMP, Area was assessed as Unfavourable-Inadequate as it was believed to have
decreased by 4.8 ha over the previous ten years. It is not clear how much of this loss was related to
human activities. Area has declined by 0.81 ha (1.3%) since the CMP survey, which is consistent
with an assessment of Unfavourable-Inadequate, and the fact that losses continue to occur means
that the trend is deteriorating.
Structure and Functions were assessed as Unfavourable-Inadequate during the CMP. Only three
criteria were assessed: positive indicator species, negative species and flowering and fruiting.
Flowering and fruiting was the criterion that failed most frequently at that time, followed by
negative indicator species. Flowering and fruiting passed at all sites during the SDM, although at

Sand dunes monitoring survey – BEC Consultants Ltd. 2013 ____________________________
52
one site, it was allowed to pass on expert judgement because the site was surveyed outside of the
flowering season. The criteria that failed most frequently during the SDM were not assessed
during the CMP, but trampling and sea defences were listed as impacts, indicating that damage
due to disturbance and interference with the sediment availability were affecting the habitat
during the CMP. No significant change in the Structure and Functions of the habitat was
identified, and Structure and Functions were assessed as Unfavourable-Inadequate (stable) during
the SDM.
Three of the four most frequently recorded impacts during the CMP appeared in the list of the top
five negative impacts during the SDM, and the fourth, erosion, was listed as one of the most
widespread neutral impacts. Two negative impacts appeared in the list of the top five negative
impacts for the first time during the SDM. Beach cleaning was recorded from two sites and
invasive non-native species were recorded from one site. Although beach cleaning was not
recorded during the CMP, it was mentioned in the individual site report for one of the sites
affected (South Bull Island) and a management plan for Bull Island dating to 2011 states that
mechanical scraping of the shoreline and deposition of the resulting sediments in the fore-dunes
was a management policy at the site. Because of these records, beach cleaning is not considered a
new impact. The presence of the non-native species Senecio squalidus at site 11 South Bull Island is
of concern and should be addressed, but this is unlikely to result in the habitat deteriorating to
Unfavourable-Bad within the next 12 years. There was no significant change in the assessment of
2110 Embryonic shifting dunes and Future Prospects were assessed as Unfavourable-Inadequate
(stable) during the SDM.
All of the parameters were assessed as Unfavourable-Inadequate during the SDM, as they were
during the CMP. Area, however, was considered to be deteriorating due to continuing losses. The
conservation status of 2110 Embryonic shifting dunes was assessed as Unfavourable-Inadequate
(deteriorating) during the SDM.
Table 3.26: Results of the conservation assessment of 2110 Embryonic shifting dunes.
Parameter CMP Assessment SDM Assessment Trend
Area Unfavourable-Inadequate Unfavourable-Inadequate Deteriorating
Structure and Functions Unfavourable-Inadequate Unfavourable-Inadequate Stable
Future Prospects Unfavourable-Inadequate Unfavourable-Inadequate Stable
Conservation assessment Unfavourable-Inadequate Unfavourable-Inadequate Deteriorating
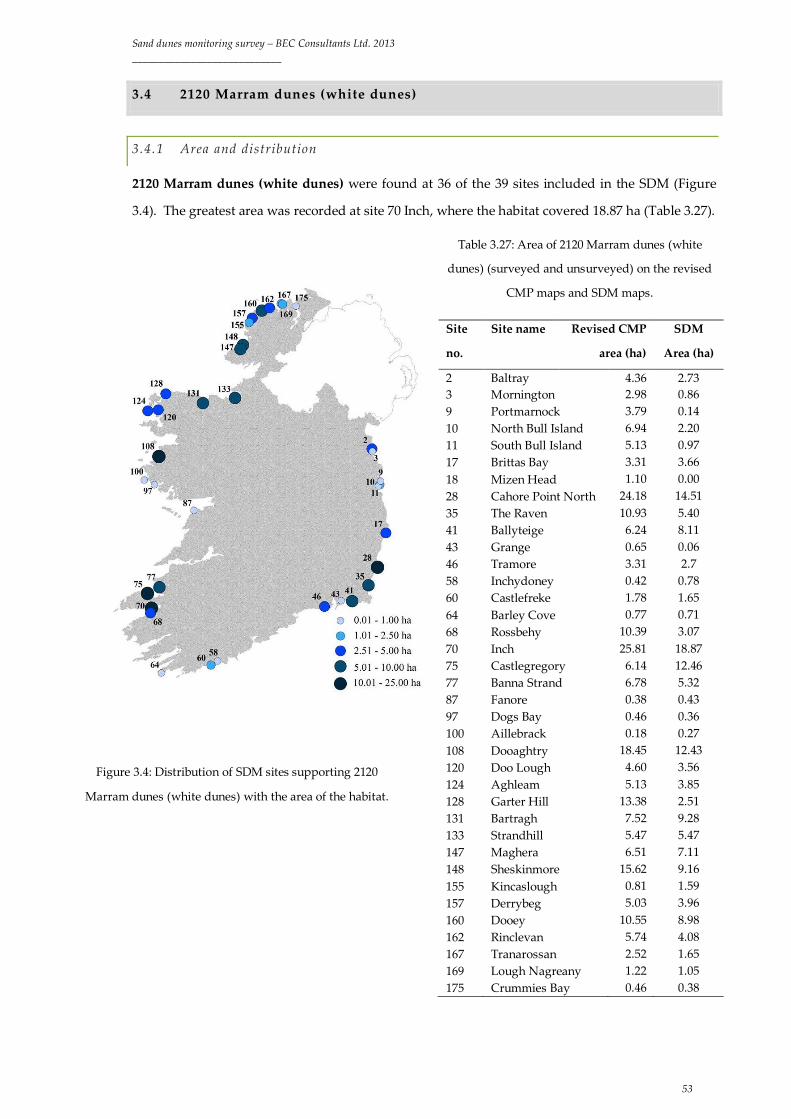
Sand dunes monitoring survey – BEC Consultants Ltd. 2013 ____________________________
53
3.4 2120 Marram dunes (white dunes)
3.4.1 Area and distribution
2120 Marram dunes (white dunes) were found at 36 of the 39 sites included in the SDM (Figure
3.4). The greatest area was recorded at site 70 Inch, where the habitat covered 18.87 ha (Table 3.27).
Table 3.27: Area of 2120 Marram dunes (white
dunes) (surveyed and unsurveyed) on the revised
CMP maps and SDM maps.
Site
no.
Site name Revised CMP
area (ha)
SDM
Area (ha)
2 Baltray 4.36 2.73 3 Mornington 2.98 0.86 9 Portmarnock 3.79 0.14 10 North Bull Island 6.94 2.20 11 South Bull Island 5.13 0.97 17 Brittas Bay 3.31 3.66 18 Mizen Head 1.10 0.00 28 Cahore Point North 24.18 14.51 35 The Raven 10.93 5.40 41 Ballyteige 6.24 8.11 43 Grange 0.65 0.06 46 Tramore 3.31 2.7 58 Inchydoney 0.42 0.78 60 Castlefreke 1.78 1.65 64 Barley Cove 0.77 0.71 68 Rossbehy 10.39 3.07 70 Inch 25.81 18.87 75 Castlegregory 6.14 12.46 77 Banna Strand 6.78 5.32 87 Fanore 0.38 0.43 97 Dogs Bay 0.46 0.36 100 Aillebrack 0.18 0.27 108 Dooaghtry 18.45 12.43 120 Doo Lough 4.60 3.56 124 Aghleam 5.13 3.85 128 Garter Hill 13.38 2.51 131 Bartragh 7.52 9.28 133 Strandhill 5.47 5.47 147 Maghera 6.51 7.11 148 Sheskinmore 15.62 9.16 155 Kincaslough 0.81 1.59 157 Derrybeg 5.03 3.96 160 Dooey 10.55 8.98 162 Rinclevan 5.74 4.08 167 Tranarossan 2.52 1.65 169 Lough Nagreany 1.22 1.05 175 Crummies Bay 0.46 0.38
Figure 3.4: Distribution of SDM sites supporting 2120
Marram dunes (white dunes) with the area of the habitat.
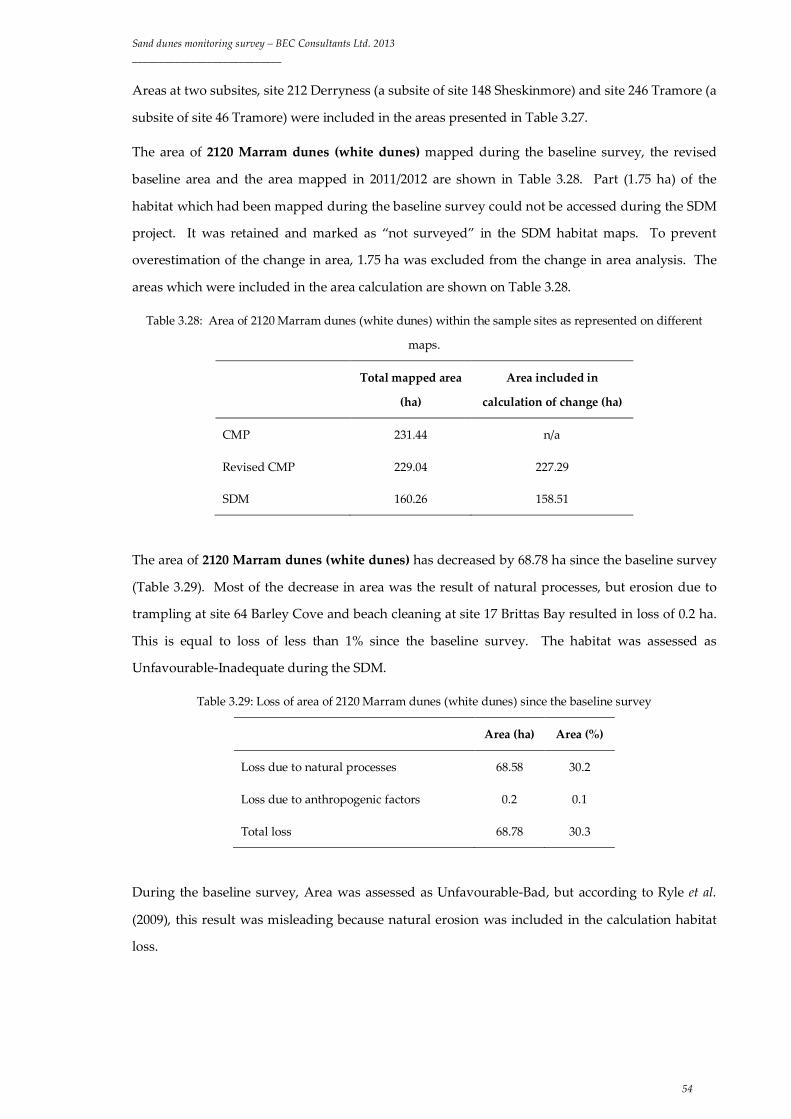
Sand dunes monitoring survey – BEC Consultants Ltd. 2013 ____________________________
54
Areas at two subsites, site 212 Derryness (a subsite of site 148 Sheskinmore) and site 246 Tramore (a
subsite of site 46 Tramore) were included in the areas presented in Table 3.27.
The area of 2120 Marram dunes (white dunes) mapped during the baseline survey, the revised
baseline area and the area mapped in 2011/2012 are shown in Table 3.28. Part (1.75 ha) of the
habitat which had been mapped during the baseline survey could not be accessed during the SDM
project. It was retained and marked as “not surveyed” in the SDM habitat maps. To prevent
overestimation of the change in area, 1.75 ha was excluded from the change in area analysis. The
areas which were included in the area calculation are shown on Table 3.28.
Table 3.28: Area of 2120 Marram dunes (white dunes) within the sample sites as represented on different
maps.
Total mapped area
(ha)
Area included in
calculation of change (ha)
CMP 231.44 n/a
Revised CMP 229.04 227.29
SDM 160.26 158.51
The area of 2120 Marram dunes (white dunes) has decreased by 68.78 ha since the baseline survey
(Table 3.29). Most of the decrease in area was the result of natural processes, but erosion due to
trampling at site 64 Barley Cove and beach cleaning at site 17 Brittas Bay resulted in loss of 0.2 ha.
This is equal to loss of less than 1% since the baseline survey. The habitat was assessed as
Unfavourable-Inadequate during the SDM.
Table 3.29: Loss of area of 2120 Marram dunes (white dunes) since the baseline survey
Area (ha) Area (%)
Loss due to natural processes 68.58 30.2
Loss due to anthropogenic factors 0.2 0.1
Total loss 68.78 30.3
During the baseline survey, Area was assessed as Unfavourable-Bad, but according to Ryle et al.
(2009), this result was misleading because natural erosion was included in the calculation habitat
loss.

Sand dunes monitoring survey – BEC Consultants Ltd. 2013 ____________________________
55
3.4.2 Structure and Functions
The Structure and Functions of 2120 Marram dunes (white dunes) were assessed at 35 sites. 2120
Marram dunes (white dunes) were recorded at site 43 Grange, but the habitat eroded before the
Structure and Functions could be assessed on a return visit. Table 3.30 shows the Structure and
Functions assessments for each site where 2120 Marram dunes (white dunes) were assessed.
Twenty-one sites were assessed as Favourable, 13 as Unfavourable-Inadequate and one site was
assessed as Unfavourable-Bad.
Table 3.30: The results of the Structure and Functions assessment at each site where 2120 Marram dunes
(white dunes) habitat was assessed showing which of the criteria passed and failed. Favourable,
Unfavourable-Inadequate and Unfavourable-Bad are abbreviated to F, U-I and U-B respectively.
Site
no.
Positive
indicator
species
Rare
species
Negative
indicator
species
Non-
native
species
Health of
the
vegetation
Alterations
to sediment
dynamics
Damage
due to
disturbance
Assessment
2 Pass Pass Pass Pass Pass Fail Fail U-I
3 Pass Pass Pass Pass Pass Pass Fail U-I
9 Pass Pass Pass Pass Pass Pass Fail U-I
10 Pass Pass Pass Pass Pass Fail Pass U-I
11 Pass Pass Pass Fail Pass Fail Fail U-B
17 Pass Pass Pass Pass Pass Pass Fail U-I
28 Pass Pass Pass Pass Pass Pass Fail U-I
35 Pass Pass Pass Pass Pass Pass Pass F
41 Pass Pass Pass Pass Pass Pass Pass F
46 Pass Pass Pass Pass Pass Pass Pass F
58 Pass Pass Pass Pass Pass Pass Fail U-I
60 Pass Pass Pass Pass Pass Pass Pass F
64 Pass Pass Pass Pass Pass Pass Pass F
68 Pass Pass Pass Pass Pass Pass Pass F
70 Pass Pass Pass Pass Pass Pass Pass F
75 Pass Pass Pass Pass Pass Fail Pass U-I
77 Pass Pass Pass Pass Pass Pass Fail U-I
87 Pass Pass Pass Pass Pass Pass Pass F
97 Pass Pass Pass Pass Pass Fail Fail U-I
100 Pass Pass Pass Pass Pass Pass Pass F
108 Pass Pass Pass Pass Pass Pass Pass F
120 Pass Pass Pass Pass Pass Pass Pass F
124 Pass Pass Pass Pass Pass Pass Pass F
128 Pass Pass Pass Pass Pass Pass Pass F

Sand dunes monitoring survey – BEC Consultants Ltd. 2013 ____________________________
56
Site
no.
Positive
indicator
species
Rare
species
Negative
indicator
species
Non-
native
species
Health of
the
vegetation
Alterations
to sediment
dynamics
Damage
due to
disturbance
Assessment
131 Pass Pass Pass Pass Pass Pass Pass F
133 Pass Pass Pass Pass Pass Pass Fail U-I
147 Pass Pass Pass Pass Pass Pass Pass F
148 Pass Pass Pass Pass Pass Pass Pass F
155 Pass Pass Pass Pass Pass Fail Pass U-I
157 Pass Pass Pass Pass Pass Fail Pass U-I
160 Pass Pass Pass Pass Pass Pass Pass F
162 Pass Pass Pass Pass Pass Pass Pass F
167 Pass Pass Pass Pass Pass Pass Pass F
169 Pass Pass Pass Pass Pass Pass Pass F
175 Pass Pass Pass Pass Pass Pass Pass F
Table 3.31 shows the failure rate for each criterion in the Structure and Functions assessment.
Damage due to disturbance and alterations to the sediment dynamics (including coastal protection
works) were the most frequent criteria to fail.
Table 3.31: The percentage of sites with 2120 Marram dunes (white dunes) at which each criterion failed in the
Structure and Functions assessment.
Criterion Failed (% of sites)
Positive indicator species 0.0
Rare species 0.0
Negative indicator species 0.0
Non-native species 2.9
Health of the vegetation 0.0
Alterations to sediment dynamics 20.5
Damage due to disturbance 29.4
Due to access difficulties, 1.75 ha could not be included in the survey. The total area included in
the Structure and Functions assessment was 158.45 ha. Of the total sample area, 142.82 ha (90.1%)
were assessed as Favourable and 15.63 ha (9.9%) were assessed as Unfavourable (Table 3.32). The
Structure and Functions were assessed as Unfavourable-Inadequate.

Sand dunes monitoring survey – BEC Consultants Ltd. 2013 ____________________________
57
Table 3.32: The total assessed area and percentage of area of 2120 Marram dunes (white dunes) in Favourable
and Unfavourable condition in 2011/2012.
Area (ha) Area (%)
Favourable 142.82 90.1
Unfavourable 15.63 9.9
This is a more favourable assessment than the habitat received during the CMP, when it was
assessed as Unfavourable-Bad, with the most important reason for this habitat to fail being the
presence of unhealthy Ammophila arenaria in monitoring stops.
3.4.3 Future Prospects
Positive impacts were recorded at one site, neutral impacts were recorded at 23 sites and negative
impacts were recorded at 21 sites. No impacts were recorded at four sites. The median impact
score across all sites was 0, and the most negative score was -6.5.
Although artificial sediment stabilisation is frequently considered to be a negative impact, at one
site it was recorded as a positive impact (Table 3.33). Anthropogenic disturbance and over grazing
has resulted in anthropogenic erosion at site 108 Dooaghtry. A local landowner is promoting the
spread of Ammophila arenaria into the affected areas, which has reduced the mobility of the sand.
Table 3.33: Positive impacts affecting 2120 Marram dunes (white dunes), the percentage of sites (where the
habitat occurs) which were affected, the degree of impact and the area of the habitat affected.
Impact code
Impact description Percentage of sites affected: Area affected
(ha)
Area affected (% of total
sample area) Low
intensity Medium intensity
High intensity
Total
J03.03 Reduction, lack or
prevention of
erosion
0.0 2.7 0.0 2.7 0.12 0.1
The neutral impact affecting the greatest area is erosion, which affects over 9% of the habitat (Table
3.34). Walking, horse-riding and non-motorised vehicles are the most frequent neutral impact.
Old sea defences are less frequent but affect the same area, 2.6% of the habitat. Non-intensive
sheep grazing and fences, paths and tracks each affect less than 1% of the habitat.

Sand dunes monitoring survey – BEC Consultants Ltd. 2013 ____________________________
58
Table 3.34: The five neutral impacts affecting the greatest area of 2120 Marram dunes (white dunes), the
percentage of sites (where the habitat occurs) which were affected, the degree of impact and the area of the
habitat affected.
Impact
code
Impact description Percentage of sites affected: Area
affected
(ha)
Area affected
(% of total
sample area) Low
intensity Medium intensity
High intensity
Total
K01.01 Erosion 5.4 16.2 13.5 35.1 14.81 9.2
G01.02 Walking, horse
riding and non-
motorised vehicles
35.1 5.4 0.0 40.5 4.16 2.6
J02.12.01 Sea defence or
coast protection
works, tidal
barrages
2.7 5.4 5.4 13.5 4.10 2.6
A04.02.02 Non intensive
sheep grazing 2.7 0.0 0.0 2.7 1.24 0.8
D01.01 Paths, tracks,
cycling tracks 5.4 2.7 0.0 8.1 0.26 0.2
Negative impacts primarily associated with recreation (walking, horse-riding and non-motorised
vehicles; trampling and overuse) affect the greatest area (Table 3.35). The other impacts presented
in Table 3.35 relate to interference with sediment dynamics.
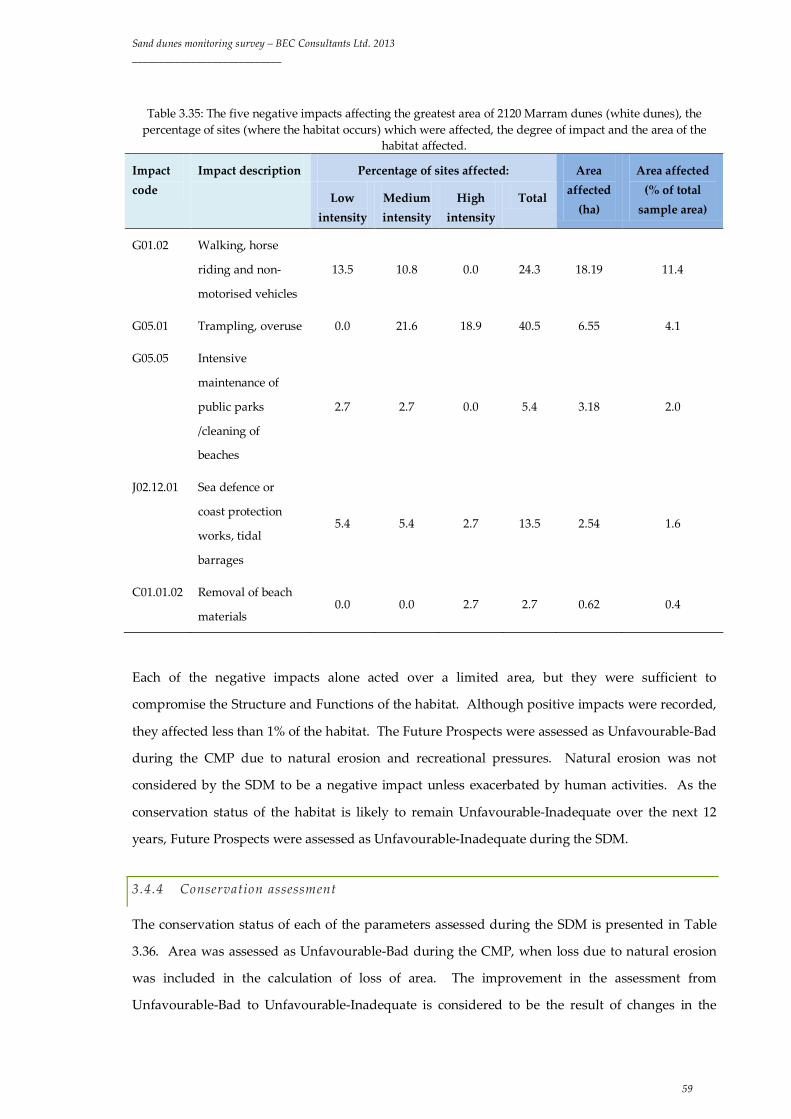
Sand dunes monitoring survey – BEC Consultants Ltd. 2013 ____________________________
59
Table 3.35: The five negative impacts affecting the greatest area of 2120 Marram dunes (white dunes), the percentage of sites (where the habitat occurs) which were affected, the degree of impact and the area of the
habitat affected.
Impact code
Impact description Percentage of sites affected: Area affected
(ha)
Area affected (% of total
sample area) Low
intensity Medium intensity
High intensity
Total
G01.02 Walking, horse
riding and non-
motorised vehicles
13.5 10.8 0.0 24.3 18.19 11.4
G05.01 Trampling, overuse 0.0 21.6 18.9 40.5 6.55 4.1
G05.05 Intensive
maintenance of
public parks
/cleaning of
beaches
2.7 2.7 0.0 5.4 3.18 2.0
J02.12.01 Sea defence or
coast protection
works, tidal
barrages
5.4 5.4 2.7 13.5 2.54 1.6
C01.01.02 Removal of beach
materials 0.0 0.0 2.7 2.7 0.62 0.4
Each of the negative impacts alone acted over a limited area, but they were sufficient to
compromise the Structure and Functions of the habitat. Although positive impacts were recorded,
they affected less than 1% of the habitat. The Future Prospects were assessed as Unfavourable-Bad
during the CMP due to natural erosion and recreational pressures. Natural erosion was not
considered by the SDM to be a negative impact unless exacerbated by human activities. As the
conservation status of the habitat is likely to remain Unfavourable-Inadequate over the next 12
years, Future Prospects were assessed as Unfavourable-Inadequate during the SDM.
3.4.4 Conservation assessment
The conservation status of each of the parameters assessed during the SDM is presented in Table
3.36. Area was assessed as Unfavourable-Bad during the CMP, when loss due to natural erosion
was included in the calculation of loss of area. The improvement in the assessment from
Unfavourable-Bad to Unfavourable-Inadequate is considered to be the result of changes in the
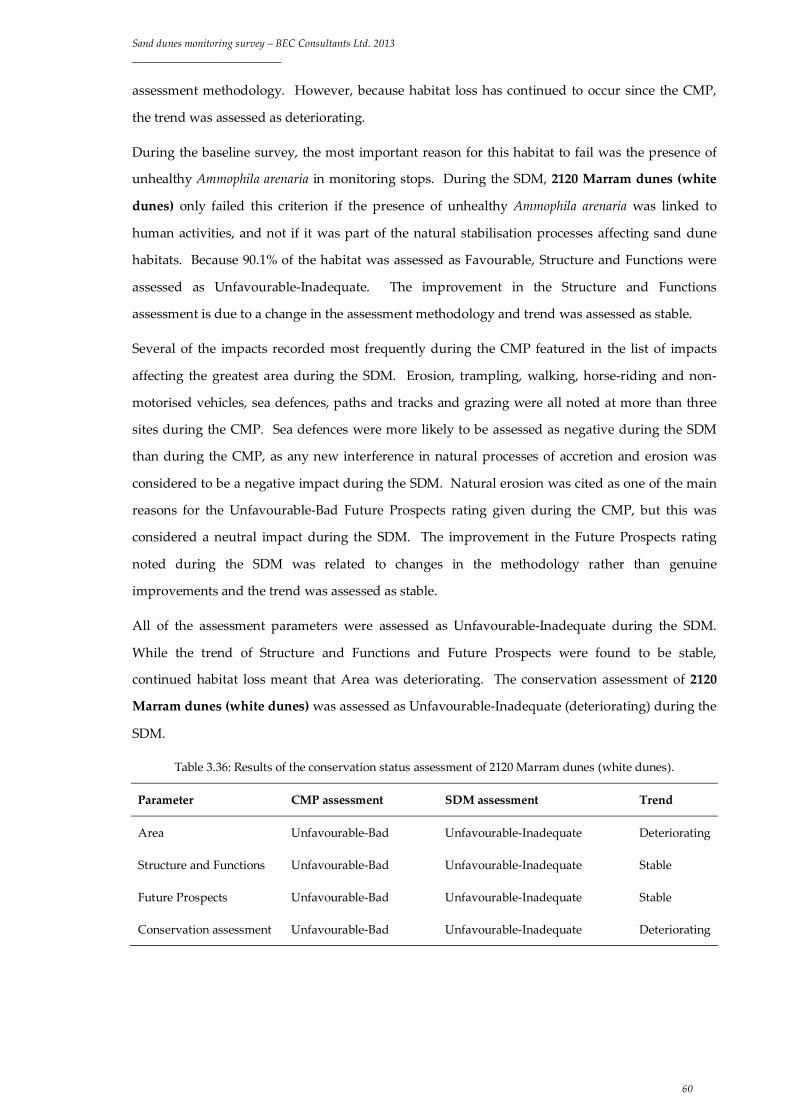
Sand dunes monitoring survey – BEC Consultants Ltd. 2013 ____________________________
60
assessment methodology. However, because habitat loss has continued to occur since the CMP,
the trend was assessed as deteriorating.
During the baseline survey, the most important reason for this habitat to fail was the presence of
unhealthy Ammophila arenaria in monitoring stops. During the SDM, 2120 Marram dunes (white
dunes) only failed this criterion if the presence of unhealthy Ammophila arenaria was linked to
human activities, and not if it was part of the natural stabilisation processes affecting sand dune
habitats. Because 90.1% of the habitat was assessed as Favourable, Structure and Functions were
assessed as Unfavourable-Inadequate. The improvement in the Structure and Functions
assessment is due to a change in the assessment methodology and trend was assessed as stable.
Several of the impacts recorded most frequently during the CMP featured in the list of impacts
affecting the greatest area during the SDM. Erosion, trampling, walking, horse-riding and non-
motorised vehicles, sea defences, paths and tracks and grazing were all noted at more than three
sites during the CMP. Sea defences were more likely to be assessed as negative during the SDM
than during the CMP, as any new interference in natural processes of accretion and erosion was
considered to be a negative impact during the SDM. Natural erosion was cited as one of the main
reasons for the Unfavourable-Bad Future Prospects rating given during the CMP, but this was
considered a neutral impact during the SDM. The improvement in the Future Prospects rating
noted during the SDM was related to changes in the methodology rather than genuine
improvements and the trend was assessed as stable.
All of the assessment parameters were assessed as Unfavourable-Inadequate during the SDM.
While the trend of Structure and Functions and Future Prospects were found to be stable,
continued habitat loss meant that Area was deteriorating. The conservation assessment of 2120
Marram dunes (white dunes) was assessed as Unfavourable-Inadequate (deteriorating) during the
SDM.
Table 3.36: Results of the conservation status assessment of 2120 Marram dunes (white dunes).
Parameter CMP assessment SDM assessment Trend
Area Unfavourable-Bad Unfavourable-Inadequate Deteriorating
Structure and Functions Unfavourable-Bad Unfavourable-Inadequate Stable
Future Prospects Unfavourable-Bad Unfavourable-Inadequate Stable
Conservation assessment Unfavourable-Bad Unfavourable-Inadequate Deteriorating

Sand dunes monitoring survey – BEC Consultants Ltd. 2013 ____________________________
61
3.5 *2130 Fixed dunes (grey dunes)
3.5.1 Area and distribution
The distribution and area of *2130 Fixed dunes (grey dunes) at sites surveyed during the SDM are
shown in Figure 3.5 and Table 3.37. *2130 Fixed dunes (grey dunes) habitat was recorded at 36 sites
and sometimes occupied large areas, for example at site 70 Inch, where the fixed dunes extended to
an area of 390.79 ha.
Table 3.37: Area of *2130 Fixed dunes (grey dunes)
(surveyed and unsurveyed) on the revised CMP
maps and the SDM maps.
Site no.
Site name Revised CMP area (ha)
SDM Area (ha)
2 Baltray 31.75 38.80 3 Mornington 31.88 35.91 9 Portmarnock 9.27 15.34 10 North Bull Island 33.69 40.36 11 South Bull Island 56.70 65.38 17 Brittas Bay 55.55 54.83 18 Mizen Head 45.62 47.10 28 Cahore Point North 81.23 96.90 35 The Raven 26.67 31.78 41 Ballyteige 226.39 225.66 43 Grange 0.57 1.50 46 Tramore 66.04 68.90 58 Inchydoney 19.11 19.06 60 Castlefreke 28.19 28.75 64 Barley Cove 27.66 47.07 68 Rossbehy 98.90 78.08 70 Inch 352.33 390.79 75 Castlegregory 282.93 279.89 77 Banna Strand 138.57 140.51 87 Fanore 61.04 61.56 97 Dogs Bay 45.41 46.09 108 Dooaghtry 66.06 72.89 120 Doo Lough 44.63 46.35 124 Aghleam 292.78 294.42 128 Garter Hill 108.35 119.24 131 Bartragh 119.58 116.44 133 Strandhill 106.52 109.30 147 Maghera 20.96 23.06 148 Sheskinmore 246.27 250.05 155 Kincaslough 81.59 82.11 157 Derrybeg 30.05 30.80 160 Dooey 94.87 97.04 162 Rincleven 276.77 277.96 167 Tranarossan 11.66 13.45 169 Lough Nagreany 8.24 8.72 175 Crummies Bay 11.89 11.95
Figure 3.5: Distribution of SDM sites supporting *2130
Fixed dunes (grey dunes) with the area of the habitat
indicated.

Sand dunes monitoring survey – BEC Consultants Ltd. 2013 ____________________________
62
Areas at two subsites, site 212 Derryness (a subsite of site 148 Sheskinmore) and site 246 Tramore (a
subsite of site 46 Tramore) were included in the areas presented in Table 3.37.
The area of *2130 Fixed dunes (grey dunes) mapped during the baseline survey, the Revised CMP
area and the area mapped during the SDM are shown in Table 3.38. In total, 616.89 ha were
labelled as unsurveyed during the SDM. The largest unsurveyed areas were at sites 70 Inch, 35
The Raven, 64 Barley Cove and 133 Strandhill. At site 64 Barley Cove, the unsurveyed area was
not included on the revised CMP map because it was not clear whether it had been present but not
mapped during the CMP, or whether the habitat had recovered in the interim. The main reasons
for exclusion of parts of the habitat from the surveyed area were access difficulties and land use
(conifer plantations). Unsurveyed areas were not included in the area assessment. Within the area
labelled as unsurveyed in the GIS there is a large area of conifer plantation on a sandy substrate in
site 35 The Raven (178.39 ha). After discussions with NPWS, this was discounted as *2130 Fixed
dunes (grey dunes) as it was too altered to be considered as this habitat now. Therefore this figure
was not used in any analysis of *2130 Fixed dunes (grey dunes).
Table 3.38: Area of *2130 Fixed dunes (grey dunes) within the sample sites as represented on different maps.
Total mapped area
(ha)
Area used in calculation of
change (ha)
CMP area 3296.31 n/a
Revised CMP area 3239.72 2801.22
SDM area 3368.04 2929.54
Within the surveyed area, the total change in area was 128.32 ha (Table 3.39). Increases in area
were recorded at 30 sites, though none appeared to be attributed to deliberate changes in
management or conservation practises. There was also anthropogenic loss of 3 ha.
Table 3.39: Change in area of *2130 Fixed dunes (grey dunes) since the baseline survey.
Area (ha) Area (%)
Increase due to natural processes 131.32 4.7
Loss due to anthropogenic factors 3.00 0.1
Net change in area (increase) 128.32 4.6
The area of *2130 Fixed dunes (grey dunes) has increased by 131.32 ha since the baseline survey.
However, there are eight sites where the habitat has decreased in size due to anthropogenic factors
Sand dunes monitoring survey – BEC Consultants Ltd. 2013 ____________________________
63
(3.00 ha). At site 133 Strandhill, a sea wall has been built into the *2130 Fixed dunes (grey dunes).
Damage associated with agriculture or recreation resulted in loss of habitat at site 17 Brittas Bay,
site 64 Barley Cove, site 75 Castlegregory and 108 Dooaghtry. Erosion is most often considered to
be one of the natural processes affecting sand dune systems. At site 108 Dooaghtry, there is a large
eroding area between the *2130 Fixed dunes (grey dunes) and *21A0 Machairs. However, at this
site, historic dumping and overgrazing have combined with the extreme weather conditions which
affect the west of Ireland and have led to considerable erosion of the fixed dune area (4.09 ha).
Although some erosion was present when the habitat was mapped during the CMP, the area
affected was far lower. Loss in area at this site since the CMP was 1.68 ha. Tourism related
developments such as car parks, holiday homes or caravan parks resulted in loss of habitat at site
28 Cahore Point North, site 68 Rossbehy and site 77 Banna Strand. In total, 0.1% of the habitat has
been lost due to human activity over the last six years. Although this is a low rate of loss, some of
the loss is likely to be permanent and in the absence of management at some sites, losses due to
disturbance are likely to continue.
Area was assessed as Unfavourable-Inadequate during the CMP and, as less than 1% of the habitat
has since been lost, the current assessment is Unfavourable-Inadequate.
3.5.2 Structure and Functions
Structure and Functions of *2130 Fixed dunes (grey dunes) were assessed at 36 sites. Parts of
several sites were excluded from the Structure and Functions assessment because of access
difficulties. In total, 2889.94 ha were included in the Structure and Functions assessment. Table
3.42 shows the Structure and Functions assessments for each site where *2130 Fixed dunes (grey
dunes) habitat was assessed, including the individual criteria assessed. Five sites (14%) were
assessed as Favourable, 21 (58%) were assessed as Unfavourable-Inadequate and 10 (28%) were
assessed as Unfavourable-Bad.
Table 3.40 shows the percentage of sites at which each criterion failed in the Structure and
Functions assessment. The criterion that failed most frequently was damage due to disturbance
(failed at 58.3% of sites), followed by positive indicator species, negative indicator species and
height of vegetation, all of which failed at over 38% of sites.

Sand dunes monitoring survey – BEC Consultants Ltd. 2013 ____________________________
64
Table 3.40: The percentage of sites at which each criterion failed in the Structure and Functions assessment of
*2130 Fixed dunes (grey dunes)
Criterion Failed (% of sites)
Positive indicator species 41.7
Rare species 0.0
Negative indicator species 38.9
Non-native species 11.1
Tree/scrub cover 8.3
Encroachment from adjacent plantations 2.8
Vegetation height 38.9
Vegetation health 5.6
Bare ground 2.8
Alterations to sediment dynamics 11.1
Damage due to disturbance 58.3
The combined area of *2130 Fixed dunes (grey dunes) within the sample sites that was assessed as
Favourable and Unfavourable during the SDM is presented in Table 3.41. Just under three quarters
(74.91%) of the sample area assessed was in Favourable condition, but 25.1% was in Unfavourable
condition. With over 25% of the habitat in Unfavourable condition, would generally be consistent
with an assessment of Unfavourable-Bad. The value is very close to the threshold for an
assessment of Unfavourable-Inadequate, however, and most of the habitat was assessed as being in
Favourable or Unfavourable-Inadequate condition, so Structure and Functions were assessed as
Unfavourable-Inadequate on expert judgement. Structure and Functions were assessed as
Unfavourable-Bad during the CMP.
Table 3.41: The total assessed area and percentage of area of *2130 Fixed dunes (grey dunes) in Favourable
and Unfavourable in 2011/2012.
Area (ha) Area (%)
Favourable 2164.9 74.91
Unfavourable 725.1 25.1

Sand dunes monitoring survey – BEC Consultants Ltd. 2013 ____________________________
65
Table 3.42: Results of the Structure and Functions assessment for *2130 Fixed dunes (grey dunes) showing which of the criteria passed and failed. Target species refers to positive
indicator species. Favourable, Unfavourable-Inadequate and Unfavourable-Bad are abbreviated to F, U-I and U-B respectively.
Site
no.
Target
species
Rare
species
Negative
indicator
species
Non-
native
species
Tree/
shrub
cover
Encroachment
from adjacent
plantations
Vegetation
height
Vegetation
health
Bare
ground
Alterations to
sediment
dynamics
Damage due
to disturbance
Assessment
2 Fail Pass Pass Pass Pass Pass Fail Pass Pass Pass Pass U-I
3 Fail Pass Pass Pass Pass Pass Pass Pass Pass Pass Fail U-I
9 Fail Pass Pass Fail Pass Pass Pass Pass Pass Fail Fail U-B
10 Pass Pass Pass Fail Pass Pass Fail Pass Pass Pass Fail U-B
11 Fail Pass Pass Pass Pass Pass Fail Pass Pass Pass Fail U-B
17 Fail Pass Fail Fail Fail Pass Fail Pass Fail Pass Fail U-B
18 Pass Pass Fail Pass Pass Pass Pass Pass Pass Pass Fail U-I
28 Fail Pass Fail Fail Pass Pass Fail Fail Pass Pass Fail U-B
35 Fail Pass Fail Pass Pass Fail Fail Pass Pass Pass Fail U-B
41 Fail Pass Pass Pass Fail Pass Pass Pass Pass Pass Pass U-I
43 Fail Pass Pass Pass Pass Pass Fail Pass Pass Pass Pass U-I
46 Fail Pass Fail Pass Fail Pass Fail Pass Pass Pass Fail U-B
58 Fail Pass Fail Pass Pass Pass Fail Fail Pass Pass Fail U-B
60 Fail Pass Fail Pass Pass Pass Pass Pass Pass Pass Pass U-I
64 Pass Pass Fail Pass Pass Pass Pass Pass Pass Pass Pass U-I
68 Pass Pass Pass Pass Pass Pass Pass Pass Pass Pass Fail U-I
70 Pass Pass Pass Pass Pass Pass Pass Pass Pass Pass Pass F
75 Fail Pass Fail Pass Pass Pass Pass Pass Pass Fail Fail U-B
77 Fail Pass Pass Pass Pass Pass Pass Pass Pass Pass Fail U-I

Sand dunes monitoring survey – BEC Consultants Ltd. 2013 ____________________________
66
Table 3.42 (cont.)
Site
no.
Target
species
Rare
species
Negative
indicator
species
Non-
native
species
Tree/
shrub
cover
Encroachment
from adjacent
plantations
Vegetation
height
Vegetation
health
Bare
ground
Alterations to
sediment
dynamics
Damage due
to disturbance
Assessment
87 Pass Pass Pass Pass Pass Pass Pass Pass Pass Pass Fail U-I
97 Pass Pass Pass Pass Pass Pass Fail Pass Pass Fail Pass U-I
108 Pass Pass Pass Pass Pass Pass Fail Pass Pass Pass Pass U-I
120 Pass Pass Pass Pass Pass Pass Pass Pass Pass Pass Pass F
124 Pass Pass Fail Pass Pass Pass Pass Pass Pass Pass Fail U-I
128 Pass Pass Pass Pass Pass Pass Pass Pass Pass Pass Pass F
131 Pass Pass Pass Pass Pass Pass Pass Pass Pass Pass Pass F
133 Fail Pass Pass Pass Pass Pass Pass Pass Pass Fail Fail U-B
147 Pass Pass Fail Pass Pass Pass Pass Pass Pass Pass Pass U-I
148 Pass Pass Fail Pass Pass Pass Pass Pass Pass Pass Pass U-I
155 Pass Pass Pass Pass Pass Pass Fail Pass Pass Fail Pass U-I
157 Pass Pass Fail Pass Pass Pass Pass Pass Pass Pass Fail U-I
160 Pass Pass Pass Pass Pass Pass Pass Pass Pass Pass Fail U-I
162 Pass Pass Pass Pass Pass Pass Pass Pass Pass Pass Fail U-I
167 Pass Pass Pass Pass Pass Pass Pass Pass Pass Pass Pass F
169 Pass Pass Fail Pass Pass Pass Fail Pass Pass Pass Pass U-I
175 Pass Pass Pass Pass Fail Pass Fail Pass Pass Pass Pass U-I

Sand dunes monitoring survey – BEC Consultants Ltd. 2013 ____________________________
67
3.5.3 Future Prospects
Positive impacts were recorded at 24 sites, neutral impacts were recorded at 36 sites and negative
impacts were recorded at 35 sites. The median impact score for *2130 Fixed dunes (grey dunes) at
sites was -5.9 and the lowest score of any site was -18.
Non-intensive grazing by cattle, horses and sheep had a positive impact on 42.9% of the *2130 Fixed
dunes (grey dunes) area (Table 3.43). Hunting was recorded as a positive impact at two sites, and this refers to
shooting of rabbits at overgrazed or rabbit-damaged sites. Rabbit grazing and burrowing was also recorded as a
positive impact at five sites.
Table 3.43: The five positive impacts affecting the greatest area of *2130 Fixed dunes (grey dunes), the percentage
of sites (where the habitat occurs) which were affected, the degree of impact and the area of the habitat affected.
Impact code
Impact description Percentage of sites affected: Area affected
(ha)
Area affected (% of total
sample area) Low
intensity Medium intensity
High intensity
Total
A04.02.01 Non intensive cattle
grazing 8.1 8.1 0.0 16.2 908.21 27.0
A04.02.02 Non intensive sheep
grazing 8.1 10.8 0.0 18.9 285.97 8.5
A04.02.03 Non intensive horse
grazing 8.1 8.1 0.0 16.2 250.17 7.4
F03.01 Hunting 5.4 0.0 0.0 5.4 138.34 4.1
K04.05 Damage by herbivores
(including game
species)
5.4 8.1 0.0 13.5 96.76 2.9
Widespread neutral impacts include walking and horse-riding, non-intensive grazing, undergrazing
and erosion (Table 3.44). Undergrazing is considered neutral where it is limited in extent as it
contributes to the structural diversity of the habitat while also resulting in small areas of species poor
habitat.
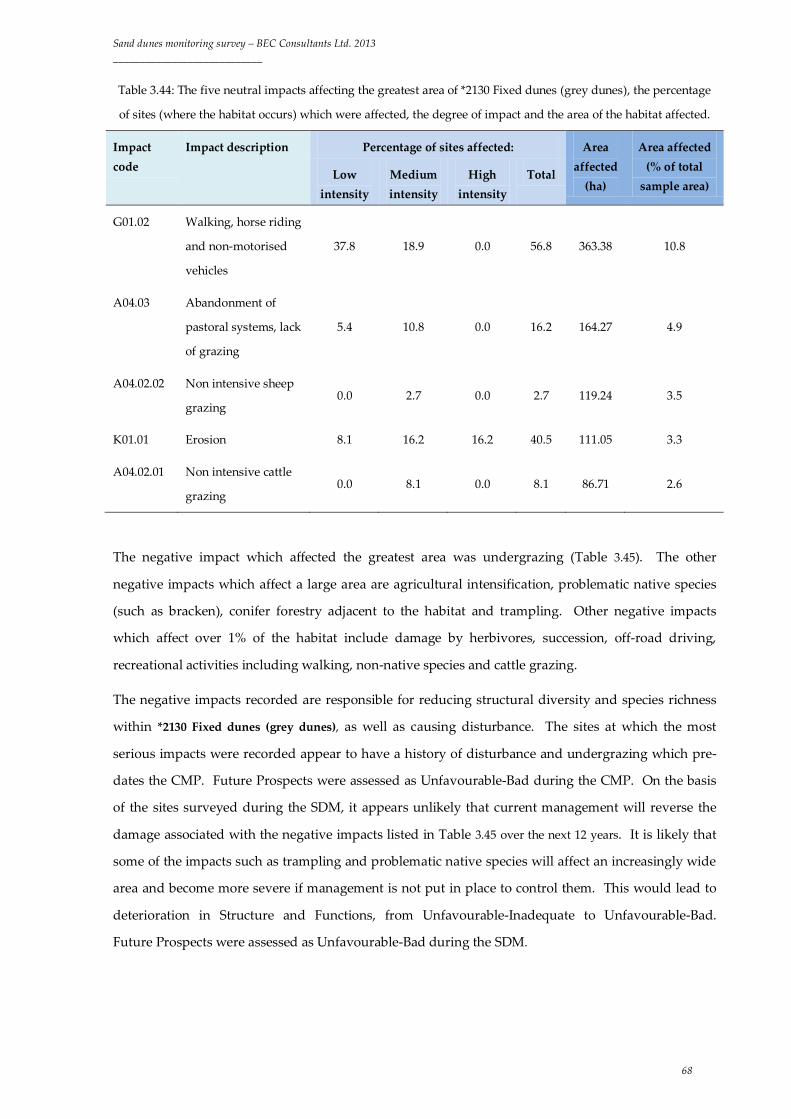
Sand dunes monitoring survey – BEC Consultants Ltd. 2013 ____________________________
68
Table 3.44: The five neutral impacts affecting the greatest area of *2130 Fixed dunes (grey dunes), the percentage
of sites (where the habitat occurs) which were affected, the degree of impact and the area of the habitat affected.
Impact code
Impact description Percentage of sites affected: Area affected
(ha)
Area affected (% of total
sample area) Low
intensity Medium intensity
High intensity
Total
G01.02 Walking, horse riding
and non-motorised
vehicles
37.8 18.9 0.0 56.8 363.38 10.8
A04.03 Abandonment of
pastoral systems, lack
of grazing
5.4 10.8 0.0 16.2 164.27 4.9
A04.02.02 Non intensive sheep
grazing 0.0 2.7 0.0 2.7 119.24 3.5
K01.01 Erosion 8.1 16.2 16.2 40.5 111.05 3.3
A04.02.01 Non intensive cattle
grazing 0.0 8.1 0.0 8.1 86.71 2.6
The negative impact which affected the greatest area was undergrazing (Table 3.45). The other
negative impacts which affect a large area are agricultural intensification, problematic native species
(such as bracken), conifer forestry adjacent to the habitat and trampling. Other negative impacts
which affect over 1% of the habitat include damage by herbivores, succession, off-road driving,
recreational activities including walking, non-native species and cattle grazing.
The negative impacts recorded are responsible for reducing structural diversity and species richness
within *2130 Fixed dunes (grey dunes), as well as causing disturbance. The sites at which the most
serious impacts were recorded appear to have a history of disturbance and undergrazing which pre-
dates the CMP. Future Prospects were assessed as Unfavourable-Bad during the CMP. On the basis
of the sites surveyed during the SDM, it appears unlikely that current management will reverse the
damage associated with the negative impacts listed in Table 3.45 over the next 12 years. It is likely that
some of the impacts such as trampling and problematic native species will affect an increasingly wide
area and become more severe if management is not put in place to control them. This would lead to
deterioration in Structure and Functions, from Unfavourable-Inadequate to Unfavourable-Bad.
Future Prospects were assessed as Unfavourable-Bad during the SDM.
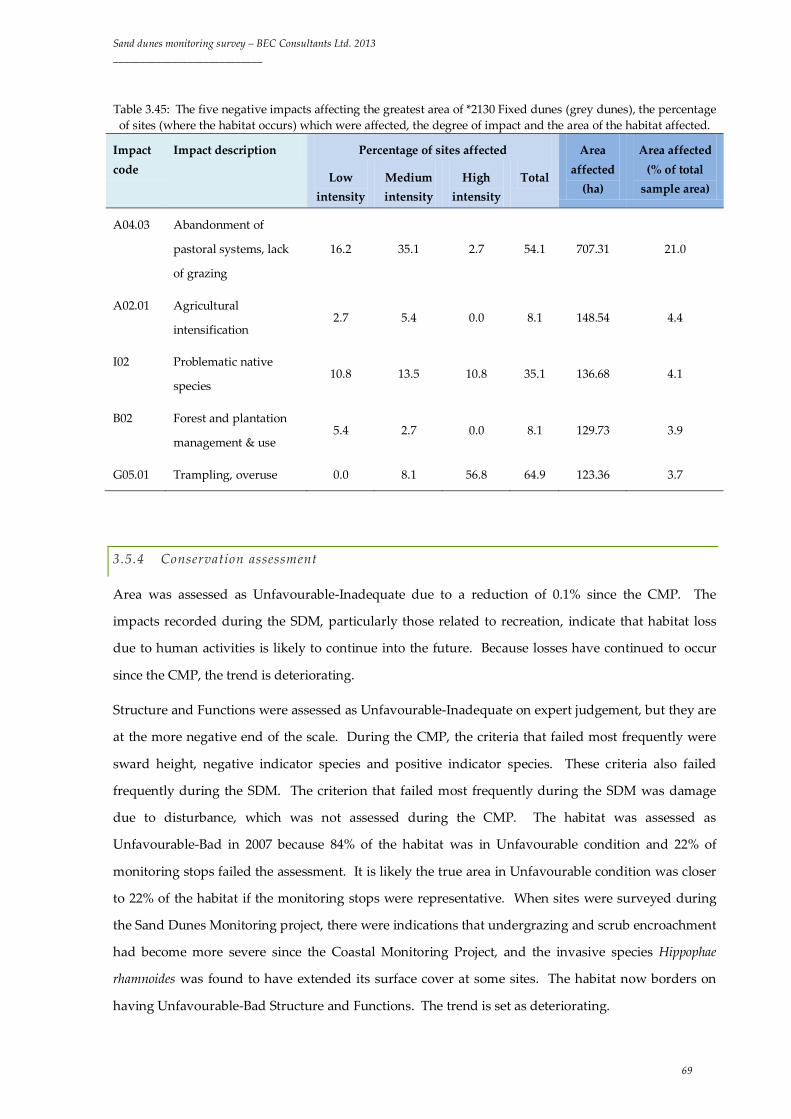
Sand dunes monitoring survey – BEC Consultants Ltd. 2013 ____________________________
69
Table 3.45: The five negative impacts affecting the greatest area of *2130 Fixed dunes (grey dunes), the percentage of sites (where the habitat occurs) which were affected, the degree of impact and the area of the habitat affected.
Impact code
Impact description Percentage of sites affected Area affected
(ha)
Area affected (% of total
sample area) Low
intensity Medium intensity
High intensity
Total
A04.03 Abandonment of
pastoral systems, lack
of grazing
16.2 35.1 2.7 54.1 707.31 21.0
A02.01 Agricultural
intensification 2.7 5.4 0.0 8.1 148.54 4.4
I02 Problematic native
species 10.8 13.5 10.8 35.1 136.68 4.1
B02 Forest and plantation
management & use 5.4 2.7 0.0 8.1 129.73 3.9
G05.01 Trampling, overuse 0.0 8.1 56.8 64.9 123.36 3.7
3.5.4 Conservation assessment
Area was assessed as Unfavourable-Inadequate due to a reduction of 0.1% since the CMP. The
impacts recorded during the SDM, particularly those related to recreation, indicate that habitat loss
due to human activities is likely to continue into the future. Because losses have continued to occur
since the CMP, the trend is deteriorating.
Structure and Functions were assessed as Unfavourable-Inadequate on expert judgement, but they are
at the more negative end of the scale. During the CMP, the criteria that failed most frequently were
sward height, negative indicator species and positive indicator species. These criteria also failed
frequently during the SDM. The criterion that failed most frequently during the SDM was damage
due to disturbance, which was not assessed during the CMP. The habitat was assessed as
Unfavourable-Bad in 2007 because 84% of the habitat was in Unfavourable condition and 22% of
monitoring stops failed the assessment. It is likely the true area in Unfavourable condition was closer
to 22% of the habitat if the monitoring stops were representative. When sites were surveyed during
the Sand Dunes Monitoring project, there were indications that undergrazing and scrub encroachment
had become more severe since the Coastal Monitoring Project, and the invasive species Hippophae
rhamnoides was found to have extended its surface cover at some sites. The habitat now borders on
having Unfavourable-Bad Structure and Functions. The trend is set as deteriorating.
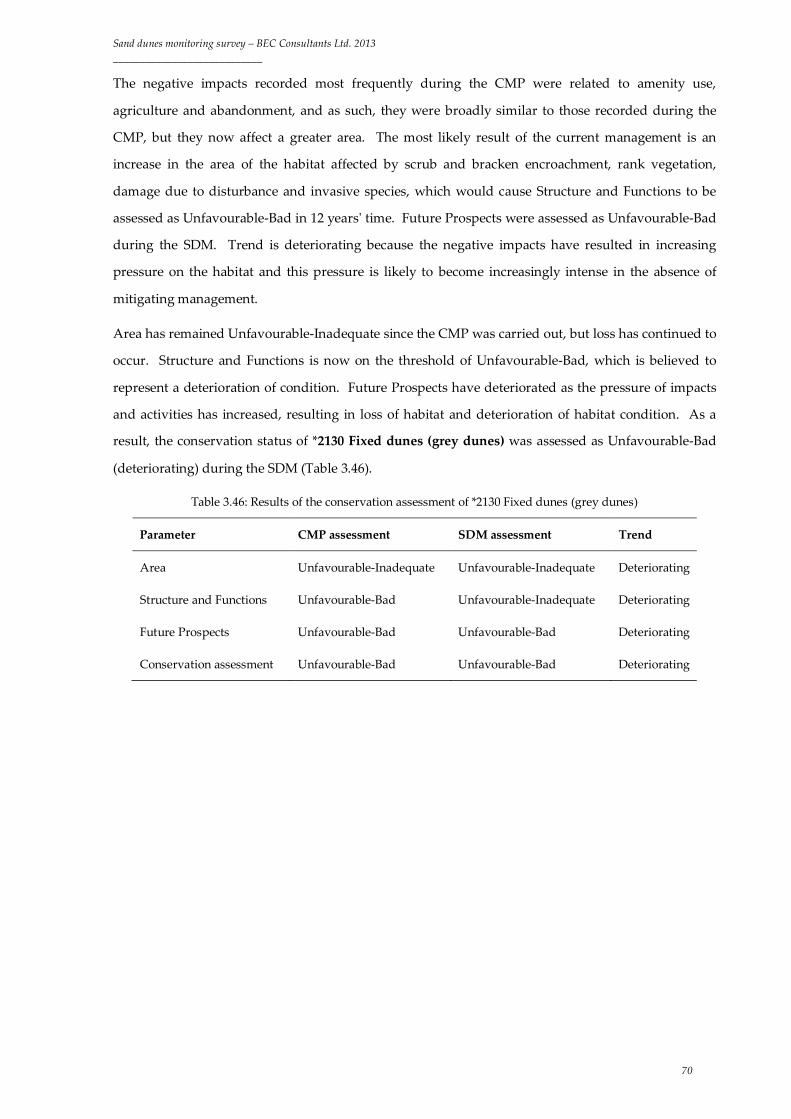
Sand dunes monitoring survey – BEC Consultants Ltd. 2013 ____________________________
70
The negative impacts recorded most frequently during the CMP were related to amenity use,
agriculture and abandonment, and as such, they were broadly similar to those recorded during the
CMP, but they now affect a greater area. The most likely result of the current management is an
increase in the area of the habitat affected by scrub and bracken encroachment, rank vegetation,
damage due to disturbance and invasive species, which would cause Structure and Functions to be
assessed as Unfavourable-Bad in 12 years' time. Future Prospects were assessed as Unfavourable-Bad
during the SDM. Trend is deteriorating because the negative impacts have resulted in increasing
pressure on the habitat and this pressure is likely to become increasingly intense in the absence of
mitigating management.
Area has remained Unfavourable-Inadequate since the CMP was carried out, but loss has continued to
occur. Structure and Functions is now on the threshold of Unfavourable-Bad, which is believed to
represent a deterioration of condition. Future Prospects have deteriorated as the pressure of impacts
and activities has increased, resulting in loss of habitat and deterioration of habitat condition. As a
result, the conservation status of *2130 Fixed dunes (grey dunes) was assessed as Unfavourable-Bad
(deteriorating) during the SDM (Table 3.46).
Table 3.46: Results of the conservation assessment of *2130 Fixed dunes (grey dunes)
Parameter CMP assessment SDM assessment Trend
Area Unfavourable-Inadequate Unfavourable-Inadequate Deteriorating
Structure and Functions Unfavourable-Bad Unfavourable-Inadequate Deteriorating
Future Prospects Unfavourable-Bad Unfavourable-Bad Deteriorating
Conservation assessment Unfavourable-Bad Unfavourable-Bad Deteriorating

Sand dunes monitoring survey – BEC Consultants Ltd. 2013 ____________________________
71
3.6 *2140 Decalcified Empetrum Dunes
3.6.1 Area and distribution
This is a very scarce habitat in Ireland. *2140 Decalcified Empetrum dunes were found at only one
site during the SDM: 148 Sheskinmore, but it was below the minimum mapping area (Figure 3.6).
This represents a decrease since the CMP, when it was found at three sites (Table 3.47).
Table 3.47: Area of *2140 Decalcified Empetrum dunes
(surveyed and unsurveyed) on the revised CMP maps
and the SDM maps.
The baseline area was revised (Table 3.48) because part of the area included in the baseline survey
consisted of heath growing on shallow base-rich or neutral sand over siliceous rock, and this was not
considered to conform to *2140 Decalcified Empetrum dunes during the SDM. During the CMP,
*2140 Decalcified Empetrum dunes habitat was recorded at site 147 Maghera. Although dune heath
is still found at that site, only one Empetrum nigrum plant was found during the SDM, so the area was
mapped as *2150 Decalcified dune heath.
Site no.
Site name Revised CMP area (ha)
SDM Area (ha)
147 Maghera 0.47 0.0
148 Sheskinmore 0.63 <0.04
175 Crummies Bay 0.02 0.0
Figure 3.6: Location of site 148, Sheskinmore,
where *2140 Decalcified Empetrum dunes were
found during the SDM with the area of the habitat
indicated.
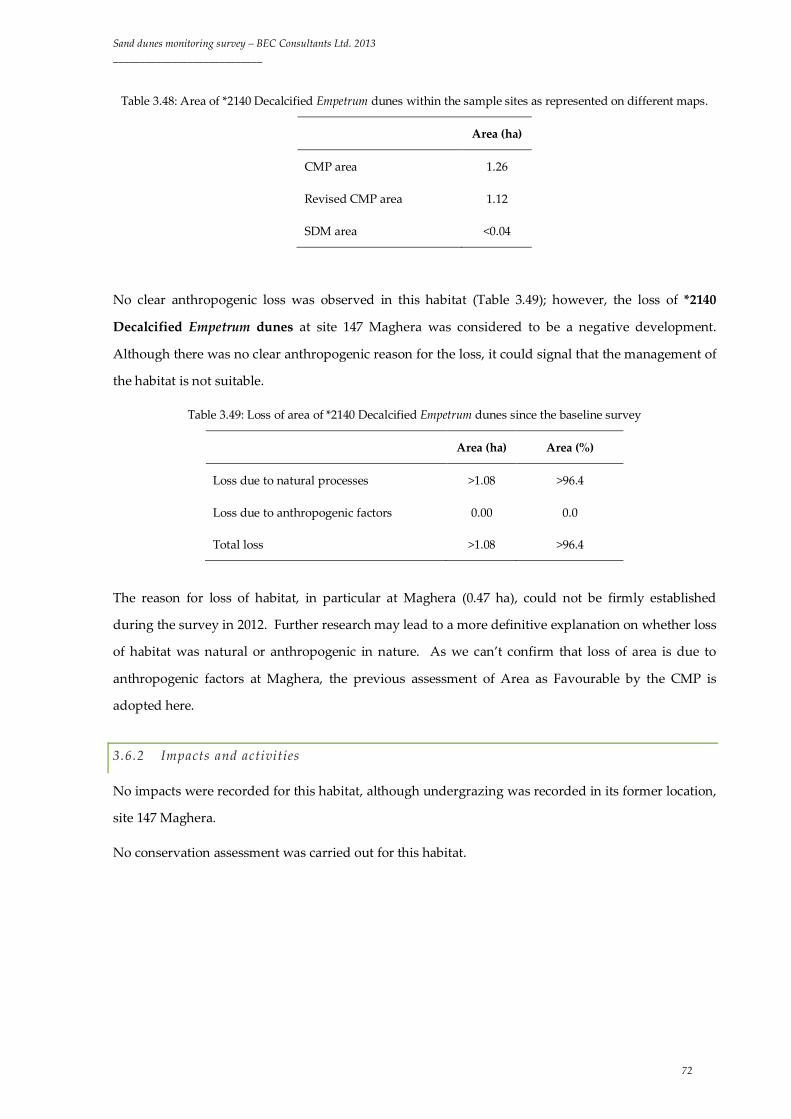
Sand dunes monitoring survey – BEC Consultants Ltd. 2013 ____________________________
72
Table 3.48: Area of *2140 Decalcified Empetrum dunes within the sample sites as represented on different maps.
Area (ha)
CMP area 1.26
Revised CMP area 1.12
SDM area <0.04
No clear anthropogenic loss was observed in this habitat (Table 3.49); however, the loss of *2140
Decalcified Empetrum dunes at site 147 Maghera was considered to be a negative development.
Although there was no clear anthropogenic reason for the loss, it could signal that the management of
the habitat is not suitable.
Table 3.49: Loss of area of *2140 Decalcified Empetrum dunes since the baseline survey
Area (ha) Area (%)
Loss due to natural processes >1.08 >96.4
Loss due to anthropogenic factors 0.00 0.0
Total loss >1.08 >96.4
The reason for loss of habitat, in particular at Maghera (0.47 ha), could not be firmly established
during the survey in 2012. Further research may lead to a more definitive explanation on whether loss
of habitat was natural or anthropogenic in nature. As we can’t confirm that loss of area is due to
anthropogenic factors at Maghera, the previous assessment of Area as Favourable by the CMP is
adopted here.
3.6.2 Impacts and activities
No impacts were recorded for this habitat, although undergrazing was recorded in its former location,
site 147 Maghera.
No conservation assessment was carried out for this habitat.
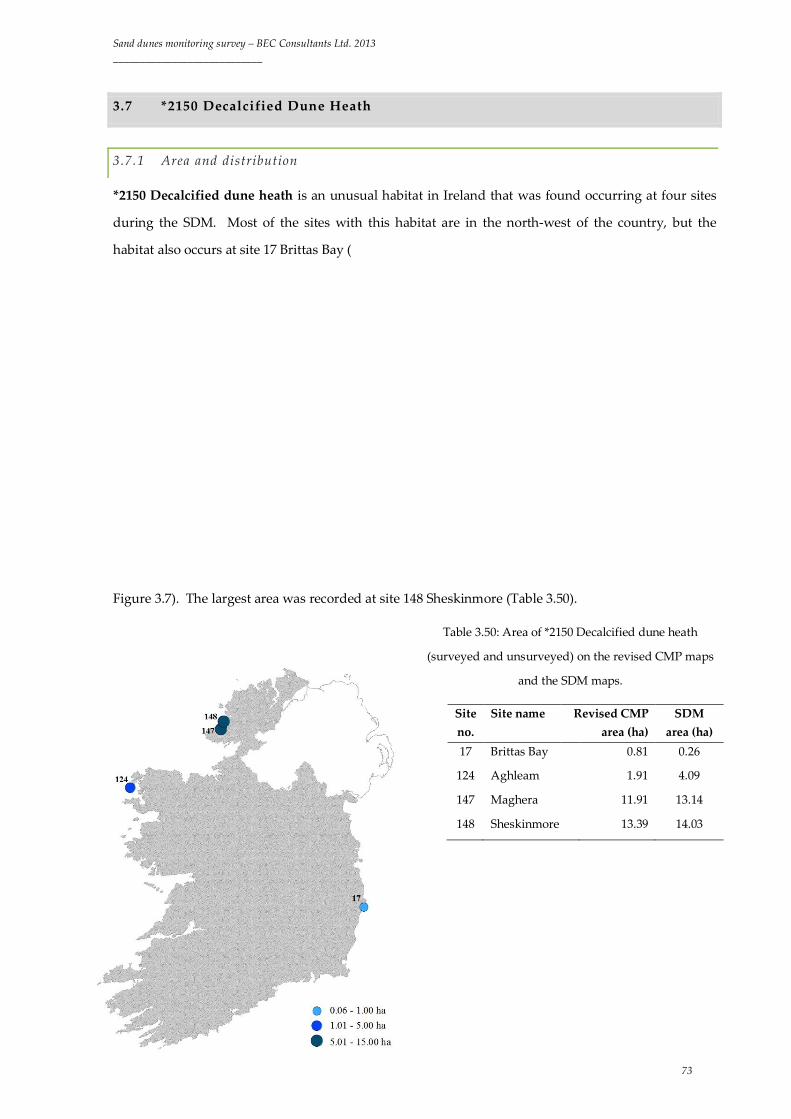
Sand dunes monitoring survey – BEC Consultants Ltd. 2013 ____________________________
73
3.7 *2150 Decalcified Dune Heath
3.7.1 Area and distribution
*2150 Decalcified dune heath is an unusual habitat in Ireland that was found occurring at four sites
during the SDM. Most of the sites with this habitat are in the north-west of the country, but the
habitat also occurs at site 17 Brittas Bay (
Figure 3.7). The largest area was recorded at site 148 Sheskinmore (Table 3.50).
Table 3.50: Area of *2150 Decalcified dune heath
(surveyed and unsurveyed) on the revised CMP maps
and the SDM maps.
Site no.
Site name Revised CMP area (ha)
SDM area (ha)
17 Brittas Bay 0.81 0.26
124 Aghleam 1.91 4.09
147 Maghera 11.91 13.14
148 Sheskinmore 13.39 14.03
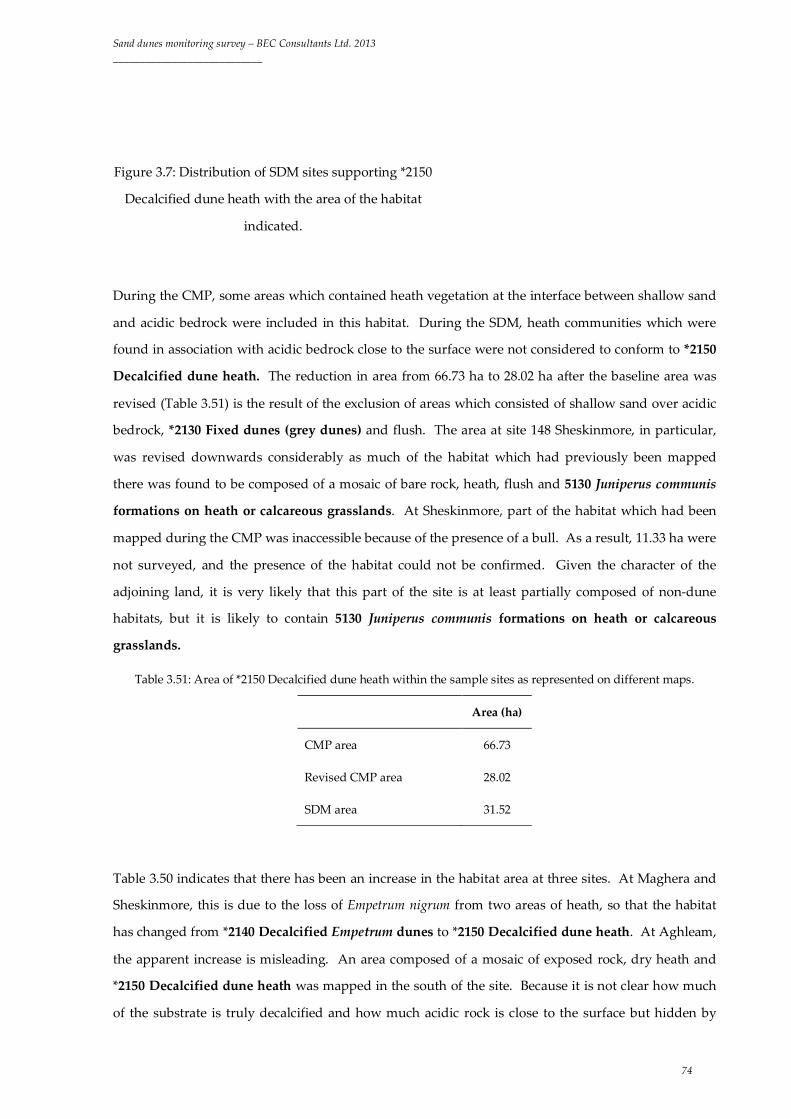
Sand dunes monitoring survey – BEC Consultants Ltd. 2013 ____________________________
74
Figure 3.7: Distribution of SDM sites supporting *2150
Decalcified dune heath with the area of the habitat
indicated.
During the CMP, some areas which contained heath vegetation at the interface between shallow sand
and acidic bedrock were included in this habitat. During the SDM, heath communities which were
found in association with acidic bedrock close to the surface were not considered to conform to *2150
Decalcified dune heath. The reduction in area from 66.73 ha to 28.02 ha after the baseline area was
revised (Table 3.51) is the result of the exclusion of areas which consisted of shallow sand over acidic
bedrock, *2130 Fixed dunes (grey dunes) and flush. The area at site 148 Sheskinmore, in particular,
was revised downwards considerably as much of the habitat which had previously been mapped
there was found to be composed of a mosaic of bare rock, heath, flush and 5130 Juniperus communis
formations on heath or calcareous grasslands. At Sheskinmore, part of the habitat which had been
mapped during the CMP was inaccessible because of the presence of a bull. As a result, 11.33 ha were
not surveyed, and the presence of the habitat could not be confirmed. Given the character of the
adjoining land, it is very likely that this part of the site is at least partially composed of non-dune
habitats, but it is likely to contain 5130 Juniperus communis formations on heath or calcareous
grasslands.
Table 3.51: Area of *2150 Decalcified dune heath within the sample sites as represented on different maps.
Area (ha)
CMP area 66.73
Revised CMP area 28.02
SDM area 31.52
Table 3.50 indicates that there has been an increase in the habitat area at three sites. At Maghera and
Sheskinmore, this is due to the loss of Empetrum nigrum from two areas of heath, so that the habitat
has changed from *2140 Decalcified Empetrum dunes to *2150 Decalcified dune heath. At Aghleam,
the apparent increase is misleading. An area composed of a mosaic of exposed rock, dry heath and
*2150 Decalcified dune heath was mapped in the south of the site. Because it is not clear how much
of the substrate is truly decalcified and how much acidic rock is close to the surface but hidden by

Sand dunes monitoring survey – BEC Consultants Ltd. 2013 ____________________________
75
overlying sand and vegetation, it was not possible to ascribe a percentage of the habitat which is
occupied by true *2150 Decalcified dune heath within the mosaic. Mosaic habitats cannot be
recorded on the revised CMP map, so the area with the most bare rock was labelled as dry heath while
the area with the greatest cover of vegetation was labelled as *2150 Decalcified dune heath. It is
considered unlikely that there has been a significant change in the area of the habitat at this site.
Undergrazing and bracken encroachment have resulted in the loss of 0.68 ha of *2150 Decalcified
dune heath from site 17 Brittas Bay, and this is considered to be anthropogenic loss. There was
however, also a slight increase in area of this habitat at this site. The anthropogenic loss of area is less
than 1% per year (Table 3.52). Area was assessed as Unfavourable-Inadequate.

Sand dunes monitoring survey – BEC Consultants Ltd. 2013 ____________________________
76
Table 3.52: Change in area of *2150 Decalcified dune heath since the baseline survey
Area (ha) Area (%)
Increase in area 2.82 10.1
Loss due to anthropogenic factors 0.68 2.4
Net change in area (increase) 3.50 12.5
3.7.2 Impacts and activities
Negative impacts were noted at two sites, neutral impacts were noted at two sites and positive
impacts were recorded at one site. At a single site, no impacts were noted. The median impact score
was -1.5 and the most negative impact score at any site was -6. The positive, neutral and negative
impacts recorded for *2150 Decalcified dune heath are shown in Table 3.53, Table 3.54 and Table 3.55.
Non-intensive sheep grazing was noted as a positive impact at site 147 Maghera.
Table 3.53: The positive impacts affecting *2150 Decalcified dune heath, the percentage of sites (where the habitat
occurs) which were affected, the degree of impact and the area of the habitat affected.
Impact code
Impact description Percentage of sites affected: Area affected
(ha)
Area affected (% of total
sample area) Low
intensity Medium intensity
High intensity
Total
A04.02.02
Non-intensive sheep
grazing 25.0 0.0 0.0 25.0 13.14 41.7
Non-intensive cattle grazing, walking and horse riding, and rabbit activity were noted as neutral
impacts. Although rabbits damage the substrate by burrowing, light grazing can reduce the rate of
succession towards scrub.
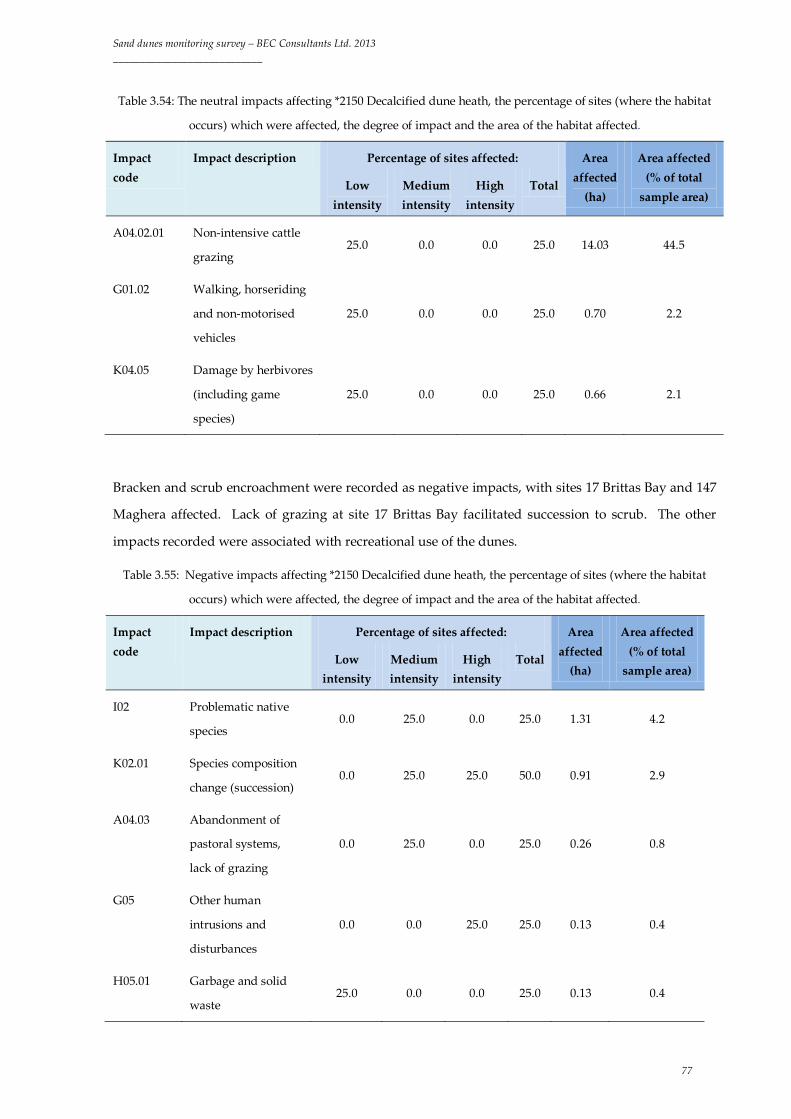
Sand dunes monitoring survey – BEC Consultants Ltd. 2013 ____________________________
77
Table 3.54: The neutral impacts affecting *2150 Decalcified dune heath, the percentage of sites (where the habitat
occurs) which were affected, the degree of impact and the area of the habitat affected.
Impact code
Impact description Percentage of sites affected: Area affected
(ha)
Area affected (% of total
sample area) Low
intensity Medium intensity
High intensity
Total
A04.02.01 Non-intensive cattle
grazing 25.0 0.0 0.0 25.0 14.03 44.5
G01.02 Walking, horseriding
and non-motorised
vehicles
25.0 0.0 0.0 25.0 0.70 2.2
K04.05 Damage by herbivores
(including game
species)
25.0 0.0 0.0 25.0 0.66 2.1
Bracken and scrub encroachment were recorded as negative impacts, with sites 17 Brittas Bay and 147
Maghera affected. Lack of grazing at site 17 Brittas Bay facilitated succession to scrub. The other
impacts recorded were associated with recreational use of the dunes.
Table 3.55: Negative impacts affecting *2150 Decalcified dune heath, the percentage of sites (where the habitat
occurs) which were affected, the degree of impact and the area of the habitat affected.
Impact code
Impact description Percentage of sites affected: Area affected
(ha)
Area affected (% of total
sample area) Low
intensity Medium intensity
High intensity
Total
I02 Problematic native
species 0.0 25.0 0.0 25.0 1.31 4.2
K02.01 Species composition
change (succession) 0.0 25.0 25.0 50.0 0.91 2.9
A04.03 Abandonment of
pastoral systems,
lack of grazing
0.0 25.0 0.0 25.0 0.26 0.8
G05 Other human
intrusions and
disturbances
0.0 0.0 25.0 25.0 0.13 0.4
H05.01 Garbage and solid
waste 25.0 0.0 0.0 25.0 0.13 0.4

Sand dunes monitoring survey – BEC Consultants Ltd. 2013 ____________________________
78
The impacts noted during the SDM were primarily related to agriculture and recreation. Most of the
impacts listed in the CMP report relate to agriculture, but recreation is cited as a threat. Bracken
encroachment was recorded in this habitat during the CMP, and this remains a problem.
No conservation assessment was carried out for this habitat.
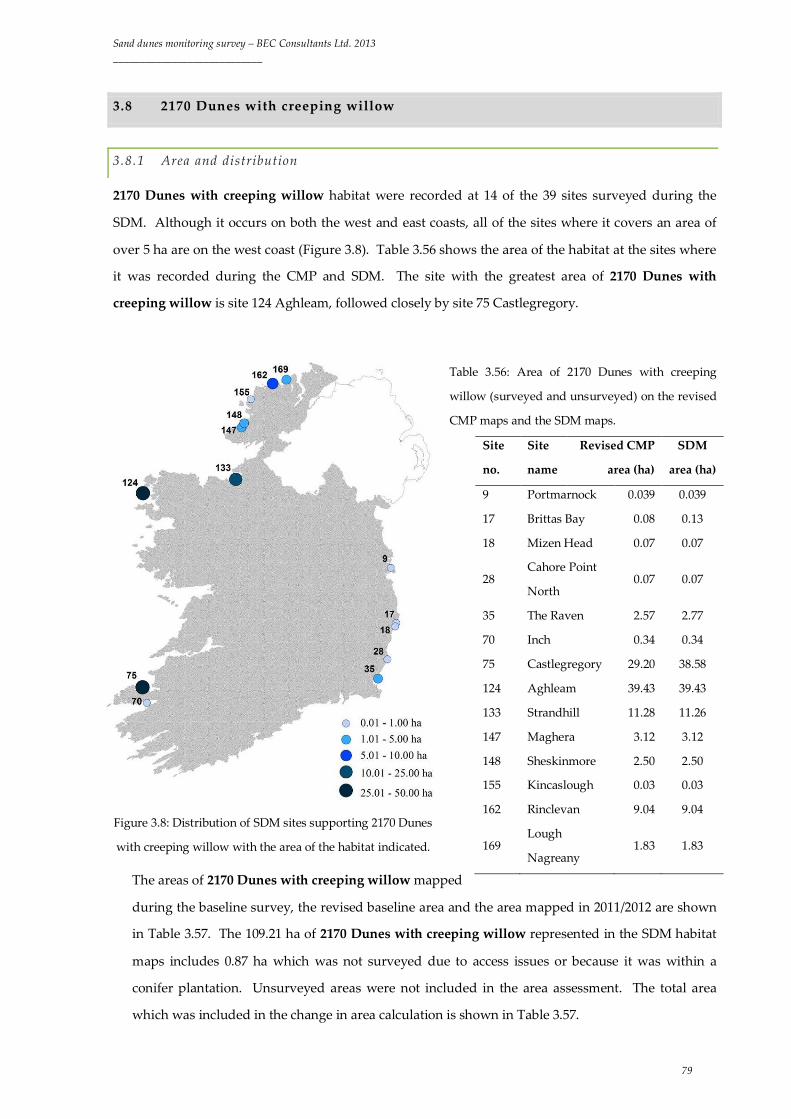
Sand dunes monitoring survey – BEC Consultants Ltd. 2013 ____________________________
79
3.8 2170 Dunes with creeping willow
3.8.1 Area and distribution
2170 Dunes with creeping willow habitat were recorded at 14 of the 39 sites surveyed during the
SDM. Although it occurs on both the west and east coasts, all of the sites where it covers an area of
over 5 ha are on the west coast (Figure 3.8). Table 3.56 shows the area of the habitat at the sites where
it was recorded during the CMP and SDM. The site with the greatest area of 2170 Dunes with
creeping willow is site 124 Aghleam, followed closely by site 75 Castlegregory.
Table 3.56: Area of 2170 Dunes with creeping
willow (surveyed and unsurveyed) on the revised
CMP maps and the SDM maps.
Figure 3.8: Distribution of SDM sites supporting 2170 Dunes
with creeping willow with the area of the habitat indicated.
The areas of 2170 Dunes with creeping willow mapped
during the baseline survey, the revised baseline area and the area mapped in 2011/2012 are shown
in Table 3.57. The 109.21 ha of 2170 Dunes with creeping willow represented in the SDM habitat
maps includes 0.87 ha which was not surveyed due to access issues or because it was within a
conifer plantation. Unsurveyed areas were not included in the area assessment. The total area
which was included in the change in area calculation is shown in Table 3.57.
Site
no.
Site
name
Revised CMP
area (ha)
SDM
area (ha)
9 Portmarnock 0.039 0.039
17 Brittas Bay 0.08 0.13
18 Mizen Head 0.07 0.07
28 Cahore Point
North 0.07 0.07
35 The Raven 2.57 2.77
70 Inch 0.34 0.34
75 Castlegregory 29.20 38.58
124 Aghleam 39.43 39.43
133 Strandhill 11.28 11.26
147 Maghera 3.12 3.12
148 Sheskinmore 2.50 2.50
155 Kincaslough 0.03 0.03
162 Rinclevan 9.04 9.04
169 Lough
Nagreany 1.83 1.83
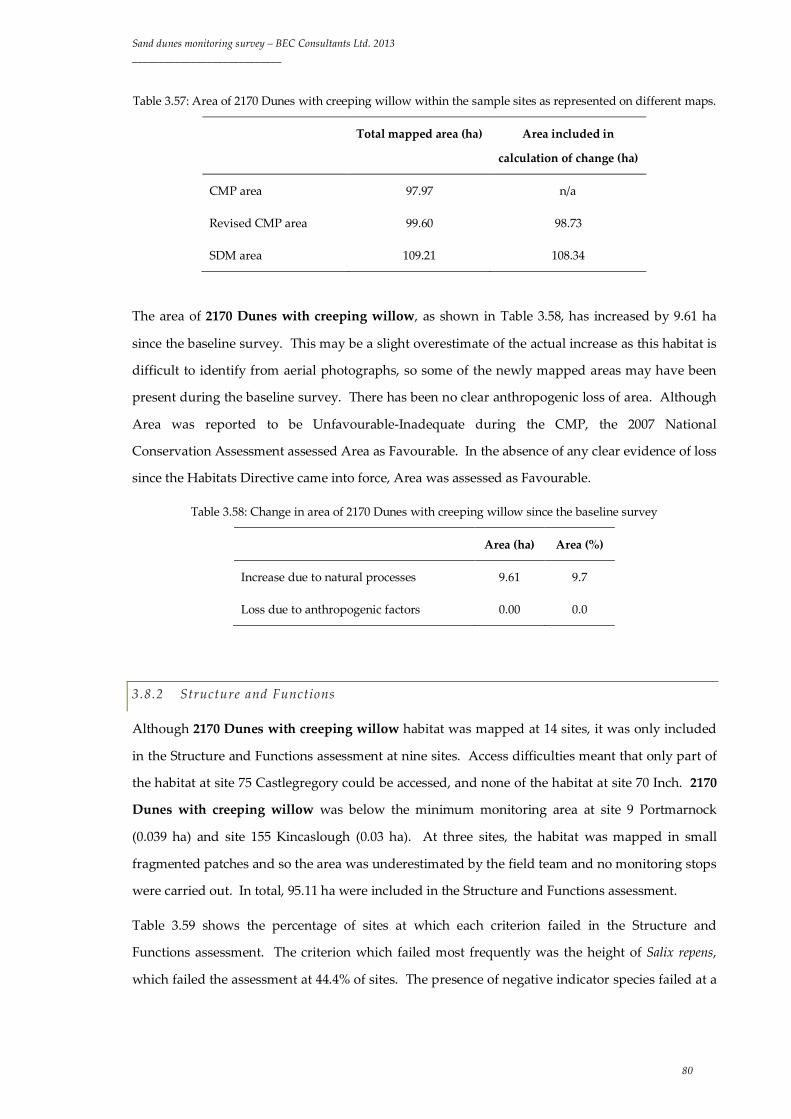
Sand dunes monitoring survey – BEC Consultants Ltd. 2013 ____________________________
80
Table 3.57: Area of 2170 Dunes with creeping willow within the sample sites as represented on different maps.
Total mapped area (ha) Area included in
calculation of change (ha)
CMP area 97.97 n/a
Revised CMP area 99.60 98.73
SDM area 109.21 108.34
The area of 2170 Dunes with creeping willow, as shown in Table 3.58, has increased by 9.61 ha
since the baseline survey. This may be a slight overestimate of the actual increase as this habitat is
difficult to identify from aerial photographs, so some of the newly mapped areas may have been
present during the baseline survey. There has been no clear anthropogenic loss of area. Although
Area was reported to be Unfavourable-Inadequate during the CMP, the 2007 National
Conservation Assessment assessed Area as Favourable. In the absence of any clear evidence of loss
since the Habitats Directive came into force, Area was assessed as Favourable.
Table 3.58: Change in area of 2170 Dunes with creeping willow since the baseline survey
Area (ha) Area (%)
Increase due to natural processes 9.61 9.7
Loss due to anthropogenic factors 0.00 0.0
3.8.2 Structure and Functions
Although 2170 Dunes with creeping willow habitat was mapped at 14 sites, it was only included
in the Structure and Functions assessment at nine sites. Access difficulties meant that only part of
the habitat at site 75 Castlegregory could be accessed, and none of the habitat at site 70 Inch. 2170
Dunes with creeping willow was below the minimum monitoring area at site 9 Portmarnock
(0.039 ha) and site 155 Kincaslough (0.03 ha). At three sites, the habitat was mapped in small
fragmented patches and so the area was underestimated by the field team and no monitoring stops
were carried out. In total, 95.11 ha were included in the Structure and Functions assessment.
Table 3.59 shows the percentage of sites at which each criterion failed in the Structure and
Functions assessment. The criterion which failed most frequently was the height of Salix repens,
which failed the assessment at 44.4% of sites. The presence of negative indicator species failed at a
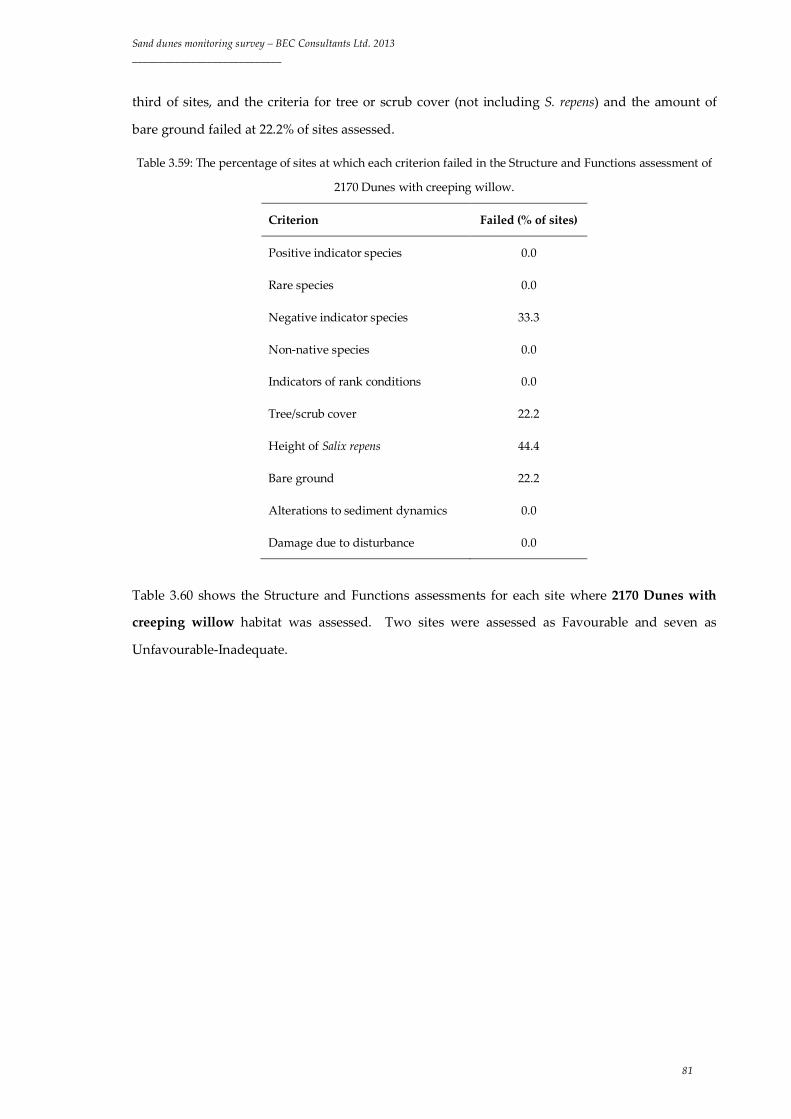
Sand dunes monitoring survey – BEC Consultants Ltd. 2013 ____________________________
81
third of sites, and the criteria for tree or scrub cover (not including S. repens) and the amount of
bare ground failed at 22.2% of sites assessed.
Table 3.59: The percentage of sites at which each criterion failed in the Structure and Functions assessment of
2170 Dunes with creeping willow.
Criterion Failed (% of sites)
Positive indicator species 0.0
Rare species 0.0
Negative indicator species 33.3
Non-native species 0.0
Indicators of rank conditions 0.0
Tree/scrub cover 22.2
Height of Salix repens 44.4
Bare ground 22.2
Alterations to sediment dynamics 0.0
Damage due to disturbance 0.0
Table 3.60 shows the Structure and Functions assessments for each site where 2170 Dunes with
creeping willow habitat was assessed. Two sites were assessed as Favourable and seven as
Unfavourable-Inadequate.

Sand dunes monitoring survey – BEC Consultants Ltd. 2013 ____________________________
82
Table 3.60: Results of the Structure and Functions assessment at each site where 2170 Dunes with creeping willow habitat was assessed showing which of the criteria passed and
failed. Favourable, Unfavourable-Inadequate and Unfavourable-Bad are abbreviated to F, U-I and U-B respectively.
Site
no.
Positive
indicator
species
Rare
species
Negative
indicator
species
Non-
native
species
Indicators
of rank
conditions
Tree/
scrub
cover
Height
of Salix
repens
Bare
ground
Alterations
to sediment
dynamics
Damage due
to
disturbance
Assessment
28 Pass Pass Pass Pass Pass Pass Fail Fail Pass Pass U-I
35 Pass Pass Pass Pass Pass Fail Fail Pass Pass Pass U-I
75 Pass Pass Fail Pass Pass Pass Pass Pass Pass Pass U-I
124 Pass Pass Pass Pass Pass Pass Fail Pass Pass Pass U-I
133 Pass Pass Pass Pass Pass Fail Pass Fail Pass Pass U-I
147 Pass Pass Fail Pass Pass Pass Fail Pass Pass Pass U-I
148 Pass Pass Pass Pass Pass Pass Pass Pass Pass Pass F
162 Pass Pass Fail Pass Pass Pass Pass Pass Pass Pass U-I
169 Pass Pass Pass Pass Pass Pass Pass Pass Pass Pass F

Sand dunes monitoring survey – BEC Consultants Ltd. 2013 ____________________________
83
Table 3.61 shows the area and percentage of the sampled area for which Structure and Functions
were assessed as Favourable and Unfavourable. Almost 80% of the habitat was assessed as
Favourable, while 20.8% of the habitat was assessed as Unfavourable. Structure and Functions
were assessed as Unfavourable-Inadequate during the baseline survey. The SDM assessment of
Structure and Functions of 2170 Dunes with creeping willow was also Unfavourable-Inadequate.
Table 3.61: The total assessed area and percentage of area of 2170 Dunes with creeping willow in Favourable
and Unfavourable condition in 2011/2012.
Area (ha) Area (%)
Favourable 78.69 79.2
Unfavourable 22.09 20.8
3.8.3 Future Prospects
Positive impacts were recorded at 7 sites, neutral impacts were recorded at five sites and negative
impacts were recorded at nine sites. The median impact score across all sites irrespective of habitat area
was -0.125 and the lowest score any site achieved was -4.75.
Five positive impacts were recorded on 2170 Dunes with creeping willow (Table 3.62). Four of the five
positive impacts related to non-intensive grazing by livestock.
Table 3.62: Positive impacts affecting 2170 Dunes with creeping willow, the percentage of sites (where the
habitat occurs) which were affected, the degree of impact and the area of the habitat affected.
Impact code
Impact description Percentage of sites affected: Area affected
(ha)
Area affected (% of total
sample area) Low
intensity Medium intensity
High intensity
Total
A04.02.01 Non intensive cattle
grazing 7.1 21.4 0.0 28.6 38.64 35.4
A04.02.05 Non intensive mixed
animal grazing 7.1 0.0 0.0 7.1 25.63 23.5
A04.02.02 Non intensive sheep
grazing 7.1 0.0 0.0 7.1 3.12 2.9
B02.02 Forestry clearance 7.1 0.0 0.0 7.1 0.14 0.1
A04.02.03 Non intensive horse
grazing 7.1 0.0 0.0 7.1 0.07 0.1
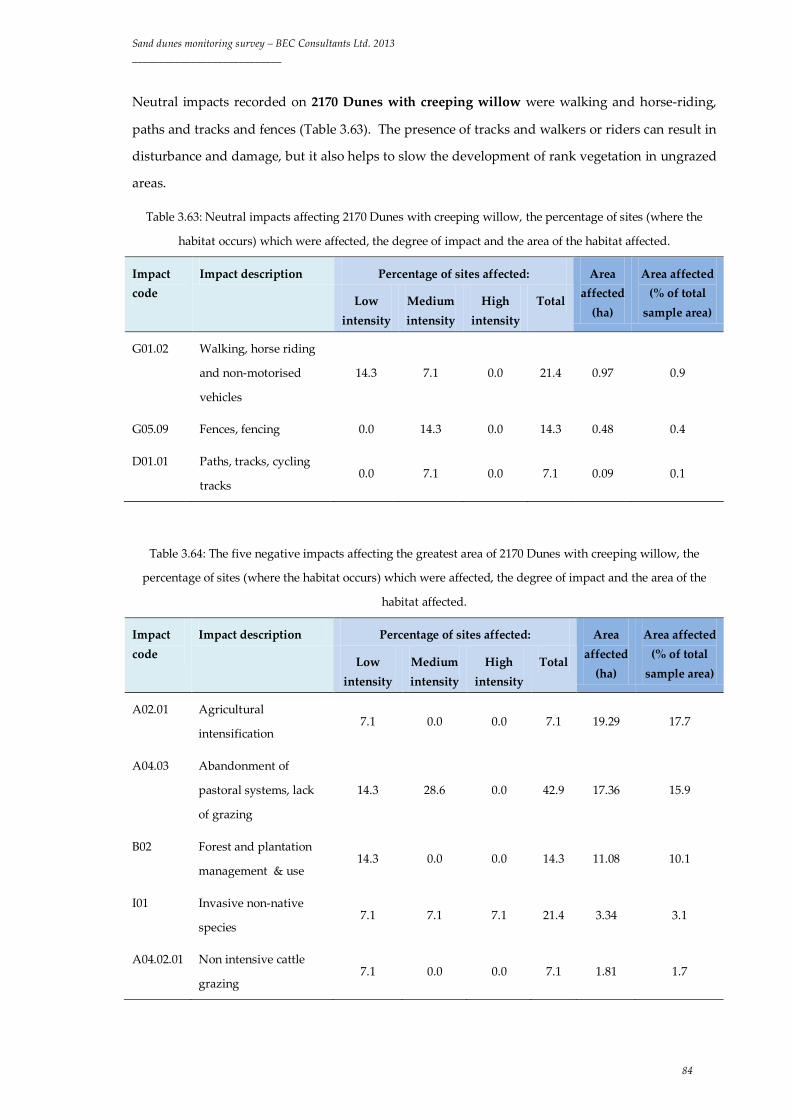
Sand dunes monitoring survey – BEC Consultants Ltd. 2013 ____________________________
84
Neutral impacts recorded on 2170 Dunes with creeping willow were walking and horse-riding,
paths and tracks and fences (Table 3.63). The presence of tracks and walkers or riders can result in
disturbance and damage, but it also helps to slow the development of rank vegetation in ungrazed
areas.
Table 3.63: Neutral impacts affecting 2170 Dunes with creeping willow, the percentage of sites (where the
habitat occurs) which were affected, the degree of impact and the area of the habitat affected.
Impact code
Impact description Percentage of sites affected: Area affected
(ha)
Area affected (% of total
sample area) Low
intensity Medium intensity
High intensity
Total
G01.02 Walking, horse riding
and non-motorised
vehicles
14.3 7.1 0.0 21.4 0.97 0.9
G05.09 Fences, fencing 0.0 14.3 0.0 14.3 0.48 0.4
D01.01 Paths, tracks, cycling
tracks 0.0 7.1 0.0 7.1 0.09 0.1
Table 3.64: The five negative impacts affecting the greatest area of 2170 Dunes with creeping willow, the
percentage of sites (where the habitat occurs) which were affected, the degree of impact and the area of the
habitat affected.
Impact code
Impact description Percentage of sites affected: Area affected
(ha)
Area affected (% of total
sample area) Low
intensity Medium intensity
High intensity
Total
A02.01 Agricultural
intensification 7.1 0.0 0.0 7.1 19.29 17.7
A04.03 Abandonment of
pastoral systems, lack
of grazing
14.3 28.6 0.0 42.9 17.36 15.9
B02 Forest and plantation
management & use 14.3 0.0 0.0 14.3 11.08 10.1
I01 Invasive non-native
species 7.1 7.1 7.1 21.4 3.34 3.1
A04.02.01 Non intensive cattle
grazing 7.1 0.0 0.0 7.1 1.81 1.7
Sand dunes monitoring survey – BEC Consultants Ltd. 2013 ____________________________
85
The top five negative impacts include three which relate to agriculture, and these relate to
unfavourable management regimes and lack of management (Table 3.64). Invasive non-native
species and forestry management also have a negative impact, and these are sometimes related as
adjacent forestry can act as a seed source for non native species which can spread into the 2170
Dunes with creeping willow.
The positive impacts on the habitat are likely to maintain the area which is currently in Favourable
condition, but are not expected to extend to areas currently assessed as Unfavourable. Future
Prospects were assessed as Unfavourable-Inadequate during the CMP. This assessment has not
changed, and Future Prospects were assessed as Unfavourable-Inadequate during the SDM.
3.8.4 Conservation assessment
Table 3.65 shows the conservation assessment of 2170 Dunes with creeping willow during the
SDM. No loss of area was recorded during the SDM. Area was assessed as Favourable in the
National Conservation assessment in 2007, which indicates that loss of area had not occurred
between implementation of the Habitats Directive and 2007. The NCA is considered to be the
definitive assessment of the habitat, and it overrides the Unfavourable-Inadequate assessment
given in the CMP report. Area was assessed as Favourable (stable) during the SDM.
The criteria assessing presence of negative indicator species, cover of trees and scrub, cover of bare
ground and height of Salix repens failed during the SDM assessment, and the habitat was assessed
as Unfavourable-Inadequate. Negative indicator species, typical species and cover of broad-leaved
grasses failed in assessments during the CMP. All of the monitoring stops passed during the CMP,
but the habitat was assessed as Unfavourable-Inadequate because 1% of the habitat was considered
to be in poor condition. Although this appears to be a more positive assessment than the SDM
reported, it is likely that the difference is partly related to a change in the methodology. Only four
of the six criteria had to pass within each monitoring stop for the habitat to pass during the CMP.
If a single criterion failed at the majority of monitoring stops within a site, the habitat would still
have been assessed as Favourable during the CMP, while it would have been assessed as
Unfavourable-Inadequate during the SDM. Absence of bare ground was not a reason for failure
during the CMP. During the SDM, a small amount of bare ground was a requirement for the
habitat to pass as absence of bare ground is a sign of over-stabilisation and results in reduced
habitat and species diversity. This difference in the methodology helps to explain why the
criterion passed at all stops during the CMP. The size of trees and scrub observed during the SDM
implies that they were almost certainly present during the CMP, so the fact that all of the
monitoring stops passed this criterion is most likely to be related to the positioning of the stops.
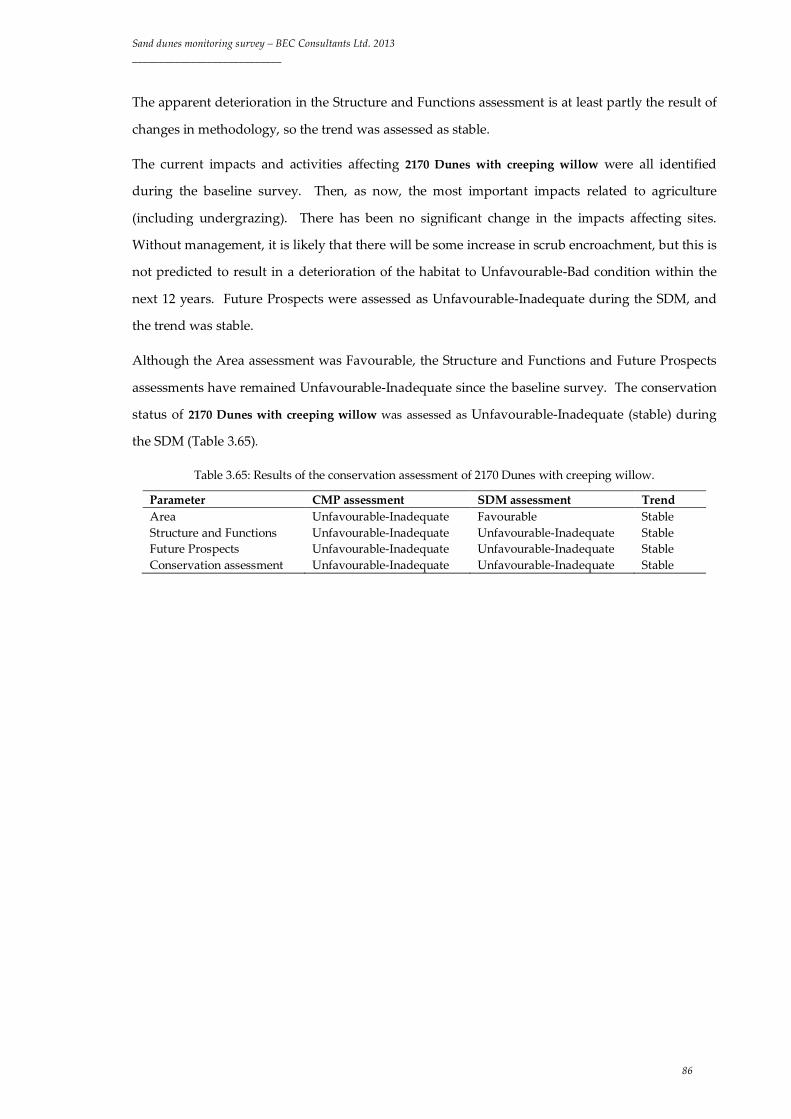
Sand dunes monitoring survey – BEC Consultants Ltd. 2013 ____________________________
86
The apparent deterioration in the Structure and Functions assessment is at least partly the result of
changes in methodology, so the trend was assessed as stable.
The current impacts and activities affecting 2170 Dunes with creeping willow were all identified
during the baseline survey. Then, as now, the most important impacts related to agriculture
(including undergrazing). There has been no significant change in the impacts affecting sites.
Without management, it is likely that there will be some increase in scrub encroachment, but this is
not predicted to result in a deterioration of the habitat to Unfavourable-Bad condition within the
next 12 years. Future Prospects were assessed as Unfavourable-Inadequate during the SDM, and
the trend was stable.
Although the Area assessment was Favourable, the Structure and Functions and Future Prospects
assessments have remained Unfavourable-Inadequate since the baseline survey. The conservation
status of 2170 Dunes with creeping willow was assessed as Unfavourable-Inadequate (stable) during
the SDM (Table 3.65).
Table 3.65: Results of the conservation assessment of 2170 Dunes with creeping willow.
Parameter CMP assessment SDM assessment Trend Area Unfavourable-Inadequate Favourable Stable Structure and Functions Unfavourable-Inadequate Unfavourable-Inadequate Stable Future Prospects Unfavourable-Inadequate Unfavourable-Inadequate Stable Conservation assessment Unfavourable-Inadequate Unfavourable-Inadequate Stable

Sand dunes monitoring survey – BEC Consultants Ltd. 2013 ____________________________
87
3.9 2190 Humid dune slacks
3.9.1 Area and distribution
2190 Humid dune slacks were recorded at 29 of the 39 sites included in the SDM. They are
distributed evenly around the coast (Figure 3.9) and larger slacks tend to be associated with sites
where there are large, expansive areas of *2130 Fixed dunes (grey dunes). Slacks were no longer
present at two sites where they were recorded during the CMP, site 3 Mornington and site 43
Grange (Table 3.66) Areas at site 246 Tramore (a subsite of site 46 Tramore) were included in the
areas presented in Table 3.66
Table 3.66: Area of 2190 Humid dune slacks
(surveyed and unsurveyed) on the revised CMP
maps and the SDM maps.
Site no.
Site name Revised CMP area (ha)
SDM area (ha)
3 Mornington 0.93 0.00 9 Portmarnock 0.87 0.31 10 North Bull Island 3.04 2.96 11 South Bull Island 8.40 9.15 17 Brittas Bay 0.83 0.34 18 Mizen Head 4.76 4.76 28 Cahore Point North 2.28 2.28 35 The Raven 0.15 0.15 41 Ballyteige 17.93 17.68 43 Grange 2.76 0.00 46 Tramore 0.25 0.25 58 Inchydoney 0.28 0.28 60 Castlefreke 0.15 0.15 64 Barley Cove 4.59 4.59 68 Rossbehy 1.91 1.60 70 Inch 32.36 32.36 75 Castlegregory 32.29 27.60 77 Banna Strand 5.31 5.29 97 Dogs Bay 0.10 0.10 108 Dooaghtry 2.00 2.00 120 Doo Lough 1.56 0.54 124 Aghleam 24.94 24.85 128 Garter Hill 5.97 5.88 131 Bartragh 1.67 1.67 133 Strandhill 1.88 2.00 147 Maghera 1.10 1.10 148 Sheskinmore 7.57 12.85 155 Kincaslough 1.09 1.09 157 Derrybeg 0.19 0.19 162 Rincleven 42.57 42.57 169 Lough Nagreany 0.72 0.72
Figure 3.9: Distribution of SDM sites supporting 2190
Humid dune slacks with the area of the habitat indicated.

Sand dunes monitoring survey – BEC Consultants Ltd. 2013 ____________________________
88
The area of 2190 Humid dune slacks mapped during the baseline survey, the revised baseline area
and the area mapped in 2011/2012 are shown in Table 3.67.
Because of access difficulties, parts of the habitat at sites 70 Inch and 75 Castlegregory could not be
surveyed and were excluded from the Area assessment. The area excluded amounted to 32.39 ha.
The areas included in the change in area calculation are presented in Table 3.67.
Table 3.67: Area of 2190 Humid dune slacks within the sample sites as represented on different maps.
Total mapped area
(ha)
Area used in calculation of change
(ha)
CMP area 159.23 n/a
Revised CMP area 210.45 178.06
SDM area 205.31 172.92
The total area of 2190 Humid dune slacks (Table 3.68) decreased between the CMP and the SDM
by 5.14 ha. The site with the largest loss was site 75 Castlegregory, where 4.69 ha were lost. This
area was only briefly viewed because of the presence of a bull, but it appeared to consist of a
mosaic of 2170 Dunes with creeping willow and 2190 Humid dune slacks, where 2170 Dunes
with creeping willow was dominant. The cover of each habitat could not be determined so the
dominant habitat, 2170 Dunes with creeping willow, was mapped as having 100% cover. The
cause of the succession could not be determined, but there was no clear evidence that it was the
result of human activities. There were indications that human activity was likely to have resulted
in loss of 1.36 ha at two sites on the east coast, site 3 Mornington and site 17 Brittas Bay. There was
evidence of development of new dune slacks at only three sites visited in 2011/2012: sites 133
Strandhill, 148 Sheskinmore and 124 Aghleam.
Table 3.68: Loss of area of 2190 Humid dune slacks since the baseline survey.
Area (ha) Area (%)
Total loss since CMP 5.14 2.9
Loss due to anthropogenic factors 1.36 0.8
Area was assessed as Unfavourable-Inadequate during the CMP. Loss of area continued in the
period between the SDM and the CMP, but was equal to less than 1% per year. Area was assessed
as Unfavourable-Inadequate during the SDM.
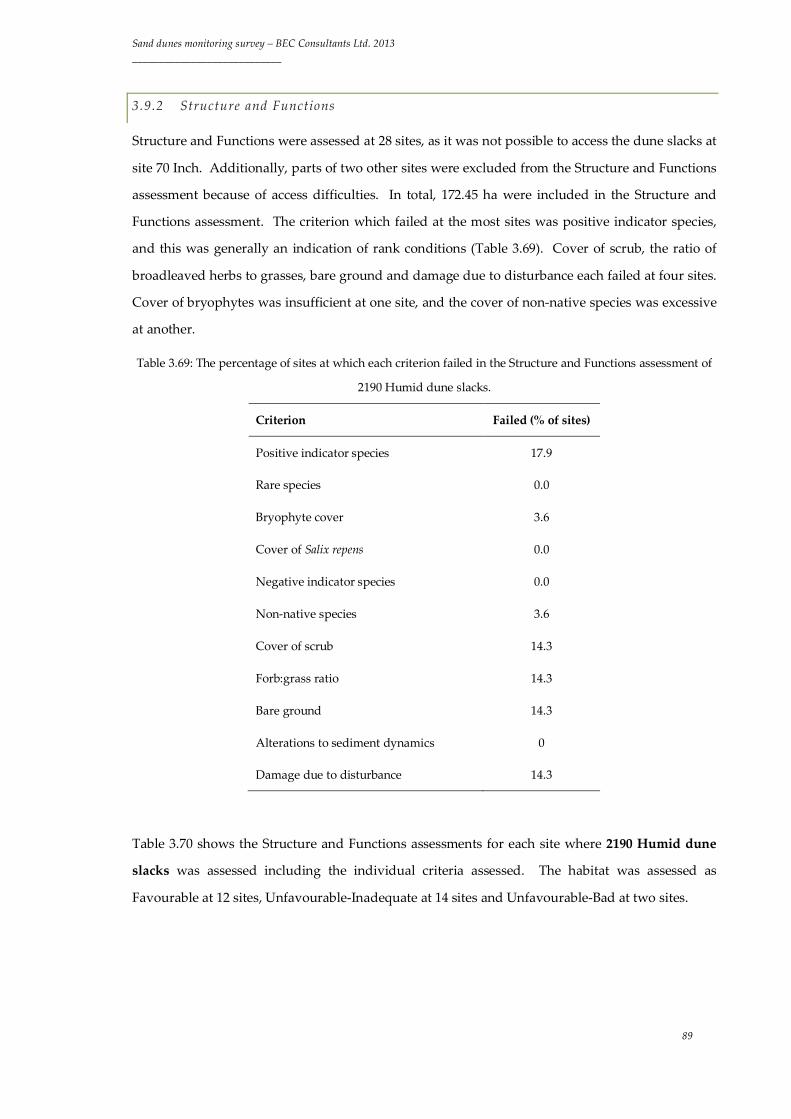
Sand dunes monitoring survey – BEC Consultants Ltd. 2013 ____________________________
89
3.9.2 Structure and Functions
Structure and Functions were assessed at 28 sites, as it was not possible to access the dune slacks at
site 70 Inch. Additionally, parts of two other sites were excluded from the Structure and Functions
assessment because of access difficulties. In total, 172.45 ha were included in the Structure and
Functions assessment. The criterion which failed at the most sites was positive indicator species,
and this was generally an indication of rank conditions (Table 3.69). Cover of scrub, the ratio of
broadleaved herbs to grasses, bare ground and damage due to disturbance each failed at four sites.
Cover of bryophytes was insufficient at one site, and the cover of non-native species was excessive
at another.
Table 3.69: The percentage of sites at which each criterion failed in the Structure and Functions assessment of
2190 Humid dune slacks.
Criterion Failed (% of sites)
Positive indicator species 17.9
Rare species 0.0
Bryophyte cover 3.6
Cover of Salix repens 0.0
Negative indicator species 0.0
Non-native species 3.6
Cover of scrub 14.3
Forb:grass ratio 14.3
Bare ground 14.3
Alterations to sediment dynamics 0
Damage due to disturbance 14.3
Table 3.70 shows the Structure and Functions assessments for each site where 2190 Humid dune
slacks was assessed including the individual criteria assessed. The habitat was assessed as
Favourable at 12 sites, Unfavourable-Inadequate at 14 sites and Unfavourable-Bad at two sites.

Sand dunes monitoring survey – BEC Consultants Ltd. 2013 ____________________________
90
Table 3.70: Results of the Structure and Functions assessment at each site where 2190 Humid dune slacks were assessed showing which of the criteria passed and failed.
Favourable, Unfavourable-Inadequate and Unfavourable-Bad are abbreviated to F, U-I and U-B respectively.
Site
no.
Positive
indicator
species
Rare
species
Bryophyte
cover
Cover of
Salix repens
Negative
indicator
species
Non-native
species
Cover
of
scrub
Forb: grass
ratio
Bare
ground
Alterations to
sediment
dynamics
Damage due to
disturbance
Structure
and
Functions
9 Pass Pass Pass Pass Pass Pass Pass Pass Fail Pass Pass U-I
10 Pass Pass Pass Pass Pass Fail Pass Pass Pass Pass Pass U-I
11 Pass Pass Pass Pass Pass Pass Fail Pass Pass Pass Pass U-I
17 Pass Pass Pass Pass Pass Pass Fail Pass Pass Pass Pass U-I
18 Pass Pass Pass Pass Pass Pass Fail Pass Pass Pass Pass U-I
28 Pass Pass Pass Pass Pass Pass Pass Fail Pass Pass Pass U-I
35 Pass Pass Pass Pass Pass Pass Pass Pass Pass Pass Pass F
41 Pass Pass Pass Pass Pass Pass Pass Pass Pass Pass Pass F
46 Fail Pass Fail Pass Pass Pass Fail Pass Fail Pass Pass U-B
58 Pass Pass Pass Pass Pass Pass Pass Pass Pass Pass Pass F
60 Pass Pass Pass Pass Pass Pass Pass Pass Pass Pass Fail U-I
64 Fail Pass Pass Pass Pass Pass Pass Fail Fail Pass Pass U-B
68 Pass Pass Pass Pass Pass Pass Pass Pass Pass Pass Pass F
75 Fail Pass Pass Pass Pass Pass Pass Pass Pass Pass Fail U-I
77 Fail Pass Pass Pass Pass Pass Pass Pass Pass Pass Pass U-I
97 Pass Pass Pass Pass Pass Pass Pass Pass Pass Pass Pass F
108 Pass Pass Pass Pass Pass Pass Pass Pass Pass Pass Pass F
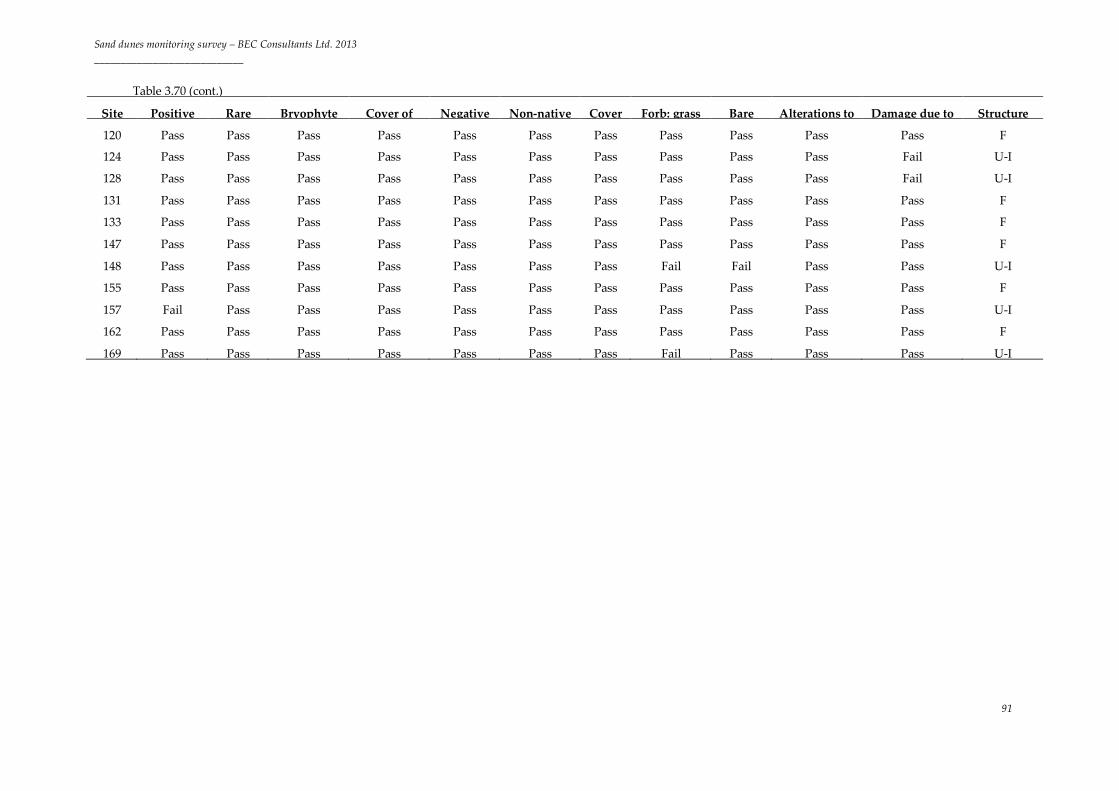
Sand dunes monitoring survey – BEC Consultants Ltd. 2013 ____________________________
91
Table 3.70 (cont.)
Site
Positive
Rare
Bryophyte
Cover of
Negative
Non-native
Cover
Forb: grass
Bare
Alterations to
Damage due to
Structure
120 Pass Pass Pass Pass Pass Pass Pass Pass Pass Pass Pass F
124 Pass Pass Pass Pass Pass Pass Pass Pass Pass Pass Fail U-I
128 Pass Pass Pass Pass Pass Pass Pass Pass Pass Pass Fail U-I
131 Pass Pass Pass Pass Pass Pass Pass Pass Pass Pass Pass F
133 Pass Pass Pass Pass Pass Pass Pass Pass Pass Pass Pass F
147 Pass Pass Pass Pass Pass Pass Pass Pass Pass Pass Pass F
148 Pass Pass Pass Pass Pass Pass Pass Fail Fail Pass Pass U-I
155 Pass Pass Pass Pass Pass Pass Pass Pass Pass Pass Pass F
157 Fail Pass Pass Pass Pass Pass Pass Pass Pass Pass Pass U-I
162 Pass Pass Pass Pass Pass Pass Pass Pass Pass Pass Pass F
169 Pass Pass Pass Pass Pass Pass Pass Fail Pass Pass Pass U-I

Sand dunes monitoring survey – BEC Consultants Ltd. 2013 ____________________________
92
The combined area of 2190 Humid dune slacks in the sample sites which was assessed as
Favourable or Unfavourable is presented in Table 3.71. Over 90% of the habitat is in Favourable
condition, which is very similar to the percentage assessed as Favourable during the baseline
survey, and the Structure and Functions for the habitat are assessed as Unfavourable-Inadequate
for the SDM.
Table 3.71: The total assessed area and percentage of area of 2190 Humid dune slacks in Favourable and
Unfavourable condition in 2011/2012.
Area (ha) Area (%)
Favourable 158.56 91.9
Unfavourable 13.89 8.1
3.9.3 Future Prospects
Positive impacts were recorded at eleven sites, neutral impacts were recorded at 18 sites, negative
impacts were recorded at 21 sites, and at one site, site 70 Inch, no impacts were recorded at all. The
median impact score across all sites irrespective of habitat area was -2.63 and the most negative
impact score at any site was -11.
Five positive impacts were recorded in 2190 Humid dune slacks. Four of these were forms of non-
intensive grazing (Table 3.72), while scrub removal was recorded as a positive impact at one site (site 10
North Bull Island).

Sand dunes monitoring survey – BEC Consultants Ltd. 2013 ____________________________
93
Table 3.72: Positive impacts affecting 2190 Humid dune slacks, the percentage of sites (where the habitat
occurs) which were affected, the degree of impact and the area of the habitat affected.
Impact code
Impact description Percentage of sites affected: Area affected
(ha)
Area affected (% of total
sample area) Low
intensity Medium intensity
High intensity
Total
A04.02.01 Non intensive cattle
grazing 10.3 13.8 0.0 24.1 102.39 49.9
A04.02.03 Non intensive horse
grazing 3.4 6.9 0.0 10.3 21.65 10.5
A04.02.05 Intensive mixed
animal grazing 3.4 0.0 0.0 3.4 7.45 3.6
A04.02.02 Non intensive sheep
grazing 3.4 3.4 0.0 6.9 2.77 1.4
A10.01 Removal of hedges
and copses or scrub 0.0 0.0 3.4 3.4 0.44 0.2
Neutral impacts included grazing by domestic animals, non-intensive recreational activities and
golf courses which were found adjacent to the sites (Table 3.73). Grazing by domestic animals is
considered to be neutral if the positive impacts are offset by negative aspects such as poaching.
Table 3.73: The five neutral impacts and activities affecting the greatest area of 2190 Humid dune slacks, the
percentage of sites (where the habitat occurs) which were affected, the degree of impact and the area of the
habitat affected.
Impact code
Impact description Percentage of sites affected: Area affected
(ha)
Area affected (% of total
sample area) Low
intensity Medium intensity
High intensity
Total
G01.02 Walking, horse riding and non-motorised vehicles
31.0 10.3 0.0 41.4 9.17 4.5
A04.02.01 Non intensive cattle grazing 6.9 3.4 0.0 10.3 8.65 4.2
A04.02.02 Non intensive sheep
grazing 6.9 0.0 0.0 6.9 7.88 3.8
G01.08 Other outdoor sports
and leisure activities 3.4 0.0 0.0 3.4 5.88 2.9
G02.01 Golf course 10.3 0.0 0.0 10.3 4.42 2.2
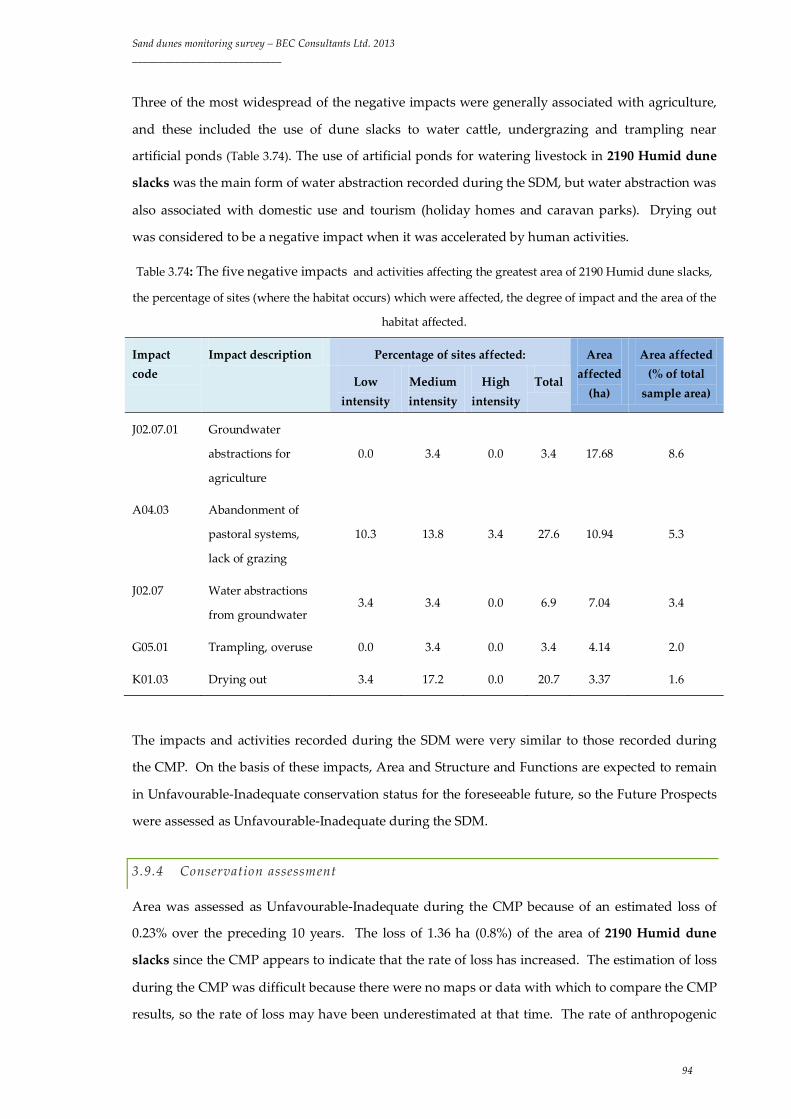
Sand dunes monitoring survey – BEC Consultants Ltd. 2013 ____________________________
94
Three of the most widespread of the negative impacts were generally associated with agriculture,
and these included the use of dune slacks to water cattle, undergrazing and trampling near
artificial ponds (Table 3.74). The use of artificial ponds for watering livestock in 2190 Humid dune
slacks was the main form of water abstraction recorded during the SDM, but water abstraction was
also associated with domestic use and tourism (holiday homes and caravan parks). Drying out
was considered to be a negative impact when it was accelerated by human activities.
Table 3.74: The five negative impacts and activities affecting the greatest area of 2190 Humid dune slacks,
the percentage of sites (where the habitat occurs) which were affected, the degree of impact and the area of the
habitat affected.
Impact code
Impact description Percentage of sites affected: Area affected
(ha)
Area affected (% of total
sample area) Low
intensity Medium intensity
High intensity
Total
J02.07.01 Groundwater
abstractions for
agriculture
0.0 3.4 0.0 3.4 17.68 8.6
A04.03 Abandonment of
pastoral systems,
lack of grazing
10.3 13.8 3.4 27.6 10.94 5.3
J02.07 Water abstractions
from groundwater 3.4 3.4 0.0 6.9 7.04 3.4
G05.01 Trampling, overuse 0.0 3.4 0.0 3.4 4.14 2.0
K01.03 Drying out 3.4 17.2 0.0 20.7 3.37 1.6
The impacts and activities recorded during the SDM were very similar to those recorded during
the CMP. On the basis of these impacts, Area and Structure and Functions are expected to remain
in Unfavourable-Inadequate conservation status for the foreseeable future, so the Future Prospects
were assessed as Unfavourable-Inadequate during the SDM.
3.9.4 Conservation assessment
Area was assessed as Unfavourable-Inadequate during the CMP because of an estimated loss of
0.23% over the preceding 10 years. The loss of 1.36 ha (0.8%) of the area of 2190 Humid dune
slacks since the CMP appears to indicate that the rate of loss has increased. The estimation of loss
during the CMP was difficult because there were no maps or data with which to compare the CMP
results, so the rate of loss may have been underestimated at that time. The rate of anthropogenic

Sand dunes monitoring survey – BEC Consultants Ltd. 2013 ____________________________
95
loss may also have been underestimated during the SDM because of incomplete data regarding the
hydrological status of some sites. During the SDM, many dune slacks were mapped for the first
time, although the plant communities present in them indicated that they had been present on the
sites for a considerable length of time and were probably overlooked during mapping for the CMP.
As a result, the area of 2190 Humid dune slacks was revised upwards by 32% in comparison with
the CMP maps. This means that some loss of the habitat may have gone undetected during the
SDM. Because of the continued habitat loss equal to less than 1% per year since the CMP survey
was carried out, Area was assessed as Unfavourable-Inadequate during the SDM and the trend
was deteriorating.
Structure and Functions were assessed as Unfavourable-Inadequate during the CMP. At that time,
5% of the monitoring stops failed the assessment, but 9% of the habitat was considered to have
Unfavourable Structure and Functions as some sites were assessed on the basis of expert
judgement alone. The attributes which failed most frequently assessed the proportion of
broadleaved herbs to grasses, cover of Salix repens, typical species and negative indicator species.
These criteria also failed frequently during the SDM with the exception of cover of Salix repens,
which did not fail at any site. If it had been assessed on a stop basis, this would have failed at
some locations. The other criteria that failed frequently during the SDM assessed the cover of bare
ground and damage due to disturbance. In contrast to the SDM methodology, the absence of bare
soil did not result in a fail during the CMP and damage due to disturbance was not assessed.
There was very little change in the Structure and Functions assessment since the CMP. Structure
and Functions were assessed as Unfavourable-Inadequate and the trend was stable.
The threats facing 2190 Humid dune slacks have changed very little since the baseline survey. The
impacts recorded most frequently both during the CMP and the SDM related to agriculture. Water
abstraction for a variety of uses was an important negative impact, but this is very difficult to
quantify and is believed to have been underestimated during the SDM. Although groundwater
abstraction was stated to be the most serious threat to the habitat during the CMP (Ryle et al. 2009),
it was not noted in the list of impacts and activities affecting the habitat in the CMP report.
Hydrology is one of the main drivers of dune slack ecology, and lack of information on water
abstraction means that it is very difficult to determine what the condition of the habitat will be in
12 years’ time. Continued habitat loss is anticipated, and Structure and Functions are likely to be
maintained in Unfavourable condition. Future Prospects were assessed as Unfavourable-
Inadequate and the trend was deteriorating.
Table 3.75 shows the Conservation assessment for 2190 Humid dune slacks. All of the parameters
were assessed as Unfavourable-Inadequate. Two parameters, Area and Future Prospects, continue

Sand dunes monitoring survey – BEC Consultants Ltd. 2013 ____________________________
96
to decline. The conservation status of 2190 Humid dune slacks was assessed as Unfavourable-
Inadequate (deteriorating) during the SDM.
Table 3.75: Results of the conservation assessment of 2190 Humid dune slacks.
Parameter CMP assessment SDM assessment Trend
Area Unfavourable-Inadequate Unfavourable-Inadequate Deteriorating
Structure and Functions Unfavourable-Inadequate Unfavourable-Inadequate Stable
Future Prospects Unfavourable-Inadequate Unfavourable-Inadequate Deteriorating
Conservation assessment Unfavourable-Inadequate Unfavourable-Inadequate Deteriorating

Sand dunes monitoring survey – BEC Consultants Ltd. 2013 ____________________________
97
3.10 *21A0 Machair
3.10.1 Area and distribution
*21A0 Machairs habitat was recorded at 12 of the 39 sites visited during the SDM. It has a distinct
north-western distribution, in keeping with the definition of the habitat (Figure 3.10). Where it
occurs, it can cover a very large area, for example at site 128 Garter Hill, where the habitat covers
an area of 234.62 ha (Table 3.76).
Table 3.76: Area of *21A0 Machair (surveyed and
Unsurveyed) on the revised CMP maps and the
SDM maps.
Figure 3.10: Distribution of SDM sites supporting
*21A0 Machairs with the area of the habitat indicated.
Site no.
Site name Revised CMP area(ha)
SDM area (ha)
100 Aillebrack 90.11 90.40
101 Doonloughan 113.62 113.27
104 Omey Island 45.63 45.80
108 Dooaghtry 142.64 143.74
120 Doo Lough 63.40 63.19
124 Aghleam 152.17 155.00
128 Garter Hill 205.59 234.62
148 Sheskinmore 24.25 21.28
157 Derrybeg 96.64 124.40
162 Rinclevan 41.35 41.42
167 Tranarossan 79.81 97.90
169 Lough Nagreany 8.54 8.54

Sand dunes monitoring survey – BEC Consultants Ltd. 2013 ____________________________
98
The area of *21A0 Machairs mapped during the baseline survey, the revised CMP area and the
area mapped during the SDM are shown in Table 3.77. Because of some changes to the boundaries
of *21A0 Machairs mapped during the baseline survey, the area of the habitat represented on the
revised CMP maps is 131.60 ha greater than that on the original CMP maps. Unsurveyed parts of
the habitat were not included in the calculations of change in area, and these amounted to 83.66
hectares. The main reasons for areas to have been mapped but not surveyed were because they
were outside of the boundaries marked on the original baseline maps, had undergone considerable
alteration through agriculture or tourist activities (caravan parks) or because of access difficulties.
The remaining areas which were included in the change in area assessment are shown in Table
3.77.
Table 3.77: Area of *21A0 Machairs within the sample sites as represented on different maps.
Total mapped area
(ha)
Area used in calculation of
change (ha)
CMP area 932.14 n/a
Revised CMP area 1063.74 980.08
SDM area 1139.56 1055.90
Area was assessed as Unfavourable-Inadequate during the CMP. There has been a genuine
increase in *21A0 Machairs since the baseline survey. This is primarily due to the partial recovery
of 28.06 ha which were formerly extremely eroded at site 128 Garter Hill. Although this can be
considered to be a natural recovery, there are signs this was aided by a reduction in grazing
intensity, and so this recovery was considered to be the result of improved management.
Anthropogenic loss also occurred. The total loss in area which can be ascribed to human activity is
7.24 ha (0.7% of the area in the Revised CMP) (Table 3.78). The loss is due to erosion which has
been exacerbated by human activity at site 108 Doonloughan and to the conversion of an area of
*21A0 Machairs at site 157 Derrybeg to a sports pitch. The loss in area is equal to less than 1% per
year since the CMP was carried out. Because habitat loss has continued, Area was assessed as
Unfavourable-Inadequate.

Sand dunes monitoring survey – BEC Consultants Ltd. 2013 ____________________________
99
Table 3.78: Change in area of *21A0 Machairs since the baseline survey.
Area (ha) Area (%)
Increase due to natural and anthropogenic factors 83.06 8.5
Loss due to anthropogenic factors 7.24 0.7
Net change in area (increase) 75.82 7.7
3.10.2 Structure and Functions
Table 3.79 shows the percentage of sites at which each criterion failed in the Structure and
Functions assessment. The criterion which failed most frequently assessed sward height, which
failed at 50% of sites, followed by criteria assessing negative indicator species, damage due to
disturbance and bryophyte cover.
Table 3.79: The percentage of sites at which each criterion failed in the Structure and Functions assessment for
*21A0 Machairs.
Criterion Failed (% of sites)
Target species 8.3
Rare species 0.0
Bryophyte cover 16.7
Negative indicator species 33.3
Non-native species 0.0
Flowering/fruiting 0.0
Bare ground 8.3
Sward height 50
Alterations to sediment dynamics 0.0
Damage due to disturbance 33.3
The Structure and Functions assessments of *21A0 Machairs at each of the 12 sites where it was
recorded during the SDM are shown in Table 3.80. One site, site 148 Sheskinmore, was assessed as
Favourable, and the remainder were assessed as Unfavourable-Inadequate.
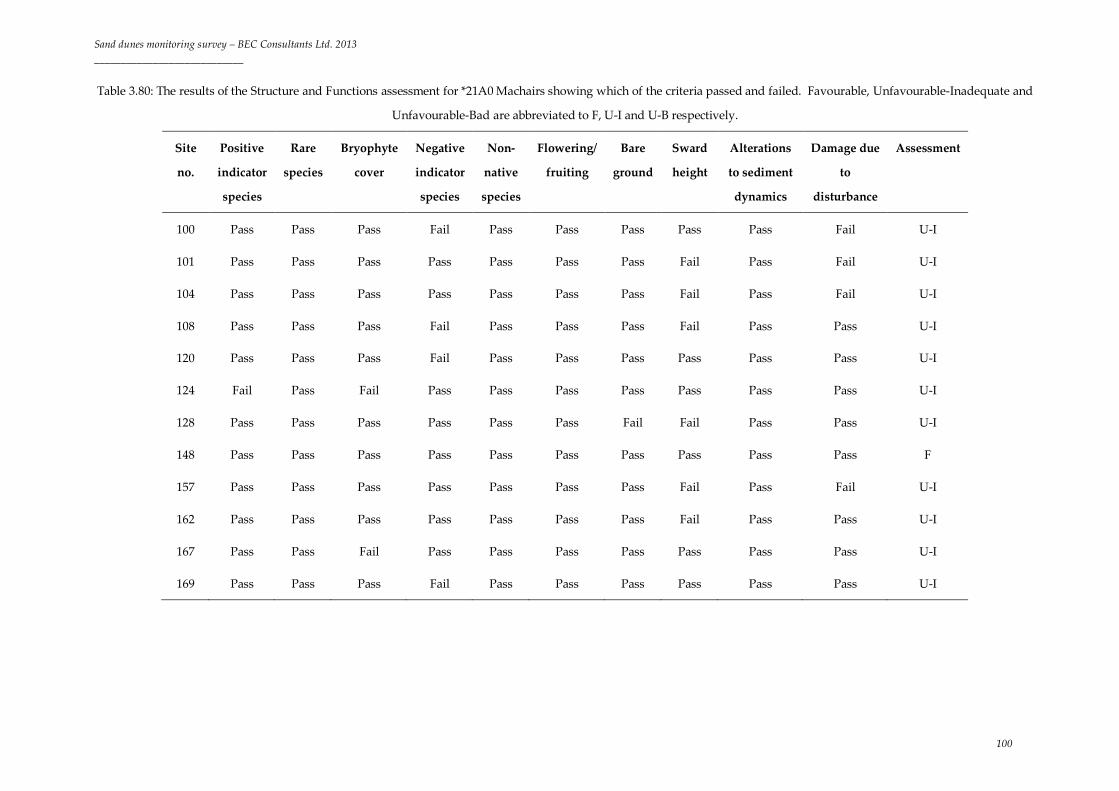
Sand dunes monitoring survey – BEC Consultants Ltd. 2013 ____________________________
100
Table 3.80: The results of the Structure and Functions assessment for *21A0 Machairs showing which of the criteria passed and failed. Favourable, Unfavourable-Inadequate and
Unfavourable-Bad are abbreviated to F, U-I and U-B respectively.
Site
no.
Positive
indicator
species
Rare
species
Bryophyte
cover
Negative
indicator
species
Non-
native
species
Flowering/
fruiting
Bare
ground
Sward
height
Alterations
to sediment
dynamics
Damage due
to
disturbance
Assessment
100 Pass Pass Pass Fail Pass Pass Pass Pass Pass Fail U-I
101 Pass Pass Pass Pass Pass Pass Pass Fail Pass Fail U-I
104 Pass Pass Pass Pass Pass Pass Pass Fail Pass Fail U-I
108 Pass Pass Pass Fail Pass Pass Pass Fail Pass Pass U-I
120 Pass Pass Pass Fail Pass Pass Pass Pass Pass Pass U-I
124 Fail Pass Fail Pass Pass Pass Pass Pass Pass Pass U-I
128 Pass Pass Pass Pass Pass Pass Fail Fail Pass Pass U-I
148 Pass Pass Pass Pass Pass Pass Pass Pass Pass Pass F
157 Pass Pass Pass Pass Pass Pass Pass Fail Pass Fail U-I
162 Pass Pass Pass Pass Pass Pass Pass Fail Pass Pass U-I
167 Pass Pass Fail Pass Pass Pass Pass Pass Pass Pass U-I
169 Pass Pass Pass Fail Pass Pass Pass Pass Pass Pass U-I

Sand dunes monitoring survey – BEC Consultants Ltd. 2013 ____________________________
101
In total, 999.27 ha were included in the Structure and Functions assessment. All of the parts of the
habitat that were labelled as unsurveyed or external were excluded. The combined area of *21A0
Machairs within the sample sites that was assessed as Favourable or Unfavourable is presented in
Table 3.81. Most (66.8%) of the habitat was in Unfavourable condition, so the Structure and Functions
are assessed as Unfavourable-Bad. This is comparable to the CMP assessment. Structure and
Functions of *21A0 Machairs were assessed as Unfavourable-Bad during the SDM.
Table 3.81: The total assessed area and percentage of area of *21A0 Machairs in Favourable and Unfavourable
condition in 2011/2012.
Area (ha) Area (%)
Favourable 332.04 33.2
Unfavourable 667.23 66.8
3.10.3 Impacts and activities
Positive impacts were noted at eight sites, neutral impacts were noted from 12 sites and negative
impacts were noted from 12 sites. The median impact score across all sites irrespective of area was -6
and the most negative score of any site was -9.
Four positive impacts were recorded in *21A0 Machairs, three of which related to agricultural
management and one to shooting of rabbits where they damaged the habitat (Table 3.82).
Table 3.82: Positive impacts affecting *21A0 Machairs, the percentage of sites (where the habitat occurs) which
were affected, the degree of impact and the area of the habitat affected.
Impact code
Impact description Percentage of sites affected: Area affected
(ha)
Area affected (% of total
sample area) Low
intensity Medium intensity
High intensity
Total
A04.02.01 Non-intensive cattle
grazing 8.3 41.7 0.0 50.0 340.87 29.9
F03.01 Hunting 8.3 0.0 0.0 8.3 45.80 4.0
A04.02.02 Non-intensive sheep
grazing 8.3 0.0 0.0 8.3 39.16 3.4
A04.02.03 Non-intensive horse
grazing 8.3 25.0 0.0 33.3 8.76 0.8
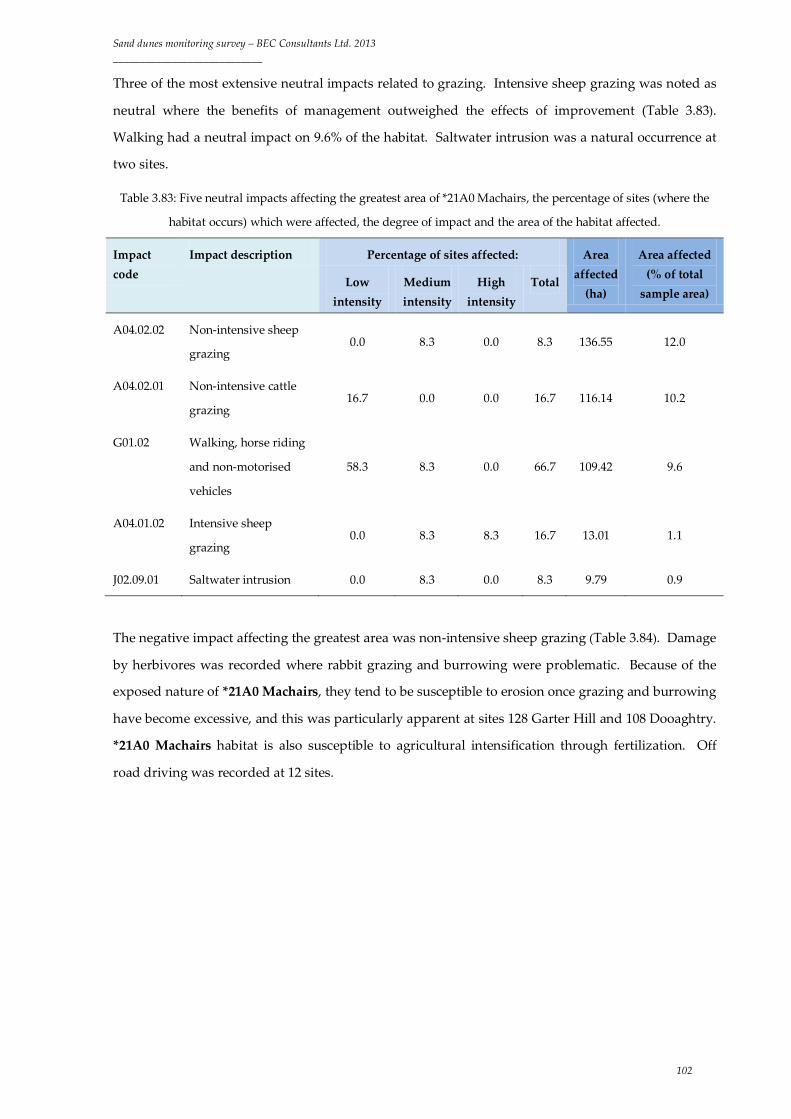
Sand dunes monitoring survey – BEC Consultants Ltd. 2013 ____________________________
102
Three of the most extensive neutral impacts related to grazing. Intensive sheep grazing was noted as
neutral where the benefits of management outweighed the effects of improvement (Table 3.83).
Walking had a neutral impact on 9.6% of the habitat. Saltwater intrusion was a natural occurrence at
two sites.
Table 3.83: Five neutral impacts affecting the greatest area of *21A0 Machairs, the percentage of sites (where the
habitat occurs) which were affected, the degree of impact and the area of the habitat affected.
Impact code
Impact description Percentage of sites affected: Area affected
(ha)
Area affected (% of total
sample area) Low
intensity Medium intensity
High intensity
Total
A04.02.02 Non-intensive sheep
grazing 0.0 8.3 0.0 8.3 136.55 12.0
A04.02.01 Non-intensive cattle
grazing 16.7 0.0 0.0 16.7 116.14 10.2
G01.02 Walking, horse riding
and non-motorised
vehicles
58.3 8.3 0.0 66.7 109.42 9.6
A04.01.02 Intensive sheep
grazing 0.0 8.3 8.3 16.7 13.01 1.1
J02.09.01 Saltwater intrusion 0.0 8.3 0.0 8.3 9.79 0.9
The negative impact affecting the greatest area was non-intensive sheep grazing (Table 3.84). Damage
by herbivores was recorded where rabbit grazing and burrowing were problematic. Because of the
exposed nature of *21A0 Machairs, they tend to be susceptible to erosion once grazing and burrowing
have become excessive, and this was particularly apparent at sites 128 Garter Hill and 108 Dooaghtry.
*21A0 Machairs habitat is also susceptible to agricultural intensification through fertilization. Off
road driving was recorded at 12 sites.

Sand dunes monitoring survey – BEC Consultants Ltd. 2013 ____________________________
103
Table 3.84: Five negative impacts affecting the greatest area of *21A0 Machairs, the percentage of sites (where the
habitat occurs) which were affected, the degree of impact and the area of the habitat affected.
Impact code
Impact description Percentage of sites affected: Area affected
(ha)
Area affected (% of total
sample area) Low
intensity Medium intensity
High intensity
Total
A04.02.02 Non-intensive sheep
grazing 8.3 25.0 0.0 33.3 425.23 37.3
K04.05 Damage by herbivores
(including game
species)
8.3 16.7 0.0 25.0 175.36 15.4
K01.01 Erosion 0.0 16.7 8.3 25.0 83.24 7.3
A08 Fertilisation 8.3 8.3 0.0 16.7 52.72 4.6
G01.03.02 Off-road motorised
driving 16.7 41.7 41.7 100.0 42.20 3.7
Future Prospects were assessed as Unfavourable-Bad during the CMP. With no improvement in the
conservation status of the habitat foreseen, Future Prospects were assessed as Unfavourable-Bad
during the SDM.
3.10.4 Conservation assessment
Table 3.85 shows the conservation assessment for *21A0 Machairs. Area was assessed as
Unfavourable-Inadequate during the CMP as agricultural improvement and land enclosure were
believed to have resulted in loss of 2.35% of the habitat over the preceding ten years. Although some
recovery was noted during the SDM, habitat loss due to human activities amounting to 0.7% was
noted to have occurred since the CMP, and Area was again assessed as Unfavourable-Inadequate.
Because both losses and recovery were noted to have occurred, the trend was stable.
During the CMP, 49% of the habitat was considered to be in Unfavourable condition and Structure
and Functions were assessed as Unfavourable-Bad. The criteria which failed most frequently were
negative indicator species and sward height, but failures were recorded for all of the criteria. Sward
height and negative indicator species were also the criteria that failed most frequently during the
SDM, but the area in Unfavourable condition was greater (66.8%). The difference in the area in
Unfavourable condition may be related to changes in the methodology because if one of the six criteria
assessed at a stop failed during the CMP, the stop was still allowed to pass. Structure and Functions

Sand dunes monitoring survey – BEC Consultants Ltd. 2013 ____________________________
104
were assessed as Unfavourable-Bad during the SDM. As there was no evidence of either a marked
improvement or deterioration in the condition of the habitat, the trend was stable.
During the CMP, the most frequent impacts were related to agriculture and recreation, with grazing,
overgrazing and field enclosure the three impacts affecting the greatest area. The pressures affecting
*21A0 Machairs do not appear to have altered significantly between the CMP and the SDM.
Although there has been some recovery in *21A0 Machairs, and this allowed a previously eroded area
to be included in the habitat assessment (site 128 Garter Hill), the impacts affecting *21A0 Machairs
have become more severe at other sites (e.g. erosion at site 108 Dooaghtry). The negative effects of
agriculture and herbivores are expected to continue to have an impact of the conservation status of the
habitat for the foreseeable future. Future Prospects were assessed as Unfavourable-Bad during the
SDM, and trend was stable.
There has been no change in any of the parameters of the conservation assessment since the baseline
survey and *21A0 Machairs habitat was assessed as Unfavourable-Bad (stable) during the SDM.
Table 3.85: Results of the conservation assessment of *21A0 Machairs.
Parameter CMP assessment SDM assessment Trend
Area Unfavourable-Inadequate Unfavourable-Inadequate Stable
Structure and Functions Unfavourable-Bad Unfavourable-Bad Stable
Future Prospects Unfavourable-Bad Unfavourable-Bad Stable
Conservation assessment Unfavourable-Bad Unfavourable-Bad Stable
Sand dunes monitoring survey – BEC Consultants Ltd. 2013 ____________________________
105
4. Discussion
4.1 Complexity of sand dune systems
Sand dune systems incorporate a range of habitats from highly dynamic, seaward communities to the
more mature, landward communities where grassland, heath, scrub and woodland can become
established. Although dunes include some of the most natural, pristine habitats in Ireland, they also
comprise communities that are dependent on management by humans for their maintenance, in
addition to habitats that are highly vulnerable to human interference. Dune systems are also
vulnerable to offshore developments as well as terrestrial land management. Works that alter the
processes of coastal erosion, deposition and sediment transport are particularly unpredictable and far-
reaching.
Much of the ecological value of sand dunes lies in the variety of micro-habitats that they contain. The
small-scale habitat variation of sand dune systems is of benefit to invertebrate fauna, providing bare
sand, exposed and sheltered aspects and dry and damp habitats (Howe et al., 2009). Sand dunes are
also an important resource on a greater landscape scale. For example, Chough breed and roost on sea
cliffs but were observed to forage in sand dunes at several sites during the SDM. In the context of
agricultural intensification and land-use change, protected sand dune habitats are an important
resource for wildlife.
Sand dune habitats depend on a range of external inputs that must be maintained for the ecosystem to
function. Input of organic material from high tides and windblown sand are particularly important
for fore-dune habitats, while groundwater is vital for maintenance of 2190 Humid dune slacks and
*21A0 Machairs. Reducing the availability of these resources in the wider landscape will reduce the
rate of habitat formation and, over time, will result in loss of area. The individual habitats within sand
dunes are mutually dependent, as fore-dunes succeed over time to fixed dunes, and the material in
fixed dunes can become mobilised during storms to form fore-dunes again. Permanent damage to one
habitat can therefore have long-term effects on the system as a whole. The transitional areas where
sand dunes grade into wetlands, saltmarshes and beaches are important because they provide some of
the resources such as groundwater and fresh sand required for the sand dune system to function.
Draining the wetlands that typically occur behind dune systems or erecting sea walls interferes with
the natural processes upon which sand dune ecosystems depend. Interrupting the natural transitions
between sand dunes and other habitats also reduces the ecological value of sand dunes as fauna from
the wider landscape is no longer able to access the dunes. The environmental conditions in
transitional areas are often unusual, and some of the rarer species recorded during the SDM were
located in transitional areas. For example, Parentucellia viscosa was found where a dune slack graded
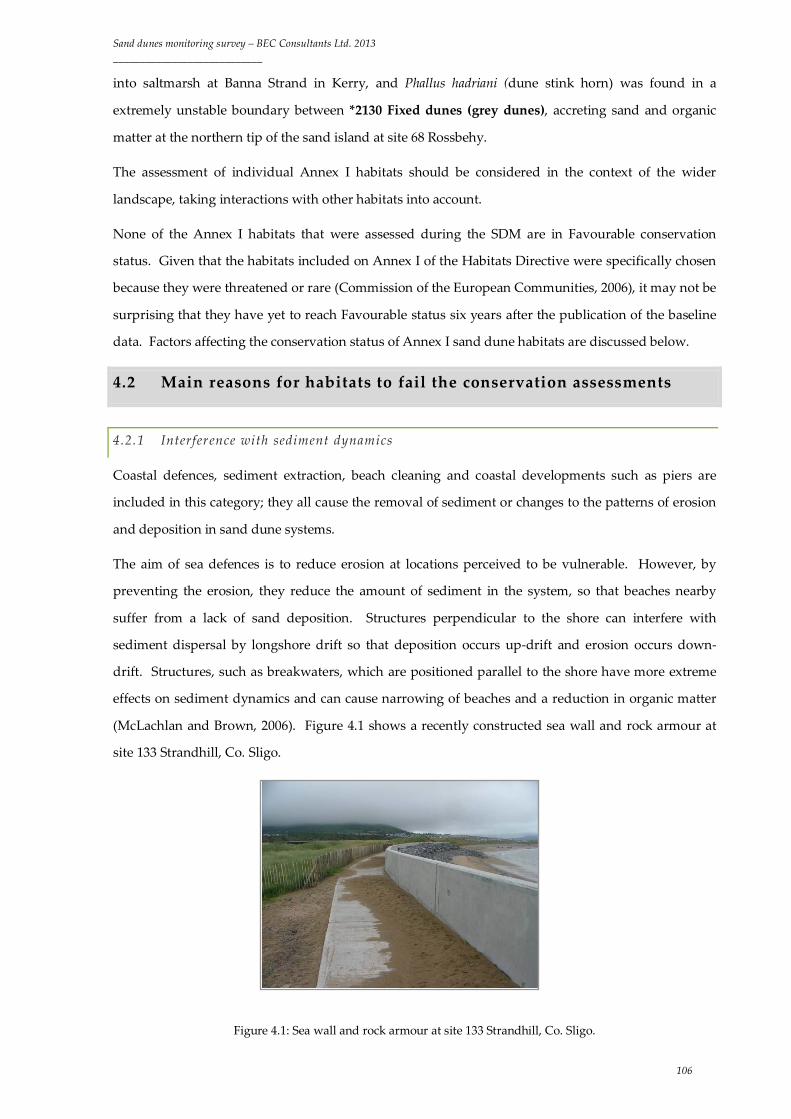
Sand dunes monitoring survey – BEC Consultants Ltd. 2013 ____________________________
106
into saltmarsh at Banna Strand in Kerry, and Phallus hadriani (dune stink horn) was found in a
extremely unstable boundary between *2130 Fixed dunes (grey dunes), accreting sand and organic
matter at the northern tip of the sand island at site 68 Rossbehy.
The assessment of individual Annex I habitats should be considered in the context of the wider
landscape, taking interactions with other habitats into account.
None of the Annex I habitats that were assessed during the SDM are in Favourable conservation
status. Given that the habitats included on Annex I of the Habitats Directive were specifically chosen
because they were threatened or rare (Commission of the European Communities, 2006), it may not be
surprising that they have yet to reach Favourable status six years after the publication of the baseline
data. Factors affecting the conservation status of Annex I sand dune habitats are discussed below.
4.2 Main reasons for habitats to fail the conservation assessments
4.2.1 Interference with sediment dynamics
Coastal defences, sediment extraction, beach cleaning and coastal developments such as piers are
included in this category; they all cause the removal of sediment or changes to the patterns of erosion
and deposition in sand dune systems.
The aim of sea defences is to reduce erosion at locations perceived to be vulnerable. However, by
preventing the erosion, they reduce the amount of sediment in the system, so that beaches nearby
suffer from a lack of sand deposition. Structures perpendicular to the shore can interfere with
sediment dispersal by longshore drift so that deposition occurs up-drift and erosion occurs down-
drift. Structures, such as breakwaters, which are positioned parallel to the shore have more extreme
effects on sediment dynamics and can cause narrowing of beaches and a reduction in organic matter
(McLachlan and Brown, 2006). Figure 4.1 shows a recently constructed sea wall and rock armour at
site 133 Strandhill, Co. Sligo.
Figure 4.1: Sea wall and rock armour at site 133 Strandhill, Co. Sligo.
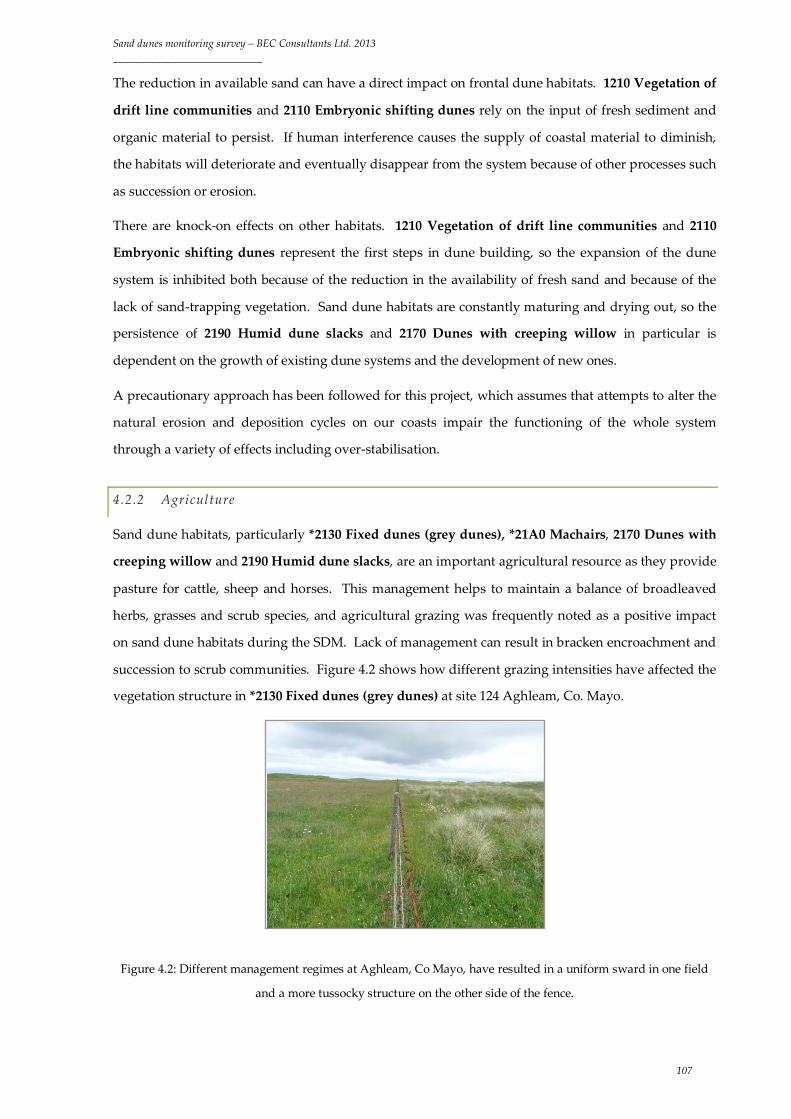
Sand dunes monitoring survey – BEC Consultants Ltd. 2013 ____________________________
107
The reduction in available sand can have a direct impact on frontal dune habitats. 1210 Vegetation of
drift line communities and 2110 Embryonic shifting dunes rely on the input of fresh sediment and
organic material to persist. If human interference causes the supply of coastal material to diminish,
the habitats will deteriorate and eventually disappear from the system because of other processes such
as succession or erosion.
There are knock-on effects on other habitats. 1210 Vegetation of drift line communities and 2110
Embryonic shifting dunes represent the first steps in dune building, so the expansion of the dune
system is inhibited both because of the reduction in the availability of fresh sand and because of the
lack of sand-trapping vegetation. Sand dune habitats are constantly maturing and drying out, so the
persistence of 2190 Humid dune slacks and 2170 Dunes with creeping willow in particular is
dependent on the growth of existing dune systems and the development of new ones.
A precautionary approach has been followed for this project, which assumes that attempts to alter the
natural erosion and deposition cycles on our coasts impair the functioning of the whole system
through a variety of effects including over-stabilisation.
4.2.2 Agriculture
Sand dune habitats, particularly *2130 Fixed dunes (grey dunes), *21A0 Machairs, 2170 Dunes with
creeping willow and 2190 Humid dune slacks, are an important agricultural resource as they provide
pasture for cattle, sheep and horses. This management helps to maintain a balance of broadleaved
herbs, grasses and scrub species, and agricultural grazing was frequently noted as a positive impact
on sand dune habitats during the SDM. Lack of management can result in bracken encroachment and
succession to scrub communities. Figure 4.2 shows how different grazing intensities have affected the
vegetation structure in *2130 Fixed dunes (grey dunes) at site 124 Aghleam, Co. Mayo.
Figure 4.2: Different management regimes at Aghleam, Co Mayo, have resulted in a uniform sward in one field
and a more tussocky structure on the other side of the fence.

Sand dunes monitoring survey – BEC Consultants Ltd. 2013 ____________________________
108
Agriculture can also have a negative effect on dune systems. *21A0 Machairs and *2130 Fixed dunes
(grey dunes) are vulnerable to reseeding, overgrazing and application of fertilisers, all of which
reduce the plant diversity of sand dune communities. 2190 Humid dune slacks appear to be
particularly attractive to grazers, and the sward can be grazed very closely. They are frequently
chosen as locations for stock feeding, and ponds are sometimes excavated in dune slacks for watering
livestock. These impacts can lead to localised disturbance of the substrate and the establishment of
ruderal communities. Any interference with the hydrological processes of dune slacks is considered
to be damaging.
4.2.3 Succession
In the context of *2130 Fixed dunes (grey dunes) and 2190 Humid dune slacks, the presence of
frequent trees and scrub is generally considered to be a negative impact. However, the succession
from dune grasslands to scrub and woodland is a natural process and, in places where pasture has
been abandoned, some of the dune habitats have started the transition to scrub and woodland. Small
areas of naturally occurring scrub and woodland can be seen at site 18 Mizen Head, where Betula
pubescens and Salix spp. have become established (Figure 4.3). Dune woodland is recognised as a
habitat of conservation interest under the Habitats Directive (Commission Of the European
Communities, 2007), but the habitat has not been recognised as occurring in Ireland. 2180 Wooded
dunes of the Atlantic, Continental and Boreal region can include natural woodland or long-
established semi-natural forests. Where dune woodland has developed spontaneously in Ireland, it
could be proposed for consideration under this category. The presence of scrub and trees is likely to
enhance the dunes as a resource for bird species (Fuller et al., 2004). Given the practical difficulties of
keeping livestock on sites with intensive amenity use, allowing succession from herbaceous
communities to woodland may be a viable alternative for selected locations on some sites. The
development of dune woodland at any site should be carefully planned and managed.
Figure 4.3: Scrub and woodland have developed due to past undergrazing at site 18 Mizen Head, Co. Wicklow.
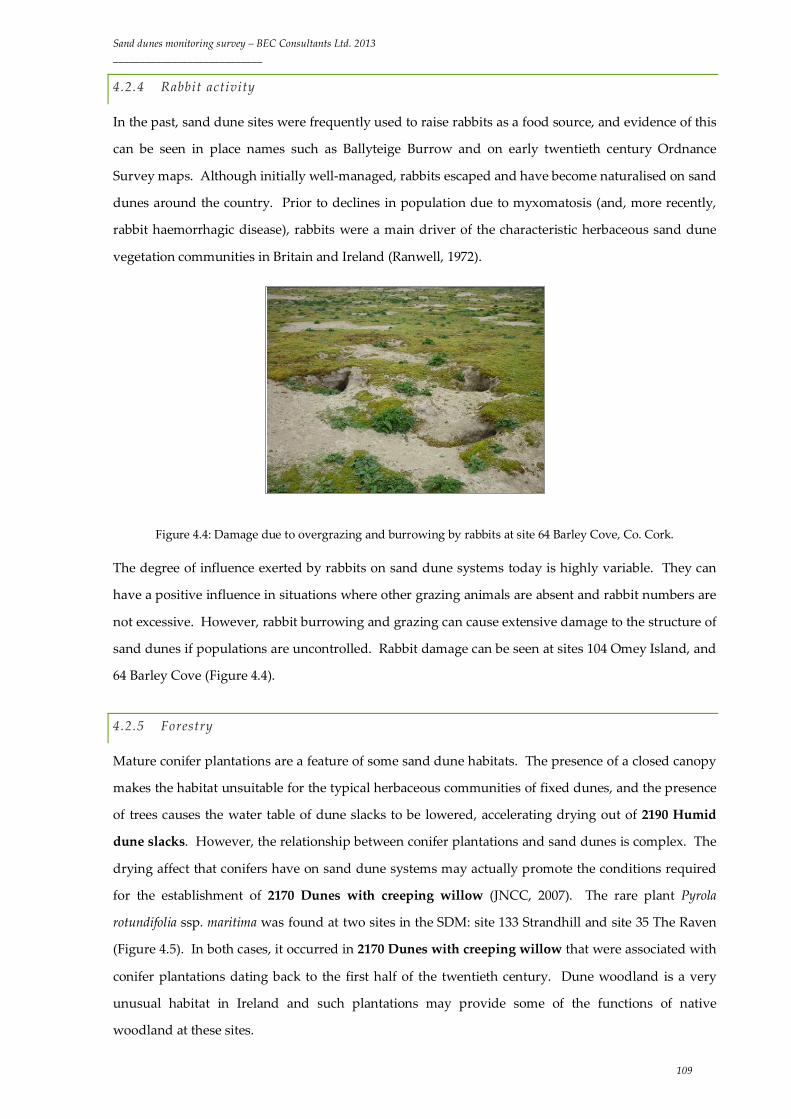
Sand dunes monitoring survey – BEC Consultants Ltd. 2013 ____________________________
109
4.2.4 Rabbit activity
In the past, sand dune sites were frequently used to raise rabbits as a food source, and evidence of this
can be seen in place names such as Ballyteige Burrow and on early twentieth century Ordnance
Survey maps. Although initially well-managed, rabbits escaped and have become naturalised on sand
dunes around the country. Prior to declines in population due to myxomatosis (and, more recently,
rabbit haemorrhagic disease), rabbits were a main driver of the characteristic herbaceous sand dune
vegetation communities in Britain and Ireland (Ranwell, 1972).
Figure 4.4: Damage due to overgrazing and burrowing by rabbits at site 64 Barley Cove, Co. Cork.
The degree of influence exerted by rabbits on sand dune systems today is highly variable. They can
have a positive influence in situations where other grazing animals are absent and rabbit numbers are
not excessive. However, rabbit burrowing and grazing can cause extensive damage to the structure of
sand dunes if populations are uncontrolled. Rabbit damage can be seen at sites 104 Omey Island, and
64 Barley Cove (Figure 4.4).
4.2.5 Forestry
Mature conifer plantations are a feature of some sand dune habitats. The presence of a closed canopy
makes the habitat unsuitable for the typical herbaceous communities of fixed dunes, and the presence
of trees causes the water table of dune slacks to be lowered, accelerating drying out of 2190 Humid
dune slacks. However, the relationship between conifer plantations and sand dunes is complex. The
drying affect that conifers have on sand dune systems may actually promote the conditions required
for the establishment of 2170 Dunes with creeping willow (JNCC, 2007). The rare plant Pyrola
rotundifolia ssp. maritima was found at two sites in the SDM: site 133 Strandhill and site 35 The Raven
(Figure 4.5). In both cases, it occurred in 2170 Dunes with creeping willow that were associated with
conifer plantations dating back to the first half of the twentieth century. Dune woodland is a very
unusual habitat in Ireland and such plantations may provide some of the functions of native
woodland at these sites.
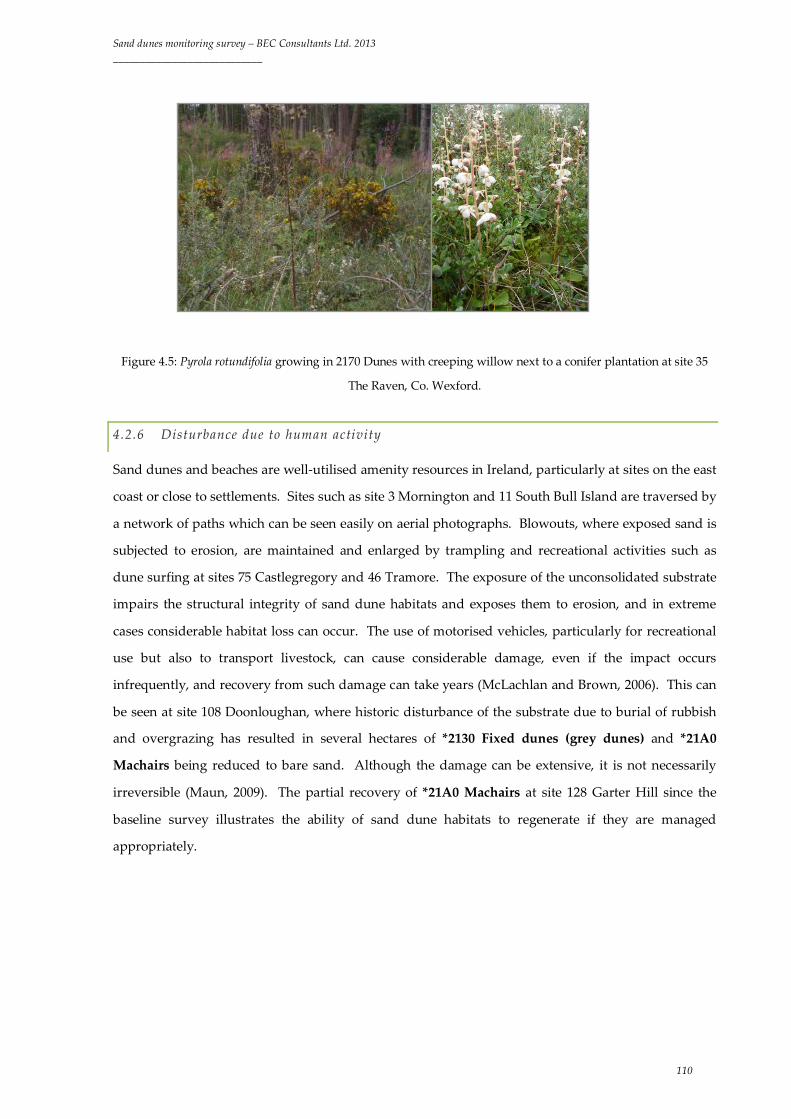
Sand dunes monitoring survey – BEC Consultants Ltd. 2013 ____________________________
110
Figure 4.5: Pyrola rotundifolia growing in 2170 Dunes with creeping willow next to a conifer plantation at site 35
The Raven, Co. Wexford.
4.2.6 Disturbance due to human activity
Sand dunes and beaches are well-utilised amenity resources in Ireland, particularly at sites on the east
coast or close to settlements. Sites such as site 3 Mornington and 11 South Bull Island are traversed by
a network of paths which can be seen easily on aerial photographs. Blowouts, where exposed sand is
subjected to erosion, are maintained and enlarged by trampling and recreational activities such as
dune surfing at sites 75 Castlegregory and 46 Tramore. The exposure of the unconsolidated substrate
impairs the structural integrity of sand dune habitats and exposes them to erosion, and in extreme
cases considerable habitat loss can occur. The use of motorised vehicles, particularly for recreational
use but also to transport livestock, can cause considerable damage, even if the impact occurs
infrequently, and recovery from such damage can take years (McLachlan and Brown, 2006). This can
be seen at site 108 Doonloughan, where historic disturbance of the substrate due to burial of rubbish
and overgrazing has resulted in several hectares of *2130 Fixed dunes (grey dunes) and *21A0
Machairs being reduced to bare sand. Although the damage can be extensive, it is not necessarily
irreversible (Maun, 2009). The partial recovery of *21A0 Machairs at site 128 Garter Hill since the
baseline survey illustrates the ability of sand dune habitats to regenerate if they are managed
appropriately.

Sand dunes monitoring survey – BEC Consultants Ltd. 2013 ____________________________
111
4.2.7 Climate change and coastal processes
Although not fully understood as yet, climate change can be expected to have a profound effect on
coastal systems. Sea level is predicted to rise by up to 90 cm worldwide by the year 2100 and extreme
weather events are expected to increase in frequency (McLachlan and Brown, 2006). Increased
mobility of dune systems can be expected in the long term, as can some loss of habitat. However,
sand dune systems are capable of persisting in the face of environmental changes. A study of sand
dune systems subject to sea level rise in Wales concluded that 14 of the 15 systems investigated had
continued to grow over the previous 100-120 years despite sea level rise (Saye and Pye, 2007). Sand
dune systems absorb considerable destructive wave energy and are important defences against storm
activity (Maun, 2009). Beaches that have been starved of sediment due to man-made constructions
will be at greater risk of erosion than those with a plentiful sand supply (McLachlan and Brown, 2006).
Where development has extended close to the coast, it can be expected that the range of sand dune
habitats will be reduced. The most extensive sand dune systems in Ireland tend to be distributed on
the west coast, where there is more potential for landward retreat of coastal habitats. Such landward
retreat of sand dune sediments has been seen at the Doñana National Park in Spain (Maun, 2009).
However, sand dune systems on the west coast are exposed to violent storm activity from the Atlantic,
and the massive erosion at site 68 Rossbehy shows the potential magnitude of the effects of such
storms (Figure 4.6).
Figure 4.6: Storm erosion at site 68 Rossbehy, Co. Kerry. Prior to 2010, the sand and shingle in the foreground
was part of a long, vegetated sand spit which was attached to the dunes visible in the distance.

Sand dunes monitoring survey – BEC Consultants Ltd. 2013 ____________________________
112
4.2.8 Invasive species
At sites surveyed during the SDM, the more stable, landward sand dune habitats are most prone to
invasion by exotic species. Non-native species may enter a habitat either accidentally (e.g. as garden
waste) or deliberately by planting. During the SDM, there was evidence that an attempt had been
made to introduce species into the dunes at site 124 Aghleam, where exotic species had been
deliberately planted in the fixed and mobile dunes, but there were no signs that the introduction was
becoming established there. Invasion of dune habitats by conifer species is a hazard where parts of
the dune system have been afforested, as at sites 133 Strandhill and 35 The Raven.
Figure 4.7: Hippophae rhamnoides in *2130 Fixed dunes (grey dunes) at site 75 Castlegregory, Co. Kerry.
2160 Dunes with Hippophae rhamnoides is an Annex I habitat elsewhere in Europe (Commission of
the European Communities, 2007), but Hippophae rhamnoides is not native to Ireland and forms dense,
monospecific stands on sand dunes. These dense stands crowd out native vegetation and help to
lower the water table. Hippophae rhamnoides has been planted deliberately, most frequently as a
measure against erosion. Attempts to remove it must be planned carefully to avoid exposing bare soil
to erosive winds. Large scrub thickets were noted at sites 9 Portmarnock, 10 North Bull Island, 11
South Bull Island, 17 Brittas Bay, 28 Cahore Point North, 75 Castlegregory, 155 Kincaslough and 162
Rinclevan during the SDM. Site 75 Castlegregory was particularly badly affected, and the area
affected was visibly greater than it had been during the CMP (Figure 4.7). Efforts to control the shrub
were visible at sites 10 North Bull Island, 155 Kincaslough and 162 Rinclevan.

Sand dunes monitoring survey – BEC Consultants Ltd. 2013 ____________________________
113
4.3 Constraints of the methodology
The changes made in the SDM to the methodology for assessing sand dune systems have reduced the
need for expert judgement and allowed for structural diversity in sand dunes. Some difficulties
remain, and these tend to be associated with the imposition of a rigid monitoring system on a
dynamic habitat. Dividing the sand dune systems into individual habitats allows the main
characteristics of successional stages to be described and assessed separately, but it does not account
for complex habitat mosaics or for gradual gradations between habitats. Criteria assessing flowering
and fruiting of plants and height of vegetation are subject to assessment at particular times of year,
and it is recommended that these criteria be altered in future so that they are more robust.
There were particular constraints affecting 1220 Perennial vegetation of stony banks, *2140
Decalcified Empetrum dunes, *2150 Decalcified dune heath and *21A0 Machairs.
4.3.1 1220 Perennial vegetation of stony banks
The definition of this habitat includes communities of large, stable shingle banks of upper beaches
such as those found in southern Wexford, as well as the more exposed beach-fringing communities
that were surveyed during the SDM. Beach-fringing communities tend to be less species rich than
communities of more stable shingle banks, and this was taken into account as far as possible in the
assessment methodology. However, the processes and impacts affecting larger, more stable shingle
banks are different from those which were included in the SDM. These differences should be taken
into account in the National Conservation Assessment for reporting to the European Commission.
4.3.2 *2140 Decalcified Empetrum dunes and *2150 Decalcified dune heath
Although the area of dune heath present at SDM sites and the impacts affecting dune heath were
recorded, a full conservation assessment could not be carried out as Structure and Functions data
were not recorded. These habitats are very unusual in Ireland, and parts of the habitats which had
been recorded previously in Ireland were found to consist of heath species growing on shallow,
calcareous sand overlying acidic rock. The herbaceous species in the vicinity suggested that the sand
retained calcareous material and the presence of heath species was related to the acidic rock rather
than decalcification of the sand. This type does not conform to the EU interpretation manual
definition of the habitat (Commission of the European Communities, 2007). They were mapped as
heath, and although they do not conform to dune heath, they can be included in the Annex I dry heath
habitat 4030 European dry heaths.
Sand dunes monitoring survey – BEC Consultants Ltd. 2013 ____________________________
114
4.3.3 *21A0 Machairs
*21A0 Machairs are difficult habitats to define and they share characteristics with *2130 Fixed dunes
(grey dunes) and 2190 Humid dune slacks. In some cases, it has been difficult to detect differences
between areas mapped as *21A0 Machairs in the CMP and the adjacent *2130 Fixed dunes (grey
dunes), 2190 Humid dune slacks or fen habitats. As a result, there was considerable change to the
boundaries of *21A0 Machairs as mapped in the CMP. At site 155, Kincaslough, the area previously
mapped as *21A0 Machairs was entirely remapped as *2130 Fixed dunes (grey dunes) because the
vegetation and structure of the habitat were very similar to that of the surrounding fixed dunes.
4.4 Other Annex I habitats which may occur in Ireland
In addition to the ten sand dune habitats documented in this report, a further two Annex I habitats
may occur: 2180 Wooded dunes of the Atlantic, Continental and Boreal region and *2250 Coastal
dunes with Juniperus spp. Native woodland was noted within or adjacent to fixed sand dunes at sites
18 Mizen Head and 175 Crummies Bay. Juniperus communis formations occurring on 2120 Marram
dunes (white dunes), *2130 Fixed dunes (grey dunes) and *21A0 Machairs have been included under
5130 Juniperus communis formations on heaths or calcareous grasslands (Cooper et al., 2012), but it is
possible that these could be better placed in the *2250 Coastal dunes with Juniperus spp. Recognising
these two habitats in Ireland would promote the management of woodlands and juniper scrub in the
context of sand dunes, taking into account the unique pressures and processes affecting coastal
habitats.

Sand dunes monitoring survey – BEC Consultants Ltd. 2013 ____________________________
115
References
Boorman, L., Londo, G. and van der Maarel, E. (1997) Communities of dune slacks. In: Dry Coastal Ecosystems,
part C. Ecosystems of the World (E. Van der Maarel, Ed.), 275-295. Elsevier, Amsterdam.
Commission of the European Communities (2006) Notes and guidelines - Reporting under Article 17 of the
Habitats Directive, Appendix 1 - Annexes of DocHab 04-03/03-Rev.3.
Commission of the European Communities (2007) Interpretation manual of European Union habitats – EUR27.
http://ec.europa.eu/environment/nature/legislation/habitatsdirective/docs/2007_07_im.pdf.
Cooper, F., Stone, R.E., McEvoy, P., Wilkins, T. and Reid, N. (2012) The conservation status of juniper
formations in Ireland. Irish Wildlife Manuals, No. 63 National Parks and Wildlife Service, Department of
Environment, Heritage and Local Government, Dublin, Ireland.
Crawford, I., Bleasdale, A. and Conaghan, J. (1996) BioMar survey of Irish machair sites. Irish Wildlife Manuals,
No. 3. National Parks and Wildlife Service, Department of the Environment, Heritage and Local
Government, Dublin, Ireland.
Curtis, T. (1991) The flora and vegetation of sand dunes in Ireland. In: A guide to the sand dunes of Ireland, (M.B.
Quigley, Ed.), 42-66. European Union for Coastal Conservation, Dublin.
Dargie, T. (1993) Sand dune vegetation survey of Great Britain: a national inventory. Part 2: Scotland. Joint Nature
Conservation Council, Peterborough.
Dargie, T. (1995) Sand dune vegetation survey of Great Britain: a national inventory. Part 3: Wales. Joint Nature
Conservation Council, Peterborough.
Devaney, F. (2007) The Alder Marsh: Ecohydrology and restoration prospects of a desiccating dune slack. Ph.D.
Thesis, University College Dublin.
Ellmauer, T. (2010) Future prospects: Draft discussion paper for the expert group on reporting under the
Nature Directives. http://circa.europa.eu/Public/irc/env/monnat/library?l=/expert_
reporting/workpackage_revision/sub-group_papers/future_prospects/prospects_june 2010pdf/
_EN_1.0_&a=d. Accessed in 2010.
Evans, D. and Arvela, M. (2011) Assessment and reporting under the Habitats Directive. European Topic Centre
on Biological Diversity. Paris, France. http://circa.europa. eu/Public/irc/env/monnat/library
?l=/habitats_reporting/reporting_2007-2012/reporting_ guidelines/guidelines-finalpdf/_EN_1.0_& a=d.
Fossitt, J. (2000) A guide to habitats in Ireland. The Heritage Council, Kilkenny.
Fuller, R. J., Hinsley, S. A. and Swetnam, R. D. (2004) The relevance of non-farmland habitats, uncropped
areas and habitat diversity to the conservation of farmland birds. Ibis, 146: 22–31. doi: 10.1111/j.1474-
919X.2004.00357.x.
Sand dunes monitoring survey – BEC Consultants Ltd. 2013 ____________________________
116
Gaynor, K. (2006) The vegetation of Irish machair. Biology and Environment: Proceedings of the Royal Irish
Academy, 106B (3): 311-321.
Gaynor, K. (2008) The phytosociology and conservation value of Irish sand dunes. Ph.D. Thesis, University College
Dublin.
Heslenfeld, P., Jungerius, P. D. and Klijn, J. A. (2008) European Coastal Dunes: Ecological Values, Threats,
Opportunities and Policy Development. Ecological Studies Volume 171, 2008, pp 335-351.
Howe, M.A., Knight, G. T. and Clee, C. (2009) The importance of coastal dunes for terrestrial invertebrates
with particular reference to aculeate Hymenoptera (bees, wasps & ants), Journal of Coastal Conservation,
June 2010, 14(2) pp 91-102.
JNCC (2004a) Common standards monitoring guidance for sand dune habitats. Joint Nature Conservation Council,
Peterborough.
JNCC (2004b) Common standards monitoring guidance for lowland heathland. Joint Nature Conservation Council,
Peterborough.
JNCC (2007) Second Report by the UK under Article 17 on the implementation of the Habitats Directive from
January 2001 to December 2006. Peterborough: JNCC. Available from: www.jncc.gov.uk/article17.
Maun, A. (2009) The biology of coastal sand dunes, Oxford University Press, Oxford, UK.
McLachlan, A. and Brown, A.C. (2006) The ecology of sandy shores, 2nd ed. Elsevier, London, UK.
Moore, D. and Wilson, F. (1999) National shingle beach survey of Ireland 1999: Synoptic report. A report submitted
to the National Parks and Wildlife Service, Dublin.
NPWS (2008) The status of EU protected habitats and species in Ireland. A report by the National Parks and
Wildlife Service, Dublin.
O’Neill, F.H., Martin, J.R, Devaney, F.M., McNutt, K.E., Perrin, P.M. and Delaney, A. (2010) Irish semi-natural
grasslands survey Annual Report No. 3: Counties Donegal, Dublin, Kildare and Sligo. Unpublished report
submitted to National Parks and Wildlife Service, Dublin.
Quigley, M.B. (1991) Introduction. In: A guide to the sand dunes of Ireland, (M.B. Quigley, Ed.), 1-5. European
Union for Coastal Conservation, Dublin.
Radley, G. (1994) Sand dune vegetation survey of Great Britain: Part 1: England. Joint Nature Conservation
Council, Peterborough.
Ranwell, D.S. (1972) Ecology of saltmarshes and sand dunes, Chapman and Hall, London.
Ryle, T., Murray, A., Connolly, K. and Swann, M. (2009) Coastal Monitoring Project 2004-2006. A report
submitted to the National Parks and Wildlife Service, Dublin.
Saye, S.E. and Pye, K. (2007) Implications of sea level rise for coastal dune habitat conservation in Wales, UK.
Journal of Coastal Conservation, 11, 31-52.

Sand dunes monitoring survey – BEC Consultants Ltd. 2013 ____________________________
117
Ssymank, A. (2010) Reference list threats, pressures and activities (final version).
http://circa.europa.eu/Public/irc/env/monnat/library?l=/expert_reporting/work-package_ revision/sub-
group_papers/pressures_-threats(vm=detailed&sb=Title. Accessed March 2011.

Sand dunes monitoring survey – BEC Consultants Ltd. 2013 ____________________________
118
Appendix I: Structure and functions assessment sheets for
eight EU Annex I sand dune habitats
The eight Annex I sand dune habitats are presented in the order:
1210 Annual vegetation of drift lines
1220 Perennial vegetation of stony banks
2110 Embryonic shifting dunes
2120 Shifting dunes along the shoreline with Ammophila arenaria (white dunes)
*2130 Fixed coastal dunes with herbaceous vegetation (grey dunes)
2170 Dunes with Salix repens ssp. argentea (Salicion arenariae)
2190 Humid dune slacks
*21A0 Machairs
* indicates a priority habitat
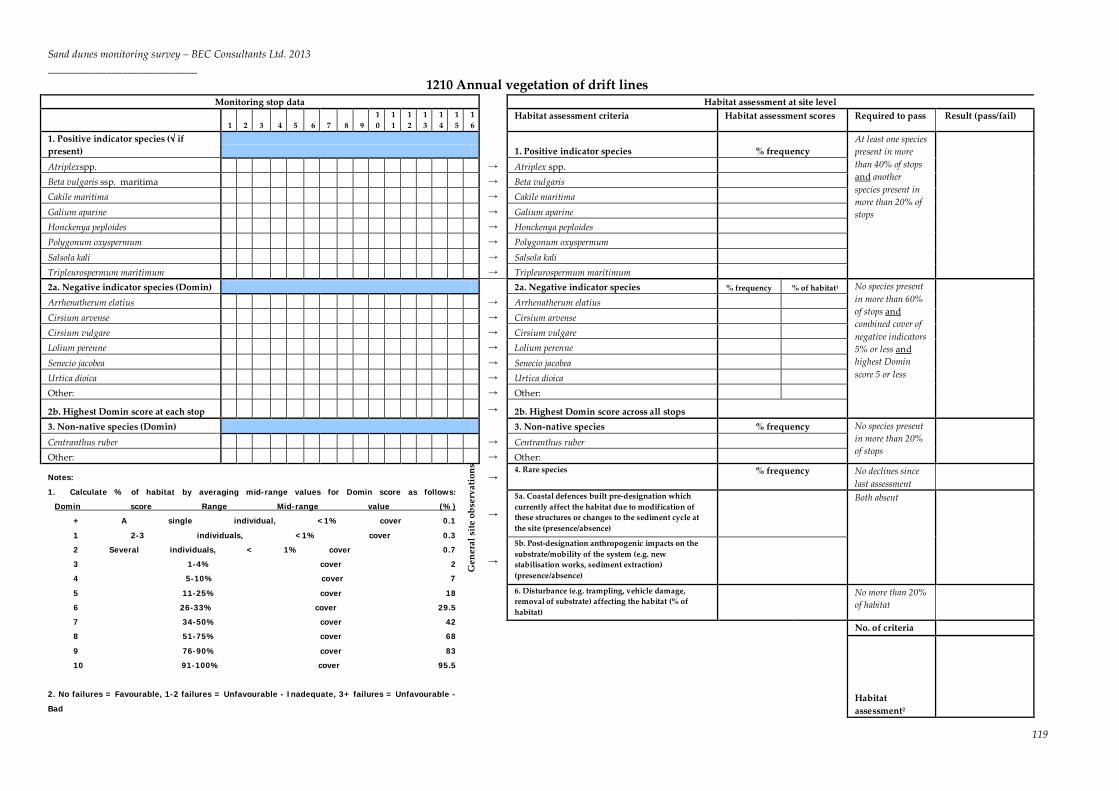
Sand dunes monitoring survey – BEC Consultants Ltd. 2013 ____________________________
119
1210 Annual vegetation of drift lines Monitoring stop data
Habitat assessment at site level
1 2 3 4 5 6 7 8 9 10
11
12
13
14
15
16
Habitat assessment criteria Habitat assessment scores Required to pass Result (pass/fail)
1. Positive indicator species (√ if present) 1. Positive indicator species % frequency
At least one species present in more than 40% of stops and another species present in more than 20% of stops
Atriplexspp. → Atriplex spp. Beta vulgaris ssp. maritima → Beta vulgaris Cakile maritima → Cakile maritima Galium aparine → Galium aparine Honckenya peploides → Honckenya peploides Polygonum oxyspermum → Polygonum oxyspermum Salsola kali → Salsola kali Tripleurospermum maritimum → Tripleurospermum maritimum 2a. Negative indicator species (Domin) 2a. Negative indicator species % frequency % of habitat1 No species present
in more than 60% of stops and combined cover of negative indicators 5% or less and highest Domin score 5 or less
Arrhenatherum elatius → Arrhenatherum elatius Cirsium arvense → Cirsium arvense Cirsium vulgare → Cirsium vulgare Lolium perenne → Lolium perenne Senecio jacobea → Senecio jacobea Urtica dioica → Urtica dioica Other: → Other:
2b. Highest Domin score at each stop → 2b. Highest Domin score across all stops 3. Non-native species (Domin) 3. Non-native species % frequency No species present
in more than 20% of stops
Centranthus ruber → Centranthus ruber Other: → Other:
Notes:
1. Calculate % of habitat by averaging mid-range values for Domin score as follows:
Domin score Range Mid-range value (%)
+ A single individual, <1% cover 0.1
1 2-3 individuals, <1% cover 0.3
2 Several individuals, < 1% cover 0.7
3 1-4% cover 2
4 5-10% cover 7
5 11-25% cover 18
6 26-33% cover 29.5
7 34-50% cover 42
8 51-75% cover 68
9 76-90% cover 83
10 91-100% cover 95.5
2. No failures = Favourable, 1-2 failures = Unfavourable - Inadequate, 3+ failures = Unfavourable -
Bad
Gen
eral
site
obs
erva
tion
s →
4. Rare species % frequency No declines since last assessment
→
5a. Coastal defences built pre-designation which currently affect the habitat due to modification of these structures or changes to the sediment cycle at the site (presence/absence)
Both absent
→
5b. Post-designation anthropogenic impacts on the substrate/mobility of the system (e.g. new stabilisation works, sediment extraction) (presence/absence)
6. Disturbance (e.g. trampling, vehicle damage, removal of substrate) affecting the habitat (% of habitat)
No more than 20% of habitat
No. of criteria
Habitat assessment2
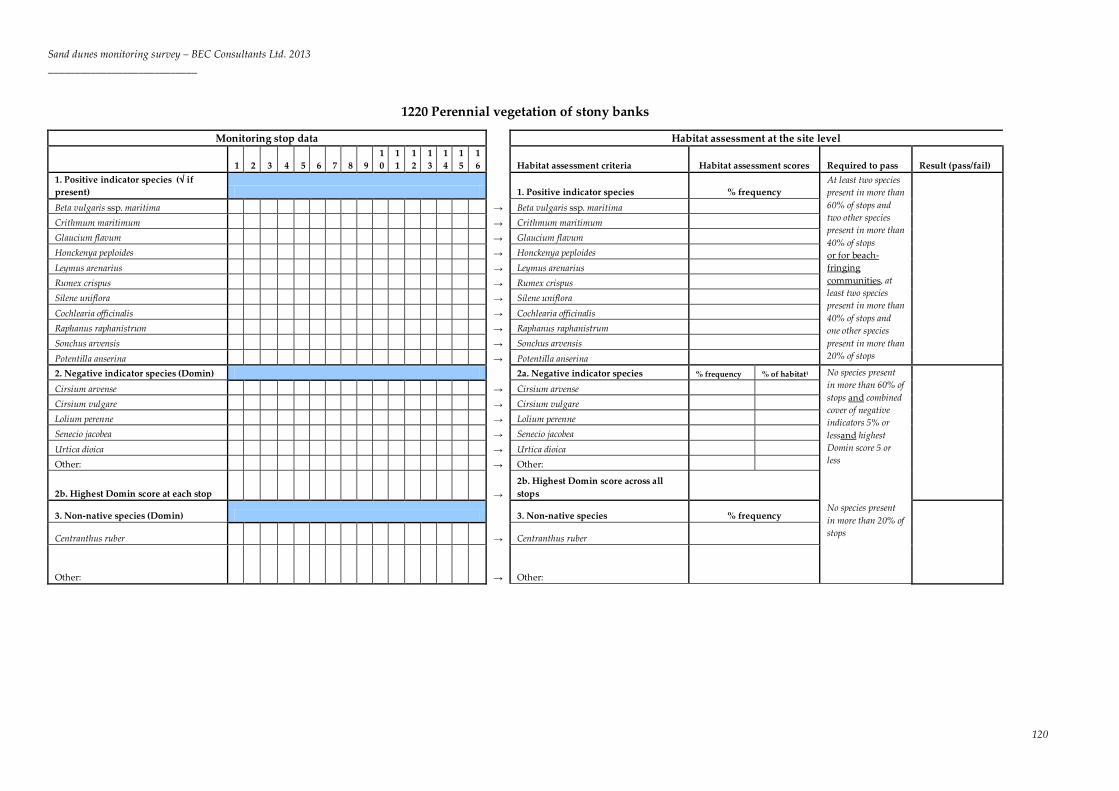
Sand dunes monitoring survey – BEC Consultants Ltd. 2013 ____________________________
120
1220 Perennial vegetation of stony banks
Monitoring stop data Habitat assessment at the site level
1 2 3 4 5 6 7 8 9 10
11
12
13
14
15
16 Habitat assessment criteria Habitat assessment scores Required to pass Result (pass/fail)
1. Positive indicator species (√ if present) 1. Positive indicator species % frequency
At least two species present in more than 60% of stops and two other species present in more than 40% of stops or for beach-fringing communities, at least two species present in more than 40% of stops and one other species present in more than 20% of stops
Beta vulgaris ssp. maritima → Beta vulgaris ssp. maritima Crithmum maritimum → Crithmum maritimum Glaucium flavum → Glaucium flavum Honckenya peploides → Honckenya peploides Leymus arenarius → Leymus arenarius Rumex crispus → Rumex crispus Silene uniflora → Silene uniflora Cochlearia officinalis → Cochlearia officinalis Raphanus raphanistrum → Raphanus raphanistrum Sonchus arvensis → Sonchus arvensis Potentilla anserina → Potentilla anserina 2. Negative indicator species (Domin) 2a. Negative indicator species % frequency % of habitat1 No species present
in more than 60% of stops and combined cover of negative indicators 5% or lessand highest Domin score 5 or less
Cirsium arvense → Cirsium arvense Cirsium vulgare → Cirsium vulgare Lolium perenne → Lolium perenne Senecio jacobea → Senecio jacobea Urtica dioica → Urtica dioica Other: → Other:
2b. Highest Domin score at each stop → 2b. Highest Domin score across all stops
3. Non-native species (Domin) 3. Non-native species % frequency No species present in more than 20% of stops
Centranthus ruber → Centranthus ruber
Other: → Other:
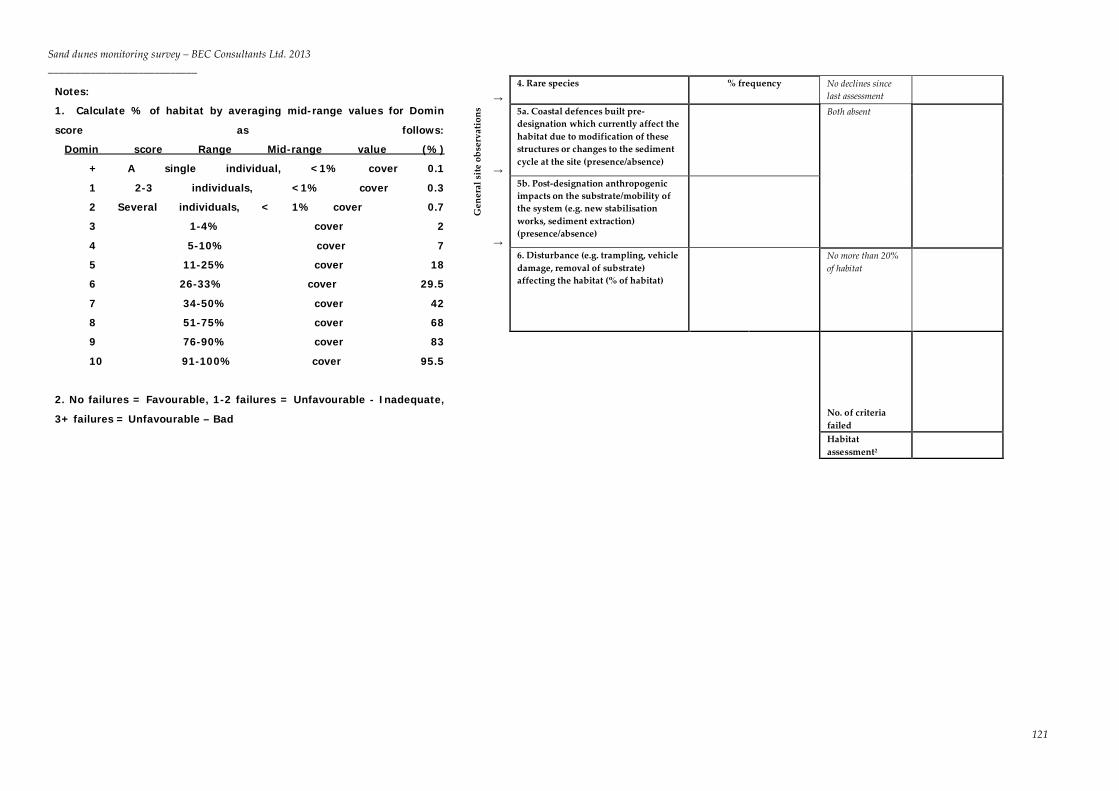
Sand dunes monitoring survey – BEC Consultants Ltd. 2013 ____________________________
121
Notes:
1. Calculate % of habitat by averaging mid-range values for Domin
score as follows:
Domin score Range Mid-range value (%)
+ A single individual, <1% cover 0.1
1 2-3 individuals, <1% cover 0.3
2 Several individuals, < 1% cover 0.7
3 1-4% cover 2
4 5-10% cover 7
5 11-25% cover 18
6 26-33% cover 29.5
7 34-50% cover 42
8 51-75% cover 68
9 76-90% cover 83
10 91-100% cover 95.5
2. No failures = Favourable, 1-2 failures = Unfavourable - Inadequate,
3+ failures = Unfavourable – Bad
Gen
eral
site
obs
erva
tion
s
→ 4. Rare species % frequency No declines since
last assessment
→
5a. Coastal defences built pre-designation which currently affect the habitat due to modification of these structures or changes to the sediment cycle at the site (presence/absence)
Both absent
→
5b. Post-designation anthropogenic impacts on the substrate/mobility of the system (e.g. new stabilisation works, sediment extraction) (presence/absence)
6. Disturbance (e.g. trampling, vehicle damage, removal of substrate) affecting the habitat (% of habitat)
No more than 20% of habitat
No. of criteria failed
Habitat assessment2

Sand dunes monitoring survey – BEC Consultants Ltd. 2013 ____________________________
122
2110 Embryonic shifting dunes Monitoring stop data Habitat assessment for the site
1 2 3 4 5 6 7 8 9 10
11
12
13
14
15
16 Habitat assessment criteria Habitat assessment scores Required to pass
Result (pass/fail)
1. Positive indicator species (√ if present) 1. Positive indicator species % frequency At least one species present in more than 40% of stops
Elytrigia juncea → Elytrigia juncea Leymus arenarius → Leymus arenarius
2a. Negative indicator species (Domin) 2a. Negative indicator species % frequency % of habitat1 No species present in more than 60% of stops and combined cover of negative indicators 5% or less and highest Domin score 5 or less
Arrhenatherum elatius → Arrhenatherum elatius
Cirsium arvense → Cirsium arvense
Cirsium vulgare → Cirsium vulgare
Lolium perenne → Lolium perenne
Senecio jacobea → Senecio jacobea
Urtica dioica → Urtica dioica
Other: → Other:
Other: → Other:
2b. Highest Domin score at each stop → 2b. Highest Domin score across all stops
3. Non-native species (Domin) 3. Non-native species % frequency No species present in more than 20% of stops
Name of species: → Name of species: Name of species: → Name of species:
4. Green shoots and flowering in flowering season (√ if present)
→ 4. Flowering/fruiting of Elytrigia juncea or Leymus arenarius (% frequency)
Observed in more than 40% of stops
Notes:
1. Calculate % of habitat by averaging mid-range values for Domin score as follows:
Domin score Range Mid-range value (%)
+ A single individual, <1% cover 0.1
1 2-3 individuals, <1% cover 0.3
2 Several individuals, < 1% cover 0.7
3 1-4% cover 2
4 5-10% cover 7
5 11-25% cover 18
6 26-33% cover 29.5
7 34-50% cover 42
8 51-75% cover 68
9 76-90% cover 83
10 91-100% cover 95.5
2. No failures = Favourable, 1-2 failures = Unfavourable - Inadequate, 3+ failures = Unfavourable – Bad
Gen
eral
site
obs
erva
tion
s → 5. Rare species % frequency No declines since the last assessment
→
6a. Coastal defences built pre-designation which currently affect the habitat due to modification of these structures or changes to the sediment cycle at the site (presence/absence)
Both absent
→
6b. Post-designation anthropogenic impacts on the substrate/mobility of the system (e.g. new stabilisation works, sediment extraction) (presence/absence)
7. Disturbance (e.g. trampling, vehicle damage, removal of substrate) affecting the habitat (% of habitat)
No more than 20% of habitat
No. of criteria failed
Habitat assessment2

Sand dunes monitoring survey – BEC Consultants Ltd. 2013 ____________________________
123
2120 Shifting dunes along the shore with Ammophila arenaria (white dunes) Monitoring stop data Habitat assessment for the site
1 2 3 4 5 6 7 8 9 10
11
12
13
14
15
16 Habitat assessment criteria Habitat assessment scores Required to pass
Result (pass/fail)
1. Positive indicator species (√ if present) 1. Positive indicator species % frequency At least one species present in more than 40% of stops
Ammophila arenaria → Ammophila arenaria Elytrigia juncea → Elytrigia juncea Leymus arenarius → Leymus arenarius
2a. Negative indicator species (Domin) 2a. Negative indicator species %
frequency % of habitat1 No species present in more than 60% of stops and combined cover of negative indicators 5% or less and highest Domin score 5 or less
Arrhenatherum elatius → Arrhenatherum elatius Cirsium arvense → Cirsium arvense Cirsium vulgare → Cirsium vulgare Lolium perenne → Lolium perenne Senecio jacobea → Senecio jacobea Urtica dioica → Urtica dioica Other: → Other: Other: → Other: 2b. Highest Domin score at each stop → 2b. Highest Domin score across all stops 3. Non-native species (Domin) 3. Non-native species % frequency No species present
in more than 20% of stops
Name of species: → Name of species: Name of species: → Name of species: 4. Green shoots and flowering in flowering season (√ if present)
→
4. Healthy shoots and flowering/fruiting of A. arenaria, E. juncea or L. arenariusaccording to season (% frequency)
Observed in more than 40% of stops
Notes: 1. Calculate % of habitat by averaging mid-range values for Domin score as follows: Domin score Range Mid-range value (%) + A single individual, <1% cover 0.1 1 2-3 individuals, <1% cover 0.3 2 Several individuals, < 1% cover 0.7 3 1-4% cover 2 4 5-10% cover 7 5 11-25% cover 18 6 26-33% cover 29.5 7 34-50% cover 42 8 51-75% cover 68 9 76-90% cover 83 10 91-100% cover 95.5 2. No failures = Favourable, 1-2 failures = Unfavourable - Inadequate, 3+ failures = Unfavourable – Bad
G
ener
al s
ite o
bser
vati
ons →
5. Rare species % frequency No declines since the last assessment.
→
6a. Coastal defences built pre-designation which currently affect the habitat due to modification of these structures or changes to the sediment cycle at the site (presence/absence)
Both absent
→
6b. Post-designation anthropogenic impacts on the substrate/mobility of the system (e.g. new stabilisation works, sediment extraction) (presence/absence)
7. Disturbance (e.g. trampling, vehicle damage, removal of substrate) affecting the habitat (% of habitat)
No more than 20% of habitat
No. of criteria failed
Habitat assessment2
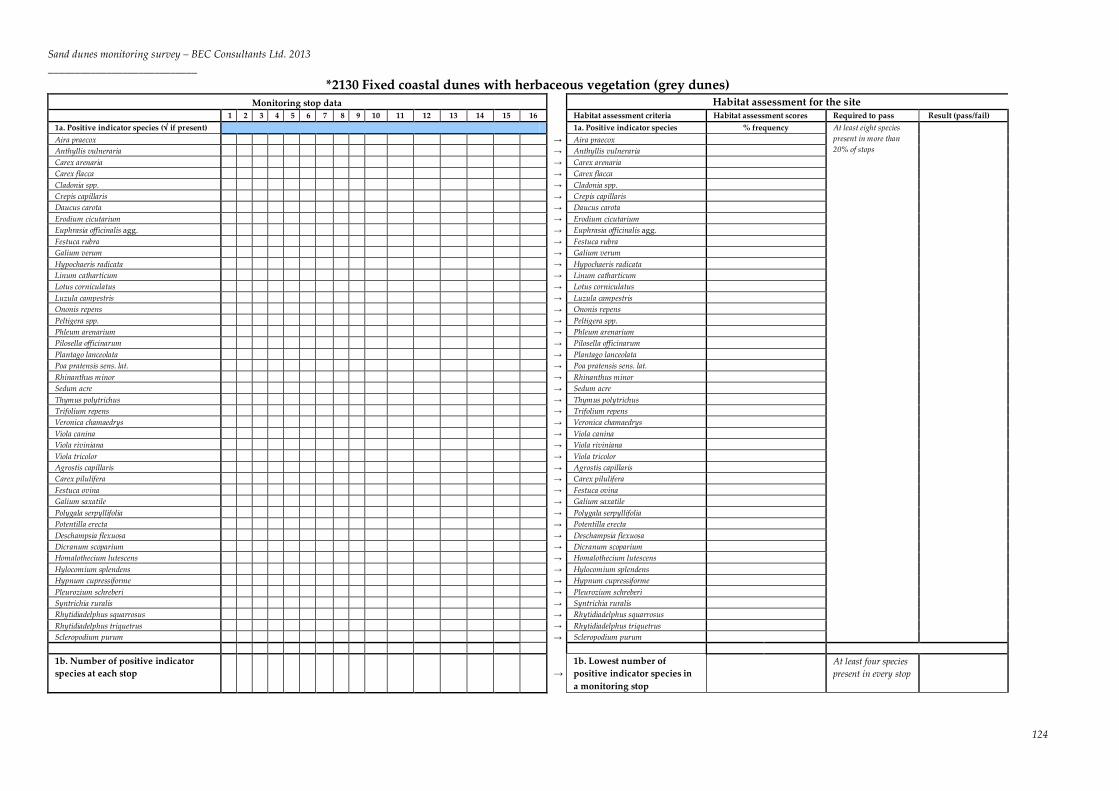
Sand dunes monitoring survey – BEC Consultants Ltd. 2013 ____________________________
124
*2130 Fixed coastal dunes with herbaceous vegetation (grey dunes) Monitoring stop data Habitat assessment for the site
1 2 3 4 5 6 7 8 9 10 11 12 13 14 15 16 Habitat assessment criteria Habitat assessment scores Required to pass Result (pass/fail) 1a. Positive indicator species (√ if present) 1a. Positive indicator species % frequency At least eight species
present in more than 20% of stops
Aira praecox → Aira praecox Anthyllis vulneraria → Anthyllis vulneraria Carex arenaria → Carex arenaria Carex flacca → Carex flacca Cladonia spp. → Cladonia spp. Crepis capillaris → Crepis capillaris Daucus carota → Daucus carota Erodium cicutarium → Erodium cicutarium Euphrasia officinalis agg. → Euphrasia officinalis agg. Festuca rubra → Festuca rubra Galium verum → Galium verum Hypochaeris radicata → Hypochaeris radicata Linum catharticum → Linum catharticum Lotus corniculatus → Lotus corniculatus Luzula campestris → Luzula campestris Ononis repens → Ononis repens Peltigera spp. → Peltigera spp. Phleum arenarium → Phleum arenarium Pilosella officinarum → Pilosella officinarum Plantago lanceolata → Plantago lanceolata Poa pratensis sens. lat. → Poa pratensis sens. lat. Rhinanthus minor → Rhinanthus minor Sedum acre → Sedum acre Thymus polytrichus → Thymus polytrichus Trifolium repens → Trifolium repens Veronica chamaedrys → Veronica chamaedrys Viola canina → Viola canina Viola riviniana → Viola riviniana Viola tricolor → Viola tricolor Agrostis capillaris → Agrostis capillaris Carex pilulifera → Carex pilulifera Festuca ovina → Festuca ovina Galium saxatile → Galium saxatile Polygala serpyllifolia → Polygala serpyllifolia Potentilla erecta → Potentilla erecta Deschampsia flexuosa → Deschampsia flexuosa Dicranum scoparium → Dicranum scoparium Homalothecium lutescens → Homalothecium lutescens Hylocomium splendens → Hylocomium splendens Hypnum cupressiforme → Hypnum cupressiforme Pleurozium schreberi → Pleurozium schreberi Syntrichia ruralis → Syntrichia ruralis Rhytidiadelphus squarrosus → Rhytidiadelphus squarrosus Rhytidiadelphus triquetrus → Rhytidiadelphus triquetrus Scleropodium purum → Scleropodium purum 1b. Number of positive indicator species at each stop
→
1b. Lowest number of positive indicator species in a monitoring stop
At least four species present in every stop

Sand dunes monitoring survey – BEC Consultants Ltd. 2013 ____________________________
125
2a. Negative indicator species (Domin)
2a. Negative indicator species
% frequency
% of habitat1
No species present in more than 60% of stops and combined cover of negative indicators 5% or less and highest Domin score 5 or less
Cirsium arvense → Cirsium arvense Cirsium vulgare → Cirsium vulgare Lolium perenne → Lolium perenne Pteridium aquilinum → Pteridium aquilinum Senecio jacobea → Senecio jacobea Pteridium aquilinum → Pteridium aquilinum Rosa spp. → Rosa spp. Rubus fruticosus agg. → Rubus fruticosus agg. Urtica dioica → Urtica dioica Other: → Other:
2b. Highest Domin score at each stop →
2b. Highest Domin score across all stops
3. Non-native species (Domin within 20m radius) 3. Non-native species % frequency
No species present in more than 20% of stops
Name of species: → Name of species: Name of species: → Name of species: 4. Cover of trees and scrub other than Juniperus (Domin within20m radius)
→
4a. Cover of trees and scrub other than Juniperus (% frequency)
Trees and scrub not recorded at more than 60% of stops and combined cover of 5% or less
4b. Cover of trees and scrub other than Juniperus (% of habitat1)
5. Trees/saplings from adjacent plantations (Domin within 20m radius)
→ 5. Trees/saplings from adjacent plantations (% frequency)
Present at not more than 20% of stops
6. Height of vegetation (cm)
→
6. Height of vegetation: stops with height 2-10 cm (%)
30-70% of stops with appropriate vegetation height
7. Flowering and fruiting of any positive indicator species (√ if present)
→ 7. Flowering and fruiting of any positive indicator species (% frequency)
Present in 40% or more of stops

Sand dunes monitoring survey – BEC Consultants Ltd. 2013 ____________________________
126
8. Bare sand (Domin)
→ 8a. Bare sand (% of habitat from stops1)
Present but total area not more than10%
Gen
eral
site
obs
erva
tion
s
→ 8b. Bare sand (% of habitat from map3)
9. Rare species % frequency in habitat No declines since
last assessment
→
10a. Coastal defences built pre-designation which currently affect the habitat due to modification of these structures or changes to the sediment cycle at the site (presence/absence)
Both absent
→
10b. Post-designation anthropogenic impacts on the substrate/mobility of the system (e.g. new stabilisation works, sediment extraction) (presence/absence)
→
11. Disturbance (e.g. trampling, vehicle damage, removal of substrate) affecting the habitat (% of habitat)
No more than 20% of habitat
No. of criteria failed
Habitat assessment2
Notes :
1. Calculate % of habitat by averaging mid-range values for Domin score as follows:
Domin score Range Mid-range value (%)
+ A single individual, <1% cover 0.1
1 2-3 individuals, <1% cover 0.3
2 Several individuals, < 1% cover 0.7
3 1-4% cover 2
4 5-10% cover 7
5 11-25% cover 18
6 26-33% cover 29.5
7 34-50% cover 42
8 51-75% cover 68
9 76-90% cover 83
10 91-100% cover 95.5
2. No failures = Favourable, 1-2 failures = Unfavourable - Inadequate, 3+ failures = Unfavourable -
Bad
3. Calculate the area of bare ground within the habitat at a site level by totalling the areas mapped
as bare ground
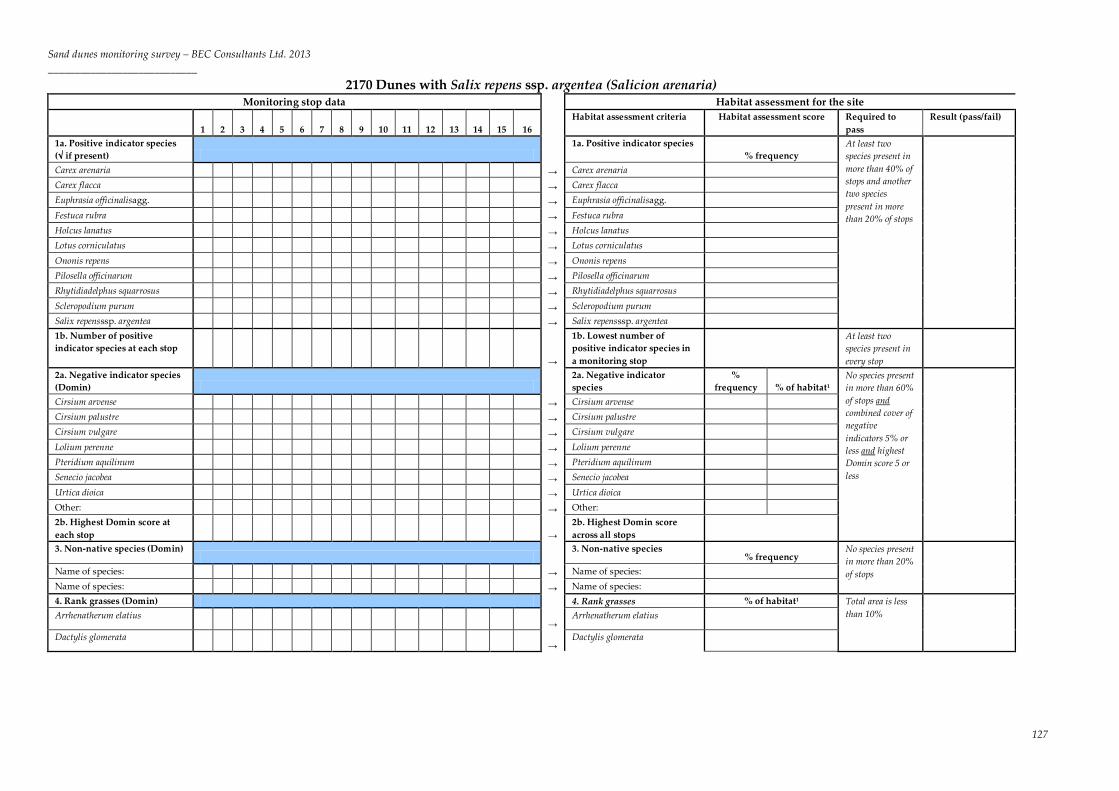
Sand dunes monitoring survey – BEC Consultants Ltd. 2013 ____________________________
127
2170 Dunes with Salix repens ssp. argentea (Salicion arenaria) Monitoring stop data Habitat assessment for the site
1 2 3 4 5 6 7 8 9 10 11 12 13 14 15 16 Habitat assessment criteria Habitat assessment score Required to
pass Result (pass/fail)
1a. Positive indicator species (√ if present)
1a. Positive indicator species % frequency
At least two species present in more than 40% of stops and another two species present in more than 20% of stops
Carex arenaria → Carex arenaria Carex flacca → Carex flacca Euphrasia officinalisagg. → Euphrasia officinalisagg. Festuca rubra → Festuca rubra Holcus lanatus → Holcus lanatus Lotus corniculatus → Lotus corniculatus Ononis repens → Ononis repens Pilosella officinarum → Pilosella officinarum Rhytidiadelphus squarrosus → Rhytidiadelphus squarrosus Scleropodium purum → Scleropodium purum Salix repensssp. argentea → Salix repensssp. argentea 1b. Number of positive indicator species at each stop
→
1b. Lowest number of positive indicator species in a monitoring stop
At least two species present in every stop
2a. Negative indicator species (Domin)
2a. Negative indicator species
% frequency % of habitat1
No species present in more than 60% of stops and combined cover of negative indicators 5% or less and highest Domin score 5 or less
Cirsium arvense → Cirsium arvense Cirsium palustre → Cirsium palustre Cirsium vulgare → Cirsium vulgare Lolium perenne → Lolium perenne Pteridium aquilinum → Pteridium aquilinum Senecio jacobea → Senecio jacobea Urtica dioica → Urtica dioica Other: → Other: 2b. Highest Domin score at each stop →
2b. Highest Domin score across all stops
3. Non-native species (Domin)
3. Non-native species % frequency
No species present in more than 20% of stops
Name of species: → Name of species: Name of species: → Name of species: 4. Rank grasses (Domin) 4. Rank grasses % of habitat1 Total area is less
than 10%
Arrhenatherum elatius →
Arrhenatherum elatius
Dactylis glomerata →
Dactylis glomerata
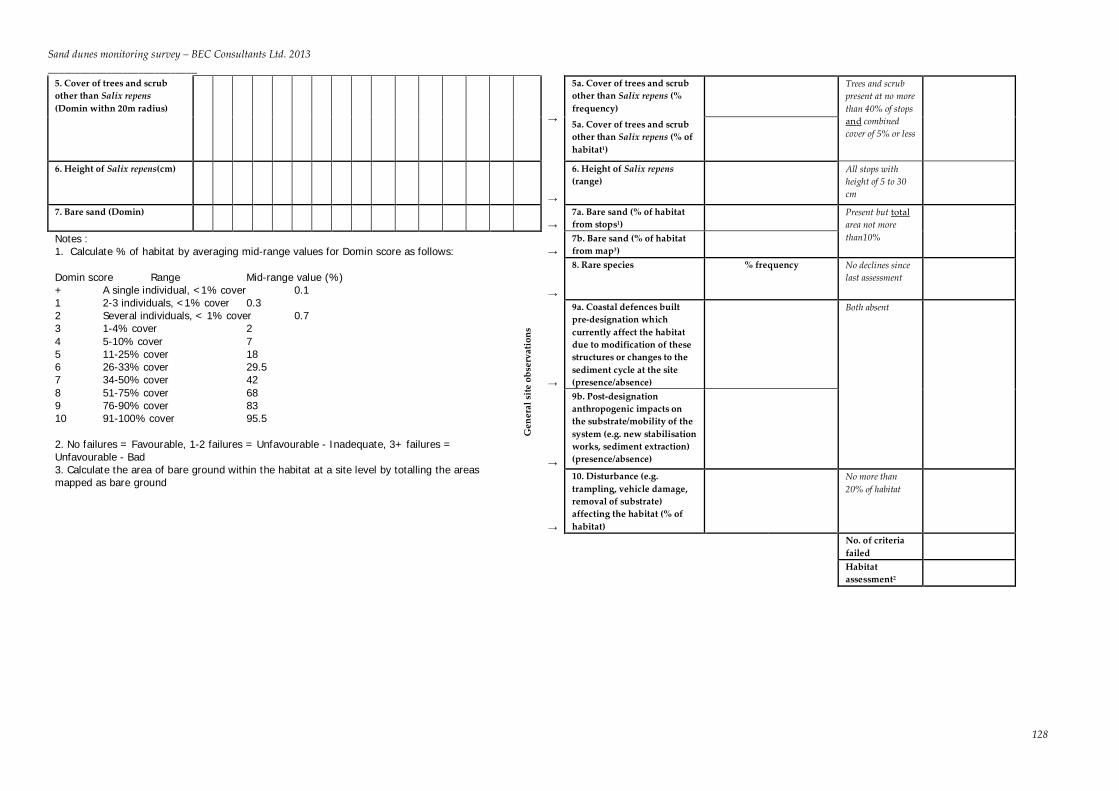
Sand dunes monitoring survey – BEC Consultants Ltd. 2013 ____________________________
128
5. Cover of trees and scrub other than Salix repens (Domin withn 20m radius)
→
5a. Cover of trees and scrub other than Salix repens (% frequency)
Trees and scrub present at no more than 40% of stops and combined cover of 5% or less
5a. Cover of trees and scrub other than Salix repens (% of habitat1)
6. Height of Salix repens(cm)
→
6. Height of Salix repens (range)
All stops with height of 5 to 30 cm
7. Bare sand (Domin) →
7a. Bare sand (% of habitat from stops1)
Present but total area not more than10%
Notes : 1. Calculate % of habitat by averaging mid-range values for Domin score as follows: Domin score Range Mid-range value (%) + A single individual, <1% cover 0.1 1 2-3 individuals, <1% cover 0.3 2 Several individuals, < 1% cover 0.7 3 1-4% cover 2 4 5-10% cover 7 5 11-25% cover 18 6 26-33% cover 29.5 7 34-50% cover 42 8 51-75% cover 68 9 76-90% cover 83 10 91-100% cover 95.5 2. No failures = Favourable, 1-2 failures = Unfavourable - Inadequate, 3+ failures = Unfavourable - Bad 3. Calculate the area of bare ground within the habitat at a site level by totalling the areas mapped as bare ground
Gen
eral
site
obs
erva
tion
s
→ 7b. Bare sand (% of habitat from map3)
→
8. Rare species % frequency No declines since last assessment
→
9a. Coastal defences built pre-designation which currently affect the habitat due to modification of these structures or changes to the sediment cycle at the site (presence/absence)
Both absent
→
9b. Post-designation anthropogenic impacts on the substrate/mobility of the system (e.g. new stabilisation works, sediment extraction) (presence/absence)
→
10. Disturbance (e.g. trampling, vehicle damage, removal of substrate) affecting the habitat (% of habitat)
No more than 20% of habitat
No. of criteria failed
Habitat assessment2
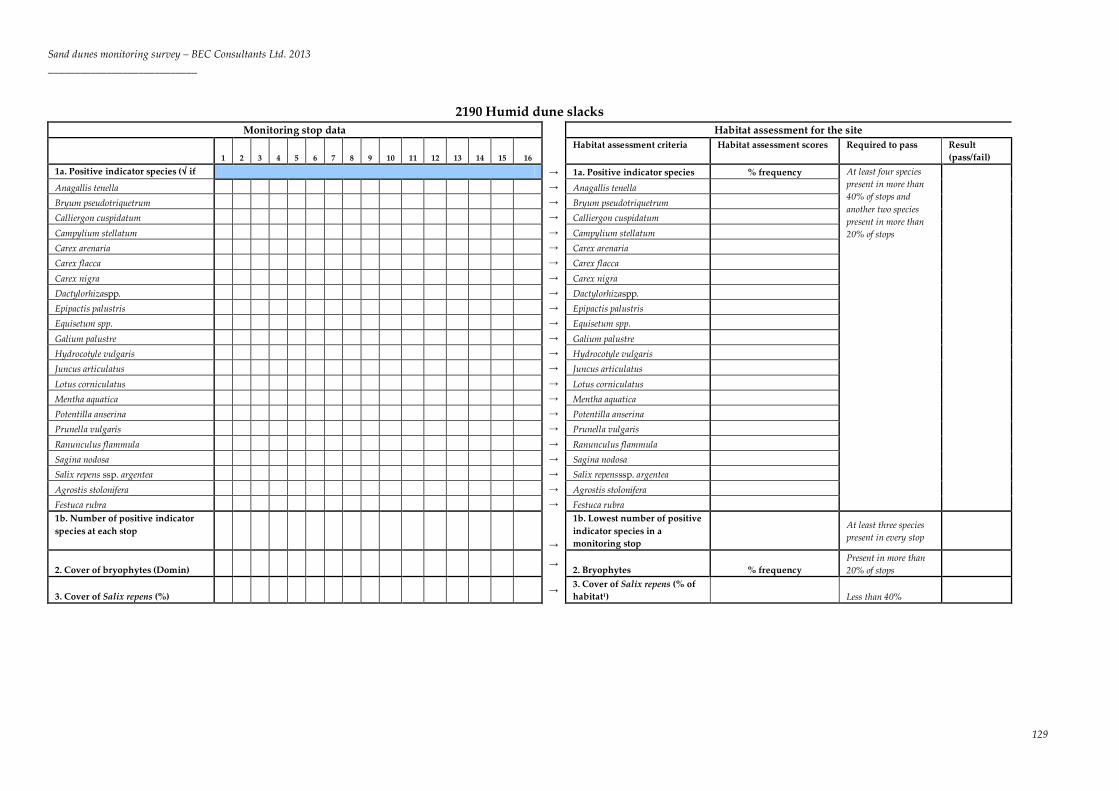
Sand dunes monitoring survey – BEC Consultants Ltd. 2013 ____________________________
129
2190 Humid dune slacks Monitoring stop data Habitat assessment for the site
1 2 3 4 5 6 7 8 9 10 11 12 13 14 15 16 Habitat assessment criteria Habitat assessment scores Required to pass Result
(pass/fail) 1a. Positive indicator species (√ if
→ 1a. Positive indicator species % frequency At least four species
present in more than 40% of stops and another two species present in more than 20% of stops
Anagallis tenella → Anagallis tenella Bryum pseudotriquetrum → Bryum pseudotriquetrum Calliergon cuspidatum → Calliergon cuspidatum
Campylium stellatum → Campylium stellatum Carex arenaria → Carex arenaria Carex flacca → Carex flacca
Carex nigra → Carex nigra Dactylorhizaspp. → Dactylorhizaspp. Epipactis palustris → Epipactis palustris Equisetum spp. → Equisetum spp.
Galium palustre → Galium palustre Hydrocotyle vulgaris → Hydrocotyle vulgaris Juncus articulatus → Juncus articulatus
Lotus corniculatus → Lotus corniculatus Mentha aquatica → Mentha aquatica Potentilla anserina → Potentilla anserina Prunella vulgaris → Prunella vulgaris
Ranunculus flammula → Ranunculus flammula Sagina nodosa → Sagina nodosa Salix repens ssp. argentea → Salix repensssp. argentea
Agrostis stolonifera → Agrostis stolonifera Festuca rubra → Festuca rubra 1b. Number of positive indicator species at each stop
→
1b. Lowest number of positive indicator species in a monitoring stop
At least three species present in every stop
2. Cover of bryophytes (Domin) →
2. Bryophytes % frequency Present in more than 20% of stops
3. Cover of Salix repens (%) → 3. Cover of Salix repens (% of
habitat1) Less than 40%
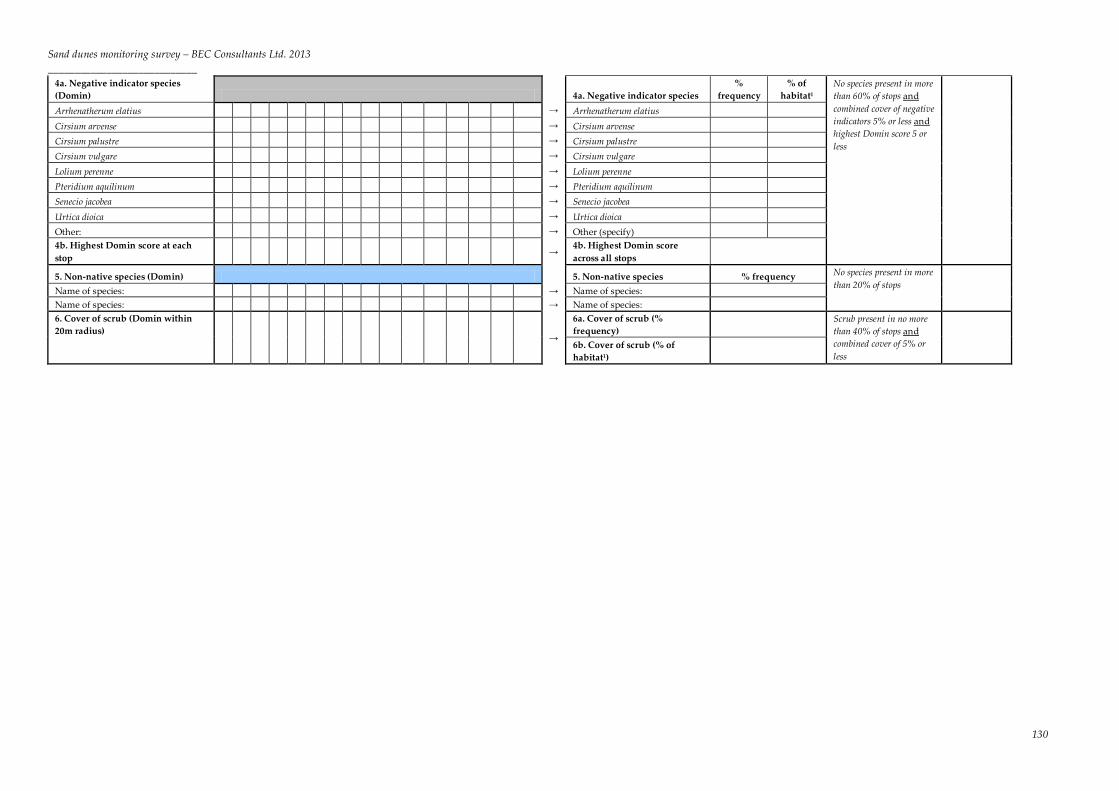
Sand dunes monitoring survey – BEC Consultants Ltd. 2013 ____________________________
130
4a. Negative indicator species (Domin) 4a. Negative indicator species
% frequency
% of habitat1
No species present in more than 60% of stops and combined cover of negative indicators 5% or less and highest Domin score 5 or less
Arrhenatherum elatius → Arrhenatherum elatius
Cirsium arvense → Cirsium arvense Cirsium palustre → Cirsium palustre Cirsium vulgare → Cirsium vulgare
Lolium perenne → Lolium perenne Pteridium aquilinum → Pteridium aquilinum Senecio jacobea → Senecio jacobea Urtica dioica → Urtica dioica Other: → Other (specify) 4b. Highest Domin score at each stop
→ 4b. Highest Domin score across all stops
5. Non-native species (Domin) 5. Non-native species % frequency No species present in more than 20% of stops
Name of species: → Name of species: Name of species: → Name of species: 6. Cover of scrub (Domin within 20m radius)
→
6a. Cover of scrub (% frequency)
Scrub present in no more than 40% of stops and combined cover of 5% or less
6b. Cover of scrub (% of habitat1)

Sand dunes monitoring survey – BEC Consultants Ltd. 2013 ____________________________
131
7. Forb cover to grass cover ratio (%:%)4
→ 7. Forb: grass ratio (mean)
Forb cover over 30%, grass cover below 70%
8. Bare ground (Domin) → 8a. Bare ground (% of habitat from stops1)
Present but total area not more than 5%
Gen
eral
site
obs
erva
tion
s
→ 8b. Bare ground (% of habitat from map3)
→
9. Rare species % frequency No declines since last assessment
→
10a. Coastal defences built pre-designation which currently affect the habitat due to modification of these structures or changes to the sediment cycle at the site (presence/absence)
Both absent
→
10b. Post-designation anthropogenic impacts on the substrate/mobility of the system (e.g. new stabilisation works, sediment extraction) (presence/absence)
→
11. Disturbance (e.g. trampling, vehicle damage, removal of substrate) affecting the habitat (% of habitat)
No more than 20% of habitat
No. of criteria failed
Recorded but not assessed: Habitat assessment2
Embryonic slacks present? (Y/N)
Algal mats present? (Y/N)
Notes :
1. Calculate % of habitat by averaging mid-range values for Domin score as follows:
Domin score Range Mid-range value (%)
+ A single individual, <1% cover 0.1
1 2-3 individuals, <1% cover 0.3
2 Several individuals, < 1% cover 0.7
3 1-4% cover 2
4 5-10% cover 7
5 11-25% cover 18
6 26-33% cover 29.5
7 34-50% cover 42
8 51-75% cover 68
9 76-90% cover 83
10 91-100% cover 95.5
2. No failures = Favourable, 1-2 failures = Unfavourable - Inadequate, 3+ failures =
Unfavourable - Bad.
3. Calculate the area of bare ground within the habitat at a site level by totalling the areas

Sand dunes monitoring survey – BEC Consultants Ltd. 2013 ____________________________
132
*21A0 Machairs Monitoring stop data Habitat assessment for the site
1 2 3 4 5 6 7 8 9 10 11 12 13 14 15 16 Habitat assessment criteria
Habitat assessment scores Required to pass Result (pass/fail)
1a. Positive indicator species (√ if present)
1a. Positive indicator species
% frequency At least six species present in more than 20% of stops
Agrostis stolonifera → Agrostis stolonifera Aira praecox → Aira praecox Bellis perennis → Bellis perennis Carex arenaria → Carex arenaria Carex flacca → Carex flacca Carex nigra → Carex nigra Cerastium fontanum → Cerastium fontanum Crepis capillaris → Crepis capillaris Euphrasia officinalis agg. → Euphrasia officinalis agg. Festuca rubra → Festuca rubra Galium verum → Galium verum Hydrocotyle vulgaris → Hydrocotyle vulgaris Linum catharticum → Linum catharticum Lotus corniculatus → Lotus corniculatus Orchid spp. → Orchid spp. Plantago lanceolata → Plantago lanceolata Potentilla anserina → Potentilla anserina Prunella vulgaris → Prunella vulgaris Rhinanthus minor → Rhinanthus minor Sedum acre → Sedum acre Thymus polytrichus → Thymus polytrichus Trifolium repens → Trifolium repens Viola canina → Viola canina Viola riviniana → Viola riviniana Viola tricolor → Viola tricolor 1b. Number of positive indicator species at each stop
→
1b. Lowest number of positive indicator species in a monitoring
At least three species present in every stop

Sand dunes monitoring survey – BEC Consultants Ltd. 2013 ____________________________
133
2. Cover of bryophytes (Domin) → 2. Cover of bryophytes
(minimum % cover) Always over 1% 3a. Negative indicator species (Domin)
3a. Negative indicator species % frequency % of habitat1
No species present in more than 40% of stops and L. perenne and P. pratense not present in more than 20% of stops and combined cover of negative indicators 5% or less and highest Domin score 5 or less
Arrhenatherum elatius → Arrhenatherum elatius
Cirsium arvense → Cirsium arvense
Cirsium vulgare → Cirsium vulgare
Senecio jacobea → Senecio jacobea
Urtica dioica → Urtica dioica
Lolium perenne → Lolium perenne
Phleum pratense → Phleum pratense
Pteridium aquilinum → Pteridium aquilinum
Other (include native invasive species):
→ Other:
3b. Highest Domin score at each stop
→ 3b. Highest Domin score across all stops
4. Non-native species (Domin) 4. Non-native species % frequency No species present in more than 20% of stops
Name of species: → Name of species:
Name of species: → Name of species: 5. Flowering and fruiting of any positive indicator species (√ if present)
→ 5. Flowering and fruiting of any positive indicator species (% frequency)
Present in more than 40% of stops
6. Height of vegetation (cm) → 6. Sward height (mean) Mean height ti t d t b

Sand dunes monitoring survey – BEC Consultants Ltd. 2013 ____________________________
134
7. Bare ground (Domin) → 7a. Bare ground (% of habitat from stops1)
Present but total area not more than5%
Notes : 1. Calculate % of habitat by averaging mid-range values for Domin score as follows: Domin score Range Mid-range value (%) + A single individual, <1% cover 0.1 1 2-3 individuals, <1% cover 0.3 2 Several individuals, < 1% cover 0.7 3 1-4% cover 2 4 5-10% cover 7 5 11-25% cover 18 6 26-33% cover 29.5 7 34-50% cover 42 8 51-75% cover 68 9 76-90% cover 83 10 91-100% cover 95.5 2. No failures = Favourable, 1-2 failures = Unfavourable - Inadequate, 3+ failures = Unfavourable - Bad 3. Calculate the area of bare ground within the habitat at a site level by totalling the areas mapped as bare ground
Gen
eral
site
obs
erva
tion
s
→ 7b. Bare ground (% of habitat from map3)
→ 8. Rare species % frequency
→
9a. Coastal defences built pre-designation which currently affect the habitat due to modification of these structures or changes to the sediment cycle at the site (presence/absence)
Both absent
→
9b. Post-designation anthropogenic impacts on the substrate/mobility of the system (e.g. new stabilisation works, sediment extraction) (presence/absence)
→
10. Disturbance (e.g. trampling, vehicle damage, removal of substrate) affecting the habitat (% of habitat)
No more than 20% of habitat
No. of criteria failed

Sand dunes monitoring survey – BEC Consultants Ltd. 2013 ____________________________
135
Appendix II: Calculation of percentage of 2170 Dunes with creeping willow in favourable condition
A: Assessment of Structure and Functions of each site Criterion Target 28 Cahore
Point North 35 The Raven 75 Castlegregory 124 Aghleam 133 Strandhill 147 Maghera 148
Sheskinmore 162 Rinclevan 169 Lough
Nagreany
Positive indicator species
At least two species present in more than 40% of stops and another two species present in more than 20% of stops. No stop with fewer than two positive indicator species.
Pass Pass Pass Pass Pass Pass Pass Pass Pass
Rare species No decline since last assessment Pass Pass Pass Pass Pass Pass Pass Pass Pass
Negative indicator species
No species present in more than 60% of stops and combined cover of negative indicators 5% or less and highest Domin score 5 or less
Pass Pass Fail Pass Pass Fail Pass Fail Pass
Non-native species (specify)
No species present in more than 20% of stops Pass Pass Pass Pass Pass Pass Pass Pass Pass
Grasses indicating rank conditions Total cover is less than 10%
Pass Pass Pass Pass Pass Pass Pass Pass Pass
Cover of trees and scrub other than S. repens
Trees and scrub present at no more than 40% of stops and combined cover of 5% or less
Pass Fail Pass Pass Fail Pass Pass Pass Pass
Height of Salix repens All stops with height of 5 to 30 cm
Fail Fail Pass Fail Pass Fail Pass Pass Pass
Bare ground Present but total area not more than 10%
Fail Pass Pass Pass Fail Pass Pass Pass Pass
Interference with the sediment dynamics Absent
Pass Pass Pass Pass Pass Pass Pass Pass Pass
Disturbance (e.g. trampling, vehicle damage, removal of substrate) affecting the habitat
Affecting no more than 20% of habitat
Pass Pass Pass Pass Pass Pass Pass Pass Pass
Number of failed criteria
0 failed criteria = Favourable 1 or 2 failed criteria = Unfavourable-Inadequate >2 failed criteria = Unfavourable-Bad
2 2 1 1 2 2 0 1 0
Site based assessment Unfavourable-Inadequate
Unfavourable-Inadequate
Unfavourable-Inadequate
Unfavourable-Inadequate
Unfavourable-Inadequate
Unfavourable-Inadequate Favourable
Unfavourable-Inadequate Favourable
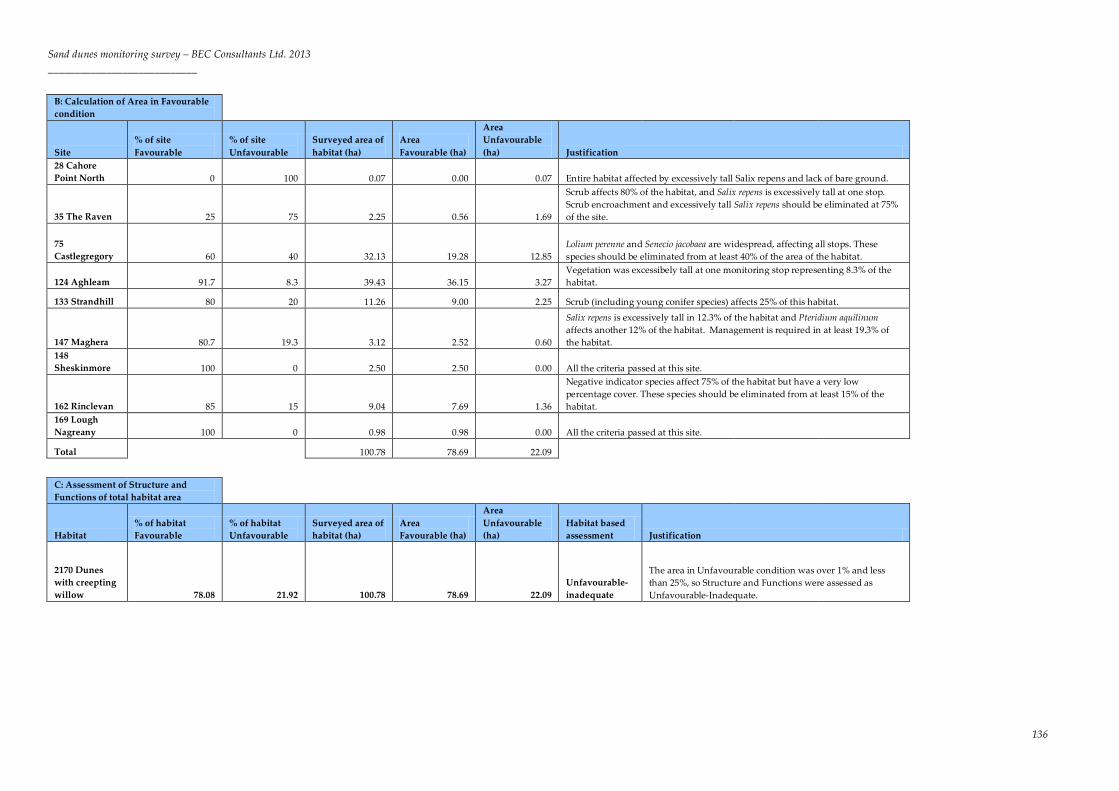
Sand dunes monitoring survey – BEC Consultants Ltd. 2013 ____________________________
136
B: Calculation of Area in Favourable condition
Site % of site Favourable
% of site Unfavourable
Surveyed area of habitat (ha)
Area Favourable (ha)
Area Unfavourable (ha) Justification
28 Cahore Point North 0 100 0.07 0.00 0.07 Entire habitat affected by excessively tall Salix repens and lack of bare ground.
35 The Raven 25 75 2.25 0.56 1.69
Scrub affects 80% of the habitat, and Salix repens is excessively tall at one stop. Scrub encroachment and excessively tall Salix repens should be eliminated at 75% of the site.
75 Castlegregory 60 40 32.13 19.28 12.85
Lolium perenne and Senecio jacobaea are widespread, affecting all stops. These species should be eliminated from at least 40% of the area of the habitat.
124 Aghleam 91.7 8.3 39.43 36.15 3.27 Vegetation was excessibely tall at one monitoring stop representing 8.3% of the habitat.
133 Strandhill 80 20 11.26 9.00 2.25 Scrub (including young conifer species) affects 25% of this habitat.
147 Maghera 80.7 19.3 3.12 2.52 0.60
Salix repens is excessively tall in 12.3% of the habitat and Pteridium aquilinum affects another 12% of the habitat. Management is required in at least 19.3% of the habitat.
148 Sheskinmore 100 0 2.50 2.50 0.00 All the criteria passed at this site.
162 Rinclevan 85 15 9.04 7.69 1.36
Negative indicator species affect 75% of the habitat but have a very low percentage cover. These species should be eliminated from at least 15% of the habitat.
169 Lough Nagreany 100 0 0.98 0.98 0.00 All the criteria passed at this site.
Total 100.78 78.69 22.09
C: Assessment of Structure and Functions of total habitat area
Habitat % of habitat Favourable
% of habitat Unfavourable
Surveyed area of habitat (ha)
Area Favourable (ha)
Area Unfavourable (ha)
Habitat based assessment Justification
2170 Dunes with creepting willow 78.08 21.92 100.78 78.69 22.09
Unfavourable-inadequate
The area in Unfavourable condition was over 1% and less than 25%, so Structure and Functions were assessed as Unfavourable-Inadequate.

Sand dunes monitoring survey – BEC Consultants Ltd. 2013 ____________________________
137
Appendix III: BSBI Guidance notes for recording DAFOR
scores
D = Dominant; A = Abundant, F = Frequent, O = Occasional, R = Rare.
D FOR DOMINANT
In practice you will rarely, if ever use this. To score D, a species would have to be the most common plant by far, in well over three quarters of the square. It is possible that, in a square that is entirely conifer plantation, Sitka spruce Picea sitchensis might score D; or in a square that is almost all occupied by highly improved grassland, perennial rye-grass Lolium perenne might sometimes score D, but even these two scenarios are unlikely most of the time. If you are not sure if something should score D or A, give it A.
A FOR ABUNDANT
Only use A if the plant was really very common in many parts of the square. For most species this would mean that there were thousands of individual plants present. In most squares, few species will score as highly as A and in quite a few squares there will be no species that score that highly. If you are not sure if something should score A or F, give it F.
F FOR FREQUENT
Use F if you found the plant in several places in the square and there was usually more than just a few individuals in each of these places. You could also use F if the plant was only present in one part of the square but was very common in that part, with many individuals and covered a substantial area (e.g. between one eighth and one quarter of the area of the whole square). If you are not sure if something should score F or O, give it O.
O FOR OCCASIONAL
Use O for species that occur in several places in the square, but whose populations are usually not very big. You would also use O for species that are very common in one bit of habitat within the square that occupied just a small area (e.g. less than one eighth of the area of the whole square). You will use O for many species in most squares. If you are not sure if something should score O or R, give it R.
R FOR RARE
Use R for any species that occur as a small number of individuals in the square. This small number of individuals may be located in one place in the square, or scattered over several different locations within the square. In many squares R is likely to be the score that most species get. If you are not sure if something should score O or R, give it R.
When DAFOR scores were converted to percentage cover, D was taken to equal 68%, A was taken to equal
29.5%, F was taken to equal 18%, O was taken to equal 2% and R was taken to equal 0.7%.

Sand dunes monitoring survey – BEC Consultants Ltd. 2013 ____________________________
138
Appendix IV: Main changes to the conservation assessment
criteria
Habitat Criterion SDM Target (2011/2012) CMP Target (2004-2006) All habitats Positive indicator species Frequency of positive indicator species
assessed across all monitoring stops (number of positive indicator species within each monitoring stop also assessed for some habitats)
Number of positive indicator species assessed in each monitoring stop.
All habitats Coastal defences No change since designation Not assessed All habitats Disturbance Rare across the site Not assessed All habitats Rare species No decline since last assessment Not assessed 2110 Embryonic shifting dunes
Healthy vegetation and flowering/fruiting of Elytrigia juncea & Leymus arenarius
Dominant, Abundant, Frequent within habitat, flowering season taken into account
Unhealthy Elytrigia juncea and/or Leymus arenarius singly or together no greater than 5% within stop
2120 Marram dunes (white dunes)
Healthy vegetation and flowering/fruiting of Elytrigia juncea & Leymus arenarius
Dominant, Abundant, Frequent within habitat, flowering season taken into account
Unhealthy Ammophila arenaria and Leymus arenarius singly or together no greater than 5%
2120 Marram dunes (white dunes)
Hippophae rhamnoides Absent Not assessed
*2130 Fixed dunes (grey dunes)
Negative indicator species
Frequency of negative indicator species assessed across all monitoring stops as well as total number of species within the stop.
Frequency of negative indicator species assessed in each monitoring stop.
*2130 Fixed dunes (grey dunes)
Cover of trees and scrub One species Frequent, Occasional, Rare, Absent and total cover 5% or less
Not assessed
*2130 Fixed dunes (grey dunes)
Trees/saplings from adjacent plantations
Rare, Absent Not assessed
*2130 Fixed dunes (grey dunes)
Flowering and fruiting Frequent, Abundant, Dominant within the habitat
At least Frequent (20% of vegetation within stop)
*2130 Fixed dunes (grey dunes)
Bare ground Present but not more than 10% in habitat No more than 10% within stop
*2130 Fixed dunes (grey dunes)
Height of vegetation 30-70% of the whole Annex I habitat between 2-10cm
No greater than 20cm and no less than 5cm within the stop
2170 Dunes with creeping willow
Negative indicator species
Urtica dioica present on list Holcus lanatus removed from list
Urtica dioica absent from list Holcus lanatus present on list
2190 Humid dune slacks
Typical species Same list applied to all slack types. Old, dry slacks are no longer humid, so they are considered elsewhere (generally 2130 Fixed dunes (grey dunes) or 2170 Dunes with creeping willow). Embryonic dune slacks noted separately on the recording sheet.
Separate species list for each of 5 types. *2130 Fixed dunes (grey dunes) species included in the list for old, dry slacks
*21A0 Machairs Native invasive species (Pteridium aquilinum, Petasites spp. etc.)
Assessed under the negative indicator species criterion.
No more than 5% cover within any monitoring stop.
*21A0 Machairs Flowering and fruiting of vegetation
At least Frequent across the site At least occasional within each monitoring stop.
*21A0 Machairs Bare ground Up to 5% across the whole site, but must be present.
0-10% cover within each monitoring stop.
*21A0 Machairs Sward height Average >8 cm in July/August 2-10cm in each stop.
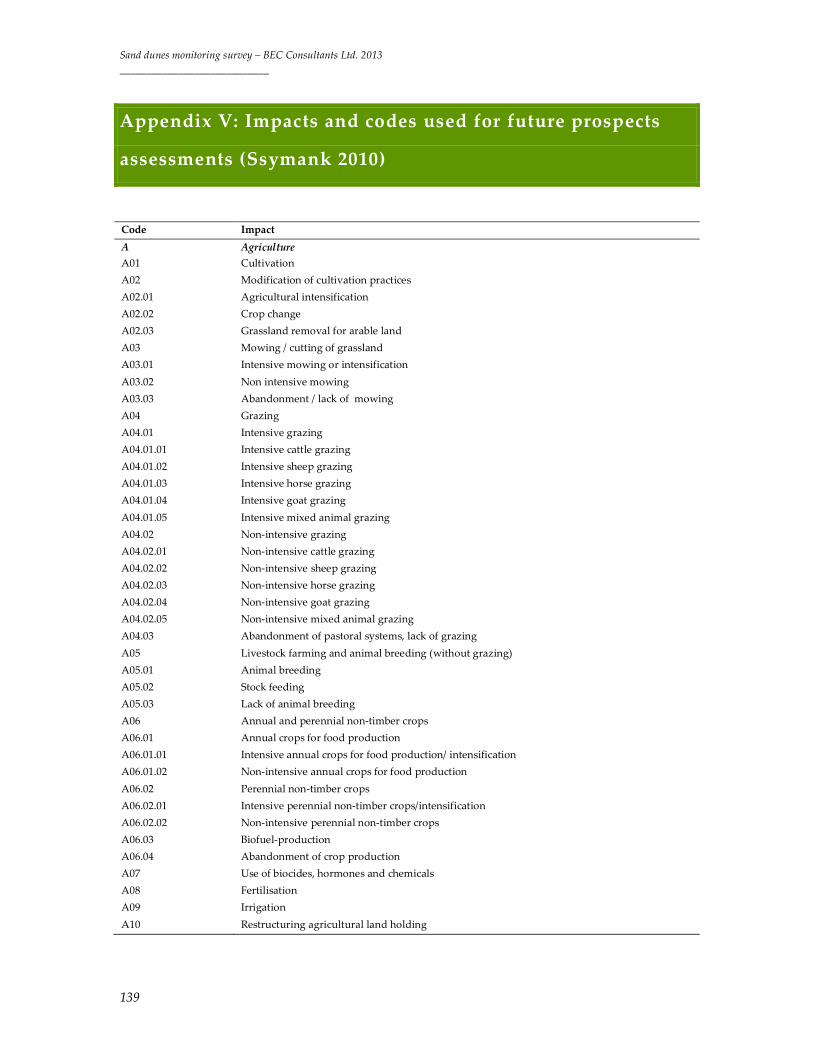
Sand dunes monitoring survey – BEC Consultants Ltd. 2013 ____________________________
139
Appendix V: Impacts and codes used for future prospects
assessments (Ssymank 2010)
Code Impact A Agriculture A01 Cultivation A02 Modification of cultivation practices A02.01 Agricultural intensification A02.02 Crop change A02.03 Grassland removal for arable land A03 Mowing / cutting of grassland A03.01 Intensive mowing or intensification A03.02 Non intensive mowing A03.03 Abandonment / lack of mowing A04 Grazing A04.01 Intensive grazing A04.01.01 Intensive cattle grazing A04.01.02 Intensive sheep grazing A04.01.03 Intensive horse grazing A04.01.04 Intensive goat grazing A04.01.05 Intensive mixed animal grazing A04.02 Non-intensive grazing A04.02.01 Non-intensive cattle grazing A04.02.02 Non-intensive sheep grazing A04.02.03 Non-intensive horse grazing A04.02.04 Non-intensive goat grazing A04.02.05 Non-intensive mixed animal grazing A04.03 Abandonment of pastoral systems, lack of grazing A05 Livestock farming and animal breeding (without grazing) A05.01 Animal breeding A05.02 Stock feeding A05.03 Lack of animal breeding A06 Annual and perennial non-timber crops A06.01 Annual crops for food production A06.01.01 Intensive annual crops for food production/ intensification A06.01.02 Non-intensive annual crops for food production A06.02 Perennial non-timber crops A06.02.01 Intensive perennial non-timber crops/intensification A06.02.02 Non-intensive perennial non-timber crops A06.03 Biofuel-production A06.04 Abandonment of crop production A07 Use of biocides, hormones and chemicals A08 Fertilisation A09 Irrigation A10 Restructuring agricultural land holding
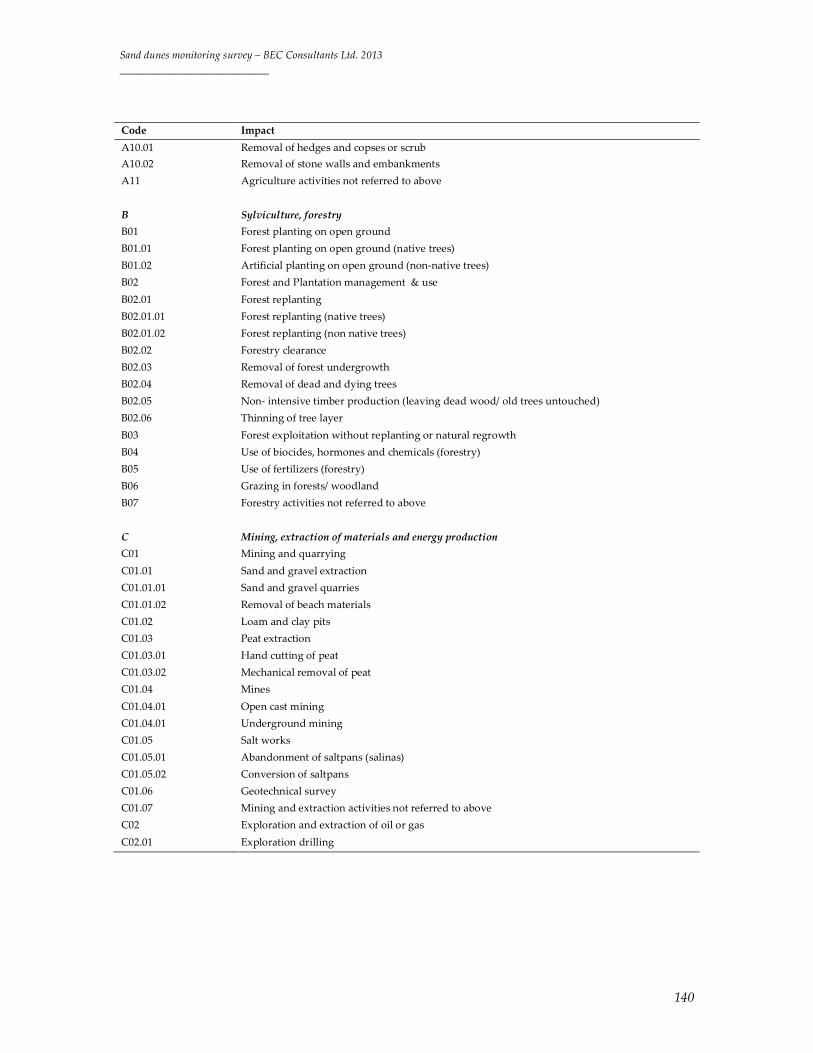
Sand dunes monitoring survey – BEC Consultants Ltd. 2013 ____________________________
140
Code Impact A10.01 Removal of hedges and copses or scrub A10.02 Removal of stone walls and embankments A11 Agriculture activities not referred to above B Sylviculture, forestry B01 Forest planting on open ground B01.01 Forest planting on open ground (native trees) B01.02 Artificial planting on open ground (non-native trees) B02 Forest and Plantation management & use B02.01 Forest replanting B02.01.01 Forest replanting (native trees) B02.01.02 Forest replanting (non native trees) B02.02 Forestry clearance B02.03 Removal of forest undergrowth B02.04 Removal of dead and dying trees B02.05 Non- intensive timber production (leaving dead wood/ old trees untouched) B02.06 Thinning of tree layer B03 Forest exploitation without replanting or natural regrowth B04 Use of biocides, hormones and chemicals (forestry) B05 Use of fertilizers (forestry) B06 Grazing in forests/ woodland B07 Forestry activities not referred to above C Mining, extraction of materials and energy production C01 Mining and quarrying C01.01 Sand and gravel extraction C01.01.01 Sand and gravel quarries C01.01.02 Removal of beach materials C01.02 Loam and clay pits C01.03 Peat extraction C01.03.01 Hand cutting of peat C01.03.02 Mechanical removal of peat C01.04 Mines C01.04.01 Open cast mining C01.04.01 Underground mining C01.05 Salt works C01.05.01 Abandonment of saltpans (salinas) C01.05.02 Conversion of saltpans C01.06 Geotechnical survey C01.07 Mining and extraction activities not referred to above C02 Exploration and extraction of oil or gas C02.01 Exploration drilling
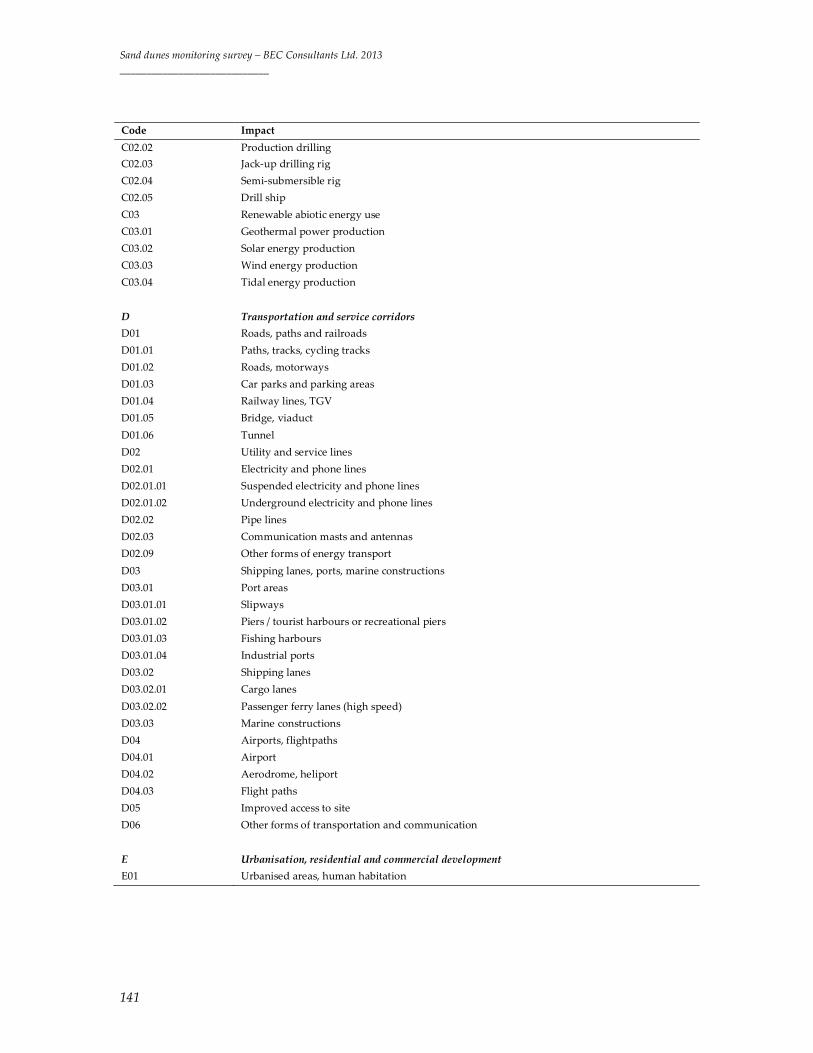
Sand dunes monitoring survey – BEC Consultants Ltd. 2013 ____________________________
141
Code Impact C02.02 Production drilling C02.03 Jack-up drilling rig C02.04 Semi-submersible rig C02.05 Drill ship C03 Renewable abiotic energy use C03.01 Geothermal power production C03.02 Solar energy production C03.03 Wind energy production C03.04 Tidal energy production D Transportation and service corridors D01 Roads, paths and railroads D01.01 Paths, tracks, cycling tracks D01.02 Roads, motorways D01.03 Car parks and parking areas D01.04 Railway lines, TGV D01.05 Bridge, viaduct D01.06 Tunnel D02 Utility and service lines D02.01 Electricity and phone lines D02.01.01 Suspended electricity and phone lines D02.01.02 Underground electricity and phone lines D02.02 Pipe lines D02.03 Communication masts and antennas D02.09 Other forms of energy transport D03 Shipping lanes, ports, marine constructions D03.01 Port areas D03.01.01 Slipways D03.01.02 Piers / tourist harbours or recreational piers D03.01.03 Fishing harbours D03.01.04 Industrial ports D03.02 Shipping lanes D03.02.01 Cargo lanes D03.02.02 Passenger ferry lanes (high speed) D03.03 Marine constructions D04 Airports, flightpaths D04.01 Airport D04.02 Aerodrome, heliport D04.03 Flight paths D05 Improved access to site D06 Other forms of transportation and communication E Urbanisation, residential and commercial development E01 Urbanised areas, human habitation
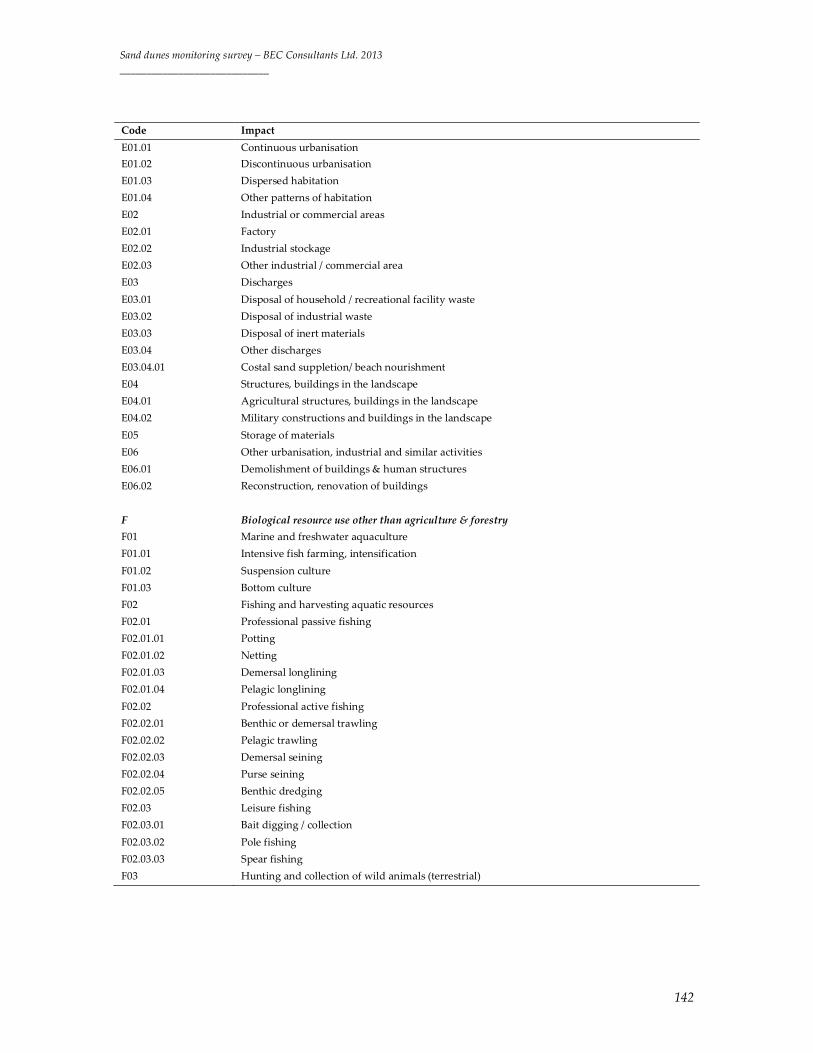
Sand dunes monitoring survey – BEC Consultants Ltd. 2013 ____________________________
142
Code Impact E01.01 Continuous urbanisation E01.02 Discontinuous urbanisation E01.03 Dispersed habitation E01.04 Other patterns of habitation E02 Industrial or commercial areas E02.01 Factory E02.02 Industrial stockage E02.03 Other industrial / commercial area E03 Discharges E03.01 Disposal of household / recreational facility waste E03.02 Disposal of industrial waste E03.03 Disposal of inert materials E03.04 Other discharges E03.04.01 Costal sand suppletion/ beach nourishment E04 Structures, buildings in the landscape E04.01 Agricultural structures, buildings in the landscape E04.02 Military constructions and buildings in the landscape E05 Storage of materials E06 Other urbanisation, industrial and similar activities E06.01 Demolishment of buildings & human structures E06.02 Reconstruction, renovation of buildings F Biological resource use other than agriculture & forestry F01 Marine and freshwater aquaculture F01.01 Intensive fish farming, intensification F01.02 Suspension culture F01.03 Bottom culture F02 Fishing and harvesting aquatic resources F02.01 Professional passive fishing F02.01.01 Potting F02.01.02 Netting F02.01.03 Demersal longlining F02.01.04 Pelagic longlining F02.02 Professional active fishing F02.02.01 Benthic or demersal trawling F02.02.02 Pelagic trawling F02.02.03 Demersal seining F02.02.04 Purse seining F02.02.05 Benthic dredging F02.03 Leisure fishing F02.03.01 Bait digging / collection F02.03.02 Pole fishing F02.03.03 Spear fishing F03 Hunting and collection of wild animals (terrestrial)
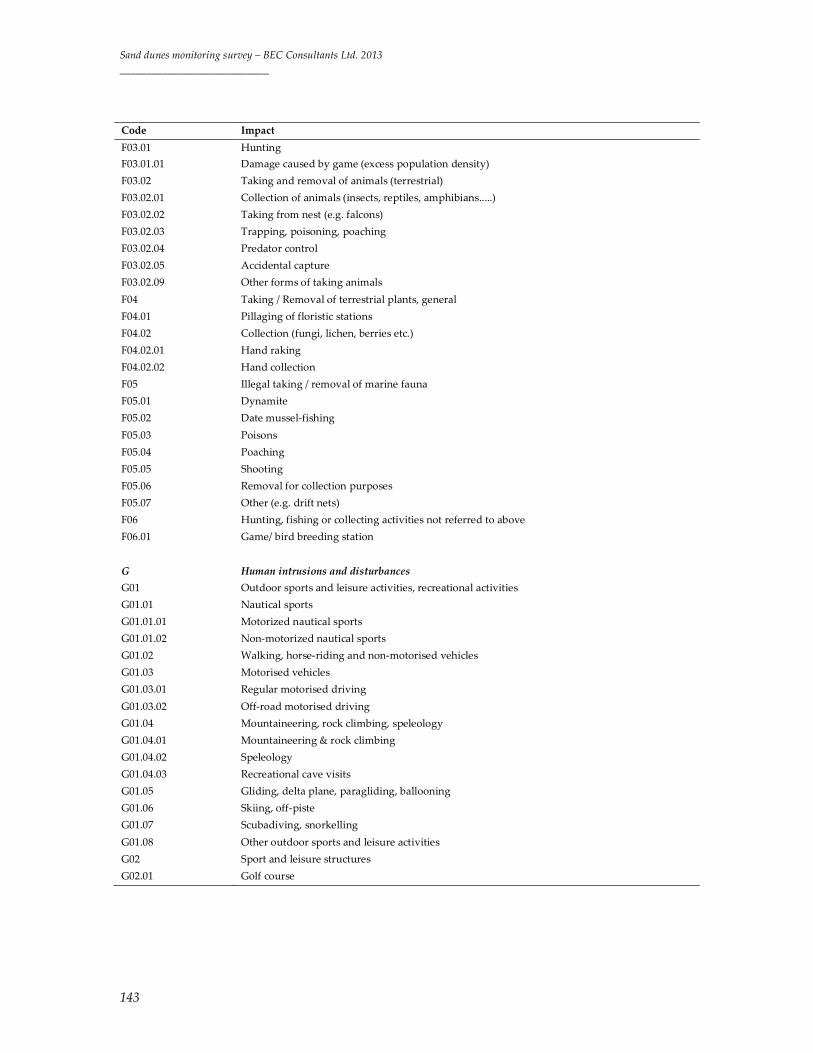
Sand dunes monitoring survey – BEC Consultants Ltd. 2013 ____________________________
143
Code Impact F03.01 Hunting F03.01.01 Damage caused by game (excess population density) F03.02 Taking and removal of animals (terrestrial) F03.02.01 Collection of animals (insects, reptiles, amphibians.....) F03.02.02 Taking from nest (e.g. falcons) F03.02.03 Trapping, poisoning, poaching F03.02.04 Predator control F03.02.05 Accidental capture F03.02.09 Other forms of taking animals F04 Taking / Removal of terrestrial plants, general F04.01 Pillaging of floristic stations F04.02 Collection (fungi, lichen, berries etc.) F04.02.01 Hand raking F04.02.02 Hand collection F05 Illegal taking / removal of marine fauna F05.01 Dynamite F05.02 Date mussel-fishing F05.03 Poisons F05.04 Poaching F05.05 Shooting F05.06 Removal for collection purposes F05.07 Other (e.g. drift nets) F06 Hunting, fishing or collecting activities not referred to above F06.01 Game/ bird breeding station G Human intrusions and disturbances G01 Outdoor sports and leisure activities, recreational activities G01.01 Nautical sports G01.01.01 Motorized nautical sports G01.01.02 Non-motorized nautical sports G01.02 Walking, horse-riding and non-motorised vehicles G01.03 Motorised vehicles G01.03.01 Regular motorised driving G01.03.02 Off-road motorised driving G01.04 Mountaineering, rock climbing, speleology G01.04.01 Mountaineering & rock climbing G01.04.02 Speleology G01.04.03 Recreational cave visits G01.05 Gliding, delta plane, paragliding, ballooning G01.06 Skiing, off-piste G01.07 Scubadiving, snorkelling G01.08 Other outdoor sports and leisure activities G02 Sport and leisure structures G02.01 Golf course
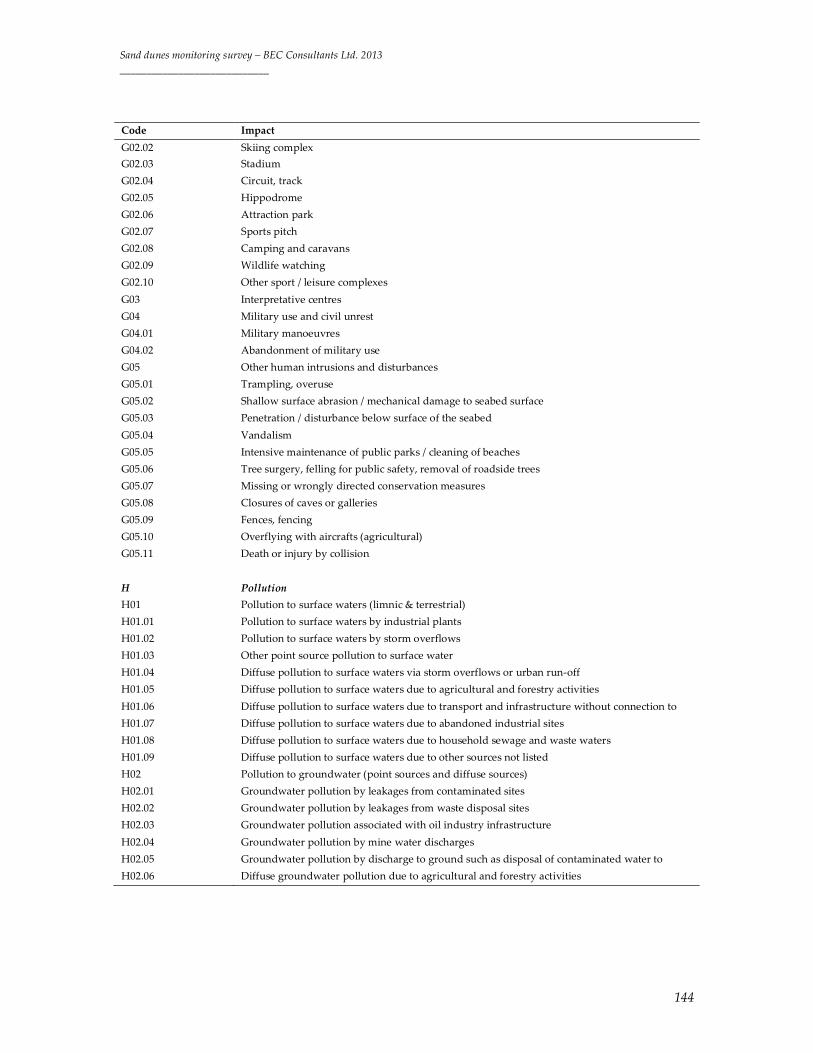
Sand dunes monitoring survey – BEC Consultants Ltd. 2013 ____________________________
144
Code Impact G02.02 Skiing complex G02.03 Stadium G02.04 Circuit, track G02.05 Hippodrome G02.06 Attraction park G02.07 Sports pitch G02.08 Camping and caravans G02.09 Wildlife watching G02.10 Other sport / leisure complexes G03 Interpretative centres G04 Military use and civil unrest G04.01 Military manoeuvres G04.02 Abandonment of military use G05 Other human intrusions and disturbances G05.01 Trampling, overuse G05.02 Shallow surface abrasion / mechanical damage to seabed surface G05.03 Penetration / disturbance below surface of the seabed G05.04 Vandalism G05.05 Intensive maintenance of public parks / cleaning of beaches G05.06 Tree surgery, felling for public safety, removal of roadside trees G05.07 Missing or wrongly directed conservation measures G05.08 Closures of caves or galleries G05.09 Fences, fencing G05.10 Overflying with aircrafts (agricultural) G05.11 Death or injury by collision H Pollution H01 Pollution to surface waters (limnic & terrestrial) H01.01 Pollution to surface waters by industrial plants H01.02 Pollution to surface waters by storm overflows H01.03 Other point source pollution to surface water H01.04 Diffuse pollution to surface waters via storm overflows or urban run-off H01.05 Diffuse pollution to surface waters due to agricultural and forestry activities H01.06 Diffuse pollution to surface waters due to transport and infrastructure without connection to
H01.07 Diffuse pollution to surface waters due to abandoned industrial sites H01.08 Diffuse pollution to surface waters due to household sewage and waste waters H01.09 Diffuse pollution to surface waters due to other sources not listed H02 Pollution to groundwater (point sources and diffuse sources) H02.01 Groundwater pollution by leakages from contaminated sites H02.02 Groundwater pollution by leakages from waste disposal sites H02.03 Groundwater pollution associated with oil industry infrastructure H02.04 Groundwater pollution by mine water discharges H02.05 Groundwater pollution by discharge to ground such as disposal of contaminated water to
H02.06 Diffuse groundwater pollution due to agricultural and forestry activities

Sand dunes monitoring survey – BEC Consultants Ltd. 2013 ____________________________
145
Code Impact H02.07 Diffuse groundwater pollution due to non-sewered population H02.08 Diffuse groundwater pollution due to urban land use H03 Marine water pollution H03.01 Oil spills in the sea H03.02 Toxic chemical discharge from material dumped at sea H03.02.01 Non-synthetic compound contamination H03.02.02 Synthetic compound contamination H03.02.03 Radionucleide contamination H03.02.04 Introduction of other substances (e.g. liquid, gas) H03.03 Marine macro-pollution (e.g. plastic bags, styrofoam) H04 Air pollution, air-borne pollutants H04.01 Acid rain H04.02 Nitrogen-input H04.03 Other air pollution H05 Soil pollution and solid waste (excluding discharges) H05.01 Garbage and solid waste H06 Excess energy H06.01 Noise nuisance, noise pollution H06.01.01 Point source or irregular noise pollution H06.01.02 Diffuse or permanent noise pollution H06.02 Light pollution H06.03 Thermal heating of water bodies H06.04 Electromagnetic changes H07 Other forms of pollution I Invasive, other problematic species and genes I02 Problematic native species I03 Introduced genetic material, GMO I03.01 Genetic pollution (animals) I03.02 Genetic pollution (plants) J Natural System modifications J01 Fire and fire suppression J01.01 Burning down J01.02 Suppression of natural fires J01.03 Lack of fires J02 Human induced changes in hydraulic conditions J02.01 Landfill, land reclamation and drying out, general J02.01.01 Polderisation J02.01.02 Reclamation of land from sea, estuary or marsh J02.01.03 Infilling of ditches, dykes, ponds, pools, marshes or pits J02.01.04 Recultivation of mining areas J02.02 Removal of sediments (mud...) J02.02.01 Dredging / removal of limnic sediments

Sand dunes monitoring survey – BEC Consultants Ltd. 2013 ____________________________
146
Code Impact J02.02.02 Estuarine and coastal dredging J02.03 Canalisation & water deviation J02.03.01 Large scale water deviation J02.03.02 Canalisation J02.04 Flooding modifications J02.04.01 Flooding J02.04.02 Lack of flooding J02.05 Modification of hydrographic functioning, general J02.05.01 Modification of water flow (tidal & marine currents) J02.05.02 Modifying structures of inland water courses J02.05.03 Modification of standing water bodies J02.05.04 Reservoirs J02.05.05 Small hydropower projects, weirs J02.05.06 Wave exposure changes J02.06 Water abstractions from surface waters J02.06.01 Surface water abstractions for agriculture J02.06.02 Surface water abstractions for public water supply J02.06.03 Surface water abstractions by manufacturing industry J02.06.04 Surface water abstractions for the production of electricity (cooling) J02.06.05 Surface water abstractions by fish farms J02.06.06 Surface water abstractions by hydro-energy J02.06.07 Surface water abstractions by quarries/ open cast (coal) sites J02.06.08 Surface water abstractions for navigation J02.06.09 Surface water abstractions for water transfer J02.06.10 Other major surface water abstractions J02.07 Water abstractions from groundwater J02.07.01 Groundwater abstractions for agriculture J02.07.02 Groundwater abstractions for public water supply J02.07.03 Groundwater abstractions by industry J02.07.04 Groundwater abstractions by quarries/open cast (coal)sites J02.07.05 Other major groundwater abstractions from groundwater for agriculture J02.08 Raising the groundwater table / artificial recharge of groundwater J02.08.01 Discharges to groundwater for artificial recharge purposes J02.08.02 Returns of groundwater to GWB from which it was abstracted J02.08.03 Mine water rebound J02.08.04 Other major groundwater recharge J02.09 Saltwater intrusion of groundwater J02.09.01 Saltwater intrusion J02.09.02 Other intrusion J02.10 Management of aquatic and bank vegetation for drainage purposes J02.11 Siltation rate changes, dumping, depositing of dredged deposits J02.11.01 Dumping, depositing of dredged deposits J02.11.02 Other siltation rate changes J02.12 Dykes, embankments, artificial beaches, general
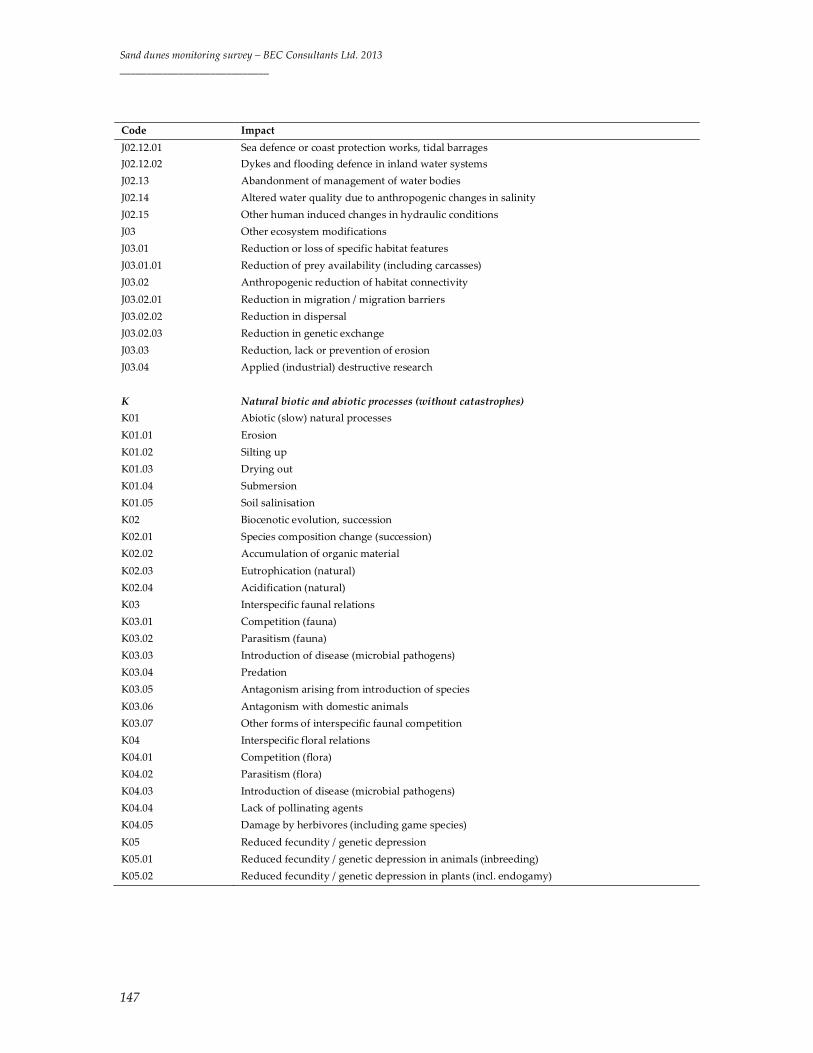
Sand dunes monitoring survey – BEC Consultants Ltd. 2013 ____________________________
147
Code Impact J02.12.01 Sea defence or coast protection works, tidal barrages J02.12.02 Dykes and flooding defence in inland water systems J02.13 Abandonment of management of water bodies J02.14 Altered water quality due to anthropogenic changes in salinity J02.15 Other human induced changes in hydraulic conditions J03 Other ecosystem modifications J03.01 Reduction or loss of specific habitat features J03.01.01 Reduction of prey availability (including carcasses) J03.02 Anthropogenic reduction of habitat connectivity J03.02.01 Reduction in migration / migration barriers J03.02.02 Reduction in dispersal J03.02.03 Reduction in genetic exchange J03.03 Reduction, lack or prevention of erosion J03.04 Applied (industrial) destructive research K Natural biotic and abiotic processes (without catastrophes) K01 Abiotic (slow) natural processes K01.01 Erosion K01.02 Silting up K01.03 Drying out K01.04 Submersion K01.05 Soil salinisation K02 Biocenotic evolution, succession K02.01 Species composition change (succession) K02.02 Accumulation of organic material K02.03 Eutrophication (natural) K02.04 Acidification (natural) K03 Interspecific faunal relations K03.01 Competition (fauna) K03.02 Parasitism (fauna) K03.03 Introduction of disease (microbial pathogens) K03.04 Predation K03.05 Antagonism arising from introduction of species K03.06 Antagonism with domestic animals K03.07 Other forms of interspecific faunal competition K04 Interspecific floral relations K04.01 Competition (flora) K04.02 Parasitism (flora) K04.03 Introduction of disease (microbial pathogens) K04.04 Lack of pollinating agents K04.05 Damage by herbivores (including game species) K05 Reduced fecundity / genetic depression K05.01 Reduced fecundity / genetic depression in animals (inbreeding) K05.02 Reduced fecundity / genetic depression in plants (incl. endogamy)

Sand dunes monitoring survey – BEC Consultants Ltd. 2013 ____________________________
148
Code Impact K06 Other forms or mixed forms of interspecific floral competition L Geological events, natural catastrophes L01 Volcanic activity L02 Tidal wave, tsunamis L03 Earthquake L04 Avalanche L05 Collapse of terrain, landslide L06 Underground collapses L07 Storm, cyclone L08 Inundation (natural processes) L09 Fire (natural) L10 Other natural catastrophes M Climate change M01 Changes in abiotic conditions M01.01 Temperature changes (e.g. rise of temperatures & extremes) M01.02 Droughts and less precipitations M01.03 Flooding and rising precipitations M01.04 pH changes M01.05 Water flow changes (limnic, tidal and oceanic) M01.06 Wave exposure changes M01.07 Sea-level changes M02 Changes in biotic conditions M02.01 Habitat shifting and alteration M02.02 Desynchronisation of processes M02.03 Decline or extinction of species M02.04 Migration of species (natural newcomers) X No threats or pressures XO Threats and pressures from outside the Member State XE Threats and pressures from outside the EU territory

Sand dunes monitoring survey – BEC Consultants Ltd. 2013 ____________________________
149
Appendix VI: Future Prospects recording form
Site
code
Annex I
habitat
Impact
code
Impact
description
Intensity Effect % Habitat Source
e.g. A04.01 eg. intensive
grazing
H M Low - 0 + <1% or
nearest 5%
inside or
outside 000 2130 A04.01.01 Intensive cattle
grazing
20% inside