Embed Size (px)
Citation preview

Town of Pittsford, NY April 2010
Table of Contents Introduction ................................................................................................................................................................... 1 Context Zones ............................................................................................................................................................... 1 History of Pittsford ....................................................................................................................................................... 2 Existing Traffic Conditions .......................................................................................................................................... 2 Historical Traffic ........................................................................................................................................................... 4 2010 Base Traffic Conditions ....................................................................................................................................... 4 2020 Future Traffic Conditions .................................................................................................................................... 6 Capacity Analysis ......................................................................................................................................................... 9 Travel Time Surveys ..................................................................................................................................................... 9 Seasonal Variation ........................................................................................................................................................ 5 2010 Base Conditions ................................................................................................................................................... 6 Travel Time ................................................................................................................................................................... 7 Capacity Analysis ......................................................................................................................................................... 8 List of Figures Figure 1 - Example Context Zones ............................................................................................................................... 1 Figure 2 - Seasonal Analysis......................................................................................................................................... 2 Figure 3 - Existing Conditions 2010 ............................................................................................................................. 3 Figure 4 - Monroe Ave. PM Peak Hour Volumes by Segment .................................................................................... 4 Figure 5 - Monroe Ave. Average Daily Traffic by Segment ........................................................................................ 4 Figure 6 - Base Conditions - 2010 ................................................................................................................................ 5 Figure 7 - Historic Traffic Volumes ............................................................................................................................. 6 Figure 8 - Future Conditions - 2020 ............................................................................................................................. 7 Figure 9 - Existing/Base/Future Traffic Volumes by Segment, Eastbound Only, PM Peak ....................................... 8 Figure 10 - ICU ........................................................................................................................................................... 10 Figure 11 - Average Travel Speed .............................................................................................................................. 13 Figure 12 - Average Travel Time ............................................................................................................................... 13 Figure 13 - Travel Time .............................................................................................................................................. 14 Figure 14 - Historic Travel Time Comparison ........................................................................................................... 17 List of Tables Table 1 - Base 2010 Trip Generation ............................................................................................................................ 4 Table 2 - Future 2020 Trip Generation ......................................................................................................................... 6 Table 3 - Capacity Analysis .......................................................................................................................................... 9 Table 4 - Number of Travel Time Runs ...................................................................................................................... 13 Table 5 - Travel Time Summary ................................................................................................................................. 17
Town & Village of Pittsford, NY May 2010
page 1
This study has been commissioned by the Town and Village of Pittsford to report on historical and current traffic conditions along the Monroe Avenue (NYS Route 31) corridor and to project future traffic conditions based upon a preliminary concept development scenario provided by the Town and Village. The purpose of the Monroe Avenue Corridor Study is to help the Town and Village of Pittsford community understand the past and present state of transportation operations within the corridor. This information provides for more informed data driven decision-making in the future.
Introduction and Existing Conditions The Monroe Avenue Corridor Study involves the segment of Monroe Avenue between Clover Street (NYS Route 65) at the northwest end of the study area, and Main Street (NYS Route 96) in the Village of Pittsford. This study includes 10 intersections, 7 of which are signalized. Context zones are used to characterize areas from rural to urban and from lower to higher density. Each context zone has associated guidelines, characteristics and parameters that are used to inform associated design guidance for buildings, streetscape features and pavement features. The sections of Monroe Avenue were classified into various context zones based upon changes in land use, landscaping, traffic volumes and other characteristics. Monroe Avenue is by no means a homogeneous corridor. The corridor can be visualized more simply when it is classified into different context zones. The context zones include: I-590 Commuter Zone (I-590 to Clover Street), Big Box/Retail Zone (Clover Street to French Road), Transition Zone (French Road to Woodland Road), and the Village Zone (Woodland Road to Main Street). The peak hours selected for the analysis were the weekday AM and PM commuter peaks. In addition, the Saturday midday peak period was evaluated due to the abundant retail uses in the corridor. Vehicular turning movement counts were performed to establish baseline traffic conditions on Monroe Avenue.
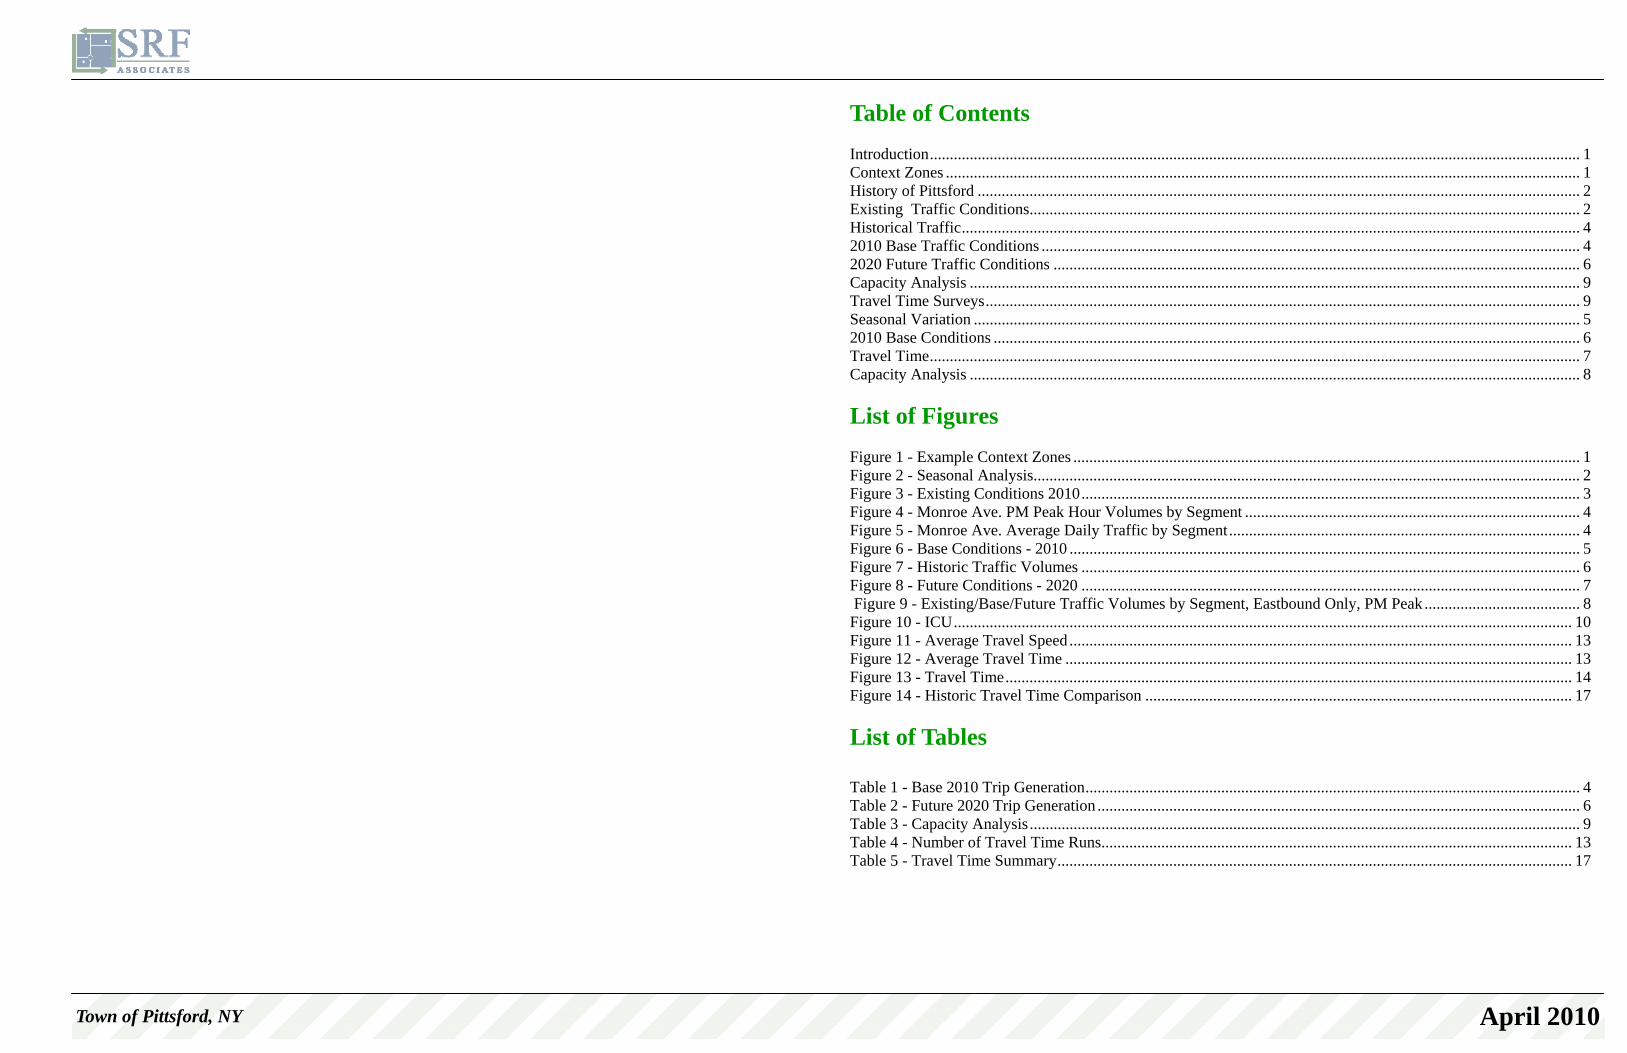
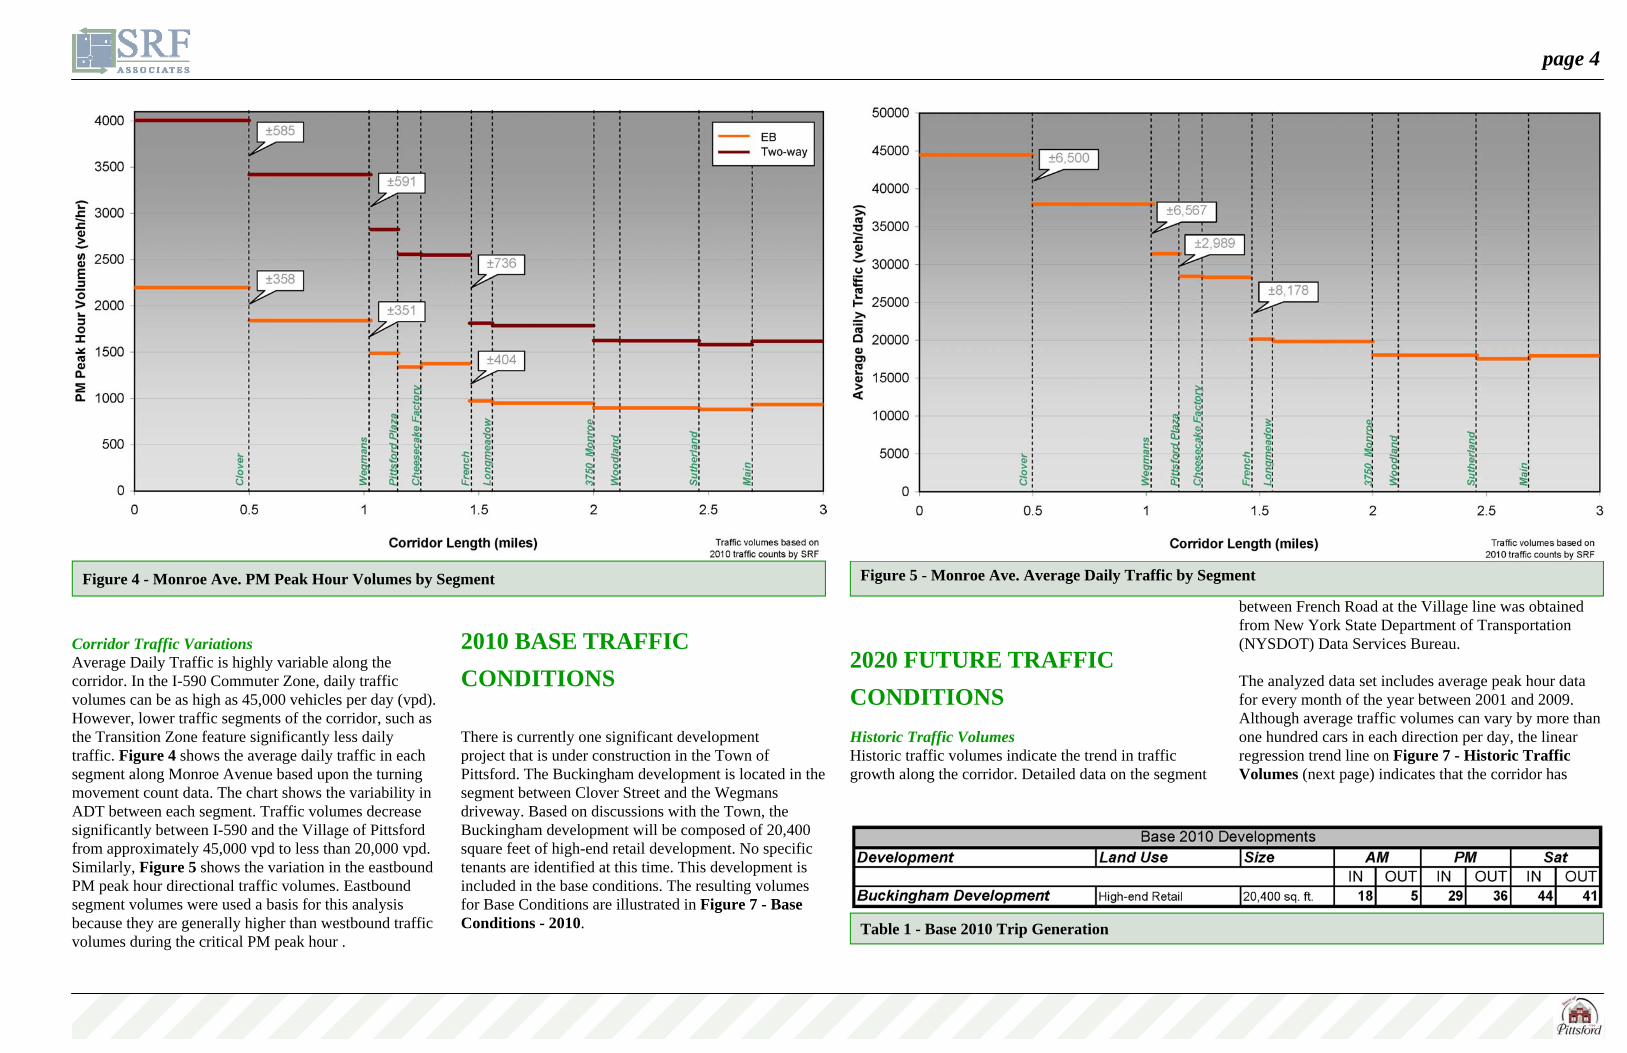
Counts were completed at ten key intersections including: 1. Clover Street (Rt. 65) 2. Wegmans driveway 3. Pittsford Plaza/McDonald’s driveway 4. Cheesecake Factory driveway 5. French Road 6. Longmeadow Circle 7. 3750 Monroe Avenue driveway 8. Woodland Road 9. Sutherland Street 10. Main Street (Rt. 96) Corridor Traffic Variations Average Daily Traffic (ADT) is highly variable along the corridor. In the I-590 Commuter Zone, daily traffic volumes can be as high as 45,000 vehicles per day (vpd). Other context zones feature significantly less daily traffic. Figures 4 and 5 on page 4 show the average daily traffic in each segment along Monroe Avenue based upon the turning movement count data and graphically depicts the variability in ADT between each segment. Traffic volumes decrease significantly between I-590 and the Village of Pittsford from approximately 45,000 vpd to less than 20,000 vpd.
2010 BASE TRAFFIC CONDITIONS
There is currently one significant development project that is under construction in the Town of Pittsford. The Buckingham development is located in the segment
between Clover Street and the Wegmans driveway. Based on discussions with the Town, the Buckingham development will be composed of 20,400 square feet of high-end retail development. No specific tenants are identified at this time. This developments is included in the base conditions.
The resulting volumes for Base Conditions are illustrated in Figure 6 - Base Conditions - 2010 on page 5.
2020 FUTURE TRAFFIC CONDITIONS Historic Traffic Volumes Historic traffic volumes indicate the trend in traffic growth along the corridor. Detailed traffic information on the segment between French Road and the Village line were obtained from the New York State Department of Transportation (NYSDOT) Data Services Bureau. The analyzed data set includes average peak hour data for every month of the year between 2001 and 2009. Although average traffic volumes can vary by more than one hundred cars in each direction per day, the corridor has actually experienced negative growth over the previous 9 years. Growth rates provided by the Genesee Transportation Council (GTC) were also reviewed and compared to current count data. Taking this into account, along with the development opportunities on Monroe Avenue and in the surrounding areas, a growth rate of 0.25% per year was used to predict the annual ambient growth in traffic over the next ten years. Future No-Build Traffic Conditions Future traffic conditions on Monroe Avenue have been projected based on the amount of ambient growth expected in the area combined with trips generated by a future land use scenario. After consulting with the Town and Village, it is our understanding that there may be three significant developments on the Monroe Avenue corridor within the next 10 years. The property at 3750 Monroe Avenue is approved for the construction of 120,000 additional square feet of office/distribution development. A mixed-use development comprised of apartments, a high-end restaurant, and a small marina is being considered at 75 Monroe Avenue. Also, a 55,000 square foot community center is planned on the north
Eastbound at Clover Street
Eastbound at Wegmans driveway
Cheesecake Factory driveway
EXECUTIVE SUMMARY
page 2
side of Monroe Avenue, just west of the Canal, as part of a project referred to as the Northwest Canal Development, a joint effort of the Town and Village of Pittsford. Table 2 - Future 2020 Trip Generation, quantifies the trips generated by each development during the peak hours of analysis. The Future Conditions
- 2020 volumes are developed for each peak by applying the ambient growth rate to the Base 2010 volumes and then combining these volumes with the new trips generated by the future developments (3750 Monroe Avenue, 75 Monroe Avenue and Northwest Canal Development).
CAPACITY ANALYSIS The majority of the intersections in the corridor operate at marginally acceptable levels of service (“D”) under the base conditions. Intersections with approaches that operate at LOS “E” or “F” under the base conditions include: Clover Street, Wegmans driveway, French Road, Woodland Road, and Sutherland Street. Under the future no-build conditions, the list of intersections with LOS “E” or “F” remains unchanged. Future 2020 Intersection Capacity Utilization Intersection Capacity Utilization can be thought of as an intersection-wide volume-to-capacity ratio. ICU is an ideal technique for transportation planning studies, future roadway design considerations, and congestion management/mitigation programs. Based upon a review of the ICU results, the most congested conditions occur during the PM peak hour. Under the base conditions, the Clover Street and Main Street intersections are operating at 88% and 80% of their capacity, respectively. Under future traffic
conditions, these intersections are utilizing 95% and 85% of their capacity. ICU’s in the range of 82% to 91% are considered to be on the verge on congested conditions with long delays at signalized intersections. Intersections with ICU’s between 91% and 100% are over capacity and typically experience periods of congestions between 15 and 60 minutes per day.
TRAVEL TIME SURVEYS Communities today face tough challenges when investing in transportation projects and programs. In a time of constrained budgets, municipalities are expected to do more with less and to appease a wide range of
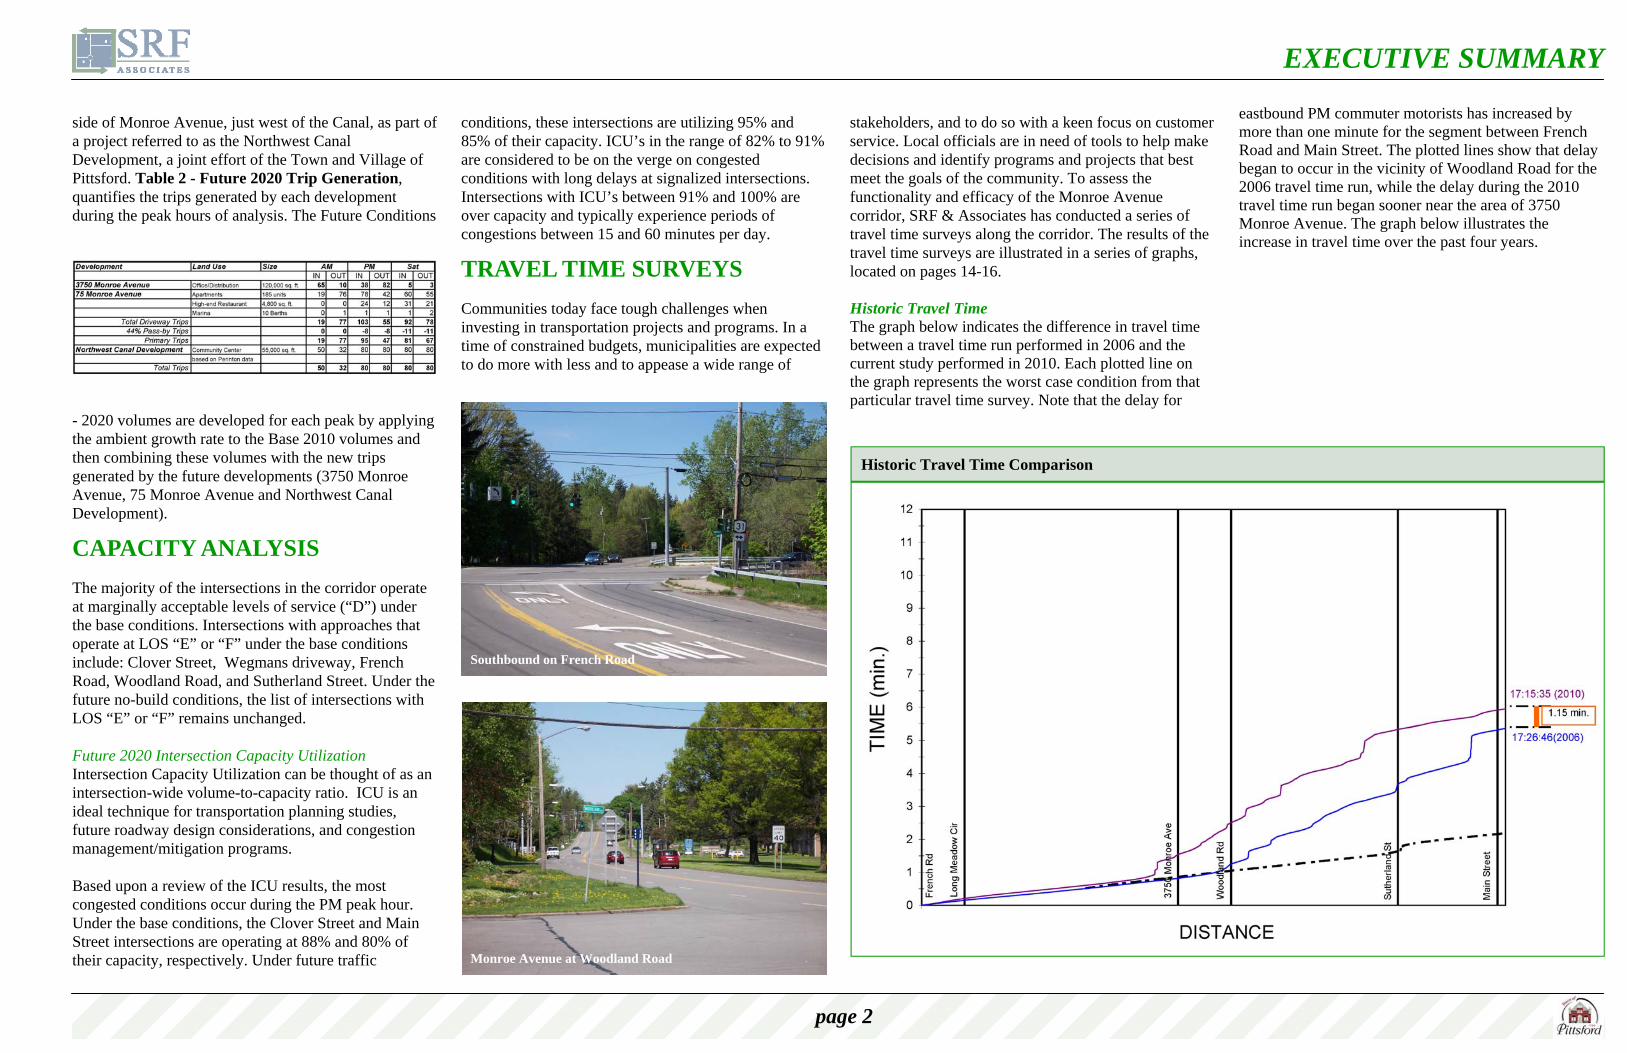
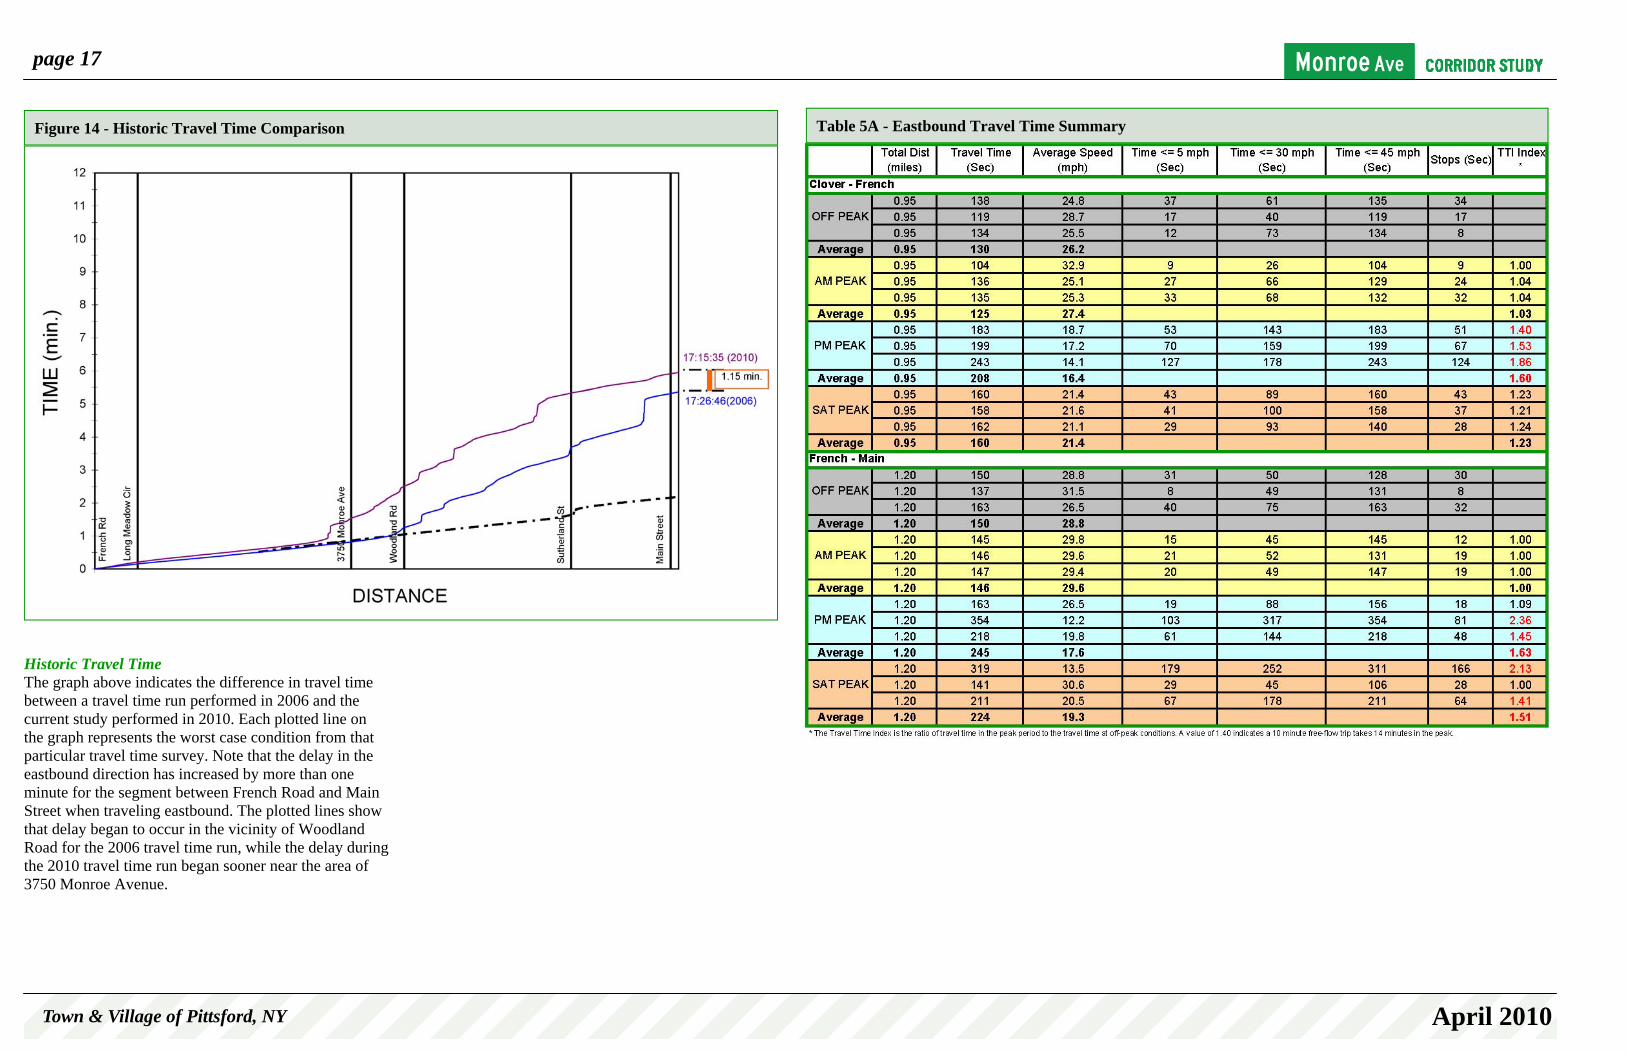
stakeholders, and to do so with a keen focus on customer service. Local officials are in need of tools to help make decisions and identify programs and projects that best meet the goals of the community. To assess the functionality and efficacy of the Monroe Avenue corridor, SRF & Associates has conducted a series of travel time surveys along the corridor. The results of the travel time surveys are illustrated in a series of graphs, located on pages 14-16. Historic Travel Time The graph below indicates the difference in travel time between a travel time run performed in 2006 and the current study performed in 2010. Each plotted line on the graph represents the worst case condition from that particular travel time survey. Note that the delay for
eastbound PM commuter motorists has increased by more than one minute for the segment between French Road and Main Street. The plotted lines show that delay began to occur in the vicinity of Woodland Road for the 2006 travel time run, while the delay during the 2010 travel time run began sooner near the area of 3750 Monroe Avenue. The graph below illustrates the increase in travel time over the past four years.
Southbound on French Road
Monroe Avenue at Woodland Road
Historic Travel Time Comparison
EXECUTIVE SUMMARY
Town & Village of Pittsford, NY April 2010
page 1
INTRODUCTION
Today’s community transportation issues involve much more than moving vehicles and preserving safety and efficiency of travel. Public safety, economic development, the environment and quality of life are also very important in understanding transportation problems and solutions. Well designed and integrated transportation, land use, and circulation systems help preserve a sense of community, foster economic development goals, and preserve both public and private investment. Transportation is a key quality of life issure for communities. This study has been commissioned by the Town and Village of Pittsford to report on current traffic conditions along the Monroe Avenue corridor and to project future traffic conditions based on development scenarios provided by the Town and Village. Project Purpose The purpose of the Monroe Avenue Corridor Study is to help the Town and Village of Pittsford understand the current state of transportation operations within the corridor.
The study seeks to serve as a documented baseline upon which additional traffic in the corridor can be monitored, and decisions regarding highway improvements and/or changes in land use can be made.
The Study Area & Existing Highway System Monroe Avenue is a bustling state road that serves multiple purposes for its users. Especially during the morning and evening peak hours, commuter through traffic places the heaviest demand on the corridor. Monroe Avenue is also home to a large number of businesses, both small and large. These businesses benefit greatly from a steady stream of pass-by traffic on Monroe Avenue and convenient access to and from their driveways. The Monroe Avenue corridor also has several single family homes in the area southeast of French Road and within the Village of Pittsford. It is imperative that the corridor remains convenient for
through travel by the commuter, accessible to consumers looking to patronize the corridor’s restaurants and stores, and remain safe and convenient for residents who live along Monroe Avenue. No one competing interest should dominate the future of the corridor. If properly planned and developed, the corridor should be able to serve all of these needs by striking an optimal balance between efficiency and accessibility.
The Monroe Avenue Corridor Study involves the segment of Monroe Avenue between Clover Street at the northwest end of the study area, and Main Street (Route 96) in the Village of Pittsford. This study includes 10 intersections, 7 of which are signalized. The existing street is generally a five-lane undivided arterial street with the following characteristics: Functional classification: principal arterial Speed limit: 30-45 mph Center turn lane: TWLTL with turn bays at intersections Transit: regional route
CONTEXT ZONES
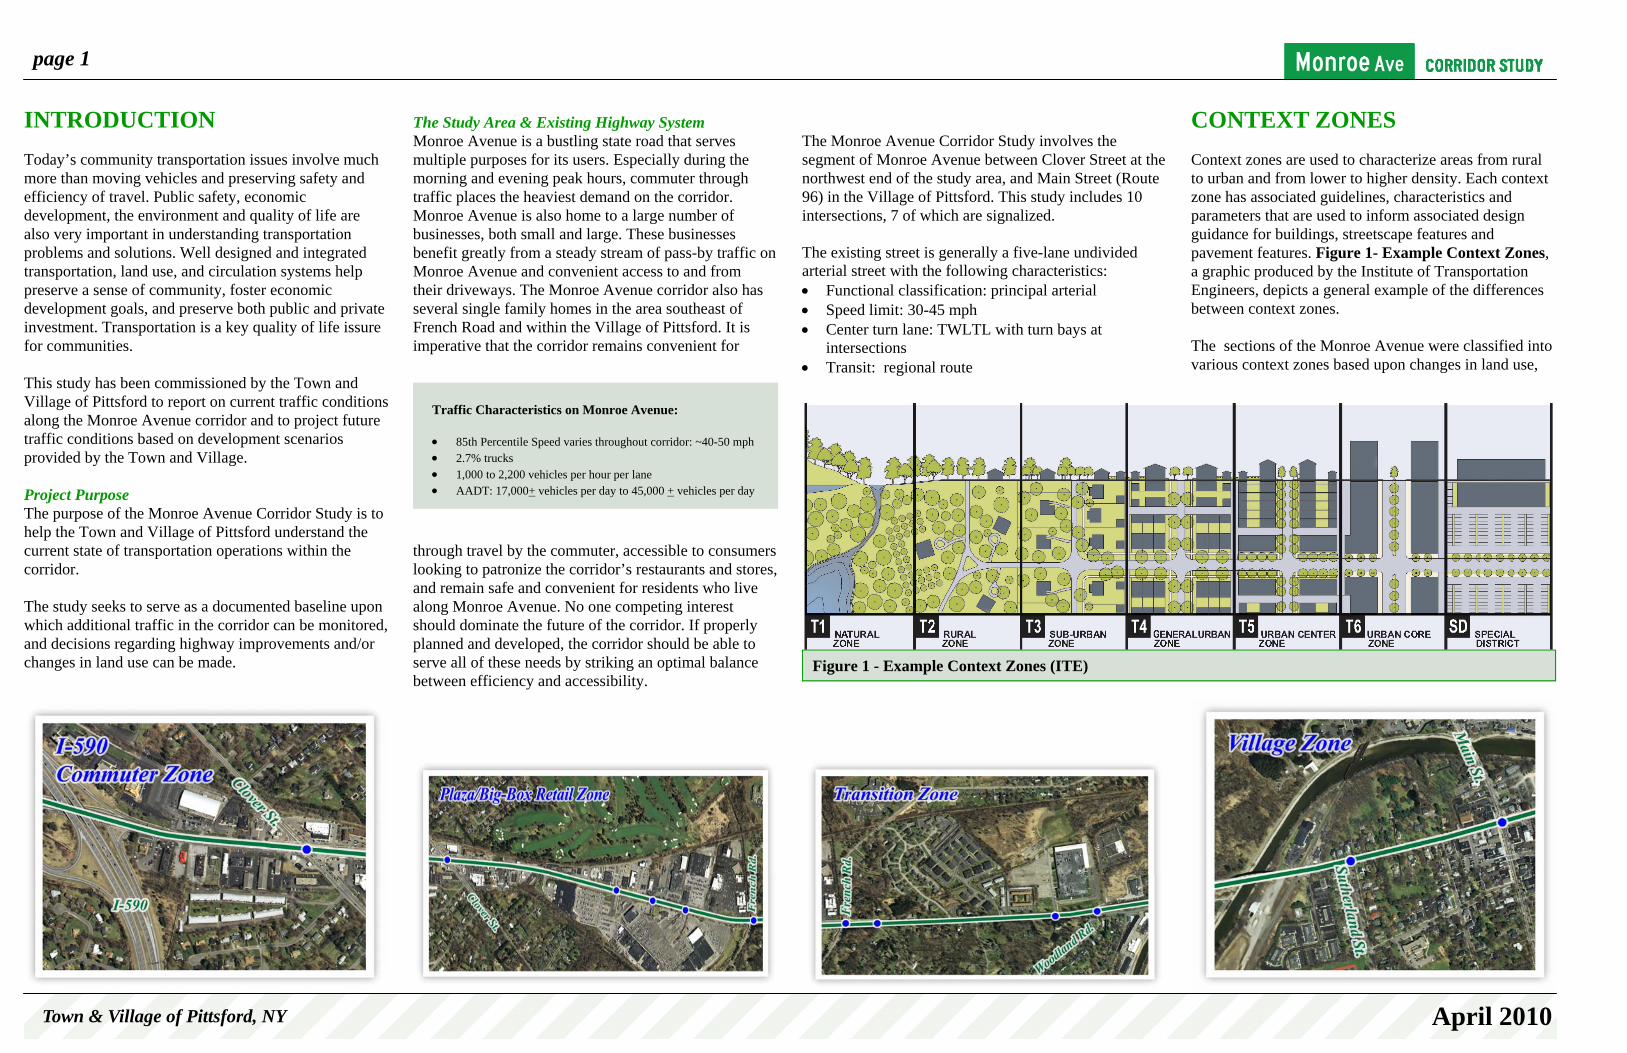
Context zones are used to characterize areas from rural to urban and from lower to higher density. Each context zone has associated guidelines, characteristics and parameters that are used to inform associated design guidance for buildings, streetscape features and pavement features. Figure 1- Example Context Zones, a graphic produced by the Institute of Transportation Engineers, depicts a general example of the differences between context zones. The sections of the Monroe Avenue were classified into various context zones based upon changes in land use,
Traffic Characteristics on Monroe Avenue: 85th Percentile Speed varies throughout corridor: ~40-50 mph 2.7% trucks 1,000 to 2,200 vehicles per hour per lane AADT: 17,000+ vehicles per day to 45,000 + vehicles per day
Figure 1 - Example Context Zones (ITE)

page 2
landscaping, traffic volumes and other characteristics. . Monroe Avenue is by no means a homogeneous corridor. The corridor can be visualized more simply when it is classified into different context zones. Starting at the northwest end of the corridor, there is the I-590 Commuter Zone, characterized by the freeway interchange and several restaurants and small shops. Generally, the heaviest traffic on the entire corridor is within this zone. Traveling further east between Clover Street and French Road is the Plaza/Big Box Retail Zone. Wegmans supermarket and Pittsford Plaza generate a large portion traffic in this segment. Between French Road and Woodland Road is the Transition Zone, which features several single-family homes and office buildings. The southeast end of the corridor is anchored by the Village Zone, featuring single-family homes and a small-scale retail node at the Main Street intersection.
HISTORY OF MONROE AVENUE Monroe Avenue through Pittsford was first constructed in 1805. Present-day Route 31 was one of several “state” roads built in western New York to encourage settlement of the region. The beginnings of Pittsford village, consisting of a tavern, stable, livery, stores, and homes developed around the intersection of Monroe Avenue Main Street. Main Street, and its extension of East Avenue and Pittsford Mendon Road, constituted the primary road linking the Genesee falls in Rochesterville with the region’s first and earliest settlement in Canandaigua. Through the nineteenth century, Monroe Avenue remained a narrow dirt road. After the incorporation of Pittsford Village in 1827, street trees, grading for drainage and wooden sidewalks were installed along the village stretch of the road. At about the same time, the grand Spring House was constructed to accommodate those who wished to “take the waters” in the springs located on what is now Oak Hill Country Club. Although the road was built for regional traffic, the opening of the parallel Erie Canal (1824) and the
Rochester and Auburn Rail Road (1834) diverted most commercial traffic. Outside of the village, the Town paid farmers to act as “roadmasters” by cutting weeds and ensuring the road remained passable. In 1902, an electrically powered “interurban” trolley was constructed along the north side of Monroe Avenue, putting the area within easy commuting distance to downtown Rochester. A decade later, the development of the Longmeadow neighborhood represented the beginning of Pittsford’s transition from rural town to residential suburb. During the twentieth century, Monroe Avenue was improved and transformed into an important regional thoroughfare. After 1900, the popularization of automobiles created a need for better roads. In 1908, the New York State Legislature included Monroe Avenue as part of a new statewide legislative route system that initially consisted of 37 unsigned routes. In 1916, the village section of Monroe Avenue was paved with brick and the town section was paved with asphalt several years later. Originally designated as part of State Route 14, Monroe Avenue was designated as NY Route 31 in 1924 when the state officially began posting route numbers. Efforts to widen Monroe Avenue began when a four-lane bridge over the canal was installed in 1940. The opening of Pittsford Plaza in 1963 and the region’s suburban growth during the 1960s, 1970s and 1980s significantly increased traffic volumes along the roadway. The New York State Department of Transportation attempted to reduce congestion adding turn lanes to the Four Corners intersection within the village in 1987 and providing a continuous left turn lane between French Road and Clover Street. Over the last several decades, Pittsford residents have become more concerned about the negative effects of road widening on livable neighborhoods, walkable streets and general safety. Protecting community character and safe pedestrian friendly streets emerged as a community issue in the 1980s and remains an important topic today. The issue was addressed in both the Village’s 2004 Traffic Calming Plan as well as the Town of Pittsford’s 2009 Comprehensive Plan update.
EXISTING TRAFFIC CONDITIONS
Peak Intervals for Analysis Given the functional characteristics of the corridor (i.e. Monroe Avenue is a primary commuter route) and the land uses that fall under the current zoning along the corridor (residential, retail/service, office), the peak hours selected for the analysis were the weekday AM and PM commuter peaks. In addition, the Saturday midday peak period was evaluated due to the abundant retail uses in the corridor. Existing Traffic Volume Data Vehicular turning movement counts were performed to establish baseline traffic conditions on Monroe Avenue. Counts were completed at ten key intersections including: 1. Clover Street (Rt. 65) 2. Wegmans driveway 3. Pittsford Plaza/McDonald’s driveway 4. Cheesecake Factory driveway 5. French Road 6. Longmeadow Circle 7. 3750 Monroe Avenue driveway 8. Woodland Road 9. Sutherland Street 10. Main Street (Rt. 96) Turning movement counts were completed between the middle of January and the first days of February, between 7:00-9:00AM, 4:00-6:00PM, and 11:30-1:30PM for the AM, PM, and Saturday peak periods, respectively. Given that the turning movement data was collected in the winter months, when traffic is typically lighter than average, an analysis of seasonal traffic trends on Monroe Avenue was performed. Figure 2 - Seasonal Analysis, illustrates the seasonal variation of the corridor. The results of the seasonal analysis indicate that for the Monroe Avenue corridor, January and February
experience slightly lower traffic volumes than average. The months of April, May, September, and October were representative of slightly above average traffic volumes. Therefore, adjustments were made to the raw turning movement count data to reflect higher, more typical traffic on the corridor. The bar graph above depicts the seasonal variation in traffic. The raw turning movement count data was balanced between adjacent intersections to correct for through volume discrepancies caused by the nature of turning movement counts as unique events isolated in time. The peak hour turning movement counts are illustrated in Figure 3 - Existing Conditions 2010 on the following page. Field Observations All intersections included in the project area were observed during peak intervals to assess existing traffic operating conditions at each intersection. Signal timing information was collected at the signalized intersections to determine peak hour phasing plans and phase durations during each interval (i.e. cycle length, concurrent and opposing movements, green time for each movement, and clearance intervals, etc).
Figure 2 - Seasonal Analysis

Figure 3 - Existing Conditions 2010
page 3
page 4
Corridor Traffic Variations Average Daily Traffic is highly variable along the corridor. In the I-590 Commuter Zone, daily traffic volumes can be as high as 45,000 vehicles per day (vpd). However, lower traffic segments of the corridor, such as the Transition Zone feature significantly less daily traffic. Figure 4 shows the average daily traffic in each segment along Monroe Avenue based upon the turning movement count data. The chart shows the variability in ADT between each segment. Traffic volumes decrease significantly between I-590 and the Village of Pittsford from approximately 45,000 vpd to less than 20,000 vpd. Similarly, Figure 5 shows the variation in the eastbound PM peak hour directional traffic volumes. Eastbound segment volumes were used a basis for this analysis because they are generally higher than westbound traffic volumes during the critical PM peak hour .
2010 BASE TRAFFIC CONDITIONS There is currently one significant development project that is under construction in the Town of Pittsford. The Buckingham development is located in the segment between Clover Street and the Wegmans driveway. Based on discussions with the Town, the Buckingham development will be composed of 20,400 square feet of high-end retail development. No specific tenants are identified at this time. This development is included in the base conditions. The resulting volumes for Base Conditions are illustrated in Figure 7 - Base Conditions - 2010.
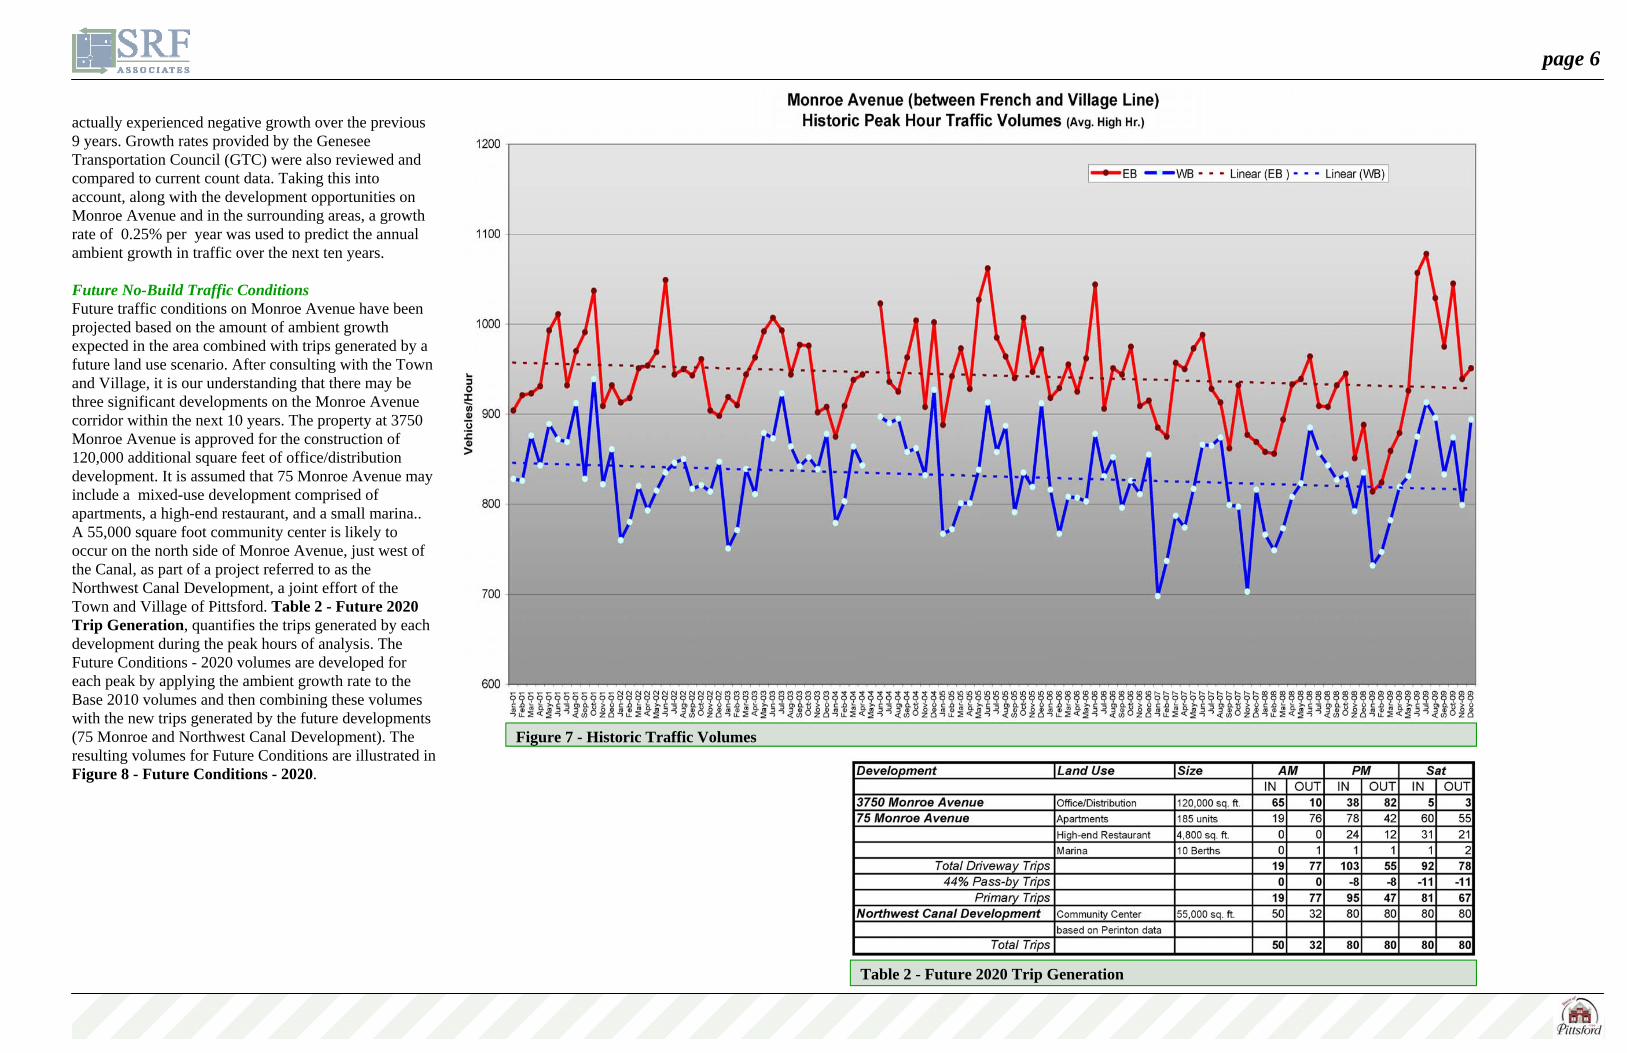
2020 FUTURE TRAFFIC CONDITIONS Historic Traffic Volumes Historic traffic volumes indicate the trend in traffic growth along the corridor. Detailed data on the segment
between French Road at the Village line was obtained from New York State Department of Transportation (NYSDOT) Data Services Bureau. The analyzed data set includes average peak hour data for every month of the year between 2001 and 2009. Although average traffic volumes can vary by more than one hundred cars in each direction per day, the linear regression trend line on Figure 7 - Historic Traffic Volumes (next page) indicates that the corridor has
Table 1 - Base 2010 Trip Generation
Figure 4 - Monroe Ave. PM Peak Hour Volumes by Segment Figure 5 - Monroe Ave. Average Daily Traffic by Segment
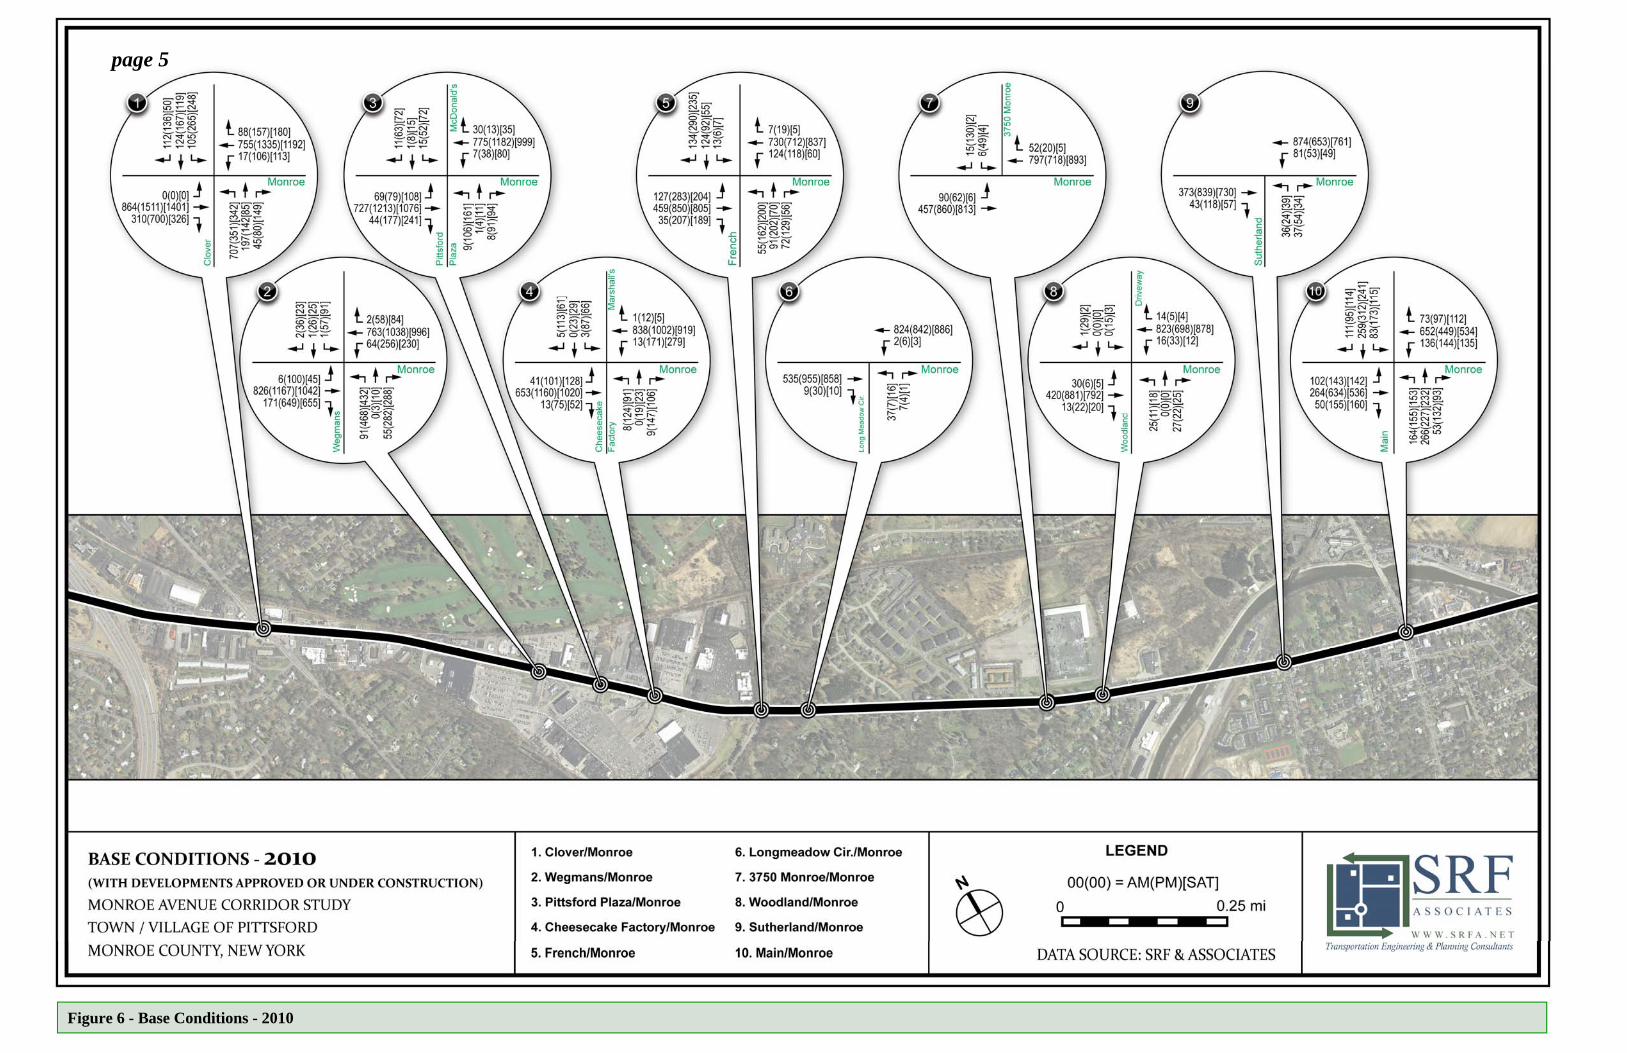
Figure 6 - Base Conditions - 2010
page 5
page 6
actually experienced negative growth over the previous 9 years. Growth rates provided by the Genesee Transportation Council (GTC) were also reviewed and compared to current count data. Taking this into account, along with the development opportunities on Monroe Avenue and in the surrounding areas, a growth rate of 0.25% per year was used to predict the annual ambient growth in traffic over the next ten years. Future No-Build Traffic Conditions Future traffic conditions on Monroe Avenue have been projected based on the amount of ambient growth expected in the area combined with trips generated by a future land use scenario. After consulting with the Town and Village, it is our understanding that there may be three significant developments on the Monroe Avenue corridor within the next 10 years. The property at 3750 Monroe Avenue is approved for the construction of 120,000 additional square feet of office/distribution development. It is assumed that 75 Monroe Avenue may include a mixed-use development comprised of apartments, a high-end restaurant, and a small marina.. A 55,000 square foot community center is likely to occur on the north side of Monroe Avenue, just west of the Canal, as part of a project referred to as the Northwest Canal Development, a joint effort of the Town and Village of Pittsford. Table 2 - Future 2020 Trip Generation, quantifies the trips generated by each development during the peak hours of analysis. The Future Conditions - 2020 volumes are developed for each peak by applying the ambient growth rate to the Base 2010 volumes and then combining these volumes with the new trips generated by the future developments (75 Monroe and Northwest Canal Development). The resulting volumes for Future Conditions are illustrated in Figure 8 - Future Conditions - 2020.
Table 2 - Future 2020 Trip Generation
Figure 7 - Historic Traffic Volumes
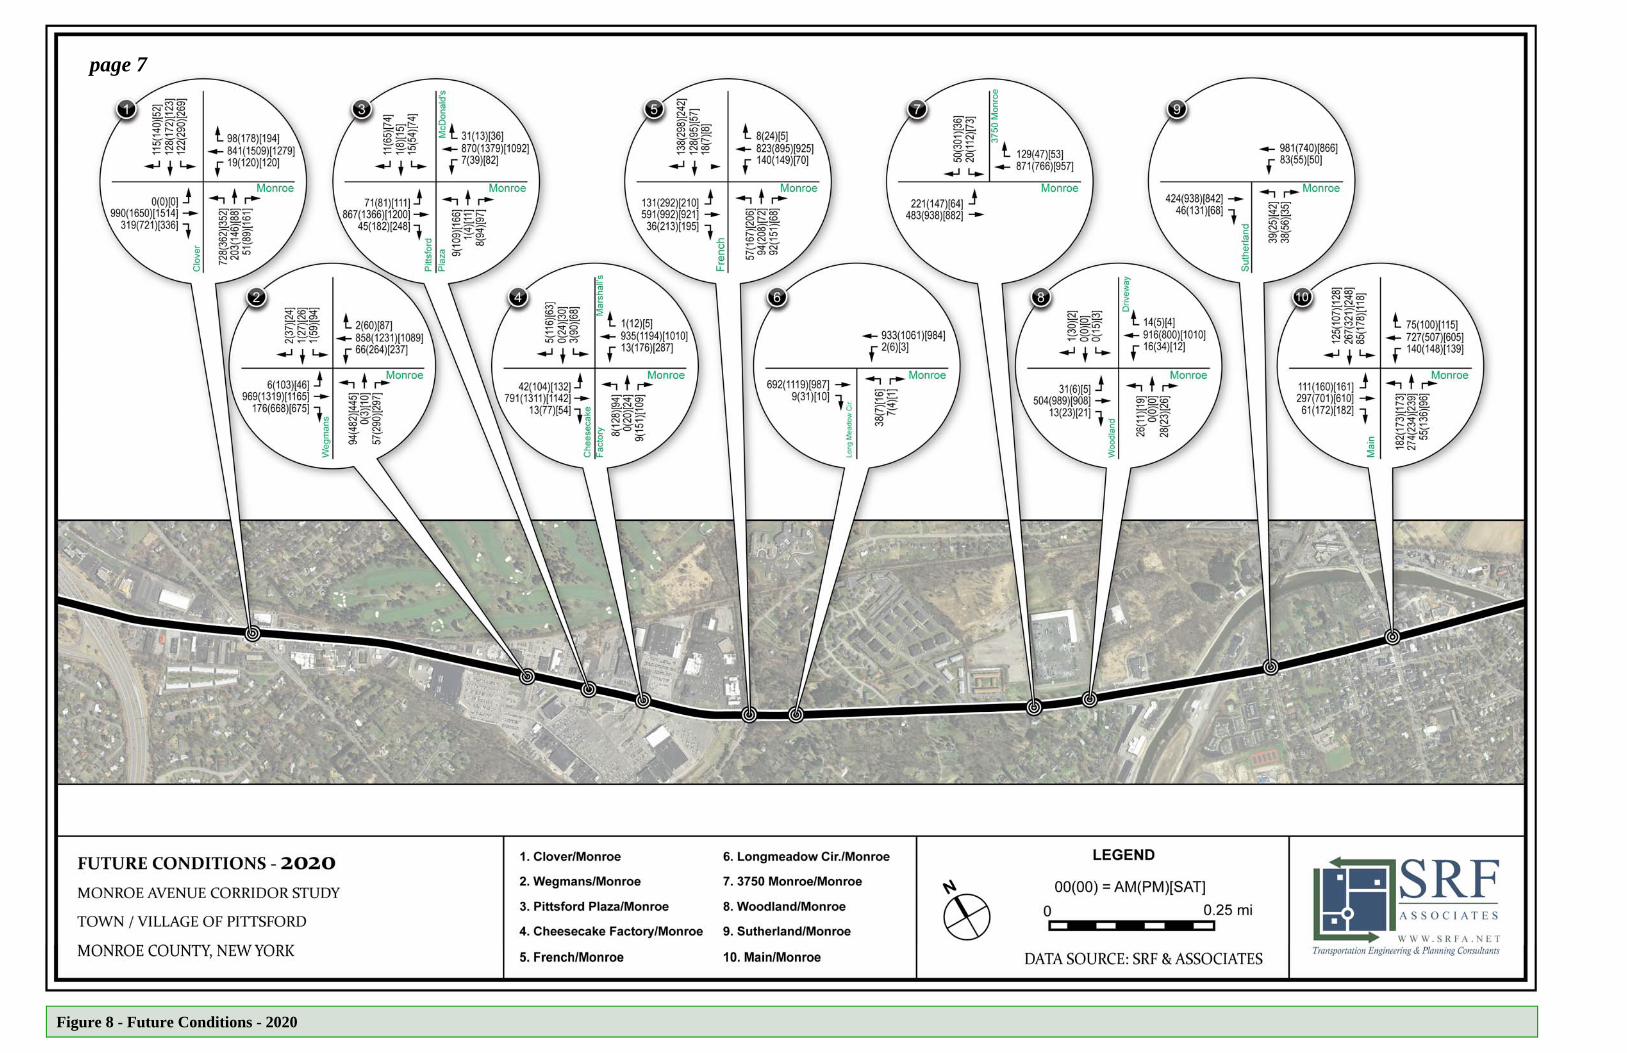
Figure 8 - Future Conditions - 2020
page 7
page 8
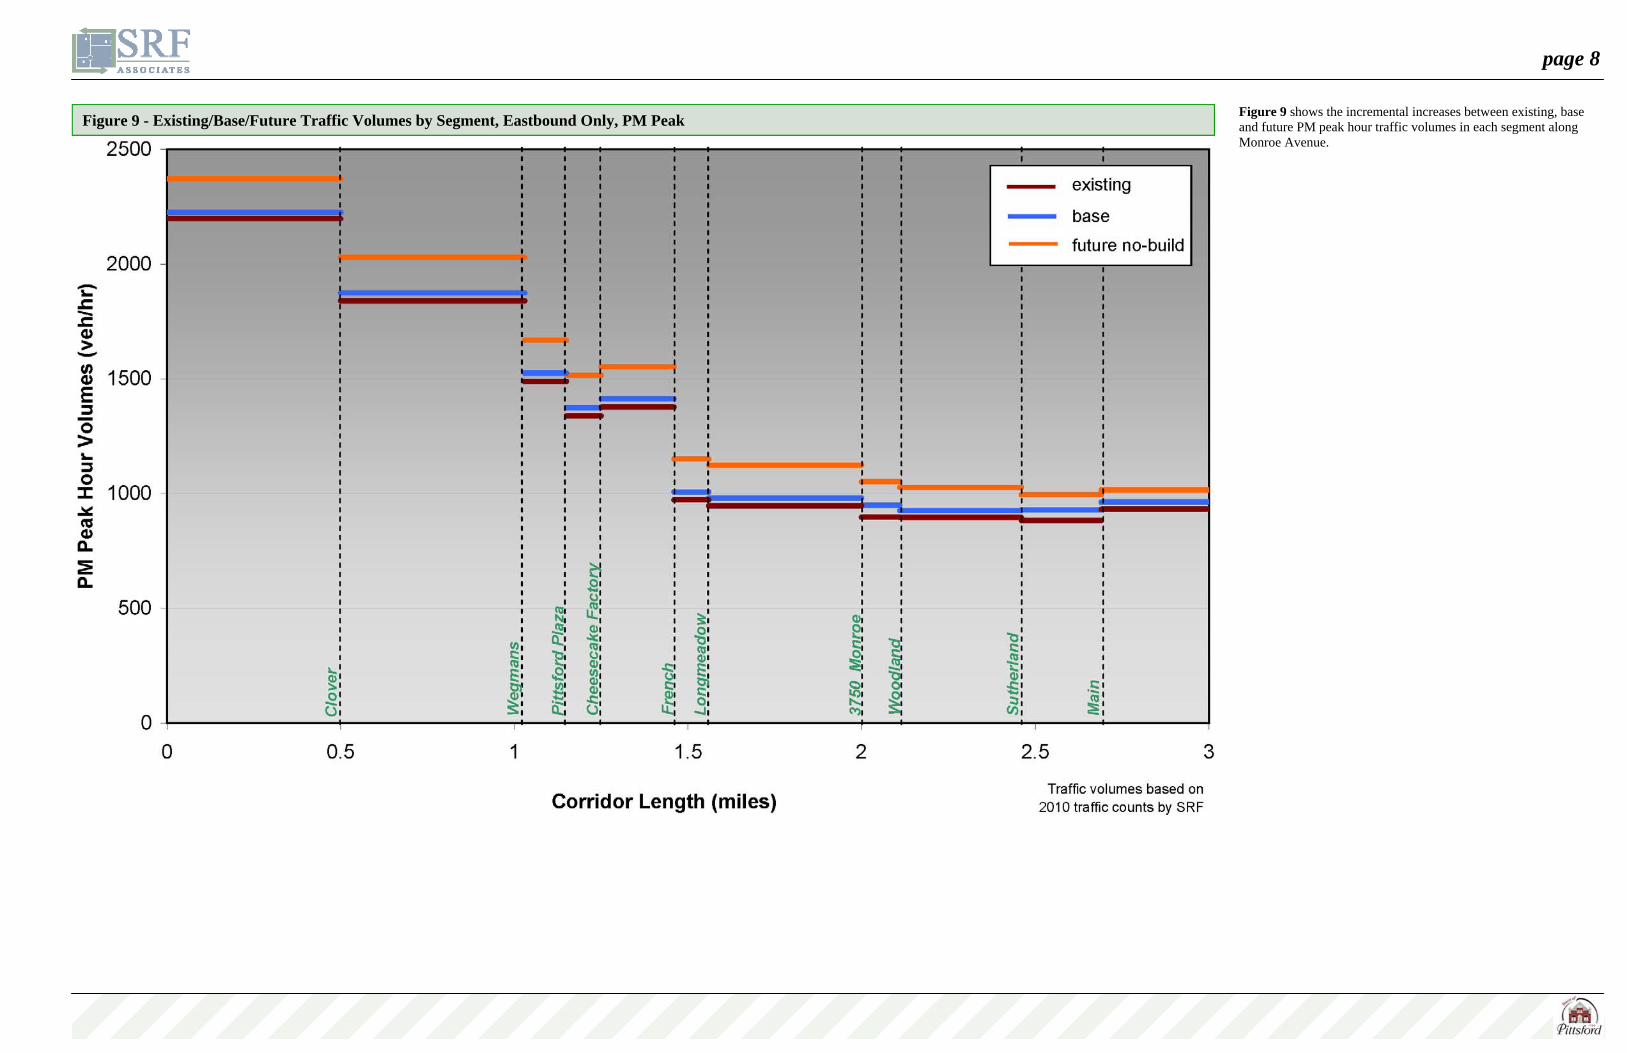
Figure 9 - Existing/Base/Future Traffic Volumes by Segment, Eastbound Only, PM Peak Figure 9 shows the incremental increases between existing, base and future PM peak hour traffic volumes in each segment along Monroe Avenue.
Town & Village of Pittsford, NY April 2010
page 9
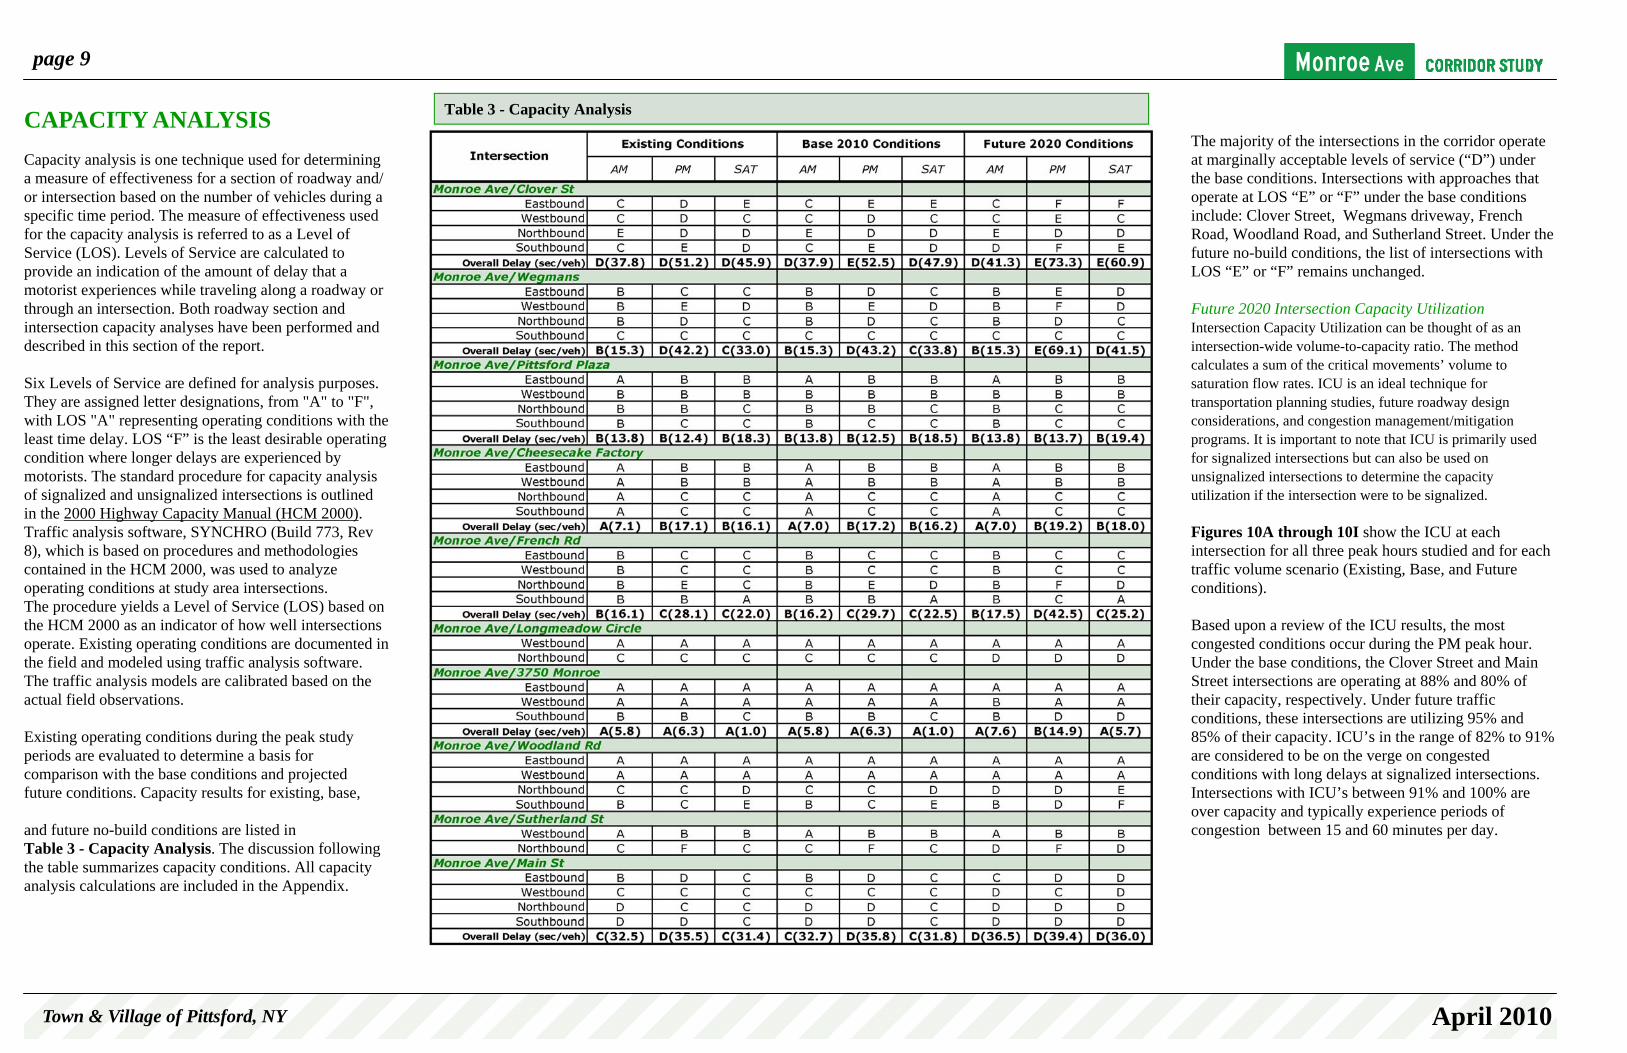
CAPACITY ANALYSIS Capacity analysis is one technique used for determining a measure of effectiveness for a section of roadway and/or intersection based on the number of vehicles during a specific time period. The measure of effectiveness used for the capacity analysis is referred to as a Level of Service (LOS). Levels of Service are calculated to provide an indication of the amount of delay that a motorist experiences while traveling along a roadway or through an intersection. Both roadway section and intersection capacity analyses have been performed and described in this section of the report. Six Levels of Service are defined for analysis purposes. They are assigned letter designations, from "A" to "F", with LOS "A" representing operating conditions with the least time delay. LOS “F” is the least desirable operating condition where longer delays are experienced by motorists. The standard procedure for capacity analysis of signalized and unsignalized intersections is outlined in the 2000 Highway Capacity Manual (HCM 2000). Traffic analysis software, SYNCHRO (Build 773, Rev 8), which is based on procedures and methodologies contained in the HCM 2000, was used to analyze operating conditions at study area intersections. The procedure yields a Level of Service (LOS) based on the HCM 2000 as an indicator of how well intersections operate. Existing operating conditions are documented in the field and modeled using traffic analysis software. The traffic analysis models are calibrated based on the actual field observations. Existing operating conditions during the peak study periods are evaluated to determine a basis for comparison with the base conditions and projected future conditions. Capacity results for existing, base, and future no-build conditions are listed in Table 3 - Capacity Analysis. The discussion following the table summarizes capacity conditions. All capacity analysis calculations are included in the Appendix.
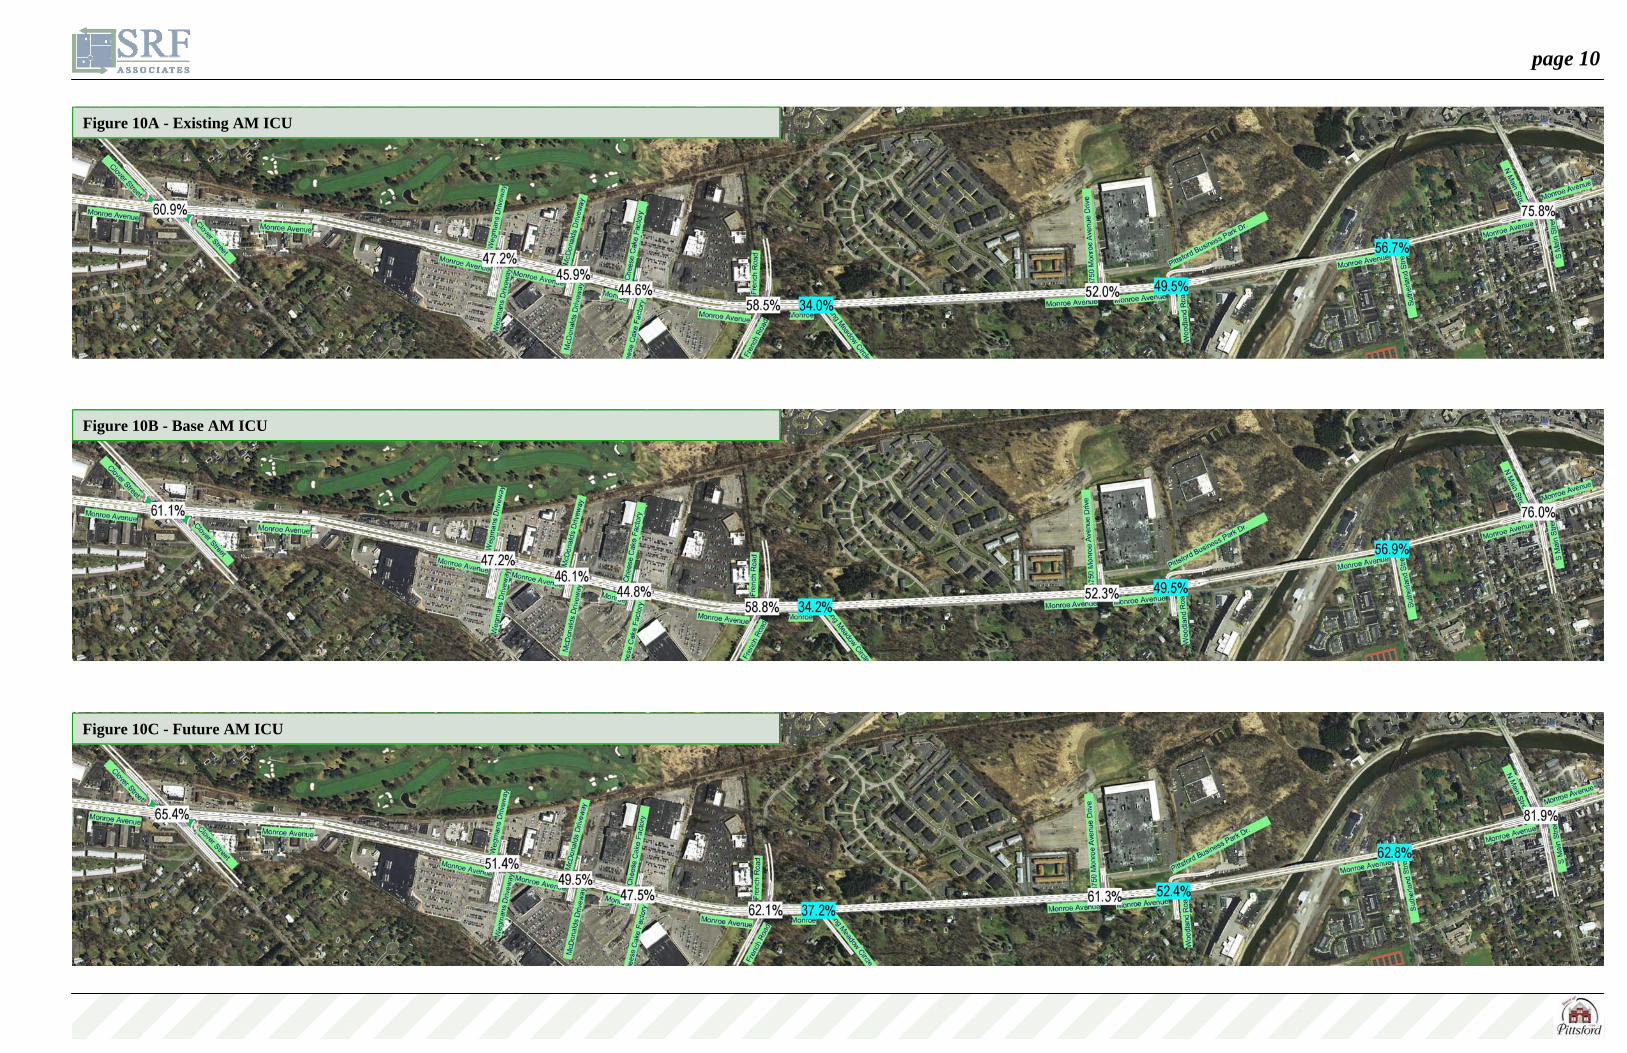
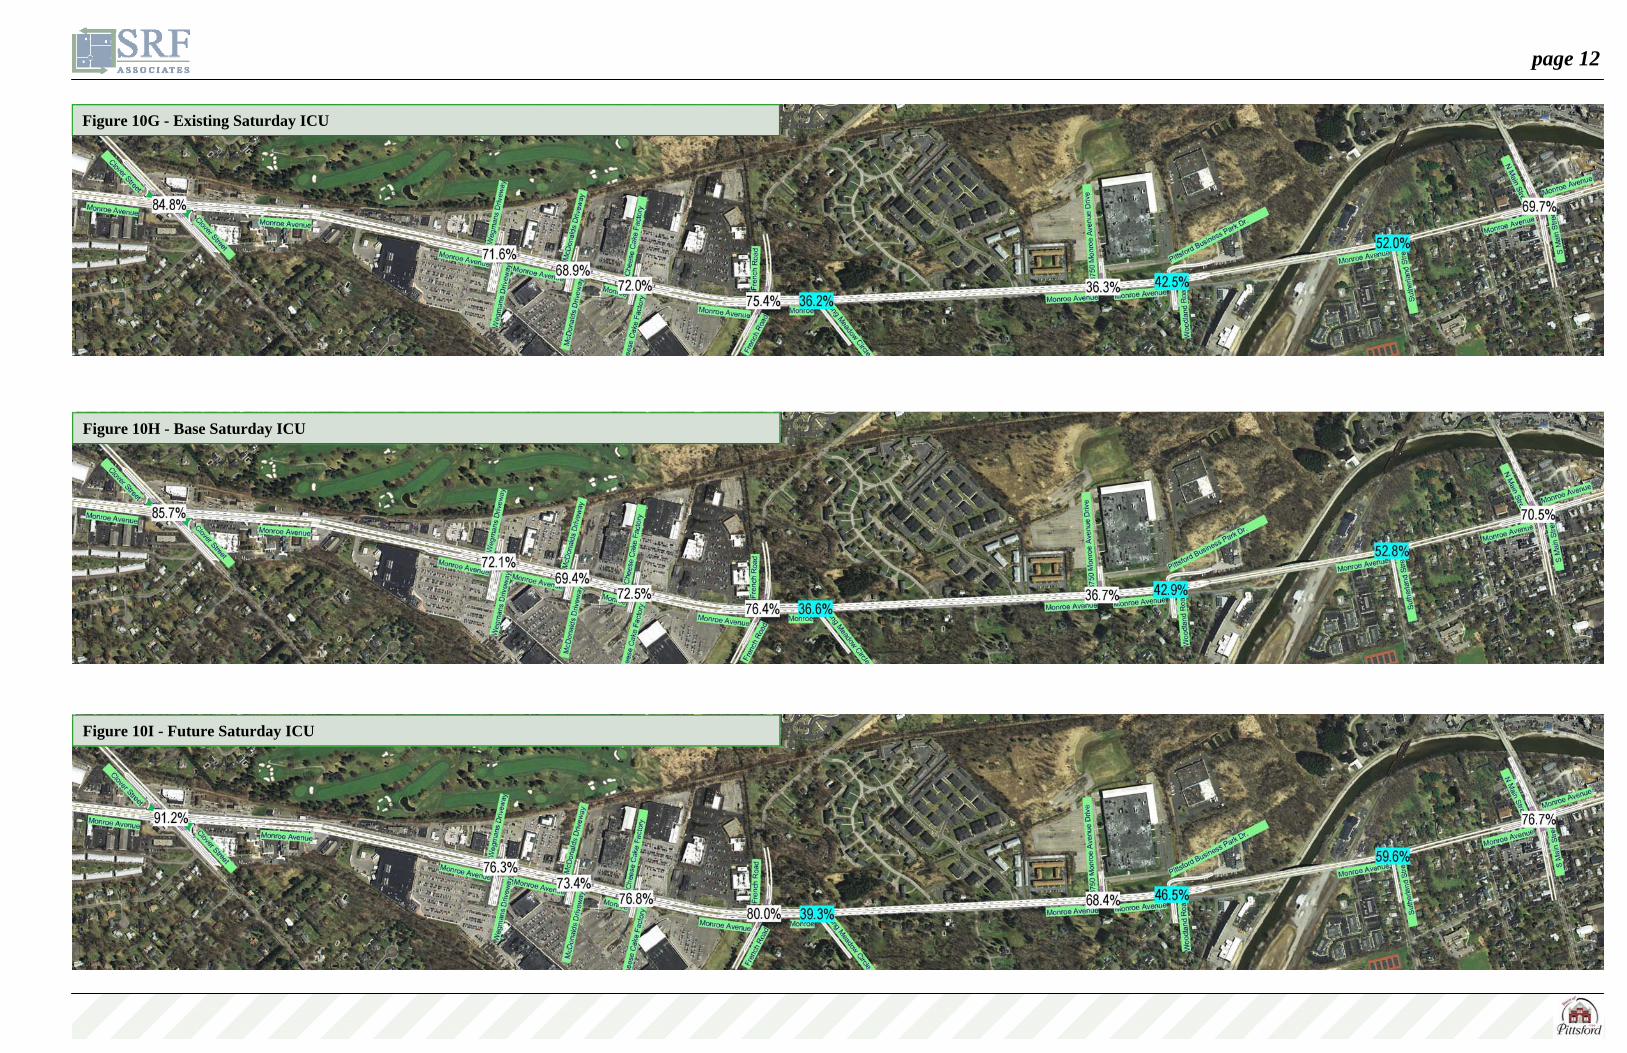
The majority of the intersections in the corridor operate at marginally acceptable levels of service (“D”) under the base conditions. Intersections with approaches that operate at LOS “E” or “F” under the base conditions include: Clover Street, Wegmans driveway, French Road, Woodland Road, and Sutherland Street. Under the future no-build conditions, the list of intersections with LOS “E” or “F” remains unchanged. Future 2020 Intersection Capacity Utilization Intersection Capacity Utilization can be thought of as an intersection-wide volume-to-capacity ratio. The method calculates a sum of the critical movements’ volume to saturation flow rates. ICU is an ideal technique for transportation planning studies, future roadway design considerations, and congestion management/mitigation programs. It is important to note that ICU is primarily used for signalized intersections but can also be used on unsignalized intersections to determine the capacity utilization if the intersection were to be signalized. Figures 10A through 10I show the ICU at each intersection for all three peak hours studied and for each traffic volume scenario (Existing, Base, and Future conditions). Based upon a review of the ICU results, the most congested conditions occur during the PM peak hour. Under the base conditions, the Clover Street and Main Street intersections are operating at 88% and 80% of their capacity, respectively. Under future traffic conditions, these intersections are utilizing 95% and 85% of their capacity. ICU’s in the range of 82% to 91% are considered to be on the verge on congested conditions with long delays at signalized intersections. Intersections with ICU’s between 91% and 100% are over capacity and typically experience periods of congestion between 15 and 60 minutes per day.
Table 3 - Capacity Analysis
page 10
Figure 10A - Existing AM ICU
Figure 10B - Base AM ICU
Figure 10C - Future AM ICU

Town & Village of Pittsford, NY April 2010
page 11
Figure 10D - Existing PM ICU
Figure 10E - Base PM ICU
Figure 10F - Future PM ICU
page 12
Figure 10G - Existing Saturday ICU
Figure 10H - Base Saturday ICU
Figure 10I - Future Saturday ICU

Town & Village of Pittsford, NY April 2010
page 13
can then be displayed over US Street Maps, Google Earth or using an excel format which can then be extracted to different formats allowing for compatibility with many mapping programs such as TransCAD or ArcGIS. The raw data files also contain information regarding acceleration and deceleration patterns, control delay, and stop delay. Corridor Performance Profile Analysis Time-distance diagrams were plotted in both directions for the weekday AM, PM, Off-peak and Saturday midday peak hours. These diagrams graphically show where and when a vehicle stops and starts and also depicts speed as indicated by the slope of the line between the start and stop points (e.g. a vertical line indicates no distance traveled, or a vehicle stopped in
TRAVEL TIME SURVEYS Communities today face tough challenges when investing in transportation projects and programs. In a time of constrained budgets, municipalities are expected to do more with less and to appease a wide range of stakeholders, and to do so with a keen focus on customer service. Local officials are in need of tools to help make decisions and identify programs and projects that best meet the goals of the community. To assess the functionality and efficacy of the Monroe Avenue corridor, SRF & Associates has conducted a series of travel time surveys along the corridor. Travel-time studies are widely used to document congestion and to quantify the impact of highway improvements. This type of performance measure represents a continuous measure, a real-time scenario. The reliability and practicality of this type of study will be useful when applied to the entire corridor. The examination of travel times along Monroe Avenue provides an accurate estimation of baseline conditions which shall provide reliable information for decision-makers.
Travel time data (i.e. time to travel the length of the corridor including delays related to driveways and intersections) was collected for both the eastbound and westbound directions along the length of the study corridor. The data collection, which occurred from 7:00am - 10:00am and from 4:00pm - 6:00pm on Tuesday, March 30, 2010 and from 11:30am - 1:30pm on Saturday, April 03, 2010, captured all three peak periods including the off-peak period (9.00 am - 10.00 am). One vehicle was used with a GPS device mounted on the front dash of the car in order to have an unobstructed sky view to obtain GPS satellite acquisition.
Bi-directional data were collected as the vehicle ran continuous loops throughout each study period. The driver was instructed to match the flow of traffic or to follow the posted speed limit; passing of vehicles did not occur. The number of travel runs per direction is dependent upon the amount of delay incurred. Table 4 summarizes the total number of travel runs per direction for the corridor. Methodology The GPS receiver used for this travel-time study is a custom-made Pocket Track Pro GPS receiver from Brickhouse Security. This unit has data logging capabilities that can store up to 100 hours of motion data. Each record stores time, latitude, longitude, and speed. The downloaded data from the Mini GPS Tracker
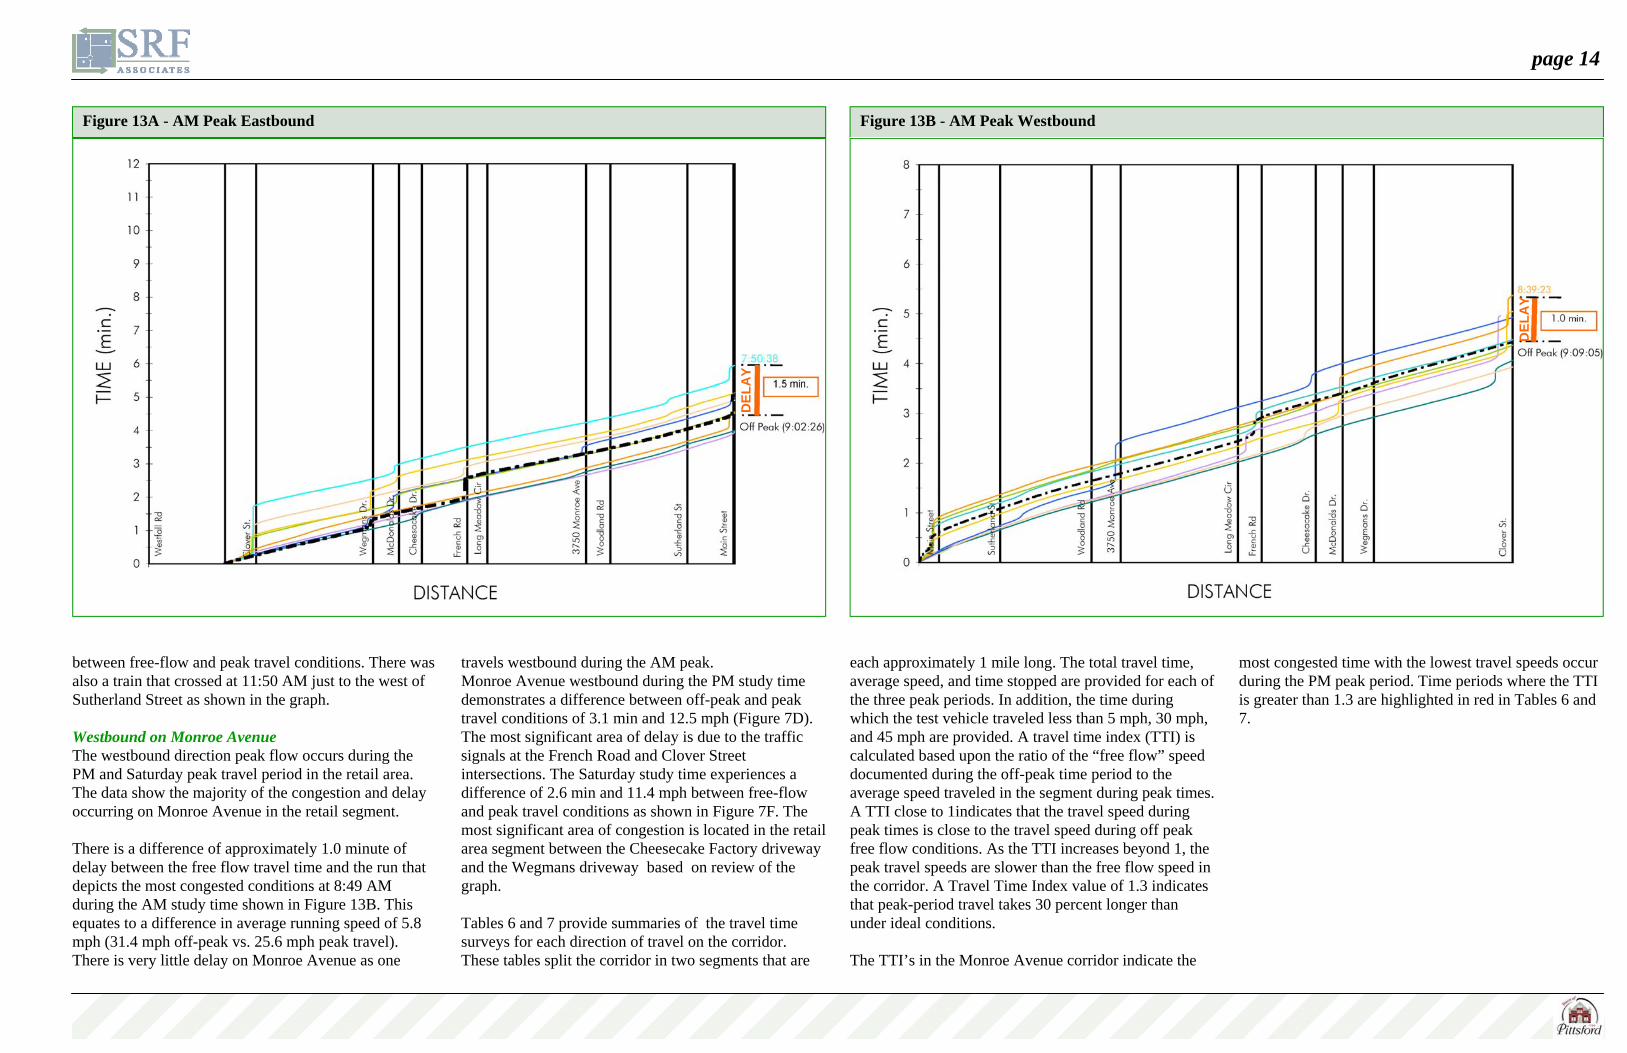
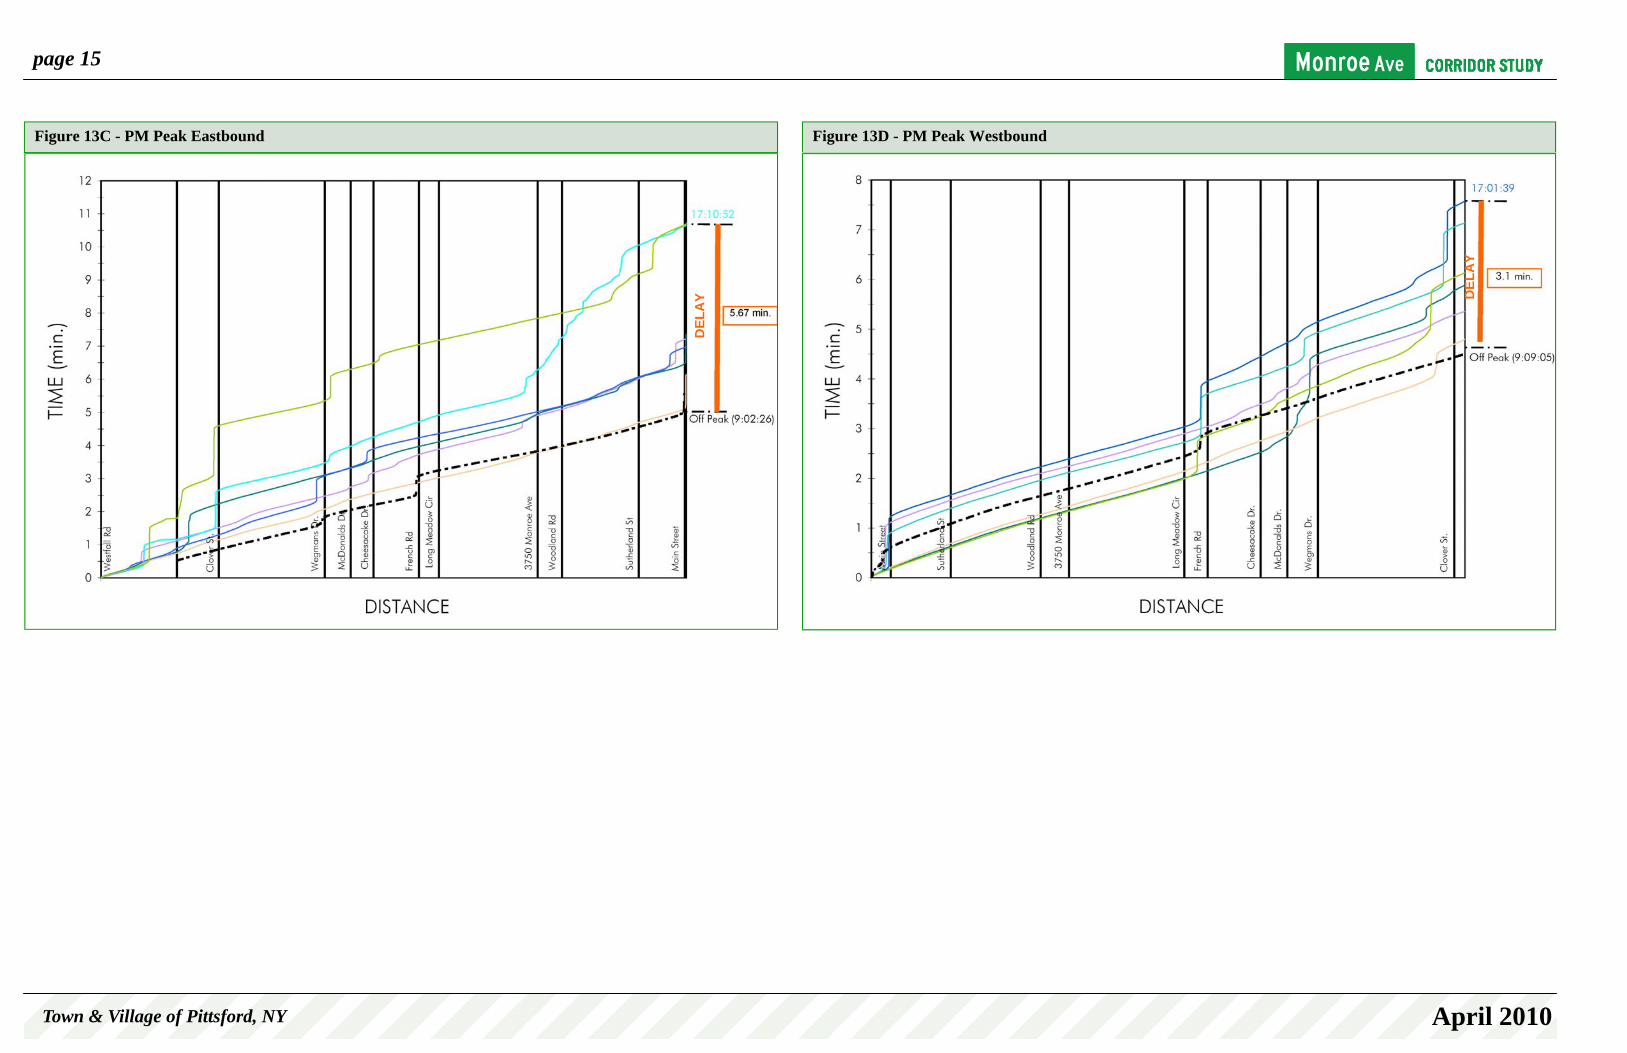
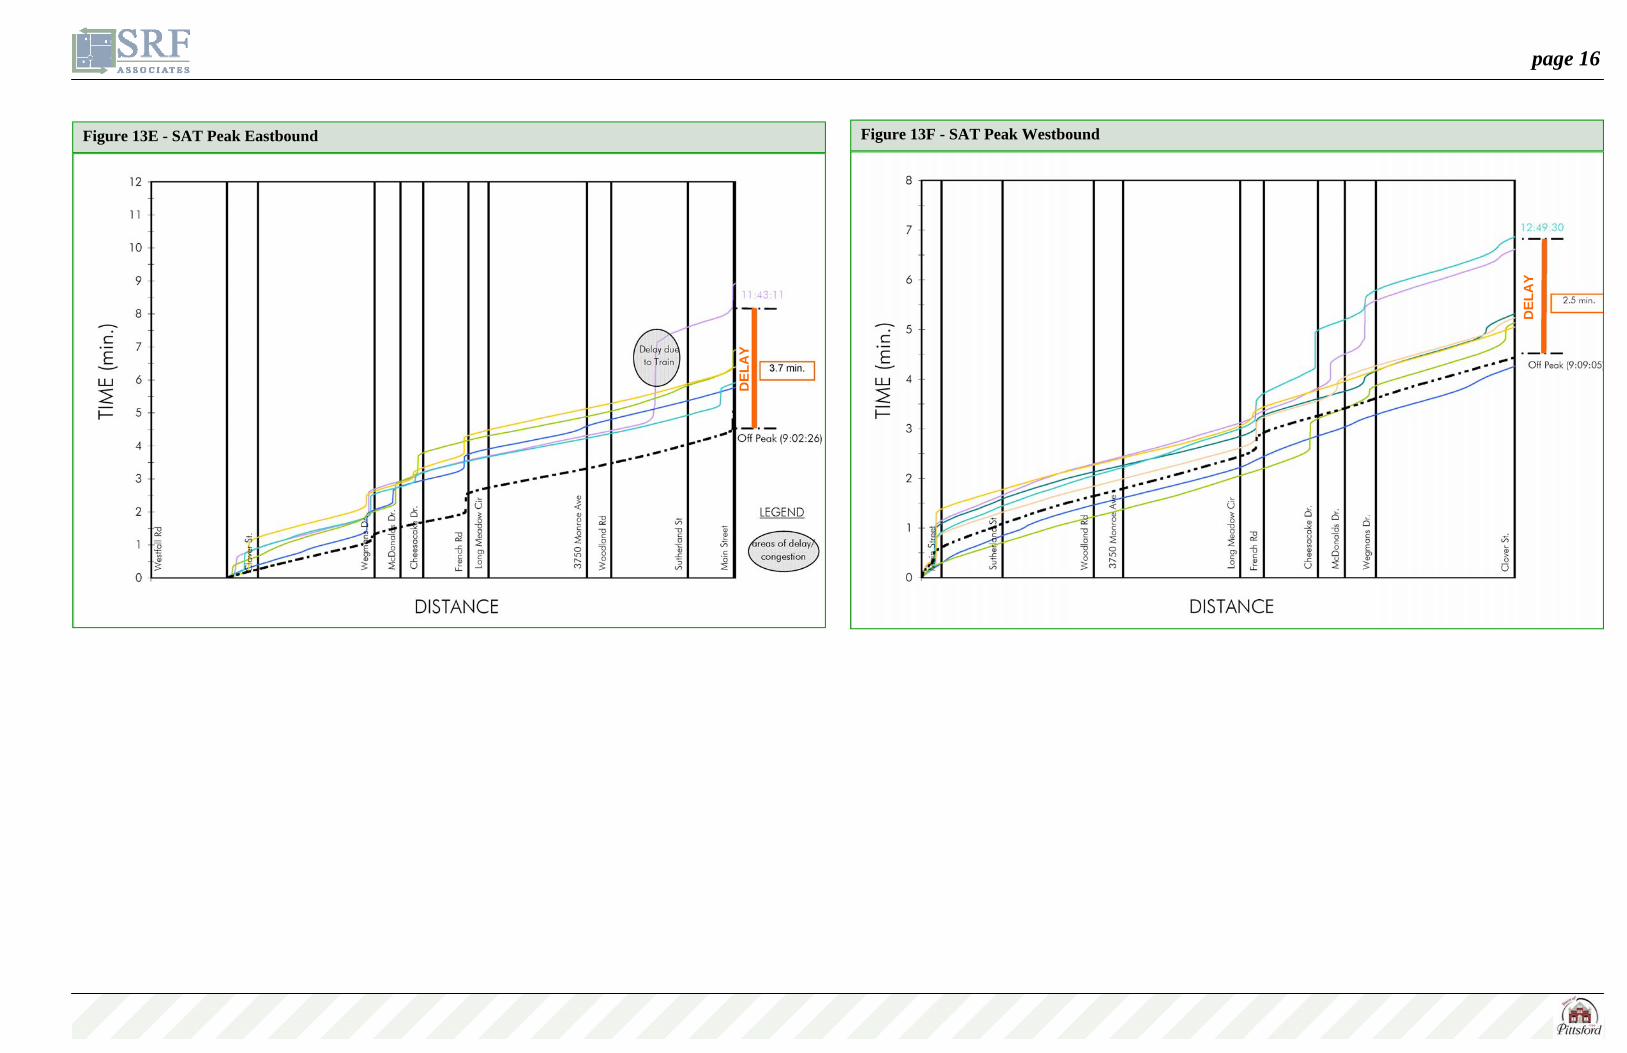
queue). Locating these critical points accurately is essential for computing various performance measures like traffic delay, stop delay, running speed, and average speed. This study resulted in the compilation of six graphs included on the following page. Each graph displays runs made during the 2-hour period. Some runs were intentionally omitted from the plot to avoid many overlapping lines. “Free-flow” time/speed is calculated based on the run completed during the off-peak period. Free-flow time/speed is the baseline comparison for all the other runs depicted on the graph. The peak run is the run that took the longest. Table 5 summarizes the findings based on these corridor performance profiles. Eastbound on Monroe Avenue Eastbound on Monroe Avenue is the peak flow direction during the PM commuter time period. The data shows a significant delay to the west of Clover Street and in the segment between Woodland Road and Main Street. There is very little congestion or delay during the AM and SAT peak time periods with the exception of one run. During that particular run, approximately 1.8 minutes of delay greater than the free-flow travel time occurred as a result traffic stopped due to a train. During the AM peak time period, the data show a difference of approximately 1.5 minutes of delay between the free-flow travel time and the most congested run at 7:50 AM (Figure 13A). This equates to a difference in average running speed of 8.7 mph (34.7 mph free-flow vs. 26.0 mph peak travel). There is very little delay on Monroe Avenue as one travels eastbound during the AM peak. Monroe Avenue eastbound during the PM study time (4pm - 6pm) experiences a difference of 5.7 min and 16.4 mph between free-flow and peak travel conditions . The most significant area of congestion is located between Woodland Road and Main Street and in the segment between Clover and the I-590 ramps based on review of the graph in Figure 13C. The Saturday study time (11:30am - 1:30pm) experiences a difference of 3.7 min and 15.6 mph
AM PM SAT
EB WB EB WB EB WB EB WB
8 8 6 6 7 7 4 4
Off-Peak
Table 4 - Number of Travel Time Runs
Figure 11A - Average Travel Speed, Eastbound Figure 11B - Average Travel Speed, Westbound
Figure 12A - Average Travel Time, Eastbound Figure 12B - Average Travel Time, Westbound
page 14
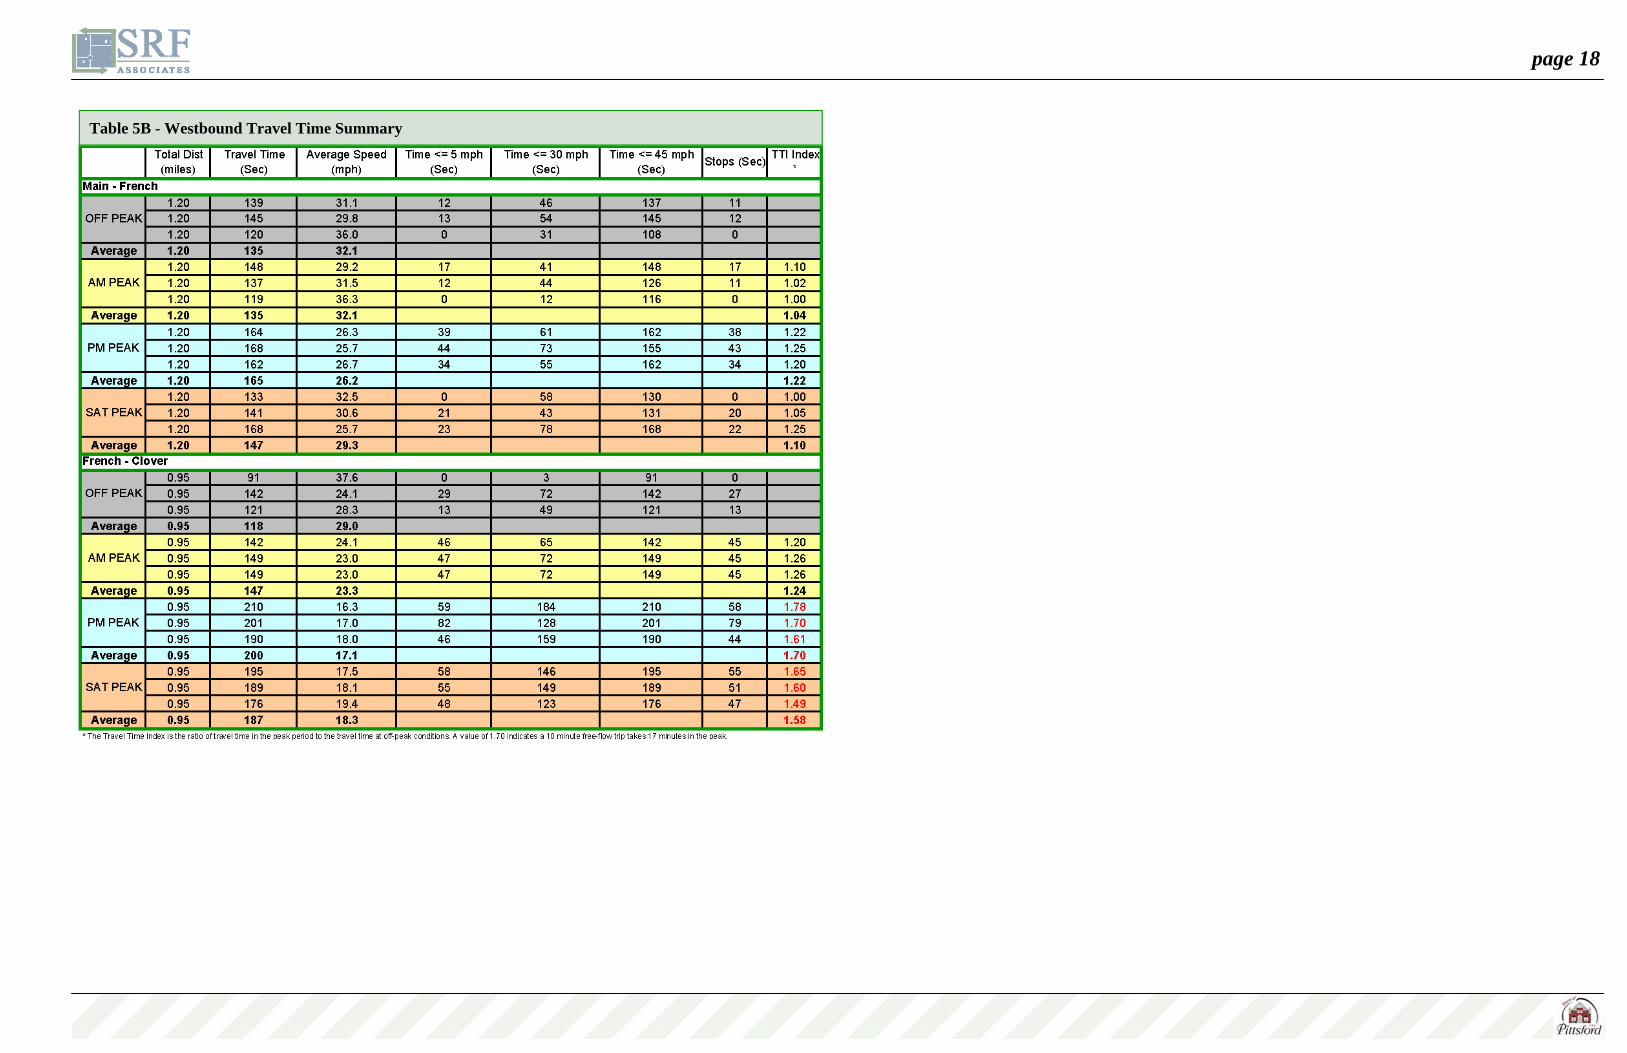
each approximately 1 mile long. The total travel time, average speed, and time stopped are provided for each of the three peak periods. In addition, the time during which the test vehicle traveled less than 5 mph, 30 mph, and 45 mph are provided. A travel time index (TTI) is calculated based upon the ratio of the “free flow” speed documented during the off-peak time period to the average speed traveled in the segment during peak times. A TTI close to 1indicates that the travel speed during peak times is close to the travel speed during off peak free flow conditions. As the TTI increases beyond 1, the peak travel speeds are slower than the free flow speed in the corridor. A Travel Time Index value of 1.3 indicates that peak-period travel takes 30 percent longer than under ideal conditions. The TTI’s in the Monroe Avenue corridor indicate the
most congested time with the lowest travel speeds occur during the PM peak period. Time periods where the TTI is greater than 1.3 are highlighted in red in Tables 6 and 7.
travels westbound during the AM peak. Monroe Avenue westbound during the PM study time demonstrates a difference between off-peak and peak travel conditions of 3.1 min and 12.5 mph (Figure 7D). The most significant area of delay is due to the traffic signals at the French Road and Clover Street intersections. The Saturday study time experiences a difference of 2.6 min and 11.4 mph between free-flow and peak travel conditions as shown in Figure 7F. The most significant area of congestion is located in the retail area segment between the Cheesecake Factory driveway and the Wegmans driveway based on review of the graph. Tables 6 and 7 provide summaries of the travel time surveys for each direction of travel on the corridor. These tables split the corridor in two segments that are
between free-flow and peak travel conditions. There was also a train that crossed at 11:50 AM just to the west of Sutherland Street as shown in the graph. Westbound on Monroe Avenue The westbound direction peak flow occurs during the PM and Saturday peak travel period in the retail area. The data show the majority of the congestion and delay occurring on Monroe Avenue in the retail segment. There is a difference of approximately 1.0 minute of delay between the free flow travel time and the run that depicts the most congested conditions at 8:49 AM during the AM study time shown in Figure 13B. This equates to a difference in average running speed of 5.8 mph (31.4 mph off-peak vs. 25.6 mph peak travel). There is very little delay on Monroe Avenue as one
Figure 13A - AM Peak Eastbound Figure 13B - AM Peak Westbound
DEL
AY
DEL
AY
Town & Village of Pittsford, NY April 2010
page 15
Figure 13C - PM Peak Eastbound Figure 13D - PM Peak Westbound
DEL
AY D
ELA
Y
page 16
Figure 13E - SAT Peak Eastbound Figure 13F - SAT Peak Westbound
DEL
AY
DEL
AY
Town & Village of Pittsford, NY April 2010
page 17
Table 5A - Eastbound Travel Time Summary
Historic Travel Time The graph above indicates the difference in travel time between a travel time run performed in 2006 and the current study performed in 2010. Each plotted line on the graph represents the worst case condition from that particular travel time survey. Note that the delay in the eastbound direction has increased by more than one minute for the segment between French Road and Main Street when traveling eastbound. The plotted lines show that delay began to occur in the vicinity of Woodland Road for the 2006 travel time run, while the delay during the 2010 travel time run began sooner near the area of 3750 Monroe Avenue.
Figure 14 - Historic Travel Time Comparison
page 18
Table 5B - Westbound Travel Time Summary