Embed Size (px)
Citation preview
December 2018
Monthly Environmental Monitoring Report, Rev. A
Page i
All rights reserved, including all rights relating to the use of this document or its contents.
Monthly Environmental Monitoring Report
December 2018
December 2018 1 Final
Date Rev. Status
December 2019
Monthly Environmental Monitroing Report, Rev. A
Page 1
All rights reserved, including all rights relating to the use of this document or its contents.
Table of Contents
1. Introduction ........................................................................................................................ 2
2. Monitoring Requirements ................................................................................................. 2
3. Dust Depositional Monitoring .......................................................................................... 5
4. Total Suspended Particulates .......................................................................................... 7
5. Real Time PM10 Monitoring ............................................................................................... 8
6. Surface Water Monitoring ............................................................................................... 10
7. Groundwater Monitoring ................................................................................................. 11
8. Noise Monitoring ............................................................................................................. 11
9. Blast Monitoring .............................................................................................................. 11
10. Meteorological Monitoring .............................................................................................. 12
December 2019
Monthly Environmental Monitroing Report, Rev. A
Page 2
All rights reserved, including all rights relating to the use of this document or its contents.
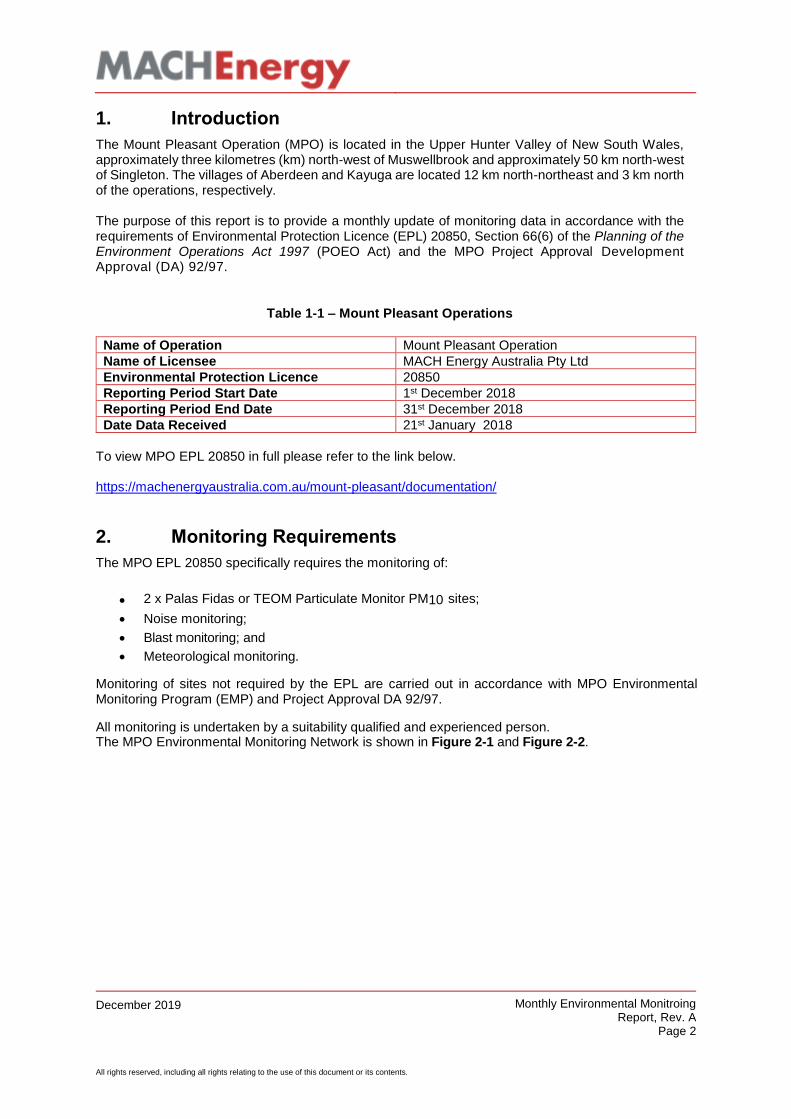
1. Introduction
The Mount Pleasant Operation (MPO) is located in the Upper Hunter Valley of New South Wales, approximately three kilometres (km) north-west of Muswellbrook and approximately 50 km north-west of Singleton. The villages of Aberdeen and Kayuga are located 12 km north-northeast and 3 km north of the operations, respectively. The purpose of this report is to provide a monthly update of monitoring data in accordance with the requirements of Environmental Protection Licence (EPL) 20850, Section 66(6) of the Planning of the Environment Operations Act 1997 (POEO Act) and the MPO Project Approval Development Approval (DA) 92/97.
Table 1-1 – Mount Pleasant Operations
Name of Operation Mount Pleasant Operation
Name of Licensee MACH Energy Australia Pty Ltd
Environmental Protection Licence 20850
Reporting Period Start Date 1st December 2018
Reporting Period End Date 31st December 2018
Date Data Received 21st January 2018
To view MPO EPL 20850 in full please refer to the link below. https://machenergyaustralia.com.au/mount-pleasant/documentation/
2. Monitoring Requirements
The MPO EPL 20850 specifically requires the monitoring of:
• 2 x Palas Fidas or TEOM Particulate Monitor PM10 sites;
• Noise monitoring;
• Blast monitoring; and
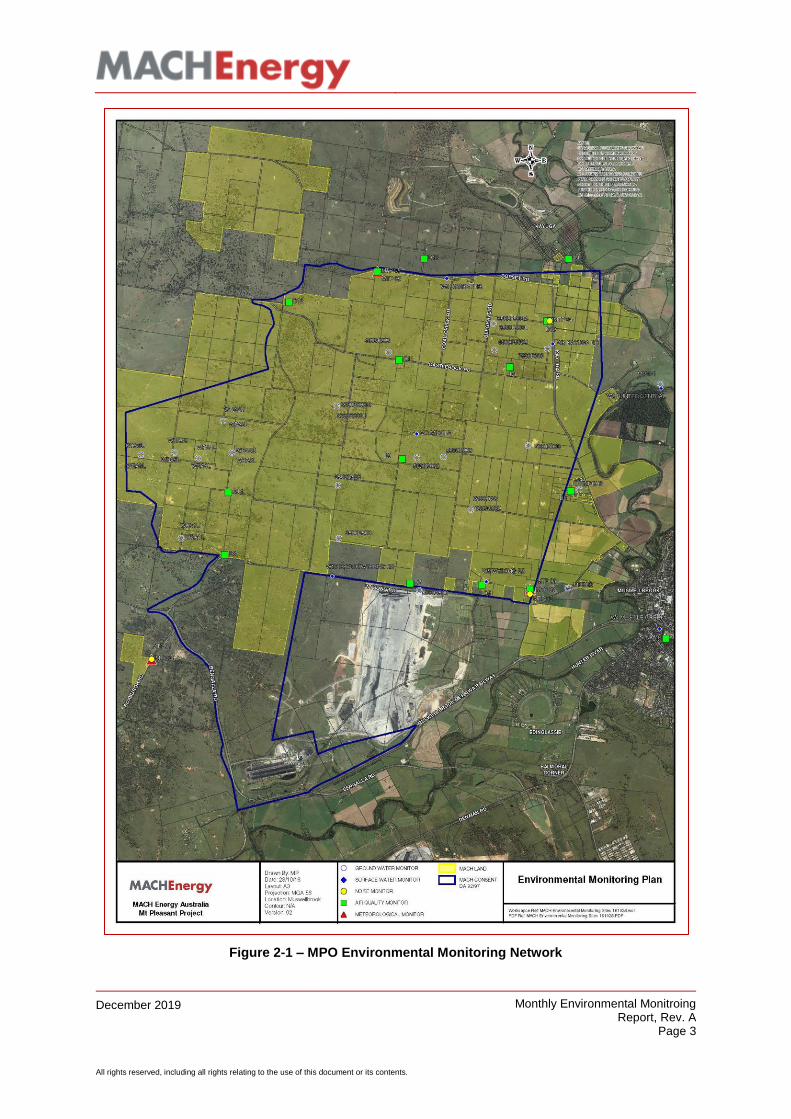
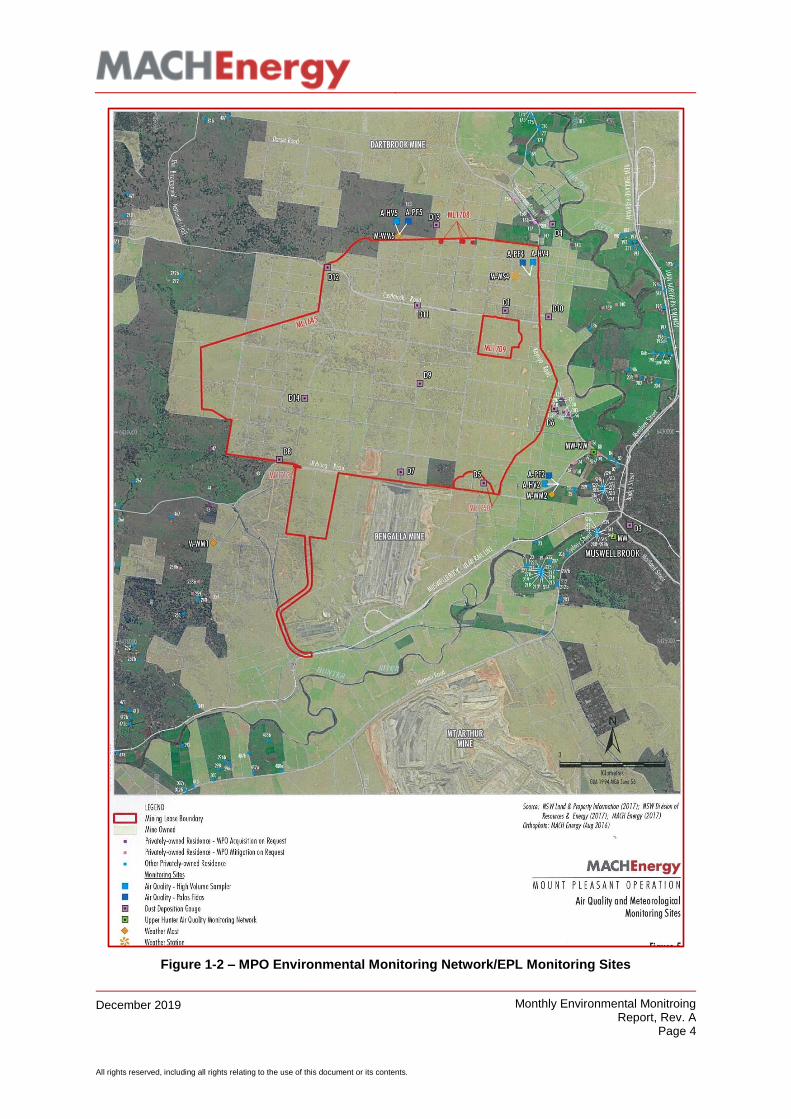
• Meteorological monitoring. Monitoring of sites not required by the EPL are carried out in accordance with MPO Environmental Monitoring Program (EMP) and Project Approval DA 92/97. All monitoring is undertaken by a suitability qualified and experienced person. The MPO Environmental Monitoring Network is shown in Figure 2-1 and Figure 2-2.
December 2019
Monthly Environmental Monitroing Report, Rev. A
Page 3
All rights reserved, including all rights relating to the use of this document or its contents.
Figure 2-1 – MPO Environmental Monitoring Network
December 2019
Monthly Environmental Monitroing Report, Rev. A
Page 4
All rights reserved, including all rights relating to the use of this document or its contents.
Figure 1-2 – MPO Environmental Monitoring Network/EPL Monitoring Sites
December 2019
Monthly Environmental Monitroing Report, Rev. A
Page 5
All rights reserved, including all rights relating to the use of this document or its contents.
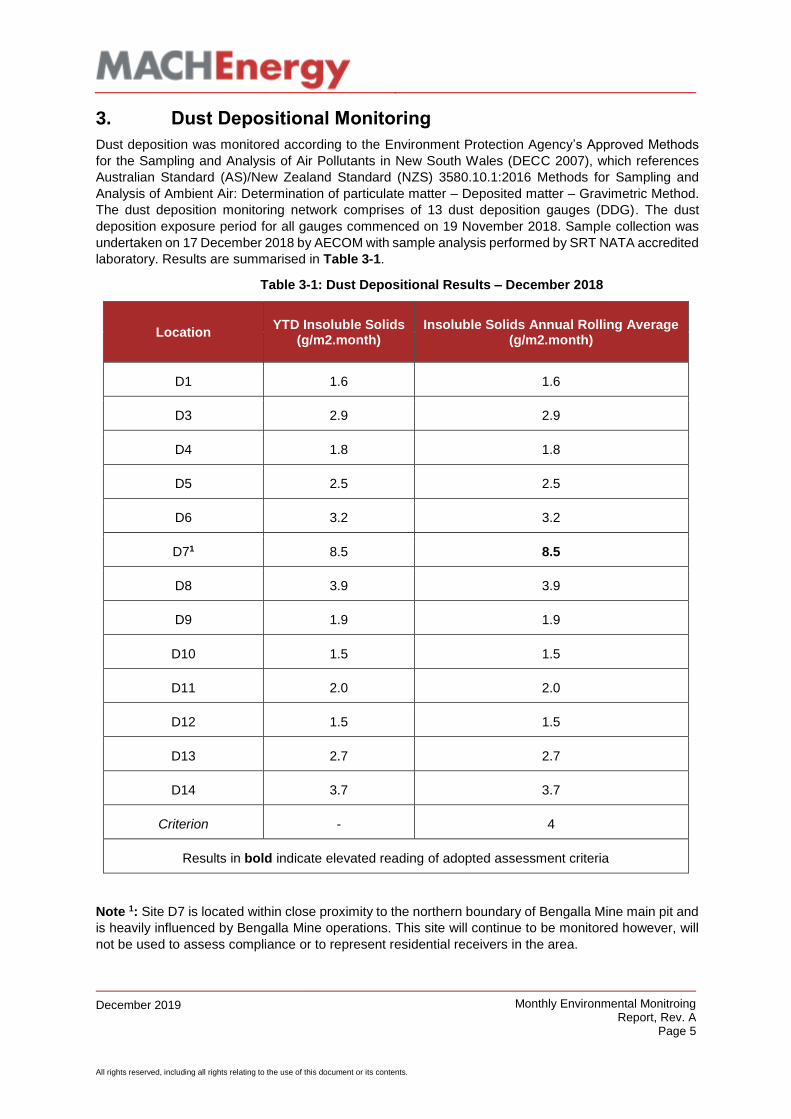
3. Dust Depositional Monitoring
Dust deposition was monitored according to the Environment Protection Agency’s Approved Methods
for the Sampling and Analysis of Air Pollutants in New South Wales (DECC 2007), which references
Australian Standard (AS)/New Zealand Standard (NZS) 3580.10.1:2016 Methods for Sampling and
Analysis of Ambient Air: Determination of particulate matter – Deposited matter – Gravimetric Method.
The dust deposition monitoring network comprises of 13 dust deposition gauges (DDG). The dust
deposition exposure period for all gauges commenced on 19 November 2018. Sample collection was
undertaken on 17 December 2018 by AECOM with sample analysis performed by SRT NATA accredited
laboratory. Results are summarised in Table 3-1.
Table 3-1: Dust Depositional Results – December 2018
Location YTD Insoluble Solids
(g/m2.month) Insoluble Solids Annual Rolling Average
(g/m2.month)
D1 1.6 1.6
D3 2.9 2.9
D4 1.8 1.8
D5 2.5 2.5
D6 3.2 3.2
D71 8.5 8.5
D8 3.9 3.9
D9 1.9 1.9
D10 1.5 1.5
D11 2.0 2.0
D12 1.5 1.5
D13 2.7 2.7
D14 3.7 3.7
Criterion - 4
Results in bold indicate elevated reading of adopted assessment criteria
Note 1: Site D7 is located within close proximity to the northern boundary of Bengalla Mine main pit and
is heavily influenced by Bengalla Mine operations. This site will continue to be monitored however, will
not be used to assess compliance or to represent residential receivers in the area.
December 2019
Monthly Environmental Monitroing Report, Rev. A
Page 6
All rights reserved, including all rights relating to the use of this document or its contents.
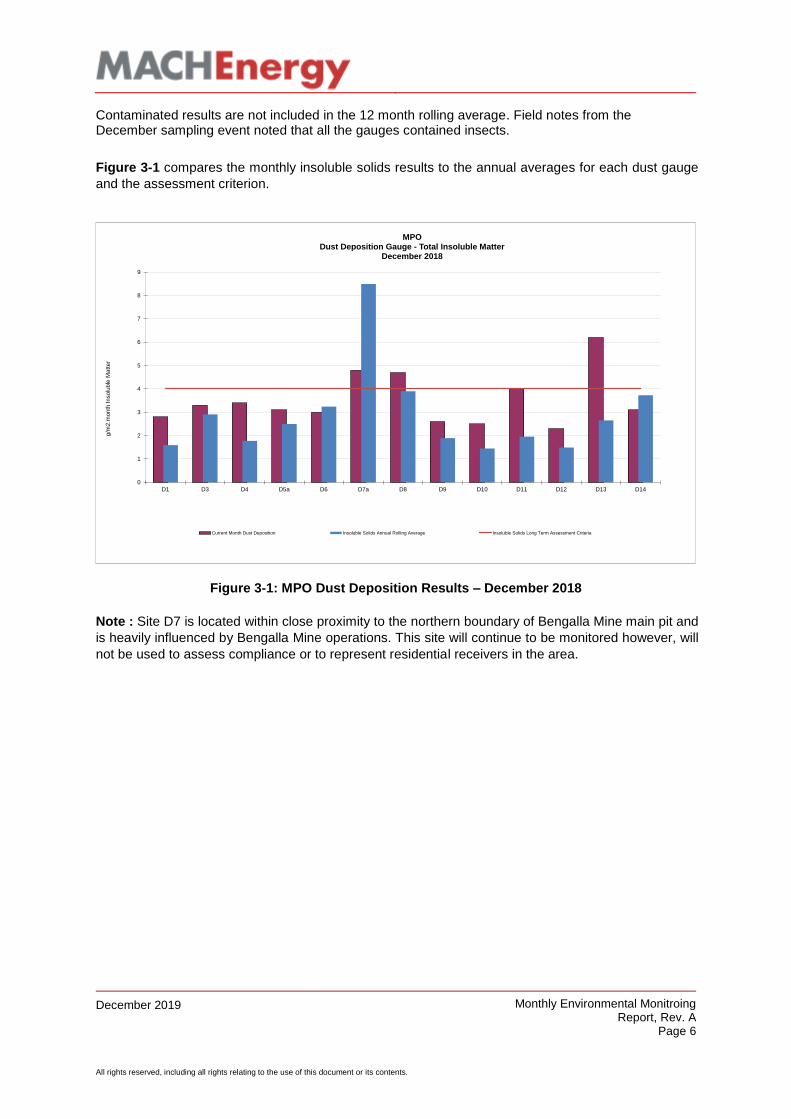
Contaminated results are not included in the 12 month rolling average. Field notes from the December sampling event noted that all the gauges contained insects.
Figure 3-1 compares the monthly insoluble solids results to the annual averages for each dust gauge
and the assessment criterion.
Figure 3-1: MPO Dust Deposition Results – December 2018
Note : Site D7 is located within close proximity to the northern boundary of Bengalla Mine main pit and
is heavily influenced by Bengalla Mine operations. This site will continue to be monitored however, will
not be used to assess compliance or to represent residential receivers in the area.
0
1
2
3
4
5
6
7
8
9
D1 D3 D4 D5a D6 D7a D8 D9 D10 D11 D12 D13 D14
g/m
2.m
onth
Insolu
ble
Matter
MPODust Deposition Gauge - Total Insoluble Matter
December 2018
Current Month Dust Deposition Insoluble Solids Annual Rolling Average Insoluble Solids Long Term Assessment Criteria
*
December 2019
Monthly Environmental Monitroing Report, Rev. A
Page 7
All rights reserved, including all rights relating to the use of this document or its contents.
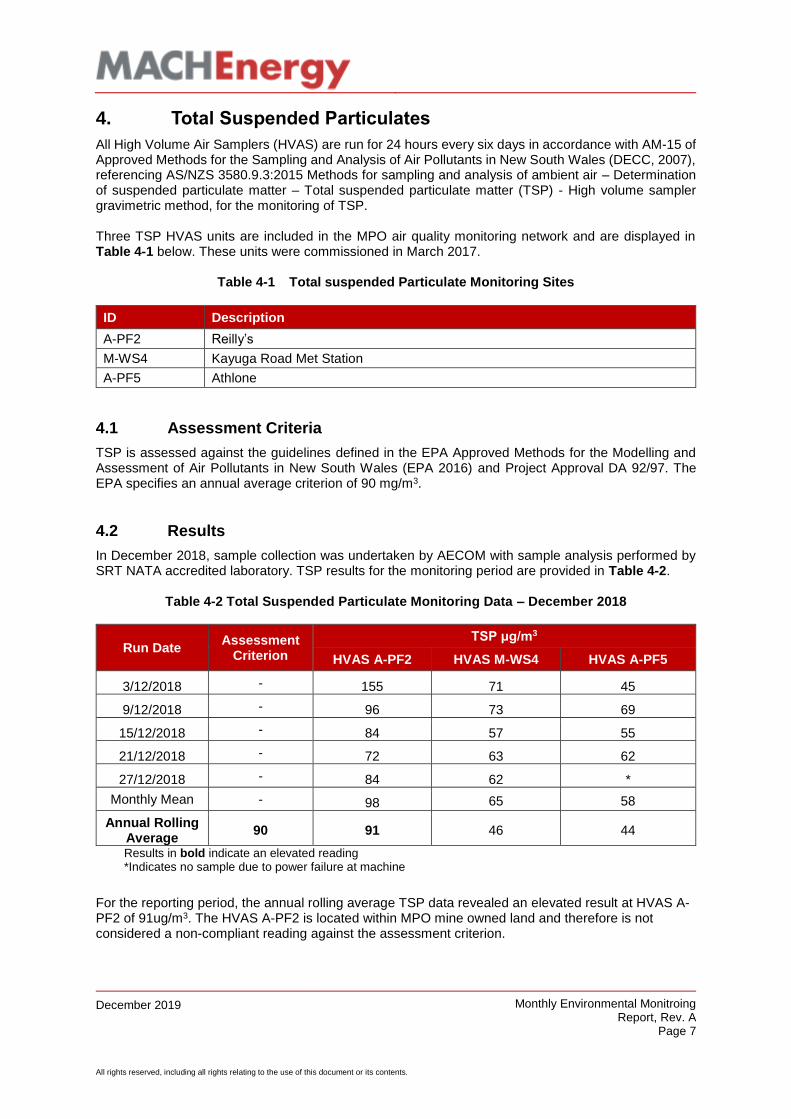
4. Total Suspended Particulates
All High Volume Air Samplers (HVAS) are run for 24 hours every six days in accordance with AM-15 of Approved Methods for the Sampling and Analysis of Air Pollutants in New South Wales (DECC, 2007), referencing AS/NZS 3580.9.3:2015 Methods for sampling and analysis of ambient air – Determination of suspended particulate matter – Total suspended particulate matter (TSP) - High volume sampler gravimetric method, for the monitoring of TSP. Three TSP HVAS units are included in the MPO air quality monitoring network and are displayed in Table 4-1 below. These units were commissioned in March 2017.
Table 4-1 Total suspended Particulate Monitoring Sites
ID Description
A-PF2 Reilly’s
M-WS4 Kayuga Road Met Station
A-PF5 Athlone
4.1 Assessment Criteria
TSP is assessed against the guidelines defined in the EPA Approved Methods for the Modelling and Assessment of Air Pollutants in New South Wales (EPA 2016) and Project Approval DA 92/97. The EPA specifies an annual average criterion of 90 mg/m3.
4.2 Results
In December 2018, sample collection was undertaken by AECOM with sample analysis performed by SRT NATA accredited laboratory. TSP results for the monitoring period are provided in Table 4-2.
Table 4-2 Total Suspended Particulate Monitoring Data – December 2018
Run Date Assessment
Criterion
TSP μg/m3
HVAS A-PF2 HVAS M-WS4 HVAS A-PF5
3/12/2018 - 155 71 45
9/12/2018 - 96 73 69
15/12/2018 - 84 57 55
21/12/2018 - 72 63 62
27/12/2018 - 84 62 *
Monthly Mean - 98 65 58
Annual Rolling Average
90 91 46 44
Results in bold indicate an elevated reading *Indicates no sample due to power failure at machine
For the reporting period, the annual rolling average TSP data revealed an elevated result at HVAS A-PF2 of 91ug/m3. The HVAS A-PF2 is located within MPO mine owned land and therefore is not considered a non-compliant reading against the assessment criterion.
December 2019
Monthly Environmental Monitroing Report, Rev. A
Page 8
All rights reserved, including all rights relating to the use of this document or its contents.
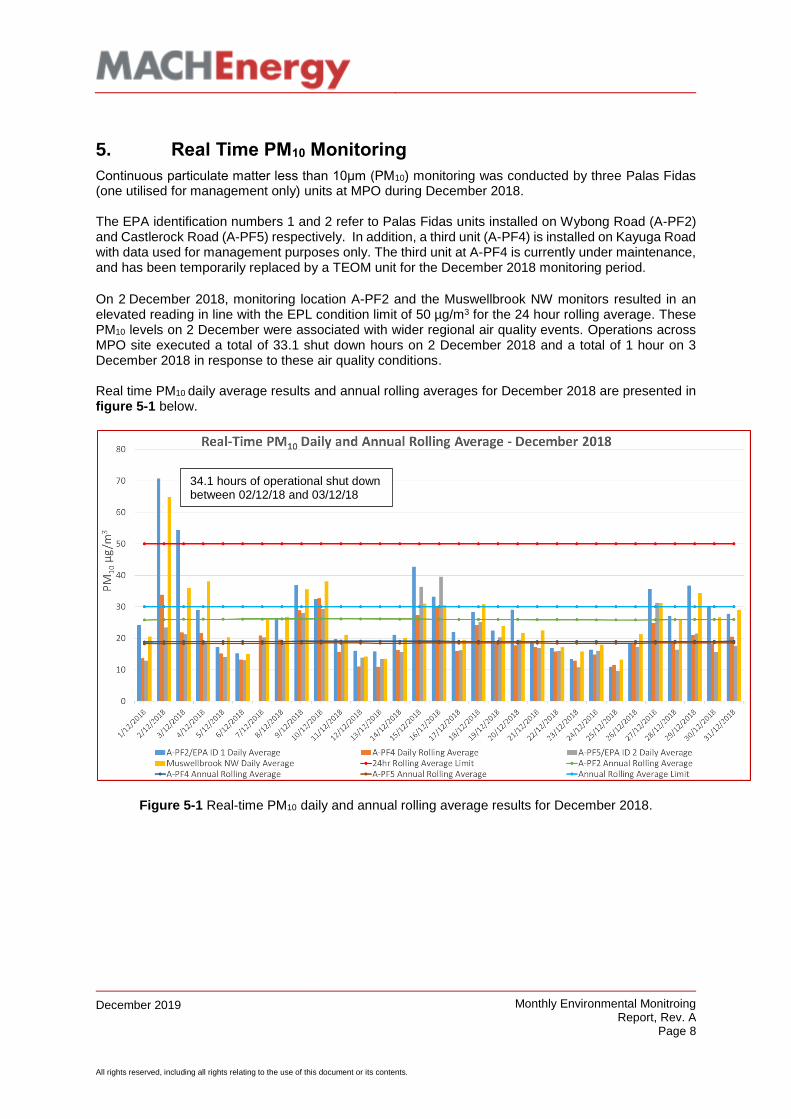
5. Real Time PM10 Monitoring
Continuous particulate matter less than 10μm (PM10) monitoring was conducted by three Palas Fidas (one utilised for management only) units at MPO during December 2018. The EPA identification numbers 1 and 2 refer to Palas Fidas units installed on Wybong Road (A-PF2) and Castlerock Road (A-PF5) respectively. In addition, a third unit (A-PF4) is installed on Kayuga Road with data used for management purposes only. The third unit at A-PF4 is currently under maintenance, and has been temporarily replaced by a TEOM unit for the December 2018 monitoring period.
On 2 December 2018, monitoring location A-PF2 and the Muswellbrook NW monitors resulted in an elevated reading in line with the EPL condition limit of 50 µg/m3 for the 24 hour rolling average. These PM10 levels on 2 December were associated with wider regional air quality events. Operations across MPO site executed a total of 33.1 shut down hours on 2 December 2018 and a total of 1 hour on 3 December 2018 in response to these air quality conditions. Real time PM10 daily average results and annual rolling averages for December 2018 are presented in figure 5-1 below.
Figure 5-1 Real-time PM10 daily and annual rolling average results for December 2018.
34.1 hours of operational shut down between 02/12/18 and 03/12/18
December 2019
Monthly Environmental Monitroing Report, Rev. A
Page 9
All rights reserved, including all rights relating to the use of this document or its contents.
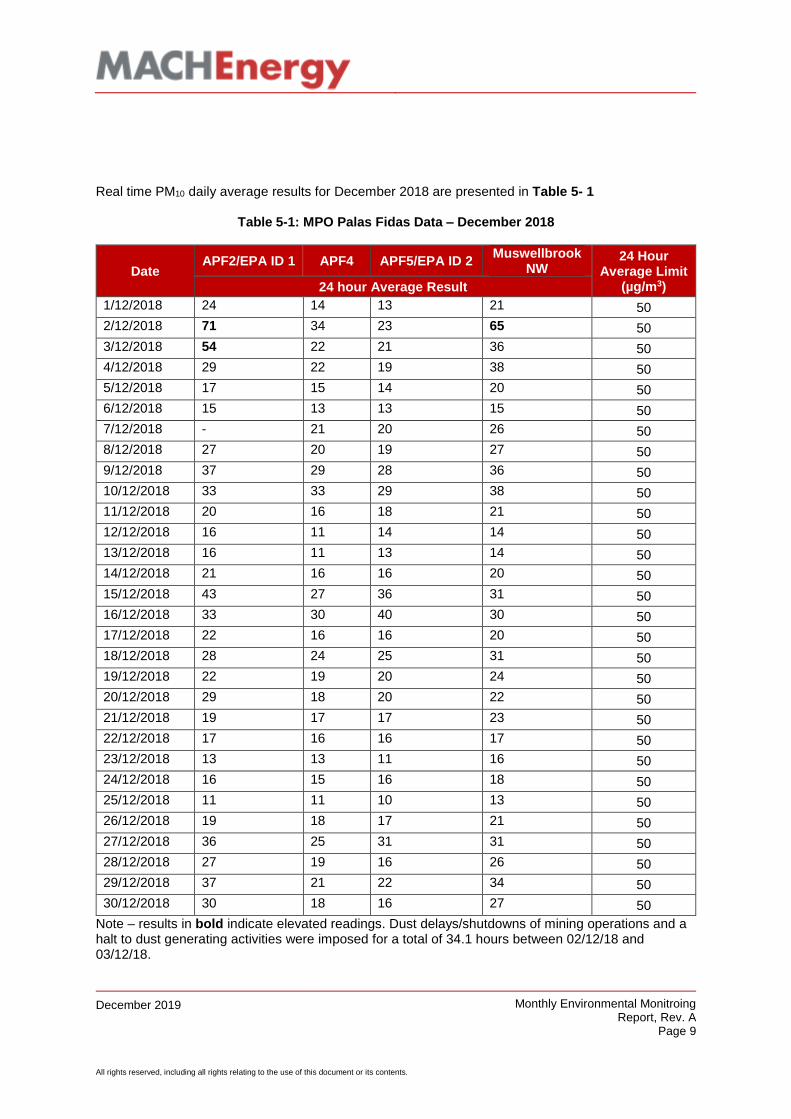
Real time PM10 daily average results for December 2018 are presented in Table 5- 1
Table 5-1: MPO Palas Fidas Data – December 2018
Date APF2/EPA ID 1 APF4 APF5/EPA ID 2
Muswellbrook NW
24 Hour Average Limit
(µg/m3) 24 hour Average Result
1/12/2018 24 14 13 21 50
2/12/2018 71 34 23 65 50
3/12/2018 54 22 21 36 50
4/12/2018 29 22 19 38 50
5/12/2018 17 15 14 20 50
6/12/2018 15 13 13 15 50
7/12/2018 - 21 20 26 50
8/12/2018 27 20 19 27 50
9/12/2018 37 29 28 36 50
10/12/2018 33 33 29 38 50
11/12/2018 20 16 18 21 50
12/12/2018 16 11 14 14 50
13/12/2018 16 11 13 14 50
14/12/2018 21 16 16 20 50
15/12/2018 43 27 36 31 50
16/12/2018 33 30 40 30 50
17/12/2018 22 16 16 20 50
18/12/2018 28 24 25 31 50
19/12/2018 22 19 20 24 50
20/12/2018 29 18 20 22 50
21/12/2018 19 17 17 23 50
22/12/2018 17 16 16 17 50
23/12/2018 13 13 11 16 50
24/12/2018 16 15 16 18 50
25/12/2018 11 11 10 13 50
26/12/2018 19 18 17 21 50
27/12/2018 36 25 31 31 50
28/12/2018 27 19 16 26 50
29/12/2018 37 21 22 34 50
30/12/2018 30 18 16 27 50
Note – results in bold indicate elevated readings. Dust delays/shutdowns of mining operations and a halt to dust generating activities were imposed for a total of 34.1 hours between 02/12/18 and 03/12/18.
December 2019
Monthly Environmental Monitroing Report, Rev. A
Page 10
All rights reserved, including all rights relating to the use of this document or its contents.
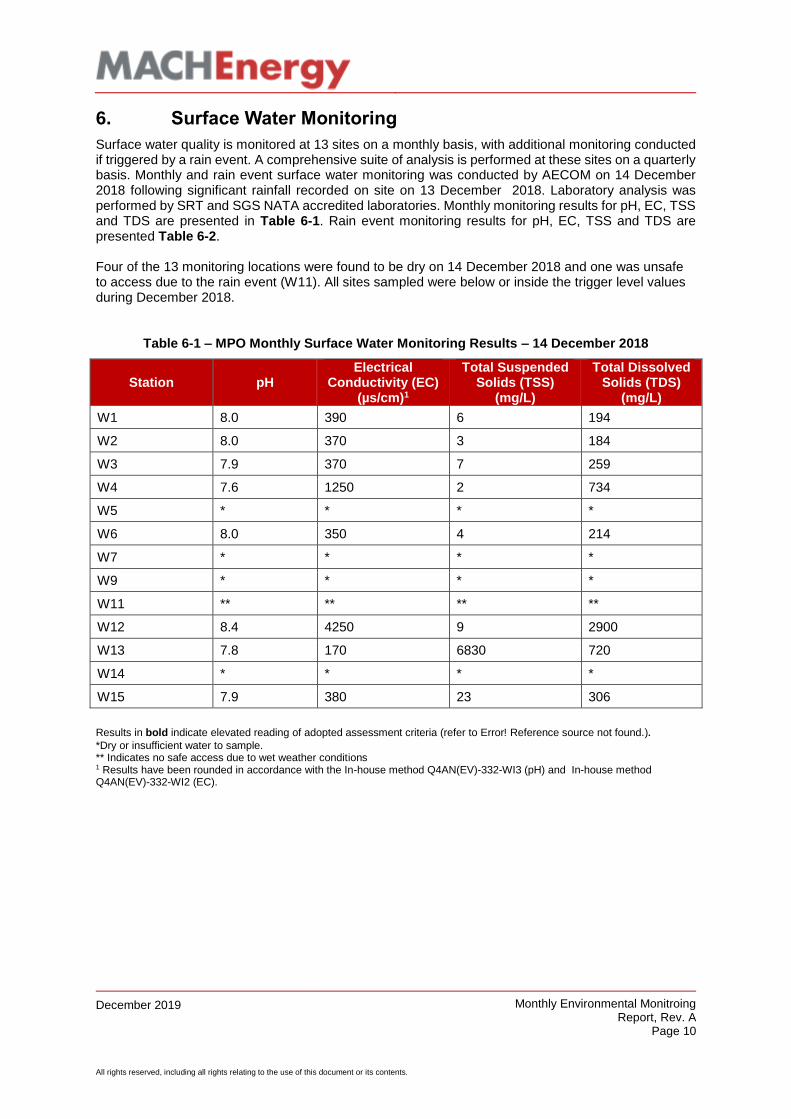
6. Surface Water Monitoring
Surface water quality is monitored at 13 sites on a monthly basis, with additional monitoring conducted if triggered by a rain event. A comprehensive suite of analysis is performed at these sites on a quarterly basis. Monthly and rain event surface water monitoring was conducted by AECOM on 14 December 2018 following significant rainfall recorded on site on 13 December 2018. Laboratory analysis was performed by SRT and SGS NATA accredited laboratories. Monthly monitoring results for pH, EC, TSS and TDS are presented in Table 6-1. Rain event monitoring results for pH, EC, TSS and TDS are presented Table 6-2. Four of the 13 monitoring locations were found to be dry on 14 December 2018 and one was unsafe to access due to the rain event (W11). All sites sampled were below or inside the trigger level values during December 2018.
Table 6-1 – MPO Monthly Surface Water Monitoring Results – 14 December 2018
Station pH Electrical
Conductivity (EC) (µs/cm)1
Total Suspended Solids (TSS)
(mg/L)
Total Dissolved Solids (TDS)
(mg/L)
W1 8.0 390 6 194
W2 8.0 370 3 184
W3 7.9 370 7 259
W4 7.6 1250 2 734
W5 * * * *
W6 8.0 350 4 214
W7 * * * *
W9 * * * *
W11 ** ** ** **
W12 8.4 4250 9 2900
W13 7.8 170 6830 720
W14 * * * *
W15 7.9 380 23 306
Results in bold indicate elevated reading of adopted assessment criteria (refer to Error! Reference source not found.). *Dry or insufficient water to sample. ** Indicates no safe access due to wet weather conditions 1 Results have been rounded in accordance with the In-house method Q4AN(EV)-332-WI3 (pH) and In-house method Q4AN(EV)-332-WI2 (EC).
December 2019
Monthly Environmental Monitroing Report, Rev. A
Page 11
All rights reserved, including all rights relating to the use of this document or its contents.
7. Groundwater Monitoring
Groundwater monitoring did not occur during December 2018. The next sampling quarterly monitoring event is scheduled for February 2019.
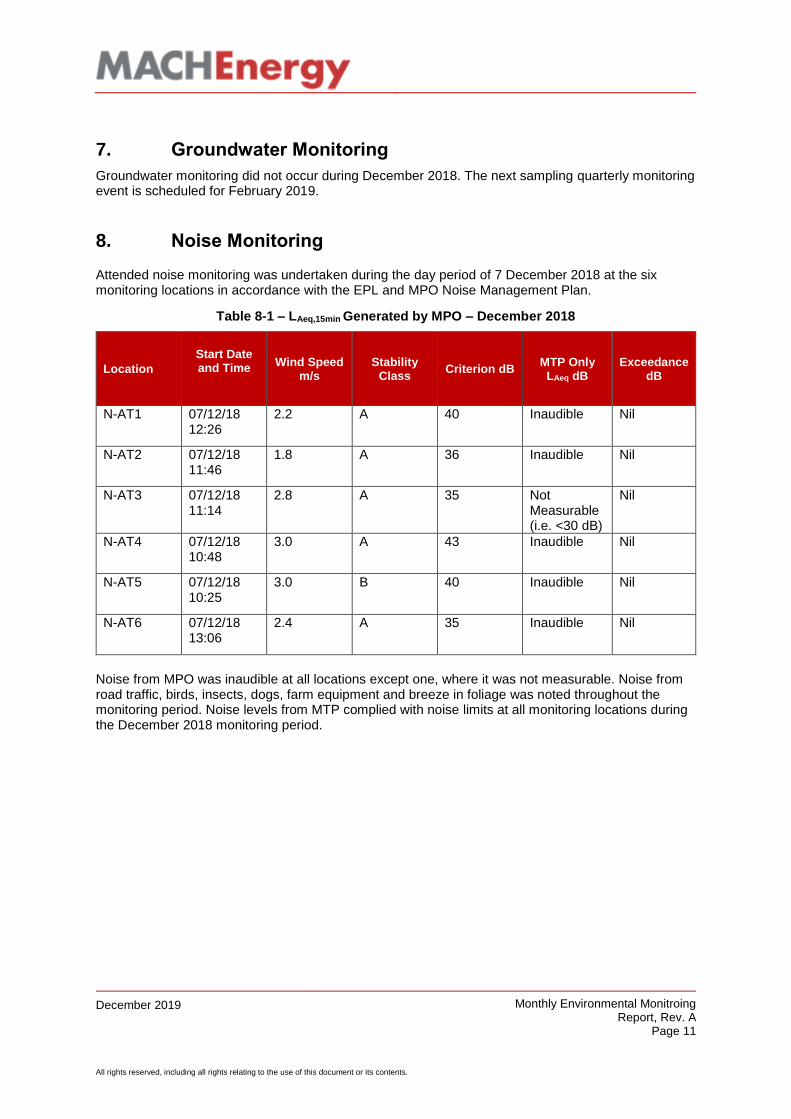
8. Noise Monitoring
Attended noise monitoring was undertaken during the day period of 7 December 2018 at the six monitoring locations in accordance with the EPL and MPO Noise Management Plan.
Table 8-1 – LAeq,15min Generated by MPO – December 2018
Location
Start Date and Time
Wind Speed m/s
Stability Class
Criterion dB MTP Only
LAeq dB Exceedance
dB
N-AT1 07/12/18 12:26
2.2 A 40 Inaudible Nil
N-AT2 07/12/18 11:46
1.8 A 36 Inaudible Nil
N-AT3 07/12/18 11:14
2.8 A 35 Not Measurable (i.e. <30 dB)
Nil
N-AT4 07/12/18 10:48
3.0 A 43 Inaudible Nil
N-AT5 07/12/18 10:25
3.0 B 40 Inaudible Nil
N-AT6 07/12/18 13:06
2.4 A 35 Inaudible Nil
Noise from MPO was inaudible at all locations except one, where it was not measurable. Noise from road traffic, birds, insects, dogs, farm equipment and breeze in foliage was noted throughout the monitoring period. Noise levels from MTP complied with noise limits at all monitoring locations during the December 2018 monitoring period.
December 2019
Monthly Environmental Monitroing Report, Rev. A
Page 12
All rights reserved, including all rights relating to the use of this document or its contents.
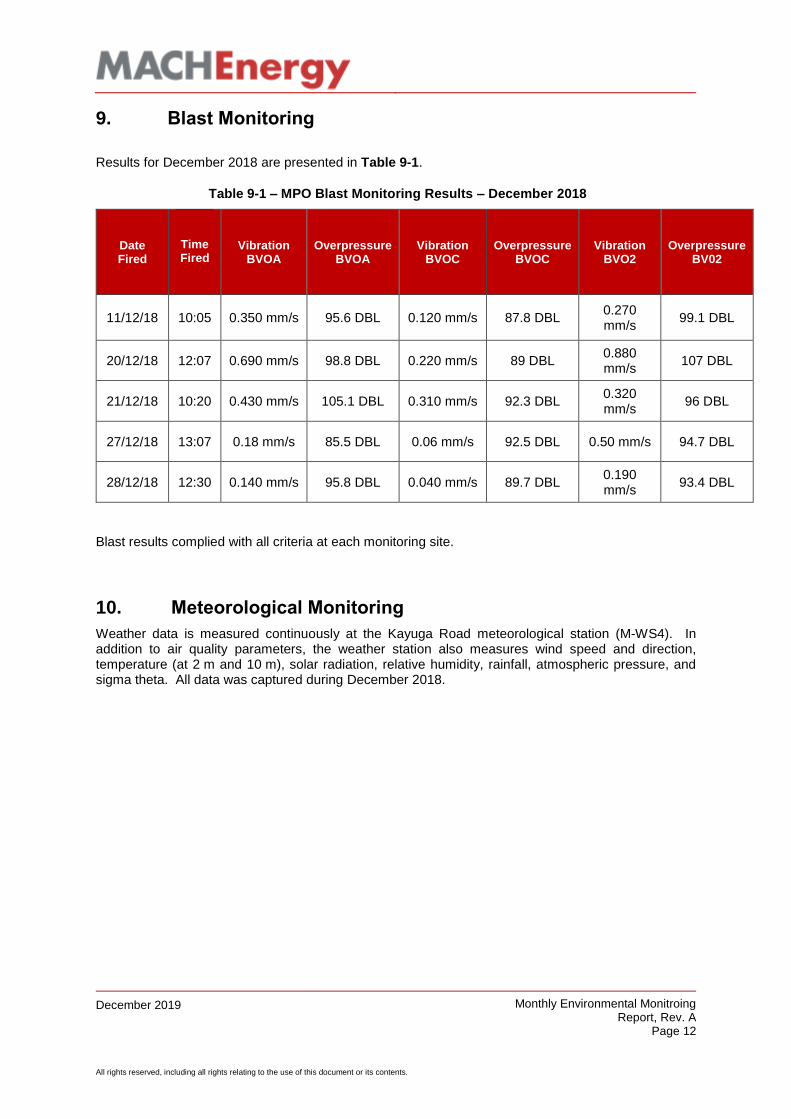
9. Blast Monitoring
Results for December 2018 are presented in Table 9-1.
Table 9-1 – MPO Blast Monitoring Results – December 2018
Date Fired
Time Fired
Vibration BVOA
Overpressure BVOA
Vibration BVOC
Overpressure BVOC
Vibration BVO2
Overpressure BV02
11/12/18 10:05 0.350 mm/s 95.6 DBL 0.120 mm/s 87.8 DBL 0.270 mm/s
99.1 DBL
20/12/18 12:07 0.690 mm/s 98.8 DBL 0.220 mm/s 89 DBL 0.880 mm/s
107 DBL
21/12/18 10:20 0.430 mm/s 105.1 DBL 0.310 mm/s 92.3 DBL 0.320 mm/s
96 DBL
27/12/18 13:07 0.18 mm/s 85.5 DBL 0.06 mm/s 92.5 DBL 0.50 mm/s 94.7 DBL
28/12/18 12:30 0.140 mm/s 95.8 DBL 0.040 mm/s 89.7 DBL 0.190 mm/s
93.4 DBL
Blast results complied with all criteria at each monitoring site.
10. Meteorological Monitoring
Weather data is measured continuously at the Kayuga Road meteorological station (M-WS4). In addition to air quality parameters, the weather station also measures wind speed and direction, temperature (at 2 m and 10 m), solar radiation, relative humidity, rainfall, atmospheric pressure, and sigma theta. All data was captured during December 2018.