Embed Size (px)
Citation preview

MORGAN STANLEY FINANCIALS CONFERENCE António Horta-Osório | 20 March 2018

1
Profit progression
(£bn)
Returns progression
(%)
• Statutory profit increasing: growth in
underlying profit and reduction in below the
line charges despite higher PPI cost
• Consistent strong underlying profit
‐ Net income growth of 5%, NIM up to 2.86%
‐ Market-leading cost:income ratio of 46.8% and
strong asset quality with AQR of 18bps
‐ Moody’s upgraded Lloyds Bank’s rating to Aa3
and S&P improved outlook to positive
‐ Loan growth of £6bn in targeted segments
• Strong underlying RoTE of 15.6%, with the
statutory RoTE increasing to 8.9%
• Strong capital generation of 245bps with 20%
increase in ordinary dividend to 3.05p per share
and a share buyback of up to £1bn
5.1
13.0
16.2 16.0 14.1
15.6
(2.5) (1.1)
4.4 2.6
6.6
8.9
2012 2013 2014 2015 2016 2017
(0.6)
0.4 1.8 1.6 4.2 5.3
2014 2015
6.2
2012 2016 2013 2017
2.6
7.8 8.1 7.9 8.5
Statutory profit before tax Underlying profit
Underlying RoTE Statutory RoTE
Business model delivering increased profits and returns
2
Solid foundations underpinning our customer centric business model
Distinctive competitive strengths
Market leading efficiency
Prudent, low risk participation
choices with strong capital position
Largest digital bank, branch reach
and customer franchise
Differentiated multi-brand, multi-
channel customer propositions
Rigorous execution and
management discipline
c.400 bps
c.545 bps
Peer
Avg.
Capital generative Strong profitability Cumulative capital generation2
2015 – 2017
Statutory RoTE, FY2017
Highly efficient Cost:income Ratio1, FY2017
3.9%
8.9%
c.60%
47%
1 – As stated by major UK banking peers. 2 – Pre-dividend capital generation, excluding acquisitions (peers annualised).
Best-in-class customer
experience Customer NPS
Peer
Avg.
43
62
2011 2017 Peer
Avg.

3
Largest digital bank in the UK, delivering market leading experience
1 – Forrester UK Mobile Banking, 2015, 2016, 2017. 2 – Forrester: UK Mobile Banking Benchmark, 2017; Global Mobile Banking Benchmark, 2017
Largest digital
bank in the UK
Leading
functionality
68%61%
54%
40%
32%
Dec-15 Dec-16 Dec-17 Dec-14 Dec-13
626576
LBG UK
average
Global
average
• “Excels at usability”: easy enrolment/ login,
seamless navigation, context-sensitive help function
• “Outstanding marketing and sales functionality”:
tailored product offers, comparison tools, third-party
offers
• “Wide range of touchpoints”: mobile-optimised
website, SMS interactions, Facebook Messenger
• “Excellent cross-channel guidance”: branch
appointment scheduling function
Forrester mobile banking app score (2017)2
Customer needs met via digital, %
£1bn investment in
digital announced
digitally active customers >13m
rated UK mobile app since 20151 #1
digital visits per month 209m
4
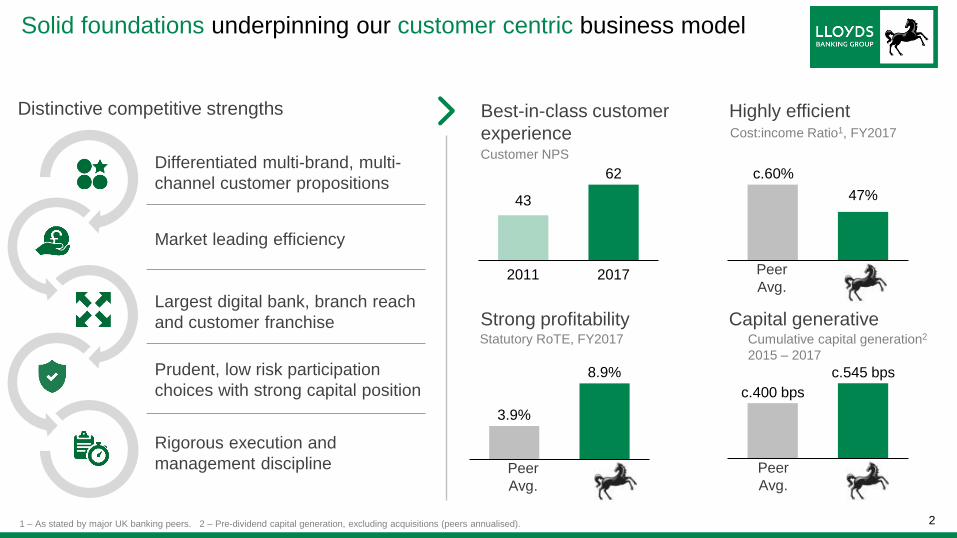
Low risk business model underpinned by prudent participation choices
driving sustainable earnings
Low risk business model reflecting portfolio de-risking and our prudent participation choices
• Over 95% of assets in UK (AA rated) and secured
assets represent over 2/3 of portfolio
• Consumer finance c.6% of loans, (c.4% in 2014)
• Stringent underwriting with targeted growth
• Run off down 95% from peak, just c.2% of loans
• Low risk model generates sustainable earnings
- A 10% fall in house prices would increase Group
RWAs by less than £1bn
- Through the cycle AQR c.35bps and <30bps for
2018-20
18
15
14
2
2015
2017
2016
Net AQR
Asset quality ratio
(bps)
28
28
28
MBNA Gross AQR
Average mortgage LTVs
55.6 43.6
2010 2017
(%)
Mortgages >80% LTV
30.7
2010 2017
(£bn)
146.6

5
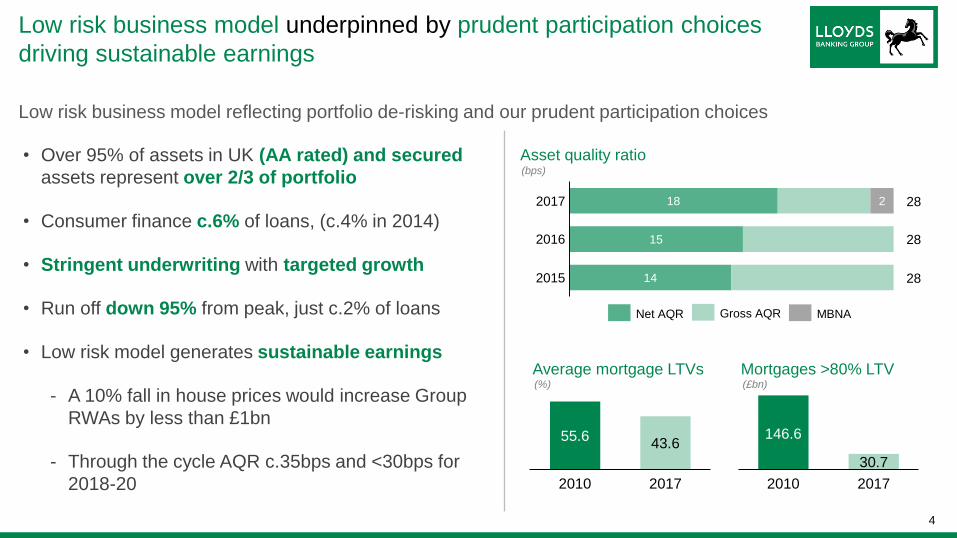
Greater investment capacity allowed by market leading efficiency
Virtuous cycle of efficiency Strong position to compete Cost:income ratio1, %
Increased investment capacity Total strategic investment, £bn
>£3.0bn
GSR1
2011-14
GSR2
2015-17
GSR3
2018-20
+25%
+40%
Market leading efficiency
Greater investment
capacity
Enhancements to internal processes
Improvement to customer
experience
Net cost reduction to
<£8bn in 2020
Freeing up
capital for >£3.0bn
investment
End-to-end
transformation
Higher NPS and
market shares
Greater
productivity
Future proofing our
business model
c.55% c.60%
c.70%
Lloyds
20202
UK banks
46.8%
EU banks Global
banks
1 – Per latest disclosure – average underlying CIR (excl. notable items as highlighted by each institution). UK: RBS, Santander UK, Barclays, HSBC; EU: BBVA, Santander Group, UniCredit, Intesa, Nordea, Swedbank, ING,
KBC, Caixabank, Sabadell, Societe Generale, Credit Agricole; Global: Citigroup, JPM, Bank of America, Morgan Stanley, Goldman Sachs, Credit Suisse, UBS, Deutsche Bank, BNP Paribas. 2 – Exit rate, incl. remediation.
Low 40s
Lloyds
2017
RoTE
14-15%
from 2019

6
More than £3bn strategic investment to deliver a significant transformation
and future proof our business
Strategic priorities Developing new sources of competitive advantage
Market leading efficiency through tech-
enabled productivity improvements
Prudent, low risk participation choices
with strong capital position
Largest digital bank, branch reach and
customer franchise with leading
integrated propositions
Differentiated multi-brand, multi-channel
customer propositions with data-driven
customer experience
Rigorous execution and management
discipline focusing on key skills of the
future
7
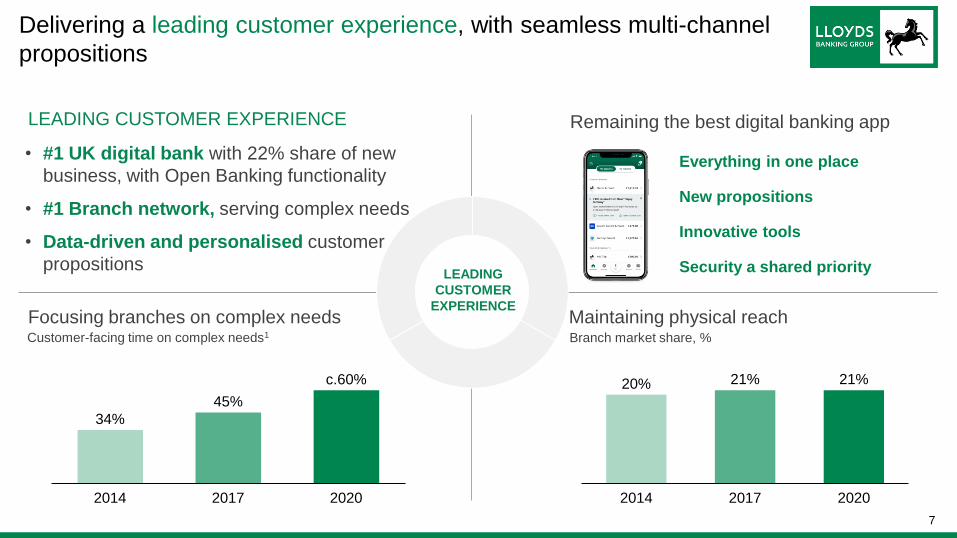
Delivering a leading customer experience, with seamless multi-channel
propositions
• #1 UK digital bank with 22% share of new
business, with Open Banking functionality
• #1 Branch network, serving complex needs
• Data-driven and personalised customer
propositions
LEADING CUSTOMER EXPERIENCE
Maintaining physical reach
20% 21% 21%
2014 2017 2020
Branch market share, %
LEADING
CUSTOMER
EXPERIENCE
Remaining the best digital banking app
34%
45%
2014 2017
c.60%
2020
Focusing branches on complex needs Customer-facing time on complex needs1
Everything in one place
New propositions
Innovative tools
Security a shared priority

8
Digitising the Group to deliver an end-to-end transformation
• End to end transformation covering
more than 70% of our cost base
• Simplification and progressive
modernisation of IT and data
architecture
DIGITISING THE GROUP
LEADING
CUSTOMER
EXPERIENCE
~50
16
Journeys transformed1
GSR3 GSR2
Broader and deeper transformation …
1 – Includes customer and enterprise journeys. 2 – Operating cost base covered by journey transformation.
• End-to-end transformation
of our customer journeys
• ~20 additional customer
journeys
• ~15 enterprise journeys to
digitise central functions
>70%
~12%
Cost base transformed2
GSR3 GSR2
… covering more of our cost base Selective upgrades to core IT systems
Channel
technology
Insight and
data
Infrastructure
• API enabled channel to exploit
Open Banking and FinTech
• Automated software
development processes
• Leveraging hybrid cloud and
software as a service
• Insight powered customer
experiences
• More activities covered
along the value chain (e.g.
control functions and
operations)
• Manual processes re-
engineered across our
central functions
9
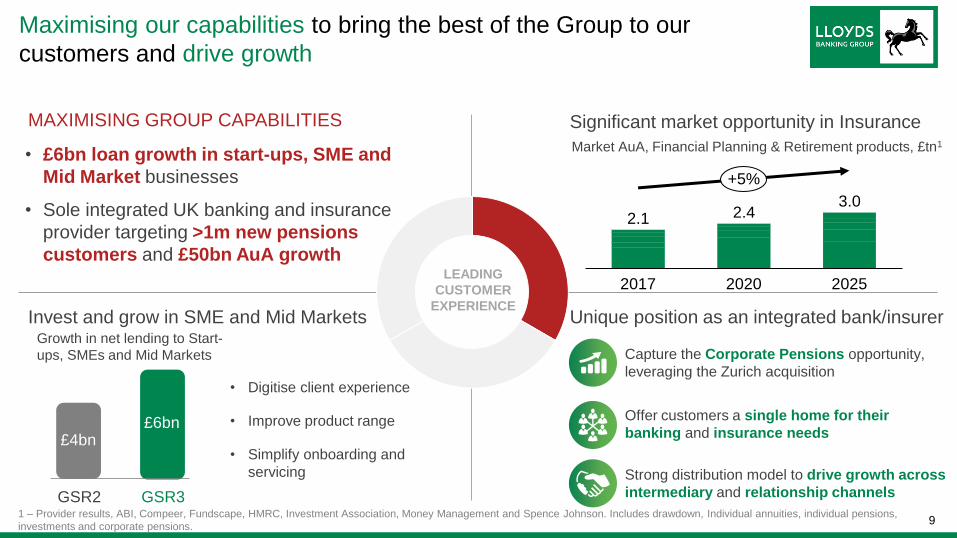
Maximising our capabilities to bring the best of the Group to our
customers and drive growth
• £6bn loan growth in start-ups, SME and
Mid Market businesses
• Sole integrated UK banking and insurance
provider targeting >1m new pensions
customers and £50bn AuA growth
MAXIMISING GROUP CAPABILITIES
LEADING
CUSTOMER
EXPERIENCE
Significant market opportunity in Insurance
Unique position as an integrated bank/insurer Invest and grow in SME and Mid Markets
3.0
2017 2025 2020
2.1 2.4
+5%
Market AuA, Financial Planning & Retirement products, £tn1
1 – Provider results, ABI, Compeer, Fundscape, HMRC, Investment Association, Money Management and Spence Johnson. Includes drawdown, Individual annuities, individual pensions,
investments and corporate pensions.
Strong distribution model to drive growth across
intermediary and relationship channels
Capture the Corporate Pensions opportunity,
leveraging the Zurich acquisition
Offer customers a single home for their
banking and insurance needs £6bn
£4bn
GSR3 GSR2
Growth in net lending to Start-
ups, SMEs and Mid Markets
• Digitise client experience
• Improve product range
• Simplify onboarding and
servicing
10
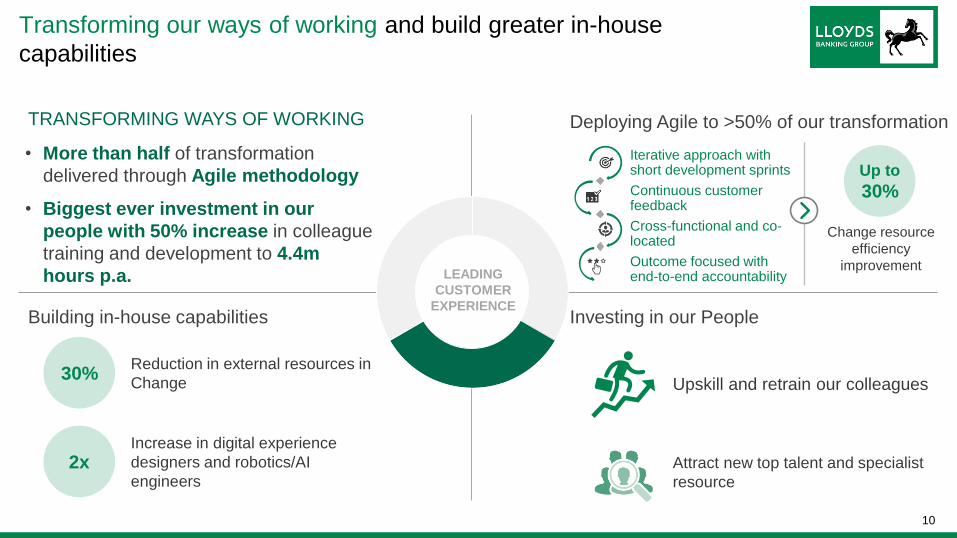
Transforming our ways of working and build greater in-house
capabilities
• More than half of transformation
delivered through Agile methodology
• Biggest ever investment in our
people with 50% increase in colleague
training and development to 4.4m
hours p.a.
TRANSFORMING WAYS OF WORKING
LEADING
CUSTOMER
EXPERIENCE
Deploying Agile to >50% of our transformation
Iterative approach with short development sprints
Continuous customer feedback
Cross-functional and co-located
Outcome focused with end-to-end accountability
Up to
30%
Change resource
efficiency
improvement
Investing in our People
Upskill and retrain our colleagues
Attract new top talent and specialist
resource
Building in-house capabilities
2x Increase in digital experience
designers and robotics/AI
engineers
30% Reduction in external resources in
Change
11
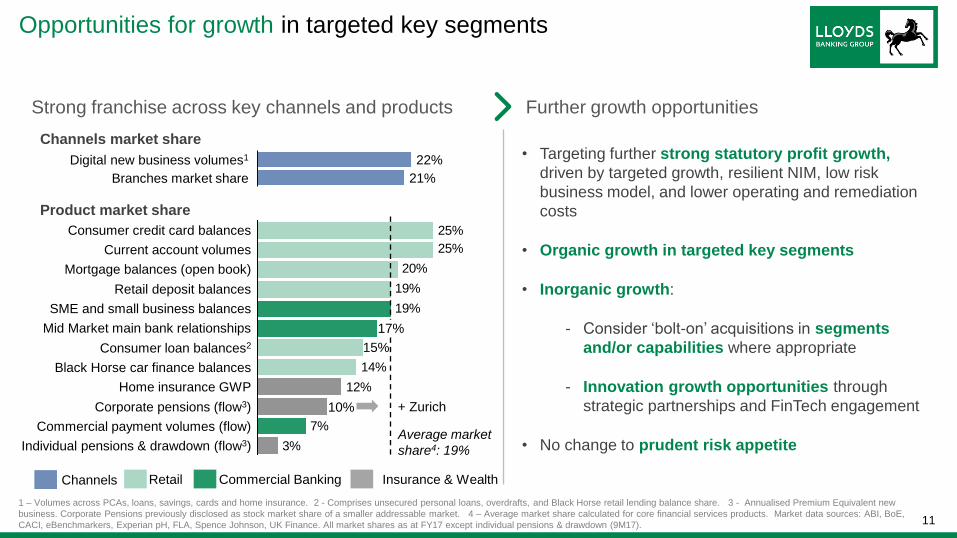
Commercial Banking
Opportunities for growth in targeted key segments
Strong franchise across key channels and products Further growth opportunities
1 – Volumes across PCAs, loans, savings, cards and home insurance. 2 - Comprises unsecured personal loans, overdrafts, and Black Horse retail lending balance share. 3 - Annualised Premium Equivalent new
business. Corporate Pensions previously disclosed as stock market share of a smaller addressable market. 4 – Average market share calculated for core financial services products. Market data sources: ABI, BoE,
CACI, eBenchmarkers, Experian pH, FLA, Spence Johnson, UK Finance. All market shares as at FY17 except individual pensions & drawdown (9M17).
Product market share
Retail Channels Insurance & Wealth
• Targeting further strong statutory profit growth,
driven by targeted growth, resilient NIM, low risk
business model, and lower operating and remediation
costs
• Organic growth in targeted key segments
• Inorganic growth:
- Consider ‘bolt-on’ acquisitions in segments
and/or capabilities where appropriate
- Innovation growth opportunities through
strategic partnerships and FinTech engagement
• No change to prudent risk appetite
3%
7%
12%
14%
19%
19%
20%
25%
25%
Individual pensions & drawdown (flow3)
Commercial payment volumes (flow)
Corporate pensions (flow3)
Home insurance GWP
Black Horse car finance balances
Consumer loan balances2
Mid Market main bank relationships
SME and small business balances
Retail deposit balances
Mortgage balances (open book)
Current account volumes
Consumer credit card balances
Average market
share4: 19%
+ Zurich
22%
21%
Digital new business volumes1
Branches market share
Channels market share
15%
17%
10%
12
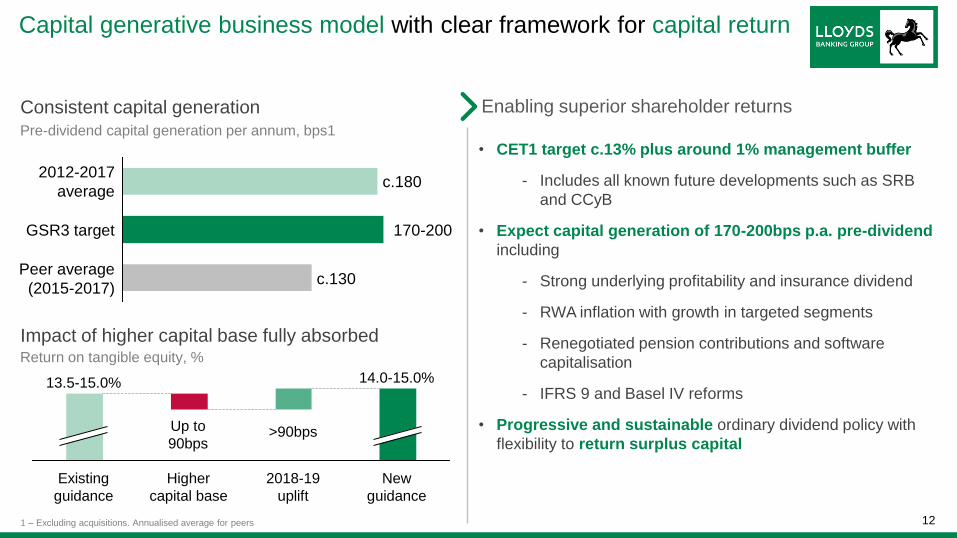
Up to
90bps
Capital generative business model with clear framework for capital return
Consistent capital generation Enabling superior shareholder returns
• CET1 target c.13% plus around 1% management buffer
- Includes all known future developments such as SRB
and CCyB
• Expect capital generation of 170-200bps p.a. pre-dividend
including
- Strong underlying profitability and insurance dividend
- RWA inflation with growth in targeted segments
- Renegotiated pension contributions and software
capitalisation
- IFRS 9 and Basel IV reforms
• Progressive and sustainable ordinary dividend policy with
flexibility to return surplus capital
Pre-dividend capital generation per annum, bps1
Peer average
(2015-2017) c.130
GSR3 target 170-200
2012-2017
average c.180
1 – Excluding acquisitions. Annualised average for peers
New
guidance
14.0-15.0%
2018-19
uplift
Higher
capital base
Existing
guidance
13.5-15.0%
>90bps
Impact of higher capital base fully absorbed Return on tangible equity, %
13
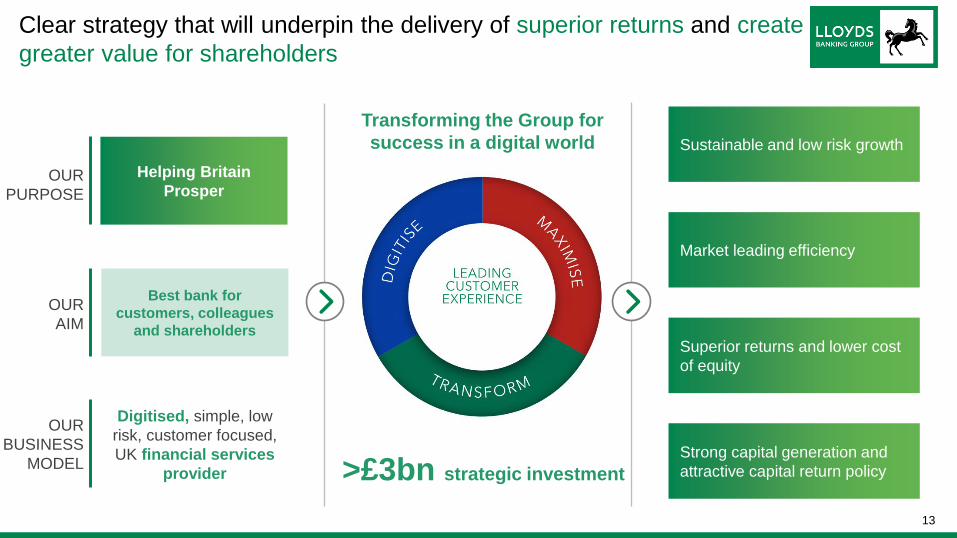
Clear strategy that will underpin the delivery of superior returns and create
greater value for shareholders
Market leading efficiency
Sustainable and low risk growth
Superior returns and lower cost
of equity
Strong capital generation and
attractive capital return policy
OUR
PURPOSE
Helping Britain
Prosper
OUR
AIM
OUR
BUSINESS
MODEL
Digitised, simple, low
risk, customer focused,
UK financial services
provider
Best bank for
customers, colleagues
and shareholders
Transforming the Group for
success in a digital world
>£3bn strategic investment

14
Questions & Answers

15
Forward looking statement
Forward looking statement
This document contains certain forward looking statements with respect to the business, strategy, plans and /or results of Lloyds Banking Group and its current goals and expectations relating to its future financial condition and performance. Statements that are not historical facts, including statements about Lloyds Banking Group's or its directors' and/or management's beliefs and expectations, are forward looking statements. By their nature, forward looking statements involve risk and uncertainty because they relate to events and depend upon circumstances that will or may occur in the future. Factors that could cause actual business, strategy, plans and/or results (including but not limited to the payment of dividends) to differ materially from forward looking statements made by the Group or on its behalf include, but are not limited to: general economic and business conditions in the UK and internationally; market related trends and developments; fluctuations in interest rates, inflation, exchange rates, stock markets and currencies; the ability to access sufficient sources of capital, liquidity and funding when required; changes to the Group's credit ratings; the ability to derive cost savings and other benefits including, but without limitation as a result of any acquisitions, disposals and other strategic transactions; changing customer behaviour including consumer spending, saving and borrowing habits; changes to borrower or counterparty credit quality; instability in the global financial markets, including Eurozone instability, instability as a result of the exit by the UK from the European Union (EU) and the potential for other countries to exit the EU or the Eurozone and the impact of any sovereign credit rating downgrade or other sovereign financial issues; technological changes and risks to the security of IT and operational infrastructure, systems, data and information resulting from increased threat of cyber and other attacks; natural, pandemic and other disasters, adverse weather and similar contingencies outside the Group's control; inadequate or failed internal or external processes or systems; acts of war, other acts of hostility, terrorist acts and responses to those acts, geopolitical, pandemic or other such events; changes in laws, regulations, accounting standards or taxation, including as a result of the exit by the UK from the EU, or a further possible referendum on Scottish independence; changes to regulatory capital or liquidity requirements and similar contingencies outside the Group's control; the policies, decisions and actions of governmental or regulatory authorities or courts in the UK, the EU, the US or elsewhere including the implementation and interpretation of key legislation and regulation together with any resulting impact on the future structure of the Group; the ability to attract and retain senior management and other employees and meet its diversity objectives; actions or omissions by the Group's directors, management or employees including industrial action; changes to the Group's post-retirement defined benefit scheme obligations; the extent of any future impairment charges or write-downs caused by, but not limited to, depressed asset valuations, market disruptions and illiquid markets; the value and effectiveness of any credit protection purchased by the Group; the inability to hedge certain risks economically; the adequacy of loss reserves; the actions of competitors, including non-bank financial services, lending companies and digital innovators and disruptive technologies; and exposure to regulatory or competition scrutiny, legal, regulatory or competition proceedings, investigations or complaints. Please refer to the latest Annual Report on Form 20-F filed with the US Securities and Exchange Commission for a discussion of certain factors together with examples of forward looking statements. Except as required by any applicable law or regulation, the forward looking statements contained in this document are made as of today's date, and Lloyds Banking Group expressly disclaims any obligation or undertaking to release publicly any updates or revisions to any forward looking statements. The information, statements and opinions contained in this document do not constitute a public offer under any applicable law or an offer to sell any securities or financial instruments or any advice or recommendation with respect to such securities or financial instruments.
© Lloyds Banking Group and its subsidiaries