Embed Size (px)
DESCRIPTION
Motor Vehicle Claims Statistics Sheet
Citation preview
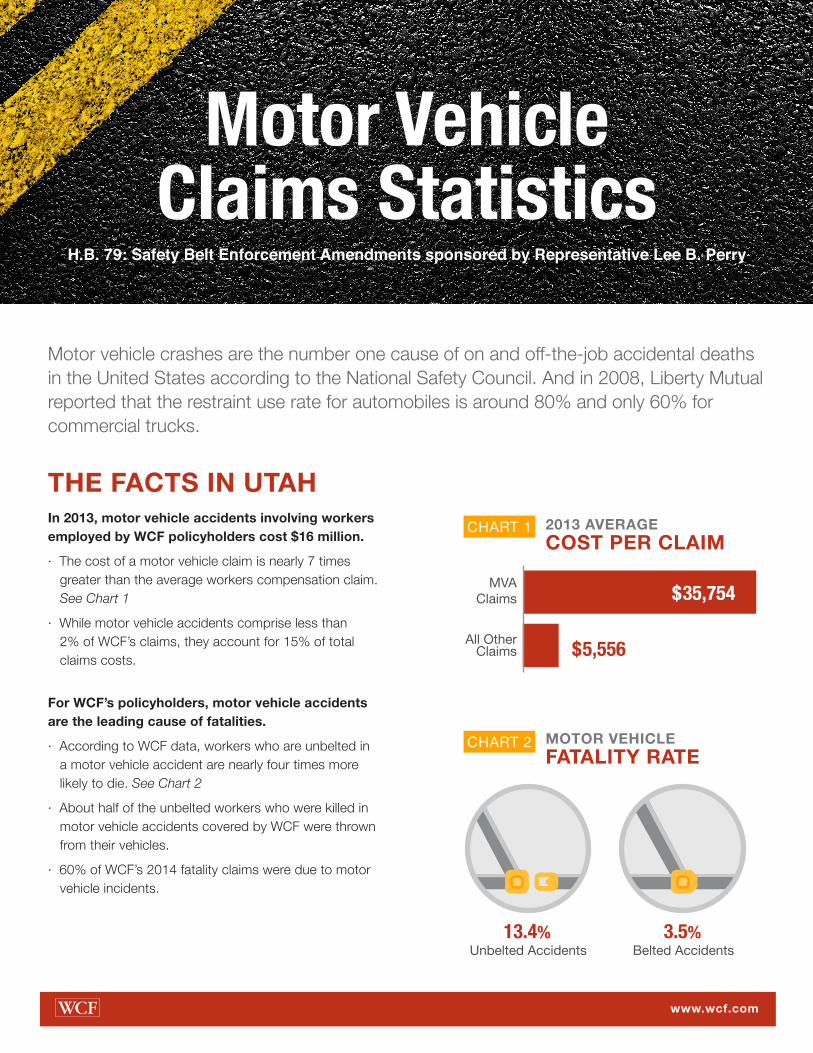
Motor vehicle crashes are the number one cause of on and off-the-job accidental deaths in the United States according to the National Safety Council. And in 2008, Liberty Mutual reported that the restraint use rate for automobiles is around 80% and only 60% for commercial trucks.
THE FACTS IN UTAHIn 2013, motor vehicle accidents involving workers employed by WCF policyholders cost $16 million.
· The cost of a motor vehicle claim is nearly 7 times greater than the average workers compensation claim. See Chart 1
· While motor vehicle accidents comprise less than 2% of WCF’s claims, they account for 15% of total claims costs.
For WCF’s policyholders, motor vehicle accidents are the leading cause of fatalities.
· According to WCF data, workers who are unbelted in a motor vehicle accident are nearly four times more likely to die. See Chart 2
· About half of the unbelted workers who were killed in motor vehicle accidents covered by WCF were thrown from their vehicles.
· 60% of WCF’s 2014 fatality claims were due to motor vehicle incidents.
2013 AVERAGE COST PER CLAIM
MOTOR VEHICLE FATALITY RATE
13.4% 3.5%Unbelted Accidents Belted Accidents
Motor Vehicle Claims Statistics
CHART 2
CHART 1
www.wcf.com
$5,556All Other Claims
MVA Claims $35,754
H.B. 79: Safety Belt Enforcement Amendments sponsored by Representative Lee B. Perry


![The Alberta Motor Vehicle Accident Claims Program ... · The Alberta Motor Vehicle Accident Claims Program WHAT’S IN THIS INFORMATION PACKAGE OVERVIEW OF THE PROGRAM [ 2 ] The Motor](https://img.pdfslide.net/doc/110x75/5ed1594d4008b975c8557669/the-alberta-motor-vehicle-accident-claims-program-the-alberta-motor-vehicle.jpg)