Embed Size (px)
Citation preview

• f
Journal of Fish Biology (2008) 72, 1188-1201 doi: 1O.1111jj.1095-8649.2007.01785.x, available online at http://www.blackwell-synergy.com
Phylogenetic relationships among North American Alosa species (Clupeidae)
B. R. BOWEN*, B. R. KREISER*t, P. F. MICKLE*, J. F. SCHAEFER*
AND S. B. ADAMSt
*The University of Southern Mississippi, Department of Biological Sciences, 118 College Drive # 5018, Hattiesburg, MS 39406-5018, U.S.A. and tUSDA Forest Service,
Southern Research Station, 1000 Front Street, Oxford, MS 38655, U.S.A.
(Received 7 June 2007, Accepted 28 November 2007)
A phylogeny of the six North American species in the genus Alosa, with representatives of three Eurasian species, was generated using mtDNA sequences. This was accomplished by obtaining sequences for three North American species and additional geographical sampling of the other three species. The subgenus Alosa, including the formerly recognized subgenus Caspialosa, formed a strongly supported monophyletic group. Alosa alabamae was part of a polytomy with Alosa sapidissima, which was interpreted to support the recognition of A. alabamae as an incipient, yet distinct, species. The subgenus Pomolobus was not recovered as a monophyletic group. Alosa chrysochloris was basal to all other Alosa, although this position was only weakly supported. Previous work had indicated that Alosa pseudoharengus and Alosa aestivalis are not reciprocally monophyletic, but additional sampling in this study did not detect any further cases of shared haplotypes between the two species. The phylogeny supports previous hypotheses that the evolution of North American Alosa species in the Gulf of Mexico (A. chrysochloris and A. alabamae) was the result of two independent events. First, the ancestor of A. chrysochloris was isolated in the Gulf of Mexico, likely by the close of the Suwannee Straits, and this was followed later by dispersal of the ancestor of A. alabamae around the Florida peninsula into the Gulf of Mexico sometime during or after the Pleistocene. © 2008 The Authors
loumal compilation © 2008 The Fisheries Society of the British Isles
Key words: Alosa; mtDNA; phylogeny; shad.
INTRODUCTION
Many members of the family Clupeidae support valuable fisheries across much of the world. Clupeids are predominately marine, although c. 29 species within the family are diadromous. Seasonal migrations of shad (subfamily Alosinae) have long been exploited by humans (McDowall, 2003). Populations of many migratory clupeids are now declining due to the same sorts of environmental perturbations and anthropogenic influences that have threatened other diadromous species such as salmonids (Nehlsen et al., 1991) and sturgeons (Billard
tAuthor to whom correspondence should be addressed. Tel.: +1 601 2666556; fax: +1 601 2665797; email: [email protected]
1188 '0 2008 The Authors Journal compilation © 2008 The Fisheries Society of the British Isles

NORTH AMERICAN ALOSA PHYLOGENY 1189
& Lecointre, 2000). Despite their economic importance and management concern, shads have generally been poorly studied (Waldman, 2003). One critical missing piece of information is knowledge of the basic taxonomic units within the genus Alosa and their phylogenetic relationships. .
Seven subfamilies are recognized within the Clupeidae (Nelson, 2006). Of interest in this study is the genus Alosa Linck in the subfamily Alosinae, a group that contains marine, freshwater and diadromous species. Of the seven alosine genera, Alosa accounts for about half of the 31 species in the subfamily. At one time, species within Alosa were split into three genera: Alosa, Caspialosa Berg and Pomolobus Rafinesque. Regan (1917; in Bentzen et al., 1993) considered Pomolobus to include four of the six species from North America [Alosa aestivalis (MitchilI), Alosa chrysochloris (Rafinesque), Alosa mediocris (Mitchill) and Alosa pseudoharengus (Wilson)], while Caspialosa was comprised of species from Eastern Europe (the Ponto-Caspian drainage systems). Alosa was reserved for the European species Alosa alosa (Linnaeus) and Alosa fallax (Lacepede) and the North American species Alosa alabamae Jordan and Evermann, and Alosa sapidissima (Wilson). Bailey et al. (1954) later united Pomolobus with Alosa. Similarly, the work of Svetovidov (1964) on osteological characters led him to group both Pomolobus and Caspialosa into Alosa, although he did recognize that the differences between Alosa and Pomolobus could support the recognition of Pomolobus as a distinct subgenus.
The taxonomic status of the genus Alosa now appears stable (although see Bagliniere et al., 2003 for some exceptions), but the number of species in the genus remains in a state of flux. Considerable polymorphism in the genus has resulted in the recognition of numerous sub-species (Bagliniere et al., 2003). For example, six sub-species of A. fallax (reviewed by Aprahamian et al., 2003) and nine sub-species of Alosa brashnikovi (Borodin) (Waldman, 2003) have been described. Conversely, other workers have questioned the taxonomic distinctiveness of some species. Chapman et al. (1994) suggested that further investigation was warranted to determine if A. alabamae is distinct from its sister species A. sapidissima. Boisneau et al. (1992) doubted that A. alosa and A. fallax were distinct species given the frequency of hybridization between the two. However, recent work (Alexandrino et al., 1996; Alexandrino et al., 2006) has documented that the two species do represent distinct lineages based on differences in morphology (gill rakers) and molecular markers (allozymes and mtDNA).
Recent systematic work on the genus Alosa has relied on genetic variation in mtDNA. Bentzen et al. (1993) used whole mitochondrial genome restriction digests to examine the phylogenetic relationships among five species: two from Europe (A. alosa and A. fallax) and three from North America (A. sapidissima, A. pseudoharengus and A. mediocris). This work recognized distinct clades representing the subgenera Alosa and Pomolobus and indicated that there was evidence of hybridization between A. alosa and A. fallax. Chapman et al. (1994) compared restriction site variation in the entire mitochondrial genome and two specific mitochondrial genes [cytochrome b (cyt b) and NADH dehydrogenase subunit 1 (NDl)] in the North American sister species A. sapidissima/ A. alabamae and A. aestivalis/A. pseudoharengus. Alosa alabamae was weakly differentiated from A. sapidissima, which led Chapman et al. (1994) to express doubts that A. alabamae warranted recognition as a distinct species. Alosa
~ 2008 The Authors Journal compilation ~ 2008 The Fisheries Society of the British Isles, Journal of Fish Biology 2008, 72, 1188--1201

1190 B. R. BOWEN ET AL.
aestivalis and A. pseudoharengus appeared to be polyphyletic based on their ND 1 data, a result that Chapman et ai. (1994) attributed to incomplete lineage sorting in a recently diverged pair of species. A follow-up study by Nolan et al. (2003) also found limited genetic differentiation between A. alabamae and A. sap idiss ima, although they detected two fixed restriction site differences. Nolan et al. (2003) appeared to interpret this as evidence favouring continued recognition of A. alabamae while recognizing that the two species have only recently diverged. Faria et al. (2006) have produced the most inclusive phylogeny to date, and the only one so far using mitochondrial sequence data. Their work focused mainly on the Eurasian Alosa species, but they did include three of the six North American Alosa in their phylogeny. Alosa and Pomolobus were again supported as being distinct clades, but Caspialosa species did not represent a unique group.
The Florida peninsula appears to have played a major role in the evolution of North American Alosa species, as for other marine organisms (examples reviewed in A vise, 2000). Both A. alabamae and A. chrysochloris are restricted to Gulf of Mexico drainages, and their presumed closest relatives, A. sapidissima and A. mediocris, respectively, occupy Atlantic drainages (Berry, 1964). The Suwannee Straits connected the Gulf of Mexico to the Atlantic Ocean and separated Florida from mainland North America during the Miocene (Riggs, 1984). This connection was eventually closed as sea levels dropped, but it may have reopened during the high sea stands of the Pliocene (reviewed by Bert, 1986). Swift et al. (1986) suggested that the close of the Suwannee Straits isolated the ancestor of A. chrysochloris in the Gulf of Mexico. However, it appeared unlikely that the ancestor of A. alabamae and A. sapidissima was present on both sides of the Florida peninsula prior to the Pleistocene, meaning that the ancestor would have had to later disperse around the peninsula (Swift et al., 1986).
The goal of this study was to collect comparable sequence data to that reported by Faria et al. (2006) and build upon their impressive phylogeny by adding complete taxonomic sampling of North American Alosa species. As far as is known, this is the first attempt to apply DNA sequence data to questions about North American Alosa species raised by previous studies that used mtDNA restriction digests (Bentzen et al., 1993; Chapman et al., 1994; Nolan et al., 2003). Specifically, the goals were to: (i) produce a complete North American Alosa phylogeny, (ii) determine the taxonomic distinctiveness of A. sapidissima and A. a labamae , (iii) characterize the extent of genetic differentiation between A. pseudoharengus and A. aestivalis through increased sampling, (iv) determine if A. chrysochioris and A. mediocris are sister species and (v) better understand the biogeography of North American Alosa species.
MATERIALS AND METHODS
Samples of North American Alosa species were obtained from numerous sources (Table I; -Fig. 1). Fin clips were placed into a preservation buffer (Seutin et aI., 1991) and then stored at -200 C at the University of Southern Mississippi until DNA was extracted. Sequence data from Faria et al. (2006) were taken from GenBank for all available North American Alosa species and for selected Eurasian species (Table I).
© 2008 The Authors Journal compilation © 2008 The Fisheries Society of the British Isles, Journal of Fish Biology 2008, 72, 1188- 1201
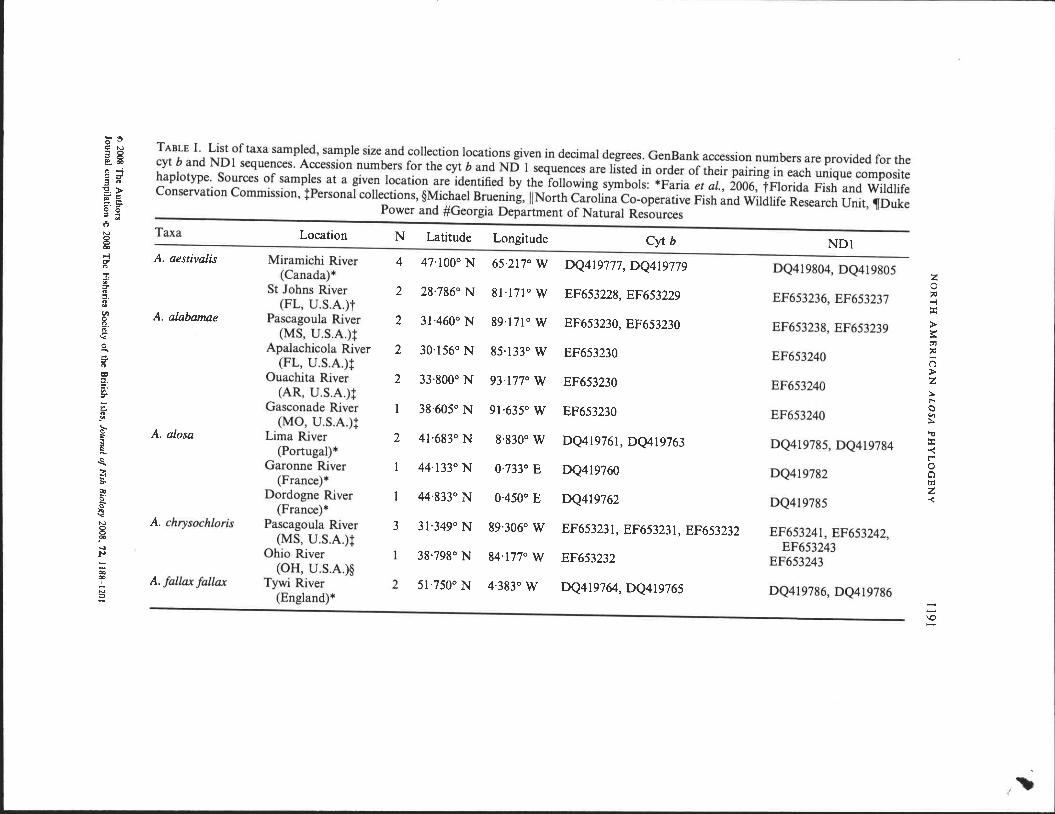
0'0 TABLE I. List of taxa sampled, sample size and collection locations given in decimal degrees. GenBank accession numbers are provided for the
r:: N
3 8 cyt band ND I sequences. Accession numbers for the cyt band ND 1 sequences are listed in order of their pairing in each unique composite ~oo
8 ;;! haplotype. Sources of samples at a given location are identified by the following symbols: *Faria et aJ., 2006, tFiorida Fish and Wildlife 3 n
'g.~ Conservation Commission, tPersonal collections, §Michael Bruening, II North Carolina Co-operative Fish and Wildlife Research Unit, ,Duke 110 '* Power and #Georgia Department of Natural Resources
=. ::r o 0 = ;: t)
Taxa Location N Latitude Longitude Cyt b NDl N
8 00
;;! .A. aestivalis Miramichi River 4 47'100° N 65·217°W DQ419777, DQ419779 DQ419804, DQ419805 z n
(Canada)* 0
:!1
~
;. St Johns River 2 28·786° N 81·171° W EF653228, EF653229 EF653236, EF653237 -! n ::::I.
(FL, U.S.A.)t ::t 11
:> til .A. alabamae Pascagoula River 2 31-460° N 89·171° W EF653230, EF653230 EF653238, EF653239 8.
3:: n (MS, U .S.A.)t trl
-< ~
0 Apalachicola River 2 30·156° N 85'133° W EF653230 EF653240 (')
.... ;. (FL, U.S.A.)t
:> n
Z 0:1 Ouachita River 2 33·800° N 93·177° W EF653230 EF653240 :a.. ::::I. ~. (AR, U.S.A.)t
t"-o :J"
C - Gasconade River 38·605° N 91'635° W EF653230 EF653240 c., '" :a.. Jf (MO, U.S.A.)t "C ~ A. alosa Lima River 2 41·683° N 8·830° W DQ419761, DQ419763 DQ419785, DQ419784 ::t
$;
-< l (port ugal) * t"" 0 ~ Garonne River 44'133°N 0·733° E DQ419760 DQ419782 0 trl ~ (France) * Z -<
tlo Dordogne River 44·833° N 0·450° E DQ419762 DQ419785 5· S" (France) * ~ N A. chrysochloris Pascagoula River 3 31·349° N 89·306° W EF653231, EF653231, EF653232 EF653241 , EF653242, 8
(MS, U.S.A.)t EF653243 JC ~ Ohio River 38·798° N 84'177° W EF653232 EF653243 ~ - (OR, U.S.A.)§ 0;; 00 A. fallax fallax Tywi River 2 51·750° N 4·383° W DQ419764, DQ419765 DQ419786, DQ419786
I
i3 (England) * -~ -\0 -
t ~

~
-.... 0 \.0 s; tv ::s e-n TABLE I. Continued 0 9 '0
~ Taxa Location N Latitude Longitude Cyt b NDI g. ::s (0 A. immaculata Danube Delta 44'867° N 29·617° E DQ419769 DQ419796 8 (Romania)'" 00
Danube Delta 2 44'183° N 28·800° E DQ419770, DQ419771 DQ419794, DQ419795 ;l n (Romania)'" !l ~ A. mediocris Roanoke River 3 36'309° N 77·563° W EF653233, EF653233 EF653244, EF653245 n
(NC, U.S.A.)" ::3. 11 til Altamaha River 2 31·316° N 81·285° W EF653233 EF653244 ~
8. (GA, U.S.A.)# ?O n ~ A. pseudoharengus Miramichi River 2 47·100° N 65·217° W DQ419777, DQ419778 DQ419804, DQ419806 0
a:l -.
(Canada)'" 0
;. ~ n Lake Ontario 2 43·250° N 77·533° W DQ419776 DQ419803 tTl 1:1' Z a· (NY, U.S.A.)'" r;j ' t!:I ::r Catawba River 3 35·436° N 80·958° W DQ419778 EF653246 ...,
~ (NC, U.S.A.)' :... r--
~ A. sapidissima Connecticut River 4 41·267° N 72·563° W DQ419773, DQ419773, DQ419799, DQ419800, ;:
~ (CT, U.S.A.)'" DQ419774, DQ419775 DQ419801, DQ419802
~ Roanoke Rjver 2 36'309 oN 77·563° W EF653234, EF653234 DQ419799, EF653247 ~ (NC, U.S.A.)" ... :r
Altamaha River 5 31'316°N 81·285° W DQ419775, DQ419775, DQ419775, EF653248, EF653249, ~ c' (GA, U.S.A.)# EF653235, EF653234 EF653250, EF653251, Q ~ EF653247 NO 8N St Johns 2 28·786° N 81·171° W DQ419774, DQ419774 EF653252, DQ419801 !J08 -01 00 River (FL, U.S.A.)t ~;l -n 00> ~c -So NO 0., - '"

NORTH AMERICAN ALOSA PHYLOGENY 1193
-95 -90 -85 -80 -75 -70 -65 -60 SO~~~~ ...... ~~~~ .. ~~~~~~~~ .. ~~==~~
30~~~~~~~~~~~----~------+------+----~30
25 -95 - 90 - 85 -80 -75 - 70
o
-65
km
200 400 25
-60
FIG. l. North American eoJlection sites for Alosa used in this study. Sites are labelled by drainage as identified in Table I. The base map was generated with the online map creation website (http:// www.aquarius.geomar.de/ome ).
Following Faria et al. (2006), one of the outgroup taxa was Sardinops melanostictus (Temminck & Schlegel) (subfamily Clupeinae), and Dorosoma cepedianum (Lesueur) (subfamily Dorosomatinae) was selected for the second outgroup. Both outgroup taxa have complete mitochondrial sequences available on GenBank (accession numbers AB032554 and OQ536426).
Total genomic DNA was extracted from fin tissue using the Qiagen DNeasy extraction kit (QIAGEN Inc., Valencia, CA, U.S.A.). The polymerase chain reaction (peR) was used to amplify the complete mitochondrial NO 1 and cyt b genes. The primers reported by Faria et al. (2006) were used for NO 1. Primers matching conserved regions in the flanking tRNAs of cyt b were designed based on the sequences avaiJable on GenBank for the clupeiform fishes S. melanostictus and D. cepidianum. These primers, ShadcytbFl (5'-CCACCGTTGTTATTCAACTATAGAAAC-3') and ShadcytbRl (5'AGAA TRCT AGCTITGGGAG-3 '), allowed us to amplify the entire cyt b gene. An internal primer, ShadcytbR3 (5' -AGAAGGGCTARTACTCC-3'), was designed for sequencing across the region reported by Faria et al. (2006).
PCR amplifications were conducted in a total volume of 25 I.d using 50 mM KCI, 10 mM Tris- HC] (pH 8'3), 0'01 % gelatin, 2 mM MgCh, 200 ~M dNTPs, 0·5 units Taq polymerase, 0·3 ~M of each primer, c. 100 ng template DNA and water to the final volume. PCR cycling conditions consisted of an initial 1 min denaturing step at 950
C followed by 30 cycles for I min at 950 C, 1 min at 500 C and 1-3 min at 720 C. A final elongation step for 7 min at 720 C completed the cycle. PCR products were
© 2008 The Authors Journal compilation © 2008 The Fisheries Society of the British Isles, Journol of Fijh Biology 2008, 71, 1188-- 1201
,

1194 B. R. BOWEN ET AL.
cleaned using the ExoSAP-IT system (USB Co., Cleveland, OH, U.S.A.) and then used as the template in a cycle sequencing reaction with an ABI BigDye Terminator cycle sequencing kit (Foster City, CA, U.S.A.) using the primers described above. All sequencing reactions were sephadex cleaned (Princeton Separations, Adelphia, NJ, U.S.A.) prior to gel runs at the Iowa State University DNA Sequencing and Synthesis Facility. Sequence data were edited and aligned using Sequencher v. 4.1 (Gene Codes Co., Ann Arbor, MI, U.S.A.). Only the portion of cyt b matching that reported by Faria et al. (2006) was used in subsequent analyses.
PAUP* 4.0bl0 (Swofford, 2002) was used to calculate pair-wise distances and the number of transitions and transversions. Saturation of nucleotide substitutions was assessed by plotting the number or transitions and transversions v. pair-wise uncorrected p distances. The degree of congruence in the phylogenetic signal of the cyt band NOI data sets was examined using the incongruence length difference test as implemented by PA UP* (Farris et aI., 1994). For all ingroup taxa, MEGA 3.1 (Kumar et al., 2004) was used to calculate the average within-species uncorrected p distances and the net nucleotide divergence between species.
Phylogenetic relationships were inferred using maximum parsimony (MP), maximum likelihood (ML) and Bayesian analyses. All redundant sequences were excluded from these analyses to reduce the computational demand. The MP analysis was performed by PAUP* with a branch-and-bound search, and the initial upper bound was calculated by stepwise addition. GARLI v. 0.95 (Zwickl, 2006) was used to perform the ML analysis. A Bayesian inference of the phylogeny was performed using MrBayes v. 3.1 (Ronquist & Huelsenbeck, 2003). Tree space was explored starting with a random tree and employing two independent runs of four Markov chains of 1 000 000 generations, each sampled every 100 generations. Plots of log-likelihood scores v. generation time were examined to ensure that each run had reached stationarity, and the first 2500 trees were then discarded as burn-in. The most appropriate model of sequence evolution for the ML and Bayesian analyses was selected by ModelTest v. 3.5 (posada & Crandall, 1998) as a GTR +G model with a gamma distribution shape parameter of 0'146. Phylogenetic support was assessed through bootstrapping (Felsenstein, 1985) with 1000 rounds of resampling for the MP and ML analyses. Bremer support values (Bremer, 1988) were calculated using MacClade 4 (Maddison & Maddison, 2000) to produce the command file for PAUp·. The majority-rule consensus of the 7500 trees saved by the Bayesian analysis was used to obtain the posterior probabilities of each clade.
The Templeton's two-tailed Wilcoxon signed-ranks test (Templeton, 1983) and the Shimodaira- Hasegawa test (SH, Shimodaira & Hasegawa, 1999) were used to compare the results of the phylogenetic analyses with prior hypotheses of relationships within Alosa. Two hypotheses were tested: monophyly of A. sapidissima and a sister relationship between A. mediocris and A. chrysochloris. The most parsimonious trees identified by the branch-and-bound search were compared with the trees generated by the constrained searches using the non-parametric two-tailed Wilcoxon signed-ranks test as implemented by P A up •. The SH test compared the most likely tree from the constrained search with the most likely tree from the unconstrained search and the set of most parsimonious trees. The most parsimonious trees were included in case the ML search did not identify the true topology since the SH test assumes that the true tree is included. The SH test was conducted in PAUP* with 1000 bootstrap replicates using the resampIing estimated log-likelihood (RELL) method.
RESULTS
New sequences for 30 individuals representing the six North American Aiosa species were obtained as a part of this study (see Table I for GenBank accession numbers), including three species (A. aiabamae, A. chrysochloris and A. mediocris) that were not sampled by Faria et ai. (2006). In combination with 18 individuals selected from Faria et ai. (2006), the data set was comprised of 35 unique haplotypes for the ingroup taxa. The final sequence alignment
© 2008 The Authors Journal compilation © 2008 The Fisheries Society of the British Isles, Journal of Fish Biology 2008, 72, 1188-1201

NORTH AMERICAN ALOSA PHYLOGENY 1195
included 1423 bases of which 448 bp were of cyt band 975 bp of NDI. When considering just the ingroup taxa, 68 sites were variable in cyt band 179 in ND1, of which 62 and 165 were parsimony informative, respectively. The incongruence length test found congruent phylogenetic signal (P = 0'73) in the two data sets, so both were combined in all phylogenetic analyses. All codon positions were weighted equally in the parsimony analysis, since no evidence of saturation at third codon positions was detected in either gene.
Average within-species p distances for both genes combined (Table II) for North American taxa were all relatively small - ranging from 0·0003 (A. mediocris) to 0·0052 (A. aestivalis). Net nucleotide divergence between the ingroup taxa (Table II) ranged from 0·0042 (A. alabamae-A. sapidissima) to 0·0936 (A. fallax-A. chrysochloris). The A. aestivalis with an A. pseudoharengus haplotype reported by Faria et al. (2006) was excluded from these calculations. Considering the subgenera Alosa and Pomolobus, the average net nucleotide divergence among species within each subgenus was 0·018 and 0'042, respectively, and the net nucleotide divergence between the two was 0·046.
Even though cyt b was a partial sequence, there were nearly as many amino acid substitutions in cyt b (seven) as there were in NDI (eight). In cyt b, five of the amino acid substitutions were synapomorphies for the subgenus Alosa, and one was a synapomorphy for Eurasian Alosa. Four of the amino acid substitutions in NDI differentiated A. chrysochloris from other Alosa, but two of these differences were also shared with one of the outgroup taxa. Likewise, the one amino acid difference in ND 1 distinguishing the subgenus Alosa from Pomolobus was not a true synapomorphy for either group. However, one amino acid substitution in this gene was a synapomorphy for A. mediocris.
The branch-and-bound search identified 48 equally parsimonious trees [L = 795, consistency index (CI) = 0'731, retention index (RI) = 0'869]. The ML (-lnL = 5465·84) and Bayesian phylogenetic analyses recovered the same overall topology, and the ML tree was selected to represent the phylogeny (Fig. 2).
TABLE II. Net nucleotide divergence (below the diagonal) and standard error (above the diagonal) between ingroup species based on the combined mitochondrial cyt band ND 1 nucleotide sequences. Average within-species uncorrected p distances are reported in bold along the diagonal. Species are abbreviated as follows: Alab., A. alabamae; Sap., A. sapidissima; Alosa, A. alosa; Fallax, A. fallax; Imm., A. immaculata; Pseudo., A.
pseudoharengus; Aest., A. aestivalis; Med., A. mediocris and Chryso., A. chrysochloris
Alab. Sap. Alosa Fallax Imm. Pseudo. Aest. Med. Chryso.
Alab. 0·0004 0·0016 0·0050 0·0048 0·0046 0·0059 0·0060 0·0070 0·0075 Sap. 0·0042 0·0043 0·0046 0·0044 0·0041 0·0059 0·0060 0'0068 0·0073 Alosa 0·0329 0·0299 0·0052 0·0039 0·0034 0·0065 0·0066 0·0069 0·0078 Fallax 0·0316 0'0290 0·0220 0·0007 0·0028 0·0066 0·0065 0·0071 0·0082 Imm. 0·0283 0·0252 0·0156 0·0110 0·0052 0·0061 0·0062 0·0068 0·0077 Pseudo. 0·0683 0·0672 0·0685 0·0694 0·0669 0·0040 0·0029 0·0050 0·0070 Aest. 0·0668 0'0650 0·0698 0'0700 0·0672 0·0151 0·0052 0·0050 0·0064 Med. 0·0750 0·0710 0·0754 0·0752 0·0740 0·0420 0·0436 0·0003 0·0072 Chryso. 0·0906 0'0863 0·0928 0'0936 0·0908 0·0707 0·0659 0'0746 0·0015
© 2008 The Authors Journal compilation © 2008 The Fisheries Society of the British Isles, Journal of Fish Biology 2008, 71, 1188-1201

1196
ssn6l<50 (1)
B. R. BOWEN ET AL.
1001100'98 (19)
99/100199 (5)
'001100199 (13)
A. alabamae Apalachicola I, 2
A. alabamae Ouachila 1. 2
A. alabamae Gasconade I
A. alabamae Pascagoula I
A. alabamae Pascagoula 2
A. sapidissima Roanoke 1
A. sapidissima Roanoke 2. Altamaha 10
A. sapidissima Connecticut (As3). St. Johns 2
A. sapidissima Connecticut (Asl)
A. sapidissima Connecticut (As2)
A. sapidissima Altamaha 4
A. sapidissima St. Johns I
A. sapidissima Connecticut (As4)
A. sapidissima Altamaha 2
A. sapidissima Altamaha 5
A. sapidissima Altamaha 6
A. alosa Lima (Aa2)
A. alosa Dordogne (Aa3)
A. alosa Lima (Aa4)
99/100'87 A. alosa Garonne (Aal) (9) 100'100'100
'----...:....:;...----i (9) A. f. falm Tywi (Afl)
97/98n2 (5)
'00199/58 (8)
S9f701<SO (I)
A. f. falm Tywi (Af2)
A. immaculata Romania (Bs5)
A. immaculata Romania (Bs6)
A. immaculata Romania (Bs8)
A. pseudoharengus Calawba 1. 2. 3
A. pseudoharengus Miramichi (Po3)
A. pseudoharengus Lake Ontario (Pol)
A. pseudoharengus Miramichi (Po2 x 2)
100'100'89 (38)
A. aeslivalis Miramichi (P04 x 2)
A. aestivalis Miramichi (P04)
A. aestivalis St. Johns I
100'100'98 (26)
86/76/<50 (5)
A. aestivalis St. Johns 2
A. mediocris Altamaha 1. 2; Roanoke 1. 2
''-OOI-'OOI-'-OO-i A. mediocris Roanoke 3 (25)
A. chrysochloris Pascagoula 1
A. chrysochloris Pascagoula 2
A. chrysochloris Pascagoula 3, Ohio 1
t-------------------- Sardinops melanostictus L-_________________ Dorosoma cepedianum
- tOchanges
FIG. 2. The phylogram recovered from the maximum likelihood (ML) analysis of the combined mitochondrial cyt b and NOt sequence data. Values provided for the more basal branches of the tree correspond to maximum parsimony bootstrap, Bayesian posterior probabilities and ML bootstrap for a given node, while the value in parentheses is the decay index. Individuals are identified by species and the river system from which they were collected. The sequences from Faria et al. (2006) have also been given the haplotype designation provided by the authors.
i!) 2008 The Authors Journal compilation 10 2008 The Fisheries Society of the British Isles. Journal of Fish Biology 2008, 72, 1188- 1201

NORTH AMERICAN ALOSA PHYLOGENY 1197
Alosa chrysochloris was recovered as the most basal Alosa species, but this relationship should be considered tentative given the low support values for the node leading to all remaining species (e.g. MP bootstrap = 55). Other species within the subgenus Pomolobus formed a moderately to poorly supported clade with A. mediocris basal to A. aestivalis and A. pseudoharengus. The subgenus Alosa was strongly supported by all measures of phylogenetic support. Within this clade, species fell into well-supported North American (A. alabamae and A. sapidissima) and Eurasian clades (A. alosa, A. fallax and Alosa immaculata Bennett). Alosa alabamae was recovered as a strongly supported monophyletic group that was part of what essentially was a polytomy with A. sapidissima.
The results of the phylogenetic hypothesis testing reflected the measures of phylogenetic support for the clades in question. When A. sapidissima was constrained to be monophyletic, the MP search recovered trees only one step longer (L = 796), and neither Templeton's (P > 0'564) nor the SH (P > 0'425) tests were significant. The position of A. chrysochloris as basal to the remainder of Alosa was only poorly supported by bootstrapping, and this topology was not significantly better than a constraint tree reflecting a sister relationship between A. chrysochloris and A. mediocris (Templeton's P > 0'170; SH P > 0'408).
DISCUSSION
As far as is known, this is the first molecular-based phylogeny including all North American Alosa species. Faria et al. (2006) extensively sampled Eurasian taxa, but they only included A. aestivalis, A. pseudoharengus and A. sapidissima from North America. In this study, the remaining three species (A. alabamae, A. chrysochloris and A. mediocris) have been added along with increased geographical sampling in the other three species, especially A. sapidissima. As found by Faria et al. (2006), the subgenus Alosa was a well-supported clade in the phylogeny. However, the subgenus Pomolobus was no longer a monophyletic group after the inclusion of A. mediocris and A. chrysochloris. Although A. chrysochloris was recovered as being basal to the remainder of Alosa, the phylogeny should realistically be presented as a polytomy of A. chrysochloris with the A. pseudoharengusjA. aestivalisjA. mediocris clade and the subgenus Alosa.
The inclusion of A. alabamae, the putative sister species to A. sapidissima, in the phylogenetic analyses did not alter the relationships within the subgenus Alosa. The A. alabamaejA. sapidissima clade was strongly supported with an average net nucleotide divergence of 0·029 between them and the Eurasian Alosa species. Alosa alabamae was recovered as a strongly supported monophyletic group that was part of a polytomy with A. sapidissima. Previous workers using mtDNA restriction site data had either refuted (Chapman et al., 1994) or supported (Nolan et al., 2003) the recognition of A. alabamae as a distinct, albeit a recently diverged, species. The sequence data presented here can also be interpreted as evidence of recent divergence of A. alabamae from A. sapidissima, and the lack of reciprocal monophyly between the two supports Swift et al. 's (1986) characterization of A. alabamae as an incipient species. However, to claim that A. alabamae and A. sapidissima do not represent separate species fails to recognize the fact that they are allopatric, separated by the Florida peninsula. The two taxa also exhibit important life-history differences; A. alabamae
© 2008 The Authors Journal compilation 1d 2008 The Fisheries Society of the British Isles, }oUrTUJl of Fish Biology 2008, 72, 1188-1201

1198 B. R. BOWEN ET AL.
is iteroparous whereas southern populations of A. sapidissima tend to be semelparous (Mettee & O'Neil, 2003). Alosa sapidissima was widely introduced in the Mississippi River drainage and across the Gulf of Mexico during the late 1800s, although these introductions were never deemed successful (Mettee & O'Neil, 2003). The present study does not address this issue since detecting the extent, if any, that these two species hybridized after the introductions would require much more intensive sampling and the use of nuclear and mtDNA markers (Alexandrino et al., 2006). However, at least within the narrow scope of the sampling, no A. sapidissima haplotypes were detected in A. alabamae.
Previous workers (Chapman et al., 1994; Faria et al., 2006) reported that A. aestivalis and A. pseudoharengus were not reciprocally monophyletic. In the mitochondrial restriction site data of Chapman et al. (1994), the two species (both sampled from North Carolina, U.S.A.) were monophyletic when considering cyt b, but not ND 1, which they considered to represent incomplete lineage sorting in the two species. Faria et al. (2006) detected two individuals of A. aestivalis from the Miramichi River (Canada) that shared a haplotype with A. pseudoharengus collected from the same location. They cited Chapman et al. 's (1994) explanation of incomplete lineage sorting, and they also suggested that this might represent hybridization since the sequence divergence between the two species was c. 20/0. Additional sampling from one new location for each species failed to reveal any additional cases of shared haplotypes. Given the extent of sequence divergence between A. aestivalis and A. pseudoharengus compared with the relatively low level within each species, incomplete lineage sorting may not be the most likely explanation. As far as is known, potential hybridization between the two species has not been thoroughly tested with mtDNA or nuclear loci (e.g. microsa telli tes).
The hypothesized close relationship between A. chrysochloris and A. mediocris has apparently been based on biogeography and not formal taxonomic study (Berry, 1964; Swift et al., 1986). The phylogeny presented here does not support this hypothesized relationship. However, the basal position of A. chrysochloris in the phylogeny was only weakly supported, and this topology was not significantly better than one in which A. chrysochloris was constrained to be sister to A. mediocris. Further work will be required before the exact relationship between A. chrysochloris and the remainder of the subgenus Pomolobus and the genus Alosa as a whole can be resolved.
The work presented here provides some insight into the biogeography of North American Alosa species. Ideally, the sequence divergence data could be used to date cladogenetic events, which would then be correlated with important geologic events. Bentzen et al. (1993) arrived at a rate of sequence divergence in Alosa mtDNA (0·220/0 per million years) that was much lower than those calculated for other teleost fishes, but recent work has raised doubts about the age of the fossils used to calibrate this rate (Zaragiieta, 2001; in Faria et al., 2006). Despite this setback, the phylogeny and sequence divergence values can still be used to make biogeographic inferences. Faria et al. (2006) inferred that two biogeographic events led to the evolution of taxa on both sides of the Atlantic. Presumably, the first event involved an ancient divergence between the subgenus Pomolobus in North America and the subgenus
(t) 2008 The Authors Journal compilation <c 2008 The Fisheries Society of the British Isles, Journal of Fish Biology 2008, 71, 1188--120 I

NORTH AMERICAN ALOSA PHYLOGENY 1199
Alosa in Eurasia. A second more recent divergence then took place between Eurasian Alosa and the common ancestor of A. sapidissima and A. alabamae. Since Alosa are anadromous fishes capable of movement in the marine environment, the isolation of the two groups could have taken place well after the widening of the Atlantic due to sea-floor spreading. The similarly distributed Acipenser sturio Linnaeus (eastern Atlantic) and Acipenser oxyrinchus Mitchill (western Atlantic) may have a similar evolutionary history, perhaps only having diverged as recently as the Pliocene or Pleistocene (Choudhury & Dick, 1998).
For the North American Alosa species, Swift et al. (1986) proposed that the evolution of A. chrysochloris and A. alabamae in the Gulf of Mexico was the product of two independent biogeographic events: the close of the Suwannee Straits and dispersal around the Florida peninsula sometime during or after the Pleistocene. The phylogeny and sequence divergence data roughly corroborate this situation. Although the phylogeny does not show strong support for a sister relationship between A. chrysochloris and A. mediocris, the large amount of sequence divergence (0'0659--0·0746) between A. chrysochloris and the remainder of the Pomolobus clade suggests that the first divergence event between North American Alosa in the Gulf of Mexico and those in the Atlantic was an ancient one. The lack of reciprocal monophyly and limited sequence divergence (0'0042) between A. alabamae and A. sapidissima support the hypothesis that the ancestor of A. alabamae arrived in the Gulf of Mexico relatively recently in geological terms. A very similar evolutionary history has' been inferred for two species of hermit crabs, both with populations in the Atlantic and Gulf of Mexico. Divergence of Pagarus pollicaris populations probably occurred sometime prior to the Pleistocene, while populations of Pagarus longicarpus likely diverged at some point during the Pleistocene (young et al., 2002).
The work presented here, in conjunction with that of Faria et al. (2006), provides a comprehensive molecular phylogeny of the genus Alosa. The complete taxonomic sampling of North American species has allowed us to address unresolved taxonomic issues in the group and to test several biogeographic hypotheses. Future work employing additional markers (other mtDNA genes and nuclear loci) may yet be able to provide a more resolved phylogeny for the genus.
Funding for this project was provided by the National Oceanic and Atmospheric Administration (NOAA) National Marine Fisheries Service, the United States Forest Service and the Mississippi Museum of Natural Science. Tissue samples or assistance in the field was generously provided by the Georgia Department of Natural Resources Fisheries Management Section Region VI (B. Deener and C. Sexton), Florida Fish and Wildlife Conservation Commission (E. Long, G. Bass, K. McDonald, D. Nemeth and C. Purturlbaugh), Florida Marine Research Institute (R. McBride and J. Harris), Mississippi Museum of Natural Science (T. Slack and M. Dugo), Missouri Department of Conservation (M. Winston), North Carolina Co-Operative Fish and Wildlife Research Unit (1. Hightower and W. Mitchill), the United States Fish and Wildlife Service (F. Parauka, J. Krummrich and B. Hilton) and M. Bruening. All personal collections were made under the appropriate state collection permits (Florida, #035R-786; Mississippi, #MSJFS2004; Missouri, #11900), and the sampling protocol was approved by the University of Southern Mississippi Institutional Animal Care and Use Committee (protocol #06091403). Invaluable editorial advice was provided by D. Kreiser.
:c 2008 The Authors Journal compilation <D 2008 The Fisheries Society of the British Isles, Journal of Fish Biology 2008, 72. 1188---1201

1200 B. R. BOWEN ET AL.
References
Alexandrino, P. J., Ferrand, N. & Rocha, J. (1996). Genetic polymorphism of a haemoglobin chain and adenosine deaminase in European shads: evidence for the existence of two distinct genetic entities with natural hybridization. Journal of Fish Biology 48, 447-456.
Alexandrino, P., Faria, R., Linhares, D., Castro, F., Le Corres, M., Sabatie, R., Bagliniere, J. L. & Weiss, S. (2006). Interspecific differentiation and intraspecific substructure in two closely related clupeids with extensive hybridization, Alosa alosa and Alosa fallax. Journal of Fish Biology 69 (Suppl. B), 242-259.
Aprahamian, M. W., Bagliniere, J. L., Sabatie, M. R., Alexandrino, P., Thiel, R. & Aprahamian, C. D. (2003). Biology, status, and conservation of the Atlantic twaite shad Alosa fallax fallax. In Biodiversity, Strategies, and Conservation of the World's Shads (Limburg, K. E. & Waldman, J. R., eds), pp. 103-124. Bethesda, MD: American Fisheries Society.
Avise, J. C. (2000). Phylogeography: The History and Formation of Species. Cambridge, MA: Harvard University Press.
Bagliniere, J. L., Sabatie, M. R., Rochard, E., Alexandrino, P. & Aprahamian, C. D. (2003). The allis shad Alosa alosa: biology, ecology, range, and status of popUlations. In Biodiversity, Strategies, and Conservation of the World's Shads (Limburg, K. E. & Waldman, J. R., eds), pp. 85-102. Bethesda, MD: American Fisheries Society.
Bailey, R. M., Winn, H. E. & Smith, C. L. (1954). Fishes from the Escambia River, Alabama and Florida, with ecologic and taxonomic notes. Proceedings of the Academy of Natural Science of Philadelphia 56, 109-164.
Bentzen, P., Leggett, W. C. & Brown, G. G. (1993). Genetic relationships among the shads (Alosa) revealed by mitochondrial DNA analysis. Journal of Fish Biology 43, 909-917.
Berry, F. H. (1964). Review and emendation of family Clupeidae. Copeia 1964, 720-730. Bert, T. M. (1986). Speciation in western Atlantic stone crabs (genus Menippe): the role of
geological processes and climatic events in the formation and distribution of species. Marine Biology 93, 157-170.
Billard, R. & Lecointre, G. (2000). Biology and conservation of sturgeon and paddlefish. Reviews in Fish Biology and Fisheries 10, 355-392.
Boisneau, P., Mennesson-Boisneau, C. & Guyomard, R. (1992). Electrophoretic identity between allis shad Alosa alosa L. and twaite shad, Alosafallax (Lacepede). Journal of Fish Biology 40, 731-738.
Bremer, K. (1988). The limits of amino acid sequence data in angiosperm phylogenetic reconstruction. Evolution 42, 795-803.
Chapman, R. W., Patton, J. C. & Elby, B. (1994). Comparisons of mitochondrial DNA variation in four alosid species as revealed by the total genome, the NADH dehydrogenase I and cytochrome b regions. In Genetics and Evolution of Aquatic Organisms (Beaumont, A., ed.), pp. 249-263. London: Chapman & Hall.
Choudhury, A. & Dick, T. A. (1998). The historical biogeography of sturgeons (Osteichthyes: Acipenseridae): a synthesis of phylogenetics, palaeontology and palaeogeography. Journal of Biogeography 25, 623-640.
Faria, R., Weiss, S. & Alexandrino, P. (2006). A molecular perspective on the evolutionary history of Alosa spp. (Clupeidae). Molecular Phylogenetics and Evolution 40, 298-304.
Farris, J. S., Kallersjo, M., Kluge, A. G. & Bult, C. (1994). Testing significance of incongruence. Cladistics 10, 315-319.
Felsenstein, J. (1985). Confidence limits on phylogenies: an approach using the bootstrap method. Evolution 39, 783-791.
Kumar, S., Tamura, K. & Nei, M. (2004). MEGA3: integrated software for molecular evolutionary genetics analysis and sequence alignment. Briefings in Bioinformatics S, 150-163.
I!:J 2008 The Authors Journal compilation © 2008 The Fisheries Society of the British Isles, Journal of Fish Biology 2008, 71, 1188-- 1201

NORTH AMERICAN ALOSA PHYLOGENY 1201
Maddison, D. R. & Maddison, W. P. (2000). MacClade 4: Analysis of Phylogeny and Character Evolution. Version 4.0. Sunderland, MA: Sinauer Associates.
McDowall, R. M. (2003). Shads and diadromy: implications for ecology, evolution, and biogeography. In Biodiversity, Strategies, and Conservation of the World's Shads (Limburg, K. E. & Waldman, J. R., eds), pp. 11-23. Bethesda, MD: American Fisheries Society.
Mettee, M. F. & O'Neil, P. E. (2003). Status of Alabama shad and skipjack herring in Gulf of Mexico drainages. In Biodiversity, Strategies, and Conservation of the World's Shads (Limburg, K. E. & Waldman, J. R., eds), pp. 157-170. Bethesda, MD: American Fisheries Society.
Nehlsen, W., WiJliams, J. E. & Lichatowich, J. A. (1991). Pacific salmon at the crossroads. Stocks at risk from California, Oregon, Idaho, and Washington. Fisheries 16, 4-21.
Nelson, J. S. (2006). Fishes of the World, 4th edn. New York, NY: John Wiley & Sons. Nolan, K. A., Waldman, J. R. & Wirgin, I. (2003). Intraspecific and interspecific
molecular differentiation of American shad and Alabama shad: a synthesis. In Biodiversity, Strategies, and Conservation of the World's Shads (Limburg, K. E. & Waldman, J. R., eds), pp. 295-302. Bethesda, MD: American Fisheries Society.
Posada, D. & Crandall, K. A. (1998). MODELTEST: testing the model of DNA substitution. Bioinformatics 14, 817- 818.
Regan, C. T. (1917). A revision of the clupeoid fishes of the genera Pomolobus, Brevoortia and Dorosoma and their allies. Annals and Magazine of Natural History, Series 8 19, 297-316.
Riggs, S. R. (1984). Pale ocean graphic model of Neogene phosphorite deposition, U.S. Atlantic continental margin. Science 223, 123-131.
Ronquist, F. & Huelsenbeck, J. P. (2003). MrBayes 3: Bayesian phylogenetic inference under mixed models. Bioinformatics 19, 1572-1574.
Seutin, G., White, B. N. & Boag, P. T. (1991). Preservation of avian blood and tissue samples for DNA analyses. Canadian Journal of Zoology 69, 82-90.
Sbimodaira, H. & Hasegawa, M. (1999). Multiple comparisons of log-likelihoods with application to phylogenetic inference. Molecular Biology and Evolution 16, 1114-1116.
Svetovidov, A. N. (1964). Systematics of North American anadromous Clupeoid fishes of the genera Alosa, Caspialosa and Pomolobus. Copeia 1964, 118-130.
Swift, C. C., Gilbert, C. R., Bortone, S. A., Burgess, G. H. & Yerger, R. W. (1986). Zoogeography of the freshwater fishes of the southeastern United States: Savannah River to Lake Pontchartrain. In The Zoogeography of North American Freshwater Fishes (Hocutt, C. H. & Wiley, E. 0., eds), pp. 213-265. New York, NY: Wiley.
Swofford, D. L. (2002). PAUP* 4.0: Phylogenetic Analysis Using Parsimony (* and Other Methods). Ver. 4.bl0. Sunderland, MA: Sinauer Associates.
Templeton, A. R. (1983). Phylogenetic inference from restriction endonuclease cleavage site maps with particular reference to the evolution of humans and the apes. Evolution 37, 221-244.
Waldman, J. R. (2003). Introduction to the shads. In Biodiversity, Strategies, and Conservation of the World's Shads (Limburg, K. E. & Waldman, J. R., eds), pp. 3-9. Bethesda, MD: American Fisheries Society.
Young, A. M., Torres, C., Mack, J. E. & Cunningham, C. W. (2002). Morphological and genetic evidence for vicariance and refugium in Atlantic and Gulf of Mexico populations of the hermit crab Pagurus longicarpus. Marine Biology 140, 1059-1066.
Zaragiieta, B. R. (2001). The fossil Alosa and the concept of genus in systematic phylogeny. Bulletin Francais de la Peche et de la Pisciculture 3621363, 1059-1066.
Zwickl, D. J. (2006). Genetic algorithm approaches for the phylogenetic analysis of large biological sequence datasets under the maximum likelihood criterion. PhD Dissertation, The University of Texas at Austin.
,0 2008 The Authors Journal compilation (t:) 2008 The Fisheries Society of the British Isles, Jounull of Fish Biology 2008, 72, 1188-1201