Embed Size (px)
Citation preview

CARICOM
NATIONAL ACCOUNTSNATIONAL ACCOUNTS
DIGESTDIGEST
2003-2006
CARIBBEAN COMMUNITY (CARICOM) SECRETARIAT
GEORGETOWN GUYANA


NATIONAL ACCOUNTS DIGEST
2003 – 2006
STATISTICS SUB-PROGRAMME CARIBBEAN COMMUNITY (CARICOM) SECRETARIAT
December 2009

ii
Copyright © 2009, Caribbean Community (CARICOM) Secretariat NATIONAL ACCOUNTS DIGEST 2003-2006 Prepared and Compiled by The Statistics Sub-Programme Information and Communication Technologies Programme Caribbean Community (CARICOM) Secretariat Turkeyen P.O. Box 10827 Georgetown Guyana Telephone: (592) 222-0001 /75 Fax: (592) 222-0098 E-mail: [email protected] Web site: www.caricomstats.org ISBN (CD-Rom)

iii
PREFACE
This is the eighth edition of the National Accounts Digest prepared by the Regional Statistics Sub-programme of the Caribbean Community (CARICOM) Secretariat. This Digest presents data for the period, 2003-2006 and is an update to the last edition which presented information for the period, 2000-2003 and was produced in 2007. During the interval, the Sub-programme continued to update its website with data received from Member States for the years beyond 2003.
The National Accounts Digest aims at providing statistics on the economic conditions and performance of the CARICOM region over a specific period as reflected in the Gross Domestic Product of its Member States. Most of the data presented were submitted by the National Statistical Offices or were extracted from national and/or sub-regional reports. More specifically the report presents:
- Summary tables for CARICOM and Member States presenting data on GDP at
constant and current prices, including annual percentage changes and distributions, GNI and per capita GDP and GNI;
- Industry profile of GDP in current and constant prices by Member State; - Expenditure components of GDP by Member State; - Selected Economic Aggregates for selected countries.
For the most part, the data in the report are presented in Eastern Caribbean dollars (EC$) and in the national currency of Member States at constant and current prices. However, there are few key selected summary statistics, such as, per capita GDP and the summary of GDP for all Member States, which are also presented in United States dollars (US$). Similar to previous National Accounts Digests, it was not possible to prepare percentage changes at current prices based on the EC dollar due to uncoordinated changes between prices and exchange rates for some Member States. The conversion of GDP at current prices, from national currencies to a common currency through the use of official exchange rates, is a less than satisfactory solution due to the possibility of wide fluctuations between the national currencies and a common currency such as the EC or US dollar. This conversion renders the comparison of current prices among countries or current and constant prices of the same country meaningless.
The use of the nominal (official) exchange rate to convert GDP of one country to the currency of another assumes that the price structures of both countries are identical and that the goods being traded are also similar. Another approach would be to use Purchasing Power Parity (PPP) which seeks to eliminate the discrepancy that can arise in the interpretation of GDP when using nominal exchange rates conversion. However, the data requirements of detailed price and expenditure data are usually quite enormous and are often not available. In the case of constant prices, the GDP for those Member States with base years other than 2000, were arithmetically converted to this base year. While this method does not result in any changes of the growth rates in national currency, it is however, not the ideal approach and is, at best, an approximation. The ideal situation would be to rebase the GDP using deflators/ extrapolators that are available at the national statistical offices. However, in a situation in which there has
iv
traditionally been a lack of harmonisation in the choice of base years throughout the Region, it is necessary to perform this arithmetic rebasing of the constant price data as was done in this report to achieve some semblance of comparability.
The national accounts data presented in this report use the data available from the national statistical offices as an authoritative source of information. In specific cases, countries will flag preliminary or crude estimates usually for the latest available years. In other instances, the identification of excessively high changes in variables, irregular fluctuations, lack of agreement of identical country totals (GDP by expenditure and industry), valuation problems and other similar irregularities are noted in the course of the evaluation and analysis of the data at the CARICOM level. In some cases, however, there are no ready short-term solutions to ascertain whether the outlying values are anomalies or not. Further analysis and use of the data will undoubtedly highlight more questions that need to be addressed.
The data series in this report does not extend beyond 2006 because of the availability of final estimates after a three year lag. During this time, the survey data of establishments, which are used as the main foundation for compiling the industry estimates, are being collected and processed, i.e. the financial accounts are available in successive years. To offset this lag, it is necessary, perhaps, to establish throughout the Region procedures to compile quarterly GDP estimates to enable the availability of information on the short-term movements in GDP that can guide policy makers.
There is an increasing demand for data that can monitor, analyse and evaluate the economies of the Region, information that is relevant, timely and readily available not only to policy and decision makers, but to anyone wishing to conduct economic analyses or research as well as information that lay persons can understand and relate to. The 1993 System of National Accounts provides the framework within which these data can be collected and compiled in order to observe and analyse the interactions taking place between the different sectors of the economy. The United Nations Statistical Commission at its fortieth session approved the 2008 System of National Accounts. However, for countries of the CARICOM Region there is need to focus on the 1993 SNA implementation and to take the practical steps to move to 2008 SNA. The issue of data comparability, timeliness and reliability will have to be considered if the information is to be relevant and of an acceptable quality. In this vein, the CARICOM Secretariat welcomes any suggestions from users and producers that will guide us in improving the national accounting framework as reflected in this report.

v
ACKNOWLEDGEMENTS
The CARICOM Secretariat thanks the National Statistics Offices of Antigua and Barbuda, The Bahamas, Barbados, Belize, Dominica, Grenada, Guyana, Jamaica, Montserrat, St Kitts and Nevis, Saint Lucia, St Vincent and the Grenadines, Suriname and Trinidad and Tobago for supplying the data for the compilation of this report.
Special thanks to the staff of the Regional Statistics Sub-Programme for producing this report.

vi
ACRONYMS AND ABBREVIATIONS General c.i.f cost, insurance and freight FISIM Financial Intermediation Services Indirectly Measured f.o.b free on board GDP Gross Domestic Product GNI Gross National Income NNDI Net National Disposal Income NNI Net National Income SNA System of National Accounts SUT Supply and Use Table VAT Value Added Tax Groupings/Organisations CARICOM Caribbean Community LDCs Less Developed Countries MDCs More Developed Countries OECS Organisation of Eastern Caribbean States ECCB Eastern Caribbean Central Bank Currency $BH The Bahamas Dollar $BD Barbados Dollar $BZ Belize Dollar $EC Eastern Caribbean Dollar $G Guyana Dollar $JM Jamaica Dollar SF Suriname Guilder $TT Trinidad and Tobago Dollar $US United States Dollar Country Abbreviations AG Antigua and Barbuda BS The Bahamas BB Barbados BZ Belize DM Dominica GD Grenada GY Guyana JM Jamaica MS Montserrat KN St Kitts and Nevis LC Saint Lucia VC St Vincent and the Grenadines SR Suriname TT Trinidad and Tobago

vii
GENERAL NOTES 1. The term MDC, as stated in Article 4 of the Revised Treaty of Chaguaramas Establishing
the Caribbean Community including the CARICOM Single Market and Economy (Revised Treaty), refers to More Developed Countries namely Barbados, Guyana, Jamaica, Suriname and Trinidad and Tobago. The other Member States were designated as Less Developed Countries (LDC) according to the Revised Treaty.
2. Gross Domestic Product (GDP) at constant prices for Belize and Trinidad and Tobago is
calculated at base year 2000. For the other Member States, GDP at constant prices is at varying base years ranging from 1974 in the case of Barbados, to 1988 for Guyana, to 1990 for the OECS countries and Suriname, to 2003 for Jamaica, to 2006 for the Bahamas. In an effort to arrive at comparable data, except for Belize and Trinidad and Tobago, the real GDP of all the other Member States have been recalculated from their respective base years to a 2000 base year.
3. Comparability of GDP data is also affected by the type of valuation used by Member
States when compiling their estimates. The OECS countries reported GDP by Industry in Basic Prices whereas The Bahamas, Barbados and Guyana prepared the estimates at Factor Cost. Jamaica’s GDP by Industry is in Producer’s Prices while it was not stated which valuation Trinidad and Tobago used.
4. The term ‘billion’ signifies 1000 million.
SYMBOLS
… means Data not available - means Nil
SOURCES OF DATA Department of Statistics, Ministry of Finance and Planning, The Bahamas Barbados Statistical Service Central Bank of Barbados Central Statistical Office - Belize Bureau of Statistics - Guyana The Statistical Institute of Jamaica General Bureau of Statistics - Suriname Central Statistical Office - Trinidad and Tobago Eastern Caribbean Central Bank

viii
EXCHANGE RATES
Eastern Caribbean Dollars ($EC) per National Currency
COUNTRY NATIONAL CURRENCY 2003 2004 2005 2006
THE BAHAMAS Bahamas Dollar - $B 2.700 2.700 2.700 2.700
BARBADOS Barbados dollar - $Bd 1.350 1.350 1.350 1.350
BELIZE Belize dollar - $BZ 1.350 1.350 1.350 1.350
GUYANA Guyana Dollar - $G 0.015 0.014 0.014 0.013
JAMAICA Jamaica Dollar - $J 0.046 0.044 0.044 0.041
SURINAME Suriname Guilder - Sf 0.001 0.001 0.001 0.001
Suriname Dollar 0.988 0.989 0.985
TRINIDAD & TOBAGO Trinidad & Tobago - $TT 0.431 0.431 0.431 0.430
National Currency per United States Dollar - (US$)
COUNTRY NATIONAL CURRENCY 2003 2004 2005 2006
THE BAHAMAS Bahamas Dollar - $B 1.000 1.000 1.000 1.000
BARBADOS Barbados dollar - $Bd 2.000 2.000 2.000 2.000
BELIZE Belize dollar - $BZ 2.000 2.000 2.000 2.000
GUYANA Guyana Dollar - $G 195.343 199.793 199.875 201.088
JAMAICA Jamaica Dollar - $J 58.240 60.990 61.990 65.866
SURINAME Suriname Guilder - Sf 2628.333 2733.583 2729.875 2742.500
Suriname Dollar 2.734 2.730 2.7425
TRINIDAD & TOBAGO Trinidad & Tobago - $TT 6.263 6.272 6.272 6.281
$EC 2.700 2.700 2.700 2.700

ix
TABLE OF CONTENTS
Page
PREFACE iii
ACKNOWLEDGEMENTS v
ACRONYMS AND ABBREVIATIONS vi
GENERAL NOTES vii
SYMBOLS vii
SOURCES OF DATA vii
EXCHANGE RATES viii
TABLE OF CONTENTS ix
CONCEPTS AND DEFINITIONS xxiii
SUMMARY TABLES xxix
NATIONAL ACCOUNTS HIGHLIGHTS 1
LIST OF TABLES
SECTION 1: CARICOM SUMMARY TABLES
1.1: Gross Domestic Product in Constant 2000 Prices (EC$ Mn)...................................... 21
1.1A: Gross Domestic Product in Constant 2000 Prices - Percentage Change..................... 21
1.1B: Gross Domestic Product in Constant 2000 Prices - Percentage Distribution.............. 22
1.2: Gross Domestic Product in Constant 2000 Prices (US$ Mn)...................................... 22
1.3: Gross Domestic Product in Current Market Prices (EC$ Mn) .................................... 24
1.4: Gross Domestic Product in Current Market Prices (US$ Mn) .................................... 24
1.5: Mid -Year Population Estimates ................................................................................... 25
1.6: Per Capita Gross Domestic Product in Constant 2000 Prices (EC$) .......................... 26
1.7 Per Capita Gross Domestic Product in Constant 2000 Prices (US$) .......................... 26
1.8: Per Capita Gross Domestic Product in Current Prices (EC$)...................................... 28
1.9: Per Capita Gross Domestic Product in Current Prices (US$)...................................... 28
1.10: Gross National Income in Market Prices (EC$ Mn)..................................................... 29

x
1.11: Gross National Income in Current Market Prices (US$ Mn) ....................................... 29
1.12: Per Capita Gross National Income in Market Prices (EC$) ........................................ 30
1.13: Per Capita Gross National Income in Market Prices (US$) ........................................ 30
SECTION 2: GDP IN CURRENT AND CONSTANT PRICES BY COUNTRY AND
INDUSTRY AND GDP BY EXPENDITURE COMPONENTS
ANTIGUA AND BARBUDA
2.1: Gross Value Added by Industry in Constant 2000 Basic Prices (EC$ Mn) ................... 33
2.1A: Gross Value Added by Industry in Constant 2000 Basic Prices - Percentage
Change............................................................................................................................. 33
2.2: Gross Value Added by Industry in Constant 1990 Basic Prices (EC$ Mn) ................. 34
2.2A: Gross Value Added by Industry in Constant 1990 Basic Prices - Percentage
Distribution ..................................................................................................................... 34
2.3 Gross Value Added by Industry in Current Basic Prices (EC$ Mn)............................... 36
2.3A: Gross Value Added by Industry in Current Basic Prices - Percentage Distribution ... 36
2.3B: Gross Value Added by Industry in Current Basic Prices - Percentage Change........... 37
2.4: Expenditure on Gross Domestic Product in Current Prices (EC$ Mn)........................ 38
2.4A Expenditure on Gross Domestic Product in Current Prices - Percentage
Distribution ..................................................................................................................... 39
The BAHAMAS
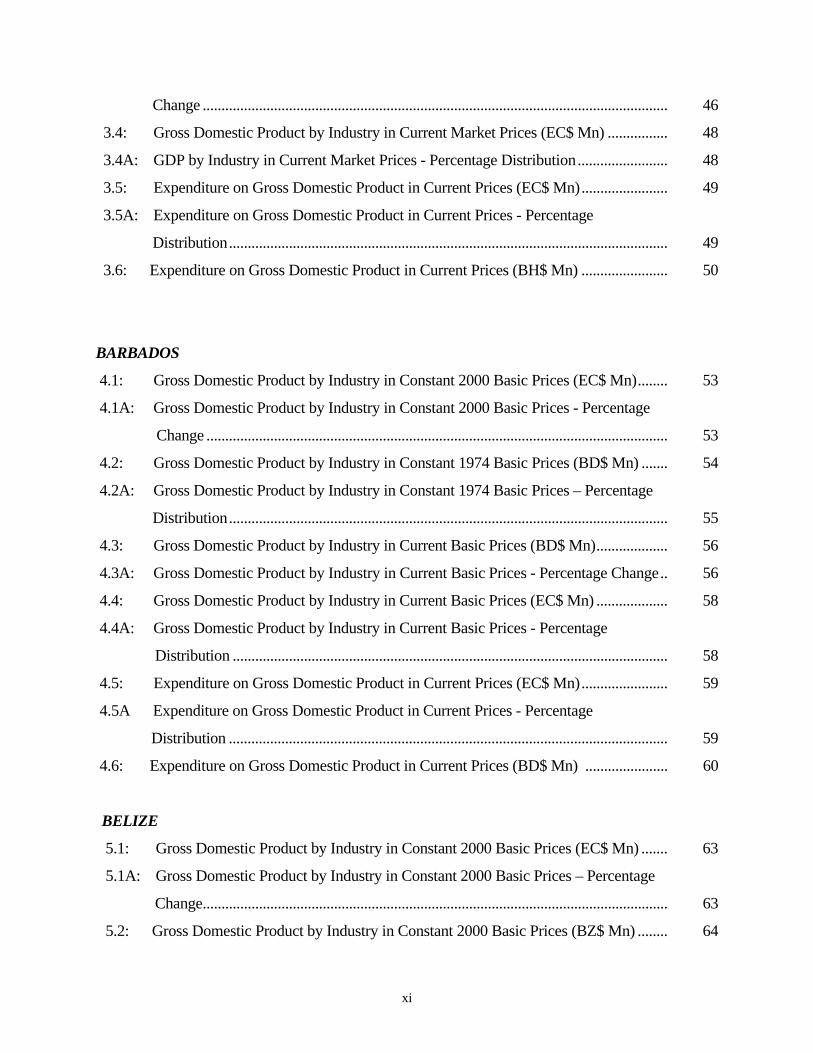
3.1: Gross Domestic Product by Industry in Constant 2000 Market Prices (EC$ Mn).... 43
3.1A: Gross Domestic Prices by Industry in Constant 2000 Market Prices –
Percentage Change........................................................................................................ 43
3.2: Gross Domestic Prices by Industry in Constant 2006 Market Prices (BH$ Mn) ....... 44
3.2A: Gross Value Added by Industry in Constant 2006 Market Prices - Percentage
Distribution .................................................................................................................... 45
3.3: Gross Domestic Product by Industry in Current Market Prices (BH$ Mn)................ 46
3.3A: Gross Domestic Product by Industry in Current Market Prices - Percentage
xi
Change ............................................................................................................................ 46
3.4: Gross Domestic Product by Industry in Current Market Prices (EC$ Mn) ................ 48
3.4A: GDP by Industry in Current Market Prices - Percentage Distribution........................ 48
3.5: Expenditure on Gross Domestic Product in Current Prices (EC$ Mn)....................... 49
3.5A: Expenditure on Gross Domestic Product in Current Prices - Percentage
Distribution..................................................................................................................... 49
3.6: Expenditure on Gross Domestic Product in Current Prices (BH$ Mn) ....................... 50
BARBADOS
4.1: Gross Domestic Product by Industry in Constant 2000 Basic Prices (EC$ Mn)........ 53
4.1A: Gross Domestic Product by Industry in Constant 2000 Basic Prices - Percentage
Change ........................................................................................................................... 53
4.2: Gross Domestic Product by Industry in Constant 1974 Basic Prices (BD$ Mn) ....... 54
4.2A: Gross Domestic Product by Industry in Constant 1974 Basic Prices – Percentage
Distribution..................................................................................................................... 55
4.3: Gross Domestic Product by Industry in Current Basic Prices (BD$ Mn)................... 56
4.3A: Gross Domestic Product by Industry in Current Basic Prices - Percentage Change.. 56
4.4: Gross Domestic Product by Industry in Current Basic Prices (EC$ Mn) ................... 58
4.4A: Gross Domestic Product by Industry in Current Basic Prices - Percentage
Distribution .................................................................................................................... 58
4.5: Expenditure on Gross Domestic Product in Current Prices (EC$ Mn)....................... 59
4.5A Expenditure on Gross Domestic Product in Current Prices - Percentage
Distribution ..................................................................................................................... 59
4.6: Expenditure on Gross Domestic Product in Current Prices (BD$ Mn) ...................... 60
BELIZE
5.1: Gross Domestic Product by Industry in Constant 2000 Basic Prices (EC$ Mn) ....... 63
5.1A: Gross Domestic Product by Industry in Constant 2000 Basic Prices – Percentage
Change............................................................................................................................ 63
5.2: Gross Domestic Product by Industry in Constant 2000 Basic Prices (BZ$ Mn) ........ 64

xii
5.2A: Gross Domestic Product by Industry in Constant 2000 Basic Prices – Percentage
Distribution .................................................................................................................... 65
5.3: Gross Domestic Product by Industry in Current Basic Prices (BZ$ Mn).................... 66
5.3A: Gross Domestic Product by Industry in Current Basic Prices - Percentage Change .. 66
5.4: Gross Domestic Product by Industry in Current Basic Prices (EC$ Mn).................... 68
5.4A: Gross Domestic Product by Industry in Current Basic Prices - Percentage
Distribution .................................................................................................................... 68
5.5: Expenditure on Gross Domestic Product in Current Prices (EC$ Mn) ....................... 69
5.5A: Expenditure on Gross Domestic Product in Current Prices - Percentage
Distribution .................................................................................................................... 69
5.6: Expenditure on Gross Domestic Product in Current Prices (BZ$ Mn) ....................... 70
DOMINICA
6.1: Gross Value Added by Industry in Constant 2000 Basic Prices (EC$ Mn)................ 73
6.1A: Gross Value Added by Industry in Constant 2000 Basic Prices - Percentage
Change............................................................................................................................. 73
6.2: Gross Value Added by Industry in Constant 1990 Basic Prices (EC$ Mn)................ 74
6.2A: Gross Value Added by Industry in Constant 1990 Basic Prices - Percentage
Distribution ..................................................................................................................... 75
6.3: Gross Value Added by Industry in Current Basic Prices (EC$ Mn) ........................... 76
6.3A: Gross Value Added by Industry in Current Basic Prices - Percentage Distribution... 76
6.3B: Gross Value Added by Industry in Current Basic Prices - Percentage Change .......... 77
6.4: Expenditure on Gross Domestic Product in Current Prices (EC$ Mn) ....................... 78
6.4A: Expenditure on Gross Domestic Product in Current Prices - Percentage
Distribution ..................................................................................................................... 79
GRENADA 7.1: Gross Value Added by Industry in Constant 2000 Basic Prices (EC$ Mn)............... 83
7.1A: Gross Value Added by Industry in Constant 2000 Basic Prices - Percentage
Change............................................................................................................................ 83
7.2: Gross Value Added by Industry in Constant 1990 Basic Prices (EC$ Mn)................ 84
7.2A: Gross Value Added by Industry in Constant 1990 Basic Prices - Percentage

xiii
Distribution .................................................................................................................... 85
7.3: Gross Value Added by Industry in Current Basic Prices (EC$ Mn) ........................... 86
7.3A: Gross Value Added by Industry in Current Basic Prices - Percentage Distribution... 86
7.3B: Gross Value Added by Industry in Current Basic Prices - Percentage Change .......... 87
7.4: Expenditure on Gross Domestic Product in Current Prices (EC$ Mn) ........................ 88
7.4A: Expenditure on Gross Domestic Product in Current Prices – Percentage
Distribution ...................................................................................................................... 89
GUYANA 8.1: Gross Domestic Product by Industry at Factor Cost in Constant
2000 Prices (EC$ Mn).................................................................................................... 93
8.1A: Gross Domestic Product by Industry at Factor Cost in Constant 2000 Prices –
Percentage Change ......................................................................................................... 93
8.2: Gross Domestic Product by Industry at Factor Cost in Constant
1988 Prices (G$ Mn) ...................................................................................................... 94
8.2A: Gross Domestic Product by Industry at Factor Cost in Constant
1988 Prices - Percentage Distribution ........................................................................... 95
8.3: Gross Domestic Product by Industry at Factor Cost in Current Prices (G$ Mn)......... 96
8.3A: Gross Domestic Product by Industry at Factor Cost in Current Prices –
Percentage Change ......................................................................................................... 96
8.4: Gross Domestic Product by Industry at Factor Cost in Current Prices (EC$ Mn) ...... 98
8.4A: Gross Domestic Product by Industry at Factor Cost in Current Prices –
Percentage Distribution .................................................................................................. 98
8.5: Expenditure on Gross Domestic Product in Current Prices (EC$ Mn)........................ 99
8.5A: Expenditure on Gross Domestic Product in Current Prices - Percentage
Distribution ..................................................................................................................... 99
8.6: Expenditure on Gross Domestic Product in Current Prices (G$ Mn) .......................... 100
JAMAICA
9.1: Gross Domestic Product by Industry in Constant 2000 Producers'
Prices (EC$ Mn) ............................................................................................................ 103
9.1A: Gross Domestic Product by Industry in Constant 2000 Producers'

xiv
Prices - Percentage Change............................................................................................ 103
9.2: Gross Domestic Product by Industry in Constant 2003 Producers' Prices (J$ Mn) ... 104
9.2A: Gross Domestic Product by Industry in Constant 2003 Producers' Prices –
Percentage Distribution ................................................................................................. 105
9.3: Gross Domestic Product by Industry in Current Purchasers' Prices (J$ Mn) ............. 106
9.3A: Gross Domestic Product by Industry in Current Purchasers' - Percentage Change.... 106
9.4: Gross Domestic Product by Industry in Current Purchasers' Prices (EC$ Mn).......... 108
9.4A: Gross Domestic Product by Industry Current at Current Purchasers' - Percentage
Distribution .................................................................................................................... 108
9.5: Expenditure on Gross Domestic Product in Current Purchasers' Prices (EC$ Mn) ... 109
9.5A: Expenditure on Gross Domestic Product in Current Purchasers’ Prices –
Percentage Distribution ................................................................................................. 109
9.6: Expenditure on Gross Domestic Product in Current Purchasers’ Prices (J$ Mn) ...... 110
MONTSERRAT
10.1: Gross Value Added by Industry in Constant 2000 Basic Prices (EC$ Mn) ............... 113
10.1A: Gross Value Added by Industry in Constant 2000 Basic Prices - Percentage
Change............................................................................................................................ 113
10.2: Gross Value Added by Industry in Constant 1990 Basic Prices (EC$ Mn) ............... 114
10.2A: Gross Value Added by Industry in Constant 1990 Basic Prices - Percentage
Distribution .................................................................................................................... 115
10.3 Gross Value Added by Industry in Current Basic Prices (EC$ Mn)........................... 116
10.3A: Gross Value Added by Industry in Current Basic Prices - Percentage Distribution .. 116
10.3B: Gross Value Added by Industry in Current Basic Prices - Percentage Change.......... 117
10.4: Expenditure on Gross Domestic Product in Current Prices (EC$ Mn)....................... 118
10.4A: Expenditure on Gross Domestic Product in Current Prices - Percentage
Distribution .................................................................................................................... 119
ST. KITTS & NEVIS 11.1: Gross Value Added by Industry in Constant 2000 Basic Prices (EC$ Mn) .............. 123
11.1A: Gross Value Added by Industry in Constant 2000 Basic Prices - Percentage
Change .......................................................................................................................... 123

xv
11.2: Gross Value Added by Industry in Constant 1990 Basic Prices (EC$ Mn) ............... 124
11.2A: Gross Value Added by Industry in Constant 1990 Basic Prices - Percentage
Distribution .................................................................................................................... 125
11.3 Gross Value Added by Industry in Current Basic Prices (EC$ Mn)........................... 126
11.3A: Gross Value Added by Industry in Current Basic Prices - Percentage Distribution .. 126
11.3B: Gross Value Added by Industry in Current Basic Prices - Percentage Change.......... 127
11.4: Expenditure on Gross Domestic Product in Current Prices (EC$ Mn)....................... 128
11.4A: Expenditure on Gross Domestic Product in Current Prices - Percentage
Distribution ..................................................................................................................... 129
SAINT LUCIA
12.1: Gross Value Added by Industry in Constant 2000 Basic Prices (EC$ Mn) ............... 133
12.1A: Gross Value Added by Industry in Constant 2000 Basic Prices - Percentage
Change............................................................................................................................. 133
12.2: Gross Value Added by Industry in Constant 1990 Basic Prices (EC$ Mn) ............... 134
12.2A: Gross Value Added by Industry in Constant 1990 Basic Prices - Percentage
Distribution .................................................................................................................... 135
12.3 Gross Value Added by Industry in Current Basic Prices (EC$ Mn)........................... 136
12.3A: Gross Value Added by Industry in Current Basic Prices - Percentage
Distribution .................................................................................................................... 136
12.3B: Gross Value Added by Industry in Current Basic Prices - Percentage Change.......... 137
12.4: Expenditure on Gross Domestic Product in Current Prices (EC$ Mn)....................... 138
12.4A: Expenditure on Gross Domestic Product in Current Prices - Percentage
Distribution .................................................................................................................... 139
ST. VINCENT & THE GRENADINES
13.1: Gross Value Added by Industry in Constant 2000 Basic Prices (EC$ Mn) ............... 143
13.1A: Gross Value Added by Industry in Constant 2000 Basic Prices - Percentage
Change............................................................................................................................ 143
13.2: Gross Value Added by Industry in Constant 1990 Basic Prices (EC$ Mn) ............... 144

xvi
13.2A: Gross Value Added by Industry in Constant 1990 Basic Prices - Percentage
Distribution .................................................................................................................... 145
13.3 Gross Value Added by Industry in Current Basic Prices (EC$ Mn) ............................ 146
13.3A: Gross Value Added by Industry in Current Basic Prices - Percentage
Distribution .................................................................................................................... 146
13.3B: Gross Value Added by Industry in Current Basic Prices - Percentage Change.......... 147
13.4: Expenditure on Gross Domestic Product in Current Prices (EC$ Mn)....................... 148
13.4A: Expenditure on Gross Domestic Product in Current Prices - Percentage
Distribution .................................................................................................................... 149
SURINAME 14.1: Gross Domestic Product by Industry in Constant 2000 Basic Prices (EC$ Mn)........ 153
14.1 A: Gross Domestic Product by Industry in Constant 2000 Basic Prices - Percentage
Change............................................................................................................................ 153
14.2: Gross Domestic Product by Industry in Constant 1990 Basic Prices (SF Mn) ........... 154
14.2A: Gross Domestic Product by Industry in Constant 1990 Basic Prices - Percentage
Distribution ................................................................................................................... 155
14.3: Gross Domestic Product by Industry in Current Basic Prices (SF Mn)....................... 156
14.3A: Gross Domestic Product by Industry in Current Basic Prices (SF Mn) - Percentage
Change............................................................................................................................. 156
14.4: Gross Domestic Product by Industry in Current Basic Prices (EC$ Mn) .................... 158
14.4A: Gross Domestic Product by Industry in Current Basic Prices - Percentage
Distribution ..................................................................................................................... 158
14.5: Expenditure on Gross Domestic Product in Current Prices (EC$ Mn)........................ 159
14.5A: Expenditure on Gross Domestic Product in Current Prices - Percentage
Distribution ...................................................................................................................... 159
14.6: Expenditure on Gross Domestic Product in Current Prices (SF Mn)........................... 160
TRINIDAD AND TOBAGO
15.1: Gross Domestic Product by Industry in Constant 2000 Market Prices (EC$ Mn) ...... 163
15.1A: Gross Domestic Product by Industry in Constant 2000 Market Prices – Percentage
Change.............................................................................................................................. 163
xvii
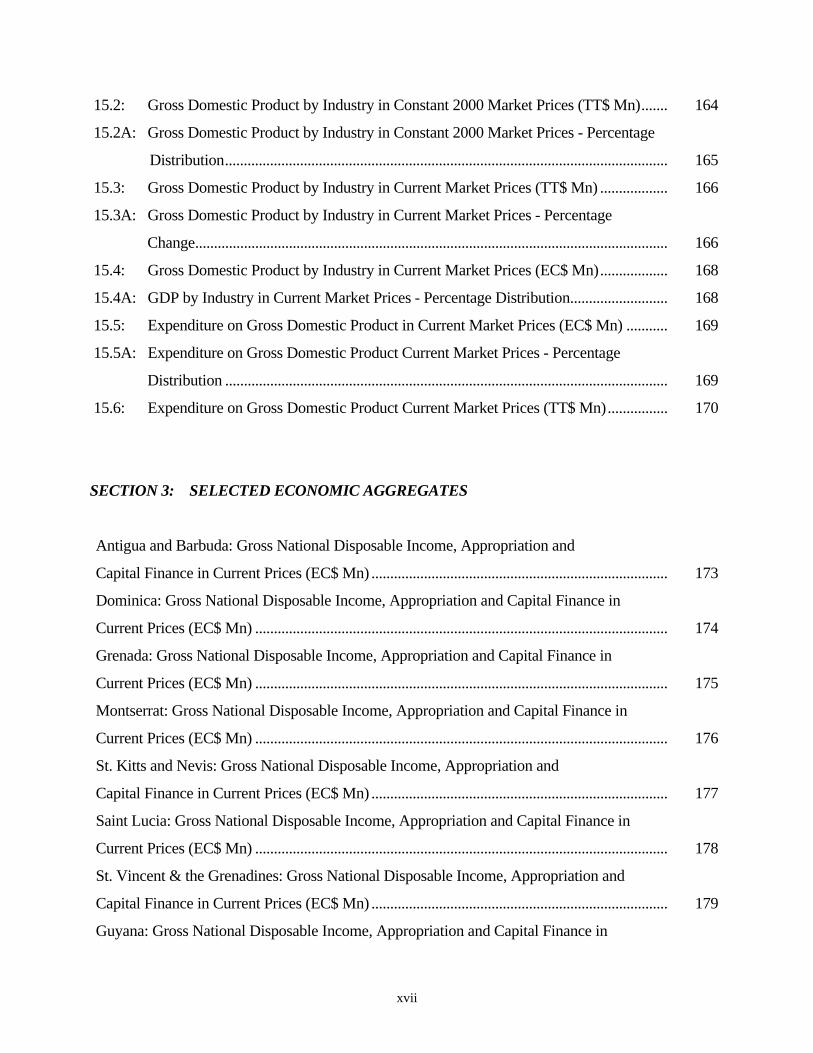
15.2: Gross Domestic Product by Industry in Constant 2000 Market Prices (TT$ Mn)....... 164
15.2A: Gross Domestic Product by Industry in Constant 2000 Market Prices - Percentage
Distribution...................................................................................................................... 165
15.3: Gross Domestic Product by Industry in Current Market Prices (TT$ Mn) .................. 166
15.3A: Gross Domestic Product by Industry in Current Market Prices - Percentage
Change.............................................................................................................................. 166
15.4: Gross Domestic Product by Industry in Current Market Prices (EC$ Mn).................. 168
15.4A: GDP by Industry in Current Market Prices - Percentage Distribution.......................... 168
15.5: Expenditure on Gross Domestic Product in Current Market Prices (EC$ Mn) ........... 169
15.5A: Expenditure on Gross Domestic Product Current Market Prices - Percentage
Distribution ...................................................................................................................... 169
15.6: Expenditure on Gross Domestic Product Current Market Prices (TT$ Mn)................ 170
SECTION 3: SELECTED ECONOMIC AGGREGATES
Antigua and Barbuda: Gross National Disposable Income, Appropriation and
Capital Finance in Current Prices (EC$ Mn) ............................................................................... 173
Dominica: Gross National Disposable Income, Appropriation and Capital Finance in
Current Prices (EC$ Mn) .............................................................................................................. 174
Grenada: Gross National Disposable Income, Appropriation and Capital Finance in
Current Prices (EC$ Mn) .............................................................................................................. 175
Montserrat: Gross National Disposable Income, Appropriation and Capital Finance in
Current Prices (EC$ Mn) .............................................................................................................. 176
St. Kitts and Nevis: Gross National Disposable Income, Appropriation and
Capital Finance in Current Prices (EC$ Mn) ............................................................................... 177
Saint Lucia: Gross National Disposable Income, Appropriation and Capital Finance in
Current Prices (EC$ Mn) .............................................................................................................. 178
St. Vincent & the Grenadines: Gross National Disposable Income, Appropriation and
Capital Finance in Current Prices (EC$ Mn) ............................................................................... 179
Guyana: Gross National Disposable Income, Appropriation and Capital Finance in

xviii
Current Prices (EC$ Mn) .............................................................................................................. 180
Guyana: Gross National Disposable Income, Appropriation and Capital Finance in
Current Prices (G$ Mn)................................................................................................................. 181
Trinidad and Tobago: Gross National Disposable Income, Appropriation and
Capital Finance in Current Prices (EC$ Mn) ............................................................................... 182
Trinidad and Tobago: Gross National Disposable Income, Appropriation and
Capital Finance in Current Prices (TT$ Mn) ............................................................................... 183
LIST OF GRAPHS
CARICOM
1.1: GDP at Constant 2000 Prices, 2003 ............................................................................. 23
1.2: GDP at Constant 2000 Prices, 2006 ............................................................................. 23
1.3: Mid – Year Population Estimates, 2003 - 2006 ........................................................... 25
1.4: GDP Per Capita in Constant 2000 Prices, 2003........................................................... 27
1.5: GDP Per Capita in Constant 2000 Prices, 2006........................................................... 27
ANTIGUA AND BARBUDA
2.1: GVA by Industry at Constant 2000 Basic Prices - Percentage Change....................... 34
2.2: GVA by Industry at Constant 1990 Basic Prices – Percentage Distribution, 2003..... 35
2.3: GVA by Industry at Constant 1990 Basic Prices - Percentage Distribution, 2006 ..... 35
2.4: GVA by Industry in Current Basic Prices - Percentage Change .................................. 37
2.5: GVA in Current and Constant 1990 Basic Prices ........................................................ 38
2.6: Expenditure on GDP in Current Prices: 2003 ............................................................... 39
2.7: Expenditure on GDP in Current Prices: 2006 ............................................................... 39
The BAHAMAS
3.1: GDP by Industry at Constant 2000 Basic Prices - Percentage Change ....................... 44
3.2: GDP by Industry at Factor Cost in Constant 2006 Market Prices – Percentage

xix
Distribution, 2003........................................................................................................... 45
3.3: GDP by Industry at Factor Cost in Constant 2006 Market Prices – Percentage
Distribution, 2006........................................................................................................... 45
3.4 GDP by Industry in Current Market Price - Percentage Change.................................. 47
3.5 GDP in Current and Constant 2006 Market Prices ....................................................... 47
3.6: Expenditure on GDP in Current Prices: 2003 .............................................................. 50
3.7: Expenditure on GDP in Current Prices: 2006 .............................................................. 50
BARBADOS
4.1: GDP by Industry in Constant 2000 Basic Prices - Percentage Change ...................... 54
4.2: GDP by Industry in Constant 1974 Basic Prices - Percentage Distribution, 2003..... 55
4.3: GDP by Industry in Constant 1974 Basic Prices - Percentage Distribution, 2006..... 55
4.4: GDP by Industry in Current Basic Prices - Percentage Change.................................. 57
4.5: GDP in Current and Constant 1974 Basic Prices ........................................................ 57
4.6: Expenditure on GDP in Current Prices: 2003 .............................................................. 60
4.7: Expenditure on GDP in Current Prices: 2006 .............................................................. 60
BELIZE
5.1: GDP by Industry in Constant 2000 Basic Prices - Percentage Change ...................... 64
5.2: GDP by Industry in Constant 2000 Basic Prices - Percentage Distribution, 2003..... 65
5.3: GDP by Industry in Constant 2000 Basic Prices - Percentage Distribution, 2006..... 65
5.4: GDP by Industry in Current Basic Prices - Percentage Change.................................. 67
5.5: GDP in Current and Constant 2000 Basic Prices ........................................................ 67
5.6: Expenditure on GDP in Current Prices: 2003 .............................................................. 70
5.7: Expenditure on GDP in Current Prices: 2006 .............................................................. 70
DOMINICA
6.1: GVA by Industry in Constant 2000 Basic Prices - Percentage Change...................... 74
6.2: GVA by Industry in Constant 1990 Basic Prices - Percentage Distribution, 2003 .... 75
6.3: GVA by Industry in Constant 1990 Basic Prices - Percentage Distribution, 2006 .... 75
6.4: GVA by Industry in Current Basic Prices - Percentage Change ................................. 77

xx
6.5: GVA in Current and Constant 1990 Basic Prices ........................................................ 78
6.6: Expenditure on GDP in Current Prices: 2003 .............................................................. 79
6.7: Expenditure on GDP in Current Prices: 2006 .............................................................. 79
GRENADA
7.1: GVA by Industry in Constant 2000 Basic Prices - Percentage Change...................... 84
7.2: GVA by Industry in Constant 1990 Basic Prices - Percentage Distribution, 2003 .... 85
7.3: GVA by Industry in Constant 1990 Basic Prices - Percentage Distribution, 2006 .... 85
7.4: GVA by Industry in Current Basic Prices - Percentage Change ................................. 87
7.5: GVA in Current and Constant 1990 Basic Prices ....................................................... 88
7.6: Expenditure on GDP in Current Prices: 2003 .............................................................. 89
7.7: Expenditure on GDP in Current Prices: 2006 .............................................................. 89
GUYANA
8.1: GDP by Industry at Factor Cost in Constant 2000 Prices - Percentage Change......... 94
8.2: GDP by Industry at Factor Cost in Constant 2000 Prices - Percentage
Distribution 2003........................................................................................................... 95
8.3: GDP by Industry at Factor Cost in Constant 2000 Prices - Percentage
Distribution, 2006.......................................................................................................... 95
8.4: GDP by Industry at Factor Cost in Current Prices - Percentage Change .................... 97
8.5: GDP at Factor Cost in Current and Constant 1988 Prices ........................................... 97
8.6: Expenditure on GDP in Current Prices: 2003 .............................................................. 100
8.7: Expenditure on GDP in Current Prices: 2006 .............................................................. 100
JAMAICA
9.1: GDP by Industry at Factor Cost in Constant 2000 Producers' Prices –
Percentage Change ........................................................................................................ 104
9.2: GDP by Industry in Constant 2003 Producers Prices - Percentage
Distribution, 2003.......................................................................................................... 105
9.3: GDP by Industry in Constant 2003 Producers Prices - Percentage
Distribution, 2006.......................................................................................................... 105

xxi
9.4: GDP by Industry in Current Purchasers’ Prices - Percentage Change........................ 107
9.5: GDP by Industry in Current Purchasers’ and Constant 2003 Producers’ Prices ........ 107
9.6: Expenditure on GDP in Current Purchasers' Prices: 2003........................................... 110
9.7: Expenditure on GDP in Current Purchasers' Prices: 2006........................................... 110
MONTSERRAT
10.1: GVA by Industry in Constant 2000 Basic Prices - Percentage Change...................... 114
10.2: GVA by Industry in Constant 1990 Basic Prices - Percentage Distribution 2003 ..... 115
10.3: GVA by Industry in Constant 1990 Basic Prices - Percentage Distribution, 2006 .... 115
10.4: GVA by Industry in Current Basic Prices - Percentage Change ................................. 117
10.5: GVA in Current and Constant 1990 Basic Prices ........................................................ 118
10.6: Expenditure on GDP in Current Prices: 2003 .............................................................. 119
10.7: Expenditure on GDP in Current Prices: 2006 .............................................................. 119
ST KITTS AND NEVIS
11.1: GVA by Industry in Constant 2000 Basic Prices - Percentage Change...................... 124
11.2: GVA by Industry in Constant 1990 Basic Prices - Percentage Distribution, 2003 .... 125
11.3: GVA by Industry in Constant 1990 Basic Prices - Percentage Distribution, 2006 .... 125
11.4: GVA by Industry in Current Basic Prices - Percentage Change ................................. 127
11.5: GVA in Current and Constant 1990 Basic Prices ........................................................ 128
11.6: Expenditure on GDP in Current Prices: 2003 .............................................................. 129
11.7: Expenditure on GDP in Current Prices: 2006 .............................................................. 129
SAINT LUCIA
12.1: GVA by Industry in Constant 2000 Basic Prices - Percentage Change....................... 134
12.2: GVA by Industry in Constant 1990 Basic Prices - Percentage Distribution, 2003 ..... 135
12.3: GVA by Industry in Constant 1990 Basic Prices - Percentage Distribution, 2006 ..... 135
12.4: GVA by Industry in Current Basic Prices - Percentage Change .................................. 137
12.5: GVA in Current and Constant 1990 Basic Prices ......................................................... 138
12.6: Expenditure on GDP in Current Prices: 2003 ............................................................... 139
12.7: Expenditure on GDP in Current Prices: 2006 .............................................................. 139
xxii
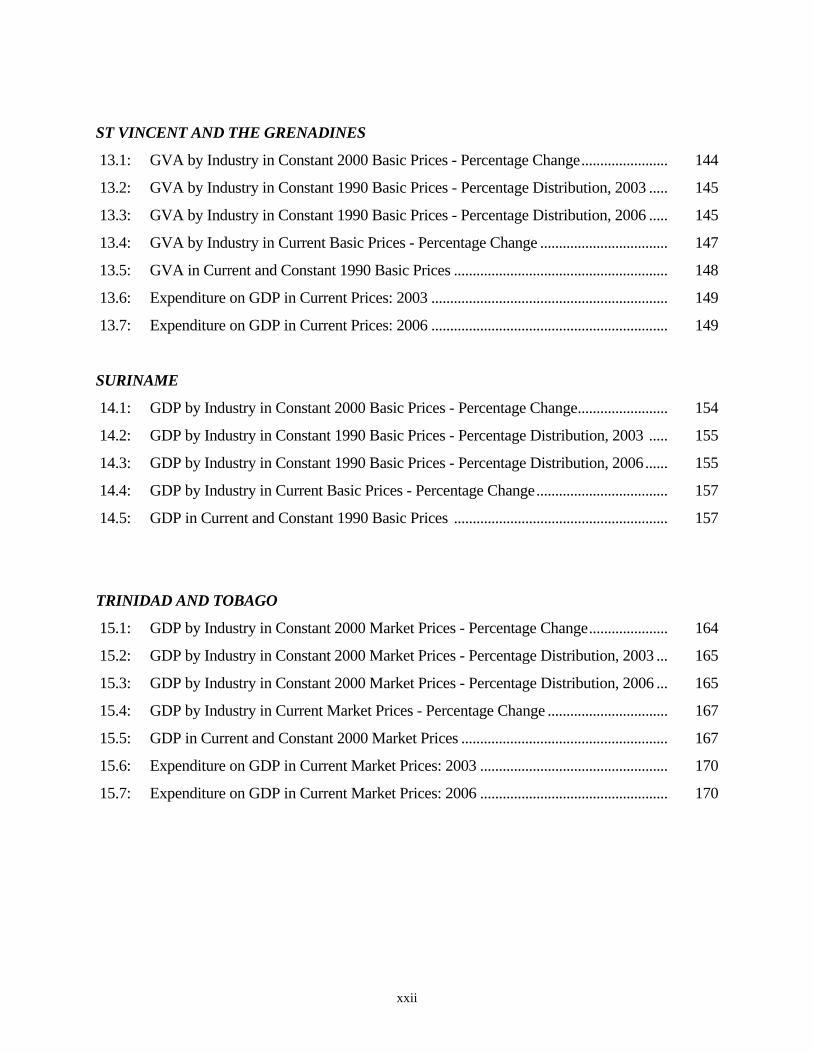
ST VINCENT AND THE GRENADINES
13.1: GVA by Industry in Constant 2000 Basic Prices - Percentage Change....................... 144
13.2: GVA by Industry in Constant 1990 Basic Prices - Percentage Distribution, 2003 ..... 145
13.3: GVA by Industry in Constant 1990 Basic Prices - Percentage Distribution, 2006 ..... 145
13.4: GVA by Industry in Current Basic Prices - Percentage Change .................................. 147
13.5: GVA in Current and Constant 1990 Basic Prices ......................................................... 148
13.6: Expenditure on GDP in Current Prices: 2003 ............................................................... 149
13.7: Expenditure on GDP in Current Prices: 2006 ............................................................... 149
SURINAME
14.1: GDP by Industry in Constant 2000 Basic Prices - Percentage Change........................ 154
14.2: GDP by Industry in Constant 1990 Basic Prices - Percentage Distribution, 2003 ..... 155
14.3: GDP by Industry in Constant 1990 Basic Prices - Percentage Distribution, 2006...... 155
14.4: GDP by Industry in Current Basic Prices - Percentage Change................................... 157
14.5: GDP in Current and Constant 1990 Basic Prices ......................................................... 157
TRINIDAD AND TOBAGO
15.1: GDP by Industry in Constant 2000 Market Prices - Percentage Change..................... 164
15.2: GDP by Industry in Constant 2000 Market Prices - Percentage Distribution, 2003 ... 165
15.3: GDP by Industry in Constant 2000 Market Prices - Percentage Distribution, 2006 ... 165
15.4: GDP by Industry in Current Market Prices - Percentage Change ................................ 167
15.5: GDP in Current and Constant 2000 Market Prices ....................................................... 167
15.6: Expenditure on GDP in Current Market Prices: 2003 .................................................. 170
15.7: Expenditure on GDP in Current Market Prices: 2006 .................................................. 170

xxiii
CONCEPTS AND DEFINITIONS 1. GROSS DOMESTIC PRODUCT: A key aggregate of the system of National Accounts is the Gross Domestic Product. The Gross Domestic Product (GDP) of an economy is the total value of all goods and services produced by all institutional units resident in the economy within a given time period, usually one year. It includes the allowance made for the consumption of fixed capital. Gross value added is a measure of GDP in which a principal consideration is that duplications must be avoided which is achieved by deducting from the output of each producing unit the value of the inputs of goods and services received from other units, at home or abroad, i.e. GDP can be derived as the sum of the value added of resident institutional units in an economy. This measure of GDP is also identical with the sum of the final expenditures on consumption, on gross capital formation and adjusted for exports less imports of goods and services. GDP is also equal to the sum of the incomes accruing from production which includes compensation of employees, consumption of operating surplus and fixed capital. 2. GROSS NATIONAL INCOME/PRODUCT ( GNI/GNP): Gross National Income (GNI) is equal to GDP less primary incomes payable to non-resident units plus primary incomes receivable from non-resident units. In the 1993 System of National Accounts (SNA), GNI is synonymous with the GNP of the 1958 SNA, however, conceptually GNI is not a concept of value added, but more one of income. GNI (GNP) is the aggregate value of the gross balances of primary incomes for all industries. The primary income components are taxes (less subsidies) on production and imports, compensation of employees and property income in all cases payable/ receivable to/from the rest of the world. 3. THE GROSS OUTPUT OF INDUSTRIES: Gross output is the value of goods and services produced within an accounting period adjusted for changes in stocks of finished goods and work-in- progress. 0utput consists of goods and services that are produced within an establishment that are disposed of in one of the following ways:
(a) Market output which includes the total value of all goods and services sold on the market,
bartered, used for payments in kind, supplied by one establishment to another belonging to the same market enterprise and the total value of changes in inventories of finished goods and work-in-progress intended for all these uses mentioned herein.
(b) Output for own final use which includes goods and services that are retained for their own final
use by the owners of the establishments within which they are produced, the total value of fixed assets produced by an establishment that are retained within the same enterprise for use in future production and the total value of changes in inventories of finished goods and work in progress intended for one of the uses contained herein.
(c) Other non-market output includes goods and services that are provided free or at prices that are
not economically significant. Common examples are the goods and services produced by government units or by non-profit units serving households (NPISHs) such as education and health services.
xxiv
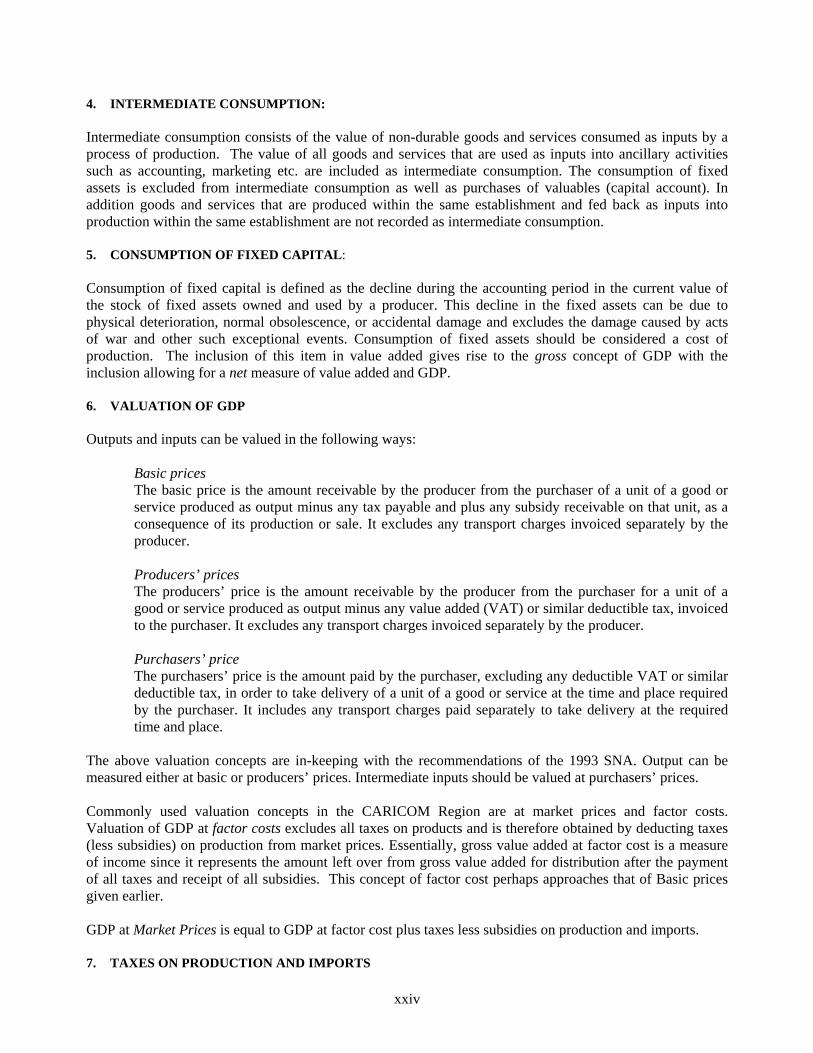
4. INTERMEDIATE CONSUMPTION: Intermediate consumption consists of the value of non-durable goods and services consumed as inputs by a process of production. The value of all goods and services that are used as inputs into ancillary activities such as accounting, marketing etc. are included as intermediate consumption. The consumption of fixed assets is excluded from intermediate consumption as well as purchases of valuables (capital account). In addition goods and services that are produced within the same establishment and fed back as inputs into production within the same establishment are not recorded as intermediate consumption. 5. CONSUMPTION OF FIXED CAPITAL: Consumption of fixed capital is defined as the decline during the accounting period in the current value of the stock of fixed assets owned and used by a producer. This decline in the fixed assets can be due to physical deterioration, normal obsolescence, or accidental damage and excludes the damage caused by acts of war and other such exceptional events. Consumption of fixed assets should be considered a cost of production. The inclusion of this item in value added gives rise to the gross concept of GDP with the inclusion allowing for a net measure of value added and GDP. 6. VALUATION OF GDP Outputs and inputs can be valued in the following ways: Basic prices
The basic price is the amount receivable by the producer from the purchaser of a unit of a good or service produced as output minus any tax payable and plus any subsidy receivable on that unit, as a consequence of its production or sale. It excludes any transport charges invoiced separately by the producer.
Producers’ prices
The producers’ price is the amount receivable by the producer from the purchaser for a unit of a good or service produced as output minus any value added (VAT) or similar deductible tax, invoiced to the purchaser. It excludes any transport charges invoiced separately by the producer.
Purchasers’ price
The purchasers’ price is the amount paid by the purchaser, excluding any deductible VAT or similar deductible tax, in order to take delivery of a unit of a good or service at the time and place required by the purchaser. It includes any transport charges paid separately to take delivery at the required time and place.
The above valuation concepts are in-keeping with the recommendations of the 1993 SNA. Output can be measured either at basic or producers’ prices. Intermediate inputs should be valued at purchasers’ prices. Commonly used valuation concepts in the CARICOM Region are at market prices and factor costs. Valuation of GDP at factor costs excludes all taxes on products and is therefore obtained by deducting taxes (less subsidies) on production from market prices. Essentially, gross value added at factor cost is a measure of income since it represents the amount left over from gross value added for distribution after the payment of all taxes and receipt of all subsidies. This concept of factor cost perhaps approaches that of Basic prices given earlier. GDP at Market Prices is equal to GDP at factor cost plus taxes less subsidies on production and imports. 7. TAXES ON PRODUCTION AND IMPORTS

xxv
Taxes are compulsory unrequited payments in cash or in kind made by institutional units to government units. Taxes on production and imports consist of:
- taxes on products payable on goods and services when they are produced, sold and otherwise disposed of by their producers; - other taxes on production comprising taxes on ownership/use of land, buildings or other assets used in production or on the labour employed or on the compensations paid to employees.
These taxes are recorded as being payable out of the gross value added. The term indirect tax which was formally used is no longer commonly used in the 1993 SNA. Indirect taxes which correspond to the taxes on production and income are compulsory payments to Government which industries treat as part of the cost of production. They include import and export duties, excise, sales, entertainment and turnover taxes, real estate and land taxes, levies on value added and the employment of labour (but not social security contributions), motor vehicles, driving tests, licenses, airport and passport fees when paid by producers. 8. SUBSIDIES Subsidies are current unrequited payments that government units, including non-resident government units, make to enterprises on the basis of the levels of their production activities or values of the goods and services they produce, sell or import. They are receivable by resident producers or importers and may be designed to influence the levels of production, the prices at which outputs are sold or the remuneration of the institutional units engaged in production. Subsidies are not payable to final consumers. Current transfers that government make to households are treated as social benefits. In effect, subsidies are treated as negative taxes on production. 9. FINANCIAL INTERMEDIATION SERVICES INDIRECTLY MEASURED - IMPUTED SERVICE
CHARGES The imputed service charge, referred to as Financial Intermediation Services Indirectly Measured (FISIM) in the 1993 SNA, is an adjustment that is required to GDP to take into consideration the estimation of the output of some financial intermediaries that do not charge explicitly for all services provided. These services include the borrowing and lending of funds from/to different categories of borrowers and lenders while paying/charging different rates of interest. The net receipt of interest defrays the costs of providing these services (that are not individually charged) and also provides operating surplus for the iterneraries. This total value of FISIM is the net property income received by these intermediaries and should in principle be allocated as intermediates among the users of these services. Due to the difficulty in allocating FISIM, in practice, it is normally recorded as intermediate consumption of a nominal industry and deducted from GDP (Imputed Service Charge). 10. SELECTED EQUATIONS IN THE SYSTEM OF NATIONAL ACCOUNTS (1) Gross Domestic Product (GDP) at market prices
= Output plus Taxes, less Subsidies, on products – Intermediate Consumption
(2) Gross Domestic Product (GDP) at Market Prices = Final Consumption Expenditure plus Changes in Inventories plus Gross fixed capital formation plus Acquisition less Disposal of valuables plus Exports of Goods and Services less Imports of Goods and Services
(3) Gross National Income (GNI which is equivalent to GNP) = GDP at Market Prices plus Taxes, less Subsidies, on Production and Imports (net receivable abroad) plus

xxvi
compensation of employees ( net, receivable abroad) plus Property Income (net receivable abroad)
(4) Net National Income (NNI or equivalent to NNP) at Market Prices = GNI at Market Prices less consumption of fixed capital
(5) Net National Disposable Income (NNDI) = NNI at Market Prices plus Current Taxes on income, wealth etc. (net receivable from abroad) plus social contributions and benefits and other Current Transfers (net, receivable from abroad)
(6) Net National Disposable Income (NNDI) = Final Consumption Expenditure plus
Adjustment for the change of net equity of households on Pension funds (net receivable from abroad) plus Saving, net.
11. NATIONAL ACCOUNTS AT CONSTANT PRICES: For analytical purposes, the National Accounts at Constant Prices are derived by breaking current values down into a price component and a quantity component. For the purposes of deriving constant price estimates of GDP, a base year is selected which is deemed to be a normal year. Estimates at Constant Prices are usually derived by deflating the current year’s values by price indices or by extrapolating the base year values by appropriate volume indices. Both methods are equivalent to expressing current period quantities at base period prices. 12. COMPILATION PRACTICES The main practices used to compile National Accounts are the Production, Income, Expenditure and the Commodity Flow approaches. The conceptual bases of these approaches are as follows:
The production approach uses establishments as the basic reporting units and groups them into production activities. The sources of data are normally surveys or censuses of establishments, agriculture and similar sources, business accounts of enterprises and administrative records. Total output and intermediates are compiled from which the value added is estimated. Estimates are adjusted for the output of financial intermediation. The production data are also to be reorganised by institutional sectors.
In the expenditure approach elements of expenditure as illustrated in the equations highlighted
earlier are estimated. Imports and exports, usually measured freight on board (f.o.b.), are estimated from the data on foreign trade and balance of payments statistics. Data on government’s final expenditure are obtained from the records of government’s revenue and expenditure. Gross capital formation comprises gross fixed capital formation, changes in inventories and acquisitions less disposals of valuables. The sources of data for gross capital formation are surveys and administrative records.
The income approach derives independent estimates of compensation of employees, operating
surplus, gross fixed income, and taxes less subsidies on production. Sources of data are similar to the expenditure aggregates.
The commodity flow approach incorporates the three approaches described above and uses as a basis the Supply and Use Tables (SUT). The supply table, which shows the value of different products that are produced by each industry as well as imports, and the use table, shows the use of every product in the economy including exports. The basic principle is that the supply of

xxvii
every product must be equal to the use of that product at the level of the economy. The method therefore entails the compilation of product or commodity flows. Sources of data are derived from those of the other approaches.
13. GOVERNMENT’S FINAL CONSUMPTION EXPENDITURE This is defined as expenditure including imputed expenditure, incurred by general government on both individual consumption of goods and services as well as on collective consumption (e.g. community services such as security). Government’s expenditure is largely financed out of taxation and other government’s revenues. Government’s final consumption expenditure may be classified according to its purpose or function such as Education, Health, General Administration and so forth. 14. PRIVATE FINAL CONSUMPTION EXPENDITURE This component of GDP is defined as the outlays of households on new durable and non-durable goods and services less their net sales of second-hand goods, scraps and waste. Purchases of dwellings are treated as gross fixed capital formation of the real estate industry. The imputed rent of owner-occupied dwellings is a part of the gross output of the real estate industry and is also included in the final consumption expenditure of households. 15. GROSS CAPITAL FORMATION: Gross capital formation consists of gross fixed capital formation, changes in inventories and acquisitions less disposals of valuables. Gross fixed capital formation in turn, consists of acquisitions of fixed assets less disposals plus certain additions to the values of non-produced assets. Fixed assets are produced assets that can be used repeatedly or continuously over a period of time of one year or more. The acquisitions of new assets also include major improvements and renovations to fixed assets that increase significantly their productive capacity. Non-produced assets consist of assets that are needed for production but have not themselves been produced, e.g. land and mineral deposits. Changes in inventories are the market value at the owning establishment of the physical change during an accounting period in stocks of materials, supplies, work-in-progress except on construction projects, finished products, livestock raised for slaughter, merchandise of strategic materials held by resident industries in stock and emergency stocks of important products held by Government services. In practice, the closest feasible approximation may be the difference between the levels of these stocks at the beginning and the end of the period, both valued at approximate average prices ruling over the period. Valuables are assets that are not used for production or consumption and are therefore held primarily as a store of value. 16. EXPORTS AND IMPORTS OF GOODS AND NON-FACTOR SERVICES Exports and imports of goods and services consist of the transactions in goods and services of the residents of a given country with the rest of the world, and covers merchandise, transportation, travel, insurance and other non-factor services, such as various fees, rentals, royalties, gifts in kind, etc. Military equipment transferred between governments may, however, go unrecorded. Expenditure abroad by residents such as tourists and other persons, seasonal workers, and diplomatic and military personnel stationed abroad are treated as imports. Similarly, expenditures in the domestic territory by non-residents are considered exports.

xxviii
The valuation of exports and imports are free on board (f.o.b.) which is the price at the frontier of the exporter after it has been loaded onto the carrier and also after payment of export taxes less receipt of any rebates. In practice, some countries in the region record imports according to the convention of cost, insurance, freight (c.i.f.) which is the valuation at the frontier of the importing country inclusive of the cost of transportation and insurance.

Growth Rate Average Annual Growth Rate
Percentage Change
Constant Current 2005 -2006 2003-2006 2006 / 2003
Antigua and Barbuda Constuction 18.9 20.5 35.0 18.3 65.4Government Services 15.3 15.8 5.4 4.3 13.5Transport 11.5 12.5 13.2 8.2 26.6
The Bahamas Real Estate, Rent and Business 17.6 16.7 3.1 2.0 6.2Wholesale and Retail Trade 12.2 11.6 1.3 4.4 13.7Financial Intermediation 11.5 10.9 1.6 4.1 12.8
Barbados Wholesale and Retail 20.5 17.0 5.3 5.5 17.6Business and General Services 17.5 27.2 5.3 4.7 14.8Tourism 15.1 11.6 1.6 2.8 8.6
Belize Trade, Hotels and Restaurants 21.4 22.0 2.7 3.2 9.9Manufacturing 12.3 12.3 35.3 15.4 53.9Transport and Communication 11.8 12.1 6.0 6.6 21.2
Dominica Government Services 19.0 19.6 1.5 0.1 0.4Agriculture 17.0 17.6 3.4 2.1 6.5Bank and Insurance 14.6 12.0 6.0 6.8 21.8
Grenada Transport 13.4 14.3 -14.0 4.3 13.5Government Services 12.9 16.6 5.5 1.0 3.1Communication 11.9 5.7 6.1 3.5 10.9
Guyana Agriculture, Forestry and Fishing 31.6 30.2 6.6 -1.7 -5.1Government 12.5 17.6 1.9 1.7 5.2Transport and Communication 12.0 11.3 10.0 7.6 24.7
Jamaica Distributive Trade 24.2 21.7 3.8 2.6 8.2Transport, Communication and Storage 12.1 10.2 4.4 2.2 6.8Producers of Gov't Services 11.7 10.6 1.0 0.5 1.4
Montserrat Government Services 35.5 40.7 4.5 1.5 4.5 Real Estate and Housing 15.3 13.8 5.6 3.1 9.5Banks and Insurance 12.8 10.2 -3.3 5.2 16.6
St.Kitts and Nevis Banks and Insurance 15.3 18.6 6.7 11.0 36.6Construction 15.3 14.3 9.0 3.7 11.6Government Services 15.0 17.8 3.5 3.2 9.8
Saint Lucia Government Services 12.7 15.0 2.1 4.8 15.1Banks and Insurance 12.6 10.0 21.8 11.6 38.9Hotel and Restuarants 12.6 13.8 -2.7 3.1 9.5
St. Vincent & the Wholesale and Retail Trade 19.4 19.5 6.6 6.9 22.3the Grenadines Transport 16.4 14.4 17.5 8.7 28.5
Government Services 15.2 18.8 4.6 4.1 12.9
Suriname Financial and Business Services 19.3 16.0 1.8 3.8 11.8Trade, Restaurants and Hotels 19.1 13.4 15.3 9.7 32.1Manufacturing 13.5 23.3 1.8 7.5 24.3
Trinidad & Tobago Mining and Quarrying 24.6 30.1 17.2 11.4 38.2Manufacturing 23.3 21.4 25.2 13.8 47.5Distribution Services 13.4 14.3 14.7 7.6 24.7
Percentage Contribution to GDPMost Significant Industries at
Constant PricesMember States
Summary of the Three Most Significant Industries of CARICOM Member States at Constant Prices: 2006
xxix

COUNTRY Mid-Year Population
GDP Growth
Rate (Constant
2000 Prices) 2005 - 2006)
Average Annual Growth
Rate (2003-2006)
Exports of Goods
and Services as % of
GDP
Imports of Goods
and Services as % of
GDP
Net Goods
and Services as % of
GDP(Persons) (%) (%) (EC$Mn.) (US$Mn.) (EC$Mn.) (US$Mn.) (EC$) (US$) (EC$) (US$) (%) (%) (%)
Antigua & Barbuda 84,330 12.4 6.8 2,709 1,003 2,096 776 24,858 9,207 30,075 11,139 55.0 81.6 -26.6 74.5 43.7 -30.8
The Bahamas 329,500 4.6 -0.6 18,564 6,876 14,489 5,366 43,973 16,286 55,315 20,487 43.7 66.8 -23.1 39.3 … …
Barbados 273,987 3.9 3.7 8,615 3,191 6,464 2,394 23,594 8,739 ... ... 59.8 66.6 -6.9 26.6 … …
Belize 291,800 4.9 5.9 3,277 1,214 2,665 987 9,134 3,383 … … 63.5 61.8 1.7 19.3 … …
Dominica 71,008 4.0 2.6 856 317 627 232 8,826 3,269 11,423 4,231 45.5 62.7 -17.2 28.9 12.6 -33.2
Grenada 106,634 -2.4 2.5 1,524 564 1,034 383 9,699 3,592 13,563 5,024 28.6 64.1 -35.5 37.8 3.6 -34.2
Guyana 760,218 5.1 1.0 2,458 910 1,735 643 2,282 845 3,078 1,140 … … -34.7 45.2 25.0 -20.2
Jamaica 2,673,800 2.7 1.3 32,309 11,966 23,623 8,749 8,835 3,272 11,464 4,246 39.6 59.4 -19.8 28.3 17.9 -10.4
Montserrat 4,655 -3.8 -0.2 121 45 79 29 16,971 6,286 24,692 9,145 36.7 97.8 -61.1 26.8 9.0 -17.8
St. Kitts & Nevis 49,990 4.0 3.6 1,319 489 892 330 17,849 6,611 24,640 9,126 47.4 65.8 -18.3 37.8 19.4 -18.4
Saint Lucia 166,838 4.4 4.0 2,464 913 1,833 679 10,985 4,069 13,516 5,006 47.2 75.6 -28.4 29.9 -3.3 -33.2
St.Vincent & the Grenadines 101,402 7.6 5.0 1,344 498 952 353 9,390 3,478 12,614 4,672 42.6 65.9 -23.3 35.0 10.9 -24.1
Suriname 504,257 4.7 6.4 5,012 1,856 2,718 1,007 5,391 1,997 9,546 3,535 … … … … … …
Trinidad & Tobago 1,297,944 13.3 10.3 52,492 19,441 36,658 13,577 28,243 10,460 38,495 14,258 75.9 36.5 39.4 12.7 47.6 34.8
SELECTED INDICATORS FOR CARICOM MEMBER STATES: 2006
GDP at Current Mkt. Prices
GDP at Constant 2000 Prices
Per Capita Real GDP (2000
Prices)Per Capita GNI
(%)
Savings - Investment
as % of GDP
Gross National Saving/
GDP
Investment/GDP
(%) (%)
xxx

NATIONAL ACCOUNTS HIGHLIGHTS: 2003-2006
1 CARICOM OVERVIEW GDP in Constant 2000 Prices CARICOM’s real Gross Domestic Product (GDP) increased by 7.3 percent in 2006, the highest annual increase for the period under review. For 2005, real GDP growth rate was 3.6 percent. In Constant 2000 Prices, CARICOM’s total GDP increased from EC$82.8 Bn (US$30.7 Bn) in 2003 to EC$95.9 Bn (US$35.5 Bn) in 2006 at an average annual growth rate of 5.0 percent for the period (Tables 1.1 and 1.1A). The MDCs were the major contributors to CARICOM’s total GDP in Constant 2000 Prices. For 2003, total GDP of the MDCs increased from EC$60.5 Bn (US$22.4 Bn) in 2003 to EC$71.2 Bn (US$26.4 Bn) in 2006 at an average annual growth rate of 5.6 percent for the period. For 2006, the MDCs reflected a growth of 8.2 percent over the 2005 value. As a percentage of CARICOM’s total GDP, the MDCs represented 73.1 percent in 2003 and 74.3 percent in 2006 (Tables 1.1, 1.1A and 1.1B). For the LDCs, total GDP in Constant 2000 Prices increased from EC$8.9 Bn (US$3.3 Bn) in 2003 to EC$10.2 Bn (US$3.8 Bn) in 2006 which represented 10.7 percent of CARICOM’s total GDP in 2003 and 10.6 percent in 2006. With respect to the contribution of individual Member States to the Region’s total GDP at Constant 2000 prices, the top contributors were Trinidad and Tobago and Jamaica. Total GDP for Trinidad and Tobago increased from EC$28.4 Bn (US$10.5 Bn) in 2003 to EC$36.7 Bn (US$13.6 Bn) in 2006. The percentage contribution of this Member State to CARICOM’s total GDP increased from 34.3 percent in 2003 to 38.2 percent in 2006. Jamaica’s total GDP also expanded from EC$22.5 Bn (US$8.3 Bn) in 2003 to EC$23.6 Bn (US$8.7 Bn) in 2006 representing 27.1 percent of total GDP in 2003 and 24.6 percent in 2006. Collectively these two Member States accounted for more than 61 percent of CARICOM’s total GDP throughout the period (Tables 1.1, 1.1B). GDP in Current Prices In Current Market Prices, CARICOM’s total GDP stood at EC$94.9 Bn (US$35.2 Bn) in 2003 and EC$133.1 Bn (US$49.3 Bn) in 2006 (Tables 1.3 and 1.4). Per Capita GDP in Constant 2000 Prices Table 1.6 shows that for the period, CARICOM’s Per Capita GDP in Constant 2000 Prices expanded from EC$12,585.5 (US$4,661.3) in 2003 to EC$14,273.5 (US$5,286.5) in 2006. The Bahamas, Trinidad and Tobago, Antigua and Barbuda and Barbados reflected the highest Per Capita GDP for the period under review. Per Capita GDP for The Bahamas increased from EC$42,432.1 (US$15,715.6) in 2003 to EC$43,972.6
1

(US$16,286.1) in 2006. Trinidad and Tobago’s Per Capita GDP increased from EC$22,172.1 (US$8,211.9) in 2003 to EC$28,242.8 (US$10,460.3) in 2006 while Per Capita GDP for Antigua and Barbuda expanded from EC$21,071.4 (US$7,804.2) in 2003 to EC$24,858.3 (US$9,206.8) in 2006. Barbados’ Per Capita GDP moved from EC$21,011.2 (US$7,781.9) in 2003 to EC$23,594.0 (US$8,738.5) in 2006. Per Capita GDP in Current Market Prices CARICOM’s Per Capita GDP in Current Market Prices increased from EC$14,429.7 (US$5,344.3) in 2003 to EC$19,812.2 (US$7,337.8) in 2006. For 2006, the Member States with the highest Per Capita GDP in Current Prices were The Bahamas, Trinidad and Tobago, Antigua and Barbuda and Barbados (Tables 1.8 and 1.9) GNI in Market Prices The Region’s Gross National Income (GNI) in Market Prices expanded from EC$89.7 Bn (US$33.2 Bn) in 2003 to EC$115.7 Bn (US$42.8 Bn) in 2006. For 2006, Trinidad and Tobago reflected the highest GNI, approximately EC$50 Bn (US$18.5 Bn). Jamaica and The Bahamas followed with GNI of EC$30.7 Bn (US$11.4 Bn) and EC$18.2 Mn (US$6.8 Bn) respectively (Tables 1.10 and 1.11). Per Capita GNI in Market Prices Between 2003 and 2006, Table 1.12 shows CARICOM’s Per Capita GNI in Current Market Prices moving from EC$228,905 (US$84,779.6) in 2003 to EC$248,422.1 (US$92,008.2) in 2006. The Bahamas reflected the highest Per Capita GNI, EC$55,315.4 (US$20,487.2) in 2006. Trinidad and Tobago and Antigua and Barbuda followed with Per Capita GNI of EC$38,495.3 (US$14,257.5) and EC$30,074.9 (US$11,138.9) respectively.
2 COUNTRY HIGHLIGHTS– INDUSTRY AND EXPENDITURE COMPONENTS
2.1 The Bahamas GDP in Constant 2000 and 2006 Prices In 2006, Real GDP growth rate for The Bahamas reflected the highest value, 4.6 percent, for the period under review. For 2005, real GDP growth rate stood at 3.3 percent. In Constant 2006 Market Prices, real GDP increased from BH$6.4 Bn in 2003 to BH$6.9 Bn in 2006. In Constant 2000 Market Prices, real GDP was EC$13.4 Bn (US$5.0 Mn) in 2003 and EC$14.5 Bn (US$5.4 Mn) in 2006. Overall, the average annual growth rate of this Member State’s GDP stood at 2.6 percent (Tables 3.1, 3.1A and 3.2). Throughout the period, the significant sector contributors to real GDP were Real Estate, Rent and Business; Wholesale and Retail Trade and Financial Intermediation. For 2006,
2

the percentage contribution of Real Estate, Rent and Business to total GDP was 17.6 percent compared to 17.0 percent in 2005. The contribution of Financial Intermediation to total GDP was 11.5 percent in 2006 and 11.3 percent in 2005. Wholesale and Retail Sale accounted for 12.2 percent of total GDP in 2006 compared to 12.0 percent in 2005 (Table 3.2A). For the major industries in 2006, the growth of Real Estate, Rent and Business expanded by 3.1 percent, Financial Intermediation increased by 1.6 percent and Wholesale and Retail Trade rose by 1.3 percent over the respective 2005 values. For 2006, Construction, showed the highest growth rate, 20.4 percent. Hotels and Restaurants reflected a growth rate of 5.1 percent (Table 3.1A). GDP in Current Prices For 2006, Real Estate, Rent and Business which accounted for 16.7 percent of total Current Prices GDP was the top industry for this Member State. Wholesale and Retail Trade and Financial Intermediation followed with percentage contributions of 11.6 percent and 10.9 percent respectively. Construction represented 10.7 percent of total GDP in Current Prices in 2006 (Tables 3.3 and 3.4A). Expenditure on GDP in Current Prices Table 3.5A shows that Total Consumption expenditure, which comprised of Private Final Consumption and General Government, represented 83.7 percent of total GDP in 2006 compared to 74.6 percent in 2003 of which Private Final Consumption accounted for 70.0 percent in 2006 and 61.4 percent in 2003. Gross Capital Formation represented 29.3 percent and 39.3 percent of total GDP in 2003 and 2006 respectively. The net of Goods and Non-Factor Services was negative throughout the period. This expenditure group represented 3.9 percent of total GDP in 2003 and 23.1 percent in 2006. Exports of Goods and Non-Factor Services accounted for 43.7 percent in 2006 while imports of Goods and Non-Factor Services represented 66.8 percent of total GDP (Tables 3.5 and 3.5A).
2.2 MDCs
2.2.1 Barbados GDP in Constant 1974 and 2000 Prices Table 4.1A shows that for 2005 and 2006, real GDP expanded by 4.1 percent and 3.9 percent respectively. Real GDP at Constant 1974 Prices increased from BD$976.7 Mn in 2003 to BD$1106.4 Mn in 2006. In Constant 2000 Prices, real GDP expanded from
3

EC$5.7 Bn (US$2.1 Bn) in 2003 to EC$6.5 Bn (US$2.4 Bn) in 2006. Overall, the average annual growth rate for the period under review stood at 4.2 percent. Throughout the period, 2003-2006, the most significant industries of this Member State were Wholesale and Retail Trade; Business and General Services; Tourism and Government Services. Wholesale and Retail trade accounted for approximately 20.0 percent of total GDP throughout the period while Business and General Services accounted for 17.2 percent of total GDP annually for the period, 2003-2005 and 17.5 percent in 2006. The percentage contribution of Tourism moved from 15.7 percent in 2003 to 15.1 percent in 2006 while Government Services accounted for approximately 14 percent of total GDP annually throughout the period (Table 4.2A). For 2006, except for Agriculture and Mining and Quarrying, all industries reflected positive growth rates. The growth rates of Agriculture and Mining and Quarrying stood at -5.7 percent and -3.0 percent respectively. Electricity, Gas and Water which expanded by 9.8 percent reflected the highest growth rate in 2006. This was followed by Construction with a growth rate of 6.9 percent. With respect to the growth rate of the top industries, Wholesale and Retail Trade and Business and General Services each increased by 5.3 percent in 2006 while Government Services and Tourism reflected growth rates of 3.0 percent and 1.6 percent respectively in 2006 (Table 4.1A). GDP in Current Prices Throughout the period under review, the dominant industries of Barbados’ Current Prices GDP were Business and General Services; Wholesale and Retail Trade; Government Services; and Tourism. Business and General Services accounted for more than 25 percent of total GDP in Current Prices throughout the period. The percentage contribution of Wholesale and Retail Trade ranged from 17.0 percent to 17.9 percent for the period while the percentage contribution of Government Services decreased from 18.0 percent in 2003 to 16.2 percent in 2006. Tourism represented 11.8 percent of total GDP in 2003 and 11.6 percent in 2006. Collectively these four industries accounted for 72 percent of Barbados’ total GDP in Current Prices in 2006 (Tables 4.3 and 4.4A). Expenditure on GDP in Current Prices On the expenditure side, Total Consumption expenditure represented 85.6 percent of total GDP in 2003 and 80.2 percent in 2006. Private Final Consumption expenditure, the major component represented 62.4 percent of GDP in 2003 and 58.9 percent in 2006. Gross Capital Formation expenditure represented 20.7 percent of total GDP in 2003 and 26.6 percent in 2006. The net of Goods and Non-Factor Services were negative throughout the period. Exports of Goods and Non-factor Services represented 59.8 percent of total GDP in 2006 while imports of Goods and Non-Factor Services represented 66.6 percent (Tables 4.5 and 4.5A).
4

2.2.2 Guyana GDP in Constant 1988 and 2000 Prices Guyana’s real GDP growth rate was 5.1 percent in 2006 compared to -2.0 percent in 2005. GDP in Constant 1988 Prices was approximately G$5.5 Bn in 2003 and G$5.8 Bn in 2006. At Constant 2000 Prices, GDP of this Member State was approximately EC$1.7 Bn annually for the period, 2003 - 2006. Overall, the average annual growth rate was 1.5 percent for the period under review (Tables 8.1, 8.1A and 8.2). Agriculture, Forestry and Fishing and Government Services were the two largest contributors to Guyana’s total GDP throughout the period. Agriculture, Forestry and Fishing represented 31.6 percent of total GDP in 2006 compared to 31.1 percent in 2005. For 2003 and 2004, this industry represented 34.8 percent and 35.4 percent respectively of total GDP. The percentage contribution of Government Services to total GDP was 12.5 percent in 2006, decreasing from 12.9 percent in 2005. For 2003 and 2004, Government Services accounted for 12.5 percent and 12.4 percent respectively of total GDP. Other major contributors in 2006 were Transport and Communication which accounted for 12.0 percent compared to 11.5 percent in 2005 and Construction and Engineering which represented 10.4 percent in 2006 and 9.7 percent in 2005 (Table 8.2 A). For 2006, except for Mining and Quarrying, which showed a growth rate of -21.7 percent, all industries reflected positive growth rates. For the major industries, Agriculture, Forestry and Fishing showed a growth rate of 6.6 percent in 2006 compared to a growth rate of -13.7 percent in 2005. Government Services reflected growth rates of approximately 2.0 percent annually in 2005 and 2006. Construction and Engineering reflected a growth rate of 12.1 percent in 2006 while Distribution; and Transport and Communication each reflected growth rate of 10.0 percent (Table 8.1A). GDP in Current Prices Throughout the period, Agriculture, Forestry and Fishing was the top industry for GDP in Current Prices. Between 2003 and 2006, this industry represented more than 30 percent of Guyana’s total GDP for the respective years. Government Services followed with a percentage contribution of over 18 percent for most of the period. For 2006, Transport and Communication and Mining and Quarrying were also major industries accounting for 11.3 percent and 9.7 percent respectively of total GDP in Current Prices. Collectively, these four industries represented 68.9 percent of Current Prices GDP in 2006 (Tables 8.4 and 8.4A). Expenditure on GDP in Current Prices For expenditure on GDP in Current Market Prices, Total Consumption Expenditure accounted for 76.0 percent in 2003 and 89.3 percent in 2006. Private Final Consumption, the main contributor to Total Consumption Expenditure accounted for 65.3 percent of GDP in 2006 compared to 49.7 percent in 2003.
5

Gross Capital Formation represented 35.0 percent of total GDP in 2003 and 45.2 percent in 2006. The net Goods and Non-Factor Services was negative throughout the period representing 34.7 percent of GDP in 2006 compared to 11.1 percent in 2003 (Tables 8.5 and 8.5A).
2.2.3 Jamaica GDP in Constant 2000 and 2003 Prices Jamaica’s real GDP grew at a rate of 2.7 percent in 2006 compared to a growth rate of 1.0 percent in 2005. Jamaica’s GDP in Constant 2003 Producers’ Prices moved from J$476.7 Bn in 2003 to J$501.6 Bn in 2006. It’s GDP in Constant 2000 Prices moved from EC$22.5 Bn in 2003 to EC$23.6 Bn in 2006. The average annual growth rate of this Member State for the period, 2003-2006 was 1.7 percent (Tables 9.1, 9.1A and 9.2). Jamaica’s top industry throughout the period under review was Distributive Trade which accounted for approximately 24.0 percent of total GDP. For 2006, other major contributors were Transport, Communication and Storage which represented 12.1 percent of total GDP followed by Producers of Government Services with 11.7 percent and Financial and Insurance Services with 11.0 percent (Table 9.2A). With respect to the 2006 growth rates of the respective industries, all industries except Manufacturing and Construction and Installation reflected positive growth rates. Manufacturing reflected a growth rate of -2.3 percent while Construction and Installation was -1.9 percent. Agriculture, Forestry and Fishing displayed the highest growth rate in 2006, 16.2 percent. Transport, Communication and Storage and Miscellaneous Services followed with growth rates of 4.4 percent and 4.3 percent respectively. The growth rates of the remaining industries in 2006 ranged from 0.7 percent to 3.8 percent (Table 9.1A). GDP in Current Prices Distributive Trade; Producers of Government Services and Transport, Communication and Storage were the top contributors to Jamaica’s GDP in Current Purchasers’ Prices with percentage contributions of 21.7 percent, 10.6 percent and 10.2 percent respectively (Table 9.4A). Expenditure on GDP in Current Prices In Current Purchasers’ Prices, Jamaica’s Final Consumption expenditure represented 88.6 percent in 2003 and 91.5 percent in 2006 of total GDP. Private Final Consumption accounted for 74.9 percent of total GDP in 2003 compared to 77.6 percent in 2006. Gross Capital Formation represented 26.3 percent of GDP in 2003 and 28.3 percent in 2006.
6
The net of Goods and Non-Factor Services was negative throughout the period. As a percentage of GDP, this component represented 15.0 percent in 2003 and 19.8 percent in 2006. For 2006, Exports of Goods and Non-Factor Services represented 39.6 percent of total GDP while Imports of Goods and Non-Factor Services represented 59.4 percent of total GDP (Tables 9.5 and 9.5A).
2.2.4 Suriname GDP in Constant 1990 and 2000 Prices For 2006, this Member State exhibited a growth rate of real GDP of 4.7 percent compared to a rate of 6.5 percent in 2005. At Constant 1990 Prices, Suriname’s GDP increased from SF$3.6 Bn in 2003 to SF$4.3 Bn in 2006. In Constant 2000 Prices, this Member State’s GDP were EC$2.3 Bn in 2003 and EC$2.7 Bn in 2006. Overall, the average annual growth rate of real GDP was 6.3 percent for the period under review (Tables 14.1, 14.1A and 14.2). For the period under review, Financial and Business Services and Trade, Restaurant and Hotels were the two most significant contributors to Suriname’s GDP. The percentage contributions of Financial and Business Services were 19.3 percent in 2006 and 19.8 percent in 2005 while for Trade, Restaurants and Hotels, the percentage contributions were 19.1 percent in 2006 and 17.3 percent in 2005. Other significant contributors in 2006 were Transport, Storage and Communication, 13.5 percent, Manufacturing, 13.5 percent and Agriculture, 8.0 percent. Collectively these five industries represented 73.3 percent of Suriname’s GDP in 2006 (Table 14.2A). With respect to the growth rates of the respective industries, Table 14.1A shows that for 2006, except for Transport, Storage and Communication, which reflected a growth rate of -3.5 percent, all industries reflected positive annual growth rates. Trade, Restaurants and Hotels reflected the highest growth rate in 2006, 15.3 percent. Financial and Business Services; Agriculture and Manufacturing reflected growth rates of 1.8 percent, 5.2 percent and 1.8 percent respectively. GDP in Current Prices For 2006, Manufacturing (23.3 percent), Financial and Business Services (16.0 percent) and Trade, Restaurants and Hotels, (13.4 percent) were Suriname’s top contributors to its GDP in Current Prices (Table 14.4 and 14.4A). Expenditure on GDP in Current Prices For the period under review, GDP expenditure data was limited and not available in most cases.
7

2.2.5 Trinidad and Tobago GDP in Constant 2000 Prices Real GDP for Trinidad and Tobago grew by 13.3 percent in 2006 compared to 5.4 percent in 2005. Real GDP at Constant 2000 Prices expanded from EC$28.4 Bn in 2003 to EC$36.7 Bn in 2006 at an average annual growth rate of 8.8 percent over the period (Table 15.1 and 15.1A). Mining and Quarrying and Manufacturing were the two top contributors to this Member State’s economy. The percentage contribution of Mining and Quarrying to total GDP stood at 22.9 percent in 2003 and 24.6 percent in 2006. Manufacturing accounted for 20.3 percent in 2003 and 23.3 percent in 2006. Together these two industries represented 43.2 percent of total GDP in 2003 and 47.9 percent in 2006. Distribution Services and Financial, Insurance, Real Estate and Business Services were the other two major industries for the period under review. Distribution Services represented 13.4 percent of total GDP in 2006 compared to 13.3 percent in 2005 while Financial, Insurance, Real Estate and Business Services accounted for 12.5 percent in 2006 and 13.9 percent in 2005 (Table 15.2A). For 2006, all industries displayed positive growth rates, except for Agriculture, Fishing and Forestry; Electricity and Water; Hotels, Guesthouses and Restaurants; and General Government which reflected growth rates of -19.2 percent; -0.4 percent; -2.2 percent and -1.5 percent respectively. Mining and Quarrying exhibited a growth rate of 17.2 percent in 2006 compared to 9.1 percent in 2005. Manufacturing reflected the highest growth rate in 2006, 25.2 percent compared to 9.1 percent in 2005. Distribution Services grew by 14.7 percent in 2006 from 4.9 percent in 2005 while Financial, Insurance, Real Estate and Business Services expanded by 1.6 percent in 2006 as opposed to a rate of -2.4 percent in 2005 (Table 15.1A). GDP in Current Prices In Current Market Prices, Trinidad and Tobago’s top industries were Mining and Quarrying and Manufacturing. For 2006, Mining and Quarrying accounted for 30.1 percent of total GDP compared to 23.1 percent in 2003 while Manufacturing accounted to 21.4 percent in 2006 compared to 18.1 percent in 2003. Other top industries in 2006 were Distribution Services (14.3 percent) and Financial, Insurance, Real Estate and Business Services (11.3 percent) (Tables 15.4 and 15.4A). Expenditure on GDP in Current Prices Regarding expenditure on GDP in Current Market Prices, Trinidad and Tobago’s Total Final Consumption expenditure accounted for 60.7 percent of total GDP in 2003 and 47.9 percent in 2006 of which, Private Final Consumption represented 48.0 percent of total GDP in 2003 and 37.1 percent in 2006.
8
The percentage contributions of Gross Capital Formation to total GDP were 25.2 percent in 2003 and 12.7 percent in 2006. The net of Goods and Non-factor Services was positive throughout the period under review. As a percentage of total GDP, this category represented 14.1 percent in 2003 and 39.4 percent in 2006. Exports of Goods and Non-Factor Services in 2006 represented 75.9 percent of GDP compared to imports of this category which reflected 36.5 percent (Tables 15.5 and 15.5A).
2.3 LDCs
2.3.1 Belize GDP in Constant 2000 Prices Belize’s growth rate of real GDP was 4.9 percent in 2006 compared to 3.9 percent in 2005. GDP in Constant 2000 Prices rose from EC$2.3 Bn (US$0.9 Bn) in 2003 to EC$2.7 Bn (US$1.0 Bn) in 2006 at an average annual growth rate of 4.7 percent for the period (Tables 5.1 and 5.1A). Table 5.2A shows that for 2006, Trade, Hotels and Restaurants; Manufacturing; Agriculture; and Transport and Communications were the four major industries contributing to Belize’s GDP at Constant 2000 Prices. Trade, Hotels and Restaurants, which was the top industry throughout the period under review, accounted for 21.4 percent total GDP in 2006 and 21.8 percent in 2005. This was followed by Manufacturing, which accounted for 12.3 percent in 2006 compared to 9.6 percent in 2005. The percentage contribution of Agriculture stood at 12.0 percent in 2006 and 12.5 percent in 2005 while Transport and Communication represented 11.8 percent of GDP in 2006 compared to 11.6 percent in 2005. Except for Fishing, Construction and Public Administration, all industries reflected positive growth rates in 2006. The highest growth rate for 2006, 38.0 percent was reflected by Electricity and Water. For the top industries, in 2006, Trade, Hotels and Restaurants grew by 2.7 percent while Manufacturing reflected a growth rate of 35.3 percent, Agriculture, 0.9 percent and Transport and Communication, 6.0 percent. Fishing; Construction and Public Administration showed growth rates of -15.8 percent, -6.5 percent and -4.6 percent respectively in 2006 (Table 5.1A). GDP in Current Prices For 2006, in Current Prices, the leading industries of this Member State were Trade, Hotels and Restaurants (22.0 percent); Manufacturing (12.3 percent) and Transport and Communication (12.1 percent). Collectively these three industries represented 46.4 percent of Belize’s total GDP (Table 5.4).
9

Expenditure on GDP in Current Prices On the expenditure side, Total Consumption Expenditure accounted for 92.1 percent of total GDP in 2003 and 78.8 percent in 2006, of which, Private Final Consumption accounted for 77.4 percent of GDP in 2003 and 65.2 percent in 2006. Gross Capital Formation represented 20.5 percent of GDP in 2003 and 19.3 percent in 2006, of which Gross Fixed Capital Formation, the major contributor to this group represented 19.0 percent of GDP annually in 2003 and 2006. Except for 2006, the net of Goods and Non-Factor Services was negative throughout the period. Exports of Goods and Services represented 63.5 percent of total GDP in 2006 while imports of Goods and Services represented 61.9 percent (Tables 5.5 and 5.5A).
2.3.2 OECS Antigua and Barbuda GDP in Constant 1990 and 2000 Prices Table 2.1A shows that for 2006, real GDP growth rate for Antigua and Barbuda increased to 12.4 percent from a rate of 5.5 percent in 2005. Real GDP in Constant 1990 Prices moved from EC$1.4 Bn (US$0.5 Bn) in 2003 to EC$1.7 Bn (US$0.6 Bn) in 2006. In Constant 2000 Prices, real GDP increased from EC$1.7 Bn (US$0.6 Bn) in 2003 to EC$2.1 Bn (US$0.8 Bn) in 2006 at an average annual growth rate of 7.6 percent for the period. The top industries for this Member State in 2006 were Construction which accounted for 18.9 percent total GDP in Constant 1990 Prices. The industries that followed were Government Services (15.3 percent); Transport (11.5 percent); Bank and Insurance (10.6 percent) and Hotels and Restaurants (10.6 percent). Collectively these five industries represented 66.9 percent of Antigua and Barbuda’s total GDP in Constant 1990 Prices (Table 2.2A). For 2006, all the industries reflected positive annual growth rates (Table 2.1A). Mining and Quarrying showed the highest growth rate, 45.0 percent followed by Construction with 35.0 percent. Transport was next with a growth rate of 13.2 percent while the remaining industries reflected growth rates which ranged from 2.9 percent to 10.9 percent. GDP in Current Prices In Current Prices, Antigua and Barbuda’s top industries in 2006 were Construction (20.5 percent), Government services (15.8 percent) and Transport (12.5 percent) (Table 2.3A).
10

Expenditure on GDP in Current Prices On the expenditure side, Table 2.4 shows that for 2003 and 2006, Private Final Consumption accounted for 37.4 percent and 34.2 percent respectively of total GDP in Current Market Prices. For 2003, General Government expenditure accounted for 20.3 percent of total GDP and 17.9 percent in 2006. For 2006, Gross Capital Formation expenditure represented 74.5 percent of total GDP compared to 51.8 percent in 2003. The net of Goods and Non-Factor Services was negative throughout the period. As a percentage of total GDP, this expenditure group represented 9.6 percent in 2003 and 26.6 percent in 2006. Exports of Non-Factor Services represented 55.4 percent of total GDP in 2003 compared to 47.6 percent in 2006. Exports of Goods represented minimal percentage contributions to GDP, ranging from 5.9 percent to 9.5 percent between 2003 and 2006. For 2003, imports of Goods accounted for 46.7 percent of total GDP compared to 55.8 percent in 2006 while for imports of Non-Factor Services represented 24.2 percent of total GDP in 2003 and 25.8 percent in 2006. Dominica GDP in Constant 1990 and 2000 Prices The growth rate of real GDP for Dominica stood at 4.0 percent in 2006 compared to 3.3 percent in 2005. For 2006, Dominica’s GDP in Constant 1990 Prices was EC$460.1 Mn (US$170.4 Mn) compared to EC$415.6 Mn (US$153.9 Mn) in 2003. In Constant 2000 Prices, real GDP stood at EC$626.7 Mn (US$232.1 Mn) in 2006 and EC$566.0 Mn (US$209.6 Mn) in 2003. Overall, real GDP in Constant 2000 Prices expanded at an average annual growth rate of 3.5 percent for the period under review (Tables 6.1, 6.1A and 6.2). Government Services and Agriculture were consistently the two top contributors to GDP at Constant 1990 Prices throughout the period. For 2006, the percentage contribution of Government Services was 19.0 percent compared to 19.4 percent in 2005 while Agriculture accounted for 17.0 percent in 2006 and 17.1 percent in 2005. Other significant contributors were Banks and Insurance which represented 14.6 percent of total GDP in 2006 and 14.3 percent in 2005 and Wholesale and retail trade which accounted for 13.9 percent of total GDP in both 2006 and 2005 (Table 6.2A). For 2006, other than Manufacturing, all industries reflected positive growth rates over 2005. Hotels and Restaurants reflected the highest growth rate, 15.0 percent while Construction; and Mining and Quarrying followed with growth rates of 8.5 percent and 8.4 percent respectively. For the top 2006 industries, Government Services reflected a growth rate of 1.5 percent over 2005 while Agriculture showed a growth rate of 3.4
11

percent. Manufacturing, which showed a growth rate of -2.0 percent, was the only industry that declined in 2006 (Table 6.1A). GDP in Current Prices In Current Prices, Government Services, Agriculture and Wholesale and Retail Trade were consistently Dominica’s top three contributors to GDP throughout the period under review. The percentage contributions of these industries to total GDP were 19.6 percent, 17.6 percent and 13.1 percent respectively in 2006 (Tables 6.3 and 6.3A). Expenditure on GDP in Current Prices With respect to expenditure on GDP in Current Market Prices, Total Final Consumption expenditure accounted for 89.9 percent of total GDP in 2003 compared to 88.3 percent in 2006 of which, Private Final Consumption expenditure represented 70.8 percent of total GDP and 69.5 percent respectively. Gross Capital Formation represented 25.0 percent of total GDP in 2003 and 28.9 percent in 2006. The net of Goods and Non-Factor Services was negative throughout the period. Exports of Non–factor services accounted for 29.4 percent in 2003 compared to 31.6 percent in 2006 while exports of Goods represented 15.5 percent of total GDP in 2003 and 14.0 percent in 2006. On the other side, Goods imports as a percentage of total GDP were 42.8 percent in 2003 and 46.3 percent in 2006 while imports of Non Factor Services accounted for 16.4 percent of total GDP in 2006 compared to 17.0 percent in 2003 (Tables 6.4 and 6.4A). Grenada GDP in Constant 1990 and 2000 Prices Real GDP growth rate for Grenada was -2.4 percent in 2006 compared to 11.0 percent in 2005. Real GDP at Constant 1990 Prices stood at EC$0.8 Bn (US$0.3 Bn) in the years, 2003 and 2006. At Constant 2000 Prices, real GDP was EC$1.0 Bn (US$0.4 Bn) in both 2003 and 2006. Between 2003 and 2006, GDP at Constant 2000 Prices grew at an average annual growth rate of 0.7 percent (Tables 7.1, 7.1A and 7.2). For 2006, the industries which contributed the most to Grenada’s GDP at Constant 1990 Prices were Transport which accounted for 13.4 percent of total GDP, Government Services (12.9 percent), Communication (11.9 percent), Other Services (11.8 percent) and Construction (11.4 percent). Together these five industries represented 61.4 percent of this Member State’s GDP at Constant 1990 Prices.
12

With respect to the growth rate of the of the respective industries Table 7.1A shows that, for 2006, Hotel and Restaurants recorded the highest growth rate, 50.6 percent followed by Mining and Quarrying, 41.0 percent and Agriculture, 28.1 percent. For the top 2006 industries, Government Services, Communications and Other Services reflected growth rates of 5.5 percent, 6.1 percent and 5.0 percent respectively while Transport and Construction showed rates of -14.0 percent and -30.1 percent respectively. GDP in Current Prices Government Services with a percentage contribution of 16.6 percent in 2006 was the largest contributor to Grenada’s GDP in Current Prices. Transport with percentage contribution of 14.3 percent, Construction, 13.9 percent and Other Services, 12.7 percent were the industries that followed. Collectively these four industries represented 57.5 percent of this Member State’s GDP in Current Prices (Tables 7.4 and 7.4A). Expenditure on GDP in Current Prices For the period, 2003-2006, Total Consumption Expenditure accounted for 87.9 percent of GDP at Current Market Prices in 2003 and 97.7 percent in 2006. Private Final Consumption represented 73.5 percent of GDP in 2003 and 81.5 percent in 2006. Gross Capital Formation represented 37.8 percent of GDP in 2006 compared to 38.6 percent in 2003. The net of Goods and Non-Factor services was negative throughout the period. For the period, exports of Goods as a percentage of GDP ranged from 9.5 percent to 5.6 percent while exports of Non-Factor Services accounted for 27.9 percent of total GDP in 2003 and 23.0 percent in 2006. On the other hand, imports of Goods represented 46.6 percent of total GDP in both 2003 and 2006 while imports of Non-Factor services as a percentage of total GDP ranged between 17.2 percent and 19.6 percent (Tables 7.4 and 7.4A). Montserrat GDP in Constant 1990 and 2000 Prices Following a real GDP growth rate of 4.5 percent in 2004, Montserrat’s GDP declined to -3.8 percent in 2006. Montserrat’s GDP at Constant 1990 Prices moved from EC$58.2 Mn (US$21.6 Mn) in 2003 to EC$58.3 Mn (US$21.6 Mn) in 2006. At Constant 2000 Prices, GDP increased from EC$78.9 Mn (US$29.2 Mn) in 2003 to EC$79.0 Mn (US$29.3 Mn) in 2006 (Tables 10.1, 10.1A and 10.2). Throughout the period, 2003-2006, Government Services, Real Estate and Housing, Banks and Insurance and Construction were the most dominant industries for Montserrat’s GDP at Constant 1990 Prices. The percentage contribution of Government
13

Services to GDP moved from 32.7 percent in 2005 to 35.5 percent in 2006 while for Real Estate and Housing the percentage contribution moved from 14.0 percent in 2005 to 15.3 percent in 2006. Banks and Insurance accounted for 12.7 percent of GDP in 2005 compared to 12.8 percent in 2006 while the percentage contribution of Construction moved 15.1 percent in 2005 to 10.4 percent in 2006 (Table 10.2A). For 2006, except for Manufacturing, Construction, Wholesale and Retail Trade, Hotel and Restaurants, Banks and Insurance and Other Services, all industries reflected positive growth rates over 2005. Mining and Quarrying reflected the highest growth rate, 276.5 percent followed by Agriculture with a growth rate of 15.5 percent. Government Services showed a growth rate of 4.5 percent while Banks and Insurance reflected -3.3 percent. The growth rate for Construction was -33.8 percent (Table 10.1A). GDP in Current Prices The most significant industries to Montserrat’s GDP in Current Prices for 2006 were Government Services (40.7 percent), Real Estate and Housing (13.8 percent), Banks and Insurance (10.2 percent) and Construction (8.8 percent). Collectively these top four industries accounted for 73.5 percent on Montserrat’s GDP in Current Prices (Table 10.3 and 10.3A). Expenditure on GDP in Current Prices Tables 10.4 and 10.4A show that Montserrat’s Total Consumption Expenditure represented 122.8 percent of total GDP in 2003 and 134.3 percent in 2006. Of this expenditure group, Private Final Consumption Expenditures were 69.6 percent of total GDP in 2003 and 75.7 percent in 2006. Gross Capital Formation represented 54.4 percent of GDP in 2003 compared to 26.8 percent in 2006. Between 2003 and 2006, the net of Goods and Non-Factor Services was negative. Exports of Non-Factor Services represented 31.6 percent of total GDP in 2003 and 32.9 percent in 2006 while exports of Goods represented minimal percentage contribution to total GDP, 6.1 percent in 2003 and 3.8 percent in 2006. On the other hand, imports of Goods represented 66 percent of total GDP in 2003 and 59.2 percent in 2006 while imports of Non Factor Services represented 48.9 percent of total GDP in 2003 and 38.6 percent in 2006.
14

St. Kitts and Nevis GDP in Constant 1990 and 2000 Prices St. Kitts and Nevis’ growth rate of real GDP stood at 4.0 percent in 2006 compared to 4.4 percent in 2005. Its’ GDP at Constant 1990 Prices expanded from EC$555.5 Mn (US$205.7 Mn) in 2003 to EC$647.1 Mn (US$239.7 Mn) in 2006. At Constant 2000 Prices, real GDP rose from EC$766.0 (US$283.7 Mn) in 2003 to EC$892.3 Mn (US$330.5 Mn) in 2006. Overall, the average annual growth rate of GDP in Constant Prices stood at 5.2 percent (Tables 11.1, 11.1A and 11.2). Throughout the period under review, the top contributors to St. Kitts and Nevis’ total GDP at Constant 1990 Prices were Banks and Insurance, Construction and Government Services. For 2006, Banks and Insurance represented 15.3 percent of total GDP compared to 14.9 percent in 2005. Construction accounted for 15.3 percent of total GDP in 2006 compared to 14.6 percent in 2005. The percentage contribution of Government Services stood at 15.0 percent in 2006 and 15.1 percent in 2005 (Table 11.2A). For 2006, all industries showed positive real GDP growth rates except for Agriculture and Manufacturing, which reflected real GDP growth rates of -21.2 percent and -4.2 percent respectively. Communication displayed the highest growth rate in 2006, 11.8 percent followed by Construction with 9.0 percent and Wholesale and Retail Trade with 8.6 percent (Table 11.1A). GDP in Current Prices For 2006, Banks and Insurance (18.6 percent), Government Services (17.8 percent) and Construction (14.3 percent) were St. Kitts and Nevis’ top industries for GDP in current prices (Table 11.3A). Expenditure on GDP in Current Prices For the period under review, Total Consumption expenditure represented 79.5 percent and 80.5 percent of the respective total GDP in Current Market Prices in 2003 and 2006. Private Consumption expenditure was 62.4 percent of total GDP in 2006 compared to 60.8 percent of GDP in 2003. Gross Fixed Capital Formation represented 37.8 percent of total GDP in 2006 compared to 45.6 percent in 2003. Also for the period, expenditure on Construction represented 26.5 percent of total GDP in 2006 compared to 29.7 percent in 2003. The net of Goods and Non-factor services was negative throughout the period. Exports of Non-Factor Services represented 29.8 percent of total GDP in 2003 and 35.5 percent in 2006 while exports of Goods represented 15.7 percent in 2003 and 11.9 percent in 2006. On the other side, imports of Goods represented 48.5 percent of total GDP in 2003 and
15

44.9 percent in 2006 while imports of Non-Factor Services represented 22.1 percent of total GDP in 2003 and 20.8 percent in 2006 (Tables 11.4 and 11.4A). Saint Lucia GDP in Constant 1990 and 2000 Prices Real GDP growth rate for this Member State stood at 4.4 percent in 2006 compared to 3.8 percent in 2005. Saint Lucia’s GDP at Constant 1990 Prices expanded throughout the period moving from EC$1.2 Bn (US$0.5 Bn) in 2003 to EC$1.4 Bn (US$0.5 Bn) in 2006. At Constant 2000 Prices, GDP of this Member State rose from EC$1.6 Bn (US$0.6 Bn) in 2003 to EC$1.8 Bn (approximately US$0.7 Bn) in 2006. For the period under review, the average annual growth rate was 4.5 percent (Tables 12.1, 12.1A and 12.2) For 2006, the top contributors to Saint Lucia’s total GDP at Constant 1990 Prices were Government Services (12.7 percent), Banks and Insurance (12.6 percent), Hotels and Restaurants (12.6 percent), Real Estate and Housing (12.3 percent) and Wholesale and Retails trade (12.1 percent). Collectively these five industries accounted for 62.2 percent of total GDP (Table 12.2A). With regards to growth rates of the industries, except for Hotels and Restaurants, Manufacturing and Electricity and Water, which declined in 2006, all industries reflected positive growth rates for 2006. Banks and Insurance showed the highest growth rate, 21.8 percent in 2006 compared to a rate of 8.7 percent in 2005. Mining and Quarrying followed with a growth rate of 19.8 percent in 2006 compared to a rate of -3.5 percent in 2005. The growth rates for Hotels and Restaurants, Manufacturing and Electricity and Water for 2006 were -2.7 percent, -4.4 percent and -8.6 percent respectively (Table 12.1A). GDP in Current Prices Throughout the period, 2003-2006 Government Services, Hotels and Restaurants and Wholesale and Retail Trade were consistently the Saint Lucia’s top three contributors to GDP in Current Prices. Government Services represented 15 percent of total GDP in 2006 compared to 14.8 percent in 2005 while Hotels and Restaurants accounted for 13.8 percent in 2006 as opposed to 14.7 percent in 2005. The percentage contribution of Wholesale and Retail Trade was 12.3 percent in 2006 and 12.6 percent in 2005 (Tables 12.3 and 12.3A). Expenditure on GDP in Current Prices On the expenditure side, Total Consumption expenditure represented 94.4 percent of total GDP at Current Market Prices in 2003 compared to 98.5 percent in 2006. Private Final consumption expenditure, the larger component of this expenditure group represented 73.7 percent of total GDP in 2003 and 81.7 percent in 2006.
16

Expenditure on Gross Capital Formation represented 20.4 percent and 29.9 percent of total GDP in 2003 and 2006 respectively. Construction, the most significant category in this group represented 13.5 percent of total GDP in 2003 and 18.1 percent in 2006. The net of Goods and Non-Factor Services was negative throughout the period. For 2006, exports of Non-Factor Services were 36.6 percent of total GDP while exports of Goods represented 10.6 percent of total GDP. Imports of Non-factor Services accounted for 57.1 percent of total GDP compared to imports of non-factor services which represented 18.5 percent of total GDP. (Tables 12.4 and 12.4A). St. Vincent and the Grenadines GDP in Constant 1990 and 2000 Prices For the period under review, St. Vincent and the Grenadines reflected the highest real GDP growth rate in 2006, 7.6 percent. The growth rate for 2005 was 2.6 percent. Real GDP at Constant 1990 Prices rose from EC$649.5 Mn (US$240.6 Mn) in 2003 to EC$766 Mn (US$283.7 Mn) in 2006. At Constant 2000 Prices, GDP moved from EC$807.4 Mn (US$299 Mn) in 2003 to EC$952.1 Mn (US$352.6 Mn) in 2006. Overall the average annual growth rate of real GDP between 2003 and 2006 was 5.6 percent ((Tables 13.1, 13.1A and 13.2). Accounting for 19.4 percent of total GDP in 2006, Wholesale and Retail Trade was the top contributor to St. Vincent and the Grenadines’ total GDP at Constant 1990 Prices. This industry was consistently the leading industry throughout the period. Transport with a percentage contribution of 16.4 percent and Government Services with 15.2 percent were the next top contributors to follow in 2006 (Table 13.2A). With respect to the growth rates, except for Hotels and Restaurants, all industries reflected positive growth rates in 2006. The industries with the highest growth rates in 2006 were Transport (17.5 percent), Construction (11.9 percent) and Communications (10.3 percent). Wholesale and Retail Trade showed a growth rate of 6.6 percent in 2006 while Government Services displayed a growth rate of 4.6 percent. GDP in Current Prices For GDP in Current Prices, the dominant industries for the period under review were Wholesale and Retail Trade, Government Services and Transport which represented 19.5 percent of total GDP, 18.8 percent and 14.4 percent respectively. Collectively these three industries represented 52.7 percent of total GDP in Current Prices (Tables 13.3 and 13.3A).
17

Expenditure on GDP in Current Prices Tables 13.4 and 13.4A show that Total Consumption expenditure represented 84.6 percent and 88.3 percent of total GDP in Current Market Prices in 2003 and 2006. The major component of this category, Private Final Consumption expenditure represented 65.1 percent of total GDP in 2003 and 69.8 percent in 2006. The ratio of Gross Capital Formation to total GDP moved from 33.3 percent in 2003 to 35.0 percent in 2006. Construction, the most significant category within this group represented 20.0 percent of GDP in 2003 and 23.3 percent in 2006. Between 2003 and 2006, this Member State’s imports of Goods and Non-Factor Services exceeded its exports of these categories resulting in a negative net position throughout the period. For 2006, Imports of Goods represented 48.1 percent of total GDP while imports of Non-factor Services accounted for 17.8 percent of total GDP. On the other hand, exports of Goods for 2006 were 8.3 percent of total GDP compared to exports of Non-factor Services which represented 34.3 percent of total GDP (Tables 13.4 and 13.4A).
18


CARICOM
EC$MnCOUNTRIES 2003 2004 2005 2006
CARIBBEAN COMMUNITY 82,790.5 86,178.6 89,322.1 95,866.2
THE BAHAMAS 13,421.2 13,399.8 13,847.2 14,489.0
CSME 69,369.4 72,778.8 75,474.9 81,377.3
MDCs 60,516.3 63,569.8 65,825.9 71,198.4
BARBADOS 5,706.6 5,980.7 6,224.3 6,464.4
GUYANA 1,656.9 1,683.1 1,650.3 1,734.9
JAMAICA 22,452.8 22,765.5 22,999.9 23,623.3
SURINAME 2,265.4 2,437.9 2,596.5 2,718.2
TRINIDAD AND TOBAGO 28,434.5 30,702.5 32,354.8 36,657.6
LDCs 8,853.1 9,209.0 9,649.0 10,178.8
BELIZE 2,324.3 2,445.3 2,541.2 2,665.4
OECS 6,528.8 6,763.8 7,107.8 7,513.4
ANTIGUA AND BARBUDA 1,681.1 1,768.9 1,865.7 2,096.3
DOMINICA 566.0 583.3 602.7 626.7
GRENADA 1,011.8 954.1 1,059.3 1,034.3
MONTSERRAT 78.9 82.4 82.1 79.0
ST. KITTS AND NEVIS 766.0 822.1 858.0 892.3
SAINT LUCIA 1,617.5 1,690.8 1,755.4 1,832.7
ST. VINCENT AND THE GRENADINES 807.4 862.3 884.6 952.1
COUNTRIES 2003 2004 2005 2006
CARIBBEAN COMMUNITY 4.4 4.1 3.6 7.3
THE BAHAMAS -10.1 -0.2 3.3 4.6
CSME 7.7 4.9 3.7 7.8
MDCs 8.2 5.0 3.5 8.2
BARBADOS 2.0 4.8 4.1 3.9
GUYANA -0.7 1.6 -2.0 5.1
JAMAICA 3.5 1.4 1.0 2.7
SURINAME 6.9 7.6 6.5 4.7
TRINIDAD AND TOBAGO 14.4 8.0 5.4 13.3
LDCs 4.7 4.0 4.8 5.5
BELIZE 9.4 5.2 3.9 4.9
OECS 3.1 3.6 5.1 5.7
ANTIGUA AND BARBUDA 4.3 5.2 5.5 12.4
DOMINICA 0.1 3.0 3.3 4.0
GRENADA 7.1 -5.7 11.0 -2.4
MONTSERRAT -0.9 4.5 -0.3 -3.8
ST. KITTS AND NEVIS -1.2 7.3 4.4 4.0
SAINT LUCIA 3.1 4.5 3.8 4.4
ST. VINCENT AND THE GRENADINES 2.8 6.8 2.6 7.6
Table 1.1: Gross Domestic Product In Constant 2000 Prices
Table 1.1A: Gross Domestic Product In Constant 2000 Prices - Percentage Change
21

CARICOM
COUNTRIES 2003 2004 2005 2006
CARIBBEAN COMMUNITY 100.0 100.0 100.0 100.0
THE BAHAMAS 16.2 15.5 15.5 15.1
CSME 83.8 84.5 84.5 84.9
MDCs 73.1 73.8 73.7 74.3
BARBADOS 6.9 6.9 7.0 6.7
GUYANA 2.0 2.0 1.8 1.8
JAMAICA 27.1 26.4 25.7 24.6
SURINAME 2.7 2.8 2.9 2.8
TRINIDAD AND TOBAGO 34.3 35.6 36.2 38.2
LDCs 10.7 10.7 10.8 10.6
BELIZE 2.8 2.8 2.8 2.8
OECS 7.9 7.8 8.0 7.8
ANTIGUA AND BARBUDA 2.0 2.1 2.1 2.2
DOMINICA 0.7 0.7 0.7 0.7
GRENADA 1.2 1.1 1.2 1.1
MONTSERRAT 0.1 0.1 0.1 0.1
ST. KITTS AND NEVIS 0.9 1.0 1.0 0.9
SAINT LUCIA 2.0 2.0 2.0 1.9
ST. VINCENT AND THE GRENADINES 1.0 1.0 1.0 1.0
US$MnCOUNTRIES 2003 2004 2005 2006
CARIBBEAN COMMUNITY 30,663.2 31,918.0 33,082.3 35,506.0
THE BAHAMAS 4,970.8 4,962.9 5,128.6 5,366.3
CSME 25,692.4 26,955.1 27,953.7 30,139.7
MDCs 22,413.4 23,544.4 24,380.0 26,369.8
BARBADOS 2,113.6 2,215.1 2,305.3 2,394.2
GUYANA 613.7 623.4 611.2 642.5
JAMAICA 8,315.9 8,431.7 8,518.5 8,749.4
SURINAME 839.0 902.9 961.7 1,006.8
TRINIDAD AND TOBAGO 10,531.3 11,371.3 11,983.3 13,576.9
LDCs 3,278.9 3,410.8 3,573.7 3,769.9
BELIZE 860.9 905.7 941.2 987.2
OECS 2,418.1 2,505.1 2,632.5 2,782.7
ANTIGUA AND BARBUDA 622.6 655.1 691.0 776.4
DOMINICA 209.6 216.0 223.2 232.1
GRENADA 374.8 353.4 392.3 383.1
MONTSERRAT 29.2 30.5 30.4 29.3
ST. KITTS AND NEVIS 283.7 304.5 317.8 330.5
SAINT LUCIA 599.1 626.2 650.1 678.8
ST. VINCENT AND THE GRENADINES 299.0 319.4 327.6 352.6
Table 1.2: Gross Domestic Product In Constant 2000 Prices
Table 1.1B: Gross Domestic Product In Constant 2000 Prices - Percentage Distribution
22

CARICOM
Fig 1.1: GDP at Constant 2000 Prices: 2003
Other OECS2.7%
Saint Lucia2.0%
Grenada1.2%
The Bahamas16.2%
Trinidad and Tobago 34.3%
Suriname2.7%
Jamaica 27.1%
Guyana2.0%
Other7.9%
Belize2.8%
Barbados 6.9%
Antigua and Barbuda2.0%
Fig 1.2: GDP at Constant 2000 Prices: 2006
Antigua and Barbuda2.2%
Barbados 6.7%
Belize2.8%
Other8.0%
Guyana1.8%
Jamaica 24.6%
Suriname2.8%
Trinidad and Tobago 38.2%
The Bahamas15.1%
Grenada1.2%
Saint Lucia2.0%
Other OECS2.7%
23

CARICOM
EC$MnCOUNTRIES 2003 2004 2005 2006
CARIBBEAN COMMUNITY 94,922.3 104,488.3 118,226.7 133,065.7
The BAHAMAS 16,042.5 16,286.4 17,575.5 18,564.2
CSME 78,879.7 88,201.9 100,651.2 114,501.5
MDC'S 68,052.5 76,637.0 88,194.7 100,886.2
BARBADOS 7,276.1 7,606.2 8,264.9 8,615.3 GUYANA 1,991.2 2,113.0 2,229.3 2,458.3 JAMAICA 25,159.7 27,457.4 30,250.9 32,309.1 SURINAME 2,945.8 3,446.2 4,231.6 5,012.0 TRINIDAD AND TOBAGO 30,679.7 36,014.2 43,218.1 52,491.6
LDC's 10,827.2 11,564.9 12,456.5 13,615.3 BELIZE 2,666.5 2,848.9 3,010.0 3,276.6
OECS 8,160.7 8,716.0 9,446.6 10,338.7
ANTIGUA AND BARBUDA 2,036.7 2,199.5 2,344.9 2,709.2 DOMINICA 709.7 770.1 808.0 856.5 GRENADA 1,296.6 1,267.2 1,495.4 1,524.0 MONTSERRAT 102.3 110.6 116.4 121.2 ST. KITTS AND NEVIS 977.5 1,078.9 1,184.8 1,319.1 SAINT LUCIA 2,005.9 2,154.0 2,295.4 2,464.4 ST. VINCENT AND THE GRENADINES 1,032.1 1,135.7 1,201.8 1,344.4 Note: All figures are in Market Prices except for Jamaica which are atPurchasers' Price
US$Mn
COUNTRIES 2003 2004 2005 2006
CARIBBEAN COMMUNITY 35,156.4 38,699.4 43,787.7 49,283.6
The BAHAMAS 5,941.7 6,032.0 6,509.5 6,875.6
CSME 29,214.7 32,667.4 37,278.2 42,408.0
MDC'S 25,204.6 28,384.1 32,664.7 37,365.3
BARBADOS 2,694.9 2,817.1 3,061.1 3,190.9 GUYANA 737.5 782.6 825.7 910.5 JAMAICA 9,318.4 10,169.4 11,204.0 11,966.4 SURINAME 1,091.0 1,276.4 1,567.2 1,856.3 TRINIDAD AND TOBAGO 11,362.8 13,338.6 16,006.7 19,441.3
LDC's 4,010.1 4,283.3 4,613.5 5,042.7 BELIZE 987.6 1,055.2 1,114.8 1,213.6
OECS 3,022.5 3,228.1 3,498.7 3,829.2
ANTIGUA AND BARBUDA 754.3 814.6 868.5 1,003.4 DOMINICA 262.8 285.2 299.3 317.2 GRENADA 480.2 469.3 553.9 564.4 MONTSERRAT 37.9 41.0 43.1 44.9 ST. KITTS AND NEVIS 362.0 399.6 438.8 488.5 SAINT LUCIA 742.9 797.8 850.1 912.7 ST. VINCENT AND THE GRENADINES 382.3 420.6 445.1 497.9 Note: All figures are in Market Prices except for Jamaica which are atPurchasers' Price
Table 1.4: Gross Domestic Product in Current Market Prices
Table 1.3: Gross Domestic Product in Current Market Prices
24

CARICOM
COUNTRIES 2003 2004 2005 2006
CARIBBEAN COMMUNITY 6,578,260 6,629,989 6,671,865 6,716,363
The BAHAMAS 316,298 320,880 325,170 329,500
CSME 6,261,962 6,309,109 6,346,695 6,386,863
MDC'S 5,418,216 5,449,275 5,471,843 5,510,206
BARBADOS 271,600 272,400 272,400 273,987
GUYANA 751,000 751,400 751,900 760,218
JAMAICA 2,630,400 2,642,000 2,654,500 2,673,800
SURINAME 482,769 492,829 498,543 504,257
TRINIDAD AND TOBAGO 1,282,447 1,290,646 1,294,500 1,297,944
LDC's 843,746 859,834 874,852 876,657 BELIZE 273,700 282,600 291,800 291,800
OECS 570,046 577,234 583,052 584,857
ANTIGUA AND BARBUDA 79,781 81,270 82,786 84,330
DOMINICA 69,820 70,417 70,690 71,008
GRENADA 103,868 105,157 105,892 106,634
MONTSERRAT 4,482 4,681 4,785 4,655
ST. KITTS AND NEVIS 47,313 48,720 49,363 49,990
SAINT LUCIA 160,620 162,434 164,587 166,838
ST. VINCENT AND THE GRENADINES 104,162 104,555 104,949 101,402
Table 1.5: Mid - Year Population Estimates
Fig 1.3: Mid-Year Population Estimates: 2003 - 2006
0
1,000
2,000
3,000
4,000
5,000
6,000
7,000
8,000
2003 2004 2005 2006Years
Tho
usan
ds o
f Per
sons
CARIBBEAN COMMUNITY MDCs LDCs OECS
25

CARICOM
EC$COUNTRIES 2003 2004 2005 2006
CARIBBEAN COMMUNITY 12,585.5 12,998.3 13,387.9 14,273.5
The BAHAMAS 42,432.1 41,759.4 42,584.6 43,972.6
CSME 11,077.9 11,535.5 11,892.0 12,741.4
MDC'S 11,169.0 11,665.7 12,029.9 12,921.2
BARBADOS 21,011.2 21,955.4 22,849.9 23,594.0 GUYANA 2,206.3 2,240.0 2,194.8 2,282.0 JAMAICA 8,535.9 8,616.8 8,664.5 8,835.1 SURINAME 4,692.4 4,946.8 5,208.2 5,390.6 TRINIDAD AND TOBAGO 22,172.1 23,788.5 24,994.1 28,242.8
LDC's 10,492.6 10,710.2 11,029.3 11,611.0 BELIZE 8,492.1 8,652.7 8,708.8 9,134.5
OECS 11,453.1 11,717.6 12,190.6 12,846.6
ANTIGUA AND BARBUDA 21,071.4 21,765.6 22,535.9 24,858.3 DOMINICA 8,106.9 8,283.1 8,526.1 8,826.1 GRENADA 9,741.6 9,072.7 10,003.9 9,699.3 MONTSERRAT 17,608.1 17,609.8 17,167.6 16,971.2 ST. KITTS AND NEVIS 16,189.7 16,873.5 17,380.6 17,848.6 SAINT LUCIA 10,070.3 10,408.9 10,665.4 10,985.0 ST. VINCENT AND THE GRENADINES 7,751.6 8,247.3 8,428.6 9,389.7
US$COUNTRIES 2003 2004 2005 2006
CARIBBEAN COMMUNITY 4,661.3 4,814.2 4,958.5 5,286.5
The BAHAMAS 15,715.6 15,466.5 15,772.1 16,286.1
CSME 4,102.9 4,272.4 4,404.4 4,719.0
MDC'S 4,136.7 4,320.6 4,455.5 4,785.6
BARBADOS 7,781.9 8,131.6 8,462.9 8,738.5 GUYANA 817.1 829.6 812.9 845.2 JAMAICA 3,161.4 3,191.4 3,209.1 3,272.3 SURINAME 1,737.9 1,832.1 1,929.0 1,996.5 TRINIDAD AND TOBAGO 8,211.9 8,810.6 9,257.1 10,460.3
LDC's 3,886.1 3,966.8 4,084.9 4,300.4 BELIZE 3,145.2 3,204.7 3,225.5 3,383.1
OECS 4,241.9 4,339.8 4,515.0 4,758.0
ANTIGUA AND BARBUDA 7,804.2 8,061.3 8,346.6 9,206.8 DOMINICA 3,002.6 3,067.8 3,157.8 3,268.9 GRENADA 3,608.0 3,360.3 3,705.1 3,592.3 MONTSERRAT 6,521.5 6,522.2 6,358.4 6,285.6 ST. KITTS AND NEVIS 5,996.2 6,249.5 6,437.3 6,610.6 SAINT LUCIA 3,729.7 3,855.1 3,950.2 4,068.5 ST. VINCENT AND THE GRENADINES 2,870.9 3,054.6 3,121.7 3,477.7
Table 1.7: Per Capita Gross Domestic Product in Constant 2000 Prices
Table 1.6: Per Capita Gross Domestic Product in Constant 2000 Prices
26

CARICOM
Fig 1.4: GDP Per Capita in Constant 2000 Prices: 2003
0
10000
20000
30000
40000
50000
60000
AG BB BH BZ DM GD GY JM MS KN LC VC SR TT
$EC
Fig 1.5: GDP Per Capita in Constant 2000 Prices: 2006
0
5000
10000
15000
20000
25000
30000
35000
40000
45000
50000
AG BB BH BZ DM GD GY JM MS KN LC VC SR TT
$EC
27

CARICOM
EC$
COUNTRIES 2003 2004 2005 2006
CARIBBEAN COMMUNITY 14,429.7 15,759.9 17,720.2 19,812.2
The BAHAMAS 50,719.7 50,755.5 54,050.2 56,340.5
CSME 12,596.6 13,980.1 15,858.8 17,927.7
MDC'S 12,559.9 14,063.7 16,117.9 18,309.0
BARBADOS 26,789.7 27,922.8 30,341.0 31,444.2
GUYANA 2,651.4 2,812.1 2,964.9 3,233.6
JAMAICA 9,565.0 10,392.7 11,396.1 12,083.6
SURINAME 6,102.0 6,992.6 8,487.8 9,939.3
TRINIDAD AND TOBAGO 23,922.8 27,904.0 33,385.9 40,442.1
LDC's 12,832.3 13,450.1 14,238.4 15,530.9
BELIZE 9,742.5 10,081.1 10,315.1 11,228.9
OECS 14,315.8 15,099.5 16,201.9 17,677.3
ANTIGUA AND BARBUDA 25,528.8 27,064.0 28,325.0 32,126.4
DOMINICA 10,164.0 10,936.1 11,429.9 12,061.6
GRENADA 12,483.2 12,050.4 14,122.0 14,291.7
MONTSERRAT 22,815.7 23,629.6 24,315.6 26,036.5
ST. KITTS AND NEVIS 20,659.4 22,144.7 24,001.2 26,386.7
SAINT LUCIA 12,488.6 13,260.7 13,946.4 14,771.2
ST. VINCENT AND THE GRENADINES 9,908.5 10,862.2 11,450.9 13,257.9
Note: All figures are in Market Prices except for Jamaica which are atPurchasers' Price
US$COUNTRIES 2003 2004 2005 2006
CARIBBEAN COMMUNITY 5,344.3 5,837.0 6,563.0 7,337.8
The BAHAMAS 18,785.1 18,798.3 20,018.6 20,866.9
CSME 4,665.4 5,177.8 5,873.6 6,639.9
MDC'S 4,651.8 5,208.8 5,969.6 6,781.1
BARBADOS 9,922.1 10,341.8 11,237.4 11,646.0 GUYANA 982.0 1,041.5 1,098.1 1,197.6 JAMAICA 3,542.6 3,849.1 4,220.8 4,475.4 SURINAME 2,260.0 2,589.9 3,143.6 3,681.2 TRINIDAD AND TOBAGO 8,860.3 10,334.8 12,365.2 14,978.5
LDC's 4,752.7 4,981.5 5,273.5 5,752.2
BELIZE 3,608.3 3,733.7 3,820.4 4,158.8
OECS 5,302.2 5,592.4 6,000.7 6,547.2
ANTIGUA AND BARBUDA 9,455.1 10,023.7 10,490.7 11,898.7 DOMINICA 3,764.4 4,050.4 4,233.3 4,467.3 GRENADA 4,623.4 4,463.1 5,230.4 5,293.2 MONTSERRAT 8,450.3 8,751.7 9,005.8 9,643.2 ST. KITTS AND NEVIS 7,651.6 8,201.7 8,889.3 9,772.8 SAINT LUCIA 4,625.4 4,911.4 5,165.3 5,470.8
ST. VINCENT AND THE GRENADINES 3,669.8 4,023.0 4,241.1 4,910.3
Note: All figures are in Market Prices except for Jamaica which are atPurchasers' Price
Table 1.9: Per Capita Gross Domestic Product in Current Prices
Table 1.8: Per Capita Gross Domestic Product in Current Market Prices
28

CARICOM
EC$MnCOUNTRIES 2003 2004 2005 2006
CARIBBEAN COMMUNITY 89,749.0 99,919.5 101,891.7 115,672.1
The BAHAMAS 15,784.8 16,075.0 17,222.7 18,226.4
CSME 73,964.1 83,844.5 84,669.0 97,445.7
MDC'S 64,153.6 73,402.8 75,804.6 87,771.3
BARBADOS 6,987.1 7,314.2 … … GUYANA 1,876.2 2,027.6 2,174.0 2,340.2 JAMAICA 23,660.0 25,879.6 28,416.6 30,652.8 SURINAME 2,787.9 3,239.6 4,043.9 4,813.5 TRINIDAD AND TOBAGO 28,842.4 34,941.8 41,170.1 49,964.7
LDC's 9,810.6 10,441.8 8,864.4 9,674.4 BELIZE 2,373.8 2,469.0 … …
OECS 7,436.8 7,972.8 8,864.4 9,674.4
ANTIGUA AND BARBUDA 1,932.2 2,076.1 2,230.5 2,536.2 DOMINICA 636.7 680.1 729.7 811.2 GRENADA 1,073.2 1,114.9 1,419.1 1,446.3 MONTSERRAT 99.0 101.5 108.7 114.9 ST. KITTS AND NEVIS 859.3 973.9 1,089.9 1,231.8 SAINT LUCIA 1,868.7 1,967.7 2,157.0 2,255.0 ST. VINCENT AND THE GRENADINES 967.7 1,058.7 1,129.5 1,279.1 Note: All figures are in Market Prices except for Jamaica which are atPurchasers' Price
US$MnCOUNTRIES 2003 2004 2005 2006
CARIBBEAN COMMUNITY 33,240.4 37,007.2 37,737.7 42,841.5
The BAHAMAS 5,846.2 5,953.7 6,378.8 6,750.5
CSME 27,394.1 31,053.5 31,358.9 36,091.0
MDC'S 23,760.6 27,186.2 28,075.8 32,507.9
BARBADOS 2,587.8 2,709.0 … … GUYANA 694.9 751.0 805.2 866.7 JAMAICA 8,763.0 9,585.0 10,524.7 11,352.9 SURINAME 1,032.6 1,199.9 1,497.7 1,782.8 TRINIDAD AND TOBAGO 10,682.4 12,941.4 15,248.2 18,505.5
LDC's 3,633.5 3,867.3 3,283.1 3,583.1 BELIZE 879.2 914.4 … …
OECS 2,754.4 2,952.9 3,283.1 3,583.1
ANTIGUA AND BARBUDA 715.6 768.9 826.1 939.3 DOMINICA 235.8 251.9 270.3 300.4 GRENADA 397.5 412.9 525.6 535.7 MONTSERRAT 36.7 37.6 40.3 42.6 ST. KITTS AND NEVIS 318.3 360.7 403.7 456.2 SAINT LUCIA 692.1 728.8 798.9 835.2 ST. VINCENT AND THE GRENADINES 358.4 392.1 418.3 473.7
Table 1.10: Gross National Income in Market Prices
Table 1.11: Gross National Income in Market Prices
29

CARICOM
EC$
COUNTRIES 2003 2004 2005 2006
CARIBBEAN COMMUNITY 228,905.0 241,533.4 225,815.7 248,422.1
The BAHAMAS 49,905.0 50,096.6 52,965.2 55,315.4
CSME 179,000.1 191,436.8 172,850.5 193,106.7
MDC'S 65,483.7 72,991.4 53,511.7 62,583.5
BARBADOS 25,725.6 26,850.8 … … GUYANA 2,498.2 2,698.4 2,891.4 3,078.3 JAMAICA 8,994.8 9,795.5 10,705.1 11,464.1 SURINAME 5,774.9 6,573.6 8,111.4 9,545.7 TRINIDAD AND TOBAGO 22,490.2 27,073.1 31,803.9 38,495.3
LDC's 113,516.4 118,445.5 119,338.8 130,523.1 BELIZE 8,672.9 8,736.6 … …
OECS 104,843.5 109,708.9 119,338.8 130,523.1
ANTIGUA AND BARBUDA 24,219.2 25,545.5 26,942.4 30,074.9 DOMINICA 9,119.3 9,657.9 10,323.1 11,423.4 GRENADA 10,331.9 10,601.9 13,401.1 13,563.5 MONTSERRAT 22,086.1 21,674.9 22,725.2 24,691.7 ST. KITTS AND NEVIS 18,162.2 19,988.7 22,079.3 24,640.1 SAINT LUCIA 11,634.1 12,114.0 13,105.7 13,515.8 ST. VINCENT AND THE GRENADINES 9,290.7 10,126.1 10,762.1 12,613.7
US$
COUNTRIES 2003 2004 2005 2006
CARIBBEAN COMMUNITY 84,779.6 89,456.8 83,635.4 92,008.2
The BAHAMAS 18,483.3 18,554.3 19,616.7 20,487.2
CSME 66,296.3 70,902.5 64,018.7 71,521.0
MDC'S 24,253.2 27,033.8 19,819.2 23,179.1
BARBADOS 9,528.0 9,944.8 … …
GUYANA 925.3 999.4 1,070.9 1,140.1
JAMAICA 3,331.4 3,627.9 3,964.8 4,246.0
SURINAME 2,138.8 2,434.7 3,004.2 3,535.5
TRINIDAD AND TOBAGO 8,329.7 10,027.1 11,779.2 14,257.5
LDC's 42,043.1 43,868.7 44,199.6 48,341.9
BELIZE 3,212.2 3,235.8 … …
OECS 38,830.9 40,632.9 44,199.6 48,341.9
ANTIGUA AND BARBUDA 8,970.1 9,461.3 9,978.7 11,138.9
DOMINICA 3,377.5 3,577.0 3,823.4 4,230.9
GRENADA 3,826.6 3,926.6 4,963.4 5,023.5
MONTSERRAT 8,180.0 8,027.7 8,416.7 9,145.1
ST. KITTS AND NEVIS 6,726.8 7,403.2 8,177.5 9,126.0
SAINT LUCIA 4,308.9 4,486.7 4,854.0 5,005.9
ST. VINCENT AND THE GRENADINES 3,441.0 3,750.4 3,986.0 4,671.7
Table 1.12: Per Capita Gross National Income in Market Prices
Table 1.13: Per Capita Gross National Income in Market Prices
30


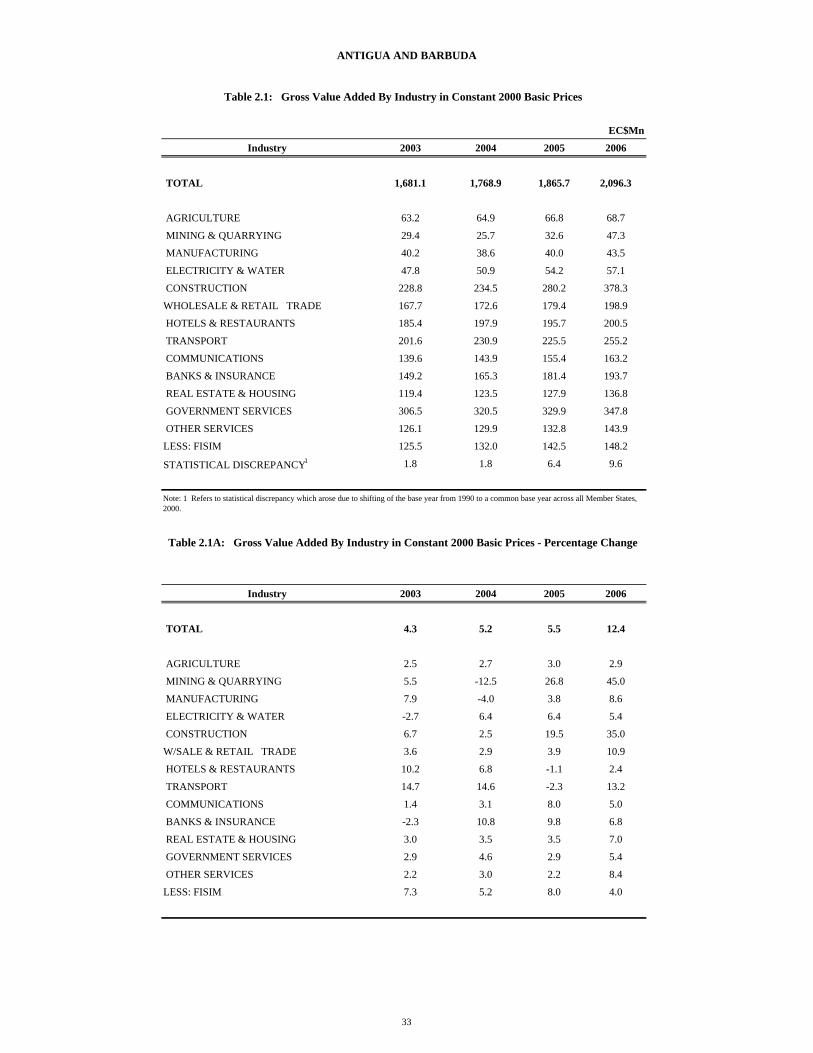
ANTIGUA AND BARBUDA
EC$Mn
Industry 2003 2004 2005 2006
TOTAL 1,681.1 1,768.9 1,865.7 2,096.3
AGRICULTURE 63.2 64.9 66.8 68.7
MINING & QUARRYING 29.4 25.7 32.6 47.3
MANUFACTURING 40.2 38.6 40.0 43.5
ELECTRICITY & WATER 47.8 50.9 54.2 57.1
CONSTRUCTION 228.8 234.5 280.2 378.3
WHOLESALE & RETAIL TRADE 167.7 172.6 179.4 198.9
HOTELS & RESTAURANTS 185.4 197.9 195.7 200.5
TRANSPORT 201.6 230.9 225.5 255.2
COMMUNICATIONS 139.6 143.9 155.4 163.2
BANKS & INSURANCE 149.2 165.3 181.4 193.7
REAL ESTATE & HOUSING 119.4 123.5 127.9 136.8
GOVERNMENT SERVICES 306.5 320.5 329.9 347.8
OTHER SERVICES 126.1 129.9 132.8 143.9
LESS: FISIM 125.5 132.0 142.5 148.2
STATISTICAL DISCREPANCY1 1.8 1.8 6.4 9.6
Industry 2003 2004 2005 2006
TOTAL 4.3 5.2 5.5 12.4
AGRICULTURE 2.5 2.7 3.0 2.9
MINING & QUARRYING 5.5 -12.5 26.8 45.0
MANUFACTURING 7.9 -4.0 3.8 8.6
ELECTRICITY & WATER -2.7 6.4 6.4 5.4
CONSTRUCTION 6.7 2.5 19.5 35.0
W/SALE & RETAIL TRADE 3.6 2.9 3.9 10.9
HOTELS & RESTAURANTS 10.2 6.8 -1.1 2.4
TRANSPORT 14.7 14.6 -2.3 13.2
COMMUNICATIONS 1.4 3.1 8.0 5.0
BANKS & INSURANCE -2.3 10.8 9.8 6.8
REAL ESTATE & HOUSING 3.0 3.5 3.5 7.0
GOVERNMENT SERVICES 2.9 4.6 2.9 5.4
OTHER SERVICES 2.2 3.0 2.2 8.4
LESS: FISIM 7.3 5.2 8.0 4.0
Note: 1 Refers to statistical discrepancy which arose due to shifting of the base year from 1990 to a common base year across all Member States, 2000.
Table 2.1: Gross Value Added By Industry in Constant 2000 Basic Prices
Table 2.1A: Gross Value Added By Industry in Constant 2000 Basic Prices - Percentage Change
33
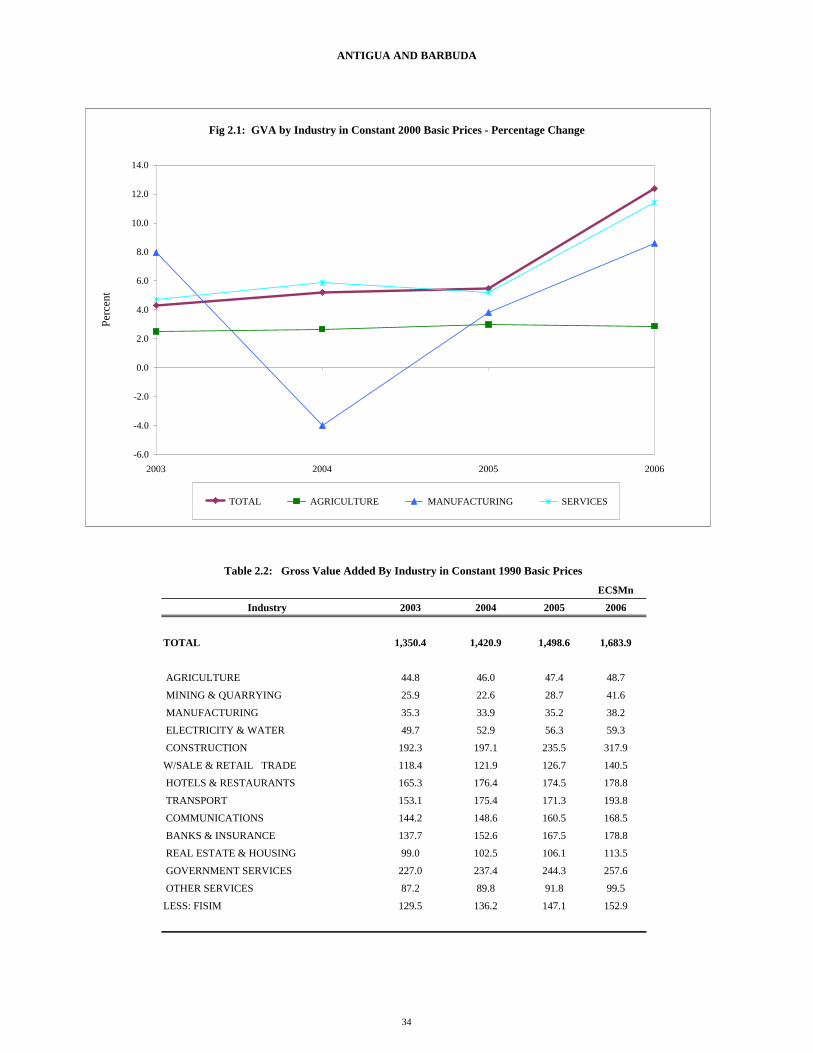
ANTIGUA AND BARBUDA
EC$Mn
Industry 2003 2004 2005 2006
TOTAL 1,350.4 1,420.9 1,498.6 1,683.9
AGRICULTURE 44.8 46.0 47.4 48.7
MINING & QUARRYING 25.9 22.6 28.7 41.6
MANUFACTURING 35.3 33.9 35.2 38.2
ELECTRICITY & WATER 49.7 52.9 56.3 59.3
CONSTRUCTION 192.3 197.1 235.5 317.9
W/SALE & RETAIL TRADE 118.4 121.9 126.7 140.5
HOTELS & RESTAURANTS 165.3 176.4 174.5 178.8
TRANSPORT 153.1 175.4 171.3 193.8
COMMUNICATIONS 144.2 148.6 160.5 168.5
BANKS & INSURANCE 137.7 152.6 167.5 178.8
REAL ESTATE & HOUSING 99.0 102.5 106.1 113.5
GOVERNMENT SERVICES 227.0 237.4 244.3 257.6
OTHER SERVICES 87.2 89.8 91.8 99.5
LESS: FISIM 129.5 136.2 147.1 152.9
Table 2.2: Gross Value Added By Industry in Constant 1990 Basic Prices
Fig 2.1: GVA by Industry in Constant 2000 Basic Prices - Percentage Change
-6.0
-4.0
-2.0
0.0
2.0
4.0
6.0
8.0
10.0
12.0
14.0
2003 2004 2005 2006
Perc
ent
TOTAL AGRICULTURE MANUFACTURING SERVICES
34

ANTIGUA AND BARBUDA
Industry 2003 2004 2005 2006
TOTAL 100.0 100.0 100.0 100.0
AGRICULTURE 3.3 3.2 3.2 2.9
MINING & QUARRYING 1.9 1.6 1.9 2.5
MANUFACTURING 2.6 2.4 2.3 2.3
ELECTRICITY & WATER 3.7 3.7 3.8 3.5
CONSTRUCTION 14.2 13.9 15.7 18.9
W/SALE & RETAIL TRADE 8.8 8.6 8.5 8.3
HOTELS & RESTAURANTS 12.2 12.4 11.6 10.6
TRANSPORT 11.3 12.3 11.4 11.5
COMMUNICATIONS 10.7 10.5 10.7 10.0
BANKS & INSURANCE 10.2 10.7 11.2 10.6
REAL ESTATE & HOUSING 7.3 7.2 7.1 6.7
GOVERNMENT SERVICES 16.8 16.7 16.3 15.3
OTHER SERVICES 6.5 6.3 6.1 5.9
LESS: FISIM 9.6 9.6 9.8 9.1
Table 2.2A: Gross Value Added By Industry in Constant 1990 Basic Prices - Percentage Distribution
Fig. 2.2: GVA By Industry in Constant 1990 Basic Prices -Percentage
Distribution, 2003
14.2
12.2
11.3
10.716.8
34.7
CONSTRUCTION HOTELS & RESTAURANTS TRANSPORT COMMUNICATIONS GOVERNMENT SERVICESOTHER SECTORS
Fig. 2.3: GVA By Industry in Constant 1990 Basic Prices -
Percentage Distribution, 2006
18.9
10.6
11.5
10.015.3
33.7
CONSTRUCTION HOTELS & RESTAURANTS TRANSPORT COMMUNICATIONS GOVERNMENT SERVICESOTHER SECTORS
35

ANTIGUA AND BARBUDA
EC$Mn
Industry 2003 2004 2005 2006
TOTAL 1,728.4 1,840.4 1,978.8 2,274.5
AGRICULTURE 65.2 67.9 71.4 75.3
MINING & QUARRYING 29.8 26.1 33.1 49.4
MANUFACTURING 40.1 39.4 40.9 42.4
ELECTRICITY & WATER 50.6 52.9 57.7 62.3
CONSTRUCTION 243.9 255.0 319.9 466.4
W/SALE & RETAIL TRADE 177.4 185.8 197.2 219.9
HOTELS & RESTAURANTS 173.4 185.2 194.1 204.8
TRANSPORT 215.0 253.0 249.9 285.4
COMMUNICATIONS 140.1 145.5 157.2 165.0
BANKS & INSURANCE 158.8 174.1 190.0 203.2
REAL ESTATE & HOUSING 126.7 133.7 141.2 154.1
GOVERNMENT SERVICES 306.5 320.5 329.9 359.8
OTHER SERVICES 126.7 133.6 141.9 142.9
LESS: FISIM 125.8 132.3 145.5 156.4
Industry 2003 2004 2005 2006
TOTAL 100.0 100.0 100.0 100.0
AGRICULTURE 3.8 3.7 3.6 3.3
MINING & QUARRYING 1.7 1.4 1.7 2.2
MANUFACTURING 2.3 2.1 2.1 1.9
ELECTRICITY & WATER 2.9 2.9 2.9 2.7
CONSTRUCTION 14.1 13.9 16.2 20.5
W/SALE & RETAIL TRADE 10.3 10.1 10.0 9.7
HOTELS & RESTAURANTS 10.0 10.1 9.8 9.0
TRANSPORT 12.4 13.7 12.6 12.5
COMMUNICATIONS 8.1 7.9 7.9 7.3
BANKS & INSURANCE 9.2 9.5 9.6 8.9
REAL ESTATE & HOUSING 7.3 7.3 7.1 6.8
GOVERNMENT SERVICES 17.7 17.4 16.7 15.8
OTHER SERVICES 7.3 7.3 7.2 6.3
LESS: FISIM 7.3 7.2 7.4 6.9
Table 2.3: Gross Valued Added By Industry in Current Basic Prices
Table 2.3A: Gross Value Added By Industry in Current Basic Prices - Percentage Distribution
36

ANTIGUA AND BARBUDA
Industry 2003 2004 2005 2006
TOTAL 4.6 6.5 7.5 14.9
AGRICULTURE 4.1 4.2 5.1 5.5
MINING & QUARRYING 5.4 -12.5 26.8 49.3
MANUFACTURING 5.4 -1.6 3.8 3.6
ELECTRICITY & WATER -1.6 4.6 8.9 8.1
CONSTRUCTION 6.7 4.6 25.5 45.8
W/SALE & RETAIL TRADE 6.0 4.7 6.1 11.5
HOTELS & RESTAURANTS 10.2 6.8 4.8 5.5
TRANSPORT 11.3 17.6 -1.2 14.2
COMMUNICATIONS 1.6 3.9 8.0 5.0
BANKS & INSURANCE -1.6 9.6 9.1 7.0
REAL ESTATE & HOUSING 5.1 5.6 5.6 9.1
GOVERNMENT SERVICES 2.9 4.6 2.9 9.1
OTHER SERVICES 1.6 5.4 6.3 0.7
LESS: FISIM 7.3 5.2 10.0 7.5
Table 2.3B: Gross Value Added By Industry in Current Basic Prices - Percentage Change
Fig 2.4: GVA by Industry in Current Basic Prices - Percentage Change
-4.0
-2.0
0.0
2.0
4.0
6.0
8.0
10.0
12.0
14.0
16.0
2003 2004 2005 2006
Perc
ent
TOTAL AGRICULTURE MANUFACTURING SERVICES
37

ANTIGUA AND BARBUDA
EC$Mn
EXPENDITURE GROUPS 2003 2004 2005 2006
GROSS DOMESTIC PRODUCT (Current Market Prices) 2,036.7 2,199.5 2,344.9 2,709.2
TOTAL CONSUMPTION 1,175.8 1,253.5 1,329.9 1,411.0
Private 761.5 814.6 886.7 925.5
General Government 414.3 438.9 443.1 485.5
GROSS CAPITAL FORMATION 1,055.6 1,103.6 1,384.8 2,019.0
Gross Fixed Capital Formation 1,055.6 1,103.6 1,384.8 2,019.0
Increase in Stocks - - - -
GOODS AND NON-FACTOR SERVICES -194.7 -157.6 -369.7 -720.8
Exports of Goods 120.8 154.1 222.6 199.8
Exports of Non-Factor Services 1,128.4 1,287.7 1,249.0 1,289.2
Imports of Goods 951.2 1,086.4 1,229.5 1,511.2
Imports of Non Factor Services 492.7 513.0 611.9 698.5
Table 2.4: Expenditure on Gross Domestic Product in Current Prices
Fig 2.5: GVA in Current and Constant 1990 Basic Prices
0
500
1000
1500
2000
2500
2003 2004 2005 2006
$EC
Mn
CONSTANT 1990 BASIC PRICES CURRENT BASIC PRICES
38

ANTIGUA AND BARBUDA
EXPENDITURE GROUPS 2003 2004 2005 2006
GROSS DOMESTIC PRODUCT (Current Market Prices) 100.0 100.0 100.0 100.0
TOTAL CONSUMPTION 57.7 57.0 56.7 52.1
Private 37.4 37.0 37.8 34.2
General Government 20.3 20.0 18.9 17.9
GROSS CAPITAL FORMATION 51.8 50.2 59.1 74.5
Gross Fixed Capital Formation 51.8 50.2 59.1 74.5
Increase in Stocks - - - -
GOODS AND NON-FACTOR SERVICES -9.6 -7.2 -15.8 -26.6
Exports of Goods 5.9 7.0 9.5 7.4
Exports of Non-Factor Services 55.4 58.5 53.3 47.6
Imports of Goods 46.7 49.4 52.4 55.8
Imports of Non Factor Services 24.2 23.3 26.1 25.8
Table 2.4A: Expenditure on Gross Domestic Product in Current Prices - Percentage Distribution
Fig 2.6: Expenditure on GDP in Current Prices : 2003
-500
0
500
1000
1500
2000
2500
Total GDP PrivateConsumption
GovernmentConsumption
Gross CapitalFormation
Goods and Non-factor Services
EC
$Mn
Fig 2.7: Expenditure on GDP in Current Prices: 2006
-1000
-500
0
500
1000
1500
2000
2500
3000
Total GDP PrivateConsumption
GovernmentConsumption
Gross CapitalFormation
Goods and Non-factor Services
EC
$Mn
39

40


THE BAHAMAS
EC$MnIndustry 2003 2004 2005 2006
TOTAL 13,421.2 13,399.8 13,847.2 14,489.0
AGRICULTURE & FISHING 362.9 334.3 283.2 292.3
MINING & MANUFACTURING 637.9 682.0 822.0 803.4
ELECTRICITY & WATER 565.8 569.6 653.3 755.2
CONSTRUCTION 1,123.8 970.5 1,102.3 1,327.6
WHOLESALE & RETAIL TRADE 1,676.9 1,749.2 1,881.4 1,906.6
HOTELS & RESTAURANTS 1,456.8 1,503.2 1,475.6 1,550.5
T/PORT, STORAGE & COMM. 1,107.9 1,134.1 1,157.0 1,165.0
FINANCIAL INTERMEDIATION 1,406.2 1,453.6 1,560.0 1,585.6
REAL ESTATE, RENT & BUSINESS 3,041.2 3,171.4 3,132.3 3,229.4
PUBLIC ADMIN. & DEFENCE 586.2 545.4 560.2 566.4
EDUCATION 629.9 656.6 675.0 677.3
HEALTH 436.6 454.9 465.5 464.5
OTHER COM., SOC. & PERS. SERV. 928.5 912.1 952.3 939.8
DUMMY FINANCIAL CORPORATION (FISIM) -820.9 -885.1 -1,014.0 -1,044.3
NET INDIRECT TAXES 1,513.5 1,445.1 1,429.3 1,618.0
STATISTICAL DISCREPANCY 1 -1,231.9 -1,296.9 -1,288.2 -1,348.4
Industry 2003 2004 2005 2006
TOTAL -10.1 -0.2 3.3 4.6
AGRICULTURE & FISHING -3.8 -7.9 -15.3 3.2
MINING & MANUFACTURING 20.6 6.9 20.5 -2.3
ELECTRICITY & WATER 6.6 0.7 14.7 15.6
CONSTRUCTION 6.6 -13.6 13.6 20.4
WHOLESALE & RETAIL TRADE -1.1 4.3 7.6 1.3
HOTELS & RESTAURANTS 7.1 3.2 -1.8 5.1
T/PORT, STORAGE & COMM. 0.9 2.4 2.0 0.7
FINANCIAL INTERMEDIATION -18.5 3.4 7.3 1.6
REAL ESTATE, RENT & BUSINESS -3.0 4.3 -1.2 3.1
PUBLIC ADMIN. & DEFENCE -18.6 -7.0 2.7 1.1
EDUCATION 12.0 4.2 2.8 0.4
HEALTH -0.5 4.2 2.4 -0.2
OTHER COM., SOC. & PERS. SERV. 7.0 -1.8 4.4 -1.3
DUMMY FINANCIAL CORPORATION (FISIM) 31.7 7.8 14.6 3.0
NET INDIRECT TAXES 3.2 -4.5 -1.1 13.2
Table 3.1: Gross Domestic Product By Industry in Constant 2000 Market Prices
Table 3.1A: Gross Domestic Product By Industry in Constant 2000 Market Prices - Percentage Change
1 Refers to statistical discrepancy which arose due to shifting of the base year from 2006 to a common base year across all Member States, 2000.
43

THE BAHAMAS
BH$MnIndustry 2003 2004 2005 2006
TOTAL 6,368.9 6,358.8 6,571.1 6,875.6
AGRICULTURE & FISHING 132.6 122.2 103.5 106.8
MINING & MANUFACTURING 279.8 299.1 360.5 352.3
ELECTRICITY & WATER 175.9 177.1 203.1 234.8
CONSTRUCTION 624.8 539.6 612.9 738.2
WHOLESALE & RETAIL TRADE 700.0 730.2 785.4 795.9
HOTELS & RESTAURANTS 658.8 679.8 667.3 701.2
T/PORT, STORAGE & COMM. 567.0 580.4 592.1 596.2
FINANCIAL INTERMEDIATION 663.3 685.7 735.8 747.9
REAL ESTATE, RENT & BUSINESS 1,079.2 1,125.4 1,111.6 1,146.0
PUBLIC ADMIN. & DEFENCE 411.0 382.4 392.8 397.1
EDUCATION 280.3 292.2 300.4 301.4
HEALTH 194.8 203.0 207.8 207.3
OTHER COM., SOC. & PERS. SERV. 383.7 376.9 393.5 388.4
DUMMY FINANCIAL CORPORATION (FISIM) 347.5 374.7 429.2 442.0
NET INDIRECT TAXES 565.1 539.6 533.7 604.1
Table 3.2: Gross Domestic Product By Industry in Constant 2006 Market Prices
Fig 3.1: GDP by Industry in Constant 2000 Basic Prices - Percentage Change (Based on EC$ Mn)
-20.0
-15.0
-10.0
-5.0
0.0
5.0
10.0
15.0
20.0
25.0
2003 2004 2005 2006
AGRICULTURE & FISHING MINING & MANUFACTURING
CONSTRUCTION SERVICES
44

THE BAHAMAS
Industry 2003 2004 2005 2006
TOTAL 100.0 100.0 100.0 100.0
AGRICULTURE & FISHING 2.0 1.9 1.6 1.6
MINING & MANUFACTURING 4.3 4.6 5.5 5.4
ELECTRICITY & WATER 2.7 2.7 3.1 3.6
CONSTRUCTION 9.6 8.3 9.4 11.3
WHOLESALE & RETAIL TRADE 10.7 11.2 12.0 12.2
HOTELS & RESTAURANTS 10.1 10.4 10.2 10.7
T/PORT, STORAGE & COMM. 8.7 8.9 9.1 9.1
FINANCIAL INTERMEDIATION 10.2 10.5 11.3 11.5
REAL ESTATE, RENT & BUSINESS 16.5 17.2 17.0 17.6
PUBLIC ADMIN. & DEFENCE 6.3 5.9 6.0 6.1
EDUCATION 4.3 4.5 4.6 4.6
HEALTH 3.0 3.1 3.2 3.2
OTHER COM., SOC. & PERS. SERV. 5.9 5.8 6.0 6.0
DUMMY FINANCIAL CORPORATION (FISIM) 5.3 5.7 6.6 6.8
NET INDIRECT TAXES 8.7 8.3 8.2 9.3
Table 3.2A: Gross Domestic Product By Industry in Constant 2006 Market Prices - Percentage Distribution
Fig 3.2: GDP by Industry at Factor Cost in Constant 2006 Market Prices - Percentage
Distribution, 2003
9.6
10.7
8.7
10.2
16.5
44.3
CONSTRUCTION
WHOLESALE & RETAIL TRADE
T/PORT, STORAGE & COMM.
FINANCIAL INTERMEDIATION
REAL ESTATE, RENT & BUSINESS
OTHER
Fig 3.3: GDP by Industry at Factor Cost in Constant 2006 Market Prices -
Percentage Distribution, 2006
11.3
12.2
9.1
11.5 17.6
38.3
CONSTRUCTION
WHOLESALE & RETAIL TRADE
T/PORT, STORAGE & COMM.
FINANCIAL INTERMEDIATION
REAL ESTATE, RENT & BUSINESS
OTHER
45

THE BAHAMAS
BH$ MnIndustry 2003 2004 2005 2006
TOTAL 5,941.7 6,032.0 6,509.5 6,875.6
AGRICULTURE & FISHING 119.8 102.0 97.6 106.8
MINING & MANUFACTURING 287.2 335.7 345.8 352.3
ELECTRICITY & WATER 186.0 182.5 205.2 234.8
CONSTRUCTION 518.5 459.2 598.0 738.2
WHOLESALE & RETAIL TRADE 661.3 685.9 750.6 795.9
HOTELS & RESTAURANTS 598.5 623.7 685.4 701.2
T/PORT, STORAGE & COMM. 536.1 537.2 600.1 596.2
FINANCIAL INTERMEDIATION 612.7 641.2 719.9 747.9
REAL ESTATE, RENT & BUSINESS 1,105.7 1,149.6 1,166.6 1,146.0
PUBLIC ADMIN. & DEFENCE 328.5 355.8 367.6 397.1
EDUCATION 247.0 261.9 286.0 301.4
HEALTH 177.9 182.6 198.1 207.3
OTHER COM., SOC. & PERS. SERV. 360.1 359.5 389.6 388.4
DUMMY FINANCIAL CORPORATION (FISIM) 316.2 346.2 416.3 442.0
NET INDIRECT TAXES 518.6 501.6 515.5 604.1
Industry 2003 2004 2005 2006
TOTAL 0.5 1.5 7.9 5.6
AGRICULTURE & FISHING -9.3 -14.9 -4.3 9.5
MINING & MANUFACTURING -4.1 16.9 3.0 1.9
ELECTRICITY & WATER 12.5 -1.9 12.4 14.4
CONSTRUCTION 5.0 -11.4 30.2 23.4
WHOLESALE & RETAIL TRADE 1.1 3.7 9.4 6.0
HOTELS & RESTAURANTS 10.3 4.2 9.9 2.3
T/PORT, STORAGE & COMM. 7.3 0.2 11.7 -0.6
FINANCIAL INTERMEDIATION -17.9 4.7 12.3 3.9
REAL ESTATE, RENT & BUSINESS 0.3 4.0 1.5 -1.8
PUBLIC ADMIN. & DEFENCE 5.8 8.3 3.3 8.0
EDUCATION 14.3 6.0 9.2 5.4
HEALTH 6.8 2.6 8.5 4.7
OTHER COM., SOC. & PERS. SERV. 8.6 -0.2 8.4 -0.3
DUMMY FINANCIAL CORPORATION (FISIM) 31.2 9.5 20.3 6.2
Table 3.3: Gross Domestic Product By Industry in Current Market Prices
Table 3.3A: Gross Domestic Product By Industry in Current Market Prices - Percentage Change
46

THE BAHAMAS
Fig 3.5: Gross Domestic Product in Current and Constant 2006 Market Prices
5400
5600
5800
6000
6200
6400
6600
6800
7000
2003 2004 2005 2006
BH
$ M
n
CONSTANT 2006 PRICES CURRENT MARKET PRICES
Fig 3.4: Gross Domestic Product by Industry in Current Market Prices - Percentage Change (Based on BH$ Mn)
-20.0
-15.0
-10.0
-5.0
0.0
5.0
10.0
15.0
20.0
2003 2004 2005 2006
Perc
ent
TOTAL AGRICULTURE & FISHING MINING & MANUFACTURING SERVICES
47
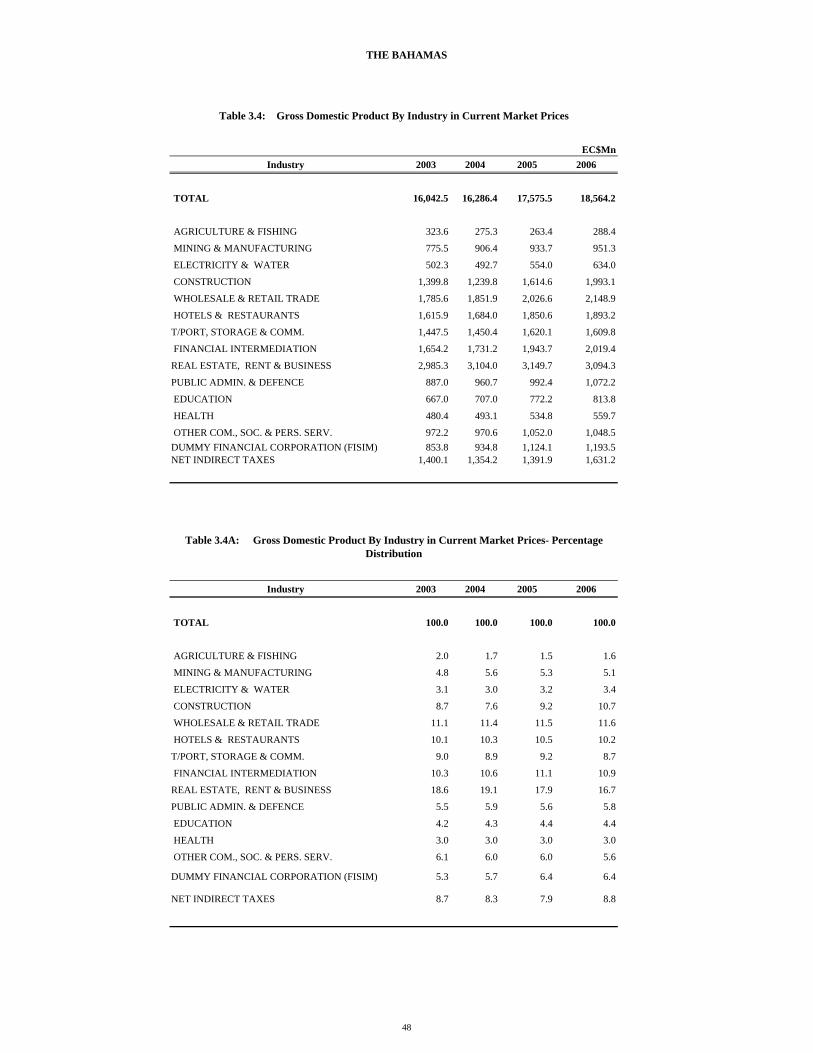
THE BAHAMAS
EC$MnIndustry 2003 2004 2005 2006
TOTAL 16,042.5 16,286.4 17,575.5 18,564.2
AGRICULTURE & FISHING 323.6 275.3 263.4 288.4
MINING & MANUFACTURING 775.5 906.4 933.7 951.3
ELECTRICITY & WATER 502.3 492.7 554.0 634.0
CONSTRUCTION 1,399.8 1,239.8 1,614.6 1,993.1
WHOLESALE & RETAIL TRADE 1,785.6 1,851.9 2,026.6 2,148.9
HOTELS & RESTAURANTS 1,615.9 1,684.0 1,850.6 1,893.2
T/PORT, STORAGE & COMM. 1,447.5 1,450.4 1,620.1 1,609.8
FINANCIAL INTERMEDIATION 1,654.2 1,731.2 1,943.7 2,019.4
REAL ESTATE, RENT & BUSINESS 2,985.3 3,104.0 3,149.7 3,094.3
PUBLIC ADMIN. & DEFENCE 887.0 960.7 992.4 1,072.2
EDUCATION 667.0 707.0 772.2 813.8
HEALTH 480.4 493.1 534.8 559.7
OTHER COM., SOC. & PERS. SERV. 972.2 970.6 1,052.0 1,048.5DUMMY FINANCIAL CORPORATION (FISIM) 853.8 934.8 1,124.1 1,193.5NET INDIRECT TAXES 1,400.1 1,354.2 1,391.9 1,631.2
Industry 2003 2004 2005 2006
TOTAL 100.0 100.0 100.0 100.0
AGRICULTURE & FISHING 2.0 1.7 1.5 1.6
MINING & MANUFACTURING 4.8 5.6 5.3 5.1
ELECTRICITY & WATER 3.1 3.0 3.2 3.4
CONSTRUCTION 8.7 7.6 9.2 10.7
WHOLESALE & RETAIL TRADE 11.1 11.4 11.5 11.6
HOTELS & RESTAURANTS 10.1 10.3 10.5 10.2
T/PORT, STORAGE & COMM. 9.0 8.9 9.2 8.7
FINANCIAL INTERMEDIATION 10.3 10.6 11.1 10.9
REAL ESTATE, RENT & BUSINESS 18.6 19.1 17.9 16.7
PUBLIC ADMIN. & DEFENCE 5.5 5.9 5.6 5.8
EDUCATION 4.2 4.3 4.4 4.4
HEALTH 3.0 3.0 3.0 3.0
OTHER COM., SOC. & PERS. SERV. 6.1 6.0 6.0 5.6
DUMMY FINANCIAL CORPORATION (FISIM) 5.3 5.7 6.4 6.4
NET INDIRECT TAXES 8.7 8.3 7.9 8.8
Table 3.4: Gross Domestic Product By Industry in Current Market Prices
Table 3.4A: Gross Domestic Product By Industry in Current Market Prices- Percentage Distribution
48

THE BAHAMAS
EC$MnEXPENDITURE GROUPS 2003 2004 2005 2006
GROSS DOMESTIC PRODUCT (Current Market Prices) 16,044.6 16,285.6 17,573.7 18,564.2
TOTAL CONSUMPTION 11,972.1 12,454.4 13,385.9 15,546.1
Private 9,852.6 10,223.4 11,028.3 12,987.5
General Government 2,119.5 2,231.0 2,357.6 2,558.6
GROSS CAPITAL FORMATION 4,695.1 4,526.1 6,012.3 7,299.6
Gross Fixed Capital Formation 4,533.6 4,368.6 5,838.8 7,123.2
Increase in Stocks 161.5 157.5 173.5 176.3
GOODS AND NON-FACTOR SERVICES -622.5 -694.8 -1,824.6 -4,281.4
Exports of Goods and Services 6,692.5 7,315.8 8,049.5 8,113.9
Imports of Goods and Services 7,315.1 8,010.6 9,874.0 12,395.3
EXPENDITURE GROUPS 2003 2004 2005 2006
GROSS DOMESTIC PRODUCT (Current Market Prices) 100.0 100.0 100.0 100.0
TOTAL CONSUMPTION 74.6 76.5 76.2 83.7
Private 61.4 62.8 62.8 70.0
General Government 13.2 13.7 13.4 13.8
GROSS CAPITAL FORMATION 29.3 27.8 34.2 39.3
Gross Fixed Capital Formation 28.3 26.8 33.2 38.4
Increase in Stocks 1.0 1.0 1.0 0.9
GOODS AND NON-FACTOR SERVICES -3.9 -4.3 -10.4 -23.1
Exports of Goods and Services 41.7 44.9 45.8 43.7
Imports of Goods and Services 45.6 49.2 56.2 66.8
Table 3.5: Expenditure on Gross Domestic Product in Current Prices
Table 3.5A: Expenditure on Gross Domestic Product in Current Prices - Percentage Distribution
49

THE BAHAMAS
BH$MnEXPENDITURE GROUPS 2003 2004 2005 2006
GROSS DOMESTIC PRODUCT (Current Market Prices) 5,942.4 6,031.7 6,508.8 6,875.6
TOTAL CONSUMPTION 4,434.1 4,612.7 4,957.7 5,757.8
Private 3,649.1 3,786.4 4,084.5 4,810.2
General Government 785.0 826.3 873.2 947.6
GROSS CAPITAL FORMATION 1,738.9 1,676.3 2,226.8 2,703.5
Gross Fixed Capital Formation 1,679.1 1,618.0 2,162.5 2,638.2
Increase in Stocks 59.8 58.3 64.3 65.3
GOODS AND NON-FACTOR SERVICES -230.6 -257.3 -675.8 -1,585.7
Exports of Goods and Services 2,478.7 2,709.5 2,981.3 3,005.1
Imports of Goods and Services 2,709.3 2,966.9 3,657.1 4,590.9
Table 3.6: Expenditure on Gross Domestic Product in Current Prices
Fig 3.6: Expenditure on GDP in Current Prices: 2003
-1000.0
0.0
1000.0
2000.0
3000.0
4000.0
5000.0
6000.0
7000.0
Total GDP PrivateConsumption
GovernmentConsumption
Gross CapitalFormation
Goods and Non-factor Services
Fig 3.7: Expenditure on GDP in Current Prices: 2006
-3000.0
-2000.0
-1000.0
0.0
1000.0
2000.0
3000.0
4000.0
5000.0
6000.0
7000.0
8000.0
Total GDP PrivateConsumption
GovernmentConsumption
Gross CapitalFormation
Goods and Non-factor Services
50


BARBADOS
EC$Mn
Industry 2003 2004 2005 2006
TOTAL 5,706.6 5,980.7 6,224.3 6,464.4
AGRICULTURE 204.1 189.3 204.5 192.9
MINING & QUARRYING 33.9 37.1 40.4 39.2
MANUFACTURING 325.3 332.3 339.3 343.0
ELECTRICITY, GAS & WATER 211.4 215.3 214.2 235.1
CONSTRUCTION 389.1 400.1 453.8 485.1
WHOLESALE & RETAIL TRADE 1,042.0 1,105.7 1,163.9 1,225.3
TOURISM 644.5 704.8 688.9 699.8
TRANSPORT, STORAGE & COMM. 524.7 552.6 579.9 610.4
BUSINESS & GENERAL SERVICES 1,332.4 1,389.4 1,452.7 1,529.4
GOVERNMENT SERVICES 1,020.2 1,077.5 1,115.1 1,149.0
STATISTICAL DISCREPANCY1 -21.0 -23.4 -28.3 -44.8
Industry 2003 2004 2005 2006
TOTAL 2.0 4.8 4.1 3.9
AGRICULTURE -4.0 -7.3 8.0 -5.7
MINING & QUARRYING -16.0 9.5 8.7 -3.0
MANUFACTURING -1.6 2.1 2.1 1.1
ELECTRICITY, GAS & WATER 2.9 1.8 -0.5 9.8
CONSTRUCTION 0.6 2.8 13.4 6.9
WHOLESALE & RETAIL TRADE 4.0 6.1 5.3 5.3
TOURISM 7.0 9.4 -2.3 1.6
TRANSPORT, STORAGE & COMM. 3.0 5.3 4.9 5.3
BUSINESS & GENERAL SERVICES 4.5 4.3 4.6 5.3
GOVERNMENT SERVICES -3.7 5.6 3.5 3.0
Table 4.1: Gross Domestic Product By Industry in Constant 2000 Basic Prices
Table 4.1A:Gross Domestic Product By Industry in Constant 2000 Basic Prices - Percentage Change
1 Refers to statistical discrepancy which arose due to shifting of the base year from 1974 to a common base year across all Member States, 2000.
53

BARBADOS
BD$MnIndustry 2003 2004 2005 2006
TOTAL 976.7 1,023.6 1,065.3 1,106.4
AGRICULTURE 51.0 47.3 51.1 48.2
MINING & QUARRYING 8.4 9.2 10.0 9.7
MANUFACTURING 60.6 61.9 63.2 63.9
ELECTRICITY, GAS & WATER 38.4 39.1 38.9 42.7
CONSTRUCTION 84.7 87.1 98.8 105.6
WHOLESALE & RETAIL TRADE 193.3 205.1 215.9 227.3
TOURISM 153.8 168.2 164.4 167.0
TRANSPORT, STORAGE & COMM. 82.6 87.0 91.3 96.1
BUSINESS & GENERAL SERVICES 168.4 175.6 183.6 193.3
GOVERNMENT SERVICES 135.5 143.1 148.1 152.6
Table 4.2: Gross Domestic Product By Industry in Constant 1974 Basic Prices
Fig 4.1: GDP by Industry in Constant 2000 Basic Prices - Percentage Change (Based on $EC Mn)
-10.0
-8.0
-6.0
-4.0
-2.0
0.0
2.0
4.0
6.0
8.0
10.0
2003 2004 2005 2006
Perc
ent
TOTAL AGRICULTURE MANUFACTURING SERVICES
54

BARBADOS
Industry 2003 2004 2005 2006
TOTAL 100.0 100.0 100.0 100.0
AGRICULTURE 5.2 4.6 4.8 4.4
MINING & QUARRYING 0.9 0.9 0.9 0.9
MANUFACTURING 6.2 6.0 5.9 5.8
ELECTRICITY, GAS & WATER 3.9 3.8 3.7 3.9
CONSTRUCTION 8.7 8.5 9.3 9.5
WHOLESALE & RETAIL TRADE 19.8 20.0 20.3 20.5
TOURISM 15.7 16.4 15.4 15.1
TRANSPORT, STORAGE & COMM. 8.5 8.5 8.6 8.7
BUSINESS & GENERAL SERVICES 17.2 17.2 17.2 17.5
GOVERNMENT SERVICES 13.9 14.0 13.9 13.8
Table 4.2A: Gross Domestic Product By Industry in Constant 1974 Basic Prices - Percentage Distribution
Fig 4.2: GDP by Industry in Constant 1974 Basic Prices - Percentage
Distribution, 2003
19.8
15.7
8.5 17.2
13.9
24.9
WHOLESALE & RETAIL TRADE TOURISM TRANSPORT, STORAGE & COMM. BUSINESS & GENERAL SERVICES GOVERNMENT SERVICESOTHER
Fig 4.3: GDP by Industry in Constant 1974 Basic Prices - Percentage Distribution, 2006
20.5
15.1
8.7 17.5
13.8
24.4
WHOLESALE & RETAIL TRADE TOURISM TRANSPORT, STORAGE & COMM. BUSINESS & GENERAL SERVICES GOVERNMENT SERVICESOTHER
55

BARBADOS
BD$MnIndustry 2003 2004 2005 2006
TOTAL 4,334.7 4,601.8 4,975.5 5,264.4
AGRICULTURE: 193.5 165.0 177.1 177.7
MINING AND QUARRYING 31.0 35.1 44.0 53.0
MANUFACTURING 292.7 315.8 321.3 357.1
ELECTRICITY, GAS AND WATER 143.6 144.5 171.1 197.3
CONSTRUCTION 232.1 259.7 329.1 356.3
WHOLESALE AND RETAIL TRADE 738.6 806.4 890.8 893.8
TOURISM 512.4 523.5 569.0 612.9
TRANSPORT, STORAGE & COMM. 289.2 318.5 327.6 330.2
BUSINESS & GENERAL SERVICES 1,121.0 1,243.4 1,325.9 1,431.9
GOVERNMENT SERVICES 780.5 789.9 819.6 854.2
Industry 2003 2004 2005 2006
TOTAL 6.6 6.2 8.1 5.8
AGRICULTURE 26.5 -14.7 7.3 0.3
MINING AND QUARRYING 5.2 13.1 25.4 20.5
MANUFACTURING 11.2 7.9 1.7 11.1
ELECTRICITY, GAS AND WATER 4.7 0.6 18.4 15.3
CONSTRUCTION 2.5 11.9 26.7 8.3
WHOLESALE AND RETAIL TRADE 4.2 9.2 10.5 0.3
TOURISM 15.3 2.2 8.7 7.7
TRANSPORT, STORAGE & COMM. -2.5 10.1 2.9 0.8
BUSINESS & GENERAL SERVICES 11.7 10.9 6.6 8.0
GOVERNMENT SERVICES -2.8 1.2 3.8 4.2
Table 4.3: Gross Domestic Product By Industry in Current Basic Prices
Table 4.3A: Gross Domestic Product By Industry in Current Basic Prices - Percentage Change
56

BARBADOS
Fig 4.4: Gross Domestic Product by Industry in Current Basic Prices - Percentage Change (Based on $BD Mn)
-20.0
-15.0
-10.0
-5.0
0.0
5.0
10.0
15.0
20.0
25.0
30.0
2003 2004 2005 2006
Perc
ent
TOTAL AGRICULTUREMANUFACTURING SERVICES
Fig 4.5: Gross Domestic Product in Current and Constant 1974 Basic Prices
0
1000
2000
3000
4000
5000
6000
2003 2004 2005 2006
$BD
Mn
CONSTANT 1974 BASIC PRICES CURRENT BASIC PRICES
57

BARBADOS
EC$Mn Industry 2003 2004 2005 2006
TOTAL 5,851.8 6,212.4 6,716.9 7,106.9
AGRICULTURE 261.2 222.8 239.1 239.9
MINING AND QUARRYING 41.9 47.4 59.4 71.6
MANUFACTURING 395.2 426.3 433.8 482.1
ELECTRICITY, GAS AND WATER 193.8 195.1 231.0 266.4
CONSTRUCTION 313.4 350.6 444.3 481.0
WHOLESALE AND RETAIL TRADE 997.1 1,088.6 1,202.6 1,206.6
TOURISM 691.7 706.7 768.2 827.4
TRANSPORT, STORAGE & COMM. 390.4 430.0 442.3 445.8
BUSINESS & GENERAL SERVICES 1,513.4 1,678.6 1,790.0 1,933.1
GOVERNMENT SERVICES 1,053.7 1,066.4 1,106.5 1,153.2
Industry 2003 2004 2005 2006
TOTAL 100.0 100.0 100.0 100.0
AGRICULTURE 4.5 3.6 3.6 3.4
MINING & QUARRYING 0.7 0.8 0.9 1.0
MANUFACTURING 6.8 6.9 6.5 6.8
ELECTRICITY, GAS & WATER 3.3 3.1 3.4 3.7
CONSTRUCTION 5.4 5.6 6.6 6.8
WHOLESALE & RETAIL TRADE 17.0 17.5 17.9 17.0
TOURISM 11.8 11.4 11.4 11.6
TRANSPORT, STORAGE & COMM. 6.7 6.9 6.6 6.3
BUSINESS & GENERAL SERVICES 25.9 27.0 26.6 27.2
GOVERNMENT SERVICES 18.0 17.2 16.5 16.2
Table 4.4: Gross Domestic Product By Industry in Current Basic Prices
Table 4.4A: Gross Domestic Product By Industry in Current Basic Prices - Percentage Distribution
58

BARBADOS
EC$Mn EXPENDITURE GROUPS 2003 2004 2005 2006
GROSS DOMESTIC PRODUCT (Current Market Prices) 7,276.1 7,606.2 8,264.9 8,615.3
TOTAL CONSUMPTION 6,228.2 6,644.0 7,007.5 6,911.1
Private 4,542.8 5,024.7 5,261.3 5,074.8
General Government 1,685.5 1,619.3 1,746.2 1,836.4
GROSS CAPITAL FORMATION 1,505.7 1,800.5 2,015.6 2,294.8
Public Building Activity 158.1 83.2 71.7 82.6
Private Building Activity 570.6 732.1 960.6 1,050.6
Finished Capital Goods 784.8 972.8 970.2 1,148.0
Stock of Finished Goods -7.8 12.4 13.1 13.6
GOODS AND NON-FACTOR SERVICES -457.8 -838.4 -758.2 -590.6
Exports of Goods and Services 3,717.8 3,983.7 4,487.9 5,149.8
LESS: Imports of Goods and Services 4,175.6 4,822.1 5,246.1 5,740.5
EXPENDITURE GROUPS 2003 2004 2005 2006
GROSS DOMESTIC PRODUCT (Current Market Prices) 100.0 100.0 100.0 100.0
TOTAL CONSUMPTION 85.6 87.4 84.8 80.2
Private 62.4 66.1 63.7 58.9
General Government 23.2 21.3 21.1 21.3
GROSS CAPITAL FORMATION 20.7 23.7 24.4 26.6
Public Building Activity 2.2 1.1 0.9 1.0
Private Building Activity 7.8 9.6 11.6 12.2
Finished Capital Goods 10.8 12.8 11.7 13.3
Stock of Finished Goods -0.1 0.2 0.2 0.2
GOODS AND NON-FACTOR SERVICES -6.3 -11.0 -9.2 -6.9
Exports of Goods and Services 51.1 52.4 54.3 59.8
LESS: Imports of Goods and Services 57.4 63.4 63.5 66.6
Table 4.5: Expenditure on Gross Domestic Product in Current Prices
Table 4.5A: Expenditure on Gross Domestic Product in Current Prices - Percentage Distribution
59
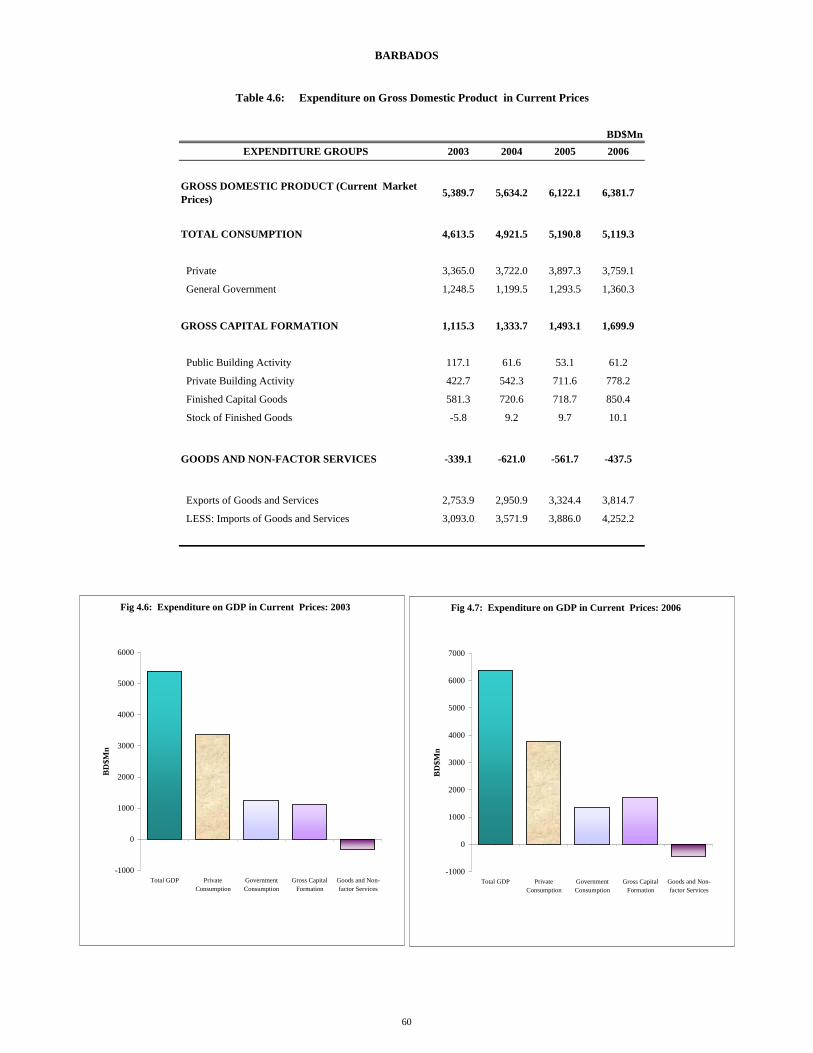
BARBADOS
BD$MnEXPENDITURE GROUPS 2003 2004 2005 2006
GROSS DOMESTIC PRODUCT (Current Market Prices) 5,389.7 5,634.2 6,122.1 6,381.7
TOTAL CONSUMPTION 4,613.5 4,921.5 5,190.8 5,119.3
Private 3,365.0 3,722.0 3,897.3 3,759.1
General Government 1,248.5 1,199.5 1,293.5 1,360.3
GROSS CAPITAL FORMATION 1,115.3 1,333.7 1,493.1 1,699.9
Public Building Activity 117.1 61.6 53.1 61.2
Private Building Activity 422.7 542.3 711.6 778.2
Finished Capital Goods 581.3 720.6 718.7 850.4
Stock of Finished Goods -5.8 9.2 9.7 10.1
GOODS AND NON-FACTOR SERVICES -339.1 -621.0 -561.7 -437.5
Exports of Goods and Services 2,753.9 2,950.9 3,324.4 3,814.7
LESS: Imports of Goods and Services 3,093.0 3,571.9 3,886.0 4,252.2
Table 4.6: Expenditure on Gross Domestic Product in Current Prices
Fig 4.6: Expenditure on GDP in Current Prices: 2003
-1000
0
1000
2000
3000
4000
5000
6000
Total GDP PrivateConsumption
GovernmentConsumption
Gross CapitalFormation
Goods and Non-factor Services
BD
$Mn
Fig 4.7: Expenditure on GDP in Current Prices: 2006
-1000
0
1000
2000
3000
4000
5000
6000
7000
Total GDP PrivateConsumption
GovernmentConsumption
Gross CapitalFormation
Goods and Non-factor Services
BD
$Mn
60


BELIZE
EC$Mn
Industry 2003 2004 2005 2006
TOTAL 2,324.3 2,445.3 2,541.2 2,665.4
AGRICULTURE 286.7 320.8 318.1 320.9
FORESTRY & LOGGING 13.8 14.9 16.6 16.6
FISHING 171.2 180.6 198.3 167.0
MINING & QUARRYING 11.9 12.6 11.7 11.9
MANUFACTURING 213.6 239.9 242.9 328.6
ELECTRICITY & WATER 88.2 86.8 86.4 119.2
CONSTRUCTION 96.5 100.8 97.2 90.9
TRADE, HOTELS & RESTAURANTS 518.3 526.4 554.4 569.4
TRANSPORT & COMMUNICATIONS 258.5 271.4 295.5 313.3
FINANCE & INSURANCE 232.9 245.4 259.1 266.2
REAL ESTATE & BUS. SERVICES 166.1 175.4 193.1 207.5
PUBLIC ADMINISTRATION 260.1 263.7 267.3 255.0
COMMUNITY & OTHER SERVICES 138.0 143.5 150.8 155.9LESS: FINANCIAL SERVICES INDIRECTLY MEASURED 131.4 136.8 150.1 157.0
Industry 2003 2004 2005 2006
TOTAL 9.4 5.2 3.9 4.9
AGRICULTURE 15.5 11.9 -0.8 0.9
FORESTRY & LOGGING -5.6 7.8 11.8 0.0
FISHING 110.3 5.5 9.8 -15.8
MINING & QUARRYING 0.0 5.7 -6.5 1.1
MANUFACTURING -0.5 12.3 1.2 35.3
ELECTRICITY & WATER 8.5 -1.5 -0.5 38.0
CONSTRUCTION -17.8 4.5 -3.6 -6.5
TRADE, HOTELS & RESTAURANTS 3.8 1.6 5.3 2.7
TRANSPORT & COMMUNICATIONS 8.6 5.0 8.9 6.0
FINANCE & INSURANCE 31.6 5.4 5.6 2.8
REAL ESTATE & BUS. SERVICES 1.1 5.6 10.1 7.5
PUBLIC ADMINISTRATION 6.3 1.3 1.4 -4.6
COMMUNITY & OTHER SERVICES 5.7 4.0 5.1 3.4LESS: FINANCIAL SERVICES INDIRECTLY MEASURED 32.6 4.1 9.8 4.6
Table 5.1: Gross Domestic Product By Industry in Constant 2000 Basic Prices
Table 5.1A: Gross Domestic Product By Industry in Constant 2000 Basic Prices- Percentage Change
63

BELIZE
BZ$MnIndustry 2003 2004 2005 2006
TOTAL 1,721.7 1,811.3 1,882.4 1,974.4
AGRICULTURE 212.4 237.6 235.6 237.7
FORESTRY & LOGGING 10.2 11.0 12.3 12.3
FISHING 126.8 133.8 146.9 123.7
MINING & QUARRYING 8.8 9.3 8.7 8.8
MANUFACTURING 158.2 177.7 179.9 243.4
ELECTRICITY & WATER 65.3 64.3 64.0 88.3
CONSTRUCTION 71.5 74.7 72.0 67.3
TRADE, HOTELS & RESTAURANTS 383.9 389.9 410.7 421.8
TRANSPORT & COMMUNICATIONS 191.5 201.0 218.9 232.1
FINANCE & INSURANCE 172.5 181.8 191.9 197.2
REAL ESTATE & BUS. SERVICES 123.0 129.9 143.0 153.7
PUBLIC ADMINISTRATION 192.7 195.3 198.0 188.9
COMMUNITY & OTHER SERVICES 102.2 106.3 111.7 115.5LESS: FINANCIAL SERVICES INDIRECTLY MEASURED 97.3 101.3 111.2 116.3
Table 5.2: Gross Domestic Product By Industry in Constant 2000 Basic Prices
Fig 5.1: GDP by Industry in Constant 2000 Basic Prices - Percentage Change
-5.0
0.0
5.0
10.0
15.0
20.0
25.0
30.0
35.0
40.0
2003 2004 2005 2006
Perc
ent
TOTAL AGRICULTURE MANUFACTURING SERVICES
64

BELIZE
Industry 2003 2004 2005 2006
TOTAL 100.0 100.0 100.0 100.0
AGRICULTURE 12.3 13.1 12.5 12.0
FORESTRY & LOGGING 0.6 0.6 0.7 0.6
FISHING 7.4 7.4 7.8 6.3
MINING & QUARRYING 0.5 0.5 0.5 0.4
MANUFACTURING 9.2 9.8 9.6 12.3
ELECTRICITY & WATER 3.8 3.5 3.4 4.5
CONSTRUCTION 4.2 4.1 3.8 3.4
TRADE, HOTELS & RESTAURANTS 22.3 21.5 21.8 21.4
TRANSPORT & COMMUNICATIONS 11.1 11.1 11.6 11.8
FINANCE & INSURANCE 10.0 10.0 10.2 10.0
REAL ESTATE & BUS. SERVICES 7.1 7.2 7.6 7.8
PUBLIC ADMINISTRATION 11.2 10.8 10.5 9.6
COMMUNITY & OTHER SERVICES 5.9 5.9 5.9 5.8LESS: FINANCIAL SERVICES INDIRECTLY MEASURED 5.7 5.6 5.9 5.9
Table 5.2A: Gross Domestic Product By Industry in Constant 2000 Basic Prices - Percentage Distribution
Fig 5.2: GDP By Industry in Constant 2000 Basic Prices - Percentage Distribution, 2003
12.3
9.2
22.3
11.1
11.2
33.9
AGRICULTURE MANUFACTURING TRADE, HOTELS & RESTAURANTS TRANSPORT & COMMUNICATIONS PUBLIC ADMINISTRATIONOTHER
Fig 5.3: GDP By Industry in Constant 2000 Basic Prices - Percentage
Distribution, 2006
12.0
12.3
21.4 11.8
9.6
32.9
AGRICULTURE MANUFACTURING TRADE, HOTELS & RESTAURANTS TRANSPORT & COMMUNICATIONS PUBLIC ADMINISTRATIONOTHER
65

BELIZE
BZ$MnIndustry 2003 2004 2005 2006
TOTAL 1,693.0 1,811.0 1,917.0 2,090.9
AGRICULTURE 174.8 195.4 197.7 206.8
FORESTRY & LOGGING 10.7 11.4 13.1 13.1
FISHING 98.0 93.5 84.0 73.8
MINING & QUARRYING 9.2 9.8 9.4 9.5
MANUFACTURING 153.7 164.9 174.9 258.1
ELECTRICITY & WATER 59.7 64.7 69.3 88.4
CONSTRUCTION 75.3 82.4 82.3 85.6
TRADE 305.1 304.7 327.7 352.3
HOTELS & RESTAURANTS 83.6 97.5 103.5 107.1
TRANSPORT & COMMUNICATIONS 204.5 225.5 247.3 253.0
FINANCE & INSURANCE 163.7 173.1 181.3 188.1
REAL ESTATE & BUS. SERVICES 129.3 141.5 161.0 179.8
PUBLIC ADMINISTRATION 206.2 214.9 230.2 238.3
COMMUNITY & OTHER SERVICES 110.5 126.3 139.0 147.6LESS: FINANCIAL SERVICES INDIRECTLY MEASURED 91.3 94.6 103.7 110.6
Industry 2003 2004 2005 2006
TOTAL 6.4 7.0 5.9 9.1
AGRICULTURE 7.8 11.8 1.2 4.6
FORESTRY & LOGGING -1.8 6.5 14.9 0.0
FISHING 54.3 -4.6 -10.2 -12.1
MINING & QUARRYING 2.2 6.5 -4.1 1.1
MANUFACTURING -0.3 7.3 6.1 47.6
ELECTRICITY & WATER -6.9 8.4 7.1 27.6
CONSTRUCTION -15.0 9.4 -0.1 4.0
TRADE, HOTELS & RESTAURANTS 1.1 -0.1 7.5 7.5
TRANSPORT & COMMUNICATIONS 2.7 10.3 9.7 2.3
FINANCE & INSURANCE 22.8 5.7 4.7 3.8
REAL ESTATE & BUS. SERVICES 3.5 9.4 13.8 11.7
PUBLIC ADMINISTRATION 9.9 4.2 7.1 3.5
COMMUNITY & OTHER SERVICES 13.2 14.3 10.1 6.2LESS: FINANCIAL SERVICES INDIRECTLY MEASURED 22.7 3.6 9.6 6.7
Table 5.3A: Gross Domestic Product By Industry in Current Basic Prices- Percentage Change
Table 5.3: Gross Domestic Product By Industry in Current Basic Prices
66

BELIZE
Fig 5.5: GDP in Current and Constant 2000 Basic Prices
0
500
1000
1500
2000
2500
2003 2004 2005 2006
$BZ
Mn
CONSTANT 2000 BASIC PRICES CURRENT BASIC PRICES
Fig 5.4: GDP by Industry in Current Basic Prices - Percentage Change (based on $BZ Mn)
-10.0
0.0
10.0
20.0
30.0
40.0
50.0
2003 2004 2005 2006
Perc
ent
TOTAL AGRICULTURE MANUFACTURING SERVICES
67

BELIZE
EC$MnIndustry 2003 2004 2005 2006
TOTAL 2,285.6 2,444.9 2,588.0 2,822.7
AGRICULTURE 236.0 263.8 266.9 279.2
FORESTRY & LOGGING 14.4 15.4 17.7 17.7
FISHING 132.3 126.2 113.4 99.6
MINING & QUARRYING 12.4 13.2 12.7 12.8
MANUFACTURING 207.5 222.6 236.1 348.4
ELECTRICITY & WATER 80.6 87.3 93.6 119.3
CONSTRUCTION 101.7 111.2 111.1 115.6
TRADE, HOTELS & RESTAURANTS 524.7 543.0 582.1 620.2
TRANSPORT & COMMUNICATIONS 276.1 304.4 333.9 341.6
FINANCE & INSURANCE 221.0 233.7 244.8 253.9
REAL ESTATE & BUS. SERVICES 174.6 191.0 217.4 242.7
PUBLIC ADMINISTRATION 278.4 290.1 310.8 321.7
COMMUNITY & OTHER SERVICES 149.2 170.5 187.7 199.3LESS: FINANCIAL SERVICES INDIRECTLY MEASURED 123.3 127.7 140.0 149.3
Industry 2003 2004 2005 2006
TOTAL 100.0 100.0 100.0 100.0
AGRICULTURE 10.3 10.8 10.3 9.9
FORESTRY & LOGGING 0.6 0.6 0.7 0.6
FISHING 5.8 5.2 4.4 3.5
MINING & QUARRYING 0.5 0.5 0.5 0.5
MANUFACTURING 9.1 9.1 9.1 12.3
ELECTRICITY & WATER 3.5 3.6 3.6 4.2
CONSTRUCTION 4.4 4.5 4.3 4.1
TRADE, HOTELS & RESTAURANTS 23.0 22.2 22.5 22.0
TRANSPORT & COMMUNICATIONS 12.1 12.5 12.9 12.1
FINANCE & INSURANCE 9.7 9.6 9.5 9.0
REAL ESTATE & BUS. SERVICES 7.6 7.8 8.4 8.6
PUBLIC ADMINISTRATION 12.2 11.9 12.0 11.4
COMMUNITY & OTHER SERVICES 6.5 7.0 7.3 7.1LESS: FINANCIAL SERVICES INDIRECTLY MEASURED 5.4 5.2 5.4 5.3
Table 5.4A: Gross Domestic Product By Industry in Current Basic Prices- Percentage Distribution
Table 5.4: Gross Domestic Product By Industry in Current Basic Prices
68

BELIZE
EC$MnEXPENDITURE GROUPS 2003 2004 2005 2006
GROSS DOMESTIC PRODUCT (Current Market Prices) 2,666.5 2,848.9 3,010.0 3,276.6
TOTAL CONSUMPTION 2,454.8 2,537.3 2,590.1 2,581.2
Private 2,063.9 2,138.5 2,154.6 2,135.3
General Government 391.0 398.8 435.5 445.9
GROSS CAPITAL FORMATION 548.0 558.4 588.3 633.8
Gross Fixed Capital Formation 506.0 503.8 557.0 622.4
Increase in Stocks 42.0 54.5 31.3 11.5
GOODS AND NON-FACTOR SERVICES -340.9 -226.9 -241.7 54.4
Exports of Goods and Services 1,422.2 1,444.4 1,644.4 2,081.0
Imports of Goods and Services 1,763.1 1,671.3 1,886.1 2,026.6
Discrepancy 1 4.6 -19.8 73.2 7.2
EXPENDITURE GROUPS 2003 2004 2005 2006
GROSS DOMESTIC PRODUCT (Current Market Prices) 100.0 100.0 100.0 100.0
TOTAL CONSUMPTION 92.1 89.1 86.1 78.8
Private 77.4 75.1 71.6 65.2
General Government 14.7 14.0 14.5 13.6
GROSS CAPITAL FORMATION 20.5 19.6 19.5 19.3
Gross Fixed Capital Formation 19.0 17.7 18.5 19.0
Increase in Stocks 1.6 1.9 1.0 0.4
GOODS AND NON-FACTOR SERVICES -12.8 -8.0 -8.0 1.7
Exports of Goods and Services 53.3 50.7 54.6 63.5
Imports of Goods and Services 66.1 58.7 62.7 61.9
Discrepancy 1 0.2 -0.7 2.4 0.2
Table 5.5: Expenditure on Gross Domestic Product in Current Prices
Table 5.5A: Expenditure on Gross Domestic Product in Current Prices - Percentage Distribution
69

BELIZE
BZ$MnEXPENDITURE GROUPS 2003 2004 2005 2006
GROSS DOMESTIC PRODUCT (Current Market Prices) 1,975.2 2,110.3 2,229.6 2,427.1
TOTAL CONSUMPTION 1,818.4 1,879.5 1,918.6 1,912.0
Private 1,528.8 1,584.1 1,596.0 1,581.7
General Government 289.6 295.4 322.6 330.3
GROSS CAPITAL FORMATION 405.9 413.6 435.8 469.5
Gross Fixed Capital Formation 374.8 373.2 412.6 461.0
Increase in Stocks 31.1 40.4 23.2 8.5
GOODS AND NON-FACTOR SERVICES -252.5 -168.1 -179.0 40.3
Exports of Goods and Services 1,053.5 1,069.9 1,218.1 1,541.5
Imports of Goods and Services 1,306.0 1,238.0 1,397.1 1,501.2
Discrepancy 1 3.4 -14.7 54.2 5.3
1 - negative figure indicates expenditure approach yields a higher estimate of GDP than the production approach
Table 5.6: Expenditure on Gross Domestic Product in Current Prices
Fig 5.6: Expenditure on GDP in Current Prices: 2003
-500
0
500
1000
1500
2000
2500
Total GDP PrivateConsumption
GovernmentConsumption
Gross CapitalFormation
Goods and Non-factor Services
EC
$Mn
Fig 5.7: Expenditure on GDP in Current Prices: 2006
0
500
1000
1500
2000
2500
3000
Total GDP PrivateConsumption
GovernmentConsumption
Gross CapitalFormation
Goods and Non-factor Services
EC
$Mn
70


DOMINICA
EC$Mn
Industry 2003 2004 2005 2006
TOTAL 566.0 583.3 602.7 626.7
AGRICULTURE 100.9 104.4 104.0 107.5
MINING & QUARRYING 4.2 4.4 4.6 4.9
MANUFACTURING 46.4 47.7 47.9 46.9
ELECTRICITY & WATER 34.6 36.4 38.7 40.4
CONSTRUCTION 42.3 43.7 45.2 49.0
W/SALE & RETAIL TRADE 70.6 73.0 76.6 79.3
HOTELS & RESTAURANTS 14.7 16.4 17.5 20.1
TRANSPORT 50.4 55.5 55.6 59.4
COMMUNICATIONS 32.3 33.5 36.3 38.2
BANKS & INSURANCE 66.2 69.6 76.1 80.6
REAL ESTATE & HOUSING 21.7 22.1 22.9 23.9
GOVERNMENT SERVICES 129.1 128.1 127.6 129.6
OTHER SERVICES 10.0 10.3 10.9 11.3
LESS: FISIM 50.6 54.9 56.1 60.0
STATISTICAL DISCREPANCY1 -6.9 -6.9 -5.2 -4.5
Industry 2003 2004 2005 2006
TOTAL 0.1 3.0 3.3 4.0
AGRICULTURE -3.4 3.5 -0.4 3.4
MINING & QUARRYING 11.5 4.0 3.5 8.4
MANUFACTURING 0.9 2.8 0.4 -2.0
ELECTRICITY & WATER -1.9 5.2 6.4 4.3
CONSTRUCTION 11.4 3.3 3.5 8.5
W/SALE & RETAIL TRADE 3.4 3.3 5.0 3.5
HOTELS & RESTAURANTS -3.1 11.7 6.5 15.0
TRANSPORT 6.3 10.0 0.3 6.7
COMMUNICATIONS -26.5 3.5 8.5 5.3
BANKS & INSURANCE 3.6 5.2 9.2 6.0
REAL ESTATE & HOUSING 2.0 2.0 3.6 4.5
GOVERNMENT SERVICES -2.0 -0.7 -0.4 1.5
OTHER SERVICES -1.9 2.7 6.3 3.1
LESS: FISIM -16.0 8.4 2.2 7.0
Table 6.1: Gross Value Added By Industry in Constant 2000 Basic Prices
Table 6.1A: Gross Value Added By Industry in Constant 2000 Basic Prices - Percentage Change
Note: 1 Refers to statistical discrepancy which arose due to shifting of the base year from 1990 to a common base year across all Member States, 2000.
73

DOMINICA
EC$Mn
Industry 2003 2004 2005 2006
TOTAL 415.6 428.2 442.5 460.1
AGRICULTURE 73.5 76.1 75.8 78.3
MINING & QUARRYING 3.0 3.1 3.2 3.5
MANUFACTURING 26.7 27.4 27.5 27.0
ELECTRICITY & WATER 20.1 21.1 22.5 23.4
CONSTRUCTION 30.0 30.9 32.0 34.7
W/SALE & RETAIL TRADE 56.9 58.8 61.7 63.9
HOTELS & RESTAURANTS 10.2 11.3 12.1 13.9
TRANSPORT 39.0 42.9 43.1 46.0
COMMUNICATIONS 35.9 37.2 40.4 42.5
BANKS & INSURANCE 55.2 58.1 63.4 67.2
REAL ESTATE & HOUSING 16.3 16.6 17.2 18.0
GOVERNMENT SERVICES 87.0 86.3 86.0 87.3
OTHER SERVICES 6.3 6.5 6.9 7.1
LESS: FISIM 44.4 48.2 49.2 52.6
Table 6.2: Gross Value Added By Industry in Constant 1990 Basic Prices
Fig 6.1: GVA by Industry in Constant 2000 Basic Prices - Percentage Change
-4.0
-3.0
-2.0
-1.0
0.0
1.0
2.0
3.0
4.0
5.0
6.0
2003 2004 2005 2006
Perc
ent
TOTAL AGRICULTURE MANUFACTURING SERVICES
74

DOMINICA
Industry 2003 2004 2005 2006
TOTAL 100.0 100.0 100.0 100.0
AGRICULTURE 17.7 17.8 17.1 17.0
MINING & QUARRYING 0.7 0.7 0.7 0.8
MANUFACTURING 6.4 6.4 6.2 5.9
ELECTRICITY & WATER 4.8 4.9 5.1 5.1
CONSTRUCTION 7.2 7.2 7.2 7.6
W/SALE & RETAIL TRADE 13.7 13.7 13.9 13.9
HOTELS & RESTAURANTS 2.4 2.6 2.7 3.0
TRANSPORT 9.4 10.0 9.7 10.0
COMMUNICATIONS 8.6 8.7 9.1 9.2
BANKS & INSURANCE 13.3 13.6 14.3 14.6
REAL ESTATE & HOUSING 3.9 3.9 3.9 3.9
GOVERNMENT SERVICES 20.9 20.2 19.4 19.0
OTHER SERVICES 1.5 1.5 1.6 1.5
LESS: FISIM 10.7 11.2 11.1 11.4
Table 6.2A: Gross Value Added By Industry in Constant 1990 Basic Prices - Percentage Distribution
Fig.6.2: GVA By Industry in Constant 1990 Basic Prices - Percentage Distribution, 2003
17.7
13.7
8.6
13.3
20.9
25.8
AGRICULTURE W/SALE & RETAIL TRADE COMMUNICATIONS BANKS & INSURANCE GOVERNMENT SERVICESOTHER SECTORS
Fig. 6.3: GVA By Industry in Constant 1990 Basic Prices - Percentage
Distribution, 2006
17.0
13.9
9.2
14.6
19.0
26.3
AGRICULTURE W/SALE & RETAIL TRADE COMMUNICATIONS BANKS & INSURANCE GOVERNMENT SERVICESOTHER SECTORS
75

DOMINICA
EC$Mn
Industry 2003 2004 2005 2006
TOTAL 581.1 611.4 641.3 671.1
AGRICULTURE 106.2 114.5 115.2 118.4
MINING & QUARRYING 4.6 5.2 5.8 6.4
MANUFACTURING 46.5 50.8 51.9 52.6
ELECTRICITY & WATER 36.9 39.3 41.3 38.4
CONSTRUCTION 46.0 50.7 56.1 62.0
W/SALE & RETAIL TRADE 73.2 77.4 82.6 87.7
HOTELS & RESTAURANTS 15.1 17.7 18.8 21.6
TRANSPORT 48.8 54.9 56.6 63.3
COMMUNICATIONS 26.1 27.0 28.4 29.3
BANKS & INSURANCE 65.6 69.1 76.2 80.8
REAL ESTATE & HOUSING 22.3 22.7 23.7 24.2
GOVERNMENT SERVICES 127.8 123.7 126.3 131.4
OTHER SERVICES 10.4 10.9 11.8 12.4
LESS: FISIM 48.3 52.4 53.5 57.3
Industry 2003 2004 2005 2006
TOTAL 100.0 100.0 100.0 100.0
AGRICULTURE 18.3 18.7 18.0 17.6
MINING & QUARRYING 0.8 0.9 0.9 1.0
MANUFACTURING 8.0 8.3 8.1 7.8
ELECTRICITY & WATER 6.3 6.4 6.4 5.7
CONSTRUCTION 7.9 8.3 8.8 9.2
W/SALE & RETAIL TRADE 12.6 12.7 12.9 13.1
HOTELS & RESTAURANTS 2.6 2.9 2.9 3.2
TRANSPORT 8.4 9.0 8.8 9.4
COMMUNICATIONS 4.5 4.4 4.4 4.4
BANKS & INSURANCE 11.3 11.3 11.9 12.0
REAL ESTATE & HOUSING 3.8 3.7 3.7 3.6
GOVERNMENT SERVICES 22.0 20.2 19.7 19.6
OTHER SERVICES 1.8 1.8 1.8 1.8
LESS: FISIM 8.3 8.6 8.3 8.5
Table 6.3 : Gross Value Added By Industry in Current Basic Prices
Table 6.3A: Gross Value Added By Industry in Current Basic Prices - Percentage Distribution
76

DOMINICA
Industry 2003 2004 2005 2006
TOTAL 1.0 5.2 4.9 4.7
AGRICULTURE 4.1 7.8 0.6 2.8
MINING & QUARRYING 17.3 13.5 10.7 10.6
MANUFACTURING 4.4 9.2 2.1 1.3
ELECTRICITY & WATER 0.0 6.6 5.0 -7.0
CONSTRUCTION 17.6 10.1 10.7 10.5
W/SALE & RETAIL TRADE 5.0 5.8 6.7 6.2
HOTELS & RESTAURANTS -2.7 17.3 6.5 15.0
TRANSPORT 7.8 12.5 3.1 11.7
COMMUNICATIONS -34.2 3.5 5.5 3.0
BANKS & INSURANCE 1.2 5.3 10.4 6.0
REAL ESTATE & HOUSING 2.0 2.0 4.5 2.0
GOVERNMENT SERVICES -3.9 -3.2 2.1 4.0
OTHER SERVICES -0.4 5.0 8.1 5.0
LESS: FISIM -6.2 8.4 2.2 7.0
Table 6.3B: Gross Value Added By Industry in Current Basic Prices - Percentage Change
Fig 6.4: GVA by Industry in Current Basic Prices - Percentage Change
-2.0
0.0
2.0
4.0
6.0
8.0
10.0
2003 2004 2005 2006
Perc
ent
TOTAL AGRICULTURE
MANUFACTURING SERVICES
77

DOMINICA
EC$Mn
EXPENDITURE GROUPS 2003 2004 2005 2006
GROSS DOMESTIC PRODUCT (Current Market Prices) 709.7 770.1 808.0 856.5
TOTAL CONSUMPTION 637.9 677.9 756.1 756.1
Private 502.8 538.2 604.2 595.0 General Government 135.1 139.7 151.9 161.1
GROSS CAPITAL FORMATION 177.6 210.0 232.1 247.4
Land Development - - - - Transport Equipment 24.0 26.6 42.5 38.9 Other Equipment 50.1 65.9 63.3 68.9 Construction 103.6 117.5 126.3 139.5 Increase in Stocks - - - -
GOODS AND NON-FACTOR SERVICES -105.9 -117.8 -180.3 -147.0
Exports of Goods 110.0 115.9 115.9 119.5 Exports of Non-Factor Services 209.0 236.4 233.4 270.5 Imports of Goods 304.0 345.0 394.0 396.6 Imports of Non Factor Services 120.8 125.1 135.5 140.4
Table 6.4: Expenditure on Gross Domestic Product in Current Prices
Fig 6.5: GVA in Current and Constant 1990 Basic Prices
0
100
200
300
400
500
600
700
800
2003 2004 2005 2006
$EC
Mn
CONSTANT 1990 BASIC PRICES CURRENT BASIC PRICES
78

DOMINICA
EXPENDITURE GROUPS 2003 2004 2005 2006
GROSS DOMESTIC PRODUCT (Current Market Prices) 100.0 100.0 100.0 100.0
TOTAL CONSUMPTION 89.9 88.0 93.6 88.3
Private 70.8 69.9 74.8 69.5 General Government 19.0 18.1 18.8 18.8
GROSS CAPITAL FORMATION 25.0 27.3 28.7 28.9
Land Development - - - - Transport Equipment 3.4 3.5 5.3 4.5 Other Equipment 7.1 8.6 7.8 8.0 Construction 14.6 15.3 15.6 16.3 Increase in Stocks - - - -
GOODS AND NON-FACTOR SERVICES -14.9 -15.3 -22.3 -17.2
Exports of Goods 15.5 15.0 14.3 14.0 Exports of Non-Factor Services 29.4 30.7 28.9 31.6 Imports of Goods 42.8 44.8 48.8 46.3 Imports of Non Factor Services 17.0 16.3 16.8 16.4
Table 6.4A: Expenditure on Gross Domestic Product in Current Prices -Percentage Distribution
Fig 6.6: Expenditure on GDP in Current Prices: 2003
-200
-100
0
100
200
300
400
500
600
700
800
Total GDP PrivateConsumption
GovernmentConsumption
Gross CapitalFormation
Goods and Non-factor Services
EC
$Mn
Fig 6.7: Expenditure on GDP in Current Prices: 2006
-200
0
200
400
600
800
1000
Total GDP PrivateConsumption
GovernmentConsumption
Gross CapitalFormation
Goods and Non-factor Services
EC
$Mn
79

80


GRENADA
EC$Mn
Industry 2003 2004 2005 2006
TOTAL 1011.8 954.1 1059.3 1034.3
AGRICULTURE 83.2 77.0 45.2 57.9
MINING & QUARRYING 7.2 6.1 6.6 9.3
MANUFACTURING 59.6 49.9 58.3 56.7
ELECTRICITY & WATER 54.7 50.4 52.7 59.6
CONSTRUCTION 99.8 105.4 193.1 134.9
W/SALE & RETAIL TRADE 100.7 80.7 107.5 89.6
HOTELS & RESTAURANTS 96.4 83.8 48.2 72.5
TRANSPORT 135.8 149.6 179.2 154.2
COMMUNICATIONS 68.1 56.8 71.2 75.6
BANKS & INSURANCE 108.9 110.0 108.7 110.0
REAL ESTATE & HOUSING 31.6 28.4 27.2 29.9
GOVERNMENT SERVICES 160.1 164.1 156.6 165.2
OTHER SERVICES 103.8 106.4 116.4 122.1
LESS: FISIM 86.0 91.0 91.5 90.4
STATISTICAL DISCREPANCY1 -12.1 -23.4 -20.1 -13.0
Industry 2003 2004 2005 2006
TOTAL 7.1 -5.7 11.0 -2.4
AGRICULTURE 2.0 -7.5 -41.2 28.1
MINING & QUARRYING 40.4 -15.3 9.0 41.0
MANUFACTURING -2.5 -16.3 16.9 -2.8
ELECTRICITY & WATER 6.7 -7.9 4.7 13.0
CONSTRUCTION 26.0 5.7 83.1 -30.1
W/SALE & RETAIL TRADE 7.4 -19.9 33.3 -16.7
HOTELS & RESTAURANTS 13.8 -13.1 -42.5 50.6
TRANSPORT 7.5 10.1 19.8 -14.0
COMMUNICATIONS 1.9 -16.6 25.4 6.1
BANKS & INSURANCE 8.0 1.0 -1.1 1.2
REAL ESTATE & HOUSING 1.5 -10.0 -4.3 10.0
GOVERNMENT SERVICES 2.9 2.5 -4.5 5.5
OTHER SERVICES 11.1 2.5 9.4 5.0
LESS: FISIM 8.0 5.9 0.5 -1.3
Table 7.1: Gross Value Added By Industry in Constant 2000 Basic Prices
Table 7.1A: Gross Value Added By Industry in Constant 2000 Basic Prices - Percentage Change
Note: 1 Refers to statistical discrepancy which arose due to shifting of the base year from 1990 to a common base year across all Member States, 2000.
83

GRENADA
EC$Mn
Industry 2003 2004 2005 2006
TOTAL 783.0 738.2 819.7 800.3
AGRICULTURE 67.7 62.7 36.8 47.2
MINING & QUARRYING 6.2 5.2 5.7 8.0
MANUFACTURING 52.1 43.6 51.0 49.6
ELECTRICITY & WATER 43.0 39.6 41.5 46.9
CONSTRUCTION 67.5 71.4 130.7 91.3
W/SALE & RETAIL TRADE 81.6 65.4 87.1 72.6
HOTELS & RESTAURANTS 61.6 53.5 30.8 46.3
TRANSPORT 94.8 104.4 125.1 107.6
COMMUNICATIONS 85.6 71.4 89.5 94.9
BANKS & INSURANCE 85.2 86.0 85.1 86.1
REAL ESTATE & HOUSING 28.9 26.0 24.9 27.3
GOVERNMENT SERVICES 100.0 102.5 97.8 103.2
OTHER SERVICES 80.0 82.0 89.7 94.1
LESS: FISIM 71.1 75.4 75.7 74.8
Table 7.2: Gross Value Added By Industry in Constant 1990 Basic Prices
Fig 7.1: GVA by Industry in Constant 2000 Basic Prices - Percentage Change
-50.0
-40.0
-30.0
-20.0
-10.0
0.0
10.0
20.0
30.0
40.0
2003 2004 2005 2006
Perc
ent
TOTAL AGRICULTURE MANUFACTURING SERVICES
84

GRENADA
Industry 2003 2004 2005 2006
TOTAL 100.0 100.0 100.0 100.0
AGRICULTURE 8.7 8.5 4.5 5.9
MINING & QUARRYING 0.8 0.7 0.7 1.0
MANUFACTURING 6.6 5.9 6.2 6.2
ELECTRICITY & WATER 5.5 5.4 5.1 5.9
CONSTRUCTION 8.6 9.7 15.9 11.4
W/SALE & RETAIL TRADE 10.4 8.9 10.6 9.1
HOTELS & RESTAURANTS 7.9 7.3 3.8 5.8
TRANSPORT 12.1 14.1 15.3 13.4
COMMUNICATIONS 10.9 9.7 10.9 11.9
BANKS & INSURANCE 10.9 11.7 10.4 10.8
REAL ESTATE & HOUSING 3.7 3.5 3.0 3.4
GOVERNMENT SERVICES 12.8 13.9 11.9 12.9
OTHER SERVICES 10.2 11.1 10.9 11.8
LESS: FISIM 9.1 10.2 9.2 9.3
Table 7.2A: Gross Value Added By Industry in Constant 1990 Basic Prices - Percentage Distribution
Fig 7.2: GVA by Industry in Constant 1990 Basic Prices - Percentage
Distribution, 2003
10.4
12.1
10.9
10.9
12.8
42.9
W/SALE & RETAIL TRADE TRANSPORT COMMUNICATIONS BANKS & INSURANCE GOVERNMENT SERVICESOTHER SECTORS
.
Fig 7.3: GVA By Industry in Constant 1990 Basic Prices - Percentage
Distribution, 2006
9.1
13.4
11.9
10.8
12.942.0
W/SALE & RETAIL TRADE TRANSPORT COMMUNICATIONS BANKS & INSURANCE GOVERNMENT SERVICESOTHER SECTORS
85

GRENADA
EC$Mn
Industry 2003 2004 2005 2006
TOTAL 1062.8 1047.1 1224.6 1242.7
AGRICULTURE 94.3 81.3 57.8 71.6
MINING & QUARRYING 7.2 6.1 6.6 9.3
MANUFACTURING 60.7 53.0 64.3 65.7
ELECTRICITY & WATER 62.6 58.4 62.3 70.7
CONSTRUCTION 102.3 109.7 226.4 172.5
W/SALE & RETAIL TRADE 107.8 88.4 121.8 114.5
HOTELS & RESTAURANTS 85.4 76.0 45.5 78.2
TRANSPORT 132.7 148.2 184.6 178.0
COMMUNICATIONS 62.7 55.8 70.0 70.6
BANKS & INSURANCE 115.5 116.7 115.3 117.9
REAL ESTATE & HOUSING 33.8 30.4 29.9 33.7
GOVERNMENT SERVICES 171.0 193.8 192.9 206.0
OTHER SERVICES 118.5 126.4 144.8 157.5
LESS: FISIM 91.7 97.1 97.6 103.6
Industry 2003 2004 2005 2006
TOTAL 100.0 100.0 100.0 100.0
AGRICULTURE 8.9 7.8 4.7 5.8
MINING & QUARRYING 0.7 0.6 0.5 0.8
MANUFACTURING 5.7 5.1 5.3 5.3
ELECTRICITY & WATER 5.9 5.6 5.1 5.7
CONSTRUCTION 9.6 10.5 18.5 13.9
W/SALE & RETAIL TRADE 10.1 8.4 9.9 9.2
HOTELS & RESTAURANTS 8.0 7.3 3.7 6.3
TRANSPORT 12.5 14.2 15.1 14.3
COMMUNICATIONS 5.9 5.3 5.7 5.7
BANKS & INSURANCE 10.9 11.1 9.4 9.5
REAL ESTATE & HOUSING 3.2 2.9 2.4 2.7
GOVERNMENT SERVICES 16.1 18.5 15.8 16.6
OTHER SERVICES 11.2 12.1 11.8 12.7
LESS: FISIM 8.6 9.3 8.0 8.3
Table 7.3A: Gross Value Added By Industry in Current Basic Prices - Percentage Distribution
Table 7.3: Gross Value Added By Industry in Current Basic Prices
86

GRENADA
Industry 2003 2004 2005 2006
TOTAL 8.5 -1.5 17.0 1.5
AGRICULTURE 1.7 -13.7 -28.9 23.8
MINING & QUARRYING 40.6 -15.5 9.2 40.8
MANUFACTURING -2.6 -12.6 21.4 2.1
ELECTRICITY & WATER 2.6 -6.6 6.6 13.5
CONSTRUCTION 26.5 7.2 106.4 -23.8
W/SALE & RETAIL TRADE 9.7 -18.0 37.8 -6.0
HOTELS & RESTAURANTS 16.3 -11.1 -40.1 72.0
TRANSPORT 8.0 11.7 24.5 -3.6
COMMUNICATIONS -3.7 -11.0 25.4 1.0
BANKS & INSURANCE 15.8 1.0 -1.1 2.2
REAL ESTATE & HOUSING 3.7 -10.0 -1.9 12.7
GOVERNMENT SERVICES 4.9 13.3 -0.5 6.8
OTHER SERVICES 15.2 6.6 14.6 8.8
LESS: FISIM 14.4 5.9 0.5 6.2
Table 7.3B: Gross Value Added By Industry in Current Basic Prices - Percentage Change
Fig 7.4: GVA by Industry in Current Basic Prices - Percentage Change
-40.0
-30.0
-20.0
-10.0
0.0
10.0
20.0
30.0
2003 2004 2005 2006
Perc
ent
TOTAL AGRICULTURE MANUFACTURING SERVICES
87

GRENADA
EC$Mn
EXPENDITURE GROUPS 2003 2004 2005 2006
GROSS DOMESTIC PRODUCT (Current Market Prices) 1,296.6 1,267.2 1,495.4 1,524.0
TOTAL CONSUMPTION 1,139.9 1,076.3 1,391.2 1,488.7
Private 953.6 857.7 1,146.2 1,242.7
General Government 186.3 218.6 245.0 246.1
GROSS CAPITAL FORMATION 500.6 512.7 753.5 575.9
Public 160.8 88.1 117.2 162.9
Private 339.8 424.6 636.3 413.0
Increase in Stocks - - - -
GOODS AND NON-FACTOR SERVICES -343.8 -321.8 -649.2 -540.6
Exports of Goods 123.0 101.3 88.7 84.8
Exports of Non Factor Services 361.8 424.6 313.2 351.1
Imports of Goods 604.5 600.0 793.7 710.2
Imports of Non Factor Services 224.1 247.7 257.5 266.3
Table 7.4: Expenditure on Gross Domestic Product in Current Prices
Fig 7.5: GVA in Current and Constant 1990 Basic Prices
0
200
400
600
800
1000
1200
1400
2003 2004 2005 2006
$EC
Mn
CONSTANT 1990 BASIC PRICES CURRENT BASIC PRICES
88

GRENADA
EXPENDITURE GROUPS 2003 2004 2005 2006
GROSS DOMESTIC PRODUCT (Current Market Prices) 100.0 100.0 100.0 100.0
TOTAL CONSUMPTION 87.9 84.9 93.0 97.7
Private 73.5 67.7 76.6 81.5
General Government 14.4 17.3 16.4 16.1
GROSS CAPITAL FORMATION 38.6 40.5 50.4 37.8
Public 12.4 7.0 7.8 10.7
Private 26.2 33.5 42.5 27.1
Increase in Stocks - - - -
GOODS AND NON-FACTOR SERVICES -26.5 -25.4 -43.4 -35.5
Exports of Goods 9.5 8.0 5.9 5.6
Exports of Non Factor Services 27.9 33.5 20.9 23.0
Imports of Goods 46.6 47.3 53.1 46.6
Imports of Non Factor Services 17.3 19.6 17.2 17.5
Table 7.4A: Expenditure on Gross Domestic Product in Current Prices - Percentage Distribution
Fig 7.6: Expenditure on GDP in Current Prices: 2003
-600
-400
-200
0
200
400
600
800
1000
1200
1400
Total GDP PrivateConsumption
GovernmentConsumption
Gross CapitalFormation
Goods and Non-factor Services
EC
$Mn
Fig 7.7: Expenditure on GDP in Current Prices: 2006
-1000
-500
0
500
1000
1500
2000
Total GDP PrivateConsumption
GovernmentConsumption
Gross CapitalFormation
Goods and Non-factor Services
EC
$Mn
89

90


GUYANA
EC$Mn Industry 2003 2004 2005 2006
TOTAL 1,656.9 1,683.1 1,650.3 1,734.9
AGRIC., FORESTRY & FISHING 541.4 558.7 482.1 513.7
MINING & QUARRYING 227.6 212.8 175.0 137.0
MANUF. & PROCESSING 131.6 131.6 147.3 154.8
CONSTRUCTION & ENGIN. 82.5 85.8 93.9 105.3
DISTRIBUTION 68.8 70.1 80.7 88.8
TRANSPORT & COMMUNICATION 145.0 150.2 164.3 180.9
RENTAL OF DWELLINGS 68.7 69.4 73.7 80.9
FINANCIAL SERVICES 59.1 59.7 63.6 68.7
GOVERNMENT 290.5 293.9 299.8 305.6
OTHER SERVICES 1 29.2 29.6 31.7 34.3
STATISTICAL DISCREPANCY 2 12.4 21.2 38.1 64.8
Industry 2003 2004 2005 2006
TOTAL -0.7 1.6 -2.0 5.1
AGRIC., FORESTRY & FISHING -1.7 3.2 -13.7 6.6
MINING & QUARRYING -8.7 -6.5 -17.8 -21.7
MANUF. & PROCESSING -2.1 0.0 12.0 5.1
CONSTRUCTION & ENGIN. 5.7 4.1 9.4 12.1
DISTRIBUTION -2.5 1.9 15.0 10.0
TRANSPORT & COMMUNICATION 5.0 3.6 9.4 10.0
RENTAL OF DWELLINGS 3.5 1.0 6.1 9.9
FINANCIAL SERVICES 1.0 1.0 6.4 8.1
GOVERNMENT 0.6 1.2 2.0 1.9
OTHER SERVICES 1 2.8 1.4 7.0 8.0
Note: 1 includes Electricity and Gas
2 Refers to statistical discrepancy which arose due to shifting of the base year from 1988 to a common base year across all Member States, 2000.
Table 8.1: Gross Domestic Product By Industry at Factor Cost in Constant 2000 Prices
Table 8.1A Gross Domestic Product By Industry at Factor Cost in Constant 2000 Prices- Percentage Change
Notes:1 includes Electricity and Gas
93

GUYANA
G$Mn
Industry 2003 2004 2005 2006
TOTAL 5,500.0 5,587.0 5,478.0 5,758.7
AGRIC., FORESTRY & FISHING 1,916.0 1,977.0 1,706.0 1,817.8
MINING & QUARRYING 554.0 518.0 426.0 333.6
MANUF. & PROCESSING 309.0 309.0 346.0 363.6
CONSTRUCTION & ENGIN. 468.0 487.0 533.0 597.3
DISTRIBUTION 412.0 420.0 483.0 531.5
TRANSPORT & COMMUNICATION 555.0 575.0 629.0 692.2
RENTAL OF DWELLINGS 97.0 98.0 104.0 114.2
FINANCIAL SERVICES 293.0 296.0 315.0 340.5
GOVERNMENT 686.0 694.0 708.0 721.8
OTHER SERVICES 1 210.0 213.0 228.0 246.2
Note: 1 includes Electricity and Gas
Table 8.2: Gross Domestic Product By Industry at Factor Cost in Constant 1988 Prices
Fig 8.1: GDP by Industry at Factor Cost in Constant 2000 Prices - Percentage Change(Based on EC$Mn)
-15.0
-10.0
-5.0
0.0
5.0
10.0
15.0
2003 2004 2005 2006
Perc
ent
TOTAL AGRIC., FORESTRY & FISHING MANUF. & PROCESSING SERVICES
94

GUYANA
Industry 2003 2004 2005 2006
TOTAL 100.0 100.0 100.0 100.0
AGRIC., FORESTRY & FISHING 34.8 35.4 31.1 31.6
MINING & QUARRYING 10.1 9.3 7.8 5.8
MANUF. & PROCESSING 5.6 5.5 6.3 6.3
CONSTRUCTION & ENGIN. 8.5 8.7 9.7 10.4
DISTRIBUTION 7.5 7.5 8.8 9.2
TRANSPORT & COMMUNICATION 10.1 10.3 11.5 12.0
RENTAL OF DWELLINGS 1.8 1.8 1.9 2.0
FINANCIAL SERVICES 5.3 5.3 5.8 5.9
GOVERNMENT 12.5 12.4 12.9 12.5
OTHER SERVICES 1 3.8 3.8 4.2 4.3
Note: 1 includes Electricity and Gas
Table 8.2A: Gross Domestic Product By Industry at Factor Cost in Constant 1988 Prices - Percentage Distribution
Fig 8.2: GDP by Industry at Factor Cost in Constant 1988 Prices - Percentage
Distribution, 2003
34.8
10.1
5.6
10.1
12.5
26.9
AGRIC., FORESTRY & FISHING MINING & QUARRYINGMANUF. & PROCESSINGTRANSPORT & COMMUNICATIONGOVERNMENTOTHER
Fig 8.3: GDP by Industry at Factor Cost in Constant 1988 Prices - Percentage
Distribution, 2006
31.6
5.8
6.3
12.0
12.531.8
AGRIC., FORESTRY & FISHING MINING & QUARRYINGMANUF. & PROCESSINGTRANSPORT & COMMUNICATIONGOVERNMENTOTHER
95

GUYANA
G$MnIndustry 2003 2004 2005 2006
TOTAL 123,261.0 130,533.0 137,786.0 154,001.0
AGRIC., FORESTRY & FISHING 38,749.0 40,864.0 41,666.0 46,515.0
MINING & QUARRYING 15,930.0 15,786.0 14,031.0 15,009.0
MANUF. & PROCESSING 11,388.0 12,577.0 11,178.0 13,324.0
CONSTRUCTION & ENGIN. 6,199.0 6,840.0 8,388.0 9,790.0
DISTRIBUTION 4,996.0 5,407.0 7,026.0 8,054.0
TRANSPORT & COMMUNICATION 11,502.0 12,630.0 15,213.0 17,438.0
RENTAL OF DWELLINGS 5,087.0 5,506.0 6,389.0 7,323.0
FINANCIAL SERVICES 4,400.0 4,715.0 5,473.0 6,159.0
GOVERNMENT 22,809.0 23,836.0 25,528.0 27,132.0
OTHER SERVICES 1 2,201.0 2,372.0 2,894.0 3,257.0
Note: 1 includes Electricity and Gas
Industry 2003 2004 2005 2006
TOTAL 4.7 5.9 5.6 11.8
AGRIC., FORESTRY & FISHING 6.8 5.5 2.0 11.6
MINING & QUARRYING -9.9 -0.9 -11.1 7.0
MANUF. & PROCESSING 9.4 10.4 -11.1 19.2
CONSTRUCTION & ENGIN. 11.1 10.3 22.6 16.7
DISTRIBUTION -0.6 8.2 29.9 14.6
TRANSPORT & COMMUNICATION 10.3 9.8 20.5 14.6
RENTAL OF DWELLINGS 8.1 8.2 16.0 14.6
FINANCIAL SERVICES 6.1 7.2 16.1 12.5
GOVERNMENT 6.3 4.5 7.1 6.3
OTHER SERVICES 1 7.7 7.8 22.0 12.5
Note: 1 includes Electricity and Gas
Table 8.3: Gross Domestic Product By Industry at Factor Cost in Current Prices
Table 8.3A: Gross Domestic Product By Industry at Factor Cost in Current Prices - Percentage Change
96
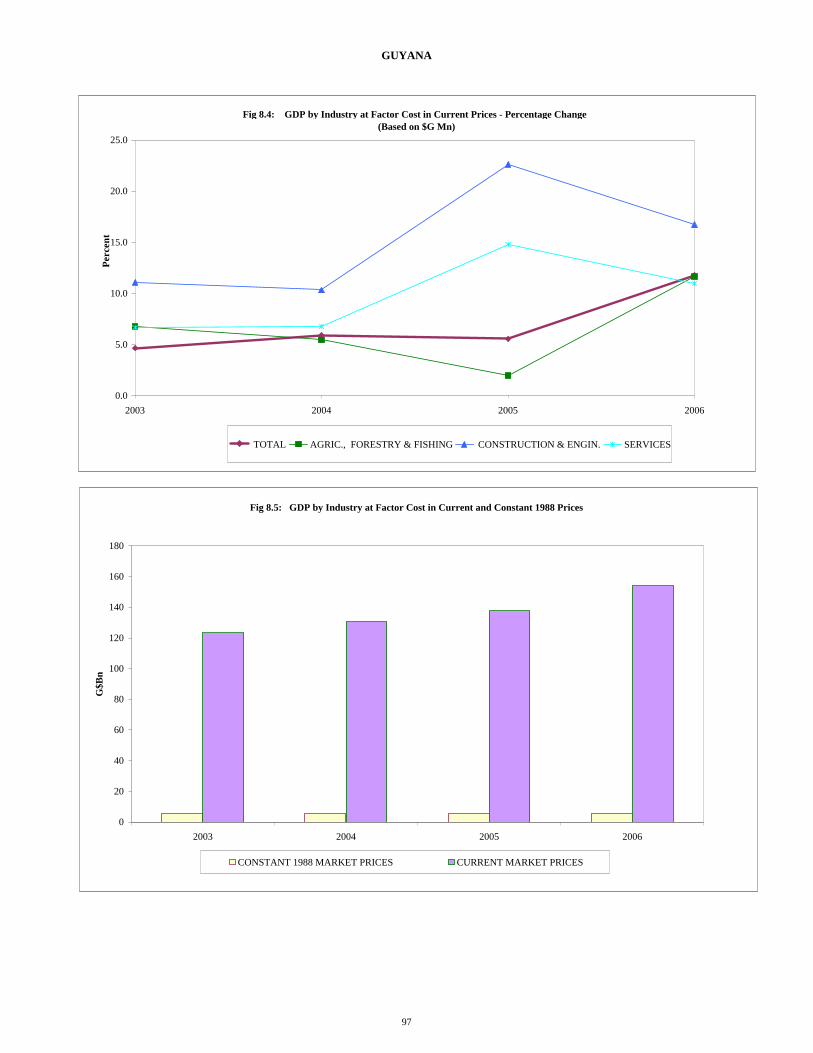
GUYANA
Fig 8.5: GDP by Industry at Factor Cost in Current and Constant 1988 Prices
0
20
40
60
80
100
120
140
160
180
2003 2004 2005 2006
G$B
n
CONSTANT 1988 MARKET PRICES CURRENT MARKET PRICES
Fig 8.4: GDP by Industry at Factor Cost in Current Prices - Percentage Change (Based on $G Mn)
0.0
5.0
10.0
15.0
20.0
25.0
2003 2004 2005 2006
Perc
ent
TOTAL AGRIC., FORESTRY & FISHING CONSTRUCTION & ENGIN. SERVICES
97

GUYANA
EC$MnIndustry 2003 2004 2005 2006
TOTAL 1,703.7 1,764.0 1,861.3 2,067.8
AGRIC., FORESTRY & FISHING 535.6 552.2 562.8 624.6
MINING & QUARRYING 220.2 213.3 189.5 201.5
MANUF. & PROCESSING 157.4 170.0 151.0 178.9
CONSTRUCTION & ENGIN. 85.7 92.4 113.3 131.5
DISTRIBUTION 69.1 73.1 94.9 108.1
TRANSPORT & COMMUNICATION 159.0 170.7 205.5 234.1
RENTAL OF DWELLINGS 70.3 74.4 86.3 98.3
FINANCIAL SERVICES 60.8 63.7 73.9 82.7
GOVERNMENT 315.3 322.1 344.8 364.3
OTHER SERVICES 1 30.4 32.1 39.1 43.7
Note: 1 includes Electricity and Gas
Industry 2003 2004 2005 2006
TOTAL 100.0 100.0 100.0 100.0
AGRIC., FORESTRY & FISHING 31.4 31.3 30.2 30.2
MINING & QUARRYING 12.9 12.1 10.2 9.7
MANUF. & PROCESSING 9.2 9.6 8.1 8.7
CONSTRUCTION & ENGIN. 5.0 5.2 6.1 6.4
DISTRIBUTION 4.1 4.1 5.1 5.2
TRANSPORT & COMMUNICATION 9.3 9.7 11.0 11.3
RENTAL OF DWELLINGS 4.1 4.2 4.6 4.8
FINANCIAL SERVICES 3.6 3.6 4.0 4.0
GOVERNMENT 18.5 18.3 18.5 17.6
OTHER SERVICES 1 1.8 1.8 2.1 2.1
Note: 1 includes Electricity and Gas
Table 8.4A: Gross Domestic Product By Industry at Factor Cost in Current Prices - Percentage Distribution
Table 8.4: Gross Domestic Product By Industry at Factor Cost in Current Prices
98
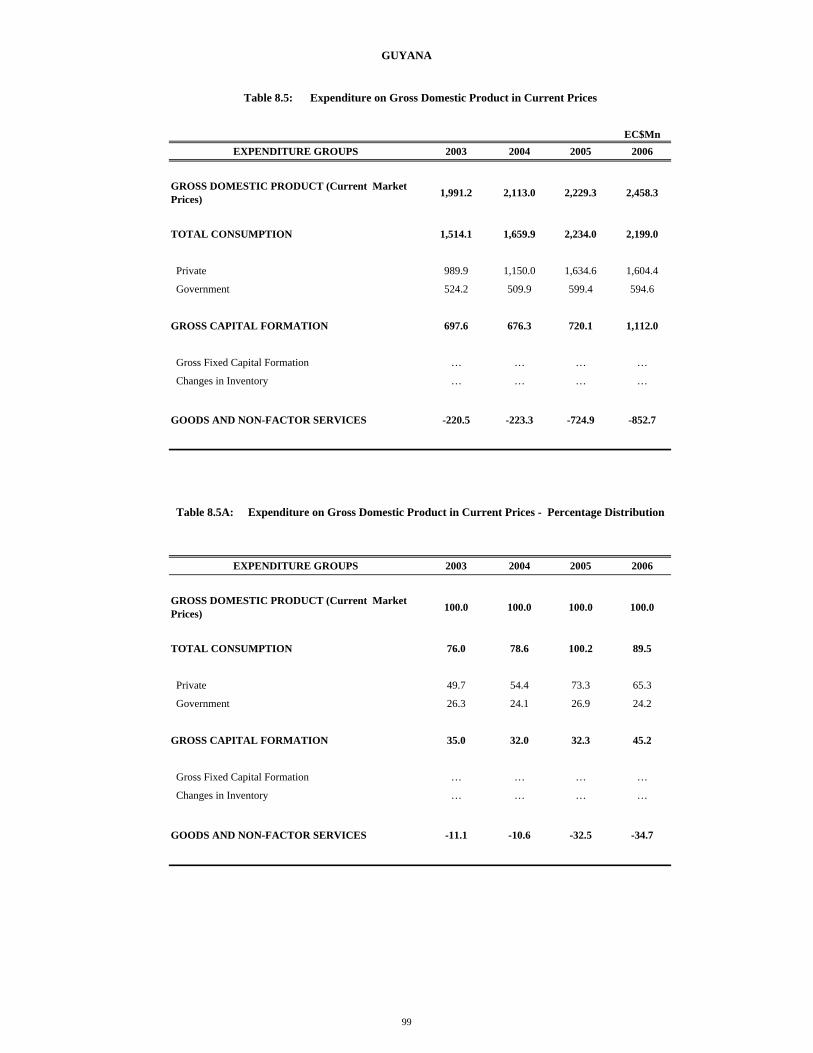
GUYANA
EC$MnEXPENDITURE GROUPS 2003 2004 2005 2006
GROSS DOMESTIC PRODUCT (Current Market Prices) 1,991.2 2,113.0 2,229.3 2,458.3
TOTAL CONSUMPTION 1,514.1 1,659.9 2,234.0 2,199.0
Private 989.9 1,150.0 1,634.6 1,604.4
Government 524.2 509.9 599.4 594.6
GROSS CAPITAL FORMATION 697.6 676.3 720.1 1,112.0
Gross Fixed Capital Formation … … … …
Changes in Inventory … … … …
GOODS AND NON-FACTOR SERVICES -220.5 -223.3 -724.9 -852.7
EXPENDITURE GROUPS 2003 2004 2005 2006
GROSS DOMESTIC PRODUCT (Current Market Prices) 100.0 100.0 100.0 100.0
TOTAL CONSUMPTION 76.0 78.6 100.2 89.5
Private 49.7 54.4 73.3 65.3
Government 26.3 24.1 26.9 24.2
GROSS CAPITAL FORMATION 35.0 32.0 32.3 45.2
Gross Fixed Capital Formation … … … …
Changes in Inventory … … … …
GOODS AND NON-FACTOR SERVICES -11.1 -10.6 -32.5 -34.7
Table 8.5A: Expenditure on Gross Domestic Product in Current Prices - Percentage Distribution
Table 8.5: Expenditure on Gross Domestic Product in Current Prices
99

GUYANA
G$MnEXPENDITURE GROUPS 2003 2004 2005 2006
GROSS DOMESTIC PRODUCT (Current Market Prices) 144,064.0 156,358.0 165,028.0 183,083.0
TOTAL CONSUMPTION 109,543.0 122,832.0 165,380.0 163,771.0
Private 71,615.0 85,100.0 121,006.0 119,487.0
Government 37,928.0 37,732.0 44,374.0 44,284.0
GROSS CAPITAL FORMATION 50,473.0 50,046.0 53,310.0 82,818.0
Gross Fixed Capital Formation … … … …
Changes in Inventory … … … …
GOODS AND NON-FACTOR SERVICES -15,952.0 -16,520.0 -53,662.0 -63,506.0
Table 8.6: Expenditure on Gross Domestic Product in Current Prices
Fig 8.6: Expenditure on GDP in Current Prices: 2003
-40
-20
0
20
40
60
80
100
120
140
160
Total GDP PrivateConsumption
GovernmentConsumption
Gross CapitalFormation
Goods and Non-factor Services
G$B
n
Fig 8.7: Expenditure on GDP in Current Prices: 2006
-100
-50
0
50
100
150
200
Total GDP PrivateConsumption
GovernmentConsumption
Gross CapitalFormation
Goods and Non-factor Services
G$B
n
100


JAMAICA
EC$Mn Industry 2003 2004 2005 2006
TOTAL 22,452.8 22,765.5 22,999.9 23,623.3
AGRIC., FORESTRY & FISHING 1,410.9 1,252.2 1,167.2 1,356.4
MINING & QUARRYING 953.8 975.0 1,002.4 1,014.6
MANUFACTURING 2,631.1 2,668.4 2,551.3 2,492.3
ELECTRICITY & WATER 749.5 748.5 779.6 804.9
CONSTRUCT. & INSTALLATION 2,012.9 2,182.9 2,346.0 2,300.9
DISTRIBUTIVE TRADE 4,263.4 4,351.7 4,442.0 4,611.3
T/PORT, COMM. & STORAGE 2,675.9 2,713.5 2,737.4 2,858.8
FINANCE & INSUR. SERVICES 1,961.4 2,007.5 2,004.4 2,037.5
REAL ESTATE & BUS. SERVICES 1,253.8 1,277.9 1,295.5 1,319.3
PRODUCERS OF GOV'T SERVICES 2,570.5 2,574.4 2,581.0 2,607.2
MISCELLANEOUS SERVICES 1,625.9 1,669.4 1,719.3 1,792.6
H/HOLD & PRIVATE NPIs 117.8 118.0 118.4 121.6
LESS: IMPUTED SERVICE CHARGES 1,281.9 1,302.1 1,298.0 1,307.7
STATISTICAL DISCREPANCY 1 1,507.9 1,528.4 1,553.4 1,613.6
Industry 2003 2004 2005 2006
TOTAL 3.5 1.4 1.0 2.7
AGRIC., FORESTRY & FISHING 7.0 -11.2 -6.8 16.2
MINING & QUARRYING 5.0 2.2 2.8 1.2
MANUFACTURING -0.5 1.4 -4.4 -2.3
ELECTRICITY & WATER 4.7 -0.1 4.2 3.2
CONSTRUCT. & INSTALLATION 5.0 8.4 7.5 -1.9
DISTRIBUTIVE TRADE 2.2 2.1 2.1 3.8
T/PORT, COMM. & STORAGE 4.0 1.4 0.9 4.4
FINANCE & INSUR. SERVICES 6.8 2.4 -0.2 1.7
REAL ESTATE & BUS. SERVICES 2.2 1.9 1.4 1.8
PRODUCERS OF GOV'T SERVICES 0.2 0.2 0.3 1.0
MISCELLANEOUS SERVICES 4.7 2.7 3.0 4.3
H/HOLD & PRIVATE NPIs 0.1 0.1 0.3 2.8
LESS: IMPUTED SERVICE CHARGES -2.9 1.6 -0.3 0.7
Table 9.1: Gross Domestic Product By Industry in Constant 2000 Producers' Prices
Table 9.1A: Gross Domestic Product By Industry in Constant 2000 Producers' Prices - Percentage Change
1 Refers to statistical discrepancy which arose due to shifting of the base year from 2003 to a common base year across all Member States, 2000.
103

JAMAICA
J$MnIndustry 2003 2004 2005 2006
TOTAL 476,745.9 483,385.8 488,363.0 501,599.2
AGRIC., FORESTRY & FISHING 28,389.8 25,196.5 23,487.4 27,293.8
MINING & QUARRYING 19,233.6 19,659.3 20,212.9 20,458.9
MANUFACTURING 45,597.4 46,245.2 44,214.6 43,192.8
ELECTRICITY & WATER 15,782.4 15,761.8 16,416.4 16,949.3
CONSTRUCT. & INSTALLATION 37,001.4 40,126.5 43,124.9 42,297.2
DISTRIBUTIVE TRADE 112,354.7 114,681.6 117,063.0 121,523.3
T/PORT, COMM. & STORAGE 56,747.8 57,543.8 58,051.7 60,626.8
FINANCE & INSUR. SERVICES 52,898.8 54,142.6 54,058.5 54,950.9
REAL ESTATE & BUS. SERVICES 45,359.3 46,233.9 46,871.2 47,730.3
PRODUCERS OF GOV'T SERVICES 58,055.2 58,144.2 58,294.0 58,884.0
MISCELLANEOUS SERVICES 26,907.8 27,627.5 28,453.0 29,666.3
H/HOLD & PRIVATE NPIs 3,596.8 3,600.4 3,612.6 3,712.9
LESS: IMPUTED SERVICE CHARGES 25,179.1 25,577.5 25,497.2 25,687.3
Table 9.2: Gross Domestic Product By Industry in Constant 2003 Producers' Prices
Fig 9.1: Gross Domestic Product by Industry in Constant 2000 Producers' Prices - Percentage Change (Based on EC$Mn)
-15.0
-10.0
-5.0
0.0
5.0
10.0
15.0
20.0
2003 2004 2005 2006
Perc
ent
TOTAL AGRIC., FORESTRY & FISHING MANUFACTURING SERVICES
104

JAMAICA
Industry 2003 2004 2005 2006
TOTAL 100.0 100.0 100.0 100.0
AGRIC., FORESTRY & FISHING 6.0 5.2 4.8 5.4
MINING & QUARRYING 4.0 4.1 4.1 4.1
MANUFACTURING 9.6 9.6 9.1 8.6
ELECTRICITY & WATER 3.3 3.3 3.4 3.4
CONSTRUCT. & INSTALLATION 7.8 8.3 8.8 8.4
DISTRIBUTIVE TRADE 23.6 23.7 24.0 24.2
T/PORT, COMM. & STORAGE 11.9 11.9 11.9 12.1
FINANCE & INSUR. SERVICES 11.1 11.2 11.1 11.0
REAL ESTATE & BUS. SERVICES 9.5 9.6 9.6 9.5
PRODUCERS OF GOV'T SERVICES 12.2 12.0 11.9 11.7
MISCELLANEOUS SERVICES 5.6 5.7 5.8 5.9
H/HOLD & PRIVATE NPIs 0.8 0.7 0.7 0.7
LESS: IMPUTED SERVICE CHARGES 5.3 5.3 5.2 5.1
Table 9.2A: Gross Domestic Product By Industry in Constant 2003 Producers' Prices - Percentage Distribution
Fig 9.2: GDP By Industry in Constant 2003 Producers' Prices: - Percentage
Distribution, 2003
9.67.8
23.6
11.9
12.2
35.0
MANUFACTURING CONSTRUCT. & INSTALLATION DISTRIBUTIVE TRADE T/PORT, COMM. & STORAGE PRODUCERS OF GOV'T SERVICESOTHER
Fig 9.3: GDP By Industry in Constant 2003 Producers' Prices: - Percentage Distribution,
2006
8.6
8.4
24.2
12.1
11.7
34.9
MANUFACTURING CONSTRUCT. & INSTALLATION DISTRIBUTIVE TRADE T/PORT, COMM. & STORAGE PRODUCERS OF GOV'T SERVICESOTHER
105

JAMAICA
J$MnIndustry 2003 2004 2005 2006
TOTAL 542,703.4 620,233.0 694,537.4 788,178.8
AGRIC., FORESTRY & FISHING 28,389.8 30,984.2 36,453.0 39,729.8
MINING & QUARRYING 19,233.6 23,533.4 25,106.3 27,348.1
MANUFACTURING 45,597.4 51,469.7 54,456.0 60,172.5
ELECTRICITY & WATER 15,782.4 18,290.2 22,304.1 25,960.1
CONSTRUCT. & INSTALLATION 37,001.4 45,847.9 52,269.0 56,665.7
DISTRIBUTIVE TRADE 112,354.7 129,310.1 149,744.3 171,257.5
T/PORT, COMM. & STORAGE 56,747.8 63,850.7 70,397.5 80,494.1
FINANCE & INSUR. SERVICES 52,898.8 56,536.8 61,074.9 64,527.0
REAL ESTATE & BUS. SERVICES 45,359.3 52,092.7 59,775.9 67,511.0
PRODUCERS OF GOV'T SERVICES 58,055.2 61,794.0 67,524.9 83,843.0
MISCELLANEOUS SERVICES 26,907.8 30,530.4 34,046.6 38,342.4
H/HOLD & PRIVATE NPIs 3,596.8 3,927.8 4,663.3 5,204.6
LESS: IMPUTED SERVICE CHARGES 25,179.1 26,359.6 29,418.9 31,170.8
ADD: VALUE ADDED TAX 65,957.5 78,424.7 86,140.5 98,293.8
Industry 2003 2004 2005 2006
TOTAL 32.3 14.3 12.0 13.5
AGRIC., FORESTRY & FISHING 25.2 9.1 17.7 9.0
MINING & QUARRYING 22.6 22.4 6.7 8.9
MANUFACTURING -12.1 12.9 5.8 10.5
ELECTRICITY & WATER 16.3 15.9 21.9 16.4
CONSTRUCT. & INSTALLATION -4.3 23.9 14.0 8.4
DISTRIBUTIVE TRADE 42.9 15.1 15.8 14.4
T/PORT, COMM. & STORAGE 11.1 12.5 10.3 14.3
FINANCE & INSUR. SERVICES 138.1 6.9 8.0 5.7
REAL ESTATE & BUS. SERVICES 86.7 14.8 14.7 12.9
PRODUCERS OF GOV'T SERVICES 15.5 6.4 9.3 24.2
MISCELLANEOUS SERVICES 0.9 13.5 11.5 12.6
H/HOLD & PRIVATE NPIs 71.5 9.2 18.7 11.6
LESS: IMPUTED SERVICE CHARGES 77.6 4.7 11.6 6.0
ADD: VALUE ADDED TAX 148.1 18.9 9.8 14.1
Table 9.3: Gross Domestic Product By Industry in Current Purchasers' Prices
Table 9.3A: Gross Domestic Product By Industry in Current Purchasers' Prices - Percentage Change
106

JAMAICA
Fig 9.5: GDP by Industry in Current Purchasers' and Constant 2003 Producers' Prices
0
100
200
300
400
500
600
700
800
900
2003 2004 2005 2006
J$ B
n
CONSTANT 2003 PRODUCERS' PRICES CURRENT PURCHASERS' PRICES
Fig 9.4: GDP by Industry in Current Purchasers' Prices - Percentage Change (Based on J$Mn)
-15.0
-10.0
-5.0
0.0
5.0
10.0
15.0
20.0
25.0
30.0
35.0
40.0
2003 2004 2005 2006
Perc
ent
TOTAL AGRIC., FORESTRY & FISHING MANUFACTURING SERVICES
107

JAMAICA
EC$MnIndustry 2003 2004 2005 2006
TOTAL 25,159.7 27,457.4 30,250.9 32,309.2
AGRIC., FORESTRY & FISHING 1,316.1 1,371.7 1,587.7 1,628.6
MINING & QUARRYING 891.7 1,041.8 1,093.5 1,121.1
MANUFACTURING 2,113.9 2,278.5 2,371.9 2,466.6
ELECTRICITY & WATER 731.7 809.7 971.5 1,064.2
CONSTRUCT. & INSTALLATION 1,715.4 2,029.7 2,276.6 2,322.8
DISTRIBUTIVE TRADE 5,208.8 5,724.5 6,522.2 7,020.2
T/PORT, COMM. & STORAGE 2,630.8 2,826.6 3,066.2 3,299.6
FINANCE & INSUR. SERVICES 2,452.4 2,502.9 2,660.1 2,645.1
REAL ESTATE & BUS. SERVICES 2,102.9 2,306.1 2,603.6 2,767.4
PRODUCERS OF GOV'T SERVICES 2,691.4 2,735.6 2,941.1 3,436.9
MISCELLANEOUS SERVICES 1,247.4 1,351.6 1,482.9 1,571.7
H/HOLD & PRIVATE NPIs 166.7 173.9 203.1 213.3
LESS: IMPUTED SERVICE CHARGES 1,167.3 1,166.9 1,281.4 1,277.8
ADD: VALUE ADDED TAX 3,057.8 3,471.8 3,751.9 4,029.3
Industry 2003 2004 2005 2006
TOTAL 100.0 100.0 100.0 100.0
AGRIC., FORESTRY & FISHING 5.2 5.0 5.2 5.0
MINING & QUARRYING 3.5 3.8 3.6 3.5
MANUFACTURING 8.4 8.3 7.8 7.6
ELECTRICITY & WATER 2.9 2.9 3.2 3.3
CONSTRUCT. & INSTALLATION 6.8 7.4 7.5 7.2
DISTRIBUTIVE TRADE 20.7 20.8 21.6 21.7
T/PORT, COMM. & STORAGE 10.5 10.3 10.1 10.2
FINANCE & INSUR. SERVICES 9.7 9.1 8.8 8.2
REAL ESTATE & BUS. SERVICES 8.4 8.4 8.6 8.6
PRODUCERS OF GOV'T SERVICES 10.7 10.0 9.7 10.6
MISCELLANEOUS SERVICES 5.0 4.9 4.9 4.9
H/HOLD & PRIVATE NPIs 0.7 0.6 0.7 0.7
LESS: IMPUTED SERVICE CHARGES 4.6 4.2 4.2 4.0
ADD: VALUE ADDED TAX 12.2 12.6 12.4 12.5
Table 9.4A: Gross Domestic Product By Industry in Current Purchasers' Prices - Percentage Distribution
Table 9.4: Gross Domestic Product By Industry in Current Purchasers' Prices
108

JAMAICA
EC$Mn
EXPENDITURE GROUPS 2003 2004 2005 2006
GROSS DOMESTIC PRODUCT (Current Purchasers' Prices) 25,159.7 27,457.4 30,250.9 32,309.1
FINAL CONSUMPTION 22,301.1 24,086.5 27,604.5 29,563.8
Private 18,835.3 20,677.4 23,417.4 25,074.6
Government 3,465.8 3,409.2 4,187.1 4,489.1
GROSS CAPITAL FORMATION 6,625.8 7,293.5 8,113.2 9,145.0
Gross Fixed Capital Formation 6,584.2 7,267.9 8,110.5 9,034.0
Increase in Stocks 41.5 25.6 2.8 111.0
GOODS AND NON-FACTOR SERVICES -3,767.2 -3,922.5 -5,466.9 -6,399.6
Exports of Goods and Services 9,242.5 10,349.0 10,723.9 12,786.8
Imports of Goods and Services 13,009.7 14,271.5 16,190.7 19,186.4
EXPENDITURE GROUPS 2003 2004 2005 2006
GROSS DOMESTIC PRODUCT (Current Purchasers' Prices) 100.0 100.0 100.0 100.0
FINAL CONSUMPTION 88.6 87.7 91.3 91.5
Private 74.9 75.3 77.4 77.6
Government 13.8 12.4 13.8 13.9
GROSS CAPITAL FORMATION 26.3 26.6 26.8 28.3
Gross Fixed Capital Formation 26.2 26.5 26.8 28.0
Increase in Stocks 0.2 0.1 0.0 0.3
GOODS AND NON-FACTOR SERVICES -15.0 -14.3 -18.1 -19.8
Exports of Goods and Services 36.7 37.7 35.4 39.6
Imports of Goods and Services 51.7 52.0 53.5 59.4
Table 9.5: Expenditure on Gross Domestic Product in Current Purchasers' Prices
Table 9.5A: Expenditure on Gross Domestic Product in Current Purchasers' Prices - Percentage Distribution
109

JAMAICA
J$MnEXPENDITURE GROUPS 2003 2004 2005 2006
GROSS DOMESTIC PRODUCT (Current Purchasers' Prices) 542,703.4 620,233.2 694,537.5 788,178.7
FINAL CONSUMPTION 481,043.6 544,087.4 633,778.4 721,205.4
Private 406,285.1 467,078.4 537,645.3 611,693.4
Government 74,758.5 77,009.0 96,133.1 109,512.0
GROSS CAPITAL FORMATION 142,920.6 164,751.2 186,274.2 223,092.1
Gross Fixed Capital Formation 142,024.4 164,172.9 186,210.2 220,384.0
Increase in Stocks 896.2 578.3 64.0 2,708.1
GOODS AND NON-FACTOR SERVICES -81,260.8 -88,605.4 -125,515.1 -156,118.8
Exports of Goods and Services 199,363.9 233,771.9 246,212.3 311,932.5
Imports of Goods and Services 280,624.7 322,377.3 371,727.4 468,051.3
Table 9.6: Expenditure on Gross Domestic Product in Current Purchasers' Prices
Fig 9.6: Expenditure on GDP in Current Prices: 2003
-200
-100
0
100
200
300
400
500
600
Total GDP PrivateConsumption
GovernmentConsumption
Gross CapitalFormation
Goods and Non-factor Services
J$B
n
Fig 9.7: Expenditure on GDP in Current Prices: 2006
-400
-200
0
200
400
600
800
1000
Total GDP PrivateConsumption
GovernmentConsumption
Gross CapitalFormation
Goods and Non-factor Services
J$B
n
110


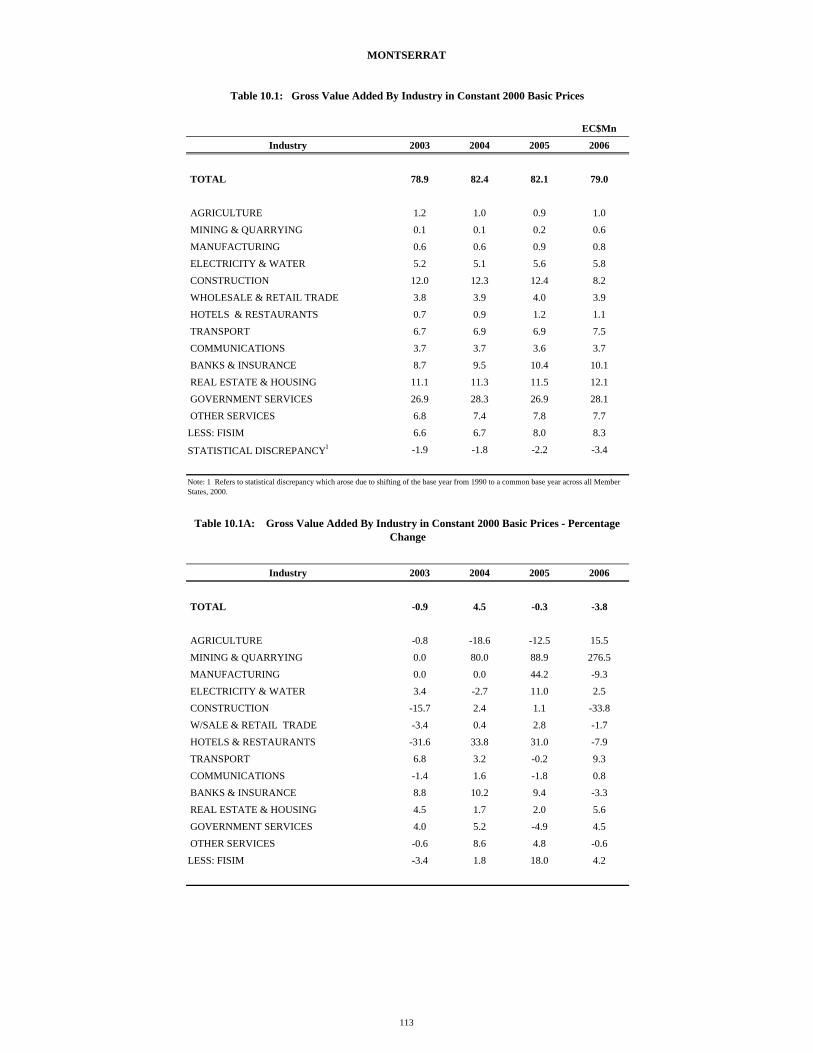
MONTSERRAT
EC$Mn
Industry 2003 2004 2005 2006
TOTAL 78.9 82.4 82.1 79.0
AGRICULTURE 1.2 1.0 0.9 1.0
MINING & QUARRYING 0.1 0.1 0.2 0.6
MANUFACTURING 0.6 0.6 0.9 0.8
ELECTRICITY & WATER 5.2 5.1 5.6 5.8
CONSTRUCTION 12.0 12.3 12.4 8.2
WHOLESALE & RETAIL TRADE 3.8 3.9 4.0 3.9
HOTELS & RESTAURANTS 0.7 0.9 1.2 1.1
TRANSPORT 6.7 6.9 6.9 7.5
COMMUNICATIONS 3.7 3.7 3.6 3.7
BANKS & INSURANCE 8.7 9.5 10.4 10.1
REAL ESTATE & HOUSING 11.1 11.3 11.5 12.1
GOVERNMENT SERVICES 26.9 28.3 26.9 28.1
OTHER SERVICES 6.8 7.4 7.8 7.7
LESS: FISIM 6.6 6.7 8.0 8.3
STATISTICAL DISCREPANCY1 -1.9 -1.8 -2.2 -3.4
Industry 2003 2004 2005 2006
TOTAL -0.9 4.5 -0.3 -3.8
AGRICULTURE -0.8 -18.6 -12.5 15.5
MINING & QUARRYING 0.0 80.0 88.9 276.5
MANUFACTURING 0.0 0.0 44.2 -9.3
ELECTRICITY & WATER 3.4 -2.7 11.0 2.5
CONSTRUCTION -15.7 2.4 1.1 -33.8
W/SALE & RETAIL TRADE -3.4 0.4 2.8 -1.7
HOTELS & RESTAURANTS -31.6 33.8 31.0 -7.9
TRANSPORT 6.8 3.2 -0.2 9.3
COMMUNICATIONS -1.4 1.6 -1.8 0.8
BANKS & INSURANCE 8.8 10.2 9.4 -3.3
REAL ESTATE & HOUSING 4.5 1.7 2.0 5.6
GOVERNMENT SERVICES 4.0 5.2 -4.9 4.5
OTHER SERVICES -0.6 8.6 4.8 -0.6
LESS: FISIM -3.4 1.8 18.0 4.2
Table 10.1: Gross Value Added By Industry in Constant 2000 Basic Prices
Table 10.1A: Gross Value Added By Industry in Constant 2000 Basic Prices - Percentage Change
Note: 1 Refers to statistical discrepancy which arose due to shifting of the base year from 1990 to a common base year across all Member States, 2000.
113

MONTSERRAT
EC$Mn
Industry 2003 2004 2005 2006
TOTAL 58.2 60.8 60.6 58.3
AGRICULTURE 1.2 1.0 0.8 1.0
MINING & QUARRYING 0.1 0.1 0.2 0.6
MANUFACTURING 0.5 0.5 0.8 0.7
ELECTRICITY & WATER 1.5 1.5 1.6 1.7
CONSTRUCTION 11.0 11.3 11.4 7.6
W/SALE & RETAIL TRADE 2.8 2.8 2.9 2.9
HOTELS & RESTAURANTS 0.7 0.9 1.1 1.1
TRANSPORT 4.4 4.6 4.5 5.0
COMMUNICATIONS 4.9 5.0 4.9 4.9
BANKS & INSURANCE 6.6 7.3 7.9 7.7
REAL ESTATE & HOUSING 5.4 5.5 5.6 5.9
GOVERNMENT SERVICES 19.7 20.7 19.7 20.6
OTHER SERVICES 4.7 5.1 5.3 5.3
LESS: FISIM 5.1 5.2 6.2 6.4
Table 10.2: Gross Value Added By Industry in Constant 1990 Basic Prices
Fig 10.1: GVA by Industry in Constant 2000 Basic Prices - Percentage Change
-30.0
-20.0
-10.0
0.0
10.0
20.0
30.0
40.0
50.0
2003 2004 2005 2006
Perc
ent
TOTAL AGRICULTURE MANUFACTURING SERVICES
114

MONTSERRAT
Industry 2003 2004 2005 2006
TOTAL 100.0 100.0 100.0 100.0
AGRICULTURE 1.6 1.2 1.1 1.3
MINING & QUARRYING 0.1 0.1 0.2 0.8
MANUFACTURING 0.8 0.8 1.1 1.0
ELECTRICITY & WATER 6.6 6.1 6.8 7.3
CONSTRUCTION 15.2 14.9 15.1 10.4
W/SALE & RETAIL TRADE 4.9 4.7 4.8 4.9
HOTELS & RESTAURANTS 0.9 1.1 1.5 1.4
TRANSPORT 8.5 8.4 8.4 9.5
COMMUNICATIONS 4.6 4.5 4.4 4.7
BANKS & INSURANCE 11.0 11.6 12.7 12.8
REAL ESTATE & HOUSING 14.0 13.6 14.0 15.3
GOVERNMENT SERVICES 34.0 34.3 32.7 35.5
OTHER SERVICES 8.7 9.0 9.5 9.8
LESS: FISIM 8.4 8.2 9.7 10.5
Table 10.2A: Gross Value Added By Industry in Constant 1990 Basic Prices - Percentage Distribution
Fig 10.2: GVA by Industry in Constant 1990 Basic Prices - Percentage
Distribution, 2003
15.2
4.6
11.0
14.0
34.0
21.1
CONSTRUCTION COMMUNICATIONS BANKS & INSURANCE REAL ESTATE & HOUSING GOVERNMENT SERVICESOTHER SECTORS
Fig 10.3: GVA by Industry in Constant 1990 Basic Prices - Percentage
Distribution, 2006
10.4
4.7
12.8
15.3
35.5
21.3
CONSTRUCTION COMMUNICATIONS BANKS & INSURANCE REAL ESTATE & HOUSING GOVERNMENT SERVICESOTHER SECTORS
115

MONTSERRAT
EC$Mn
Industry 2003 2004 2005 2006
TOTAL 89.4 94.6 98.7 104.8
AGRICULTURE 1.4 1.1 1.0 1.2
MINING & QUARRYING 0.1 0.1 0.2 0.6
MANUFACTURING 0.6 0.6 0.9 0.8
ELECTRICITY & WATER 6.5 6.7 7.4 7.6
CONSTRUCTION 12.7 13.2 13.4 9.2
W/SALE & RETAIL TRADE 4.2 4.4 4.7 4.7
HOTELS & RESTAURANTS 0.7 0.9 1.2 1.1
TRANSPORT 7.2 7.7 8.1 8.8
COMMUNICATIONS 3.7 3.7 3.6 3.7
BANKS & INSURANCE 9.2 10.1 11.0 10.7
REAL ESTATE & HOUSING 12.1 12.8 13.4 14.5
GOVERNMENT SERVICES 31.0 32.7 34.2 42.7
OTHER SERVICES 7.1 7.8 8.1 8.1
LESS: FISIM 7.1 7.2 8.5 8.9
Industry 2003 2004 2005 2006
TOTAL 100.0 100.0 100.0 100.0
AGRICULTURE 1.5 1.2 1.0 1.2 MINING & QUARRYING 0.1 0.1 0.2 0.6 MANUFACTURING 0.7 0.7 0.9 0.8 ELECTRICITY & WATER 7.2 7.1 7.5 7.3 CONSTRUCTION 14.2 13.9 13.5 8.8 W/SALE & RETAIL TRADE 4.7 4.7 4.7 4.5 HOTELS & RESTAURANTS 0.8 1.0 1.2 1.1 TRANSPORT 8.1 8.2 8.2 8.4 COMMUNICATIONS 4.1 3.9 3.7 3.5 BANKS & INSURANCE 10.3 10.7 11.2 10.2 REAL ESTATE & HOUSING 13.6 13.6 13.6 13.8 GOVERNMENT SERVICES 34.7 34.5 34.6 40.7 OTHER SERVICES 8.0 8.2 8.2 7.7LESS: FISIM 7.9 7.6 8.6 8.5
Table 10.3: Gross Value Added By Industry, in Current Basic Prices
Table 10.3A: Gross Value Added By Industry in Current Basic Prices - Percentage Distribution
116

MONTSERRAT
Industry 2003 2004 2005 2006
TOTAL 1.9 5.8 4.4 6.2
AGRICULTURE 3.1 -17.0 -8.0 18.4
MINING & QUARRYING 0.0 80.0 88.9 276.5
MANUFACTURING 0.0 0.0 45.2 -10.0
ELECTRICITY & WATER 10.6 3.3 11.2 2.8
CONSTRUCTION -13.4 3.9 1.2 -31.2
WHOLESALE & RETAIL TRADE -2.1 4.3 5.9 0.2
HOTELS & RESTAURANTS -31.4 34.3 30.9 -8.1
TRANSPORT 9.9 6.6 4.5 9.7
COMMUNICATIONS -1.3 1.4 -1.9 1.1
BANKS & INSURANCE 13.3 10.0 9.4 -3.4
REAL ESTATE & HOUSING 5.7 5.8 4.6 7.8
GOVERNMENT SERVICES 4.0 5.2 4.6 24.9
OTHER SERVICES -0.6 8.7 4.8 -0.6
LESS: FISIM 1.6 1.8 18.0 4.2
Table 10.3B: Gross Value Added By Industry, in Current Basic Prices - Percentage Change
Fig 10.4: GVA by Industry in Current Basic Prices - Percentage Change
-30.0
-20.0
-10.0
0.0
10.0
20.0
30.0
40.0
50.0
2003 2004 2005 2006
Perc
ent
TOTAL AGRICULTURE MANUFACTURING SERVICES
117
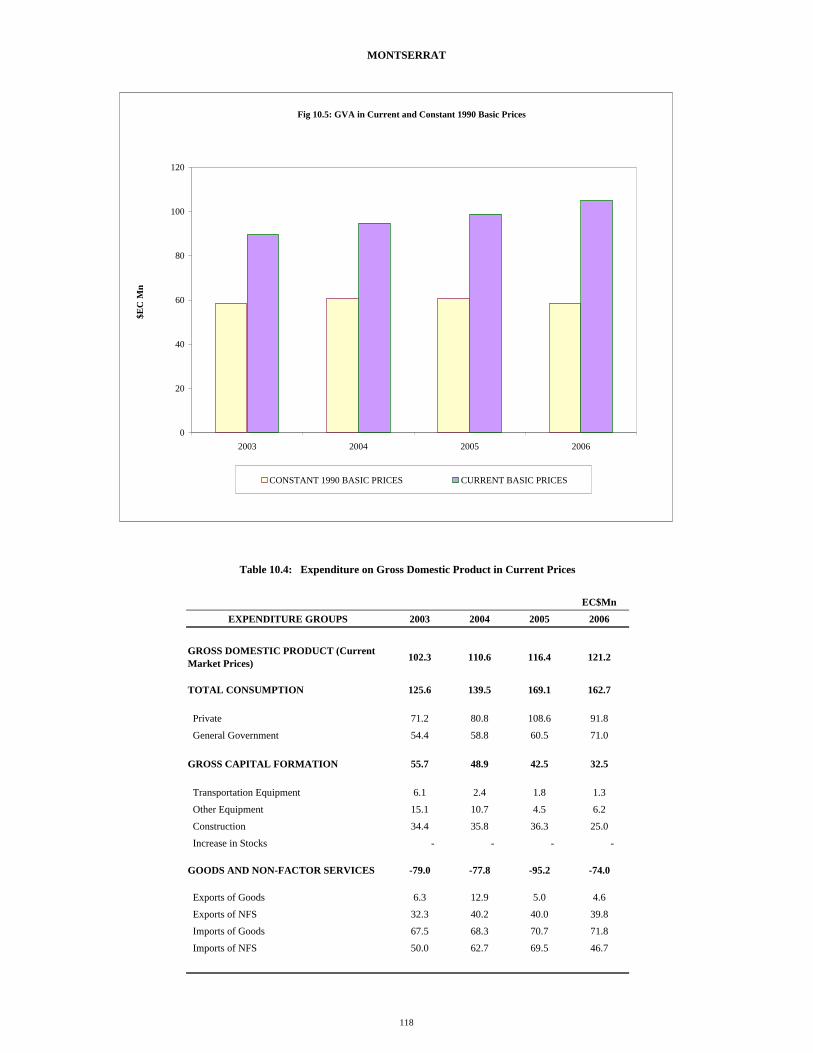
MONTSERRAT
EC$Mn
EXPENDITURE GROUPS 2003 2004 2005 2006
GROSS DOMESTIC PRODUCT (Current Market Prices) 102.3 110.6 116.4 121.2
TOTAL CONSUMPTION 125.6 139.5 169.1 162.7
Private 71.2 80.8 108.6 91.8
General Government 54.4 58.8 60.5 71.0
GROSS CAPITAL FORMATION 55.7 48.9 42.5 32.5
Transportation Equipment 6.1 2.4 1.8 1.3
Other Equipment 15.1 10.7 4.5 6.2
Construction 34.4 35.8 36.3 25.0
Increase in Stocks - - - -
GOODS AND NON-FACTOR SERVICES -79.0 -77.8 -95.2 -74.0
Exports of Goods 6.3 12.9 5.0 4.6
Exports of NFS 32.3 40.2 40.0 39.8
Imports of Goods 67.5 68.3 70.7 71.8
Imports of NFS 50.0 62.7 69.5 46.7
Table 10.4: Expenditure on Gross Domestic Product in Current Prices
Fig 10.5: GVA in Current and Constant 1990 Basic Prices
0
20
40
60
80
100
120
2003 2004 2005 2006
$EC
Mn
CONSTANT 1990 BASIC PRICES CURRENT BASIC PRICES
118

MONTSERRAT
EXPENDITURE GROUPS 2003 2004 2005 2006
GROSS DOMESTIC PRODUCT (Current Market Prices) 100.0 100.0 100.0 100.0
TOTAL CONSUMPTION 122.8 126.1 145.3 134.3
Private 69.6 73.0 93.3 75.7
General Government 53.2 53.1 52.0 58.5
GROSS CAPITAL FORMATION 54.4 44.2 36.6 26.8
Transportation Equipment 6.0 2.2 1.5 1.1
Other Equipment 14.7 9.7 3.9 5.1
Construction 33.7 32.4 31.2 20.6
Increase in Stocks - - - -
GOODS AND NON-FACTOR SERVICES -77.3 -70.4 -81.9 -61.1
Exports of Goods 6.1 11.7 4.3 3.8
Exports of NFS 31.6 36.3 34.4 32.9
Imports of Goods 66.0 61.7 60.8 59.2
Imports of NFS 48.9 56.6 59.7 38.6
Table 10.4A: Expenditure on Gross Domestic Product in Current Prices - Percentage Distribution
Fig 10.6: Expenditure on GDP in Current Prices: 2003
-100
-80
-60
-40
-20
0
20
40
60
80
100
120
Total GDP PrivateConsumption
GovernmentConsumption
Gross CapitalFormation
Goods and Non-factor Services
EC
$Mn
Fig 10.7: Expenditure on GDP in Current Prices : 2006
-100
-50
0
50
100
150
Total GDP PrivateConsumption
GovernmentConsumption
Gross CapitalFormation
Goods and Non-factor Services
EC
$Mn
119

120


ST KITTS AND NEVIS
EC$Mn
Industry 2003 2004 2005 2006
TOTAL 766.0 822.1 858.0 892.3
AGRICULTURE 23.1 25.8 25.1 19.8
MINING & QUARRYING 1.9 2.1 2.1 2.3
MANUFACTURING 81.3 84.3 86.9 83.2
ELECTRICITY & WATER 19.0 20.6 20.7 22.3
CONSTRUCTION 105.4 106.7 107.9 117.6
WHOLESALE & RETAIL TRADE 97.9 96.7 98.7 107.3
HOTELS & RESTAURANTS 56.3 73.1 79.4 82.6
TRANSPORT 60.5 81.1 82.3 83.2
COMMUNICATIONS 45.5 47.1 55.6 62.2
BANKS & INSURANCE 121.0 141.9 154.9 165.3
REAL ESTATE & HOUSING 21.8 22.2 22.4 23.7
GOVERNMENT SERVICES 156.5 160.6 166.1 171.9
OTHER SERVICES 35.2 36.3 38.2 40.7
LESS: FISIM 49.0 58.3 63.0 66.2
STATISTICAL DISCREPANCY1 -10.4 -18.1 -19.4 -23.5
Industry 2003 2004 2005 2006
TOTAL -1.2 7.3 4.4 4.0
AGRICULTURE -12.4 11.7 -2.5 -21.2
MINING & QUARRYING -46.3 9.9 4.0 7.7
MANUFACTURING -0.2 3.8 3.0 -4.2
ELECTRICITY & WATER 10.6 8.3 0.8 7.6
CONSTRUCTION -12.6 1.3 1.1 9.0
W/SALE & RETAIL TRADE 4.7 -1.3 2.1 8.6
HOTELS & RESTAURANTS 31.3 29.9 8.6 4.0
TRANSPORT -0.5 34.1 1.5 1.0
COMMUNICATIONS -4.4 3.4 18.1 11.8
BANKS & INSURANCE 2.2 17.3 9.2 6.7
REAL ESTATE & HOUSING 2.0 1.5 1.0 6.0
GOVERNMENT SERVICES -1.0 2.6 3.4 3.5
OTHER SERVICES 8.1 3.4 5.1 6.5
LESS: FISIM 1.2 19.0 8.1 5.0
Table 11.1: Gross Value Added By Industry in Constant 2000 Basic Prices
Table 11.1A: Gross Value Added By Industry in Constant 2000 Basic Prices - Percentage Change
Note: 1 Refers to statistical discrepancy which arose due to shifting of the base year from 1990 to a common base year across all Member States, 2000.
123

ST KITTS AND NEVIS
EC$Mn
Industry 2003 2004 2005 2006
TOTAL 555.5 596.2 622.2 647.1
AGRICULTURE 27.5 30.8 30.0 23.6
MINING & QUARRYING 1.8 2.0 2.1 2.2
MANUFACTURING 73.2 76.0 78.3 75.0
ELECTRICITY & WATER 12.8 13.9 14.0 15.1
CONSTRUCTION 88.6 89.7 90.7 98.9
W/SALE & RETAIL TRADE 70.3 69.4 70.9 77.0
HOTELS & RESTAURANTS 31.2 40.6 44.1 45.8
TRANSPORT 45.7 61.2 62.1 62.8
COMMUNICATIONS 53.2 55.0 64.9 72.6
BANKS & INSURANCE 72.6 85.2 93.0 99.2
REAL ESTATE & HOUSING 15.8 16.1 16.2 17.2
GOVERNMENT SERVICES 88.5 90.8 93.9 97.2
OTHER SERVICES 23.7 24.5 25.8 27.4
LESS: FISIM 49.5 58.9 63.7 66.9
Table 11.2: Gross Value Added By Industry in Constant 1990 Basic Prices
Fig 11.1: GVA by Industry in Constant 2000 Basic Prices - Percentage Change
-25.0
-20.0
-15.0
-10.0
-5.0
0.0
5.0
10.0
15.0
2003 2004 2005 2006
Perc
ent
TOTAL AGRICULTURE MANUFACTURING SERVICES
124

ST KITTS AND NEVIS
Industry 2003 2004 2005 2006
TOTAL 100.0 100.0 100.0 100.0
AGRICULTURE 5.0 5.2 4.8 3.7
MINING & QUARRYING 0.3 0.3 0.3 0.3
MANUFACTURING 13.2 12.7 12.6 11.6
ELECTRICITY & WATER 2.3 2.3 2.2 2.3
CONSTRUCTION 16.0 15.1 14.6 15.3
W/SALE & RETAIL TRADE 12.7 11.6 11.4 11.9
HOTELS & RESTAURANTS 5.6 6.8 7.1 7.1
TRANSPORT 8.2 10.3 10.0 9.7
COMMUNICATIONS 9.6 9.2 10.4 11.2
BANKS & INSURANCE 13.1 14.3 14.9 15.3
REAL ESTATE & HOUSING 2.8 2.7 2.6 2.7
GOVERNMENT SERVICES 15.9 15.2 15.1 15.0
OTHER SERVICES 4.3 4.1 4.1 4.2
LESS: FISIM 8.9 9.9 10.2 10.3
Table 11.2A: Gross Value Added By Industry in Constant 1990 Basic Prices - Percentage Distribution
Fig 11.2: GVA by Industry in Constant 1990 Basic Prices - Percentage
Distribution: 2003
13.216.0
12.7
13.1
15.9
29.2
MANUFACTURING CONSTRUCTION W/SALE & RETAIL TRADE BANKS & INSURANCE GOVERNMENT SERVICESOTHER
Fig 11.3: GVA by Industry in Constant 1990 Basic Prices -
Percentage Distribution: 2006
11.615.3
11.9
15.3
15.0
30.9
MANUFACTURING CONSTRUCTION W/SALE & RETAIL TRADE BANKS & INSURANCE GOVERNMENT SERVICESOTHER
125

ST KITTS AND NEVIS
EC$Mn
Industry 2003 2004 2005 2006
TOTAL 813.1 895.0 979.3 1061.2
AGRICULTURE 25.1 28.5 30.1 28.8
MINING & QUARRYING 2.3 2.6 2.7 3.0
MANUFACTURING 84.9 89.1 94.5 95.8
ELECTRICITY & WATER 23.7 24.4 26.2 28.6
CONSTRUCTION 119.8 131.0 133.1 151.4
W/SALE & RETAIL TRADE 104.2 105.3 111.1 131.7
HOTELS & RESTAURANTS 56.6 76.6 94.3 101.1
TRANSPORT 64.6 88.5 97.3 110.2
COMMUNICATIONS 47.5 49.2 55.1 59.8
BANKS & INSURANCE 131.3 146.7 182.7 197.2
REAL ESTATE & HOUSING 23.2 23.5 24.5 26.7
GOVERNMENT SERVICES 156.5 176.6 182.7 188.9
OTHER SERVICES 38.2 39.5 42.0 47.1
LESS: FISIM 64.7 86.5 97.1 109.2
Industry 2003 2004 2005 2006
TOTAL 100.0 100.0 100.0 100.0
AGRICULTURE 3.1 3.2 3.1 2.7
MINING & QUARRYING 0.3 0.3 0.3 0.3
MANUFACTURING 10.4 10.0 9.7 9.0
ELECTRICITY & WATER 2.9 2.7 2.7 2.7
CONSTRUCTION 14.7 14.6 13.6 14.3
W/SALE & RETAIL TRADE 12.8 11.8 11.3 12.4
HOTELS & RESTAURANTS 7.0 8.6 9.6 9.5
TRANSPORT 7.9 9.9 9.9 10.4
COMMUNICATIONS 5.8 5.5 5.6 5.6
BANKS & INSURANCE 16.1 16.4 18.7 18.6
REAL ESTATE & HOUSING 2.9 2.6 2.5 2.5
GOVERNMENT SERVICES 19.2 19.7 18.7 17.8
OTHER SERVICES 4.7 4.4 4.3 4.4
LESS: FISIM 8.0 9.7 9.9 10.3
Table 11.3: Gross Value Added By Industry in Current Basic Prices
Table 11.3A: Gross Value Added By Industry in Current Basic Prices - Percentage Distribution
126

ST KITTS AND NEVIS
Industry 2003 2004 2005 2006
TOTAL 1.4 10.1 9.4 8.4
AGRICULTURE -7.0 13.9 5.5 -4.5
MINING & QUARRYING -33.0 9.9 3.5 13.2
MANUFACTURING 14.1 4.9 6.1 1.4
ELECTRICITY & WATER 7.6 2.9 7.4 9.0
CONSTRUCTION -12.7 9.4 1.6 13.8
W/SALE & RETAIL TRADE 7.0 1.0 5.6 18.5
HOTELS & RESTAURANTS 31.2 35.3 23.1 7.1
TRANSPORT 1.2 37.2 9.8 13.3
COMMUNICATIONS -0.7 3.7 12.0 8.5
BANKS & INSURANCE 3.7 11.7 24.6 8.0
REAL ESTATE & HOUSING 5.1 1.5 4.0 9.2
GOVERNMENT SERVICES -1.0 12.9 3.4 3.4
OTHER SERVICES 10.6 3.4 6.2 12.4
LESS: FISIM 17.2 33.8 12.2 12.5
Table 11.3B: Gross Value Added By Industry in Current Basic Prices - Percentage Change
Figure 11.4: GVA by Industry in Current Basic Prices - Percentage Change
-10.0
-5.0
0.0
5.0
10.0
15.0
20.0
2003 2004 2005 2006
Perc
ent
TOTAL AGRICULTURE MANUFACTURING SERVICES
127

ST KITTS AND NEVIS
EC$Mn
EXPENDITURE GROUPS 2003 2004 2005 2006
GROSS DOMESTIC PRODUCT (Current Market Prices) 977.5 1078.9 1184.8 1319.1
TOTAL CONSUMPTION 777.5 735.4 827.7 1062.5
Private 594.1 518.0 595.9 822.7
General Government 183.5 217.4 231.8 239.7
GROSS FIXED CAPITAL FORMATION 445.4 472.3 501.4 498.7
Land Development - - - -
Transport Equipment 40.3 25.4 32.2 38.8
Other Equipment 114.8 129.4 146.6 110.2
Construction 290.4 317.5 322.6 349.8
GOODS AND NON-FACTOR SERVICES -245.5 -128.8 -144.4 -242.0
Exports of Goods 153.8 158.6 171.3 157.2
Exports of NFS 291.3 365.0 440.7 468.3
Imports of Goods 474.2 434.2 500.1 592.9
Imports of NFS 216.5 218.2 256.3 274.6
Table 11.4: Expenditure on Gross Domestic Product in Current Prices
Fig 11.5: GVA at Factor Cost in Current and Constant 1990 Basic Prices
0
200
400
600
800
1000
1200
2003 2004 2005 2006
$EC
Mn
CONSTANT 1990 BASIC PRICES CURRENT BASIC PRICES
128

ST KITTS AND NEVIS
EXPENDITURE GROUPS 2003 2004 2005 2006
GROSS DOMESTIC PRODUCT (Current Market Prices) 100.0 100.0 100.0 100.0
TOTAL CONSUMPTION 79.5 68.2 69.9 80.5
Private 60.8 48.0 50.3 62.4
General Government 18.8 20.2 19.6 18.2
GROSS FIXED CAPITAL FORMATION 45.6 43.8 42.3 37.8
Land Development 0.0 0.0 0.0 0.0
Transport Equipment 4.1 2.4 2.7 2.9
Other Equipment 11.7 12.0 12.4 8.4
Construction 29.7 29.4 27.2 26.5
GOODS AND NON-FACTOR SERVICES -25.1 -11.9 -12.2 -18.3
Exports of Goods 15.7 14.7 14.5 11.9
Exports of NFS 29.8 33.8 37.2 35.5
Imports of Goods 48.5 40.2 42.2 44.9
Imports of NFS 22.1 20.2 21.6 20.8
Table 11.4A: Expenditure on Gross Domestic Product in Current Prices - Percentage Distribution
Fig 11.6: Expenditure on GDP in Current Prices: 2003
-400
-200
0
200
400
600
800
1000
1200
Total GDP PrivateConsumption
GovernmentConsumption
Gross CapitalFormation
Goods and Non-factor Services
EC
$Mn
Fig 11.7: Expenditure on GDP in Current Prices: 2006
-400
-200
0
200
400
600
800
1000
1200
1400
Total GDP PrivateConsumption
GovernmentConsumption
Gross CapitalFormation
Goods and Non-factor Services
EC
$Mn
129

130


SAINT LUCIA
EC$Mn
Industry 2003 2004 2005 2006
TOTAL 1617.5 1690.8 1755.4 1832.7
AGRICULTURE 75.9 73.8 55.5 60.9
MINING & QUARRYING 6.0 5.9 5.7 6.8
MANUFACTURING 84.7 91.7 97.2 93.0
ELECTRICITY & WATER 90.3 92.0 79.7 72.8
CONSTRUCTION 120.2 121.4 136.6 154.7
WHOLESALE & RETAIL TRADE 189.0 204.9 216.8 236.4
HOTELS & RESTAURANTS 221.8 234.8 249.7 242.9
TRANSPORT 181.2 194.5 192.5 217.5
COMMUNICATIONS 139.9 146.3 157.1 158.7
BANKS & INSURANCE 152.7 160.2 174.1 212.1
REAL ESTATE & HOUSING 164.1 169.5 179.2 183.8
GOVERNMENT SERVICES 236.0 245.6 266.1 271.7
OTHER SERVICES 71.2 71.6 73.0 75.8
LESS: FISIM 129.0 135.2 145.1 171.5
STATISTICAL DISCREPANCY1 13.4 13.6 17.3 17.2
Industry 2003 2004 2005 2006
TOTAL 3.1 4.5 3.8 4.4
AGRICULTURE -15.7 -2.9 -24.7 9.8
MINING & QUARRYING 0.2 -2.2 -3.5 19.8
MANUFACTURING -1.7 8.3 5.9 -4.4
ELECTRICITY & WATER 1.9 1.9 -13.4 -8.6
CONSTRUCTION 1.6 1.0 12.5 13.2
W/SALE & RETAIL TRADE 7.8 8.4 5.8 9.0
HOTELS & RESTAURANTS 16.6 5.9 6.3 -2.7
TRANSPORT 4.3 7.3 -1.0 13.0
COMMUNICATIONS 4.5 4.6 7.3 1.0
BANKS & INSURANCE 2.0 4.9 8.7 21.8
REAL ESTATE & HOUSING 3.3 3.3 5.7 2.6
GOVERNMENT SERVICES -2.1 4.1 8.4 2.1
OTHER SERVICES 0.0 0.6 1.9 3.9
LESS: FISIM 1.6 4.8 7.4 18.2
Table 12.1: Gross Value Added By Industry in Constant 2000 Basic Prices
Table 12.1A: Gross Value Added By Industry in Constant 2000 Basic Prices - Percentage Change
Note: 1 Refers to statistical discrepancy which arose due to shifting of the base year from 1990 to a common base year across all Member States, 2000.
133

SAINT LUCIA
EC$Mn
Industry 2003 2004 2005 2006
TOTAL 1234.6 1290.6 1339.9 1398.9
AGRICULTURE 56.7 55.1 41.5 45.5
MINING & QUARRYING 5.8 5.7 5.5 6.6
MANUFACTURING 79.3 85.8 90.9 87.0
ELECTRICITY & WATER 63.4 64.6 56.0 51.1
CONSTRUCTION 95.7 96.7 108.8 123.2
W/SALE & RETAIL TRADE 136.2 147.7 156.3 170.4
HOTELS & RESTAURANTS 161.4 170.9 181.7 176.7
TRANSPORT 126.0 135.2 133.8 151.2
COMMUNICATIONS 135.4 141.7 152.1 153.6
BANKS & INSURANCE 131.9 138.4 150.4 183.2
REAL ESTATE & HOUSING 154.6 159.7 168.8 173.2
GOVERNMENT SERVICES 143.9 149.8 162.3 165.7
OTHER SERVICES 54.3 54.6 55.6 57.8
LESS: FISIM 110.0 115.2 123.7 146.2
Table 12.2: Gross Value Added By Industry in Constant 1990 Basic Prices
Fig 12.1: GVA by Industry in Constant 2000 Basic Prices - Percentage Change
-30.0
-25.0
-20.0
-15.0
-10.0
-5.0
0.0
5.0
10.0
15.0
2003 2004 2005 2006
Perc
ent
TOTAL AGRICULTURE MANUFACTURING SERVICES
134

SAINT LUCIA
Industry 2003 2004 2005 2006
TOTAL 100.0 100.0 100.0 100.0
AGRICULTURE 4.6 4.3 3.1 3.2
MINING & QUARRYING 0.5 0.4 0.4 0.5
MANUFACTURING 6.4 6.6 6.8 6.9
ELECTRICITY & WATER 5.1 5.0 4.2 4.6
CONSTRUCTION 7.8 7.5 8.1 8.8
W/SALE & RETAIL TRADE 11.0 11.4 11.7 12.1
HOTELS & RESTAURANTS 13.1 13.2 13.6 12.6
TRANSPORT 10.2 10.5 10.0 9.6
COMMUNICATIONS 11.0 11.0 11.3 10.8
BANKS & INSURANCE 10.7 10.7 11.2 12.6
REAL ESTATE & HOUSING 12.5 12.4 12.6 12.3
GOVERNMENT SERVICES 11.7 11.6 12.1 12.7
OTHER SERVICES 4.4 4.2 4.1 4.1
LESS: FISIM 8.9 8.9 9.2 10.7
Table 12.2A: Gross Value Added By Industry in Constant 1990 Basic Prices - Percentage Distribution
Fig 12.2: GVA by Industry in Constant 1990 Basic Prices - Percentage
Distribution, 2003
11.013.1
10.2
12.5
11.7
41.5
W/SALE & RETAIL TRADE HOTELS & RESTAURANTS TRANSPORT REAL ESTATE & HOUSING GOVERNMENT SERVICESOTHER SECTORS
Fig 12.3: GVA by Industry in Constant 1990 Basic Prices - Percentage
Distribution, 2006
12.112.6
9.6
12.6
12.740.4
W/SALE & RETAIL TRADE HOTELS & RESTAURANTS TRANSPORT BANKS & INSURANCE GOVERNMENT SERVICESOTHER SECTORS
135

SAINT LUCIA
EC$Mn
Industry 2003 2004 2005 2006
TOTAL 1666.8 1778.5 1903.0 2017.1
AGRICULTURE 85.0 91.7 74.8 80.8
MINING & QUARRYING 6.0 5.9 5.7 6.8
MANUFACTURING 83.8 93.0 112.8 125.4
ELECTRICITY & WATER 89.2 99.5 97.1 99.2
CONSTRUCTION 114.0 119.0 150.9 187.5
W/SALE & RETAIL TRADE 195.2 215.3 239.6 248.7
HOTELS & RESTAURANTS 235.2 252.6 279.1 277.8
TRANSPORT 191.6 206.3 206.4 205.5
COMMUNICATIONS 140.4 147.7 161.0 165.2
BANKS & INSURANCE 169.6 178.9 194.6 201.4
REAL ESTATE & HOUSING 161.8 167.4 172.3 188.8
GOVERNMENT SERVICES 248.1 261.2 282.1 302.4
OTHER SERVICES 82.1 85.0 85.7 89.2
LESS: FISIM 135.3 144.9 159.0 161.5
EC$Mn
Industry 2003 2004 2005 2006
TOTAL 100.0 100.0 100.0 100.0
AGRICULTURE 5.1 5.2 3.9 4.0
MINING & QUARRYING 0.4 0.3 0.3 0.3
MANUFACTURING 5.0 5.2 5.9 6.2
ELECTRICITY & WATER 5.4 5.6 5.1 4.9
CONSTRUCTION 6.8 6.7 7.9 9.3
W/SALE & RETAIL TRADE 11.7 12.1 12.6 12.3
HOTELS & RESTAURANTS 14.1 14.2 14.7 13.8
TRANSPORT 11.5 11.6 10.8 10.2
COMMUNICATIONS 8.4 8.3 8.5 8.2
BANKS & INSURANCE 10.2 10.1 10.2 10.0
REAL ESTATE & HOUSING 9.7 9.4 9.1 9.4
GOVERNMENT SERVICES 14.9 14.7 14.8 15.0
OTHER SERVICES 4.9 4.8 4.5 4.4
LESS: FISIM 8.1 8.1 8.4 8.0
Table 12.3: Gross Value Added By Industry in Current Basic Prices
Table 12.3A: Gross Value Added By Industry in Current Basic Prices - Percentage Distribution
136

SAINT LUCIA
Industry 2003 2004 2005 2006
TOTAL 4.7 6.7 7.0 6.0
AGRICULTURE -9.7 7.8 -18.4 8.0
MINING & QUARRYING -0.3 -2.2 -3.7 20.1
MANUFACTURING 12.8 11.0 21.3 11.1
ELECTRICITY & WATER 8.5 11.5 -2.3 2.1
CONSTRUCTION -3.7 4.4 26.7 24.3
W/SALE & RETAIL TRADE 9.4 10.3 11.3 3.8
HOTELS & RESTAURANTS 17.8 7.4 10.5 -0.4
TRANSPORT 1.6 7.7 0.0 -0.4
COMMUNICATIONS 6.4 5.2 9.0 2.6
BANKS & INSURANCE 5.7 5.4 8.8 3.5
REAL ESTATE & HOUSING 3.5 3.4 3.0 9.5
GOVERNMENT SERVICES 0.3 5.3 8.0 7.2
OTHER SERVICES 2.2 3.5 0.9 4.0
LESS: FISIM 6.7 7.1 9.8 1.5
Table 12.3B: Gross Value Added By Industry in Current Basic Prices - Percentage Change
Fig 12.4: GVA by Industry in Current Basic Prices - Percentage Change
-25.0
-20.0
-15.0
-10.0
-5.0
0.0
5.0
10.0
15.0
20.0
25.0
2003 2004 2005 2006
Perc
ent
TOTAL AGRICULTURE MANUFACTURING SERVICES
137

SAINT LUCIA
EC$Mn
EXPENDITURE GROUPS 2003 2004 2005 2006
GROSS DOMESTIC PRODUCT (Current Market Prices) 2005.9 2154.0 2295.4 2464.4
TOTAL CONSUMPTION 1892.7 1789.4 1988.8 2427.3
Private 1477.9 1377.2 1551.9 2012.9
General Government 414.7 412.2 436.9 414.4
GROSS CAPITAL FORMATION 408.4 451.8 551.2 736.2
Transport Equiptment 46.6 64.9 91.9 168.6
Other Equiptment 91.1 101.6 115.6 122.3
Construction 270.7 285.3 343.7 445.4
GOODS AND NON-FACTOR SERVICES -295.1 -87.2 -244.6 -699.2
Exports of Goods 193.8 260.0 239.7 260.9
Exports of NFS 859.5 991.3 1108.3 902.4
Imports of Goods 957.2 939.6 1128.9 1406.5
Imports of NFS 391.3 398.9 463.6 456.0
Table 12.4: Expenditure on Gross Domestic Product in Current Prices
Fig 12.5: GVA at Factor Cost in Current and Constant 1990 Basic Prices
0
500
1000
1500
2000
2500
2003 2004 2005 2006
$EC
Mn
CONSTANT 1990 BASIC PRICES CURRENT BASIC PRICES
138

SAINT LUCIA
EXPENDITURE GROUPS 2003 2004 2005 2006
GROSS DOMESTIC PRODUCT (Current Market Prices) 100.0 100.0 100.0 100.0
TOTAL CONSUMPTION 94.4 83.1 86.6 98.5
Private 73.7 63.9 67.6 81.7
General Government 20.7 19.1 19.0 16.8
GROSS CAPITAL FORMATION 20.4 21.0 24.0 29.9
Transport Equiptment 2.3 3.0 4.0 6.8
Other Equiptment 4.5 4.7 5.0 5.0
Construction 13.5 13.2 15.0 18.1
GOODS AND NON-FACTOR SERVICES -14.7 -4.0 -10.7 -28.4
Exports of Goods 9.7 12.1 10.4 10.6
Exports of NFS 42.8 46.0 48.3 36.6
Imports of Goods 47.7 43.6 49.2 57.1
Imports of NFS 19.5 18.5 20.2 18.5
Table 12.4A: Expenditure on Gross Domestic Product in Current Prices - Percentage Distribution
Fig 12.6: Expenditure on GDP in Current Prices: 2003
-500
0
500
1000
1500
2000
2500
GDP PrivateConsumption
GovernmentConsumption
Gross CapitalFormation
Goods and Non-factor Services
EC
$Mn
Fig 12.7: Expenditure on GDP in Current Prices : 2006
-1000
-500
0
500
1000
1500
2000
2500
3000
GDP PrivateConsumption
GovernmentConsumption
Gross CapitalFormation
Goods and Non-factor Services
EC
$Mn
139

140


ST VINCENT AND THE GRENADINES
EC$Mn
Industry 2003 2004 2005 2006
TOTAL 807.4 862.3 884.6 952.1
AGRICULTURE 80.2 76.0 73.0 77.9
MINING & QUARRYING 1.9 2.0 2.1 2.2
MANUFACTURING 46.0 47.5 48.2 49.8
ELECTRICITY & WATER 60.1 64.3 69.7 71.1
CONSTRUCTION 96.7 110.9 111.4 124.6
WHOLESALE & RETAIL TRADE 153.6 168.6 176.1 187.7
HOTELS & RESTAURANTS 15.2 16.3 17.8 17.7
TRANSPORT 121.9 134.3 133.3 156.7
COMMUNICATIONS 44.6 53.3 52.7 58.1
BANKS & INSURANCE 63.8 65.7 72.5 76.5
REAL ESTATE & HOUSING 19.2 19.5 19.8 20.5
GOVERNMENT SERVICES 153.5 157.4 165.7 173.3
OTHER SERVICES 17.3 18.4 20.2 21.0
LESS: FISIM 56.0 61.6 65.6 71.7
STATISTICAL DISCREPANCY1 -10.5 -10.3 -12.4 -13.3
Industry 2003 2004 2005 2006
TOTAL 2.8 6.8 2.6 7.6
AGRICULTURE -2.2 -5.2 -3.9 6.8
MINING & QUARRYING 5.0 6.5 2.8 8.1
MANUFACTURING 0.7 3.3 1.6 3.2
ELECTRICITY & WATER 7.5 7.1 8.4 2.0
CONSTRUCTION 8.2 14.7 0.4 11.9
W/SALE & RETAIL TRADE 4.2 9.8 4.4 6.6
HOTELS & RESTAURANTS -5.7 7.3 9.5 -0.8
TRANSPORT 7.8 10.1 -0.7 17.5
COMMUNICATIONS -2.0 19.3 -1.1 10.3
BANKS & INSURANCE 3.5 3.1 10.4 5.4
REAL ESTATE & HOUSING 1.5 1.5 1.5 3.4
GOVERNMENT SERVICES 2.5 2.5 5.3 4.6
OTHER SERVICES 7.9 6.0 10.0 4.1
LESS: FISIM 8.5 10.0 6.5 9.3
Table 13.1: Gross Value Added By Industry in Constant 2000 Basic Prices
Table 13.1A: Gross Value Added By Industry in Constant 2000 Basic Prices - Percentage Change
Note: 1 Refers to statistical discrepancy which arose due to shifting of the base year from 1990 to a common base year across all MembStates, 2000.
143

ST VINCENT AND THE GRENADINES
EC$Mn
Industry 2003 2004 2005 2006
TOTAL 649.5 693.7 711.6 766.0
AGRICULTURE 72.0 68.3 65.6 70.0
MINING & QUARRYING 1.7 1.8 1.9 2.0
MANUFACTURING 37.9 39.1 39.7 41.0
ELECTRICITY & WATER 46.4 49.7 53.9 55.0
CONSTRUCTION 61.3 70.3 70.6 79.0
W/SALE & RETAIL TRADE 120.2 132.0 137.9 147.0
HOTELS & RESTAURANTS 12.9 13.8 15.1 15.0
TRANSPORT 96.6 106.4 105.6 124.1
COMMUNICATIONS 61.3 73.2 72.4 79.9
BANKS & INSURANCE 63.4 65.3 72.1 76.0
REAL ESTATE & HOUSING 16.9 17.1 17.4 18.0
GOVERNMENT SERVICES 102.7 105.3 110.9 116.0
OTHER SERVICES 12.4 13.1 14.4 15.0
LESS: FISIM 56.2 61.8 65.9 72.0
Table 13.2: Gross Value Added By Industry in Constant 1990 Basic Prices
Fig 13.1: GVA by Industry in Constant 2000 Basic Prices - Percentage Change
-6.0
-4.0
-2.0
0.0
2.0
4.0
6.0
8.0
10.0
2003 2004 2005 2006
Perc
ent
TOTAL AGRICULTURE MANUFACTURING SERVICES
144

ST VINCENT AND THE GRENADINES
Industry 2003 2004 2005 2006
TOTAL 100.0 100.0 100.0 100.0
AGRICULTURE 11.1 9.8 9.2 9.3
MINING & QUARRYING 0.3 0.3 0.3 0.3
MANUFACTURING 5.8 5.6 5.6 5.4
ELECTRICITY & WATER 7.1 7.2 7.6 7.2
CONSTRUCTION 9.4 10.1 9.9 10.3
W/SALE & RETAIL TRADE 18.5 19.0 19.4 19.4
HOTELS & RESTAURANTS 2.0 2.0 2.1 2.0
TRANSPORT 14.9 15.3 14.8 16.4
COMMUNICATIONS 9.4 10.5 10.2 9.7
BANKS & INSURANCE 9.8 9.4 10.1 10.0
REAL ESTATE & HOUSING 2.6 2.5 2.4 2.3
GOVERNMENT SERVICES 15.8 15.2 15.6 15.2
OTHER SERVICES 1.9 1.9 2.0 2.0
LESS: FISIM 8.7 8.9 9.3 9.5
Table 13.2A: Gross Value Added By Industry in Constant 1990 Basic Prices - Percentage Distribution
Fig 13.2 GVA by Industry in Constant 1990 Basic Prices - Percentage Distribution, 2003
11.1
9.4
18.5
14.9
15.8
30.3
AGRICULTURE CONSTRUCTION W/SALE & RETAIL TRADE TRANSPORT GOVERNMENT SERVICESOTHER SECTORS
Fig 13.3: GVA by Industry in Constant 1990 Basic Prices - Percentage Distribution, 2006
9.3
10.3
19.4
16.4
15.2
29.4
AGRICULTURE CONSTRUCTION W/SALE & RETAIL TRADE TRANSPORT GOVERNMENT SERVICESOTHER SECTORS
145

ST VINCENT AND THE GRENADINES
EC$Mn
Industry 2003 2004 2005 2006
TOTAL 852.3 928.4 987.9 1084.6
AGRICULTURE 74.6 76.0 81.3 83.7
MINING & QUARRYING 2.0 2.2 2.2 2.5
MANUFACTURING 49.6 54.3 59.4 52.7
ELECTRICITY & WATER 56.2 54.5 55.0 56.9
CONSTRUCTION 100.7 117.2 119.6 154.9
W/SALE & RETAIL TRADE 156.6 177.0 191.8 211.0
HOTELS & RESTAURANTS 19.3 20.7 22.7 22.9
TRANSPORT 118.4 131.1 132.7 155.9
COMMUNICATIONS 48.8 58.5 55.7 61.4
BANKS & INSURANCE 81.2 92.8 115.9 119.8
REAL ESTATE & HOUSING 19.9 20.6 21.3 22.4
GOVERNMENT SERVICES 162.1 172.3 187.4 203.8
OTHER SERVICES 17.6 18.7 20.5 21.9
LESS: FISIM 54.7 67.3 77.7 85.1
Industry 2003 2004 2005 2006
TOTAL 100.0 100.0 100.0 100.0
AGRICULTURE 8.8 8.2 8.2 7.7
MINING & QUARRYING 0.2 0.2 0.2 0.2
MANUFACTURING 5.8 5.8 6.0 4.9
ELECTRICITY & WATER 6.6 5.9 5.6 5.2
CONSTRUCTION 11.8 12.6 12.1 14.3
W/SALE & RETAIL TRADE 18.4 19.1 19.4 19.5
HOTELS & RESTAURANTS 2.3 2.2 2.3 2.1
TRANSPORT 13.9 14.1 13.4 14.4
COMMUNICATIONS 5.7 6.3 5.6 5.7
BANKS & INSURANCE 9.5 10.0 11.7 11.0
REAL ESTATE & HOUSING 2.3 2.2 2.2 2.1
GOVERNMENT SERVICES 19.0 18.6 19.0 18.8
OTHER SERVICES 2.1 2.0 2.1 2.0
LESS: FISIM 6.4 7.2 7.9 7.8
Table 13.3: Gross Value Added By Industry in Current Basic Prices
Table 13.3A: Gross Value Added By Industry in Current Basic Prices - Percentage Distribution
146

ST VINCENT AND THE GRENADINES
Industry 2003 2004 2005 2006
TOTAL 4.3 8.9 6.4 9.8
AGRICULTURE -7.4 1.8 6.9 3.0
MINING & QUARRYING 5.9 10.7 2.8 11.2
MANUFACTURING -9.0 9.5 9.4 -11.3
ELECTRICITY & WATER 13.1 -3.0 0.9 3.3
CONSTRUCTION 8.7 16.4 2.0 29.6
W/SALE & RETAIL TRADE 4.5 13.0 8.4 10.0
HOTELS & RESTAURANTS 13.1 7.3 9.5 1.0
TRANSPORT 5.4 10.7 1.3 17.5
COMMUNICATIONS -1.5 19.9 -4.8 10.2
BANKS & INSURANCE 29.7 14.2 24.9 3.4
REAL ESTATE & HOUSING 3.5 3.5 3.5 5.1
GOVERNMENT SERVICES -0.3 6.3 8.8 8.7
OTHER SERVICES 7.9 6.0 10.0 6.6
LESS: FISIM 5.9 23.0 15.5 9.5
Table 13.3B: Gross Value Added By Industry in Current Basic Prices - Percentage Change
Fig 13.4: GVA by Industry in Current Basic Prices - Percentage Change
-15.0
-10.0
-5.0
0.0
5.0
10.0
15.0
2003 2004 2005 2006
Perc
ent
TOTAL AGRICULTURE MANUFACTURING SERVICES
147

ST VINCENT AND THE GRENADINES
EC$Mn
EXPENDITURE GROUPS 2003 2004 2005 2006
GROSS DOMESTIC PRODUCT (Current Market Prices) 1,032.1 1,135.7 1,201.8 1,344.4
TOTAL CONSUMPTION 873.3 1,012.6 1,065.9 1,187.2
Private 671.6 791.5 831.8 938.9
General Government 201.6 221.1 234.1 248.4
GROSS CAPITAL FORMATION 343.9 359.9 380.6 470.6
Transport Equiptment 16.1 24.4 23.2 39.3
Other Machinery and Equipment 120.9 98.4 115.8 118.1
Construction 206.9 237.1 241.6 313.1
Land development - - - -
Increase in Stocks - - - -
GOODS AND NON-FACTOR SERVICES -185.1 -236.8 -244.8 -313.4
Exports of Goods 108.2 106.0 114.9 111.1
Exports of NFS 358.5 392.1 426.5 461.3
Imports of Goods 477.4 537.2 573.5 647.1
Imports of NFS 174.4 197.7 212.8 238.8
Table 13.4: Expenditure on Gross Domestic Product in Current Prices
Fig 13.5: GVA by Industry in Current and Constant 1990 Basic Prices
0
200
400
600
800
1000
1200
2003 2004 2005 2006
$EC
Mn
CONSTANT 1990 BASIC PRICES CURRENT BASIC PRICES
148

ST VINCENT AND THE GRENADINES
EXPENDITURE GROUPS 2003 2004 2005 2006
GROSS DOMESTIC PRODUCT (Current Market Prices) 100.0 100.0 100.0 100.0
TOTAL CONSUMPTION 84.6 89.2 88.7 88.3
Private 65.1 69.7 69.2 69.8
General Government 19.5 19.5 19.5 18.5
GROSS CAPITAL FORMATION 33.3 31.7 31.7 35.0
Transport Equiptment 1.6 2.2 1.9 2.9
Other Machinery and Equip. 11.7 8.7 9.6 8.8
Construction 20.0 20.9 20.1 23.3
Land development - - - -
Increase in Stocks - - - -
GOODS AND NON-FACTOR SERVICES -17.9 -20.9 -20.4 -23.3
Exports of Goods 10.5 9.3 9.6 8.3
Exports of NFS 34.7 34.5 35.5 34.3
Imports of Goods 46.3 47.3 47.7 48.1
Imports of NFS 16.9 17.4 17.7 17.8
Table 13.4A: Expenditure on Gross Domestic Product in Current Prices - Percentage Distribution
Fig 13.6: Expenditure on GDP in Current Prices: 2003
-400
-200
0
200
400
600
800
1000
1200
Total GDP PrivateConsumption
GovernmentConsumption
Gross CapitalFormation
Goods and Non-factor Services
EC
$Mn
Fig 13.7: Expenditure on GDP in Current Prices : 2006
-400
-200
0
200
400
600
800
1000
1200
1400
1600
Total GDP PrivateConsumption
GovernmentConsumption
Gross CapitalFormation
Goods and Non-factor Services
EC
$Mn
149

150


SURINAME
EC$Mn
Industry 2003 2004 2005 2006
TOTAL 2,265.4 2,437.9 2,596.5 2,718.2
AGRICULTURE 267.3 269.6 256.2 269.6
MINING & QUARRYING 125.6 163.3 188.3 194.8
MANUFACTURING 409.9 454.2 500.6 509.4
GAS, WATER & ELECTRICITY 104.4 114.9 118.7 128.7
CONSTRUCTION 85.5 94.2 102.4 107.6
TRADE, RESTAURANTS & HOTELS 347.7 368.5 398.3 459.3
T/PORT, STORAGE & COMMUN. 263.8 284.3 306.7 296.0
FINAN. & BUS. SERVICES 331.1 348.9 363.6 370.1
PUBLIC ADMINISTRATION 201.8 200.8 212.6 225.6
PERS., SOC. & OTHER COMM. SERV. 195.5 198.7 206.2 210.5
LESS: FISIM 83.6 85.3 88.3 89.2
STATISTICAL DISCREPANCY1 16.4 25.8 31.1 35.6
Industry 2003 2004 2005 2006
TOTAL 6.9 7.6 6.5 4.7
AGRICULTURE 3.7 0.9 -5.0 5.2
MINING & QUARRYING 0.1 30.1 15.3 3.5
MANUFACTURING 5.4 10.8 10.2 1.8
GAS, WATER & ELECTRICITY -1.1 10.1 3.3 8.4
CONSTRUCTION 17.0 10.1 8.7 5.1
TRADE, RESTAURANTS & HOTELS 32.1 6.0 8.1 15.3
T/PORT, STORAGE & COMMUN. 3.0 7.8 7.9 -3.5
FINAN. & BUS. SERVICES 2.5 5.4 4.2 1.8
PUBLIC ADMINISTRATION -0.2 -0.5 5.9 6.1
PERS., SOC. & OTHER COMM. SERV. 0.6 1.7 3.8 2.1
LESS: FISIM 6.0 2.0 3.5 1.1
Table 14.1A: Gross Domestic Product By Industry in Constant 2000 Basic Prices - Percentage Change
Table 14.1: Gross Domestic Product By Industry in Constant 2000 Basic Prices
Note: 1 Refers to statistical discrepancy which arose due to shifting of the base year from 1990 to a common base year across all Member States, 2000.
153

SURINAME
SF MnIndustry 2003 2004 2005 2006
TOTAL 3,579.5 3,852.1 4,102.7 4,295.0
AGRICULTURE 339.0 342.0 325.0 342.0
MINING & QUARRYING 211.4 275.0 317.0 328.0
MANUFACTURING 467.5 518.0 571.0 581.0
GAS, WATER & ELECTRICITY 209.3 230.4 238.0 258.0
CONSTRUCTION 190.7 210.0 228.3 240.0
TRADE, RESTAURANTS & HOTELS 620.7 657.9 711.0 820.0
T/PORT, STORAGE & COMMUN. 516.9 557.0 601.0 580.0
FINAN. & BUS. SERVICES 739.9 779.6 812.4 827.0
PUBLIC ADMINISTRATION 253.1 251.9 266.7 283.0
PERS., SOC. & OTHER COMM. SERV. 300.8 305.8 317.3 324.0
LESS: FISIM 269.9 275.4 285.0 288.0
Table 14.2: Gross Domestic Product By Industry in Constant 1990 Basic Prices
Fig 14.1: GDP by Industry in Constant 2000 Basic Prices - Percentage Change (Based on EC$Mn)
-6.0
-4.0
-2.0
0.0
2.0
4.0
6.0
8.0
10.0
12.0
2003 2004 2005 2006
Perc
ent
TOTAL AGRICULTURE MANUFACTURING SERVICES
154

SURINAME
Industry 2003 2004 2005 2006
TOTAL 100.0 100.0 100.0 100.0
AGRICULTURE 9.5 8.9 7.9 8.0
MINING & QUARRYING 5.9 7.1 7.7 7.6
MANUFACTURING 13.1 13.4 13.9 13.5
GAS, WATER & ELECTRICITY 5.8 6.0 5.8 6.0
CONSTRUCTION 5.3 5.5 5.6 5.6
TRADE, RESTAURANTS & HOTELS 17.3 17.1 17.3 19.1
T/PORT, STORAGE & COMMUN. 14.4 14.5 14.6 13.5
FINAN. & BUS. SERVICES 20.7 20.2 19.8 19.3
PUBLIC ADMINISTRATION 7.1 6.5 6.5 6.6
PERS., SOC. & OTHER COMM. SERV. 8.4 7.9 7.7 7.5
LESS: FISIM 7.5 7.1 6.9 6.7
Table 14.2A: Gross Domestic Product By Industry in Constant 1990 Basic Prices - Percentage Distribution
Fig 14.2: GDP By Industry in Constant 1990 Basic Prices - Percentage Distribution, 2003
13.117.3
14.4
20.7
25.0
AGRICULTURE
MANUFACTURING
TRADE, RESTAURANTS & HOTELS
T/PORT, STORAGE & COMMUN.
FINAN. & BUS. SERVICES
OTHER
Fig 14.3: GDP By Industry in Constant 1990 Basic Prices - Percentage Distribution, 2006
8.0
13.5
19.1
13.5
19.3
26.7
AGRICULTURE
MANUFACTURING
TRADE, RESTAURANTS & HOTELS
T/PORT, STORAGE & COMMUN.
FINAN. & BUS. SERVICES
OTHER
155

SURINAME
SF MnIndustry 2003 2004 2005 2006
TOTAL 2,449,928.8 3,023,187.1 3,736,009.6 4,436,581.3
AGRICULTURE 214,749.0 212,771.2 240,401.2 271,482.8
MINING & QUARRYING 215,025.0 335,861.0 458,855.0 562,840.0
MANUFACTURING 426,017.0 613,947.0 818,302.0 1,035,577.0
GAS, WATER & ELECTRICITY 160,899.0 190,105.0 223,545.0 245,184.0
CONSTRUCTION 86,224.0 118,768.0 153,076.0 200,634.0
TRADE, RESTAURANTS & HOTELS 356,165.5 397,135.2 510,568.3 593,870.0
T/PORT, STORAGE & COMMUN. 247,017.0 295,672.7 350,904.1 364,890.6
FINAN. & BUS. SERVICES 353,941.0 459,979.0 575,965.0 711,426.0
PUBLIC ADMINISTRATION 244,916.0 266,014.0 309,547.0 340,246.0
PERS., SOC. & OTHER COMM. SERV. 223,705.0 239,896.0 261,063.0 324,558.0
LESS: FISIM 78,729.7 106,962.0 166,217.0 214,127.0
Industry 2003 2004 2005 2006
TOTAL 24.6 23.4 23.6 18.8
AGRICULTURE 24.6 -0.9 13.0 12.9
MINING & QUARRYING 20.6 56.2 36.6 22.7
MANUFACTURING 22.6 44.1 33.3 26.6
GAS, WATER & ELECTRICITY 8.0 18.2 17.6 9.7
CONSTRUCTION 39.1 37.7 28.9 31.1
TRADE, RESTAURANTS & HOTELS 70.5 11.5 28.6 16.3
T/PORT, STORAGE & COMMUN. 23.4 19.7 18.7 4.0
FINAN. & BUS. SERVICES 20.9 30.0 25.2 23.5
PUBLIC ADMINISTRATION 10.4 8.6 16.4 9.9
PERS., SOC. & OTHER COMM. SERV. 11.0 7.2 8.8 24.3
LESS: FISIM 15.5 35.9 55.4 28.8
Table 14.3: Gross Domestic Product By Industry in Current Basic Prices
Table 14.3A: Gross Domestic Product By Industry in Current Basic Prices - Percentage Change
156
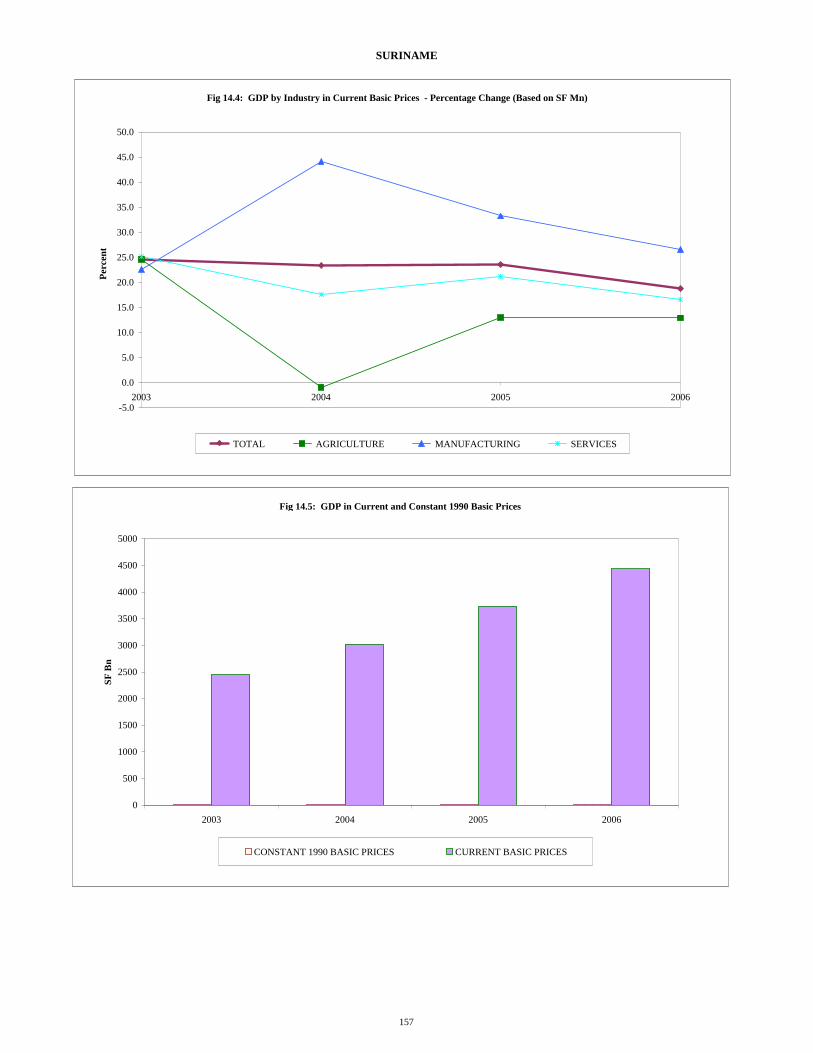
SURINAME
Fig 14.5: GDP in Current and Constant 1990 Basic Prices
0
500
1000
1500
2000
2500
3000
3500
4000
4500
5000
2003 2004 2005 2006
SF B
n
CONSTANT 1990 BASIC PRICES CURRENT BASIC PRICES
Fig 14.4: GDP by Industry in Current Basic Prices - Percentage Change (Based on SF Mn)
-5.0
0.0
5.0
10.0
15.0
20.0
25.0
30.0
35.0
40.0
45.0
50.0
2003 2004 2005 2006
Perc
ent
TOTAL AGRICULTURE MANUFACTURING SERVICES
157

SURINAME
EC$Mn Industry 2003 2004 2005 2006
TOTAL 2,516.7 2,986.0 3,695.1 4,367.8
AGRICULTURE 220.6 210.2 237.8 267.3
MINING & QUARRYING 220.9 331.7 453.8 554.1
MANUFACTURING 437.6 606.4 809.3 1,019.5
GAS, WATER & ELECTRICITY 165.3 187.8 221.1 241.4
CONSTRUCTION 88.6 117.3 151.4 197.5
TRADE, RESTAURANTS & HOTELS 365.9 392.3 505.0 584.7
T/PORT, STORAGE & COMMUN. 253.8 292.0 347.1 359.2
FINAN. & BUS. SERVICES 363.6 454.3 569.7 700.4
PUBLIC ADMINISTRATION 251.6 262.7 306.2 335.0
PERS., SOC. & OTHER COMM. SERV. 229.8 236.9 258.2 319.5
LESS: FISIM 80.9 105.6 164.4 210.8
Industry 2003 2004 2005 2006
TOTAL 100.0 100.0 100.0 100.0
AGRICULTURE 8.8 7.0 6.4 6.1
MINING & QUARRYING 8.8 11.1 12.3 12.7
MANUFACTURING 17.4 20.3 21.9 23.3
GAS, WATER & ELECTRICITY 6.6 6.3 6.0 5.5
CONSTRUCTION 3.5 3.9 4.1 4.5
TRADE, RESTAURANTS & HOTELS 14.5 13.1 13.7 13.4
T/PORT, STORAGE & COMMUN. 10.1 9.8 9.4 8.2
FINAN. & BUS. SERVICES 14.4 15.2 15.4 16.0
PUBLIC ADMINISTRATION 10.0 8.8 8.3 7.7
PERS., SOC. & OTHER COMM. SERV. 9.1 7.9 7.0 7.3
LESS: FISIM 3.2 3.5 4.4 4.8
Table 14.4: Gross Domestic Product By Industry in Current Basic Prices
Table 14.4A: Gross Domestic Product By Industry in Current Basic Prices - Percentage Distribution
158

SURINAME
EC$Mn EXPENDITURE GROUPS 2003 2004 2005 2006
GROSS DOMESTIC PRODUCT (Current Market Prices) 2,945.8 3,446.2 4,231.6 5,012.0
FINAL CONSUMPTION EXPENDITURE … … … …
Government 954.8 508.1 … …
Private …
GROSS CAPITAL FORMATION … … … …
Gross Fixed Capital Formation … … … …
Increase in Stocks … … … …
GOODS AND NON-FACTOR SERVICES -285.4 -240.0 … …
Exports of Goods and Services 1,476.6 2,108.0 … …
Less: Imports of Goods and services 1,762.0 2,348.0 … …
EXPENDITURE GROUPS 2003 2004 2005 2006
GROSS DOMESTIC PRODUCT (Current Market Prices) 100.0 100.0 100.0 100.0
FINAL CONSUMPTION EXPENDITURE … … … …
Government 32.4 14.7 … …
Private …
GROSS CAPITAL FORMATION … … … …
Gross Fixed Capital Formation … … … …
Increase in Stocks … … … …
GOODS AND NON-FACTOR SERVICES -9.7 -7.0 … …
Exports of Goods and Services 50.1 61.2 … …
Less: Imports of Goods and services 59.8 68.1 … …
Table 14.5A: Expenditure on Gross Domestic Product in Current Prices - Percentage Distribution
Table 14.5: Expenditure on Gross Domestic Product in Current Prices
159

SURINAME
SF MnEXPENDITURE GROUPS 2003 2004 2005 2006
GROSS DOMESTIC PRODUCT (Current Market Prices) 2,867,643.0 3,489,032.0 4,278,374.0 5,090,872.0
FINAL CONSUMPTION EXPENDITURE … … … …
Government 929,423.0 514,400.0 … …
Private … … … …
GROSS CAPITAL FORMATION … … … …
Gross Fixed Capital Formation … … … …
Increase in Stocks … … … …
GOODS AND NON-FACTOR SERVICES -277,820.0 -243,000.0 … …
Exports of Goods and Services 1,437,430.0 2,134,180.0 … …
Less: Imports of Goods and services 1,715,250.0 2,377,180.0 … …
Table 14.6: Expenditure on Gross Domestic Product in Current Prices
160


TRINIDAD AND TOBAGO
EC$Mn
Industry 2003 2004 2005 2006
TOTAL 28,434.5 30,702.5 32,354.8 36,657.6
AGRICULTURE, FISHING & FORESTRY 238.4 182.0 197.1 159.2
MINING & QUARRYING 6,521.7 7,045.0 7,689.1 9,012.2
MANUFACTURE 5,780.8 6,242.9 6,810.9 8,523.8
ELECTRICITY & WATER 455.2 469.9 499.1 497.0
CONSTRUCTION 2,129.9 2,302.0 2,672.0 2,839.0
DISTRIBUTION SERVICES 3,951.3 4,095.8 4,295.0 4,926.3
HOTELS, G/ HOUSES & RESTAURANTS 419.1 430.3 454.4 444.5
T/PORT, STORAGE & COMMUN. 2,362.7 2,344.2 2,287.8 2,505.5
FIN., INS., REAL EST. & BUS. SERVICES 3,792.5 4,615.2 4,502.9 4,575.6
GENERAL GOVERNMENT 1,691.4 1,701.8 1,734.9 1,708.6
EDUC. CULT. & COMM. SERVICES 1,112.7 1,156.6 1,126.9 1,220.3
LESS: FISIM 941.0 1,098.1 1,034.4 1,259.0
STATISTICAL DISCREPANCY 919.9 1,215.1 1,119.2 1,504.7
Industry 2003 2004 2005 2006
TOTAL 14.4 8.0 5.4 13.3
AGRICULTURE, FISHING & FORESTRY -14.1 -23.6 8.3 -19.2
MINING & QUARRYING 29.3 8.0 9.1 17.2
MANUFACTURE 29.2 8.0 9.1 25.2
ELECTRICITY & WATER 5.3 3.2 6.2 -0.4
CONSTRUCTION 23.4 8.1 16.1 6.2
DISTRIBUTION SERVICES 2.1 3.7 4.9 14.7
HOTELS, G/ HOUSES & RESTAURANTS 0.1 2.7 5.6 -2.2
T/PORT, STORAGE & COMMUN. 5.4 -0.8 -2.4 9.5
FIN., INS., REAL EST. & BUS. SERVICES 7.3 21.7 -2.4 1.6
GENERAL GOVERNMENT -1.0 0.6 1.9 -1.5
EDUC. CULT. & COMM. SERVICES 8.9 3.9 -2.6 8.3
LESS: FISIM 9.9 16.7 -5.8 21.7
STATISTICAL DISCREPANCY -4.3 32.1 -7.9 34.4
Table 15.1: Gross Domestic Product By Industry in Constant 2000 Market Prices
Table 15.1A: Gross Domestic Product By Industry in Constant 2000 Market Prices - Percentage Change
163

TRINIDAD AND TOBAGO
TT$Mn
Industry 2003 2004 2005 2006
TOTAL 66,084.0 71,355.0 75,195.0 85,195.0
AGRICULTURE, FISHING & FORESTRY 554.0 423.0 458.0 370.0
MINING & QUARRYING 15,157.0 16,373.0 17,870.0 20,945.0
MANUFACTURE 13,435.0 14,509.0 15,829.0 19,810.0
ELECTRICITY & WATER 1,058.0 1,092.0 1,160.0 1,155.0
CONSTRUCTION 4,950.0 5,350.0 6,210.0 6,598.0
DISTRIBUTION SERVICES 9,183.0 9,519.0 9,982.0 11,449.0
HOTELS, G/ HOUSES & RESTAURANTS 974.0 1,000.0 1,056.0 1,033.0
T/PORT, STORAGE & COMMUN. 5,491.0 5,448.0 5,317.0 5,823.0
FIN., INS., REAL EST. & BUS. SERVICES 8,814.0 10,726.0 10,465.0 10,634.0
GENERAL GOVERNMENT 3,931.0 3,955.0 4,032.0 3,971.0
EDUC. CULT. & COMM. SERVICES 2,586.0 2,688.0 2,619.0 2,836.0
LESS: FISIM 2,187.0 2,552.0 2,404.0 2,926.0
STATISTICAL DISCREPANCY 2,138.0 2,824.0 2,601.0 3,497.0
Table 15.2: Gross Domestic Product By Industry in Constant 2000 Market Prices
Fig 5.1: GDP by Industry in Constant 2000 Market Prices - Percentage Change (Based on EC$ Mn)
-30.0
-20.0
-10.0
0.0
10.0
20.0
30.0
40.0
2003 2004 2005 2006
Perc
ent
TOTAL AGRICULTURE MANUFACTURE SERVICES
164
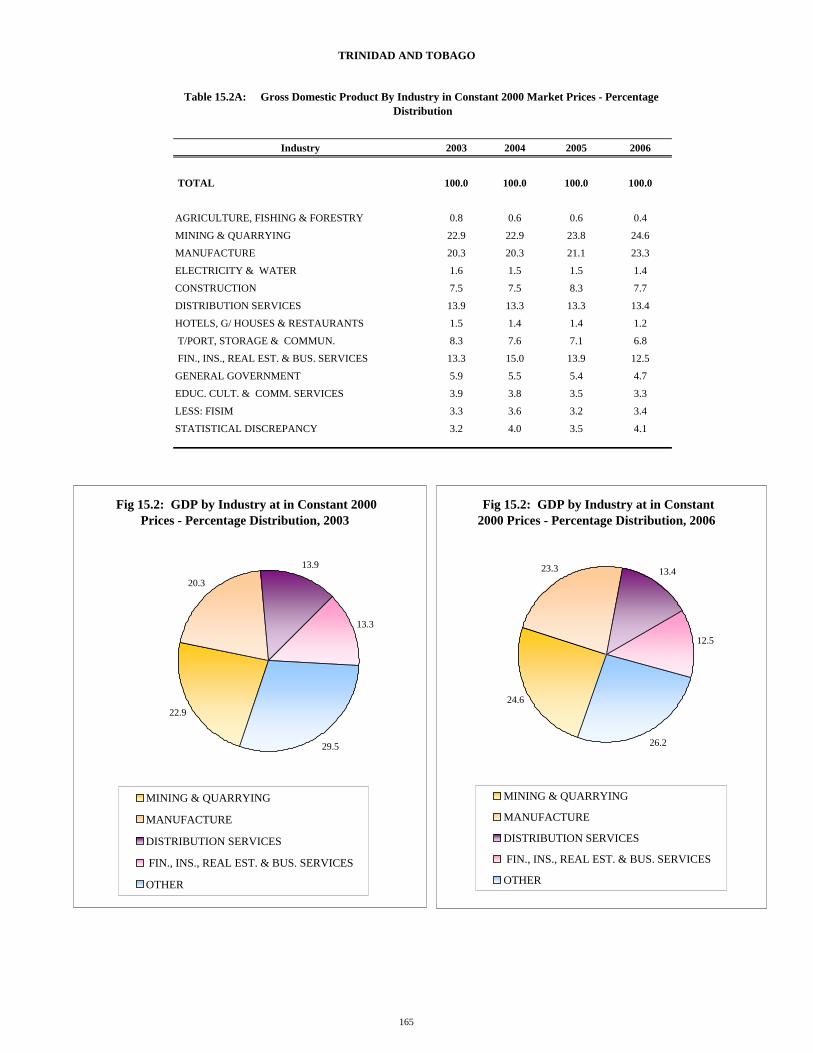
TRINIDAD AND TOBAGO
Industry 2003 2004 2005 2006
TOTAL 100.0 100.0 100.0 100.0
AGRICULTURE, FISHING & FORESTRY 0.8 0.6 0.6 0.4
MINING & QUARRYING 22.9 22.9 23.8 24.6
MANUFACTURE 20.3 20.3 21.1 23.3
ELECTRICITY & WATER 1.6 1.5 1.5 1.4
CONSTRUCTION 7.5 7.5 8.3 7.7
DISTRIBUTION SERVICES 13.9 13.3 13.3 13.4
HOTELS, G/ HOUSES & RESTAURANTS 1.5 1.4 1.4 1.2
T/PORT, STORAGE & COMMUN. 8.3 7.6 7.1 6.8
FIN., INS., REAL EST. & BUS. SERVICES 13.3 15.0 13.9 12.5
GENERAL GOVERNMENT 5.9 5.5 5.4 4.7
EDUC. CULT. & COMM. SERVICES 3.9 3.8 3.5 3.3
LESS: FISIM 3.3 3.6 3.2 3.4
STATISTICAL DISCREPANCY 3.2 4.0 3.5 4.1
Table 15.2A: Gross Domestic Product By Industry in Constant 2000 Market Prices - Percentage Distribution
Fig 15.2: GDP by Industry at in Constant 2000 Prices - Percentage Distribution, 2003
22.9
20.3
13.9
13.3
29.5
MINING & QUARRYING
MANUFACTURE
DISTRIBUTION SERVICES
FIN., INS., REAL EST. & BUS. SERVICES
OTHER
Fig 15.2: GDP by Industry at in Constant 2000 Prices - Percentage Distribution, 2006
24.6
23.3 13.4
12.5
26.2
MINING & QUARRYING
MANUFACTURE
DISTRIBUTION SERVICES
FIN., INS., REAL EST. & BUS. SERVICES
OTHER
165

TRINIDAD AND TOBAGO
TT$ MnIndustry 2003 2004 2005 2006
TOTAL 71,168.0 83,655.0 100,388.0 122,109.2
AGRICULTURE, FISHING & FORESTRY 569.0 507.0 528.0 489.0
MINING & QUARRYING 16,441.0 19,875.0 27,236.0 36,802.0
MANUFACTURE 12,902.0 17,297.0 21,221.0 26,157.2
ELECTRICITY & WATER 896.0 947.0 890.0 981.0
CONSTRUCTION 5,154.0 5,939.0 7,453.0 8,577.0
DISTRIBUTION SERVICES 10,399.0 11,272.0 14,015.0 17,447.0
HOTELS, G/ HOUSES & RESTAURANTS 1,129.0 1,197.0 1,372.0 1,556.0
T/PORT, STORAGE & COMMUN. 5,669.0 5,433.0 5,634.0 5,046.0
FIN., INS., REAL EST. & BUS. SERVICES 9,182.0 11,695.0 11,643.0 13,753.0
GENERAL GOVERNMENT 5,560.0 5,964.0 6,675.0 6,988.0
EDUC. CULT. & COMM. SERVICES 3,241.0 3,222.0 3,527.0 3,843.0
PERSONAL SERVICES 155.0 155.0 156.0 156.0
LESS: FISIM 2,493.0 3,019.0 3,041.0 4,010.0
STATISTICAL DISCREPANCY 2,364.0 3,171.0 3,079.0 4,324.0
VALUE ADDED TAX 1,834.0 1,519.0 586.0 -47.0
Industry 2003 2004 2005 2006
TOTAL 26.4 17.5 20.0 21.6
AGRICULTURE, FISHING & FORESTRY -15.4 -10.9 4.1 -7.4
MINING & QUARRYING 80.8 20.9 37.0 35.1
MANUFACTURE 45.2 34.1 22.7 23.3
ELECTRICITY & WATER 11.6 5.7 -6.0 10.2
CONSTRUCTION 27.0 15.2 25.5 15.1
DISTRIBUTION SERVICES 8.8 8.4 24.3 24.5
HOTELS, G/ HOUSES & RESTAURANTS 5.4 6.0 14.6 13.4
T/PORT, STORAGE & COMMUN. 3.3 -4.2 3.7 -10.4
FIN., INS., REAL EST. & BUS. SERVICES 3.3 27.4 -0.4 18.1
GENERAL GOVERNMENT 28.3 7.3 11.9 4.7
EDUC. CULT. & COMM. SERVICES 5.7 -0.6 9.5 9.0
PERSONAL SERVICES 0.6 0.0 0.6 0.0
LESS: FISIM 14.0 21.1 0.7 31.9
STATISTICAL DISCREPANCY -1.5 34.1 -2.9 40.4
VALUE ADDED TAX 12.6 -17.2 -61.4 -108.0
Note: Data for the respective Industries includes Value Added Taxes. Therefore data on total Value Added Tax are included for information purposes only.
Table 15.3: Gross Domestic Product By Industry in Current Market Prices
Table 15.3A: Gross Domestic Product By Industry in Current Market Prices - Percentage Change
Note: Data for the respective Industries includes Value Added Taxes. Therefore data on total Value Added Tax are included for information purposes only.
166

TRINIDAD AND TOBAGO
Fig 15.5: Gross Domestic Product at Factor Cost in Current and Constant 2000 Prices
0
20000
40000
60000
80000
100000
120000
140000
2003 2004 2005 2006
$TT
Mn
CONSTANT 2000 MARKET PRICES CURRENT MARKET PRICES
Fig 15.4: Gross Domestic Product by Industry in Current Market Prices - Percentage Change (Based on TT$ Mn)
-20.0
-10.0
0.0
10.0
20.0
30.0
40.0
50.0
2003 2004 2005 2006
Perc
ent
TOTAL AGRICULTURE MANUFACTURING SERVICES
167

TRINIDAD AND TOBAGO
EC$MnIndustry 2003 2004 2005 2006
TOTAL 30,679.3 36,015.1 43,218.9 52,492.1
AGRICULTURE, FISHING & FORESTRY 245.3 218.3 227.3 210.2
MINING & QUARRYING 7,087.4 8,556.6 11,725.6 15,820.4
MANUFACTURE 5,561.8 7,446.7 9,136.0 11,244.4
ELECTRICITY & WATER 386.3 407.7 383.2 421.7
CONSTRUCTION 2,221.8 2,556.9 3,208.7 3,687.1
DISTRIBUTION SERVICES 4,482.8 4,852.8 6,033.7 7,500.1
HOTELS, G/ HOUSES & RESTAURANTS 486.7 515.3 590.7 668.9
T/PORT, STORAGE & COMMUN. 2,443.8 2,339.0 2,425.5 2,169.2
FIN., INS., REAL EST. & BUS. SERVICES 3,958.2 5,034.9 5,012.5 5,912.1
GENERAL GOVERNMENT 2,396.8 2,567.6 2,873.7 3,004.0
EDUC. CULT. & COMM. SERVICES 1,397.1 1,387.1 1,518.4 1,652.0
PERSONAL SERVICES 66.8 66.7 67.2 67.1
LESS: FISIM 1,074.7 1,299.7 1,309.2 1,723.8
STATISTICAL DISCREPANCY 1,019.1 1,365.2 1,325.6 1,858.8
VALUE ADDED TAX 790.6 654.0 252.3 -20.2
Industry 2003 2004 2005 2006
TOTAL 100.0 100.0 100.0 100.0
AGRICULTURE, FISHING & FORESTRY 0.8 0.6 0.5 0.4
MINING & QUARRYING 23.1 23.8 27.1 30.1
MANUFACTURE 18.1 20.7 21.1 21.4
ELECTRICITY & WATER 1.3 1.1 0.9 0.8
CONSTRUCTION 7.2 7.1 7.4 7.0
DISTRIBUTION SERVICES 14.6 13.5 14.0 14.3
HOTELS, G/ HOUSES & RESTAURANTS 1.6 1.4 1.4 1.3
T/PORT, STORAGE & COMMUN. 8.0 6.5 5.6 4.1
FIN., INS., REAL EST. & BUS. SERVICES 12.9 14.0 11.6 11.3
GENERAL GOVERNMENT 7.8 7.1 6.6 5.7
EDUC. CULT. & COMM. SERVICES 4.6 3.9 3.5 3.1
PERSONAL SERVICES 0.2 0.2 0.2 0.1
LESS: FISIM 3.5 3.6 3.0 3.3
STATISTICAL DISCREPANCY 3.3 3.8 3.1 3.5
VALUE ADDED TAX 2.6 1.8 0.6 0.0
Table 15.4A: Gross Domestic Product By Industry in Current Market Prices - Percentage Distribution
Note: Data for the respective Industries includes Value Added Taxes. Therefore data on total Value Added Tax are included for information purposes only.
Note: Data for the respective Industries includes Value Added Taxes. Therefore data on total Value Added Tax are included for information purposes only.
Table 15.4: Gross Domestic Product By Industry in Current Market Prices
168

TRINIDAD AND TOBAGO
EC$ Mn
EXPENDITURE GROUPS 2003 2004 2005 2006
GROSS DOMESTIC PRODUCT (Current Market Prices) 30,679.7 36,014.2 43,218.1 52,491.6
TOTAL FINAL CONSUMPTION 18,615.4 24,660.6 28,261.4 25,119.1
Private 14,717.6 20,309.7 23,221.3 19,478.2
Government 3,897.8 4,350.8 5,040.1 5,640.9
GROSS CAPITAL FORMATION 7,727.6 5,986.8 6,349.7 6,687.2
GOODS AND NON-FACTOR SERVICES 4,336.7 5,366.9 8,606.9 20,685.3
Exports of Goods and Services 15,894.9 19,580.4 26,397.3 39,856.6
Imports of Goods and Services 11,558.2 14,213.6 17,790.3 19,171.3
EXPENDITURE GROUPS 2003 2004 2005 2006
GROSS DOMESTIC PRODUCT (Current Market Prices) 100.0 100.0 100.0 100.0
TOTAL FINAL CONSUMPTION 60.7 68.5 65.4 47.9
Private 48.0 56.4 53.7 37.1
Government 12.7 12.1 11.7 10.7
GROSS CAPITAL FORMATION 25.2 16.6 14.7 12.7
GOODS AND NON-FACTOR SERVICES 14.1 14.9 19.9 39.4
Exports of Goods and Services 51.8 54.4 61.1 75.9
Imports of Goods and Services 37.7 39.5 41.2 36.5
Table 15.5: Expenditure on Gross Domestic Product in Current Market Prices
Table 15.5A: Expenditure on Gross Domestic Product in Current Market Prices - Percentage Distribution
169
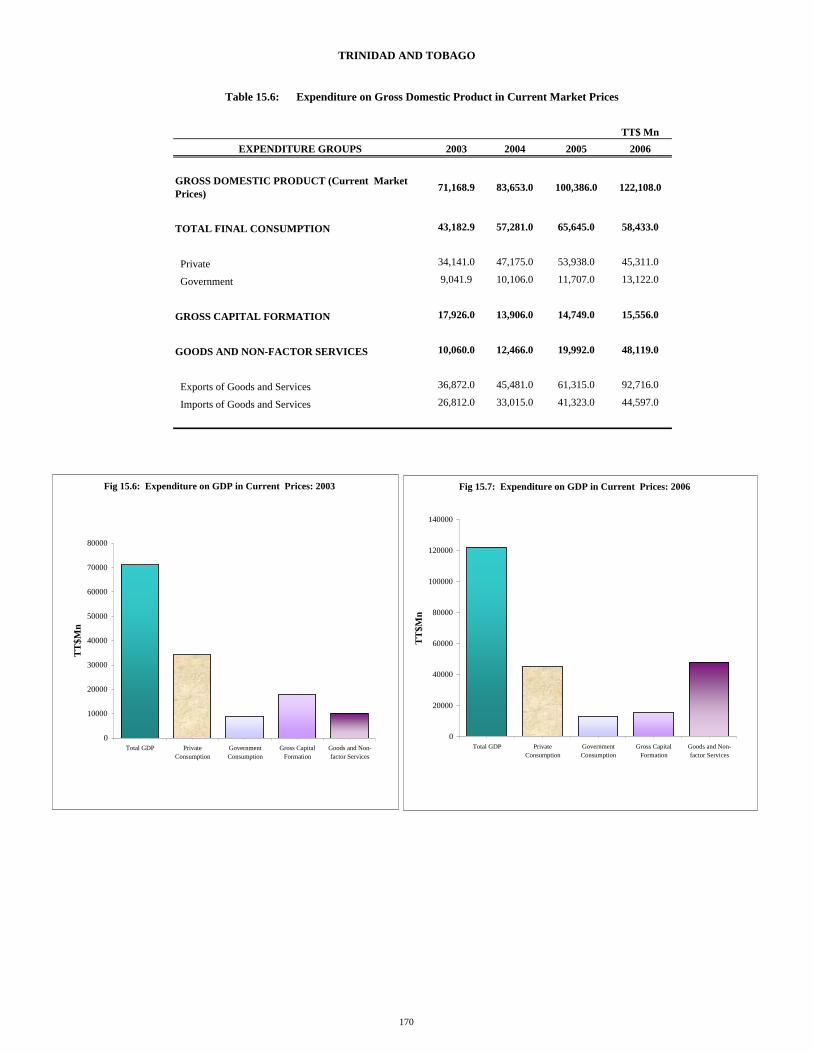
TRINIDAD AND TOBAGO
TT$ MnEXPENDITURE GROUPS 2003 2004 2005 2006
GROSS DOMESTIC PRODUCT (Current Market Prices) 71,168.9 83,653.0 100,386.0 122,108.0
TOTAL FINAL CONSUMPTION 43,182.9 57,281.0 65,645.0 58,433.0
Private 34,141.0 47,175.0 53,938.0 45,311.0
Government 9,041.9 10,106.0 11,707.0 13,122.0
GROSS CAPITAL FORMATION 17,926.0 13,906.0 14,749.0 15,556.0
GOODS AND NON-FACTOR SERVICES 10,060.0 12,466.0 19,992.0 48,119.0
Exports of Goods and Services 36,872.0 45,481.0 61,315.0 92,716.0
Imports of Goods and Services 26,812.0 33,015.0 41,323.0 44,597.0
Table 15.6: Expenditure on Gross Domestic Product in Current Market Prices
Fig 15.6: Expenditure on GDP in Current Prices: 2003
0
10000
20000
30000
40000
50000
60000
70000
80000
Total GDP PrivateConsumption
GovernmentConsumption
Gross CapitalFormation
Goods and Non-factor Services
TT
$Mn
Fig 15.7: Expenditure on GDP in Current Prices: 2006
0
20000
40000
60000
80000
100000
120000
140000
Total GDP PrivateConsumption
GovernmentConsumption
Gross CapitalFormation
Goods and Non-factor Services
TT
$Mn
170


ANTIGUA AND BARBUDA
(EC$Mn)2003 2004 2005 2006
A. INCOME
GVA AT BASIC PRICES 1728.4 1840.4 1978.8 2274.5
Taxes on production and Imports Less Subsidies 308.3 359.1 366.2 434.7
GDP AT MARKET PRICES 2036.7 2199.5 2344.9 2709.2
Net Factor Income from Abroad -104.5 -123.4 -114.5 -173.0
GROSS NATIONAL INCOME 1932.2 2076.1 2230.5 2536.2
Net Current Transfers from Abroad 35.8 22.5 21.6 59.2
GROSS NATIONAL DISPOSABLE INCOME 1968.0 2098.6 2252.1 2595.4
B. APPROPRIATION
Private Final Consumption 761.5 814.6 886.7 925.5
Government Final Consumption 414.3 438.9 443.1 485.5
Total Consumption 1175.8 1253.5 1329.9 1411.0
GROSS NATIONAL SAVINGS 792.2 845.2 922.2 1184.5
C. CAPITAL FINANCE
Gross Capital Formation 1055.6 1103.6 1384.8 2019.0
Gross National Savings 792.2 845.2 922.2 1184.5
FOREIGN SAVINGS 263.4 258.5 462.6 834.5
GROSS NATIONAL DISPOSABLE INCOME, APPROPRIATION AND CAPITAL FINANCE IN CURRENT PRICES
173

DOMINICA
(EC$Mn)2003r 2004r 2005p 2006
A. INCOME
GVA AT BASIC PRICES 581.1 611.4 641.3 671.1
Taxes on production and Imports Less Subsidies 128.5 158.6 166.7 185.3
GDP AT MARKET PRICES 709.7 770.1 808.0 856.5
Net Factor Income from Abroad -72.9 -90.0 -78.2 -45.3
GROSS NATIONAL INCOME 636.7 680.1 729.7 811.2
Net Current Transfers from Abroad 34.5 45.2 53.1 52.9
GROSS NATIONAL DISPOSABLE INCOME 671.2 725.3 782.8 864.0
B. APPROPRIATION
Private Final Consumption 502.8 538.2 604.2 595.0
Government Final Consumption 135.1 139.7 151.9 161.1
Total Consumption 637.9 677.9 756.1 756.1
GROSS NATIONAL SAVINGS 33.3 47.4 26.7 108.0
C. CAPITAL FINANCE
Gross Capital Formation 177.6 210.0 232.1 247.4
Gross National Savings 33.3 47.4 26.7 108.0
FOREIGN SAVINGS 144.3 162.6 205.4 139.4
GROSS NATIONAL DISPOSABLE INCOME, APPROPRIATION AND CAPITAL FINANCE IN CURRENT PRICES
174

GRENADA
(EC$Mn)2003 2004 2005 2006
A. INCOME
GVA AT BASIC PRICES 1062.8 1047.1 1224.6 1242.7
Taxes on production and Imports Less Subsidies 233.9 220.1 270.8 281.3
GDP AT MARKET PRICES 1296.6 1267.2 1495.4 1524.0
Net Factor Income from Abroad -135.8 -152.3 -76.4 -77.7
GROSS NATIONAL INCOME 1073.2 1114.9 1419.1 1446.3
Net Current Transfers from Abroad 98.5 326.4 222.2 97.5
GROSS NATIONAL DISPOSABLE INCOME 1171.7 1441.2 1641.3 1543.9
B. APPROPRIATION
Private Final Consumption 953.6 857.7 1146.2 1242.7
Government Final Consumption 186.3 218.6 245.0 246.1
Total Consumption 1139.9 1076.3 1391.2 1488.7
GROSS NATIONAL SAVINGS 119.4 364.9 250.1 55.1
C. CAPITAL FINANCE
Gross Capital Formation 500.6 512.7 753.5 575.9
Gross National Savings 119.4 364.9 250.1 55.1
FOREIGN SAVINGS 381.1 147.7 503.4 520.7
GROSS NATIONAL DISPOSABLE INCOME, APPROPRIATION AND CAPITAL FINANCE IN CURRENT PRICES
175

MONTSERRAT
(EC$Mn)2003 2004 2005 2006
A. INCOME
GVA AT BASIC PRICES 89.4 94.6 98.7 104.8
Taxes on production and Imports Less Subsidies 12.9 16.0 17.7 16.4
GDP AT MARKET PRICES 102.3 110.6 116.3 121.2
Net Factor Income from Abroad -3.3 -9.2 -7.6 -6.3
GROSS NATIONAL INCOME 99.0 101.5 108.7 114.9
Net Current Transfers from Abroad 59.5 62.7 60.1 58.7
GROSS NATIONAL DISPOSABLE INCOME 158.5 164.1 168.8 173.6
B. APPROPRIATION
Private Final Consumption 71.2 80.8 108.6 91.8
Government Final Consumption 54.4 58.8 60.5 71.0
Total Consumption 125.6 139.5 169.1 162.7
GROSS NATIONAL SAVINGS 34.5 24.6 -0.3 10.9
C. CAPITAL FINANCE
Gross Capital Formation 55.7 48.9 42.5 32.5
Gross National Savings 34.5 24.6 -0.3 10.9
FOREIGN SAVINGS 21.2 24.3 42.8 21.6
GROSS NATIONAL DISPOSABLE INCOME, APPROPRIATION AND CAPITAL FINANCE IN CURRENT PRICES
176

ST. KITTS AND NEVIS
(EC$Mn)2003 2004 2005 2006
A. INCOME
GVA AT BASIC PRICES 813.1 895.0 979.3 1061.2
Taxes on production and Imports Less Subsidies 164.4 183.9 205.5 257.9
GDP AT MARKET PRICES 977.5 1078.9 1184.8 1319.1
Net Factor Income from Abroad -118.2 -105.0 -94.9 -87.3
GROSS NATIONAL INCOME 859.3 973.9 1089.9 1231.8
Net Current Transfers from Abroad 50.2 49.2 64.5 87.0
GROSS NATIONAL DISPOSABLE INCOME 909.5 1023.1 1154.4 1318.7
B. APPROPRIATION
Private Final Consumption 594.1 518.0 595.9 822.7
Government Final Consumption 183.5 217.4 231.8 239.7
Total Consumption 777.5 735.4 827.7 1062.5
GROSS NATIONAL SAVINGS 132.0 287.7 326.7 256.3
C. CAPITAL FINANCE
Gross Capital Formation 445.4 472.3 501.4 498.7
Gross National Savings 132.0 287.7 326.7 256.3
FOREIGN SAVINGS 313.5 184.6 174.7 242.4
GROSS NATIONAL DISPOSABLE INCOME, APPROPRIATION AND CAPITAL FINANCE IN CURRENT PRICES
177

SAINT LUCIA
(EC$Mn)2003r 2004r 2005r 2006
A. INCOME
GVA AT BASIC PRICES 1666.8 1778.5 1903.0 2017.1
Taxes on production and Imports Less Subsidies 339.1 375.5 392.4 447.3
GDP AT MARKET PRICES 2005.9 2154.0 2295.4 2464.4
Net Factor Income from Abroad -137.3 -186.3 -195.8 -215.8
GROSS NATIONAL INCOME 1868.7 1967.7 2157.0 2255.0
Net Current Transfers from Abroad 34.8 37.6 35.0 33.3
GROSS NATIONAL DISPOSABLE INCOME 1903.4 2005.3 2192.1 2288.2
B. APPROPRIATION
Private Final Consumption 1477.9 1377.2 1551.9 2012.9
Government Final Consumption 414.7 412.2 436.9 414.4
Total Consumption 1892.7 1789.4 1988.8 2427.3
GROSS NATIONAL SAVINGS 10.8 215.9 145.9 -81.1
C. CAPITAL FINANCE
Gross Capital Formation 408.4 451.8 551.2 736.2
Gross National Savings 10.8 215.9 145.9 -81.1
FOREIGN SAVINGS 397.6 235.9 405.4 817.3
GROSS NATIONAL DISPOSABLE INCOME, APPROPRIATION AND CAPITAL FINANCE IN CURRENT PRICES
178
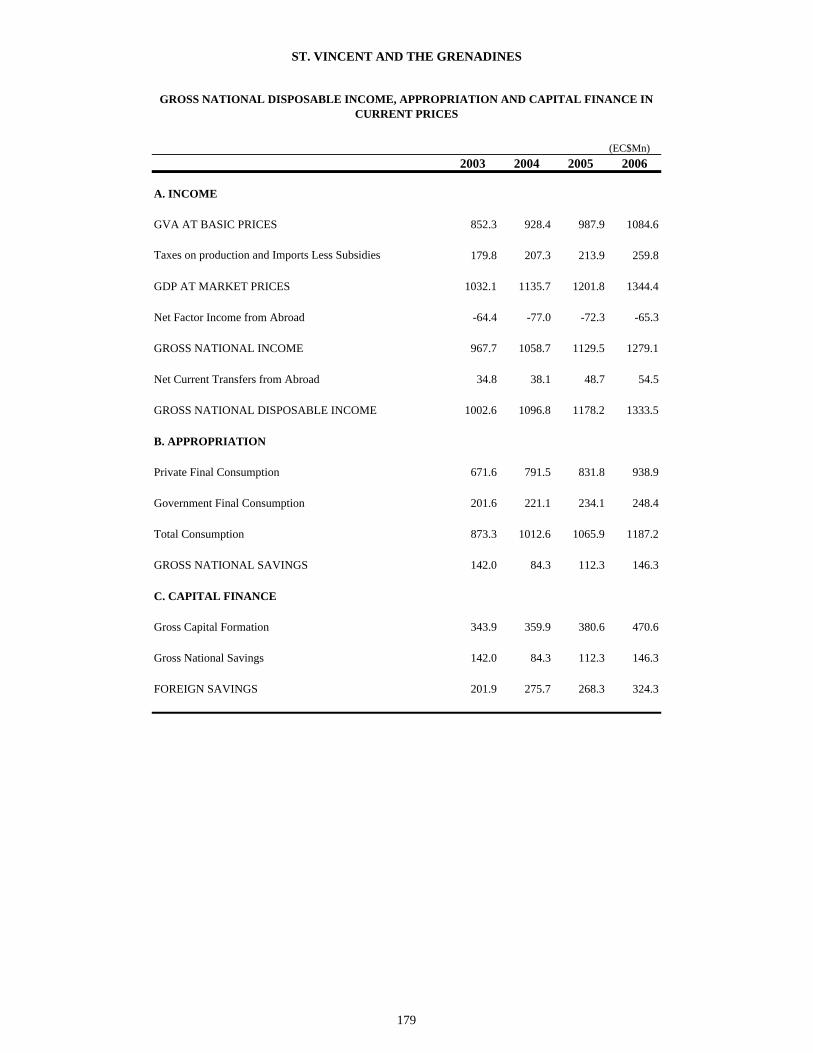
ST. VINCENT AND THE GRENADINES
(EC$Mn)2003 2004 2005 2006
A. INCOME
GVA AT BASIC PRICES 852.3 928.4 987.9 1084.6
Taxes on production and Imports Less Subsidies 179.8 207.3 213.9 259.8
GDP AT MARKET PRICES 1032.1 1135.7 1201.8 1344.4
Net Factor Income from Abroad -64.4 -77.0 -72.3 -65.3
GROSS NATIONAL INCOME 967.7 1058.7 1129.5 1279.1
Net Current Transfers from Abroad 34.8 38.1 48.7 54.5
GROSS NATIONAL DISPOSABLE INCOME 1002.6 1096.8 1178.2 1333.5
B. APPROPRIATION
Private Final Consumption 671.6 791.5 831.8 938.9
Government Final Consumption 201.6 221.1 234.1 248.4
Total Consumption 873.3 1012.6 1065.9 1187.2
GROSS NATIONAL SAVINGS 142.0 84.3 112.3 146.3
C. CAPITAL FINANCE
Gross Capital Formation 343.9 359.9 380.6 470.6
Gross National Savings 142.0 84.3 112.3 146.3
FOREIGN SAVINGS 201.9 275.7 268.3 324.3
GROSS NATIONAL DISPOSABLE INCOME, APPROPRIATION AND CAPITAL FINANCE IN CURRENT PRICES
179

GUYANA
(EC$Mn)2003 2004 2005 2006
A. INCOME
GDP AT FACTOR COST 1703.7 1764.0 1861.3 2067.8
Net Indirect Taxes 287.5 349.0 368.0 390.5
GDP AT MARKET PRICES 1991.2 2113.0 2229.3 2458.3
Net Factor Income from Abroad -115.1 -85.4 -55.2 -118.1
GROSS NATIONAL INCOME 1876.2 2027.6 2174.0 2340.2
Net Current Transfers from Abroad 118.3 123.9 451.4 583.5
GROSS NATIONAL DISPOSABLE INCOME 1994.4 2151.5 2625.5 2923.7
B. APPROPRIATION
Private Final Consumption 989.9 1148.3 1634.9 1604.4
Government Final Consumption 524.2 509.9 599.4 594.6
Total Consumption 1514.1 1658.2 2234.3 2199.0
GROSS NATIONAL SAVINGS 472.6 452.4 265.3 615.1
C. CAPITAL FINANCE
Gross Capital Formation 697.6 676.3 720.1 1112.0
Gross National Savings 472.6 452.4 265.3 615.1
FOREIGN SAVINGS 225.0 223.9 454.8 496.9
GROSS NATIONAL DISPOSABLE INCOME, APPROPRIATION AND CAPITAL FINANCE IN CURRENT PRICES
180

GUYANA
(G$Mn)2003 2004 2005 2006
A. INCOME
GDP AT FACTOR COST 123261.0 130533.0 137788.0 154000.0
Net Indirect Taxes 20803.0 25824.0 27240.0 29084.0
GDP AT MARKET PRICES 144064.0 156357.0 165028.0 183084.0
Net Factor Income from Abroad -8325.0 -6320.0 -4088.0 -8792.0
GROSS NATIONAL INCOME 135739.0 150037.0 160940.0 174292.0
Net Current Transfers from Abroad 8556.0 9170.5 33419.1 43455.0
GROSS NATIONAL DISPOSABLE INCOME 144295.0 159207.5 194359.1 217747.0
B. APPROPRIATION
Private Final Consumption 71615.0 84972.0 121027.0 119487.0
Government Final Consumption 37928.0 37732.0 44374.0 44284.0
Total Consumption 109543.0 122704.0 165401.0 163771.0
GROSS NATIONAL SAVINGS 34191.6 33478.0 19639.3 45812.0
C. CAPITAL FINANCE
Gross Capital Formation 50473.0 50046.0 53310.0 82818.0
Gross National Savings 34191.6 33478.0 19639.3 45812.0
FOREIGN SAVINGS 16281.4 16568.0 33670.7 37006.0
GROSS NATIONAL DISPOSABLE INCOME, APPROPRIATION AND CAPITAL FINANCE IN CURRENT PRICES
181

TRINIDAD AND TOBAGO
(EC$Mn)2003 2004 2005 2006
A. INCOME
GDP AT BASIC PRICES 31754.0 37314.8 44528.2 53356.5
Taxes on production and Imports Less Subsidies 790.6 654.0 252.3 -20.2
GDP AT MARKET PRICES 32544.6 37968.8 44780.4 53336.3
Net Factor Income from Abroad -1837.3 -1072.4 -2048.0 -2526.8
GROSS NATIONAL INCOME 28842.4 34941.8 41170.1 49964.7
Net Current Transfers from Abroad 158.2 151.5 135.2 126.4
GROSS NATIONAL DISPOSABLE INCOME 29000.7 35093.3 41305.3 50091.1
B. APPROPRIATION
Private Final Consumption 14717.6 20309.7 23221.3 19478.2
Government Final Consumption 3897.8 4350.8 5040.1 5640.9
Total Consumption 18615.4 24660.6 28261.4 25119.1
GROSS NATIONAL SAVINGS 10579.2 10432.8 13043.9 24972.0
C. CAPITAL FINANCE
Gross Capital Formation 7727.6 5986.8 6349.7 6687.2
Gross National Savings 10579.2 10432.8 13043.9 24972.0
GROSS NATIONAL DISPOSABLE INCOME, APPROPRIATION AND CAPITAL FINANCE IN CURRENT PRICES
182

TRINIDAD AND TOBAGO
(TT$Mn)2003 2004 2005 2006
A. INCOME
GDP AT BASIC PRICES 73661.0 86674.0 103429.0 124120.0
Net Indirect Taxes 1834.0 1519.0 586.0 -47.0
GDP AT MARKET PRICES 75495.0 88193.0 104015.0 124073.0
Net Factor Income from Abroad -4262.0 -2491.0 -4757.0 -5878.0
GROSS NATIONAL INCOME 66907.0 81162.0 95629.0 116230.0
Net Current Transfers from Abroad 367.0 352.0 314.0 294.0
GROSS NATIONAL DISPOSABLE INCOME 67274.0 81514.0 95943.0 116524.0
B. APPROPRIATION
Private Final Consumption 34141.0 47175.0 53938.0 45311.0
Government Final Consumption 9041.9 10106.0 11707.0 13122.0
Total Consumption 43182.9 57281.0 65645.0 58433.0
GROSS NATIONAL SAVINGS 24541.0 24233.0 30298.0 58091.0
C. CAPITAL FINANCE
Gross Capital Formation 17926.0 13906.0 14749.0 15556.0
Gross National Savings 24541.0 24233.0 30298.0 58091.0
GROSS NATIONAL DISPOSABLE INCOME, APPROPRIATION AND CAPITAL FINANCE IN CURRENT PRICES
183


REGIONAL STATISTICS SUB-PROGRAMME
INFORMATION AND COMMUNICATION TECHNOLOGIES
CARIBBEAN COMMUNITY (CARICOM) SECRETARIAT
GEORGETOWN, GUYANA
P O BOX 10827