Embed Size (px)
Citation preview
National VitalStatistics ReportsVolume 64, Number 9 August 6, 2015
Infant Mortality Statistics From the 2013 Period Linked Birth/Infant Death Data Setby T.J. Mathews, M.S.; Marian F. MacDorman, Ph.D.; and Marie E. Thoma, Ph.D., Division of Vital Statistics
Abstract Results—The U.S. infant mortality rate was 5.96 infant deaths per 1,000 live births in 2013, similar to the rate of 5.98 in 2012.
Objectives—This report presents 2013 period infant mortality The number of infant deaths was 23,446 in 2013, a decline of 208 statistics from the linked birth/infant death data set (linked file) by infant deaths from 2012. From 2012 to 2013, infant mortality rates maternal and infant characteristics. The linked file differs from the were stable for most race and Hispanic origin groups; declines were mortality file, which is based entirely on death certificate data. reported for two Hispanic subgroups: Cuban and Puerto Rican.
Methods—Descriptive tabulations of data are presented and Since 2005, the most recent high, the U.S. infant mortality rate interpreted.
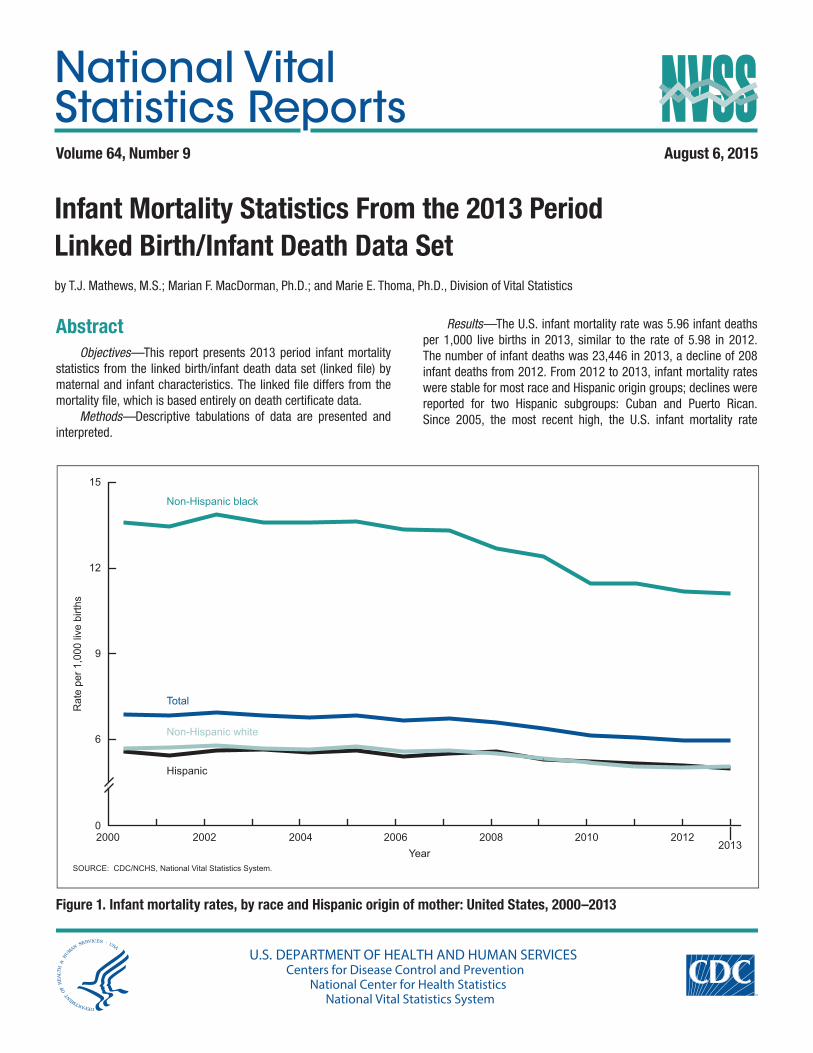
Figure 1. Infant mortality rates, by race and Hispanic origin of mother: United States, 2000–2013
Rat
e pe
r 1,0
00 li
ve b
irths
Non-Hispanic black
Total
Non-Hispanic white
Hispanic
SOURCE: CDC/NCHS, National Vital Statistics System.
Year2000 2002 2004 2006 2008 2010 2012
2013
6
9
12
15
0
U.S. DEPARTMENT OF HEALTH AND HUMAN SERVICES Centers for Disease Control and Prevention
National Center for Health Statistics National Vital Statistics System
2 National Vital Statistics Reports, Vol. 64, No. 9, August 6, 2015
has declined 13% (from 6.86), with declines in both neonatal and their corresponding birth records. These records were weighted to postneonatal mortality overall and for most groups. In 2013, infants adjust for the 1.0% of infant death records that were not linked to born at 37–38 weeks of gestation (early term) had mortality rates their corresponding birth certificates (see Technical Notes). that were 63% higher than for full-term (39–40 week) infants. For Information on births by age, race, or marital status of mother is multiple births, the infant mortality rate was 25.84, 5 times the rate imputed if it is not reported on the birth certificate. These items were of 5.25 for singleton births. In 2013, 36% of infant deaths were due not reported for less than 2% of U.S. births in 2013 (2,3).to preterm-related causes of death, and an additional 15% were due Race and Hispanic origin are reported independently on the birth to causes grouped into the sudden unexpected infant death category. certificate. In tabulations of birth data by race and Hispanic origin,
data for Hispanic persons are not further classified by race, as the Keywords: infant health, birthweight, gestational age, maternal majority of women of Hispanic origin are reported as white. Data for characteristics American Indian or Alaska Native (AIAN) and Asian or Pacific Islander
(API) births are not shown separately by Hispanic origin because the Introduction vast majority of these populations are non-Hispanic.
Cause-of-death statistics in this publication are classified This report presents infant mortality data from the 2013 period
in accordance with the International Statistical Classification of linked file. In the linked file, information from the death certificate is Diseases and Related Health Problems, 10th Revision (ICD–10) (5) linked to information from the birth certificate for each infant under
(see Technical Notes). age 1 year who died in the 50 states, the District of Columbia (D.C.), Puerto Rico, or Guam during 2013 (1). For 2013, linked birth-infant death data are not available for American Samoa, the Commonwealth Data by maternal and infant characteristics of the Northern Marianas, and the Virgin Islands. The purpose of the This report presents descriptive tabulations of infant mortality linkage is to use the many additional variables available from the data by a variety of maternal and infant characteristics. These birth certificate to conduct more detailed analyses of infant mortality tabulations are useful for understanding the basic relationships patterns (2,3). This report presents infant mortality data by race and between risk factors and infant mortality, unadjusted for the Hispanic origin of the mother, birthweight, period of gestation, sex possible effects of other variables. In reality, women with one risk of infant, plurality, maternal age, live-birth order, mother’s marital factor often have other risk factors as well. For example, teenage status, mother’s place of birth, age at death, and underlying cause of mothers are more likely to be unmarried and of a low-income death (Tables 1–7, A–D, and Figures 1–5). status; mothers who do not receive prenatal care are more likely
Data based exclusively on the vital statistics mortality file provide to be of a low-income status and uninsured. The preferred method further information on trends in infant mortality and on causes of for disentangling the multiple interrelationships among risk factors infant death (4). The linked file is used to analyze and calculate is multivariate analysis; however, an understanding of the basic infant mortality rates by race and ethnicity that are more accurately relationships between risk factors and infant mortality is a necessary measured from the birth certificate. Some rates calculated from the precursor to more sophisticated types of analyses, and is the aim of mortality file differ from those published using the linked file. A more this publication. detailed discussion of these differences is presented in the Technical Race and Hispanic origin data—Infant mortality rates are Notes. presented here by race and detailed Hispanic origin of mother.
The linked file is particularly useful for computing accurate infant
Methods mortality rates for this purpose because the race and Hispanic origin of the mother from the birth certificate are used in both the numerator
Data shown in this report are based on birth and infant death and denominator of the infant mortality rate. In contrast, for the vital certificates registered in all states, D.C., Puerto Rico, and Guam. As statistics mortality file, race information for the denominator is the part of the Vital Statistics Cooperative Program (VSCP), each state race of the mother as reported on the birth certificate, whereas the provides matching birth and death certificate numbers for each race information for the numerator is the race of the decedent as infant under age 1 year who died in the state during 2013 to the reported on the death certificate (2–4). Race information from the Centers for Disease Control and Prevention’s (CDC) National Center birth certificate reported by the mother is considered to be more for Health Statistics (NCHS). When the birth and death occurred in reliable than that from the death certificate where the race and different states, the state of death was responsible for contacting the ethnicity of the deceased infant are reported by the funeral director state of birth identified on the death certificate to obtain the original based on information provided by an informant or by observation. birth certificate number. NCHS used the matching birth and death These different reporting methods can lead to differences in race- certificate numbers provided by the states to extract final edited and ethnicity-specific infant mortality rates between the two data data from the NCHS natality and mortality statistical files. These data files (4,6).were linked to form a single statistical record, thereby establishing a The 2003 revision of the U.S. Standard Certificate of Live Birth national linked record file. allows the reporting of more than one race (multiple races) for each
After the initial linkage, NCHS returned lists of unlinked infant parent (2,3,7,8). Forty-four states and D.C. reported multiple race death records and records with inconsistent data between the birth data on their birth certificates for either part or all of 2013, and 33 and death certificates to each state. State additions and corrections states reported in 2012. To provide uniformity and comparability of were incorporated, and a final national linked file was produced. In the data, multiple race is imputed to a single race (see Technical 2013, 99.0% of all infant death records were successfully linked to Notes).
National Vital Statistics Reports,Vol. 64, No. 9, August 6, 2015 3
Statistical significance—Text statements have been tested for mothers compared with non-Hispanic white mothers (5.06). Rates statistical significance, and a statement that a given infant mortality were below the non-Hispanic white rate for infants of API (4.07), rate is higher or lower than another rate indicates that the rates Central and South American (4.30), and Cuban (3.02) mothers (Tables are significantly different. Information on the methods used to test A and B). These differences are explained in part by the differences in for statistical significance, as well as information on differences cause-specific infant mortality rates among race and Hispanic origin between period and cohort data, the weighting of the linked file, groups (9,10).and a comparison of infant mortality data between the linked file The disparity in the infant mortality rate between non-Hispanic and the vital statistics mortality file are presented in the Technical black and non-Hispanic white women has more than doubled over Notes. Additional information on maternal age, marital status, period the past decade. From 2005 (the most recent U.S. high) to 2013, the of gestation, birthweight, and cause-of-death classification is also infant mortality rate declined for both groups. The ratio in the infant presented in the Technical Notes. mortality rate was 2.4 from 2000 to 2007, 2.3 in 2008 and 2009, and
has fluctuated between 2.2 and 2.3 from 2010 to 2013 (Table B). Results and Discussion
Age at deathTrends in infant mortality
Neither neonatal (under 28 days) nor postneonatal (28 days to The overall 2013 infant mortality rate from the linked file was under age 1 year) mortality rates changed significantly for the United
5.96 infant deaths per 1,000 live births, nearly the same as the rate States from 2012 to 2013 (Table B). The neonatal mortality rate was of 5.98 in 2012 (Tables A and B). The infant mortality rate plateaued 4.04 in 2013 and 4.02 in 2012 for deaths under 28 days of age per from 2000 to 2005, fluctuated for 2 years, and then declined from 1,000 births. The postneonatal mortality rate was 1.92 in 2013 and 2007 to 2012 (Table B and Figure 1); the 2013 infant mortality rate is 1.96 in 2012 for deaths from 28 days to under age 1 year per 1,000 13% lower than the 2005 high (6.86). live births.
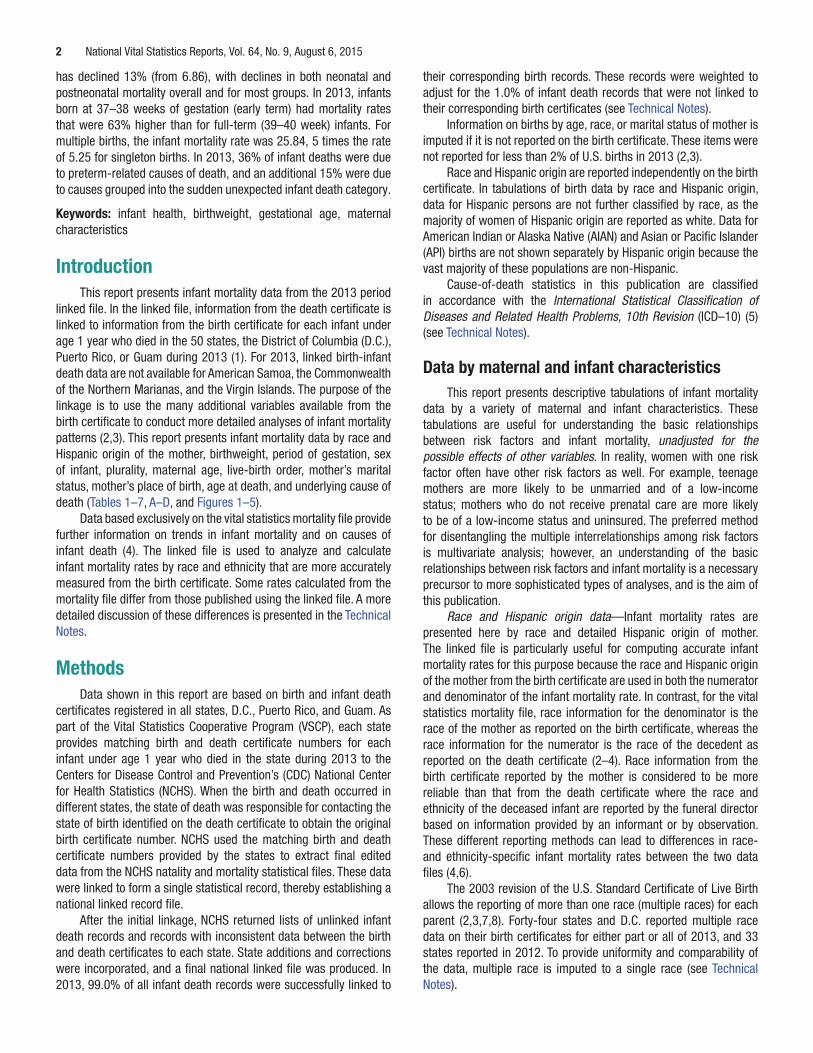
From 2012 to 2013, the infant mortality rates were stable for The only decline in neonatal mortality from 2012 to 2013 was most groups but declined significantly for two Hispanic subgroups: for births to Cuban women, down 43%, from 3.97 to 2.28 per 1,000. 14% for Puerto Rican women (6.86 to 5.93) and 40% for Cuban
While all groups had lower postneonatal mortality rates from 2012 to women (5.00 to 3.02) (in 2013 there were 57 infant deaths to Cuban
2013, none of the declines were significant (Table B). women) (Table B). Several groups had significant declines from Non-Hispanic black women had the highest neonatal mortality 2005 (the most recent U.S. high) to 2013: Puerto Rican (29%), non-
rate in 2013 at 7.46, 2.2 times that for non-Hispanic white women Hispanic black (18%), API (17%), non-Hispanic white (12%), and (3.34). Neonatal mortality rates were also higher for Puerto Rican Mexican women (11%) (Table B and Figure 2). (4.23) and AIAN (4.11) women than for non-Hispanic white women.
Infant mortality by race and Hispanic origin of Neonatal mortality rates were lower for API (2.99) and Cuban (2.28) women compared with non-Hispanic white women (Tables A and B).
mother Infants of non-Hispanic black (3.65) and AIAN (3.50) women had Infant mortality rates vary considerably by race and Hispanic the highest postneonatal mortality rates of any group—more than
origin of mother. In 2013, the highest rate, 11.11 per 1,000 live twice the rate for non-Hispanic white women (1.71) (Tables A and B). births, was for infants of non-Hispanic black mothers. Infants of In contrast, postneonatal mortality rates for Mexican (1.40), Central Cuban mothers had the lowest rate at 3.02. Rates were higher for and South American (1.18), and API (1.08) women were lower than infants of non-Hispanic black, AIAN (7.61), and Puerto Rican (5.93) for non-Hispanic white women (Table A).
Table A. Infant, neonatal, and postneonatal deaths and mortality rates, by race and Hispanic origin of mother: United States, 2013 linked file
Number of deaths Mortality rate per 1,000 live births
Hispanic origin and race of mother Live births Infant Neonatal Postneonatal Infant Neonatal Postneonatal
Total1 . . . . . . . . . . . . . . . . . . . . . . . . . . . . . . . . . . . . . 3,932,181 23,446 15,893 7,553 5.96 4.04 1.92Non-Hispanic white . . . . . . . . . . . . . . . . . . . . . . . . . . 2,129,196 10,766 7,119 3,647 5.06 3.34 1.71Non-Hispanic black . . . . . . . . . . . . . . . . . . . . . . . . . . . 583,834 6,488 4,355 2,133 11.11 7.46 3.65American Indian or Alaska Native . . . . . . . . . . . . . . . . 45,991 350 189 161 7.61 4.11 3.50Asian or Pacific Islander . . . . . . . . . . . . . . . . . . . . . . . 265,673 1,082 794 288 4.07 2.99 1.08Hispanic . . . . . . . . . . . . . . . . . . . . . . . . . . . . . . . . . . . 901,033 4,507 3,200 1,308 5.00 3.55 1.45
Mexican . . . . . . . . . . . . . . . . . . . . . . . . . . . . . . . . . 545,202 2,672 1,911 761 4.90 3.51 1.40Puerto Rican . . . . . . . . . . . . . . . . . . . . . . . . . . . . . . 68,302 405 289 115 5.93 4.23 1.68Cuban . . . . . . . . . . . . . . . . . . . . . . . . . . . . . . . . . . . 18,854 57 43 14 3.02 2.28 *Central and South American . . . . . . . . . . . . . . . . . . 131,305 565 410 155 4.30 3.12 1.18
* Figure does not meet standards of reliability or precision; based on fewer than 20 deaths in the numerator.1Includes other and unknown Hispanic origin and Hispanic origin not stated, not shown separately.NOTES: Infant deaths are weighted so numbers may not exactly add to totals due to rounding. Neonatal is under 28 days and postneonatal is 28 days to under age 1 year. Race and Hispanic origin are reported separately on birth certificates. Race categories are consistent with the 1977 Office of Management and Budget standards. Persons of Hispanic origin may be of any race. In this table, Hispanic women are classified only by place of origin; non-Hispanic women are classified by race. Forty-four states and the District of Columbia reported multiple-race data on the birth certificate for 2013. The multiple-race data for these states were bridged to the single-race categories of the 1977 standards for comparability with other states; see references 2 and 3.
4 National Vital Statistics Reports, Vol. 64, No. 9, August 6, 2015
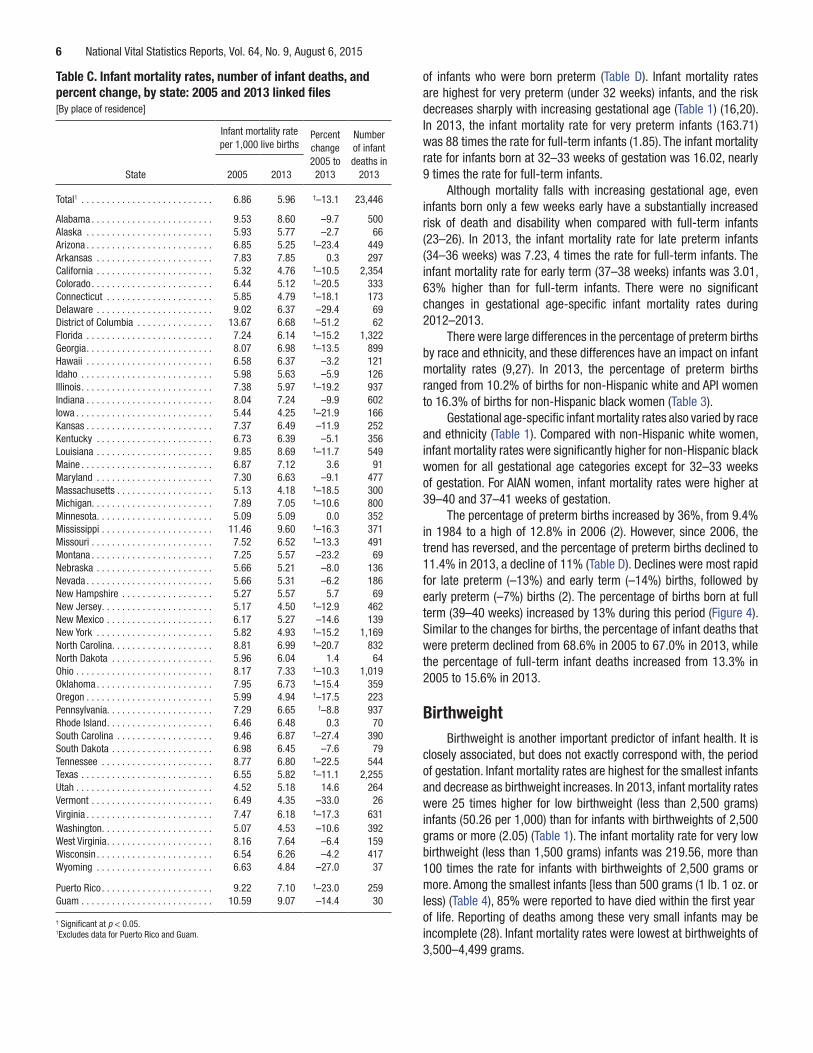
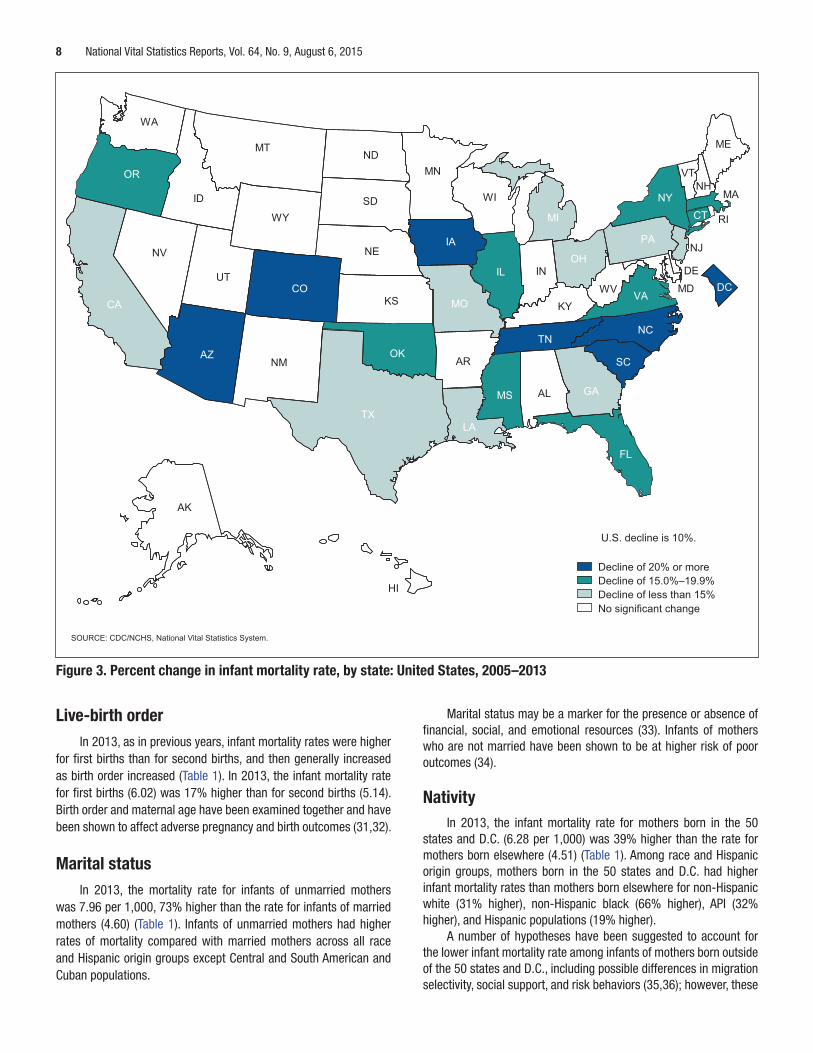
Infant mortality by state and race and ethnicity 39 states and D.C.; among these states, mortality rates ranged from a high of 14.18 in Kansas to a low of 6.90 in Massachusetts. For
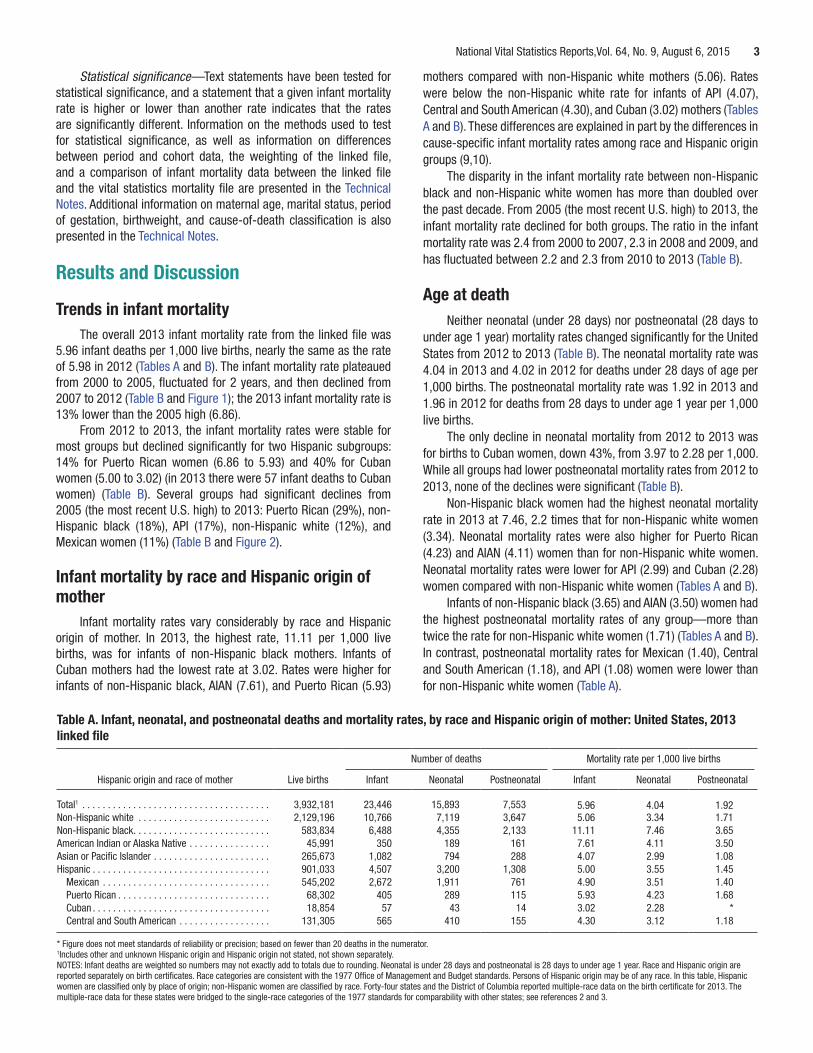
Total infant mortality rates by state for 2005 (the most recent infants of non-Hispanic white mothers, West Virginia had the highest U.S. high) and 2013 and the number of infant deaths for 2013 are infant mortality rate (6.99) and New Jersey had the lowest rate presented in Table C. Between 2005 and 2013, rates declined in 24
(3.20). Among the 41 states and D.C. where infant mortality rates states, D.C., and Puerto Rico (Figure 3). These declines ranged from
could be reliably computed for Hispanic mothers, Rhode Island had 51% for D.C. (13.67 to 6.68) to 9% for Pennsylvania (7.29 to 6.65). the highest rate (7.22) and Iowa had the lowest (2.65). Six states and D.C. had declines greater than 20%. Rates for other
For infants of AIAN mothers, mortality rates for 2011–2013 states did not change significantly over this time period.could be reliably computed for only 15 states, and for infants of API To examine variations across states in more detail and obtain mothers, rates could only be computed for 28 states. For infants of statistically reliable state-specific rates by race and Hispanic origin,
3 years of data were combined (Table 2). Across the United States, AIAN mothers, mortality rates ranged from 13.23 in North Dakota to
infant mortality rates are generally higher in the South and Midwest 5.87 in New Mexico. Infant mortality rates for infants of API mothers and lower elsewhere. For 2011–2013, infant mortality rates ranged ranged from 7.59 in Oklahoma to 3.32 in Massachusetts.from a high of 9.25 for Mississippi to a low of 4.21 for Massachusetts. The data shown in Table 2 and described above show the wide
Infant mortality rates differ by state among race and Hispanic disparities that exist in infant mortality rates across states. The U.S. origin groups. In 2011–2013, rates for infants of non-Hispanic black infant mortality rate ratio for non-Hispanic black relative to non-mothers could be reliably computed (20 or more infant deaths) in Hispanic white populations for the 3 years 2011–2013 was 2.2.
Table B. Infant, neonatal, and postneonatal mortality rates, by race and Hispanic origin of mother: United States, 2000, 2005–2013 linked files
Percent Percent change change 2005 to 2012 to
Race and Hispanic origin of mother 2000 2005 2006 2007 2008 2009 2010 2011 2012 2013 2013 2013
Infant mortality rateAll races . . . . . . . . . . . . . . . . . . . . . . . . 6.89 6.86 6.68 6.75 6.61 6.39 6.14 6.07 5.98 5.96 †–13.1 –0.3Non-Hispanic white . . . . . . . . . . . . . . . 5.70 5.76 5.58 5.63 5.52 5.33 5.18 5.07 5.04 5.06 † –12.2 0.4Non-Hispanic black . . . . . . . . . . . . . . . . 13.59 13.63 13.35 13.31 12.67 12.40 11.46 11.45 11.19 11.11 † –18.5 –0.7American Indian or Alaska Native . . . . . 8.30 8.06 8.28 9.22 8.42 8.47 8.28 8.21 8.40 7.61 –5.6 –9.4Asian or Pacific Islander . . . . . . . . . . . . 4.87 4.89 4.55 4.78 4.51 4.40 4.27 4.36 4.06 4.07 † –16.8 0.2Hispanic . . . . . . . . . . . . . . . . . . . . . . . . 5.59 5.62 5.41 5.51 5.59 5.29 5.25 5.15 5.11 5.00 †–11.0 –2.2
Mexican . . . . . . . . . . . . . . . . . . . . . . 5.43 5.53 5.34 5.42 5.58 5.12 5.12 4.99 5.02 4.90 †–11.4 –2.4Puerto Rican . . . . . . . . . . . . . . . . . . . 8.21 8.30 8.01 7.71 7.29 7.18 7.10 7.85 6.86 5.93 †–28.6 †–13.6Cuban . . . . . . . . . . . . . . . . . . . . . . . . 4.54 4.42 5.08 5.18 4.90 5.77 3.79 4.32 5.00 3.02 –31.7 †–39.6Central and South American . . . . . . . 4.64 4.68 4.52 4.57 4.76 4.47 4.43 4.35 4.14 4.30 –8.1 3.9
Neonatal mortality rateAll races . . . . . . . . . . . . . . . . . . . . . . . . 4.62 4.54 4.46 4.42 4.29 4.18 4.05 4.06 4.02 4.04 †–11.0 0.5Non-Hispanic white . . . . . . . . . . . . . . . 3.78 3.71 3.64 3.61 3.50 3.40 3.35 3.31 3.31 3.34 †–10.0 0.9Non-Hispanic black . . . . . . . . . . . . . . . . 9.19 9.13 8.95 8.74 8.28 8.13 7.45 7.62 7.46 7.46 †–18.3 0.0American Indian or Alaska Native . . . . . 4.39 4.04 4.30 4.55 4.18 4.38 4.28 4.70 4.86 4.11 1.7 –15.4Asian or Pacific Islander . . . . . . . . . . . . 3.43 3.37 3.18 3.38 3.08 3.11 3.01 3.10 2.88 2.99 †–11.3 3.8Hispanic . . . . . . . . . . . . . . . . . . . . . . . . 3.77 3.86 3.74 3.72 3.76 3.56 3.59 3.63 3.58 3.55 †–8.0 –0.8
Mexican . . . . . . . . . . . . . . . . . . . . . . 3.61 3.78 3.73 3.68 3.78 3.44 3.53 3.51 3.56 3.51 †–7.1 –1.4Puerto Rican . . . . . . . . . . . . . . . . . . . 5.80 5.95 5.44 5.14 4.98 4.76 4.82 5.28 4.85 4.23 †–28.9 –12.8Cuban . . . . . . . . . . . . . . . . . . . . . . . . 3.20 3.05 3.60 3.65 3.23 3.61 2.84 3.44 3.97 2.28 –25.2 †–42.6Central and South American . . . . . . . 3.26 3.23 3.12 3.14 3.19 3.17 3.00 3.23 2.85 3.12 –3.4 9.5
Postneonatal mortality rateAll races . . . . . . . . . . . . . . . . . . . . . . . . 2.27 2.32 2.22 2.33 2.32 2.21 2.10 2.01 1.96 1.92 †–17.2 –2.0Non-Hispanic white . . . . . . . . . . . . . . . 1.92 2.05 1.94 2.02 2.02 1.93 1.82 1.76 1.73 1.71 †–16.6 –1.2Non-Hispanic black . . . . . . . . . . . . . . . . 4.40 4.50 4.40 4.57 4.39 4.27 4.01 3.83 3.73 3.65 †–18.9 –2.1American Indian or Alaska Native . . . . . 3.94 4.02 3.98 4.67 4.24 4.09 4.00 3.51 3.51 3.50 –12.9 –0.3Asian or Pacific Islander . . . . . . . . . . . . 1.44 1.51 1.37 1.40 1.43 1.29 1.25 1.26 1.17 1.08 †–28.5 –7.7Hispanic . . . . . . . . . . . . . . . . . . . . . . . . 1.82 1.76 1.67 1.79 1.83 1.73 1.66 1.52 1.53 1.45 †–17.6 –5.2
Mexican . . . . . . . . . . . . . . . . . . . . . . 1.82 1.75 1.61 1.75 1.80 1.67 1.58 1.48 1.46 1.40 †–20.0 –4.1Puerto Rican . . . . . . . . . . . . . . . . . . . 2.41 2.37 2.57 2.57 2.30 2.42 2.28 2.55 1.99 1.68 †–29.1 –15.6Cuban . . . . . . . . . . . . . . . . . . . . . . . . * 1.37 1.42 1.53 1.62 2.10 * * * * * *Central and South American . . . . . . . 1.38 1.46 1.41 1.43 1.57 1.30 1.42 1.12 1.29 1.18 †–19.2 –8.5
† Significant at p < 0.05.* Figure does not meet standards of reliability or precision; based on fewer than 20 deaths in the numerator.NOTES: Race and Hispanic origin are reported separately on birth certificates. Race categories are consistent with the 1977 Office of Management and Budget standards. Persons of Hispanic origin may be of any race. In this table, Hispanic women are classified only by place of origin; non-Hispanic women are classified by race. Forty-four states and the District of Columbia reported multiple-race data on the birth certificate for 2013. The multiple-race data for these states were bridged to the single-race categories of the 1977 standards for comparability with other states; see references 2 and 3. Neonatal is under 28 days and postneonatal is 28 days to under age 1 year.
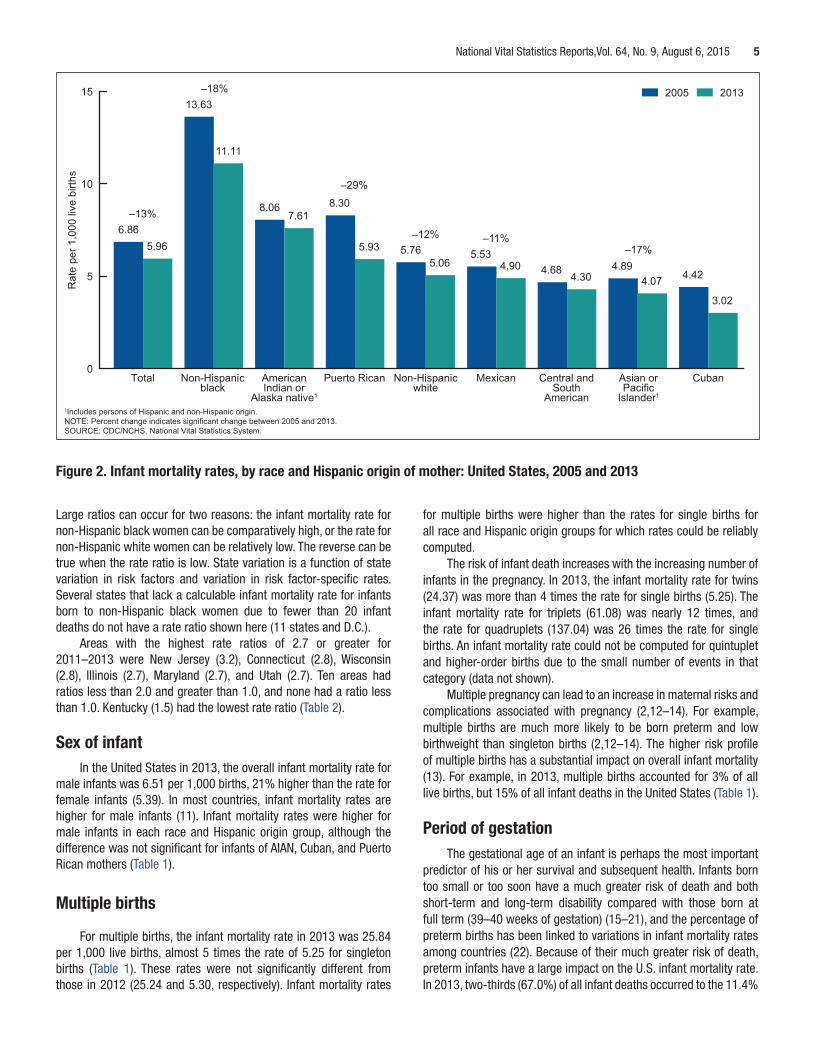
Figure 2. Infant mortality rates, by race and Hispanic origin of moth
1Includes persons of Hispanic and non-Hispanic origin.NOTE: Percent change indicates significant change between 2005 and 2013.SOURCE: CDC/NCHS, National Vital Statistics System.
Rat
e pe
r 1,0
00 li
ve b
irths
6.86–13%
–18%
–29%
–12%
13.63
8.06 8.30
5.765.96
11.11
7.61
5.935.06
0
5
10
15
Total Non-Hispanicblack
AmericanIndian or
Alaska native1
Puerto Rican Non-Hispanwhite
National Vital Statistics Reports,Vol. 64, No. 9, August 6, 2015 5
er: United States, 2005 and 2013
2005 2013
–11%–17%5.53
4.68 4.894.42
4.904.30 4.07
3.02
ic Mexican Central andSouth
American
Asian orPacific
Islander1
Cuban
Large ratios can occur for two reasons: the infant mortality rate for for multiple births were higher than the rates for single births for non-Hispanic black women can be comparatively high, or the rate for all race and Hispanic origin groups for which rates could be reliably non-Hispanic white women can be relatively low. The reverse can be computed. true when the rate ratio is low. State variation is a function of state The risk of infant death increases with the increasing number of variation in risk factors and variation in risk factor-specific rates. infants in the pregnancy. In 2013, the infant mortality rate for twins Several states that lack a calculable infant mortality rate for infants (24.37) was more than 4 times the rate for single births (5.25). The born to non-Hispanic black women due to fewer than 20 infant infant mortality rate for triplets (61.08) was nearly 12 times, and deaths do not have a rate ratio shown here (11 states and D.C.). the rate for quadruplets (137.04) was 26 times the rate for single
Areas with the highest rate ratios of 2.7 or greater for births. An infant mortality rate could not be computed for quintuplet 2011–2013 were New Jersey (3.2), Connecticut (2.8), Wisconsin and higher-order births due to the small number of events in that (2.8), Illinois (2.7), Maryland (2.7), and Utah (2.7). Ten areas had category (data not shown). ratios less than 2.0 and greater than 1.0, and none had a ratio less Multiple pregnancy can lead to an increase in maternal risks and than 1.0. Kentucky (1.5) had the lowest rate ratio (Table 2). complications associated with pregnancy (2,12–14). For example,
multiple births are much more likely to be born preterm and low Sex of infant birthweight than singleton births (2,12–14). The higher risk profile
of multiple births has a substantial impact on overall infant mortality In the United States in 2013, the overall infant mortality rate for (13). For example, in 2013, multiple births accounted for 3% of all male infants was 6.51 per 1,000 births, 21% higher than the rate for live births, but 15% of all infant deaths in the United States (Table 1).female infants (5.39). In most countries, infant mortality rates are
higher for male infants (11). Infant mortality rates were higher for male infants in each race and Hispanic origin group, although the Period of gestation difference was not significant for infants of AIAN, Cuban, and Puerto The gestational age of an infant is perhaps the most important Rican mothers (Table 1). predictor of his or her survival and subsequent health. Infants born
too small or too soon have a much greater risk of death and both Multiple births short-term and long-term disability compared with those born at
full term (39–40 weeks of gestation) (15–21), and the percentage of For multiple births, the infant mortality rate in 2013 was 25.84 preterm births has been linked to variations in infant mortality rates
per 1,000 live births, almost 5 times the rate of 5.25 for singleton among countries (22). Because of their much greater risk of death, births (Table 1). These rates were not significantly different from preterm infants have a large impact on the U.S. infant mortality rate. those in 2012 (25.24 and 5.30, respectively). Infant mortality rates In 2013, two-thirds (67.0%) of all infant deaths occurred to the 11.4%
6 National Vital Statistics Reports, Vol. 64, No. 9, August 6, 2015
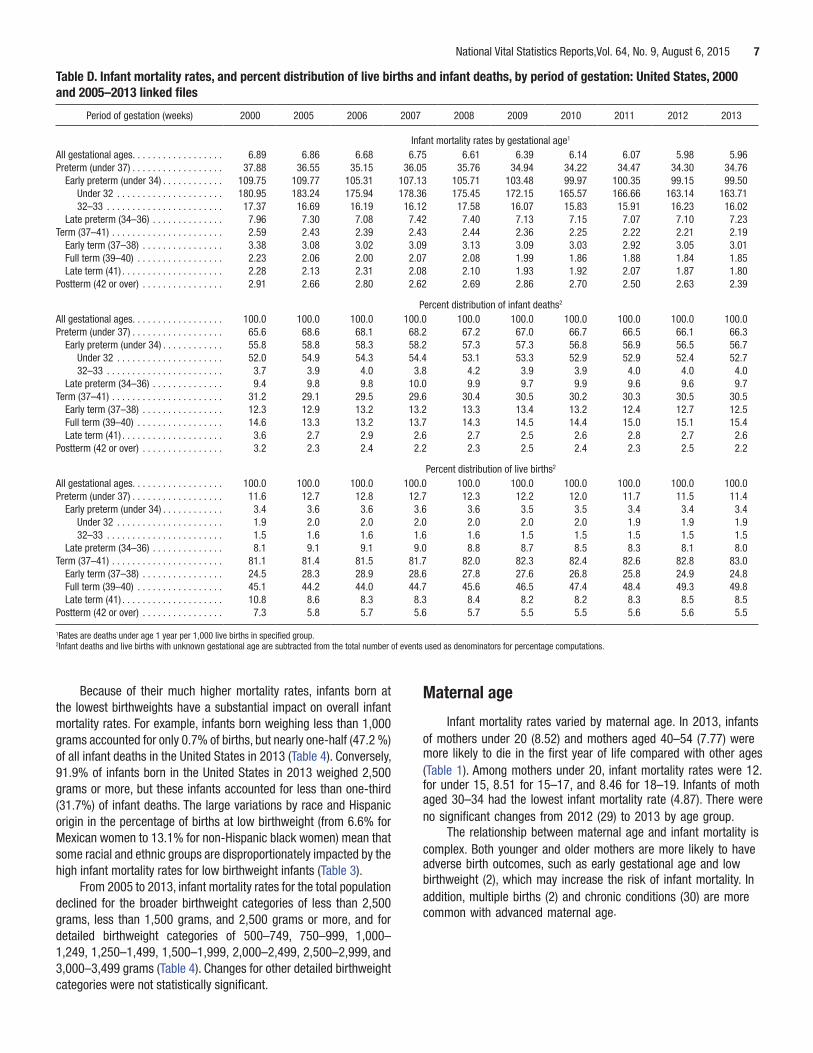
Table C. Infant mortality rates, number of infant deaths, and of infants who were born preterm (Table D). Infant mortality rates percent change, by state: 2005 and 2013 linked files are highest for very preterm (under 32 weeks) infants, and the risk [By place of residence] decreases sharply with increasing gestational age (Table 1) (16,20).
In 2013, the infant mortality rate for very preterm infants (163.71) Infant mortality rate Percent Number per 1,000 live births was 88 times the rate for full-term infants (1.85). The infant mortality change of infant
2005 to deaths in rate for infants born at 32–33 weeks of gestation was 16.02, nearly State 2005 2013 2013 2013 9 times the rate for full-term infants.
Although mortality falls with increasing gestational aTotal1 . . . . . . . . . . . . . . . . . . . . . . . . . . 6.86 5.96 †
ge, even –13.1 23,446
infants born only a few weeks early have a substantially increased Alabama . . . . . . . . . . . . . . . . . . . . . . . . 9.53 8.60 –9.7 500 risk of death and disability when compared with full-term infants Alaska . . . . . . . . . . . . . . . . . . . . . . . . . 5.93 5.77 –2.7 66
(23–26). In 2013, the infant mortality rate for late preterm infants Arizona . . . . . . . . . . . . . . . . . . . . . . . . . 6.85 5.25 †–23.4 449Arkansas . . . . . . . . . . . . . . . . . . . . . . . 7.83 7.85 0.3 297 (34–36 weeks) was 7.23, 4 times the rate for full-term infants. The California . . . . . . . . . . . . . . . . . . . . . . . 5.32 4.76 †–10.5 2,354 infant mortality rate for early term (37–38 weeks) infants was 3.01, Colorado . . . . . . . . . . . . . . . . . . . . . . . . 6.44 5.12 †–20.5 333Connecticut . . . . . . . . . . . . . . . . . . . . . 5.85 4.79 †
63% higher than for full-term infants. There were no significant –18.1 173
changes in gestational age-specific infant mortality rates during Delaware . . . . . . . . . . . . . . . . . . . . . . . 9.02 6.37 –29.4 69District of Columbia . . . . . . . . . . . . . . . 13.67 6.68 †–51.2 62 2012–2013. Florida . . . . . . . . . . . . . . . . . . . . . . . . . 7.24 6.14 †–15.2 1,322 There were large differences in the percentage of preterm births Georgia . . . . . . . . . . . . . . . . . . . . . . . . . 8.07 6.98 †–13.5 899 by race and ethnicity, and these differences have an impact on infant Hawaii . . . . . . . . . . . . . . . . . . . . . . . . . 6.58 6.37 –3.2 121Idaho . . . . . . . . . . . . . . . . . . . . . . . . . . 5.98 5.63 –5.9 126 mortality rates (9,27). In 2013, the percentage of preterm births Illinois . . . . . . . . . . . . . . . . . . . . . . . . . . 7.38 5.97 †–19.2 937 ranged from 10.2% of births for non-Hispanic white and API women Indiana . . . . . . . . . . . . . . . . . . . . . . . . . 8.04 7.24 –9.9 602 to 16.3% of births for non-Hispanic black women (Table 3). Iowa . . . . . . . . . . . . . . . . . . . . . . . . . . . 5.44 4.25 †–21.9 166 Gestational age-specific infant mortality rates also varied by race Kansas . . . . . . . . . . . . . . . . . . . . . . . . . 7.37 6.49 –11.9 252Kentucky . . . . . . . . . . . . . . . . . . . . . . . 6.73 6.39 –5.1 356 and ethnicity (Table 1). Compared with non-Hispanic white women, Louisiana . . . . . . . . . . . . . . . . . . . . . . . 9.85 8.69 †–11.7 549 infant mortality rates were significantly higher for non-Hispanic black Maine . . . . . . . . . . . . . . . . . . . . . . . . . . 6.87 7.12 3.6 91 women for all gestational age categories except for 32–33 weeks Maryland . . . . . . . . . . . . . . . . . . . . . . . 7.30 6.63 –9.1 477
† of gestation. For AIAN women, infant mortality rates were higher at Massachusetts . . . . . . . . . . . . . . . . . . . 5.13 4.18 –18.5 300Michigan. . . . . . . . . . . . . . . . . . . . . . . . 7.89 7.05 †–10.6 800 39–40 and 37–41 weeks of gestation. Minnesota . . . . . . . . . . . . . . . . . . . . . . . 5.09 5.09 0.0 352 The percentage of preterm births increased by 36%, from 9.4% Mississippi . . . . . . . . . . . . . . . . . . . . . . 11.46 9.60 †–16.3 371 in 1984 to a high of 12.8% in 2006 (2). However, since 2006, the Missouri . . . . . . . . . . . . . . . . . . . . . . . . 7.52 6.52 †–13.3 491 trend has reversed, and the percentage of preterm births declined to Montana . . . . . . . . . . . . . . . . . . . . . . . . 7.25 5.57 –23.2 69Nebraska . . . . . . . . . . . . . . . . . . . . . . . 5.66 5.21 –8.0 136 11.4% in 2013, a decline of 11% (Table D). Declines were most rapid Nevada . . . . . . . . . . . . . . . . . . . . . . . . . 5.66 5.31 –6.2 186 for late preterm (–13%) and early term (–14%) births, followed by New Hampshire . . . . . . . . . . . . . . . . . . 5.27 5.57 5.7 69 early preterm (–7%) births (2). The percentage of births born at full New Jersey . . . . . . . . . . . . . . . . . . . . . . 5.17 4.50 †–12.9 462 term (39–40 weeks) increased by 13% during this period (Figure 4). New Mexico . . . . . . . . . . . . . . . . . . . . . 6.17 5.27 –14.6 139New York . . . . . . . . . . . . . . . . . . . . . . . 5.82 4.93 †–15.2 1,169 Similar to the changes for births, the percentage of infant deaths that North Carolina . . . . . . . . . . . . . . . . . . . . 8.81 6.99 †–20.7 832 were preterm declined from 68.6% in 2005 to 67.0% in 2013, while North Dakota . . . . . . . . . . . . . . . . . . . . 5.96 6.04 1.4 64Ohio 7.33 †
the percentage of full-term infant deaths increased from 13.3% in . . . . . . . . . . . . . . . . . . . . . . . . . . . 8.17 –10.3 1,019
. . . . . . . . . . . . . . . . . . . . . . . 7.95 6.73 † 2005 to 15.6% in 2013. Oklahoma –15.4 359Oregon . . . . . . . . . . . . . . . . . . . . . . . . . 5.99 4.94 †–17.5 223Pennsylvania. . . . . . . . . . . . . . . . . . . . . 7.29 6.65 †–8.8 937 Birthweight Rhode Island . . . . . . . . . . . . . . . . . . . . . 6.46 6.48 0.3 70South Carolina . . . . . . . . . . . . . . . . . . . 9.46 6.87 †–27.4 390 Birthweight is another important predictor of infant health. It is South Dakota . . . . . . . . . . . . . . . . . . . . 6.98 6.45 –7.6 79 closely associated, but does not exactly correspond with, the period Tennessee . . . . . . . . . . . . . . . . . . . . . . 8.77 6.80 †–22.5 544Texas . . . . . . . . . . . . . . . . . . . . . . . . . . 6.55 5.82 †–11.1 2,255 of gestation. Infant mortality rates are highest for the smallest infants Utah . . . . . . . . . . . . . . . . . . . . . . . . . . . 4.52 5.18 14.6 264 and decrease as birthweight increases. In 2013, infant mortality rates Vermont . . . . . . . . . . . . . . . . . . . . . . . . 6.49 4.35 –33.0 26 were 25 times higher for low birthweight (less than 2,500 grams) Virginia . . . . . . . . . . . . . . . . . . . . . . . . . 7.47 6.18 †–17.3 631 infants (50.26 per 1,000) than for infants with birthweights of 2,500 Washington . . . . . . . . . . . . . . . . . . . . . . 5.07 4.53 –10.6 392
grams or more (2.05) (Table 1). The infant mortality rate for very low West Virginia . . . . . . . . . . . . . . . . . . . . . 8.16 7.64 –6.4 159Wisconsin . . . . . . . . . . . . . . . . . . . . . . . 6.54 6.26 –4.2 417 birthweight (less than 1,500 grams) infants was 219.56, more than Wyoming . . . . . . . . . . . . . . . . . . . . . . . 6.63 4.84 –27.0 37 100 times the rate for infants with birthweights of 2,500 grams or Puerto Rico . . . . . . . . . . . . . . . . . . . . . . 9.22 7.10 †–23.0 259 more. Among the smallest infants [less than 500 grams (1 lb. 1 oz. or Guam . . . . . . . . . . . . . . . . . . . . . . . . . . 10.59 9.07 –14.4 30 less) (Table 4), 85% were reported to have died within the first year † of life. Reporting of deaths among these very small infants may be Significant at p < 0.05.
1Excludes data for Puerto Rico and Guam. incomplete (28). Infant mortality rates were lowest at birthweights of 3,500–4,499 grams.
National Vital Statistics Reports,Vol. 64, No. 9, August 6, 2015 7
Table D. Infant mortality rates, and percent distribution of live births and infant deaths, by period of gestation: United States, 2000 and 2005–2013 linked files
Period of gestation (weeks) 2000 2005 2006 2007 2008 2009 2010 2011 2012 2013
Infant mortality rates by gestational age1
All gestational ages. . . . . . . . . . . . . . . . . . 6.89 6.86 6.68 6.75 6.61 6.39 6.14 6.07 5.98 5.96Preterm (under 37) . . . . . . . . . . . . . . . . . . 37.88 36.55 35.15 36.05 35.76 34.94 34.22 34.47 34.30 34.76
Early preterm (under 34) . . . . . . . . . . . . 109.75 109.77 105.31 107.13 105.71 103.48 99.97 100.35 99.15 99.50Under 32 . . . . . . . . . . . . . . . . . . . . . 180.95 183.24 175.94 178.36 175.45 172.15 165.57 166.66 163.14 163.7132–33 . . . . . . . . . . . . . . . . . . . . . . . 17.37 16.69 16.19 16.12 17.58 16.07 15.83 15.91 16.23 16.02
Late preterm (34–36) . . . . . . . . . . . . . . 7.96 7.30 7.08 7.42 7.40 7.13 7.15 7.07 7.10 7.23Term (37–41) . . . . . . . . . . . . . . . . . . . . . . 2.59 2.43 2.39 2.43 2.44 2.36 2.25 2.22 2.21 2.19
Early term (37–38) . . . . . . . . . . . . . . . . 3.38 3.08 3.02 3.09 3.13 3.09 3.03 2.92 3.05 3.01Full term (39–40) . . . . . . . . . . . . . . . . . 2.23 2.06 2.00 2.07 2.08 1.99 1.86 1.88 1.84 1.85Late term (41) . . . . . . . . . . . . . . . . . . . . 2.28 2.13 2.31 2.08 2.10 1.93 1.92 2.07 1.87 1.80
Postterm (42 or over) . . . . . . . . . . . . . . . . 2.91 2.66 2.80 2.62 2.69 2.86 2.70 2.50 2.63 2.39
Percent distribution of infant deaths2
All gestational ages. . . . . . . . . . . . . . . . . . 100.0 100.0 100.0 100.0 100.0 100.0 100.0 100.0 100.0 100.0Preterm (under 37) . . . . . . . . . . . . . . . . . . 65.6 68.6 68.1 68.2 67.2 67.0 66.7 66.5 66.1 66.3
Early preterm (under 34) . . . . . . . . . . . . 55.8 58.8 58.3 58.2 57.3 57.3 56.8 56.9 56.5 56.7Under 32 . . . . . . . . . . . . . . . . . . . . . 52.0 54.9 54.3 54.4 53.1 53.3 52.9 52.9 52.4 52.732–33 . . . . . . . . . . . . . . . . . . . . . . . 3.7 3.9 4.0 3.8 4.2 3.9 3.9 4.0 4.0 4.0
Late preterm (34–36) . . . . . . . . . . . . . . 9.4 9.8 9.8 10.0 9.9 9.7 9.9 9.6 9.6 9.7Term (37–41) . . . . . . . . . . . . . . . . . . . . . . 31.2 29.1 29.5 29.6 30.4 30.5 30.2 30.3 30.5 30.5
Early term (37–38) . . . . . . . . . . . . . . . . 12.3 12.9 13.2 13.2 13.3 13.4 13.2 12.4 12.7 12.5Full term (39–40) . . . . . . . . . . . . . . . . . 14.6 13.3 13.2 13.7 14.3 14.5 14.4 15.0 15.1 15.4Late term (41) . . . . . . . . . . . . . . . . . . . . 3.6 2.7 2.9 2.6 2.7 2.5 2.6 2.8 2.7 2.6
Postterm (42 or over) . . . . . . . . . . . . . . . . 3.2 2.3 2.4 2.2 2.3 2.5 2.4 2.3 2.5 2.2
Percent distribution of live births2
All gestational ages. . . . . . . . . . . . . . . . . . 100.0 100.0 100.0 100.0 100.0 100.0 100.0 100.0 100.0 100.0Preterm (under 37) . . . . . . . . . . . . . . . . . . 11.6 12.7 12.8 12.7 12.3 12.2 12.0 11.7 11.5 11.4
Early preterm (under 34) . . . . . . . . . . . . 3.4 3.6 3.6 3.6 3.6 3.5 3.5 3.4 3.4 3.4Under 32 . . . . . . . . . . . . . . . . . . . . . 1.9 2.0 2.0 2.0 2.0 2.0 2.0 1.9 1.9 1.932–33 . . . . . . . . . . . . . . . . . . . . . . . 1.5 1.6 1.6 1.6 1.6 1.5 1.5 1.5 1.5 1.5
Late preterm (34–36) . . . . . . . . . . . . . . 8.1 9.1 9.1 9.0 8.8 8.7 8.5 8.3 8.1 8.0Term (37–41) . . . . . . . . . . . . . . . . . . . . . . 81.1 81.4 81.5 81.7 82.0 82.3 82.4 82.6 82.8 83.0
Early term (37–38) . . . . . . . . . . . . . . . . 24.5 28.3 28.9 28.6 27.8 27.6 26.8 25.8 24.9 24.8Full term (39–40) . . . . . . . . . . . . . . . . . 45.1 44.2 44.0 44.7 45.6 46.5 47.4 48.4 49.3 49.8Late term (41) . . . . . . . . . . . . . . . . . . . . 10.8 8.6 8.3 8.3 8.4 8.2 8.2 8.3 8.5 8.5
Postterm (42 or over) . . . . . . . . . . . . . . . . 7.3 5.8 5.7 5.6 5.7 5.5 5.5 5.6 5.6 5.5
1Rates are deaths under age 1 year per 1,000 live births in specified group.2Infant deaths and live births with unknown gestational age are subtracted from the total number of events used as denominators for percentage computations.
Because of their much higher mortality rates, infants born at Maternal age the lowest birthweights have a substantial impact on overall infant mortality rates. For example, infants born weighing less than 1,000 Infant mortality rates varied by maternal age. In 2013, infants grams accounted for only 0.7% of births, but nearly one-half (47.2 %) of mothers under 20 (8.52) and mothers aged 40–54 (7.77) were of all infant deaths in the United States in 2013 (Table 4). Conversely, more likely to die in the first year of life compared with other ages
91.9% of infants born in the United States in 2013 weighed 2,500 (Table 1). Among mothers under 20, infant mortality rates were 12.for under 15, 8.51 for 15–17, and 8.46 for 18–19. Infants of mothgrams or more, but these infants accounted for less than one-third aged 30–34 had the lowest infant mortality rate (4.87). There were(31.7%) of infant deaths. The large variations by race and Hispanic no significant changes from 2012 (29) to 2013 by age group.origin in the percentage of births at low birthweight (from 6.6% for
The relationship between maternal age and infant mortality is Mexican women to 13.1% for non-Hispanic black women) mean that complex. Both younger and older mothers are more likely to havesome racial and ethnic groups are disproportionately impacted by the adverse birth outcomes, such as early gestational age and low high infant mortality rates for low birthweight infants (Table 3). birthweight (2), which may increase the risk of infant mortality. InFrom 2005 to 2013, infant mortality rates for the total population addition, multiple births (2) and chronic conditions (30) are moredeclined for the broader birthweight categories of less than 2,500 common with advanced maternal age.
grams, less than 1,500 grams, and 2,500 grams or more, and for detailed birthweight categories of 500–749, 750–999, 1,000–1,249, 1,250–1,499, 1,500–1,999, 2,000–2,499, 2,500–2,999, and 3,000–3,499 grams (Table 4). Changes for other detailed birthweight categories were not statistically significant.
8 National Vital Statistics Reports, Vol. 64, No. 9, August 6, 2015
Figure 3. Percent change in infant mortality rate, by state: United States, 2005–2013
MT
WY
ID
WA
OR
NV
UT
CA
AZ
ND
SD
NE
CO
NM
TX
OK
KS
AR
LA
MO
IA
MN
WI
IL IN
KY
TN
MS AL GA
FL
SC
NC
VAWV
OH
MI
NY
PA
MD DCDE
NJ
CT RI
MA
ME
VTNH
AK
HI
U.S. decline is 10%.
SOURCE: CDC/NCHS, National Vital Statistics System.
Decline of 20% or moreDecline of 15.0%–19.9% Decline of less than 15%No significant change
Live-birth order Marital status may be a marker for the presence or absence of financial, social, and emotional resources (33). Infants of mothers
In 2013, as in previous years, infant mortality rates were higher who are not married have been shown to be at higher risk of poor for first births than for second births, and then generally increased outcomes (34). as birth order increased (Table 1). In 2013, the infant mortality rate for first births (6.02) was 17% higher than for second births (5.14). Nativity Birth order and maternal age have been examined together and have
In 2013, the infant mortality rate for mothers born in the 50 been shown to affect adverse pregnancy and birth outcomes (31,32).states and D.C. (6.28 per 1,000) was 39% higher than the rate for mothers born elsewhere (4.51) (Table 1). Among race and Hispanic Marital status origin groups, mothers born in the 50 states and D.C. had higher
In 2013, the mortality rate for infants of unmarried mothers infant mortality rates than mothers born elsewhere for non-Hispanic
was 7.96 per 1,000, 73% higher than the rate for infants of married white (31% higher), non-Hispanic black (66% higher), API (32% higher), and Hispanic populations (19% higher).mothers (4.60) (Table 1). Infants of unmarried mothers had higher
A number of hypotheses have been suggested to account for rates of mortality compared with married mothers across all race the lower infant mortality rate among infants of mothers born outside and Hispanic origin groups except Central and South American and of the 50 states and D.C., including possible differences in migration Cuban populations. selectivity, social support, and risk behaviors (35,36); however, these
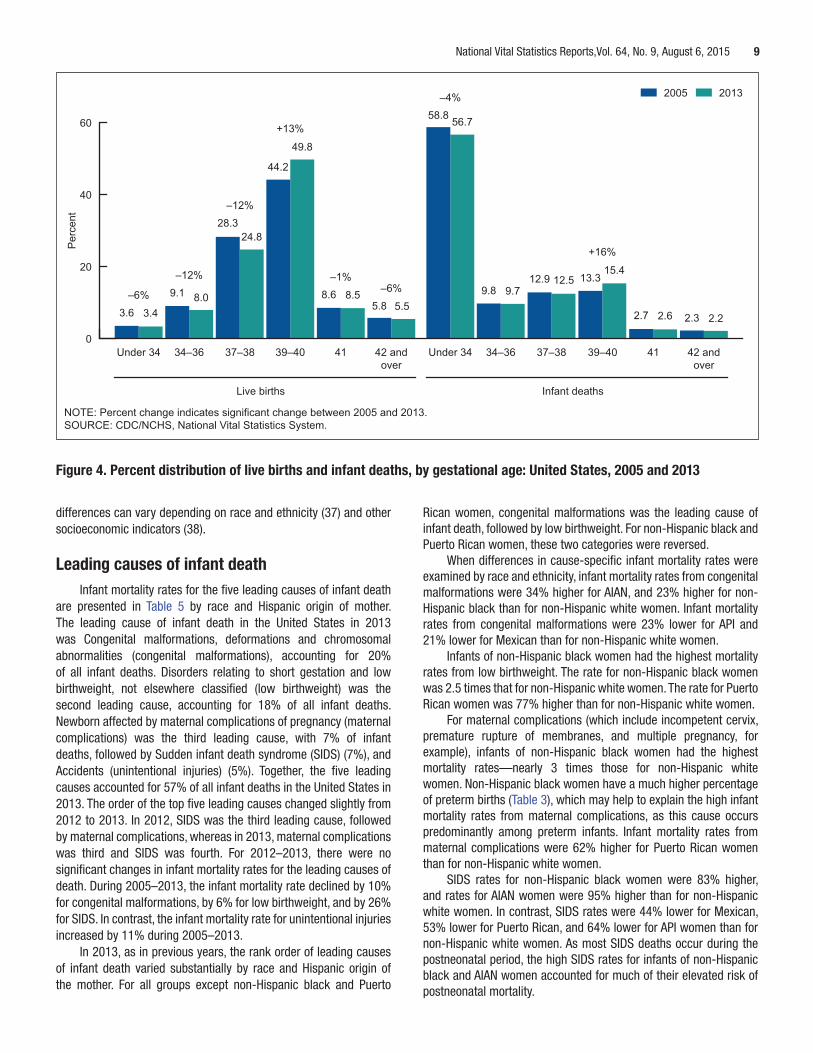
Figure 4. Percent distribution of live births and infant deaths, by ges
NOTE: Percent change indicates significant change between 2005 and 2013.SOURCE: CDC/NCHS, National Vital Statistics System.
Per
cent
–6%
3.6 3.4
–1%
8.6 8.5 –6%
5.8 5.5
–12%
9.1 8.0
–12%
28.324.8
–4
58.8+13%
44.2
49.8
0
20
40
60
42 andover
4139–4037–3834–36Under 34 Unde
Live births
National Vital Statistics Reports,Vol. 64, No. 9, August 6, 2015 9
tational age: United States, 2005 and 2013
2005 2013
9.8 9.712.9 12.5
2.7 2.6 2.3 2.2
%
56.7
+16%
13.315.4
39–4037–3834–36 42 andover
41
Infant deaths
r 34
differences can vary depending on race and ethnicity (37) and other Rican women, congenital malformations was the leading cause of socioeconomic indicators (38). infant death, followed by low birthweight. For non-Hispanic black and
Puerto Rican women, these two categories were reversed.
Leading causes of infant death When differences in cause-specific infant mortality rates were examined by race and ethnicity, infant mortality rates from congenital
Infant mortality rates for the five leading causes of infant death malformations were 34% higher for AIAN, and 23% higher for non-are presented in Table 5 by race and Hispanic origin of mother. Hispanic black than for non-Hispanic white women. Infant mortality The leading cause of infant death in the United States in 2013 rates from congenital malformations were 23% lower for API and was Congenital malformations, deformations and chromosomal 21% lower for Mexican than for non-Hispanic white women. abnormalities (congenital malformations), accounting for 20% Infants of non-Hispanic black women had the highest mortality of all infant deaths. Disorders relating to short gestation and low rates from low birthweight. The rate for non-Hispanic black women birthweight, not elsewhere classified (low birthweight) was the was 2.5 times that for non-Hispanic white women. The rate for Puerto second leading cause, accounting for 18% of all infant deaths. Rican women was 77% higher than for non-Hispanic white women. Newborn affected by maternal complications of pregnancy (maternal For maternal complications (which include incompetent cervix, complications) was the third leading cause, with 7% of infant premature rupture of membranes, and multiple pregnancy, for deaths, followed by Sudden infant death syndrome (SIDS) (7%), and example), infants of non-Hispanic black women had the highest Accidents (unintentional injuries) (5%). Together, the five leading mortality rates—nearly 3 times those for non-Hispanic white
causes accounted for 57% of all infant deaths in the United States in women. Non-Hispanic black women have a much higher percentage of preterm births (Table 3), which may help to explain the high infant 2013. The order of the top five leading causes changed slightly from mortality rates from maternal complications, as this cause occurs 2012 to 2013. In 2012, SIDS was the third leading cause, followed predominantly among preterm infants. Infant mortality rates from by maternal complications, whereas in 2013, maternal complications maternal complications were 62% higher for Puerto Rican women was third and SIDS was fourth. For 2012–2013, there were no than for non-Hispanic white women. significant changes in infant mortality rates for the leading causes of
SIDS rates for non-Hispanic black women were 83% higher, death. During 2005–2013, the infant mortality rate declined by 10% and rates for AIAN women were 95% higher than for non-Hispanic for congenital malformations, by 6% for low birthweight, and by 26% white women. In contrast, SIDS rates were 44% lower for Mexican, for SIDS. In contrast, the infant mortality rate for unintentional injuries 53% lower for Puerto Rican, and 64% lower for API women than for
increased by 11% during 2005–2013. non-Hispanic white women. As most SIDS deaths occur during the
In 2013, as in previous years, the rank order of leading causes postneonatal period, the high SIDS rates for infants of non-Hispanic
of infant death varied substantially by race and Hispanic origin of black and AIAN women accounted for much of their elevated risk of the mother. For all groups except non-Hispanic black and Puerto postneonatal mortality.
10 National Vital Statistics Reports, Vol. 64, No. 9, August 6, 2015
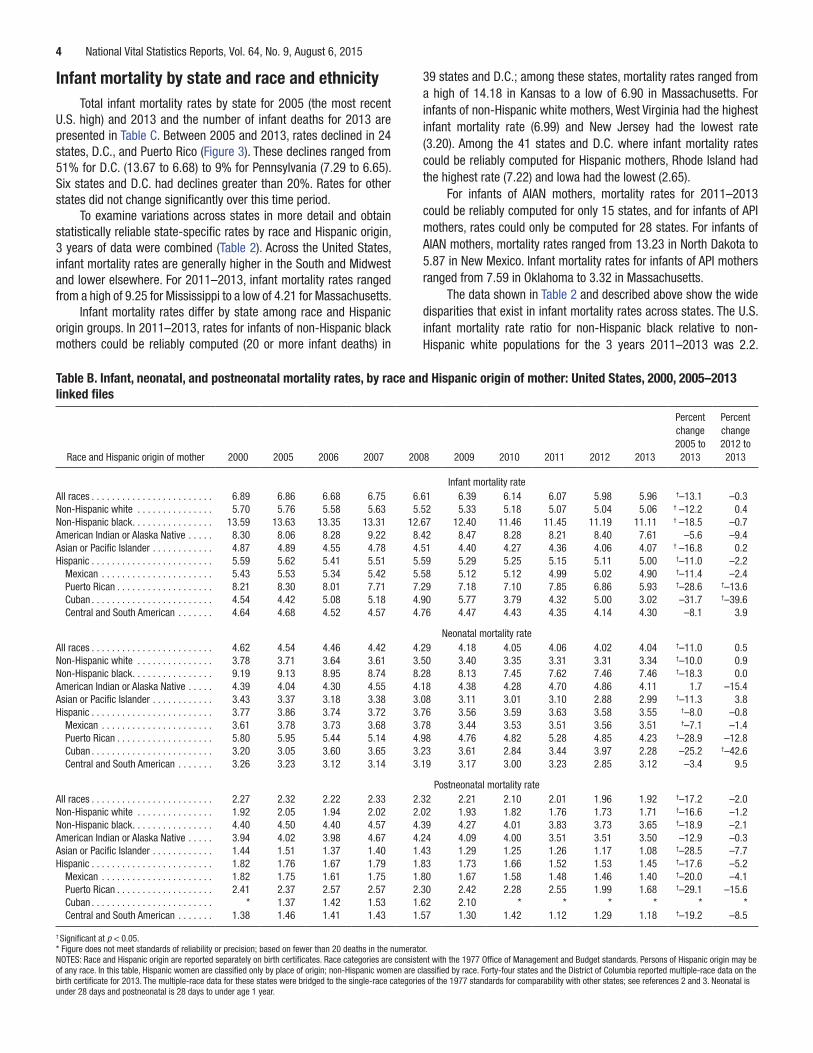
Figure 5. Sudden unexpected infant death rates, by race and Hispanic origin of mother: United States, 2013
1Includes persons of Hispanic and non-Hispanic origin.SOURCE: CDC/NCHS, National Vital Statistics System.
Rat
e pe
r 100
,000
live
birt
hs
87.0
172.5 169.6
84.5
67.3
47.5
29.017.5
0
20
40
60
80
100
120
140
160
180
200
Total Non-Hispanicblack
AmericanIndian
or Alaskanative1
Non-Hispanicwhite
Puerto Rican Mexican Asian orPacific
Islander1
Centraland SouthAmerican
For unintentional injuries, the non-Hispanic black rate was more other”) had a high percentage of preterm infant deaths but lacked than twice the non-Hispanic white rate. Infant mortality rates from sufficient specificity to be able to establish the etiologic connection unintentional injuries were 75% higher for AIAN and 28% higher for to prematurity with any degree of certainty. Puerto Rican women than for non-Hispanic white women. In contrast, Table 6 shows trends in preterm-related infant mortality by race infant mortality rates from unintentional injuries were 41% lower for and Hispanic origin of mother. In 2013, 8,470 out of a total of 23,446 Mexican than for non-Hispanic white women. infant deaths (36.1%) in the United States were preterm-related.
The impact of preterm-related infant deaths varied considerably by Preterm-related causes of death maternal race and ethnicity. In 2013, 44% of non-Hispanic black,
and 41% of Puerto Rican infant deaths were due to preterm-related To more fully assess the impact of preterm birth on infant preterm- causes, while the percentage was somewhat lower for other racial mortality, CDC researchers have developed a grouping of
related causes of death. A cause of death was considered preterm- and ethnic groups (Table 6).
related if 75% or more of infants whose deaths were attributed to Preterm-related infant mortality rates varied considerablythat cause were born at under 37 weeks of gestation, and the cause by race and ethnicity of the mother (Table 6). The preterm-related of death was a direct consequence of preterm birth based on a infant mortality rate for non-Hispanic black women (490.9 per clinical evaluation and review of the literature (39,40). 100,000) was 3 times that for non-Hispanic white women (159.1).
The preterm-related cause-of-death grouping includes The preterm-related infant mortality rate was 52% higher for Puerto Disorders related to short gestation and low birthweight not Rican women (241.6), and 28% higher for AIAN (204.4) women than elsewhere classified, and most of the Maternal complications of for non-Hispanic white (159.1) women. pregnancy category from the five leading causes of death. Also Although preterm-related infant mortality rates were highest for included are a variety of other causes of death closely associated non-Hispanic black and Puerto Rican women, they also experienced with prematurity such as Respiratory distress of newborn, Bacterial the largest declines in recent years. From 2005 (the most recent sepsis of newborn, Necrotizing enterocolitis of newborn, and overall U.S. infant mortality rate high) to 2013, preterm-related infant others. The comprehensive list of preterm-related cause-of-death mortality rates declined by 22% for non-Hispanic black women, and categories (ICD–10 codes) is shown in the note on Table 6. Even
by 30% for Puerto Rican women, compared with a 14% decline for this comprehensive grouping probably underestimates the total
non-Hispanic white women. Preterm-related infant mortality rates impact of preterm-related infant mortality, as some cause-of-death also declined by 10% for Mexican women, while changes for other categories (notably those beginning with the words “Other” and “All race and ethnic groups were not statistically significant (Table 6).
National Vital Statistics Reports,Vol. 64, No. 9, August 6, 2015 11
Sudden unexpected infant deaths death rates by race and Hispanic origin: A summary of currentresearch, 1999. National Center for Health Statistics. Vital Health Stat
A special cause-of-death category for Sudden unexpected 2(128). 1999.infant deaths (SUID) has recently been developed (41). This was 7. NCHS. U.S. Certificate of Live Birth. 2003. Available from: http://www.developed in response to variations over time and between those cdc.gov/nchs/data/dvs/birth11-03final-ACC.pdf.
who complete death certificates in how sudden unexpected infant 8. Hamilton BE, Ventura SJ. Characteristics of births to single- and
deaths are reported on death certificates (41,42). multiple-race women: California, Hawaii, Pennsylvania, Utah, andWashington, 2003. National vital statistics reports; vol 55 no 15. The SUID category combines ICD–10 codes for SIDS (R95), Hyattsville, MD: National Center for Health Statistics. 2007.Other ill-defined and unspecified causes of mortality (R99), and
9. MacDorman MF. Race and ethnic disparities in fetal mortality, preterm Accidental suffocation and strangulation in bed (W75). This category birth, and infant mortality in the United States: An overview. Semin is being increasingly used by researchers to produce more accurate Perinatol 35(4):200–8. 2011.comparisons in SUIDs over time and between geographic areas 10. MacDorman MF, Mathews TJ. Understanding racial and ethnic(41,42). SUID is among the leading health indicators measured in disparities in U.S. infant mortality rates. NCHS data brief, no 74. Healthy People 2020 (43). Hyattsville, MD: National Center for Health Statistics. 2011.
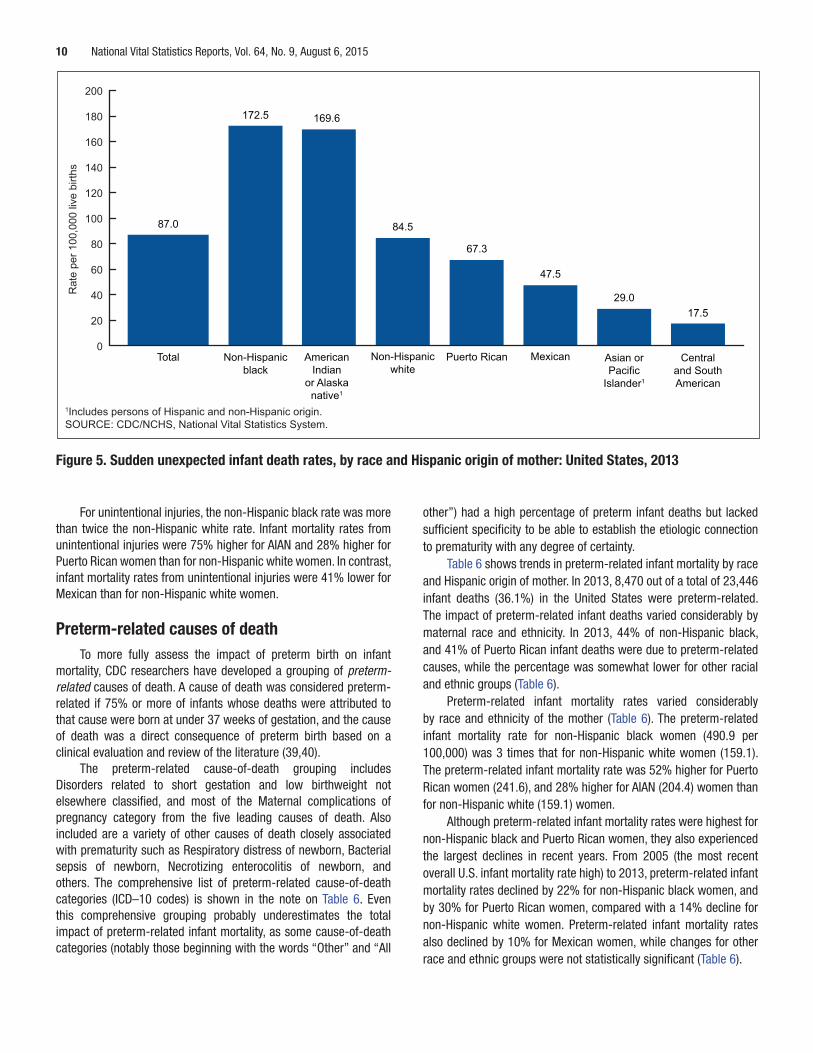
In 2013, there were 3,422 SUIDs in the United States, comprising 11. Fuse K, Crenshaw EM. Gender imbalance in infant mortality: A cross-
14.6% of total infant deaths in that year. The SUID rate was 87.0 infant national study of social structure and female infanticide. Soc Sci Med
deaths per 100,000 live births in 2013, 10% lower than the rate of 62(2):360–74. 2006.12. Martin JA, Hamilton BE, Osterman MJK. Three decades of twin births 97.2 in 2005, the most recent overall infant mortality rate high. SUID
in the United States, 1980–2009. NCHS data brief, no 80. Hyattsville, rates were twice as high for non-Hispanic black (172.5) and AIAN MD: National Center for Health Statistics. 2012.
(169.6) women as for non-Hispanic white women (84.5). Compared 13. American Congress of Obstetricians and Gynecologists, Society for with non-Hispanic white women, SUID rates were significantly lower Maternal-Fetal Medicine. Multifetal gestations: Twin, triplet, andfor Puerto Rican (67.3), Mexican (47.5), API (29.0), and Central and higher-order multifetal pregnancies. ACOG Practice Bulletin no. 144. South American (17.5) women (Table 7 and Figure 5). Washington, DC. 2014.
14. Glinianaia SV, Rankin J, Sturgiss SN, Ward Platt MP, Crowder D, Bell R.
Contribution of leading causes of death to racial The North of England Survey of Twin and Multiple Pregnancy. Twin Res Hum Genet 16(1):112–6. 2013.
and ethnic infant mortality differences 15. Chang HH, Larson J, Blencowe H, Spong CY, Howson CP, Cairns-Smith S, et al. Preventing preterm births: Analysis of trends and potential The contribution of individual causes of death to racial and reductions with interventions in 39 countries with very high human ethnic disparities in infant mortality can be assessed by relating development index. Lancet 381(9862):223–34. 2013.
differences in rates from individual causes of death to the overall 16. Ancel PY, Goffinet F, EPIPAGE-2 Writing Group, Kuhn P, Langer B, Matis infant mortality difference (10). When this is done, 54% of the higher J, et al. Survival and morbidity of preterm children born at 22 through infant mortality rate for non-Hispanic black women when compared 34 weeks gestation in France in 2011: Results of the EPIPAGE-2 cohort with non-Hispanic white women is due to their higher infant mortality study. JAMA Pediatr 169(3):230–8. 2015.rate from preterm-related causes, and 15% is due to differences in 17. Adams JN, Feldman HM, Huffman LC, Loe IM. Sensory processing in SUIDs. For Puerto Rican women, nearly all (94%) of the difference preterm preschoolers and its association with executive function. Early
in overall infant mortality rates between Puerto Rican and non- Hum Dev 91(3):227–33. 2015.
Hispanic white women was due to preterm-related causes of death. 18. Brown L, Burns YR, Watter P, Gibbons KS, Gray PH. Motor performance, postural stability and behaviour of non-disabled extremely preterm or In contrast, for AIAN mothers, 33% of their elevated infant mortality extremely low birth weight children at four to five years of age. Early rates when compared with non-Hispanic white women were due to Hum Dev 91(5):309–15. 2015.
differences in SUID, 18% to differences in preterm-related causes, 19. van der Pal-de Bruin KM, van der Pal SM, Verloove-Vanhorick SP, and 16% due to differences in congenital anomalies. Walther FJ. Profiling the preterm or VLBW born adolescent; implications
of the Dutch POPS cohort follow-up studies. Early Hum Dev 91(2):97–
References 102. 2015.20. Stoll BJ, Hansen NI, Bell EF, Shankaran S, Laptook AR, Walsh MC, et
1. NCHS. Public use data file documentation: 2013 period linked birth/ al. Neonatal outcomes of extremely preterm infants from the NICHD infant death data set. Hyattsville, MD. 2015. Neonatal Research Network. Pediatrics 126(3):443–56. 2010.
2. Martin JA, Hamilton BE, Osterman MJK, et al. Births: Final data for 21. Spong CY. Defining “term” pregnancy: Recommendations from the 2013. National vital statistics reports; vol 64 no 1. Hyattsville, MD: Defining “Term” Pregnancy Workgroup. JAMA 309(23):2445–6. 2013.NCHS. 2015. 22. MacDorman MF, Mathews TJ, Mohangoo AD, Zeitlin J. International
3. NCHS. User guide to the 2013 natality public use file. Hyattsville, MD. comparisons of infant mortality and related factors: United States and Available from: ftp://ftp.cdc.gov/pub/Health_Statistics/NCHS/Dataset_ Europe, 2010. National vital statistics reports; vol 63 no 5. Hyattsville, Documentation/DVS/natality/UserGuide2013.pdf. MD: National Center for Health Statistics. 2014.
4. Kochanek KD, Murphy SL, Xu JQ. Deaths: Final data for 2011. National 23. Horgan MJ. Management of the late preterm infant: Not quite ready for vital statistics reports; vol 63 no 3. Hyattsville, MD: National Center for prime time. Pediatr Clin North Am 62(2):439–51. 2015.Health Statistics. 2015. 24. Heinonen K, Eriksson JG, Lahti J, Kajantie E, Pesonen AK, Tuovinen
5. WHO. International statistical classification of diseases and related S, et al. Late preterm birth and neurocognitive performance in late health problems, 10th revision (ICD–10). 2nd ed. Geneva, Switzerland. adulthood: A birth cohort study. Pediatrics 135(4):e818–25. 2015.2004. 25. Boyle EM, Johnson S, Manktelow B, Seaton SE, Draper ES, Smith LK,
6. Rosenberg HM, Maurer JD, Sorlie PD, Johnson NJ, et al. Quality of et al. Neonatal outcomes and delivery of care for infants born late
12 National Vital Statistics Reports, Vol. 64, No. 9, August 6, 2015
preterm or moderately preterm: A prospective population-based study. documentation (published annually). Hyattsville, MD. 2014. Arch Dis Child Fetal Neonatal Ed. 2015. 46. OMB. Revisions to the standards for the classification of federal data
26. Rabie NZ, Bird TM, Magann EF, Hall RW, McKelvey SS. ADHD and on race and ethnicity. Fed Regist 62(210):58782–90. 1997.developmental speech/language disorders in late preterm, early term 47. OMB. Race and ethnic standards for federal statistics and administrative and term infants. J Perinatol. 2015. reporting. Statistical Policy Directive 15. May 12, 1977.
27. Braveman PA, Heck K, Egerter S, Marchi KS, Dominguez TP, Cubbin C, 48. Johnson DP. Coding and editing multiple race and ethincity. In: 2004et al. The role of socioeconomic factors in black-white disparities in joint meeting of NAPHSIS and VSCP. Portland, OR: June 6–10, 2004.preterm birth. Am J Public Health 105(4):694–702. 2015. 49. Martin JA, Osterman MJK, Kirmeyer SE, Gregory ECW. Measuring
28. Paulson J, Ramsini W, Conrey E, Cooper M. Unregistered deaths among gestational age in vital statistics data: Transitioning to the obstetricextremely low birthweight infants—Ohio, 2006. MMWR 56(42):1101– estimate. National vital statistics reports; vol 64 no 5. Hyattsville, MD: 3. 2007. National Center for Health Statistics. 2015.
29. NCHS. User guide to the 2012 period linked birth/infant death 50. NCHS. Vital statistics, instructions for classifying the underlying cause public use file. Hyattsville, MD. Available from: ftp://ftp.cdc.gov/pub/ of death. NCHS instruction manual; part 2a. Hyattsville, MD: PublicHealth_Statistics/NCHS/Dataset_Documentation/DVS/periodlinked/ Health Service. 2014. LinkPE12Guide.pdf. 51. NCHS. Vital statistics, instructions for classifying the underlying cause
30. Lamminpää R, Vehviläinen-Julkunen K, Gissler M, Heinonen S. of death. NCHS instruction manual; part 2b. Hyattsville, MD: PublicPreeclampsia complicated by advanced maternal age: A registry- Health Service. 2014. based study on primiparous women in Finland 1997–2008. BMC 52. WHO. Manual of the international statistical classification of diseases, Pregnancy Childbirth 12:47. 2012. injuries, and causes of death, 9th revision. Geneva, Switzerland. 1977.
31. Kozuki N, Lee AC, Silveira MF, Sania A, Vogel JP, Adair L, et al. The 53. Anderson RN, Minino AM, Hoyert DL, Rosenberg HM. Comparability of associations of parity and maternal age with small-for-gestational- cause of death between ICD–9 and ICD–10: Preliminary estimates.age, preterm, and neonatal and infant mortality: A meta-analysis. BMC National vital statistics reports; vol 49 no 2. Hyattsville, MD: National Public Health 13 Suppl 3:S2. 2013. Center for Health Statistics. 2001.
32. Luke B, Brown MB. Elevated risks of pregnancy complications 54. National Center for Health Statistics Data Warehouse. Comparability of and adverse outcomes with increasing maternal age. Hum Reprod cause-of-death between ICD revisions. 2008. 22(5):1264–72. 2007. 55. NCHS. ICD–10 cause-of-death lists for tabulating mortality statistics,
33. Raatikainen K, Heiskanen N, Heinonen S. Marriage still protects effective 1999. NCHS instruction manual: part 9. Hyattsville, MD:pregnancy. BJOG 112(10):1411–6. 2005. Public Health Service. 1999.
34. Shah PS, Zao J, Ali S, Knowledge Synthesis Group of Determinants 56. Malloy MH, MacDorman M. Changes in the classification of suddenof Preterm/LBW Births. Maternal marital status and birth outcomes: unexpected infant deaths: United States, 1992–2001. PediatricsA systematic review and meta-analyses. Matern Child Health J 115(5):1247–53. 2005.15(7):1097–109. 2011. 57. Shapiro-Mendoza CK, Kimball M, Tomashek KM, Anderson RN, Blanding
35. Singh GK, Miller BA. Health, life expectancy, and mortality patterns S. U.S. infant mortality trends attributable to accidental suffocation and among immigrant populations in the United States. Can J Public Health strangulation in bed from 1984 through 2004: Are rates increasing?95(3):I14–21. 2004. Pediatrics 123(2):533–9. 2009.
36. Liu KL, Laraque F. Higher mortality rate among infants of U.S.-born 58. Corey TS, Hanzlick R, Howard J, Nelson C, Krous H, NAME Ad Hocmothers compared to foreign-born mothers in New York City. J Immigr Committee on Sudden Unexplained Infant Death. A functionalMinor Health 8(3):281–9. 2006. approach to sudden unexplained infant deaths. Am J Forensic Med
37. Singh GK, Rodriguez-Lainz A, Kogan MD. Immigrant health inequalities Pathol 28(3):271–7. 2007.in the United States: Use of eight major national data systems. 59. HHS, Health Resources and Services Administration, Maternal andScientificWorldJournal 2013:512313. 2013. Child Health Bureau. Collaborative Improvement & Innovation Network
38. DeCamp LR, Choi H, Fuentes-Afflick E, Sastry N. Immigrant Latino to Reduce Infant Mortality. 2015.neighborhoods and mortality among infants born to Mexican-origin 60. HHS, Health Resources and Services Administration, Maternal andLatina women. Matern Child Health J 19(6):1354–63. 2014. Child Health Bureau. Child Health USA 2014. Rockville, MD: 2014.
39. Callaghan WD, MacDorman MF, Rasmussen SA, Qin C, Lackritz EM. 61. Brillinger DR. The natural variability of vital rates and associatedThe contribution of preterm birth to infant mortality rates in the United statistics. Biometrics 42(4):693–734. 1986.States. Pediatrics 118(4):1566–73. 2006.
40. MacDorman MF, Callaghan WM, Mathews TJ, Hoyert DL, Kochanek KD. Trends in preterm-related infant mortality by race and ethnicity, United States, 1999–2004. Int J Health Serv 37(4):635–41. 2007.
41. Shapiro-Mendoza CK, Tomashek KM, Anderson RN, Wingo J. Recent national trends in sudden, unexpected infant deaths: More evidence supporting a change in classification or reporting. Am J Epidemiol 163(8):762–9. 2006.
42. Nashelsky MB, Pinckard JK. The death of SIDS. Academic Forensic Pathology 1(1):92–8. 2011.
43. HHS. Office of Disease Prevention and Health. Healthy People 2020 topics and objectives: Maternal, infant, and child health. 2015.
44. Buehler JW, Prager K, Hogue CJ. The role of linked birth and infant death certificates in maternal and child health epidemiology in the United States. Am J Prev Med 19(1 Suppl):3–11. 2000.
45. NCHS. Mortality multiple cause of death public use data file
National Vital Statistics Reports,Vol. 64, No. 9, August 6, 2015 13
List of Detailed Tables 1. Infant mortality rates, live births, and infant deaths, by selected
characteristics and Hispanic origin of mother and by race of mother for mothers of non-Hispanic origin: United States, 2013 linked file . . . . . . . . . . . . . . . . . . . . . . . . . . . . . . . . . . . . . . . . . . 14
2. Infant mortality rates, by race and Hispanic origin of mother: United States and each state, Puerto Rico, and Guam, 2011–2013 linked files . . . . . . . . . . . . . . . . . . . . . . . . . . . . . . . . . . . . . . . . . 17
3. Percentage of live births with selected maternal and infant characteristics, by race and Hispanic origin of mother: United States, 2013 linked file . . . . . . . . . . . . . . . . . . . . . . . . . . . . . . . . 18
4. Live births, infant, neonatal, and postneonatal deaths, and mortality rates, by race and Hispanic origin of mother and birthweight: United States, 2013 linked file, and percent change in birthweight-specific infant mortality, 2005 and 2013 linked files . 19
5. Infant deaths and mortality rates for the five leading causes of infant death, by race and Hispanic origin of mother: United States, 2013 linked file . . . . . . . . . . . . . . . . . . . . . . . . . . . . . . . . . . . . . . 21
6. Number and percentage of preterm-related infant deaths and preterm-related infant mortality rates, by race and Hispanic origin of mother, United States, 2000–2013 linked files . . . . . . . . . . . . . 22
7. Number and percentage of SUID and SUID mortality rates, by race and Hispanic origin of mother, United States, 2000–2013 linked files . . . . . . . . . . . . . . . . . . . . . . . . . . . . . . . . . . . . . . . . . . . . . . . 23
14 National Vital Statistics Reports, Vol. 64, No. 9, August 6, 2015
Table 1. Infant mortality rates, live births, and infant deaths, by selected characteristics and Hispanic origin of mother and by race of mother for mothers of non-Hispanic origin: United States, 2013 linked file
Non-Hispanic HispanicAmerican Indian or Asian or Central Alaska Pacific Puerto and South
Characteristic All origins1 White Black Native2 Islander Total Mexican Rican Cuban American
Infant mortality rates per 1,000 live births in specified group
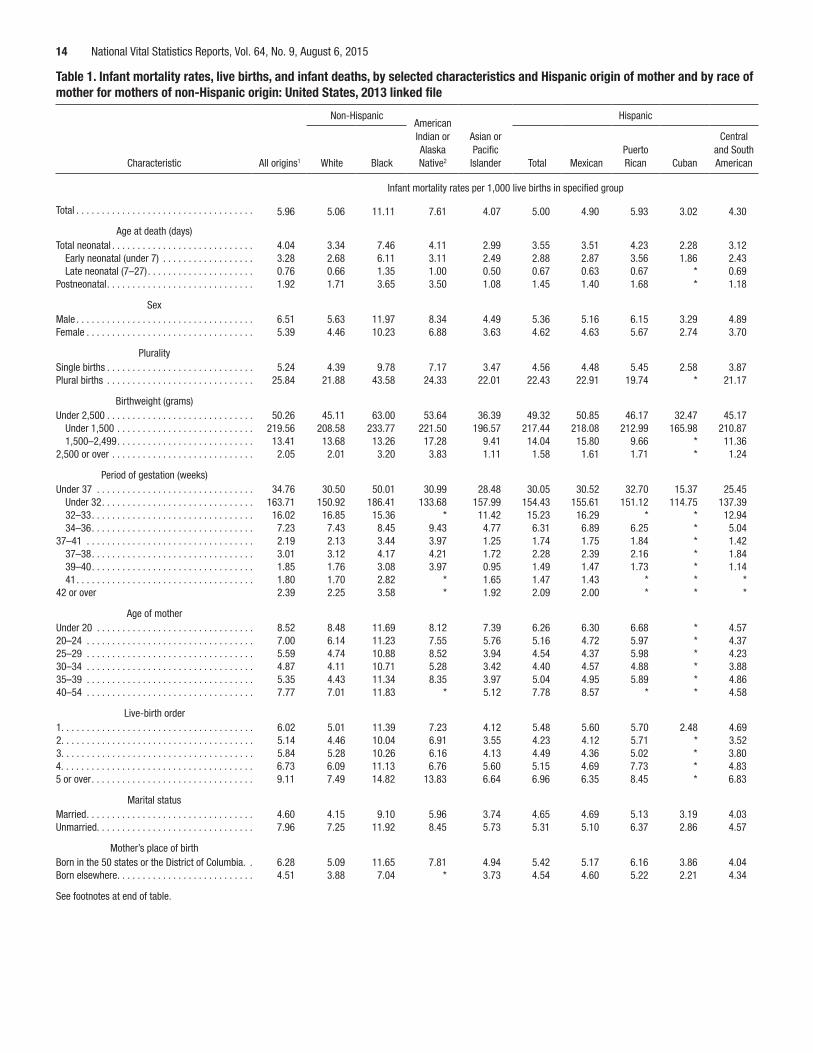
Total . . . . . . . . . . . . . . . . . . . . . . . . . . . . . . . . . . . 5.96 5.06 11.11 7.61 4.07 5.00 4.90 5.93 3.02 4.30
Age at death (days)Total neonatal . . . . . . . . . . . . . . . . . . . . . . . . . . . . 4.04 3.34 7.46 4.11 2.99 3.55 3.51 4.23 2.28 3.12
Early neonatal (under 7) . . . . . . . . . . . . . . . . . . 3.28 2.68 6.11 3.11 2.49 2.88 2.87 3.56 1.86 2.43Late neonatal (7–27) . . . . . . . . . . . . . . . . . . . . . 0.76 0.66 1.35 1.00 0.50 0.67 0.63 0.67 * 0.69
Postneonatal . . . . . . . . . . . . . . . . . . . . . . . . . . . . . 1.92 1.71 3.65 3.50 1.08 1.45 1.40 1.68 * 1.18
SexMale . . . . . . . . . . . . . . . . . . . . . . . . . . . . . . . . . . . 6.51 5.63 11.97 8.34 4.49 5.36 5.16 6.15 3.29 4.89Female . . . . . . . . . . . . . . . . . . . . . . . . . . . . . . . . . 5.39 4.46 10.23 6.88 3.63 4.62 4.63 5.67 2.74 3.70
PluralitySingle births . . . . . . . . . . . . . . . . . . . . . . . . . . . . . 5.24 4.39 9.78 7.17 3.47 4.56 4.48 5.45 2.58 3.87Plural births . . . . . . . . . . . . . . . . . . . . . . . . . . . . . 25.84 21.88 43.58 24.33 22.01 22.43 22.91 19.74 * 21.17
Birthweight (grams)Under 2,500 . . . . . . . . . . . . . . . . . . . . . . . . . . . . . 50.26 45.11 63.00 53.64 36.39 49.32 50.85 46.17 32.47 45.17
Under 1,500 . . . . . . . . . . . . . . . . . . . . . . . . . . . 219.56 208.58 233.77 221.50 196.57 217.44 218.08 212.99 165.98 210.871,500–2,499 . . . . . . . . . . . . . . . . . . . . . . . . . . . 13.41 13.68 13.26 17.28 9.41 14.04 15.80 9.66 * 11.36
2,500 or over . . . . . . . . . . . . . . . . . . . . . . . . . . . . 2.05 2.01 3.20 3.83 1.11 1.58 1.61 1.71 * 1.24
Period of gestation (weeks)Under 37 . . . . . . . . . . . . . . . . . . . . . . . . . . . . . . . 34.76 30.50 50.01 30.99 28.48 30.05 30.52 32.70 15.37 25.45
Under 32 . . . . . . . . . . . . . . . . . . . . . . . . . . . . . . 163.71 150.92 186.41 133.68 157.99 154.43 155.61 151.12 114.75 137.3932–33 . . . . . . . . . . . . . . . . . . . . . . . . . . . . . . . . 16.02 16.85 15.36 * 11.42 15.23 16.29 * * 12.9434–36 . . . . . . . . . . . . . . . . . . . . . . . . . . . . . . . . 7.23 7.43 8.45 9.43 4.77 6.31 6.89 6.25 * 5.04
37–41 . . . . . . . . . . . . . . . . . . . . . . . . . . . . . . . . . 2.19 2.13 3.44 3.97 1.25 1.74 1.75 1.84 * 1.4237–38 . . . . . . . . . . . . . . . . . . . . . . . . . . . . . . . . 3.01 3.12 4.17 4.21 1.72 2.28 2.39 2.16 * 1.8439–40 . . . . . . . . . . . . . . . . . . . . . . . . . . . . . . . . 1.85 1.76 3.08 3.97 0.95 1.49 1.47 1.73 * 1.1441 . . . . . . . . . . . . . . . . . . . . . . . . . . . . . . . . . . . 1.80 1.70 2.82 * 1.65 1.47 1.43 * * *
42 or over 2.39 2.25 3.58 * 1.92 2.09 2.00 * * *
Age of motherUnder 20 . . . . . . . . . . . . . . . . . . . . . . . . . . . . . . . 8.52 8.48 11.69 8.12 7.39 6.26 6.30 6.68 * 4.5720–24 . . . . . . . . . . . . . . . . . . . . . . . . . . . . . . . . . 7.00 6.14 11.23 7.55 5.76 5.16 4.72 5.97 * 4.3725–29 . . . . . . . . . . . . . . . . . . . . . . . . . . . . . . . . . 5.59 4.74 10.88 8.52 3.94 4.54 4.37 5.98 * 4.2330–34 . . . . . . . . . . . . . . . . . . . . . . . . . . . . . . . . . 4.87 4.11 10.71 5.28 3.42 4.40 4.57 4.88 * 3.8835–39 . . . . . . . . . . . . . . . . . . . . . . . . . . . . . . . . . 5.35 4.43 11.34 8.35 3.97 5.04 4.95 5.89 * 4.8640–54 . . . . . . . . . . . . . . . . . . . . . . . . . . . . . . . . . 7.77 7.01 11.83 * 5.12 7.78 8.57 * * 4.58
Live-birth order1. . . . . . . . . . . . . . . . . . . . . . . . . . . . . . . . . . . . . . 6.02 5.01 11.39 7.23 4.12 5.48 5.60 5.70 2.48 4.692. . . . . . . . . . . . . . . . . . . . . . . . . . . . . . . . . . . . . . 5.14 4.46 10.04 6.91 3.55 4.23 4.12 5.71 * 3.523. . . . . . . . . . . . . . . . . . . . . . . . . . . . . . . . . . . . . . 5.84 5.28 10.26 6.16 4.13 4.49 4.36 5.02 * 3.804. . . . . . . . . . . . . . . . . . . . . . . . . . . . . . . . . . . . . . 6.73 6.09 11.13 6.76 5.60 5.15 4.69 7.73 * 4.835 or over . . . . . . . . . . . . . . . . . . . . . . . . . . . . . . . . 9.11 7.49 14.82 13.83 6.64 6.96 6.35 8.45 * 6.83
Marital statusMarried . . . . . . . . . . . . . . . . . . . . . . . . . . . . . . . . . 4.60 4.15 9.10 5.96 3.74 4.65 4.69 5.13 3.19 4.03Unmarried. . . . . . . . . . . . . . . . . . . . . . . . . . . . . . . 7.96 7.25 11.92 8.45 5.73 5.31 5.10 6.37 2.86 4.57
Mother’s place of birthBorn in the 50 states or the District of Columbia. . 6.28 5.09 11.65 7.81 4.94 5.42 5.17 6.16 3.86 4.04Born elsewhere . . . . . . . . . . . . . . . . . . . . . . . . . . . 4.51 3.88 7.04 * 3.73 4.54 4.60 5.22 2.21 4.34
See footnotes at end of table.
National Vital Statistics Reports,Vol. 64, No. 9, August 6, 2015 15
Table 1. Infant mortality rates, live births, and infant deaths, by selected characteristics and Hispanic origin of mother and by race of mother for mothers of non-Hispanic origin: United States, 2013 linked file—Con.
Non-Hispanic HispanicAmerican Indian or Asian or Central Alaska Pacific Puerto and South
Characteristic All origins1 White Black Native2 Islander Total Mexican Rican Cuban American
Live births
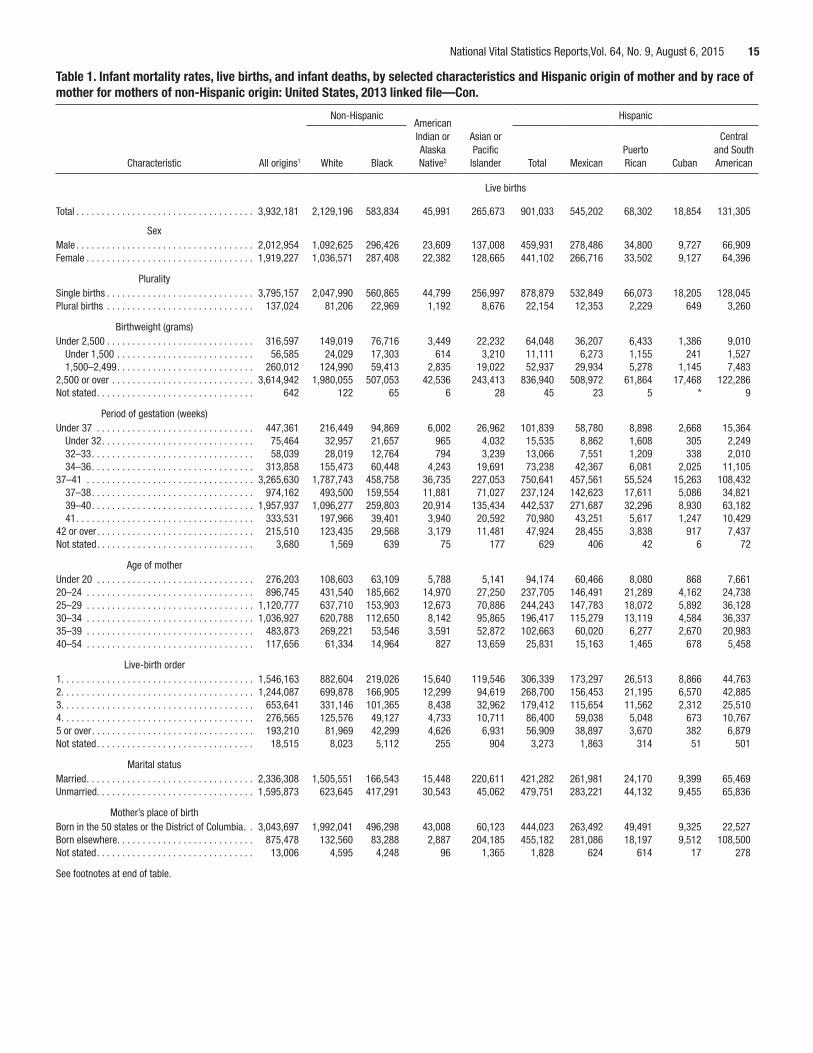
Total . . . . . . . . . . . . . . . . . . . . . . . . . . . . . . . . . . . 3,932,181 2,129,196 583,834 45,991 265,673 901,033 545,202 68,302 18,854 131,305
SexMale . . . . . . . . . . . . . . . . . . . . . . . . . . . . . . . . . . . 2,012,954 1,092,625 296,426 23,609 137,008 459,931 278,486 34,800 9,727 66,909 Female . . . . . . . . . . . . . . . . . . . . . . . . . . . . . . . . . 1,919,227 1,036,571 287,408 22,382 128,665 441,102 266,716 33,502 9,127 64,396
PluralitySingle births . . . . . . . . . . . . . . . . . . . . . . . . . . . . . 3,795,157 2,047,990 560,865 44,799 256,997 878,879 532,849 66,073 18,205 128,045 Plural births . . . . . . . . . . . . . . . . . . . . . . . . . . . . . 137,024 81,206 22,969 1,192 8,676 22,154 12,353 2,229 649 3,260
Birthweight (grams)Under 2,500 . . . . . . . . . . . . . . . . . . . . . . . . . . . . . 316,597 149,019 76,716 3,449 22,232 64,048 36,207 6,433 1,386 9,010
Under 1,500 . . . . . . . . . . . . . . . . . . . . . . . . . . . 56,585 24,029 17,303 614 3,210 11,111 6,273 1,155 241 1,527 1,500–2,499 . . . . . . . . . . . . . . . . . . . . . . . . . . . 260,012 124,990 59,413 2,835 19,022 52,937 29,934 5,278 1,145 7,483
2,500 or over . . . . . . . . . . . . . . . . . . . . . . . . . . . . 3,614,942 1,980,055 507,053 42,536 243,413 836,940 508,972 61,864 17,468 122,286 Not stated . . . . . . . . . . . . . . . . . . . . . . . . . . . . . . . 642 122 65 6 28 45 23 5 * 9
Period of gestation (weeks)Under 37 . . . . . . . . . . . . . . . . . . . . . . . . . . . . . . . 447,361 216,449 94,869 6,002 26,962 101,839 58,780 8,898 2,668 15,364
Under 32 . . . . . . . . . . . . . . . . . . . . . . . . . . . . . . 75,464 32,957 21,657 965 4,032 15,535 8,862 1,608 305 2,249 32–33 . . . . . . . . . . . . . . . . . . . . . . . . . . . . . . . . 58,039 28,019 12,764 794 3,239 13,066 7,551 1,209 338 2,010 34–36 . . . . . . . . . . . . . . . . . . . . . . . . . . . . . . . . 313,858 155,473 60,448 4,243 19,691 73,238 42,367 6,081 2,025 11,105
37–41 . . . . . . . . . . . . . . . . . . . . . . . . . . . . . . . . . 3,265,630 1,787,743 458,758 36,735 227,053 750,641 457,561 55,524 15,263 108,432 37–38 . . . . . . . . . . . . . . . . . . . . . . . . . . . . . . . . 974,162 493,500 159,554 11,881 71,027 237,124 142,623 17,611 5,086 34,821 39–40 . . . . . . . . . . . . . . . . . . . . . . . . . . . . . . . . 1,957,937 1,096,277 259,803 20,914 135,434 442,537 271,687 32,296 8,930 63,182 41 . . . . . . . . . . . . . . . . . . . . . . . . . . . . . . . . . . . 333,531 197,966 39,401 3,940 20,592 70,980 43,251 5,617 1,247 10,429
42 or over . . . . . . . . . . . . . . . . . . . . . . . . . . . . . . . 215,510 123,435 29,568 3,179 11,481 47,924 28,455 3,838 917 7,437 Not stated . . . . . . . . . . . . . . . . . . . . . . . . . . . . . . . 3,680 1,569 639 75 177 629 406 42 6 72
Age of motherUnder 20 . . . . . . . . . . . . . . . . . . . . . . . . . . . . . . . 276,203 108,603 63,109 5,788 5,141 94,174 60,466 8,080 868 7,661 20–24 . . . . . . . . . . . . . . . . . . . . . . . . . . . . . . . . . 896,745 431,540 185,662 14,970 27,250 237,705 146,491 21,289 4,162 24,738 25–29 . . . . . . . . . . . . . . . . . . . . . . . . . . . . . . . . . 1,120,777 637,710 153,903 12,673 70,886 244,243 147,783 18,072 5,892 36,128 30–34 . . . . . . . . . . . . . . . . . . . . . . . . . . . . . . . . . 1,036,927 620,788 112,650 8,142 95,865 196,417 115,279 13,119 4,584 36,337 35–39 . . . . . . . . . . . . . . . . . . . . . . . . . . . . . . . . . 483,873 269,221 53,546 3,591 52,872 102,663 60,020 6,277 2,670 20,983 40–54 . . . . . . . . . . . . . . . . . . . . . . . . . . . . . . . . . 117,656 61,334 14,964 827 13,659 25,831 15,163 1,465 678 5,458
Live-birth order1. . . . . . . . . . . . . . . . . . . . . . . . . . . . . . . . . . . . . . 1,546,163 882,604 219,026 15,640 119,546 306,339 173,297 26,513 8,866 44,763 2. . . . . . . . . . . . . . . . . . . . . . . . . . . . . . . . . . . . . . 1,244,087 699,878 166,905 12,299 94,619 268,700 156,453 21,195 6,570 42,885 3. . . . . . . . . . . . . . . . . . . . . . . . . . . . . . . . . . . . . . 653,641 331,146 101,365 8,438 32,962 179,412 115,654 11,562 2,312 25,510 4. . . . . . . . . . . . . . . . . . . . . . . . . . . . . . . . . . . . . . 276,565 125,576 49,127 4,733 10,711 86,400 59,038 5,048 673 10,767 5 or over . . . . . . . . . . . . . . . . . . . . . . . . . . . . . . . . 193,210 81,969 42,299 4,626 6,931 56,909 38,897 3,670 382 6,879 Not stated . . . . . . . . . . . . . . . . . . . . . . . . . . . . . . . 18,515 8,023 5,112 255 904 3,273 1,863 314 51 501
Marital statusMarried . . . . . . . . . . . . . . . . . . . . . . . . . . . . . . . . . 2,336,308 1,505,551 166,543 15,448 220,611 421,282 261,981 24,170 9,399 65,469 Unmarried. . . . . . . . . . . . . . . . . . . . . . . . . . . . . . . 1,595,873 623,645 417,291 30,543 45,062 479,751 283,221 44,132 9,455 65,836
Mother’s place of birthBorn in the 50 states or the District of Columbia. . 3,043,697 1,992,041 496,298 43,008 60,123 444,023 263,492 49,491 9,325 22,527 Born elsewhere . . . . . . . . . . . . . . . . . . . . . . . . . . . 875,478 132,560 83,288 2,887 204,185 455,182 281,086 18,197 9,512 108,500 Not stated . . . . . . . . . . . . . . . . . . . . . . . . . . . . . . . 13,006 4,595 4,248 96 1,365 1,828 624 614 17 278
See footnotes at end of table.
16 National Vital Statistics Reports, Vol. 64, No. 9, August 6, 2015
Table 1. Infant mortality rates, live births, and infant deaths, by selected characteristics and Hispanic origin of mother and by race of mother for mothers of non-Hispanic origin: United States, 2013 linked file—Con.
Non-Hispanic HispanicAmerican Indian or Asian or Central Alaska Pacific Puerto and South
Characteristic All origins1 White Black Native2 Islander Total Mexican Rican Cuban American
Infant deaths
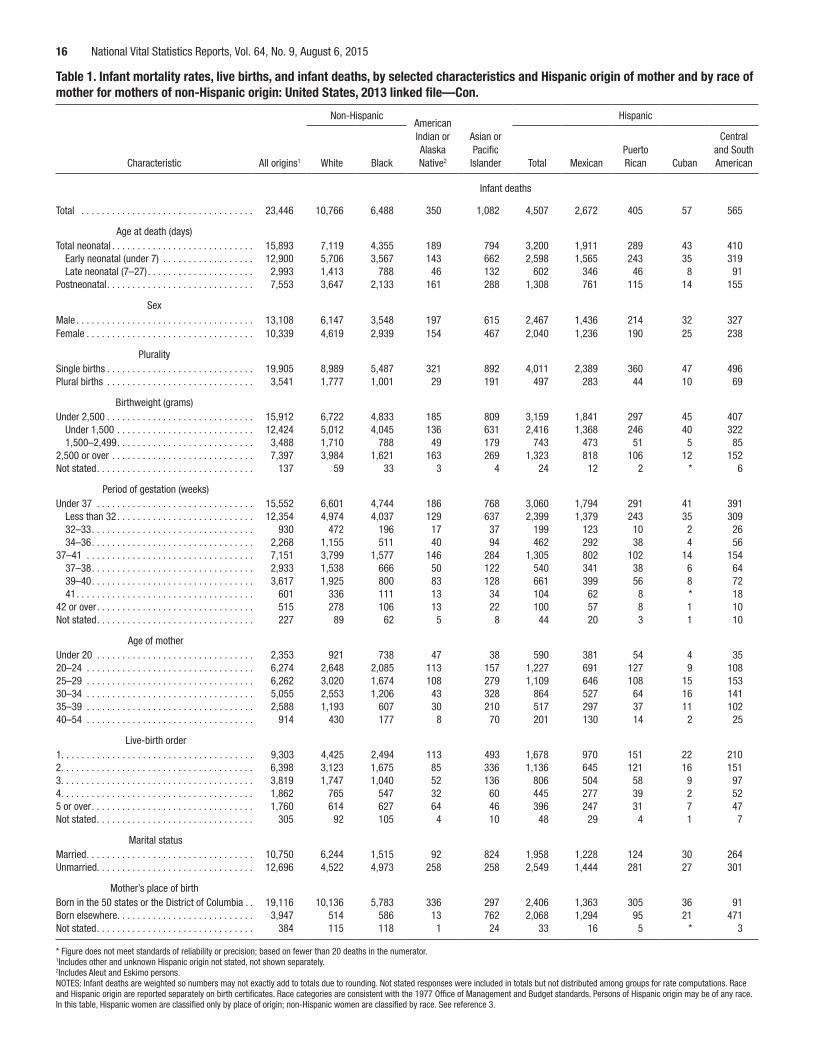
Total . . . . . . . . . . . . . . . . . . . . . . . . . . . . . . . . . . 23,446 10,766 6,488 350 1,082 4,507 2,672 405 57 565
Age at death (days) Total neonatal . . . . . . . . . . . . . . . . . . . . . . . . . . . . 15,893 7,119 4,355 189 794 3,200 1,911 289 43 410
Early neonatal (under 7) . . . . . . . . . . . . . . . . . . 12,900 5,706 3,567 143 662 2,598 1,565 243 35 319 Late neonatal (7–27) . . . . . . . . . . . . . . . . . . . . . 2,993 1,413 788 46 132 602 346 46 8 91
Postneonatal . . . . . . . . . . . . . . . . . . . . . . . . . . . . . 7,553 3,647 2,133 161 288 1,308 761 115 14 155
Sex Male . . . . . . . . . . . . . . . . . . . . . . . . . . . . . . . . . . . 13,108 6,147 3,548 197 615 2,467 1,436 214 32 327 Female . . . . . . . . . . . . . . . . . . . . . . . . . . . . . . . . . 10,339 4,619 2,939 154 467 2,040 1,236 190 25 238
Plurality Single births . . . . . . . . . . . . . . . . . . . . . . . . . . . . . 19,905 8,989 5,487 321 892 4,011 2,389 360 47 496 Plural births . . . . . . . . . . . . . . . . . . . . . . . . . . . . . 3,541 1,777 1,001 29 191 497 283 44 10 69
Birthweight (grams) Under 2,500 . . . . . . . . . . . . . . . . . . . . . . . . . . . . . 15,912 6,722 4,833 185 809 3,159 1,841 297 45 407
Under 1,500 . . . . . . . . . . . . . . . . . . . . . . . . . . . 12,424 5,012 4,045 136 631 2,416 1,368 246 40 322 1,500–2,499 . . . . . . . . . . . . . . . . . . . . . . . . . . . 3,488 1,710 788 49 179 743 473 51 5 85
2,500 or over . . . . . . . . . . . . . . . . . . . . . . . . . . . . 7,397 3,984 1,621 163 269 1,323 818 106 12 152 Not stated . . . . . . . . . . . . . . . . . . . . . . . . . . . . . . . 137 59 33 3 4 24 12 2 * 6
Period of gestation (weeks) Under 37 . . . . . . . . . . . . . . . . . . . . . . . . . . . . . . . 15,552 6,601 4,744 186 768 3,060 1,794 291 41 391
Less than 32 . . . . . . . . . . . . . . . . . . . . . . . . . . . 12,354 4,974 4,037 129 637 2,399 1,379 243 35 309 32–33 . . . . . . . . . . . . . . . . . . . . . . . . . . . . . . . . 930 472 196 17 37 199 123 10 2 26 34–36 . . . . . . . . . . . . . . . . . . . . . . . . . . . . . . . . 2,268 1,155 511 40 94 462 292 38 4 56
37–41 . . . . . . . . . . . . . . . . . . . . . . . . . . . . . . . . . 7,151 3,799 1,577 146 284 1,305 802 102 14 154 37–38 . . . . . . . . . . . . . . . . . . . . . . . . . . . . . . . . 2,933 1,538 666 50 122 540 341 38 6 64 39–40 . . . . . . . . . . . . . . . . . . . . . . . . . . . . . . . . 3,617 1,925 800 83 128 661 399 56 8 72 41 . . . . . . . . . . . . . . . . . . . . . . . . . . . . . . . . . . . 601 336 111 13 34 104 62 8 * 18
42 or over . . . . . . . . . . . . . . . . . . . . . . . . . . . . . . . 515 278 106 13 22 100 57 8 1 10 Not stated . . . . . . . . . . . . . . . . . . . . . . . . . . . . . . . 227 89 62 5 8 44 20 3 1 10
Age of mother Under 20 . . . . . . . . . . . . . . . . . . . . . . . . . . . . . . . 2,353 921 738 47 38 590 381 54 4 35 20–24 . . . . . . . . . . . . . . . . . . . . . . . . . . . . . . . . . 6,274 2,648 2,085 113 157 1,227 691 127 9 108 25–29 . . . . . . . . . . . . . . . . . . . . . . . . . . . . . . . . . 6,262 3,020 1,674 108 279 1,109 646 108 15 153 30–34 . . . . . . . . . . . . . . . . . . . . . . . . . . . . . . . . . 5,055 2,553 1,206 43 328 864 527 64 16 141 35–39 . . . . . . . . . . . . . . . . . . . . . . . . . . . . . . . . . 2,588 1,193 607 30 210 517 297 37 11 102 40–54 . . . . . . . . . . . . . . . . . . . . . . . . . . . . . . . . . 914 430 177 8 70 201 130 14 2 25
Live-birth order 1. . . . . . . . . . . . . . . . . . . . . . . . . . . . . . . . . . . . . . 9,303 4,425 2,494 113 493 1,678 970 151 22 210 2. . . . . . . . . . . . . . . . . . . . . . . . . . . . . . . . . . . . . . 6,398 3,123 1,675 85 336 1,136 645 121 16 151 3. . . . . . . . . . . . . . . . . . . . . . . . . . . . . . . . . . . . . . 3,819 1,747 1,040 52 136 806 504 58 9 97 4. . . . . . . . . . . . . . . . . . . . . . . . . . . . . . . . . . . . . . 1,862 765 547 32 60 445 277 39 2 52 5 or over . . . . . . . . . . . . . . . . . . . . . . . . . . . . . . . . 1,760 614 627 64 46 396 247 31 7 47 Not stated . . . . . . . . . . . . . . . . . . . . . . . . . . . . . . . 305 92 105 4 10 48 29 4 1 7
Marital status Married . . . . . . . . . . . . . . . . . . . . . . . . . . . . . . . . . 10,750 6,244 1,515 92 824 1,958 1,228 124 30 264 Unmarried. . . . . . . . . . . . . . . . . . . . . . . . . . . . . . . 12,696 4,522 4,973 258 258 2,549 1,444 281 27 301
Mother’s place of birthBorn in the 50 states or the District of Columbia . . 19,116 10,136 5,783 336 297 2,406 1,363 305 36 91 Born elsewhere . . . . . . . . . . . . . . . . . . . . . . . . . . . 3,947 514 586 13 762 2,068 1,294 95 21 471 Not stated . . . . . . . . . . . . . . . . . . . . . . . . . . . . . . . 384 115 118 1 24 33 16 5 * 3
* Figure does not meet standards of reliability or precision; based on fewer than 20 deaths in the numerator.1Includes other and unknown Hispanic origin not stated, not shown separately. 2Includes Aleut and Eskimo persons.NOTES: Infant deaths are weighted so numbers may not exactly add to totals due to rounding. Not stated responses were included in totals but not distributed among groups for rate computations. Race and Hispanic origin are reported separately on birth certificates. Race categories are consistent with the 1977 Office of Management and Budget standards. Persons of Hispanic origin may be of any race. In this table, Hispanic women are classified only by place of origin; non-Hispanic women are classified by race. See reference 3.
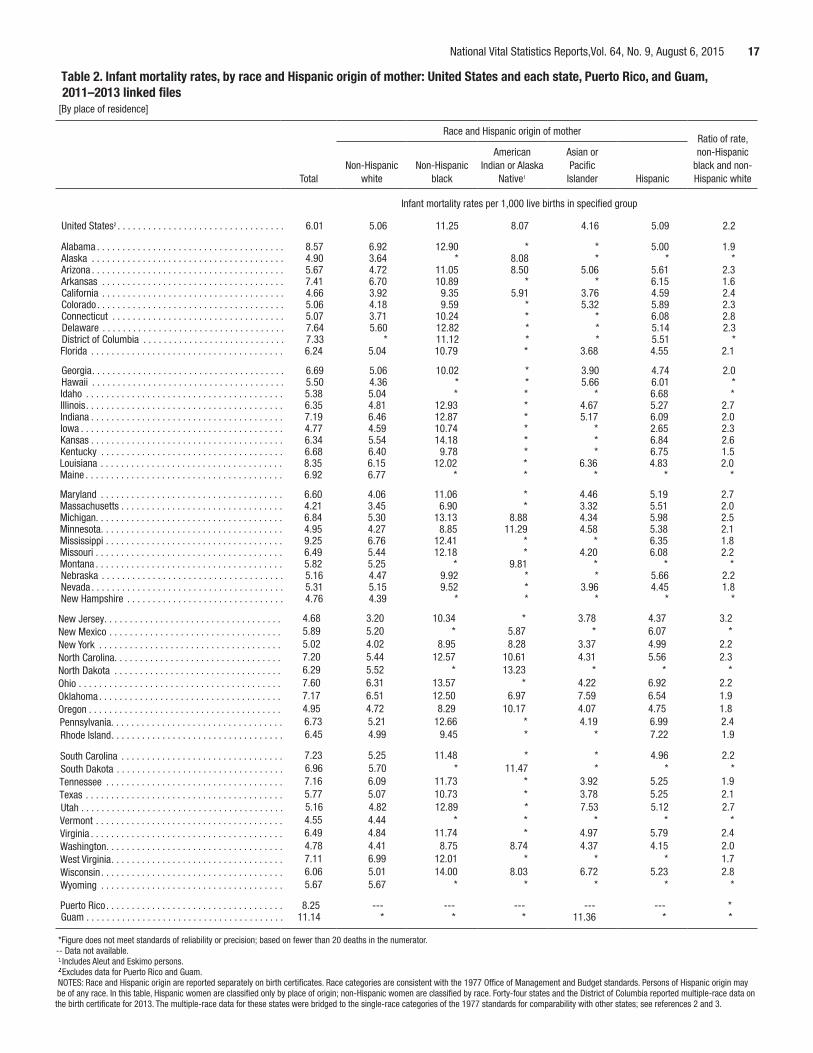
National Vital Statistics Reports,Vol. 64, No. 9, August 6, 2015 17
Table 2. Infant mortality rates, by race and Hispanic origin of mother: United States and each state, Puerto Rico, and Guam, 2011–2013 linked files
[By place of residence]
Race and Hispanic origin of motherRatio of rate,
American Asian or non-Hispanic Non-Hispanic Non-Hispanic Indian or Alaska Pacific black and non-
Total white black Native1 Islander Hispanic Hispanic white
Infant mortality rates per 1,000 live births in specified group
United States2 . . . . . . . . . . . . . . . . . . . . . . . . . . . . . . . . . 6.01 5.06 11.25 8.07 4.16 5.09 2.2
Alabama . . . . . . . . . . . . . . . . . . . . . . . . . . . . . . . . . . . . . 8.57 6.92 12.90 * * 5.00 1.9Alaska . . . . . . . . . . . . . . . . . . . . . . . . . . . . . . . . . . . . . . 4.90 3.64 * 8.08 * * *Arizona . . . . . . . . . . . . . . . . . . . . . . . . . . . . . . . . . . . . . . 5.67 4.72 11.05 8.50 5.06 5.61 2.3Arkansas . . . . . . . . . . . . . . . . . . . . . . . . . . . . . . . . . . . . 7.41 6.70 10.89 * * 6.15 1.6California . . . . . . . . . . . . . . . . . . . . . . . . . . . . . . . . . . . . 4.66 3.92 9.35 5.91 3.76 4.59 2.4Colorado . . . . . . . . . . . . . . . . . . . . . . . . . . . . . . . . . . . . . 5.06 4.18 9.59 * 5.32 5.89 2.3Connecticut . . . . . . . . . . . . . . . . . . . . . . . . . . . . . . . . . . 5.07 3.71 10.24 * * 6.08 2.8Delaware . . . . . . . . . . . . . . . . . . . . . . . . . . . . . . . . . . . . 7.64 5.60 12.82 * * 5.14 2.3District of Columbia . . . . . . . . . . . . . . . . . . . . . . . . . . . . 7.33 * 11.12 * * 5.51 *Florida . . . . . . . . . . . . . . . . . . . . . . . . . . . . . . . . . . . . . . 6.24 5.04 10.79 * 3.68 4.55 2.1
Georgia . . . . . . . . . . . . . . . . . . . . . . . . . . . . . . . . . . . . . . 6.69 5.06 10.02 * 3.90 4.74 2.0Hawaii . . . . . . . . . . . . . . . . . . . . . . . . . . . . . . . . . . . . . . 5.50 4.36 * * 5.66 6.01 *
Idaho . . . . . . . . . . . . . . . . . . . . . . . . . . . . . . . . . . . . . . . 5.38 5.04 * * * 6.68 * lIlinois . . . . . . . . . . . . . . . . . . . . . . . . . . . . . . . . . . . . . . . 6.35 4.81 12.93 * 4.67 5.27 2.7 Indiana . . . . . . . . . . . . . . . . . . . . . . . . . . . . . . . . . . . . . . 7.19 6.46 12.87 * 5.17 6.09 2.0 Iowa . . . . . . . . . . . . . . . . . . . . . . . . . . . . . . . . . . . . . . . . 4.77 4.59 10.74 * * 2.65 2.3 Kansas . . . . . . . . . . . . . . . . . . . . . . . . . . . . . . . . . . . . . . 6.34 5.54 14.18 * * 6.84 2.6 Kentucky . . . . . . . . . . . . . . . . . . . . . . . . . . . . . . . . . . . . 6.68 6.40 9.78 * * 6.75 1.5 Louisiana . . . . . . . . . . . . . . . . . . . . . . . . . . . . . . . . . . . . 8.35 6.15 12.02 * 6.36 4.83 2.0Maine . . . . . . . . . . . . . . . . . . . . . . . . . . . . . . . . . . . . . . . 6.92 6.77 * * * * *
Maryland . . . . . . . . . . . . . . . . . . . . . . . . . . . . . . . . . . . . 6.60 4.06 11.06 * 4.46 5.19 2.7Massachusetts . . . . . . . . . . . . . . . . . . . . . . . . . . . . . . . . 4.21 3.45 6.90 * 3.32 5.51 2.0Michigan. . . . . . . . . . . . . . . . . . . . . . . . . . . . . . . . . . . . . 6.84 5.30 13.13 8.88 4.34 5.98 2.5Minnesota . . . . . . . . . . . . . . . . . . . . . . . . . . . . . . . . . . . . 4.95 4.27 8.85 11.29 4.58 5.38 2.1Mississippi . . . . . . . . . . . . . . . . . . . . . . . . . . . . . . . . . . . 9.25 6.76 12.41 * * 6.35 1.8Missouri . . . . . . . . . . . . . . . . . . . . . . . . . . . . . . . . . . . . . 6.49 5.44 12.18 * 4.20 6.08 2.2Montana . . . . . . . . . . . . . . . . . . . . . . . . . . . . . . . . . . . . . 5.82 5.25 * 9.81 * * * Nebraska . . . . . . . . . . . . . . . . . . . . . . . . . . . . . . . . . . . . 5.16 4.47 9.92 * * 5.66 2.2 Nevada . . . . . . . . . . . . . . . . . . . . . . . . . . . . . . . . . . . . . . 5.31 5.15 9.52 * 3.96 4.45 1.8 New Hampshire . . . . . . . . . . . . . . . . . . . . . . . . . . . . . . . 4.76 4.39 * * * * *
New Jersey . . . . . . . . . . . . . . . . . . . . . . . . . . . . . . . . . . . 4.68 3.20 10.34 * 3.78 4.37 3.2New Mexico . . . . . . . . . . . . . . . . . . . . . . . . . . . . . . . . . . 5.89 5.20 * 5.87 * 6.07 *New York . . . . . . . . . . . . . . . . . . . . . . . . . . . . . . . . . . . . 5.02 4.02 8.95 8.28 3.37 4.99 2.2North Carolina . . . . . . . . . . . . . . . . . . . . . . . . . . . . . . . . . 7.20 5.44 12.57 10.61 4.31 5.56 2.3North Dakota . . . . . . . . . . . . . . . . . . . . . . . . . . . . . . . . . 6.29 5.52 * 13.23 * * *Ohio . . . . . . . . . . . . . . . . . . . . . . . . . . . . . . . . . . . . . . . . 7.60 6.31 13.57 * 4.22 6.92 2.2Oklahoma . . . . . . . . . . . . . . . . . . . . . . . . . . . . . . . . . . . . 7.17 6.51 12.50 6.97 7.59 6.54 1.9Oregon . . . . . . . . . . . . . . . . . . . . . . . . . . . . . . . . . . . . . . 4.95 4.72 8.29 10.17 4.07 4.75 1.8 Pennsylvania. . . . . . . . . . . . . . . . . . . . . . . . . . . . . . . . . . 6.73 5.21 12.66 * 4.19 6.99 2.4 Rhode Island . . . . . . . . . . . . . . . . . . . . . . . . . . . . . . . . . . 6.45 4.99 9.45 * * 7.22 1.9
South Carolina . . . . . . . . . . . . . . . . . . . . . . . . . . . . . . . . 7.23 5.25 11.48 * * 4.96 2.2 South Dakota . . . . . . . . . . . . . . . . . . . . . . . . . . . . . . . . . 6.96 5.70 * 11.47 * * * Tennessee . . . . . . . . . . . . . . . . . . . . . . . . . . . . . . . . . . . 7.16 6.09 11.73 * 3.92 5.25 1.9 Texas . . . . . . . . . . . . . . . . . . . . . . . . . . . . . . . . . . . . . . . 5.77 5.07 10.73 * 3.78 5.25 2.1 Utah . . . . . . . . . . . . . . . . . . . . . . . . . . . . . . . . . . . . . . . . 5.16 4.82 12.89 * 7.53 5.12 2.7 Vermont . . . . . . . . . . . . . . . . . . . . . . . . . . . . . . . . . . . . . 4.55 4.44 * * * * * Virginia . . . . . . . . . . . . . . . . . . . . . . . . . . . . . . . . . . . . . . 6.49 4.84 11.74 * 4.97 5.79 2.4Washington . . . . . . . . . . . . . . . . . . . . . . . . . . . . . . . . . . . 4.78 4.41 8.75 8.74 4.37 4.15 2.0West Virginia . . . . . . . . . . . . . . . . . . . . . . . . . . . . . . . . . . 7.11 6.99 12.01 * * * 1.7Wisconsin . . . . . . . . . . . . . . . . . . . . . . . . . . . . . . . . . . . . 6.06 5.01 14.00 8.03 6.72 5.23 2.8Wyoming . . . . . . . . . . . . . . . . . . . . . . . . . . . . . . . . . . . . 5.67 5.67 * * * * *
Puerto Rico . . . . . . . . . . . . . . . . . . . . . . . . . . . . . . . . . . . 8.25 --- --- --- --- --- * Guam . . . . . . . . . . . . . . . . . . . . . . . . . . . . . . . . . . . . . . . 11.14 * * * 11.36 * *
*Figure does not meet standards of reliability or precision; based on fewer than 20 deaths in the numerator.-- Data not available. Includes Aleut and Eskimo persons. Excludes data for Puerto Rico and Guam.NOTES: Race and Hispanic origin are reported separately on birth certificates. Race categories are consistent with the 1977 Office of Management and Budget standards. Persons of Hispanic origin may be of any race. In this table, Hispanic women are classified only by place of origin; non-Hispanic women are classified by race. Forty-four states and the District of Columbia reported multiple-race data on the birth certificate for 2013. The multiple-race data for these states were bridged to the single-race categories of the 1977 standards for comparability with other states; see references 2 and 3.
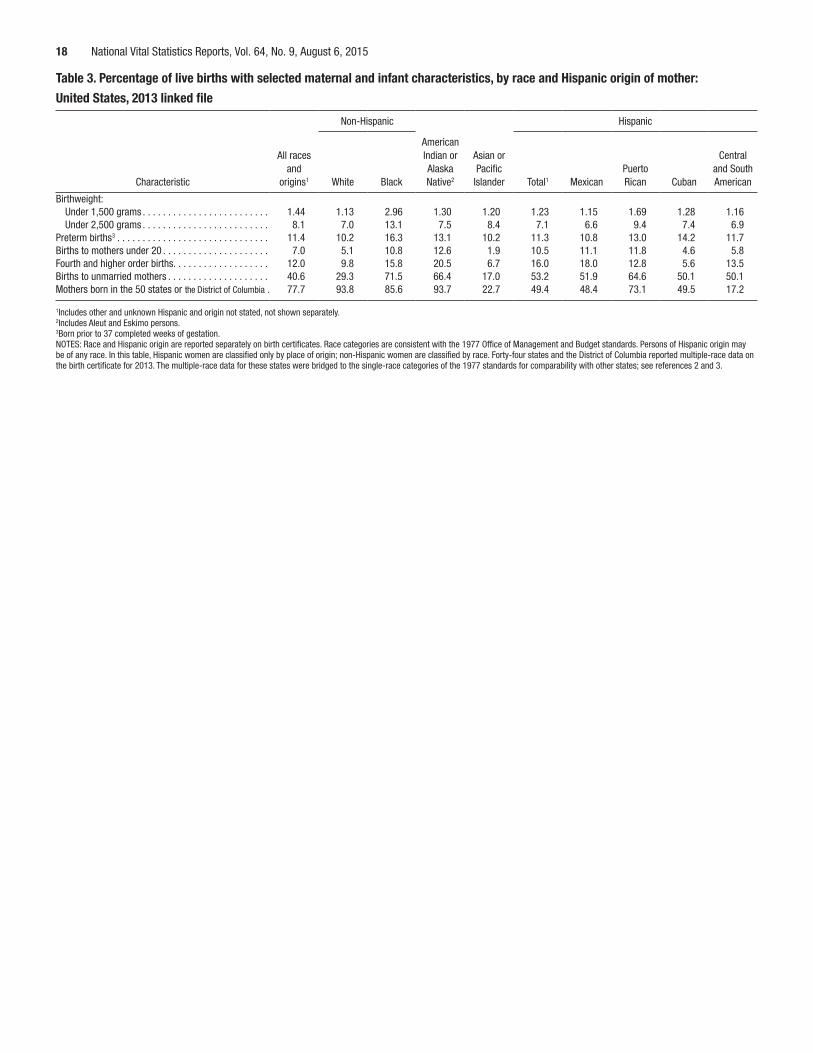
18 National Vital Statistics Reports, Vol. 64, No. 9, August 6, 2015
Table 3. Percentage of live births with selected maternal and infant characteristics, by race and Hispanic origin of mother:
United States, 2013 linked file
Non-Hispanic Hispanic
American All races Indian or Asian or Central
and Alaska Pacific Puerto and South Characteristic origins1 White Black Native2 Islander Total1 Mexican Rican Cuban American
Birthweight: . . . . . . . . . . . . . . . . . . . . . . . . . . . . . . . .Under 1,500 grams . . . . . . . . . . . . . . . . . . . . . . . . . 1.44 1.13 2.96 1.30 1.20 1.23 1.15 1.69 1.28 1.16 Under 2,500 grams . . . . . . . . . . . . . . . . . . . . . . . . . 8.1 7.0 13.1 7.5 8.4 7.1 6.6 9.4 7.4 6.9
Preterm births3 . . . . . . . . . . . . . . . . . . . . . . . . . . . . . . 11.4 10.2 16.3 13.1 10.2 11.3 10.8 13.0 14.2 11.7 Births to mothers under 20 . . . . . . . . . . . . . . . . . . . . . 7.0 5.1 10.8 12.6 1.9 10.5 11.1 11.8 4.6 5.8 Fourth and higher order births. . . . . . . . . . . . . . . . . . . 12.0 9.8 15.8 20.5 6.7 16.0 18.0 12.8 5.6 13.5 Births to unmarried mothers . . . . . . . . . . . . . . . . . . . . 40.6 29.3 71.5 66.4 17.0 53.2 51.9 64.6 50.1 50.1 Mothers born in the 50 states or the District of Columbia . 77.7 93.8 85.6 93.7 22.7 49.4 48.4 73.1 49.5 17.2
1Includes other and unknown Hispanic and origin not stated, not shown separately.2Includes Aleut and Eskimo persons.3Born prior to 37 completed weeks of gestation.NOTES: Race and Hispanic origin are reported separately on birth certificates. Race categories are consistent with the 1977 Office of Management and Budget standards. Persons of Hispanic origin may be of any race. In this table, Hispanic women are classified only by place of origin; non-Hispanic women are classified by race. Forty-four states and the District of Columbia reported multiple-race data on the birth certificate for 2013. The multiple-race data for these states were bridged to the single-race categories of the 1977 standards for comparability with other states; see references 2 and 3.
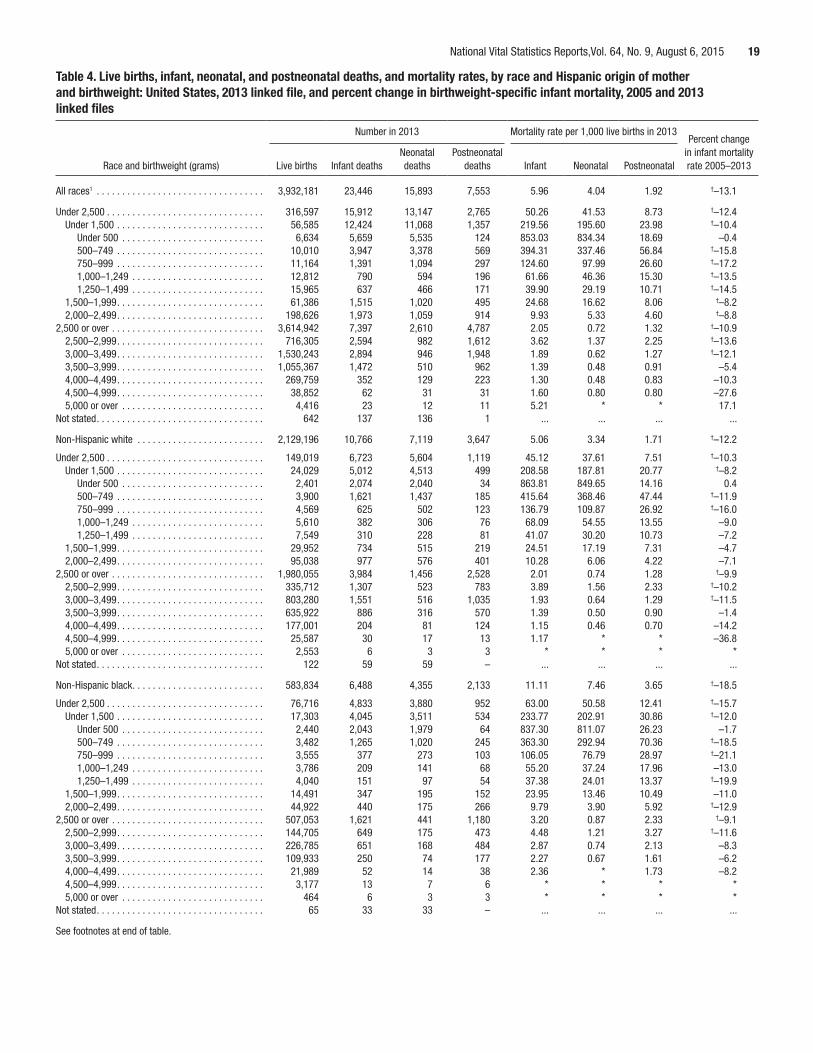
National Vital Statistics Reports,Vol. 64, No. 9, August 6, 2015 19
Table 4. Live births, infant, neonatal, and postneonatal deaths, and mortality rates, by race and Hispanic origin of mother and birthweight: United States, 2013 linked file, and percent change in birthweight-specific infant mortality, 2005 and 2013 linked files
Number in 2013 Mortality rate per 1,000 live births in 2013Percent change
Neonatal Postneonatal in infant mortality Race and birthweight (grams) Live births Infant deaths deaths deaths Infant Neonatal Postneonatal rate 2005–2013
All races1 . . . . . . . . . . . . . . . . . . . . . . . . . . . . . . . . . 3,932,181 23,446 15,893 7,553 5.96 4.04 1.92 †–13.1
Under 2,500 . . . . . . . . . . . . . . . . . . . . . . . . . . . . . . . 316,597 15,912 13,147 2,765 50.26 41.53 8.73 †–12.4Under 1,500 . . . . . . . . . . . . . . . . . . . . . . . . . . . . . 56,585 12,424 11,068 1,357 219.56 195.60 23.98 †–10.4
Under 500 . . . . . . . . . . . . . . . . . . . . . . . . . . . . 6,634 5,659 5,535 124 853.03 834.34 18.69 –0.4500–749 . . . . . . . . . . . . . . . . . . . . . . . . . . . . . 10,010 3,947 3,378 569 394.31 337.46 56.84 †–15.8750–999 . . . . . . . . . . . . . . . . . . . . . . . . . . . . . 11,164 1,391 1,094 297 124.60 97.99 26.60 †–17.21,000–1,249 . . . . . . . . . . . . . . . . . . . . . . . . . . 12,812 790 594 196 61.66 46.36 15.30 †–13.51,250–1,499 . . . . . . . . . . . . . . . . . . . . . . . . . . 15,965 637 466 171 39.90 29.19 10.71 †–14.5
1,500–1,999 . . . . . . . . . . . . . . . . . . . . . . . . . . . . . 61,386 1,515 1,020 495 24.68 16.62 8.06 †–8.22,000–2,499 . . . . . . . . . . . . . . . . . . . . . . . . . . . . . 198,626 1,973 1,059 914 9.93 5.33 4.60 †–8.8
2,500 or over . . . . . . . . . . . . . . . . . . . . . . . . . . . . . . 3,614,942 7,397 2,610 4,787 2.05 0.72 1.32 †–10.92,500–2,999 . . . . . . . . . . . . . . . . . . . . . . . . . . . . . 716,305 2,594 982 1,612 3.62 1.37 2.25 †–13.63,000–3,499 . . . . . . . . . . . . . . . . . . . . . . . . . . . . . 1,530,243 2,894 946 1,948 1.89 0.62 1.27 †–12.13,500–3,999 . . . . . . . . . . . . . . . . . . . . . . . . . . . . . 1,055,367 1,472 510 962 1.39 0.48 0.91 –5.44,000–4,499 . . . . . . . . . . . . . . . . . . . . . . . . . . . . . 269,759 352 129 223 1.30 0.48 0.83 –10.34,500–4,999 . . . . . . . . . . . . . . . . . . . . . . . . . . . . . 38,852 62 31 31 1.60 0.80 0.80 –27.65,000 or over . . . . . . . . . . . . . . . . . . . . . . . . . . . . 4,416 23 12 11 5.21 * * 17.1
Not stated . . . . . . . . . . . . . . . . . . . . . . . . . . . . . . . . . 642 137 136 1 ... ... ... ...
Non-Hispanic white . . . . . . . . . . . . . . . . . . . . . . . . . 2,129,196 10,766 7,119 3,647 5.06 3.34 1.71 †–12.2
Under 2,500 . . . . . . . . . . . . . . . . . . . . . . . . . . . . . . . 149,019 6,723 5,604 1,119 45.12 37.61 7.51 †–10.3Under 1,500 . . . . . . . . . . . . . . . . . . . . . . . . . . . . . 24,029 5,012 4,513 499 208.58 187.81 20.77 †–8.2
Under 500 . . . . . . . . . . . . . . . . . . . . . . . . . . . . 2,401 2,074 2,040 34 863.81 849.65 14.16 0.4500–749 . . . . . . . . . . . . . . . . . . . . . . . . . . . . . 3,900 1,621 1,437 185 415.64 368.46 47.44 †–11.9750–999 . . . . . . . . . . . . . . . . . . . . . . . . . . . . . 4,569 625 502 123 136.79 109.87 26.92 †–16.01,000–1,249 . . . . . . . . . . . . . . . . . . . . . . . . . . 5,610 382 306 76 68.09 54.55 13.55 –9.01,250–1,499 . . . . . . . . . . . . . . . . . . . . . . . . . . 7,549 310 228 81 41.07 30.20 10.73 –7.2
1,500–1,999 . . . . . . . . . . . . . . . . . . . . . . . . . . . . . 29,952 734 515 219 24.51 17.19 7.31 –4.72,000–2,499 . . . . . . . . . . . . . . . . . . . . . . . . . . . . . 95,038 977 576 401 10.28 6.06 4.22 –7.1
2,500 or over . . . . . . . . . . . . . . . . . . . . . . . . . . . . . . 1,980,055 3,984 1,456 2,528 2.01 0.74 1.28 †–9.92,500–2,999 . . . . . . . . . . . . . . . . . . . . . . . . . . . . . 335,712 1,307 523 783 3.89 1.56 2.33 †–10.23,000–3,499 . . . . . . . . . . . . . . . . . . . . . . . . . . . . . 803,280 1,551 516 1,035 1.93 0.64 1.29 †–11.53,500–3,999 . . . . . . . . . . . . . . . . . . . . . . . . . . . . . 635,922 886 316 570 1.39 0.50 0.90 –1.44,000–4,499 . . . . . . . . . . . . . . . . . . . . . . . . . . . . . 177,001 204 81 124 1.15 0.46 0.70 –14.24,500–4,999 . . . . . . . . . . . . . . . . . . . . . . . . . . . . . 25,587 30 17 13 1.17 * * –36.85,000 or over . . . . . . . . . . . . . . . . . . . . . . . . . . . . 2,553 6 3 3 * * * *
Not stated . . . . . . . . . . . . . . . . . . . . . . . . . . . . . . . . . 122 59 59 – ... ... ... ...
Non-Hispanic black . . . . . . . . . . . . . . . . . . . . . . . . . . 583,834 6,488 4,355 2,133 11.11 7.46 3.65 †–18.5
Under 2,500 . . . . . . . . . . . . . . . . . . . . . . . . . . . . . . . 76,716 4,833 3,880 952 63.00 50.58 12.41 †–15.7Under 1,500 . . . . . . . . . . . . . . . . . . . . . . . . . . . . . 17,303 4,045 3,511 534 233.77 202.91 30.86 †–12.0
Under 500 . . . . . . . . . . . . . . . . . . . . . . . . . . . . 2,440 2,043 1,979 64 837.30 811.07 26.23 –1.7500–749 . . . . . . . . . . . . . . . . . . . . . . . . . . . . . 3,482 1,265 1,020 245 363.30 292.94 70.36 †–18.5750–999 . . . . . . . . . . . . . . . . . . . . . . . . . . . . . 3,555 377 273 103 106.05 76.79 28.97 †–21.11,000–1,249 . . . . . . . . . . . . . . . . . . . . . . . . . . 3,786 209 141 68 55.20 37.24 17.96 –13.01,250–1,499 . . . . . . . . . . . . . . . . . . . . . . . . . . 4,040 151 97 54 37.38 24.01 13.37 †–19.9
1,500–1,999 . . . . . . . . . . . . . . . . . . . . . . . . . . . . . 14,491 347 195 152 23.95 13.46 10.49 –11.02,000–2,499 . . . . . . . . . . . . . . . . . . . . . . . . . . . . . 44,922 440 175 266 9.79 3.90 5.92 †–12.9
2,500 or over . . . . . . . . . . . . . . . . . . . . . . . . . . . . . . 507,053 1,621 441 1,180 3.20 0.87 2.33 †–9.12,500–2,999 . . . . . . . . . . . . . . . . . . . . . . . . . . . . . 144,705 649 175 473 4.48 1.21 3.27 †–11.63,000–3,499 . . . . . . . . . . . . . . . . . . . . . . . . . . . . . 226,785 651 168 484 2.87 0.74 2.13 –8.33,500–3,999 . . . . . . . . . . . . . . . . . . . . . . . . . . . . . 109,933 250 74 177 2.27 0.67 1.61 –6.24,000–4,499 . . . . . . . . . . . . . . . . . . . . . . . . . . . . . 21,989 52 14 38 2.36 * 1.73 –8.24,500–4,999 . . . . . . . . . . . . . . . . . . . . . . . . . . . . . 3,177 13 7 6 * * * *5,000 or over . . . . . . . . . . . . . . . . . . . . . . . . . . . . 464 6 3 3 * * * *
Not stated . . . . . . . . . . . . . . . . . . . . . . . . . . . . . . . . . 65 33 33 – ... ... ... ...
See footnotes at end of table.
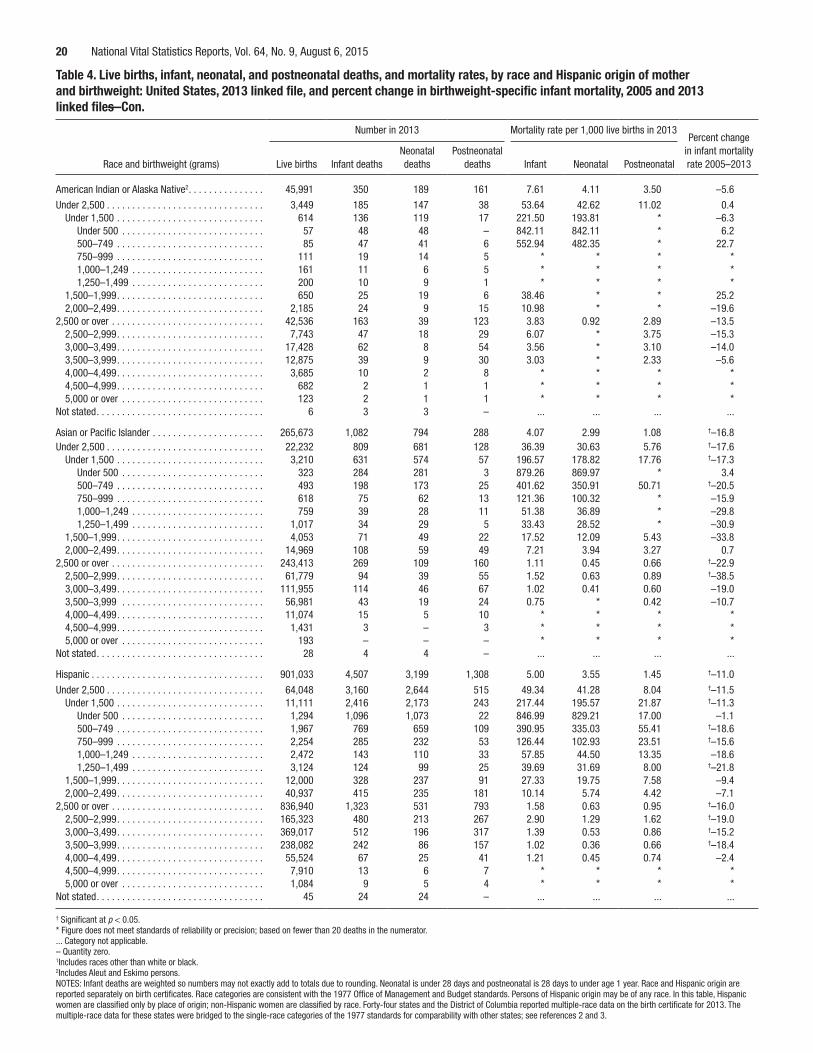
20 National Vital Statistics Reports, Vol. 64, No. 9, August 6, 2015
Table 4. Live births, infant, neonatal, and postneonatal deaths, and mortality rates, by race and Hispanic origin of mother and birthweight: United States, 2013 linked file, and percent change in birthweight-specific infant mortality, 2005 and 2013 linked files—Con.
Number in 2013 Mortality rate per 1,000 live births in 2013Percent change
Neonatal Postneonatal in infant mortality Race and birthweight (grams) Live births Infant deaths deaths deaths Infant Neonatal Postneonatal rate 2005–2013
American Indian or Alaska Native2 . . . . . . . . . . . . . . . 45,991 350 189 161 7.61 4.11 3.50 –5.6
Under 2,500 . . . . . . . . . . . . . . . . . . . . . . . . . . . . . . . 3,449 185 147 38 53.64 42.62 11.02 0.4Under 1,500 . . . . . . . . . . . . . . . . . . . . . . . . . . . . . 614 136 119 17 221.50 193.81 * –6.3
Under 500 . . . . . . . . . . . . . . . . . . . . . . . . . . . . 57 48 48 – 842.11 842.11 * 6.2500–749 . . . . . . . . . . . . . . . . . . . . . . . . . . . . . 85 47 41 6 552.94 482.35 * 22.7750–999 . . . . . . . . . . . . . . . . . . . . . . . . . . . . . 111 19 14 5 * * * *1,000–1,249 . . . . . . . . . . . . . . . . . . . . . . . . . . 161 11 6 5 * * * *1,250–1,499 . . . . . . . . . . . . . . . . . . . . . . . . . . 200 10 9 1 * * * *
1,500–1,999 . . . . . . . . . . . . . . . . . . . . . . . . . . . . . 650 25 19 6 38.46 * * 25.22,000–2,499 . . . . . . . . . . . . . . . . . . . . . . . . . . . . . 2,185 24 9 15 10.98 * * –19.6
2,500 or over . . . . . . . . . . . . . . . . . . . . . . . . . . . . . . 42,536 163 39 123 3.83 0.92 2.89 –13.52,500–2,999 . . . . . . . . . . . . . . . . . . . . . . . . . . . . . 7,743 47 18 29 6.07 * 3.75 –15.33,000–3,499 . . . . . . . . . . . . . . . . . . . . . . . . . . . . . 17,428 62 8 54 3.56 * 3.10 –14.03,500–3,999 . . . . . . . . . . . . . . . . . . . . . . . . . . . . . 12,875 39 9 30 3.03 * 2.33 –5.64,000–4,499 . . . . . . . . . . . . . . . . . . . . . . . . . . . . . 3,685 10 2 8 * * * *4,500–4,999 . . . . . . . . . . . . . . . . . . . . . . . . . . . . . 682 2 1 1 * * * *5,000 or over . . . . . . . . . . . . . . . . . . . . . . . . . . . . 123 2 1 1 * * * *
Not stated . . . . . . . . . . . . . . . . . . . . . . . . . . . . . . . . . 6 3 3 – ... ... ... ...
Asian or Pacific Islander . . . . . . . . . . . . . . . . . . . . . . 265,673 1,082 794 288 4.07 2.99 1.08 †–16.8Under 2,500 . . . . . . . . . . . . . . . . . . . . . . . . . . . . . . . 22,232 809 681 128 36.39 30.63 5.76 †–17.6
Under 1,500 . . . . . . . . . . . . . . . . . . . . . . . . . . . . . 3,210 631 574 57 196.57 178.82 17.76 †–17.3Under 500 . . . . . . . . . . . . . . . . . . . . . . . . . . . . 323 284 281 3 879.26 869.97 * 3.4500–749 . . . . . . . . . . . . . . . . . . . . . . . . . . . . . 493 198 173 25 401.62 350.91 50.71 †–20.5750–999 . . . . . . . . . . . . . . . . . . . . . . . . . . . . . 618 75 62 13 121.36 100.32 * –15.91,000–1,249 . . . . . . . . . . . . . . . . . . . . . . . . . . 759 39 28 11 51.38 36.89 * –29.81,250–1,499 . . . . . . . . . . . . . . . . . . . . . . . . . . 1,017 34 29 5 33.43 28.52 * –30.9
1,500–1,999 . . . . . . . . . . . . . . . . . . . . . . . . . . . . . 4,053 71 49 22 17.52 12.09 5.43 –33.82,000–2,499 . . . . . . . . . . . . . . . . . . . . . . . . . . . . . 14,969 108 59 49 7.21 3.94 3.27 0.7
2,500 or over . . . . . . . . . . . . . . . . . . . . . . . . . . . . . . 243,413 269 109 160 1.11 0.45 0.66 †–22.92,500–2,999 . . . . . . . . . . . . . . . . . . . . . . . . . . . . . 61,779 94 39 55 1.52 0.63 0.89 †–38.53,000–3,499 . . . . . . . . . . . . . . . . . . . . . . . . . . . . . 111,955 114 46 67 1.02 0.41 0.60 –19.03,500–3,999 . . . . . . . . . . . . . . . . . . . . . . . . . . . . 56,981 43 19 24 0.75 * 0.42 –10.74,000–4,499 . . . . . . . . . . . . . . . . . . . . . . . . . . . . . 11,074 15 5 10 * * * *4,500–4,999 . . . . . . . . . . . . . . . . . . . . . . . . . . . . . 1,431 3 – 3 * * * *5,000 or over . . . . . . . . . . . . . . . . . . . . . . . . . . . . 193 – – – * * * *
Not stated . . . . . . . . . . . . . . . . . . . . . . . . . . . . . . . . . 28 4 4 – ... ... ... ...
Hispanic . . . . . . . . . . . . . . . . . . . . . . . . . . . . . . . . . . 901,033 4,507 3,199 1,308 5.00 3.55 1.45 †–11.0
Under 2,500 . . . . . . . . . . . . . . . . . . . . . . . . . . . . . . . 64,048 3,160 2,644 515 49.34 41.28 8.04 †–11.5Under 1,500 . . . . . . . . . . . . . . . . . . . . . . . . . . . . . 11,111 2,416 2,173 243 217.44 195.57 21.87 †–11.3
Under 500 . . . . . . . . . . . . . . . . . . . . . . . . . . . . 1,294 1,096 1,073 22 846.99 829.21 17.00 –1.1500–749 . . . . . . . . . . . . . . . . . . . . . . . . . . . . . 1,967 769 659 109 390.95 335.03 55.41 †–18.6750–999 . . . . . . . . . . . . . . . . . . . . . . . . . . . . . 2,254 285 232 53 126.44 102.93 23.51 †–15.61,000–1,249 . . . . . . . . . . . . . . . . . . . . . . . . . . 2,472 143 110 33 57.85 44.50 13.35 –18.61,250–1,499 . . . . . . . . . . . . . . . . . . . . . . . . . . 3,124 124 99 25 39.69 31.69 8.00 †–21.8
1,500–1,999 . . . . . . . . . . . . . . . . . . . . . . . . . . . . . 12,000 328 237 91 27.33 19.75 7.58 –9.42,000–2,499 . . . . . . . . . . . . . . . . . . . . . . . . . . . . . 40,937 415 235 181 10.14 5.74 4.42 –7.1
2,500 or over . . . . . . . . . . . . . . . . . . . . . . . . . . . . . . 836,940 1,323 531 793 1.58 0.63 0.95 †–16.02,500–2,999 . . . . . . . . . . . . . . . . . . . . . . . . . . . . . 165,323 480 213 267 2.90 1.29 1.62 †–19.03,000–3,499 . . . . . . . . . . . . . . . . . . . . . . . . . . . . . 369,017 512 196 317 1.39 0.53 0.86 †–15.23,500–3,999 . . . . . . . . . . . . . . . . . . . . . . . . . . . . . 238,082 242 86 157 1.02 0.36 0.66 †–18.44,000–4,499 . . . . . . . . . . . . . . . . . . . . . . . . . . . . . 55,524 67 25 41 1.21 0.45 0.74 –2.44,500–4,999 . . . . . . . . . . . . . . . . . . . . . . . . . . . . . 7,910 13 6 7 * * * *5,000 or over . . . . . . . . . . . . . . . . . . . . . . . . . . . . 1,084 9 5 4 * * * *
Not stated . . . . . . . . . . . . . . . . . . . . . . . . . . . . . . . . . 45 24 24 – ... ... ... ...
† Significant at p < 0.05.* Figure does not meet standards of reliability or precision; based on fewer than 20 deaths in the numerator.... Category not applicable.– Quantity zero.1Includes races other than white or black.2Includes Aleut and Eskimo persons.NOTES: Infant deaths are weighted so numbers may not exactly add to totals due to rounding. Neonatal is under 28 days and postneonatal is 28 days to under age 1 year. Race and Hispanic origin are reported separately on birth certificates. Race categories are consistent with the 1977 Office of Management and Budget standards. Persons of Hispanic origin may be of any race. In this table, Hispanic women are classified only by place of origin; non-Hispanic women are classified by race. Forty-four states and the District of Columbia reported multiple-race data on the birth certificate for 2013. The multiple-race data for these states were bridged to the single-race categories of the 1977 standards for comparability with other states; see references 2 and 3.
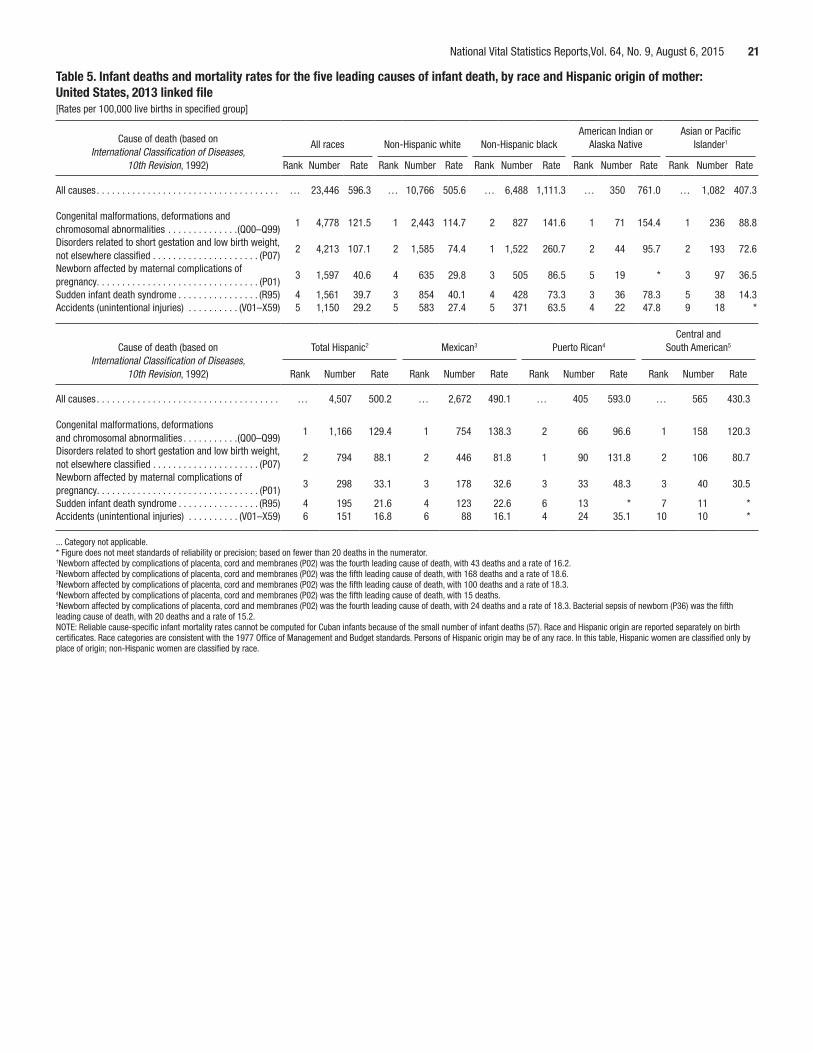
National Vital Statistics Reports,Vol. 64, No. 9, August 6, 2015 21
Table 5. Infant deaths and mortality rates for the five leading causes of infant death, by race and Hispanic origin of mother: United States, 2013 linked file[Rates per 100,000 live births in specified group]
American Indian or Asian or Pacific Cause of death (based on All races Non-Hispanic white Non-Hispanic black Alaska Native Islander1
International Classification of Diseases, 10th Revision, 1992) Rank Number Rate Rank Number Rate Rank Number Rate Rank Number Rate Rank Number Rate
All causes . . . . . . . . . . . . . . . . . . . . . . . . . . . . . . . . . . . . … 23,446 596.3 … 10,766 505.6 … 6,488 1,111.3 … 350 761.0 … 1,082 407.3
Congenital malformations, deformations and 1 4,778 121.5 1 2,443 114.7 2 827 141.6 1 71 154.4 1 236 88.8
chromosomal abnormalities . . . . . . . . . . . . . .(Q00–Q99)Disorders related to short gestation and low birth weight,
2 4,213 107.1 2 1,585 74.4 1 1,522 260.7 2 44 95.7 2 193 72.6not elsewhere classified . . . . . . . . . . . . . . . . . . . . . (P07)Newborn affected by maternal complications of
3 1,597 40.6 4 635 29.8 3 505 86.5 5 19 * 3 97 36.5pregnancy. . . . . . . . . . . . . . . . . . . . . . . . . . . . . . . . (P01)Sudden infant death syndrome . . . . . . . . . . . . . . . . (R95) 4 1,561 39.7 3 854 40.1 4 428 73.3 3 36 78.3 5 38 14.3Accidents (unintentional injuries) . . . . . . . . . . (V01–X59) 5 1,150 29.2 5 583 27.4 5 371 63.5 4 22 47.8 9 18 *
Central and Cause of death (based on Total Hispanic2 Mexican3 Puerto Rican4 South American5
International Classification of Diseases, 10th Revision, 1992) Rank Number Rate Rank Number Rate Rank Number Rate Rank Number Rate
All causes . . . . . . . . . . . . . . . . . . . . . . . . . . . . . . . . . . . . … 4,507 500.2 … 2,672 490.1 … 405 593.0 … 565 430.3
Congenital malformations, deformations1 1,166 129.4 1 754 138.3 2 66 96.6 1 158 120.3
and chromosomal abnormalities . . . . . . . . . . .(Q00–Q99)Disorders related to short gestation and low birth weight,
2 794 88.1 2 446 81.8 1 90 131.8 2 106 80.7not elsewhere classified . . . . . . . . . . . . . . . . . . . . . (P07)Newborn affected by maternal complications of
3 298 33.1 3 178 32.6 3 33 48.3 3 40 30.5pregnancy. . . . . . . . . . . . . . . . . . . . . . . . . . . . . . . . (P01)Sudden infant death syndrome . . . . . . . . . . . . . . . . (R95) 4 195 21.6 4 123 22.6 6 13 * 7 11 *Accidents (unintentional injuries) . . . . . . . . . . (V01–X59) 6 151 16.8 6 88 16.1 4 24 35.1 10 10 *
... Category not applicable.* Figure does not meet standards of reliability or precision; based on fewer than 20 deaths in the numerator.1Newborn affected by complications of placenta, cord and membranes (P02) was the fourth leading cause of death, with 43 deaths and a rate of 16.2.2Newborn affected by complications of placenta, cord and membranes (P02) was the fifth leading cause of death, with 168 deaths and a rate of 18.6.3Newborn affected by complications of placenta, cord and membranes (P02) was the fifth leading cause of death, with 100 deaths and a rate of 18.3.4Newborn affected by complications of placenta, cord and membranes (P02) was the fifth leading cause of death, with 15 deaths. 5Newborn affected by complications of placenta, cord and membranes (P02) was the fourth leading cause of death, with 24 deaths and a rate of 18.3. Bacterial sepsis of newborn (P36) was the fifth leading cause of death, with 20 deaths and a rate of 15.2.NOTE: Reliable cause-specific infant mortality rates cannot be computed for Cuban infants because of the small number of infant deaths (57). Race and Hispanic origin are reported separately on birth certificates. Race categories are consistent with the 1977 Office of Management and Budget standards. Persons of Hispanic origin may be of any race. In this table, Hispanic women are classified only by place of origin; non-Hispanic women are classified by race.
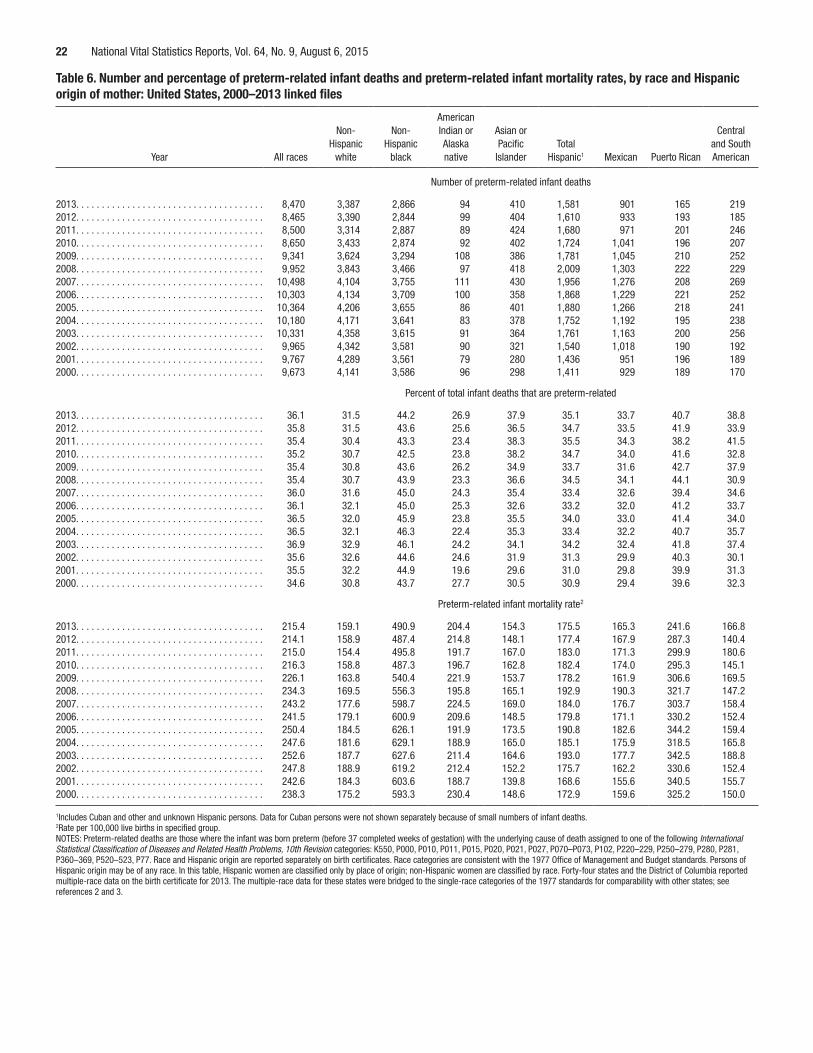
22 National Vital Statistics Reports, Vol. 64, No. 9, August 6, 2015
Table 6. Number and percentage of preterm-related infant deaths and preterm-related infant mortality rates, by race and Hispanic origin of mother: United States, 2000–2013 linked files
American Non- Non- Indian or Asian or Central
Hispanic Hispanic Alaska Pacific Total and South Year All races white black native Islander Hispanic1 Mexican Puerto Rican American
Number of preterm-related infant deaths
2013. . . . . . . . . . . . . . . . . . . . . . . . . . . . . . . . . . . . . 8,470 3,387 2,866 94 410 1,581 901 165 2192012. . . . . . . . . . . . . . . . . . . . . . . . . . . . . . . . . . . . . 8,465 3,390 2,844 99 404 1,610 933 193 1852011. . . . . . . . . . . . . . . . . . . . . . . . . . . . . . . . . . . . . 8,500 3,314 2,887 89 424 1,680 971 201 2462010. . . . . . . . . . . . . . . . . . . . . . . . . . . . . . . . . . . . . 8,650 3,433 2,874 92 402 1,724 1,041 196 2072009. . . . . . . . . . . . . . . . . . . . . . . . . . . . . . . . . . . . . 9,341 3,624 3,294 108 386 1,781 1,045 210 2522008. . . . . . . . . . . . . . . . . . . . . . . . . . . . . . . . . . . . . 9,952 3,843 3,466 97 418 2,009 1,303 222 2292007. . . . . . . . . . . . . . . . . . . . . . . . . . . . . . . . . . . . . 10,498 4,104 3,755 111 430 1,956 1,276 208 2692006. . . . . . . . . . . . . . . . . . . . . . . . . . . . . . . . . . . . . 10,303 4,134 3,709 100 358 1,868 1,229 221 2522005. . . . . . . . . . . . . . . . . . . . . . . . . . . . . . . . . . . . . 10,364 4,206 3,655 86 401 1,880 1,266 218 2412004. . . . . . . . . . . . . . . . . . . . . . . . . . . . . . . . . . . . . 10,180 4,171 3,641 83 378 1,752 1,192 195 2382003. . . . . . . . . . . . . . . . . . . . . . . . . . . . . . . . . . . . . 10,331 4,358 3,615 91 364 1,761 1,163 200 2562002. . . . . . . . . . . . . . . . . . . . . . . . . . . . . . . . . . . . . 9,965 4,342 3,581 90 321 1,540 1,018 190 1922001. . . . . . . . . . . . . . . . . . . . . . . . . . . . . . . . . . . . . 9,767 4,289 3,561 79 280 1,436 951 196 1892000. . . . . . . . . . . . . . . . . . . . . . . . . . . . . . . . . . . . . 9,673 4,141 3,586 96 298 1,411 929 189 170
Percent of total infant deaths that are preterm-related
2013. . . . . . . . . . . . . . . . . . . . . . . . . . . . . . . . . . . . . 36.1 31.5 44.2 26.9 37.9 35.1 33.7 40.7 38.82012. . . . . . . . . . . . . . . . . . . . . . . . . . . . . . . . . . . . . 35.8 31.5 43.6 25.6 36.5 34.7 33.5 41.9 33.92011. . . . . . . . . . . . . . . . . . . . . . . . . . . . . . . . . . . . . 35.4 30.4 43.3 23.4 38.3 35.5 34.3 38.2 41.52010. . . . . . . . . . . . . . . . . . . . . . . . . . . . . . . . . . . . . 35.2 30.7 42.5 23.8 38.2 34.7 34.0 41.6 32.82009. . . . . . . . . . . . . . . . . . . . . . . . . . . . . . . . . . . . . 35.4 30.8 43.6 26.2 34.9 33.7 31.6 42.7 37.92008. . . . . . . . . . . . . . . . . . . . . . . . . . . . . . . . . . . . . 35.4 30.7 43.9 23.3 36.6 34.5 34.1 44.1 30.92007. . . . . . . . . . . . . . . . . . . . . . . . . . . . . . . . . . . . . 36.0 31.6 45.0 24.3 35.4 33.4 32.6 39.4 34.62006. . . . . . . . . . . . . . . . . . . . . . . . . . . . . . . . . . . . . 36.1 32.1 45.0 25.3 32.6 33.2 32.0 41.2 33.72005. . . . . . . . . . . . . . . . . . . . . . . . . . . . . . . . . . . . . 36.5 32.0 45.9 23.8 35.5 34.0 33.0 41.4 34.02004. . . . . . . . . . . . . . . . . . . . . . . . . . . . . . . . . . . . . 36.5 32.1 46.3 22.4 35.3 33.4 32.2 40.7 35.72003. . . . . . . . . . . . . . . . . . . . . . . . . . . . . . . . . . . . . 36.9 32.9 46.1 24.2 34.1 34.2 32.4 41.8 37.42002. . . . . . . . . . . . . . . . . . . . . . . . . . . . . . . . . . . . . 35.6 32.6 44.6 24.6 31.9 31.3 29.9 40.3 30.12001. . . . . . . . . . . . . . . . . . . . . . . . . . . . . . . . . . . . . 35.5 32.2 44.9 19.6 29.6 31.0 29.8 39.9 31.32000. . . . . . . . . . . . . . . . . . . . . . . . . . . . . . . . . . . . . 34.6 30.8 43.7 27.7 30.5 30.9 29.4 39.6 32.3
Preterm-related infant mortality rate2
2013. . . . . . . . . . . . . . . . . . . . . . . . . . . . . . . . . . . . . 215.4 159.1 490.9 204.4 154.3 175.5 165.3 241.6 166.82012. . . . . . . . . . . . . . . . . . . . . . . . . . . . . . . . . . . . . 214.1 158.9 487.4 214.8 148.1 177.4 167.9 287.3 140.42011. . . . . . . . . . . . . . . . . . . . . . . . . . . . . . . . . . . . . 215.0 154.4 495.8 191.7 167.0 183.0 171.3 299.9 180.62010. . . . . . . . . . . . . . . . . . . . . . . . . . . . . . . . . . . . . 216.3 158.8 487.3 196.7 162.8 182.4 174.0 295.3 145.12009. . . . . . . . . . . . . . . . . . . . . . . . . . . . . . . . . . . . . 226.1 163.8 540.4 221.9 153.7 178.2 161.9 306.6 169.52008. . . . . . . . . . . . . . . . . . . . . . . . . . . . . . . . . . . . . 234.3 169.5 556.3 195.8 165.1 192.9 190.3 321.7 147.22007. . . . . . . . . . . . . . . . . . . . . . . . . . . . . . . . . . . . . 243.2 177.6 598.7 224.5 169.0 184.0 176.7 303.7 158.42006. . . . . . . . . . . . . . . . . . . . . . . . . . . . . . . . . . . . . 241.5 179.1 600.9 209.6 148.5 179.8 171.1 330.2 152.42005. . . . . . . . . . . . . . . . . . . . . . . . . . . . . . . . . . . . . 250.4 184.5 626.1 191.9 173.5 190.8 182.6 344.2 159.42004. . . . . . . . . . . . . . . . . . . . . . . . . . . . . . . . . . . . . 247.6 181.6 629.1 188.9 165.0 185.1 175.9 318.5 165.82003. . . . . . . . . . . . . . . . . . . . . . . . . . . . . . . . . . . . . 252.6 187.7 627.6 211.4 164.6 193.0 177.7 342.5 188.82002. . . . . . . . . . . . . . . . . . . . . . . . . . . . . . . . . . . . . 247.8 188.9 619.2 212.4 152.2 175.7 162.2 330.6 152.42001. . . . . . . . . . . . . . . . . . . . . . . . . . . . . . . . . . . . . 242.6 184.3 603.6 188.7 139.8 168.6 155.6 340.5 155.72000. . . . . . . . . . . . . . . . . . . . . . . . . . . . . . . . . . . . . 238.3 175.2 593.3 230.4 148.6 172.9 159.6 325.2 150.0
1Includes Cuban and other and unknown Hispanic persons. Data for Cuban persons were not shown separately because of small numbers of infant deaths.2Rate per 100,000 live births in specified group.NOTES: Preterm-related deaths are those where the infant was born preterm (before 37 completed weeks of gestation) with the underlying cause of death assigned to one of the following International Statistical Classification of Diseases and Related Health Problems, 10th Revision categories: K550, P000, P010, P011, P015, P020, P021, P027, P070–P073, P102, P220–229, P250–279, P280, P281, P360–369, P520–523, P77. Race and Hispanic origin are reported separately on birth certificates. Race categories are consistent with the 1977 Office of Management and Budget standards. Persons of Hispanic origin may be of any race. In this table, Hispanic women are classified only by place of origin; non-Hispanic women are classified by race. Forty-four states and the District of Columbia reported multiple-race data on the birth certificate for 2013. The multiple-race data for these states were bridged to the single-race categories of the 1977 standards for comparability with other states; see references 2 and 3.
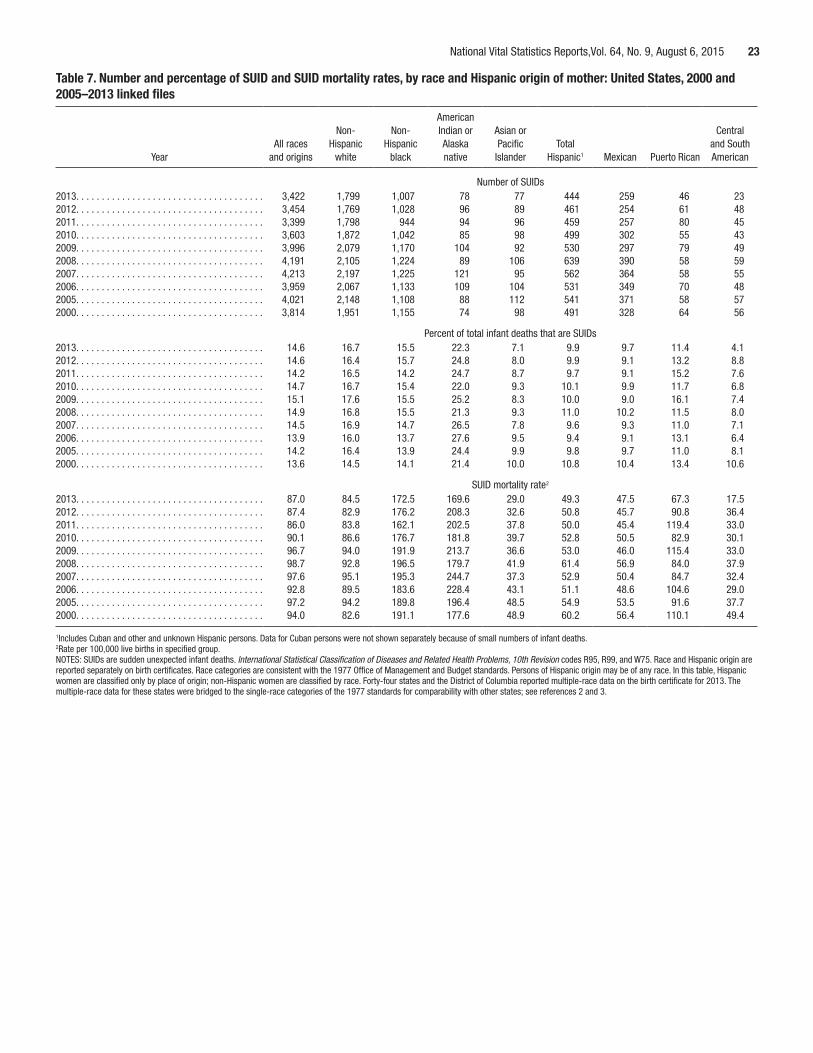
National Vital Statistics Reports,Vol. 64, No. 9, August 6, 2015 23
Table 7. Number and percentage of SUID and SUID mortality rates, by race and Hispanic origin of mother: United States, 2000 and 2005–2013 linked files
American Non- Non- Indian or Asian or Central
All races Hispanic Hispanic Alaska Pacific Total and South Year and origins white black native Islander Hispanic1 Mexican Puerto Rican American
Number of SUIDs2013. . . . . . . . . . . . . . . . . . . . . . . . . . . . . . . . . . . . . 3,422 1,799 1,007 78 77 444 259 46 232012. . . . . . . . . . . . . . . . . . . . . . . . . . . . . . . . . . . . . 3,454 1,769 1,028 96 89 461 254 61 482011. . . . . . . . . . . . . . . . . . . . . . . . . . . . . . . . . . . . . 3,399 1,798 944 94 96 459 257 80 452010. . . . . . . . . . . . . . . . . . . . . . . . . . . . . . . . . . . . . 3,603 1,872 1,042 85 98 499 302 55 432009. . . . . . . . . . . . . . . . . . . . . . . . . . . . . . . . . . . . . 3,996 2,079 1,170 104 92 530 297 79 492008. . . . . . . . . . . . . . . . . . . . . . . . . . . . . . . . . . . . . 4,191 2,105 1,224 89 106 639 390 58 592007. . . . . . . . . . . . . . . . . . . . . . . . . . . . . . . . . . . . . 4,213 2,197 1,225 121 95 562 364 58 552006. . . . . . . . . . . . . . . . . . . . . . . . . . . . . . . . . . . . . 3,959 2,067 1,133 109 104 531 349 70 482005. . . . . . . . . . . . . . . . . . . . . . . . . . . . . . . . . . . . . 4,021 2,148 1,108 88 112 541 371 58 572000. . . . . . . . . . . . . . . . . . . . . . . . . . . . . . . . . . . . . 3,814 1,951 1,155 74 98 491 328 64 56
Percent of total infant deaths that are SUIDs2013. . . . . . . . . . . . . . . . . . . . . . . . . . . . . . . . . . . . . 14.6 16.7 15.5 22.3 7.1 9.9 9.7 11.4 4.12012. . . . . . . . . . . . . . . . . . . . . . . . . . . . . . . . . . . . . 14.6 16.4 15.7 24.8 8.0 9.9 9.1 13.2 8.82011. . . . . . . . . . . . . . . . . . . . . . . . . . . . . . . . . . . . . 14.2 16.5 14.2 24.7 8.7 9.7 9.1 15.2 7.62010. . . . . . . . . . . . . . . . . . . . . . . . . . . . . . . . . . . . . 14.7 16.7 15.4 22.0 9.3 10.1 9.9 11.7 6.82009. . . . . . . . . . . . . . . . . . . . . . . . . . . . . . . . . . . . . 15.1 17.6 15.5 25.2 8.3 10.0 9.0 16.1 7.42008. . . . . . . . . . . . . . . . . . . . . . . . . . . . . . . . . . . . . 14.9 16.8 15.5 21.3 9.3 11.0 10.2 11.5 8.02007. . . . . . . . . . . . . . . . . . . . . . . . . . . . . . . . . . . . . 14.5 16.9 14.7 26.5 7.8 9.6 9.3 11.0 7.12006. . . . . . . . . . . . . . . . . . . . . . . . . . . . . . . . . . . . . 13.9 16.0 13.7 27.6 9.5 9.4 9.1 13.1 6.42005. . . . . . . . . . . . . . . . . . . . . . . . . . . . . . . . . . . . . 14.2 16.4 13.9 24.4 9.9 9.8 9.7 11.0 8.12000. . . . . . . . . . . . . . . . . . . . . . . . . . . . . . . . . . . . . 13.6 14.5 14.1 21.4 10.0 10.8 10.4 13.4 10.6
SUID mortality rate2
2013. . . . . . . . . . . . . . . . . . . . . . . . . . . . . . . . . . . . . 87.0 84.5 172.5 169.6 29.0 49.3 47.5 67.3 17.52012. . . . . . . . . . . . . . . . . . . . . . . . . . . . . . . . . . . . . 87.4 82.9 176.2 208.3 32.6 50.8 45.7 90.8 36.42011. . . . . . . . . . . . . . . . . . . . . . . . . . . . . . . . . . . . . 86.0 83.8 162.1 202.5 37.8 50.0 45.4 119.4 33.02010. . . . . . . . . . . . . . . . . . . . . . . . . . . . . . . . . . . . . 90.1 86.6 176.7 181.8 39.7 52.8 50.5 82.9 30.12009. . . . . . . . . . . . . . . . . . . . . . . . . . . . . . . . . . . . . 96.7 94.0 191.9 213.7 36.6 53.0 46.0 115.4 33.02008. . . . . . . . . . . . . . . . . . . . . . . . . . . . . . . . . . . . . 98.7 92.8 196.5 179.7 41.9 61.4 56.9 84.0 37.92007. . . . . . . . . . . . . . . . . . . . . . . . . . . . . . . . . . . . . 97.6 95.1 195.3 244.7 37.3 52.9 50.4 84.7 32.42006. . . . . . . . . . . . . . . . . . . . . . . . . . . . . . . . . . . . . 92.8 89.5 183.6 228.4 43.1 51.1 48.6 104.6 29.02005. . . . . . . . . . . . . . . . . . . . . . . . . . . . . . . . . . . . . 97.2 94.2 189.8 196.4 48.5 54.9 53.5 91.6 37.72000. . . . . . . . . . . . . . . . . . . . . . . . . . . . . . . . . . . . . 94.0 82.6 191.1 177.6 48.9 60.2 56.4 110.1 49.4
1Includes Cuban and other and unknown Hispanic persons. Data for Cuban persons were not shown separately because of small numbers of infant deaths.2Rate per 100,000 live births in specified group.NOTES: SUIDs are sudden unexpected infant deaths. International Statistical Classification of Diseases and Related Health Problems, 10th Revision codes R95, R99, and W75. Race and Hispanic origin are reported separately on birth certificates. Race categories are consistent with the 1977 Office of Management and Budget standards. Persons of Hispanic origin may be of any race. In this table, Hispanic women are classified only by place of origin; non-Hispanic women are classified by race. Forty-four states and the District of Columbia reported multiple-race data on the birth certificate for 2013. The multiple-race data for these states were bridged to the single-race categories of the 1977 standards for comparability with other states; see references 2 and 3.
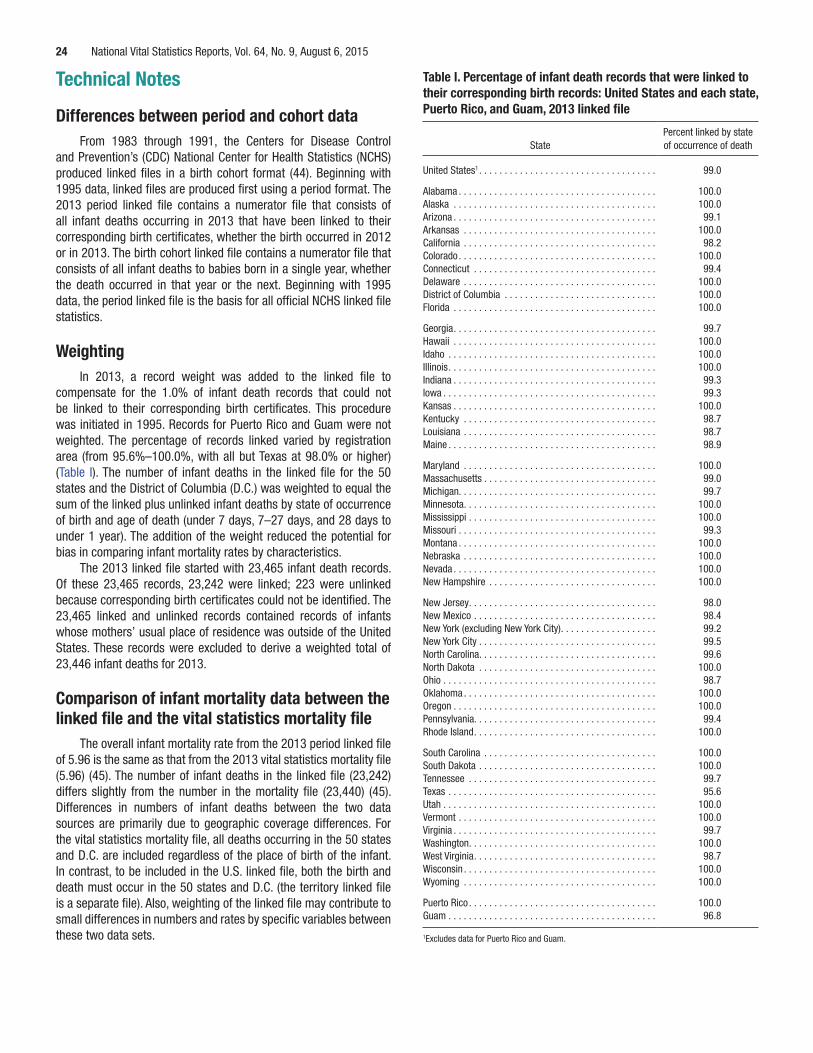
24 National Vital Statistics Reports, Vol. 64, No. 9, August 6, 2015
Technical Notes Table I. Percentage of infant death records that were linked to their corresponding birth records: United States and each state,
Differences between period and cohort data Puerto Rico, and Guam, 2013 linked file
Percent linked by state From 1983 through 1991, the Centers for Disease Control State of occurrence of death
and Prevention’s (CDC) National Center for Health Statistics (NCHS) produced linked files in a birth cohort format (44). Beginning with United States1 . . . . . . . . . . . . . . . . . . . . . . . . . . . . . . . . . . . 99.0
1995 data, linked files are produced first using a period format. The Alabama . . . . . . . . . . . . . . . . . . . . . . . . . . . . . . . . . . . . . . . 100.02013 period linked file contains a numerator file that consists of Alaska . . . . . . . . . . . . . . . . . . . . . . . . . . . . . . . . . . . . . . . . 100.0
all infant deaths occurring in 2013 that have been linked to their Arizona . . . . . . . . . . . . . . . . . . . . . . . . . . . . . . . . . . . . . . . . 99.1Arkansas . . . . . . . . . . . . . . . . . . . . . . . . . . . . . . . . . . . . . . 100.0
corresponding birth certificates, whether the birth occurred in 2012 California . . . . . . . . . . . . . . . . . . . . . . . . . . . . . . . . . . . . . . 98.2or in 2013. The birth cohort linked file contains a numerator file that Colorado . . . . . . . . . . . . . . . . . . . . . . . . . . . . . . . . . . . . . . . 100.0consists of all infant deaths to babies born in a single year, whether Connecticut . . . . . . . . . . . . . . . . . . . . . . . . . . . . . . . . . . . . 99.4
the death occurred in that year or the next. Beginning with 1995 Delaware . . . . . . . . . . . . . . . . . . . . . . . . . . . . . . . . . . . . . . 100.0District of Columbia . . . . . . . . . . . . . . . . . . . . . . . . . . . . . . 100.0data, the period linked file is the basis for all official NCHS linked file Florida . . . . . . . . . . . . . . . . . . . . . . . . . . . . . . . . . . . . . . . . 100.0
statistics.Georgia . . . . . . . . . . . . . . . . . . . . . . . . . . . . . . . . . . . . . . . . 99.7Hawaii . . . . . . . . . . . . . . . . . . . . . . . . . . . . . . . . . . . . . . . . 100.0
Weighting Idaho . . . . . . . . . . . . . . . . . . . . . . . . . . . . . . . . . . . . . . . . . 100.0Illinois . . . . . . . . . . . . . . . . . . . . . . . . . . . . . . . . . . . . . . . . . 100.0
In 2013, a record weight was added to the linked file to Indiana . . . . . . . . . . . . . . . . . . . . . . . . . . . . . . . . . . . . . . . . 99.3compensate for the 1.0% of infant death records that could not Iowa . . . . . . . . . . . . . . . . . . . . . . . . . . . . . . . . . . . . . . . . . . 99.3
be linked to their corresponding birth certificates. This procedure Kansas . . . . . . . . . . . . . . . . . . . . . . . . . . . . . . . . . . . . . . . . 100.0Kentucky . . . . . . . . . . . . . . . . . . . . . . . . . . . . . . . . . . . . . . 98.7was initiated in 1995. Records for Puerto Rico and Guam were not Louisiana . . . . . . . . . . . . . . . . . . . . . . . . . . . . . . . . . . . . . . 98.7
weighted. The percentage of records linked varied by registration Maine . . . . . . . . . . . . . . . . . . . . . . . . . . . . . . . . . . . . . . . . . 98.9area (from 95.6%–100.0%, with all but Texas at 98.0% or higher)
Maryland . . . . . . . . . . . . . . . . . . . . . . . . . . . . . . . . . . . . . . 100.0(Table I). The number of infant deaths in the linked file for the 50 Massachusetts . . . . . . . . . . . . . . . . . . . . . . . . . . . . . . . . . . 99.0states and the District of Columbia (D.C.) was weighted to equal the Michigan. . . . . . . . . . . . . . . . . . . . . . . . . . . . . . . . . . . . . . . 99.7sum of the linked plus unlinked infant deaths by state of occurrence Minnesota . . . . . . . . . . . . . . . . . . . . . . . . . . . . . . . . . . . . . . 100.0
of birth and age of death (under 7 days, 7–27 days, and 28 days to Mississippi . . . . . . . . . . . . . . . . . . . . . . . . . . . . . . . . . . . . . 100.0Missouri . . . . . . . . . . . . . . . . . . . . . . . . . . . . . . . . . . . . . . . 99.3under 1 year). The addition of the weight reduced the potential for Montana . . . . . . . . . . . . . . . . . . . . . . . . . . . . . . . . . . . . . . . 100.0
bias in comparing infant mortality rates by characteristics. Nebraska . . . . . . . . . . . . . . . . . . . . . . . . . . . . . . . . . . . . . . 100.0The 2013 linked file started with 23,465 infant death records. Nevada . . . . . . . . . . . . . . . . . . . . . . . . . . . . . . . . . . . . . . . . 100.0
Of these 23,465 records, 23,242 were linked; 223 were unlinked New Hampshire . . . . . . . . . . . . . . . . . . . . . . . . . . . . . . . . . 100.0
because corresponding birth certificates could not be identified. The New Jersey . . . . . . . . . . . . . . . . . . . . . . . . . . . . . . . . . . . . . 98.023,465 linked and unlinked records contained records of infants New Mexico . . . . . . . . . . . . . . . . . . . . . . . . . . . . . . . . . . . . 98.4
whose mothers’ usual place of residence was outside of the United New York (excluding New York City) . . . . . . . . . . . . . . . . . . . 99.2New York City . . . . . . . . . . . . . . . . . . . . . . . . . . . . . . . . . . . 99.5States. These records were excluded to derive a weighted total of North Carolina . . . . . . . . . . . . . . . . . . . . . . . . . . . . . . . . . . . 99.6
23,446 infant deaths for 2013. North Dakota . . . . . . . . . . . . . . . . . . . . . . . . . . . . . . . . . . . 100.0Ohio . . . . . . . . . . . . . . . . . . . . . . . . . . . . . . . . . . . . . . . . . . 98.7
Comparison of infant mortality data between the Oklahoma . . . . . . . . . . . . . . . . . . . . . . . . . . . . . . . . . . . . . . 100.0Oregon . . . . . . . . . . . . . . . . . . . . . . . . . . . . . . . . . . . . . . . . 100.0
linked file and the vital statistics mortality file Pennsylvania. . . . . . . . . . . . . . . . . . . . . . . . . . . . . . . . . . . . 99.4Rhode Island . . . . . . . . . . . . . . . . . . . . . . . . . . . . . . . . . . . . 100.0
The overall infant mortality rate from the 2013 period linked file South Carolina . . . . . . . . . . . . . . . . . . . . . . . . . . . . . . . . . . 100.0
of 5.96 is the same as that from the 2013 vital statistics mortality file South Dakota . . . . . . . . . . . . . . . . . . . . . . . . . . . . . . . . . . . 100.0(5.96) (45). The number of infant deaths in the linked file (23,242) Tennessee . . . . . . . . . . . . . . . . . . . . . . . . . . . . . . . . . . . . . 99.7differs slightly from the number in the mortality file (23,440) (45). Texas . . . . . . . . . . . . . . . . . . . . . . . . . . . . . . . . . . . . . . . . . 95.6
Differences in numbers of infant deaths between the two data Utah . . . . . . . . . . . . . . . . . . . . . . . . . . . . . . . . . . . . . . . . . . 100.0Vermont . . . . . . . . . . . . . . . . . . . . . . . . . . . . . . . . . . . . . . . 100.0sources are primarily due to geographic coverage differences. For Virginia . . . . . . . . . . . . . . . . . . . . . . . . . . . . . . . . . . . . . . . . 99.7
the vital statistics mortality file, all deaths occurring in the 50 states Washington . . . . . . . . . . . . . . . . . . . . . . . . . . . . . . . . . . . . . 100.0and D.C. are included regardless of the place of birth of the infant. West Virginia . . . . . . . . . . . . . . . . . . . . . . . . . . . . . . . . . . . . 98.7
In contrast, to be included in the U.S. linked file, both the birth and Wisconsin . . . . . . . . . . . . . . . . . . . . . . . . . . . . . . . . . . . . . . 100.0Wyoming . . . . . . . . . . . . . . . . . . . . . . . . . . . . . . . . . . . . . . 100.0death must occur in the 50 states and D.C. (the territory linked file
is a separate file). Also, weighting of the linked file may contribute to Puerto Rico . . . . . . . . . . . . . . . . . . . . . . . . . . . . . . . . . . . . . 100.0
small differences in numbers and rates by specific variables between Guam . . . . . . . . . . . . . . . . . . . . . . . . . . . . . . . . . . . . . . . . . 96.8
these two data sets. 1Excludes data for Puerto Rico and Guam.
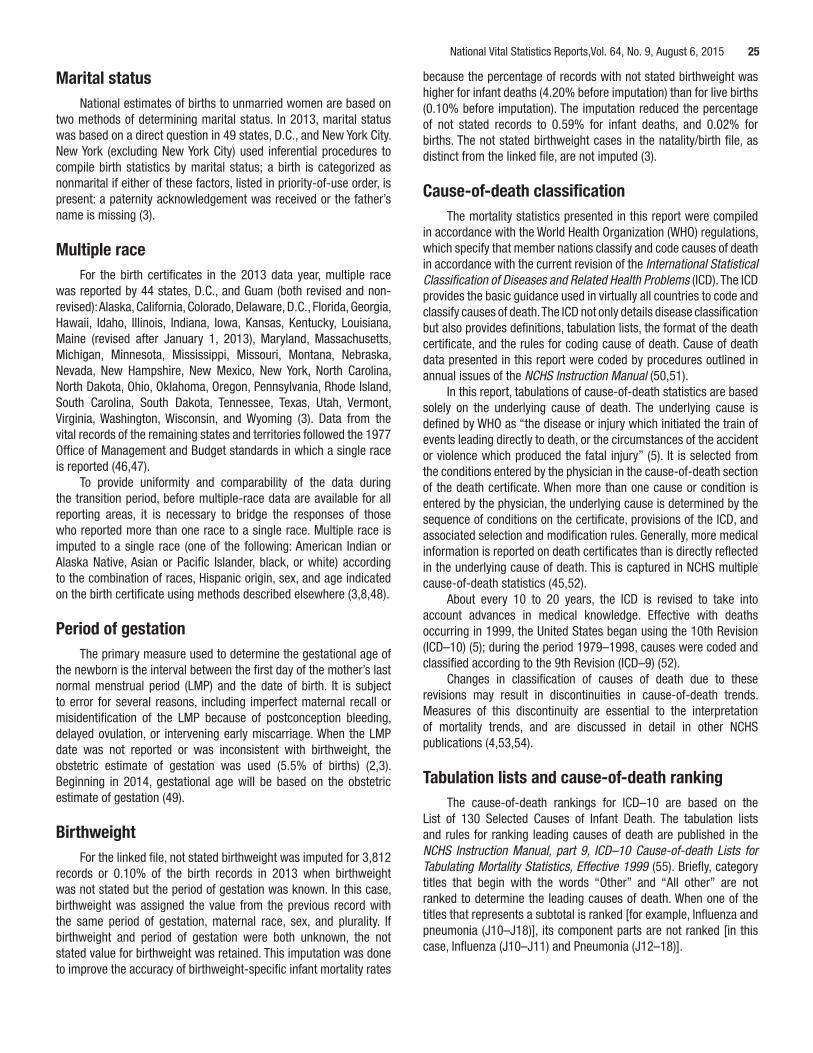
National Vital Statistics Reports,Vol. 64, No. 9, August 6, 2015 25
Marital status because the percentage of records with not stated birthweight was higher for infant deaths (4.20% before imputation) than for live births
National estimates of births to unmarried women are based on (0.10% before imputation). The imputation reduced the percentage two methods of determining marital status. In 2013, marital status of not stated records to 0.59% for infant deaths, and 0.02% for was based on a direct question in 49 states, D.C., and New York City. births. The not stated birthweight cases in the natality/birth file, as New York (excluding New York City) used inferential procedures to distinct from the linked file, are not imputed (3).compile birth statistics by marital status; a birth is categorized as nonmarital if either of these factors, listed in priority-of-use order, is Cause-of-death classificationpresent: a paternity acknowledgement was received or the father’s name is missing (3). The mortality statistics presented in this report were compiled
in accordance with the World Health Organization (WHO) regulations, Multiple race which specify that member nations classify and code causes of death
in accordance with the current revision of the International Statistical For the birth certificates in the 2013 data year, multiple race Classification of Diseases and Related Health Problems (ICD). The ICD
was reported by 44 states, D.C., and Guam (both revised and non- provides the basic guidance used in virtually all countries to code and revised): Alaska, California, Colorado, Delaware, D.C., Florida, Georgia, classify causes of death. The ICD not only details disease classification Hawaii, Idaho, Illinois, Indiana, Iowa, Kansas, Kentucky, Louisiana, but also provides definitions, tabulation lists, the format of the death Maine (revised after January 1, 2013), Maryland, Massachusetts, certificate, and the rules for coding cause of death. Cause of death Michigan, Minnesota, Mississippi, Missouri, Montana, Nebraska, data presented in this report were coded by procedures outlined in Nevada, New Hampshire, New Mexico, New York, North Carolina, annual issues of the NCHS Instruction Manual (50,51). North Dakota, Ohio, Oklahoma, Oregon, Pennsylvania, Rhode Island, In this report, tabulations of cause-of-death statistics are based South Carolina, South Dakota, Tennessee, Texas, Utah, Vermont, solely on the underlying cause of death. The underlying cause is Virginia, Washington, Wisconsin, and Wyoming (3). Data from the defined by WHO as “the disease or injury which initiated the train of vital records of the remaining states and territories followed the 1977 events leading directly to death, or the circumstances of the accident Office of Management and Budget standards in which a single race or violence which produced the fatal injury” (5). It is selected from is reported (46,47). the conditions entered by the physician in the cause-of-death section
To provide uniformity and comparability of the data during of the death certificate. When more than one cause or condition is the transition period, before multiple-race data are available for all entered by the physician, the underlying cause is determined by the reporting areas, it is necessary to bridge the responses of those sequence of conditions on the certificate, provisions of the ICD, and who reported more than one race to a single race. Multiple race is associated selection and modification rules. Generally, more medical imputed to a single race (one of the following: American Indian or information is reported on death certificates than is directly reflected Alaska Native, Asian or Pacific Islander, black, or white) according in the underlying cause of death. This is captured in NCHS multiple to the combination of races, Hispanic origin, sex, and age indicated cause-of-death statistics (45,52).on the birth certificate using methods described elsewhere (3,8,48). About every 10 to 20 years, the ICD is revised to take into
account advances in medical knowledge. Effective with deathsPeriod of gestation occurring in 1999, the United States began using the 10th Revision
(ICD–10) (5); during the period 1979–1998, causes were coded and The primary measure used to determine the gestational age of classified according to the 9th Revision (ICD–9) (52). the newborn is the interval between the first day of the mother’s last
Changes in classification of causes of death due to thesenormal menstrual period (LMP) and the date of birth. It is subject revisions may result in discontinuities in cause-of-death trends.to error for several reasons, including imperfect maternal recall or Measures of this discontinuity are essential to the interpretation misidentification of the LMP because of postconception bleeding, of mortality trends, and are discussed in detail in other NCHSdelayed ovulation, or intervening early miscarriage. When the LMP publications (4,53,54). date was not reported or was inconsistent with birthweight, the
obstetric estimate of gestation was used (5.5% of births) (2,3). Beginning in 2014, gestational age will be based on the obstetric Tabulation lists and cause-of-death rankingestimate of gestation (49). The cause-of-death rankings for ICD–10 are based on the
List of 130 Selected Causes of Infant Death. The tabulation lists Birthweight and rules for ranking leading causes of death are published in the
NCHS Instruction Manual, part 9, ICD–10 Cause-of-death Lists for For the linked file, not stated birthweight was imputed for 3,812 Tabulating Mortality Statistics, Effective 1999 (55). Briefly, category records or 0.10% of the birth records in 2013 when birthweight titles that begin with the words “Other” and “All other” are not was not stated but the period of gestation was known. In this case, ranked to determine the leading causes of death. When one of the birthweight was assigned the value from the previous record with titles that represents a subtotal is ranked [for example, Influenza and the same period of gestation, maternal race, sex, and plurality. If pneumonia (J10–J18)], its component parts are not ranked [in this birthweight and period of gestation were both unknown, the not case, Influenza (J10–J11) and Pneumonia (J12–18)]. stated value for birthweight was retained. This imputation was done
to improve the accuracy of birthweight-specific infant mortality rates
26 National Vital Statistics Reports, Vol. 64, No. 9, August 6, 2015
Preterm-related causes of death death rates, used only in age-specific death rates with the mortality file, use the estimated population of persons under age 1 year as the
Preterm-related causes of death are those causes that have denominator. a direct etiological connection to preterm birth. For an underlying For all variables, not stated responses were shown in tables of cause of death to be considered preterm-related, 75% or more of frequencies but were subtracted before rates were computed. Rates infants whose deaths were attributed to that cause had to be born per 1,000 live births display two digits after the decimal place to preterm, and the cause of death had to be a direct consequence provide a more precise and sensitive measurement. For rates perof preterm birth based on a clinical evaluation and review of the 100,000 live births (by cause of death), the infant mortality rate is literature (39). The cause-of-death categories included in this shown for one decimal place. Adding an additional decimal for rates grouping are shown in the note in Table 6. Causes that are incidental per 100,000 does not increase precision as it does for rates perto preterm birth (for example, a Motor vehicle accident to a preterm 1,000.infant) are not included. This grouping of preterm-related causes As stated previously, infant death records for the 50 states and probably underestimates the total impact of preterm-related infant D.C. in the U.S. linked file are weighted so that the infant mortality death, as some ICD categories (notably those beginning with the rates are not underestimated for those areas that did not successfully words “Other” and “All other”) had a high percentage of preterm link all records. infant deaths but lacked sufficient specificity to be able to establish the etiologic connection to prematurity with any degree of certainty. Random variation in infant mortality ratesFurther details on the development of this cause-of-death grouping are available in related publications (39,40). The number of infant deaths and live births reported for an area
represent complete counts of such events. As such, they are not
Sudden unexpected infant death subject to sampling error, although they are subject to nonsampling error in the registration process. However, when the figures are used
Recent studies have identified changes in how sudden for analytic purposes, such as the comparison of rates over time,unexplained infant deaths have been classified over time by medical for different areas, or among different subgroups, the number ofexaminers and coroners, with large decreases in sudden infant events that actually occurred may be considered as one of a large death syndrome (SIDS) accompanied by corresponding increases in series of possible results that could have arisen under the samecause unknown and accidental suffocation and strangulation in bed circumstances (61). As a result, numbers of births, deaths, and infant (41,56,57). To facilitate more consistent tracking of trends in these mortality rates are subject to random variation. The probable range of deaths, unaffected by classification differences, a special cause-of- values may be estimated from the actual figures according to certain death category has been developed for Sudden Unexpected Infant statistical assumptions.Deaths (SUID) (41,42). SUID is defined as, “The death of an infant In general, distributions of vital events may be assumed toless than one year of age in which investigation, autopsy, medical follow the normal distribution. When the number of events is large, history review and appropriate laboratory testing fail to identify a the relative standard error (RSE) is usually small. When the number specific cause of death. SUID includes cases that meet the definition of events is small (i.e., fewer than 100) and the probability of such an of sudden infant death syndrome” (58). The SUID category combines event is small, considerable caution must be observed in interpreting ICD–10 codes for Sudden Infant Death Syndrome, or SIDS (R95), the data. Such infrequent events may be assumed to follow a Poisson Accidental Suffocation and Strangulation in Bed, or ASSB (W75), probability distribution (3,4). Estimates of RSEs and 95% confidence and Unknown cause (R99) based on underlying cause of death. intervals are shown below.This category is currently being used as a key indicator by Healthy The formula for the RSE of infant deaths and live births is:People 2020 Maternal, Infant, and Child Health outcomes (43), the
1Collaborative Improvement & Innovation Network to Reduce Infant RSE(D )=100 • where D is the number of deaths and
DMortality (59), and Child Health USA (60).
1Computation of rates RSE(B )=100 • where B is the number of births.B
Infant mortality rates are the most commonly used index for For example, say that for Group A the number of infant deaths measuring the risk of dying during the first year of life. For the was 497 while the number of live births was 81,555, yielding anlinked birth/infant death data set, they are calculated by dividing the infant mortality rate of 6.09 infant deaths per 1,000 live births. number of infant deaths in a calendar year by the number of live
1births registered for the same period and are presented as rates per The RSE of the deaths = 100 • = 4.49,4971,000 or per 100,000 live births. Both the mortality file and the linked
birth/infant death file use this computation method, but due to unique 1while the RSE of the births = 100 numbers of infant deaths, as explained in the section above on the • = 0.35.
81,555comparison of these two files, the rates will often differ for specific variables (particularly for race and ethnicity). Infant mortality rates The formula for the RSE of the infant mortality rate (IMR) is:in the linked file use the number of live births in the denominator to 1 1RSE(IMR)=100 • +approximate the population at risk of dying before the first birthday.
D BIn contrast to the infant mortality rates based on live births, infant

National Vital Statistics Reports,Vol. 64, No. 9, August 6, 2015 27
The RSE of the IMR for the example above R – RZ = 1 2
1 1= 100 • + = 4.50. 2 ( RSE( ) R1497 81,555 1 100 )
2RSE(R2)R 2 2 (
2
R + 100 )
Normal distribution—When the number of events is greater than If |z| ≥ 1.96, then the difference is statistically significant at the 100, the normal distribution is used to estimate the 95% confidence 0.05 level, and if |z| < 1.96, the difference is not significant.intervals as follows:
RSE(R ) Availability of linked file dataLower: R1 – 1.96 • R 1•1 100 Linked file data are available for download at: http://www.cdc.
RSE(R• 1)• gov/nchs/data_access/VitalStatsOnline.htm. Beginning with 2005,Upper: R1 + 1.96 R1 100 the public-use file no longer includes geographic detail; such files
are available upon special request (see: http://www.cdc.gov/nchs/Thus, for Group A:nvss/dvs_data_release.htm). Data are also available in issues of Vital
Lower: 6.09 – ( 4.501.96 • 6.09 • ) = 5.55 and Health Statistics, Series 20, National Vital Statistics Reports, and 100
Data Briefs from the NCHS website: http://www.cdc.gov/nchs/.Upper: 6.09 + ( 4.501.96 • 6.09 • ) = 6.63
100
Thus, the chances are 95 out of 100 that the true IMR for Group A lies somewhere in the 5.55–6.63 interval.
Poisson distribution—When the number of events in the numerator is fewer than 100, the confidence interval for the rate can be estimated based on the Poisson distribution using the values in Table II.
Lower: IMR • L (.95, Dadj)
Upper: IMR • U (.95, Dadj)
where Dadj is the adjusted number of infant deaths (rounded to the nearest integer) used to take into account the RSE of the number of infant deaths and live births, and is computed as follows:
D BDadj =•
D + B
L(.95, Dadj) and U(.95, Dadj) refer to the values in Table II corresponding to the value of Dadj.
For example, suppose that for Group B the number of infant deaths was 53, the number of live births was 9,241, and the infant mortality rate was 5.74.
53 9,241 Dadj = • = 5353 + 9,241
Therefore, the 95% confidence interval (using the formula in Table II for 1–99 infant deaths) =
Lower: 5.74 • 0.74907 = 4.30
Upper: 5.74 • 1.30802 = 7.51
Comparison of two infant mortality rates—If either of the two rates to be compared is based on fewer than 100 deaths, compute the confidence intervals for both rates and check to see if they overlap. If so, the difference is not statistically significant at the 95% level. If they do not overlap, the difference is statistically significant. If both of the two rates (R1 and R2) to be compared are based on 100 or more deaths, the following z test may be used to define a significance test statistic:
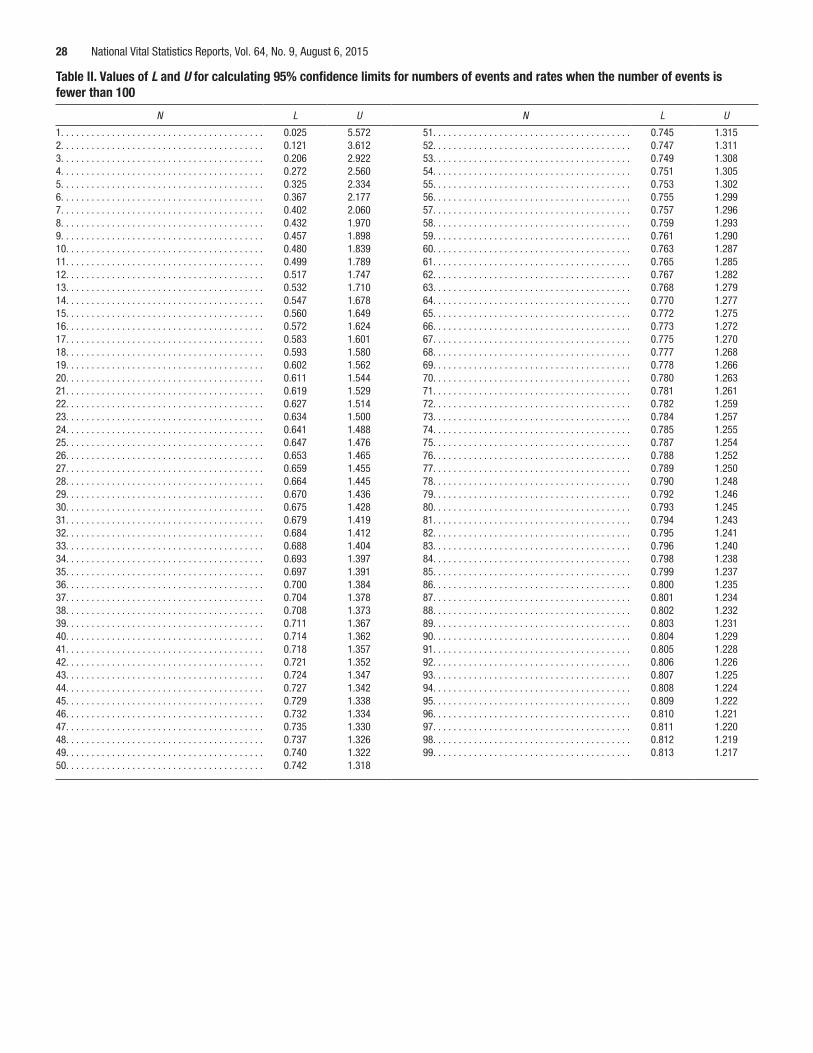
28 National Vital Statistics Reports, Vol. 64, No. 9, August 6, 2015
Table II. Values of L and U for calculating 95% confidence limits for numbers of events and rates when the number of events is fewer than 100
N L U N L U
1. . . . . . . . . . . . . . . . . . . . . . . . . . . . . . . . . . . . . . . . 0.025 5.572 51. . . . . . . . . . . . . . . . . . . . . . . . . . . . . . . . . . . . . . . 0.745 1.3152. . . . . . . . . . . . . . . . . . . . . . . . . . . . . . . . . . . . . . . . 0.121 3.612 52. . . . . . . . . . . . . . . . . . . . . . . . . . . . . . . . . . . . . . . 0.747 1.3113. . . . . . . . . . . . . . . . . . . . . . . . . . . . . . . . . . . . . . . . 0.206 2.922 53. . . . . . . . . . . . . . . . . . . . . . . . . . . . . . . . . . . . . . . 0.749 1.3084. . . . . . . . . . . . . . . . . . . . . . . . . . . . . . . . . . . . . . . . 0.272 2.560 54. . . . . . . . . . . . . . . . . . . . . . . . . . . . . . . . . . . . . . . 0.751 1.3055. . . . . . . . . . . . . . . . . . . . . . . . . . . . . . . . . . . . . . . . 0.325 2.334 55. . . . . . . . . . . . . . . . . . . . . . . . . . . . . . . . . . . . . . . 0.753 1.3026. . . . . . . . . . . . . . . . . . . . . . . . . . . . . . . . . . . . . . . . 0.367 2.177 56. . . . . . . . . . . . . . . . . . . . . . . . . . . . . . . . . . . . . . . 0.755 1.2997. . . . . . . . . . . . . . . . . . . . . . . . . . . . . . . . . . . . . . . . 0.402 2.060 57. . . . . . . . . . . . . . . . . . . . . . . . . . . . . . . . . . . . . . . 0.757 1.2968. . . . . . . . . . . . . . . . . . . . . . . . . . . . . . . . . . . . . . . . 0.432 1.970 58. . . . . . . . . . . . . . . . . . . . . . . . . . . . . . . . . . . . . . . 0.759 1.2939. . . . . . . . . . . . . . . . . . . . . . . . . . . . . . . . . . . . . . . . 0.457 1.898 59. . . . . . . . . . . . . . . . . . . . . . . . . . . . . . . . . . . . . . . 0.761 1.29010. . . . . . . . . . . . . . . . . . . . . . . . . . . . . . . . . . . . . . . 0.480 1.839 60. . . . . . . . . . . . . . . . . . . . . . . . . . . . . . . . . . . . . . . 0.763 1.28711. . . . . . . . . . . . . . . . . . . . . . . . . . . . . . . . . . . . . . . 0.499 1.789 61. . . . . . . . . . . . . . . . . . . . . . . . . . . . . . . . . . . . . . . 0.765 1.28512. . . . . . . . . . . . . . . . . . . . . . . . . . . . . . . . . . . . . . . 0.517 1.747 62. . . . . . . . . . . . . . . . . . . . . . . . . . . . . . . . . . . . . . . 0.767 1.28213. . . . . . . . . . . . . . . . . . . . . . . . . . . . . . . . . . . . . . . 0.532 1.710 63. . . . . . . . . . . . . . . . . . . . . . . . . . . . . . . . . . . . . . . 0.768 1.27914. . . . . . . . . . . . . . . . . . . . . . . . . . . . . . . . . . . . . . . 0.547 1.678 64. . . . . . . . . . . . . . . . . . . . . . . . . . . . . . . . . . . . . . . 0.770 1.27715. . . . . . . . . . . . . . . . . . . . . . . . . . . . . . . . . . . . . . . 0.560 1.649 65. . . . . . . . . . . . . . . . . . . . . . . . . . . . . . . . . . . . . . . 0.772 1.27516. . . . . . . . . . . . . . . . . . . . . . . . . . . . . . . . . . . . . . . 0.572 1.624 66. . . . . . . . . . . . . . . . . . . . . . . . . . . . . . . . . . . . . . . 0.773 1.27217. . . . . . . . . . . . . . . . . . . . . . . . . . . . . . . . . . . . . . . 0.583 1.601 67. . . . . . . . . . . . . . . . . . . . . . . . . . . . . . . . . . . . . . . 0.775 1.27018. . . . . . . . . . . . . . . . . . . . . . . . . . . . . . . . . . . . . . . 0.593 1.580 68. . . . . . . . . . . . . . . . . . . . . . . . . . . . . . . . . . . . . . . 0.777 1.26819. . . . . . . . . . . . . . . . . . . . . . . . . . . . . . . . . . . . . . . 0.602 1.562 69. . . . . . . . . . . . . . . . . . . . . . . . . . . . . . . . . . . . . . . 0.778 1.26620. . . . . . . . . . . . . . . . . . . . . . . . . . . . . . . . . . . . . . . 0.611 1.544 70. . . . . . . . . . . . . . . . . . . . . . . . . . . . . . . . . . . . . . . 0.780 1.26321. . . . . . . . . . . . . . . . . . . . . . . . . . . . . . . . . . . . . . . 0.619 1.529 71. . . . . . . . . . . . . . . . . . . . . . . . . . . . . . . . . . . . . . . 0.781 1.26122. . . . . . . . . . . . . . . . . . . . . . . . . . . . . . . . . . . . . . . 0.627 1.514 72. . . . . . . . . . . . . . . . . . . . . . . . . . . . . . . . . . . . . . . 0.782 1.25923. . . . . . . . . . . . . . . . . . . . . . . . . . . . . . . . . . . . . . . 0.634 1.500 73. . . . . . . . . . . . . . . . . . . . . . . . . . . . . . . . . . . . . . . 0.784 1.25724. . . . . . . . . . . . . . . . . . . . . . . . . . . . . . . . . . . . . . . 0.641 1.488 74. . . . . . . . . . . . . . . . . . . . . . . . . . . . . . . . . . . . . . . 0.785 1.25525. . . . . . . . . . . . . . . . . . . . . . . . . . . . . . . . . . . . . . . 0.647 1.476 75. . . . . . . . . . . . . . . . . . . . . . . . . . . . . . . . . . . . . . . 0.787 1.25426. . . . . . . . . . . . . . . . . . . . . . . . . . . . . . . . . . . . . . . 0.653 1.465 76. . . . . . . . . . . . . . . . . . . . . . . . . . . . . . . . . . . . . . . 0.788 1.25227. . . . . . . . . . . . . . . . . . . . . . . . . . . . . . . . . . . . . . . 0.659 1.455 77. . . . . . . . . . . . . . . . . . . . . . . . . . . . . . . . . . . . . . . 0.789 1.25028. . . . . . . . . . . . . . . . . . . . . . . . . . . . . . . . . . . . . . . 0.664 1.445 78. . . . . . . . . . . . . . . . . . . . . . . . . . . . . . . . . . . . . . . 0.790 1.24829. . . . . . . . . . . . . . . . . . . . . . . . . . . . . . . . . . . . . . . 0.670 1.436 79. . . . . . . . . . . . . . . . . . . . . . . . . . . . . . . . . . . . . . . 0.792 1.24630. . . . . . . . . . . . . . . . . . . . . . . . . . . . . . . . . . . . . . . 0.675 1.428 80. . . . . . . . . . . . . . . . . . . . . . . . . . . . . . . . . . . . . . . 0.793 1.24531. . . . . . . . . . . . . . . . . . . . . . . . . . . . . . . . . . . . . . . 0.679 1.419 81. . . . . . . . . . . . . . . . . . . . . . . . . . . . . . . . . . . . . . . 0.794 1.24332. . . . . . . . . . . . . . . . . . . . . . . . . . . . . . . . . . . . . . . 0.684 1.412 82. . . . . . . . . . . . . . . . . . . . . . . . . . . . . . . . . . . . . . . 0.795 1.24133. . . . . . . . . . . . . . . . . . . . . . . . . . . . . . . . . . . . . . . 0.688 1.404 83. . . . . . . . . . . . . . . . . . . . . . . . . . . . . . . . . . . . . . . 0.796 1.24034. . . . . . . . . . . . . . . . . . . . . . . . . . . . . . . . . . . . . . . 0.693 1.397 84. . . . . . . . . . . . . . . . . . . . . . . . . . . . . . . . . . . . . . . 0.798 1.23835. . . . . . . . . . . . . . . . . . . . . . . . . . . . . . . . . . . . . . . 0.697 1.391 85. . . . . . . . . . . . . . . . . . . . . . . . . . . . . . . . . . . . . . . 0.799 1.23736. . . . . . . . . . . . . . . . . . . . . . . . . . . . . . . . . . . . . . . 0.700 1.384 86. . . . . . . . . . . . . . . . . . . . . . . . . . . . . . . . . . . . . . . 0.800 1.23537. . . . . . . . . . . . . . . . . . . . . . . . . . . . . . . . . . . . . . . 0.704 1.378 87. . . . . . . . . . . . . . . . . . . . . . . . . . . . . . . . . . . . . . . 0.801 1.23438. . . . . . . . . . . . . . . . . . . . . . . . . . . . . . . . . . . . . . . 0.708 1.373 88. . . . . . . . . . . . . . . . . . . . . . . . . . . . . . . . . . . . . . . 0.802 1.23239. . . . . . . . . . . . . . . . . . . . . . . . . . . . . . . . . . . . . . . 0.711 1.367 89. . . . . . . . . . . . . . . . . . . . . . . . . . . . . . . . . . . . . . . 0.803 1.23140. . . . . . . . . . . . . . . . . . . . . . . . . . . . . . . . . . . . . . . 0.714 1.362 90. . . . . . . . . . . . . . . . . . . . . . . . . . . . . . . . . . . . . . . 0.804 1.22941. . . . . . . . . . . . . . . . . . . . . . . . . . . . . . . . . . . . . . . 0.718 1.357 91. . . . . . . . . . . . . . . . . . . . . . . . . . . . . . . . . . . . . . . 0.805 1.22842. . . . . . . . . . . . . . . . . . . . . . . . . . . . . . . . . . . . . . . 0.721 1.352 92. . . . . . . . . . . . . . . . . . . . . . . . . . . . . . . . . . . . . . . 0.806 1.22643. . . . . . . . . . . . . . . . . . . . . . . . . . . . . . . . . . . . . . . 0.724 1.347 93. . . . . . . . . . . . . . . . . . . . . . . . . . . . . . . . . . . . . . . 0.807 1.22544. . . . . . . . . . . . . . . . . . . . . . . . . . . . . . . . . . . . . . . 0.727 1.342 94. . . . . . . . . . . . . . . . . . . . . . . . . . . . . . . . . . . . . . . 0.808 1.22445. . . . . . . . . . . . . . . . . . . . . . . . . . . . . . . . . . . . . . . 0.729 1.338 95. . . . . . . . . . . . . . . . . . . . . . . . . . . . . . . . . . . . . . . 0.809 1.22246. . . . . . . . . . . . . . . . . . . . . . . . . . . . . . . . . . . . . . . 0.732 1.334 96. . . . . . . . . . . . . . . . . . . . . . . . . . . . . . . . . . . . . . . 0.810 1.22147. . . . . . . . . . . . . . . . . . . . . . . . . . . . . . . . . . . . . . . 0.735 1.330 97. . . . . . . . . . . . . . . . . . . . . . . . . . . . . . . . . . . . . . . 0.811 1.22048. . . . . . . . . . . . . . . . . . . . . . . . . . . . . . . . . . . . . . . 0.737 1.326 98. . . . . . . . . . . . . . . . . . . . . . . . . . . . . . . . . . . . . . . 0.812 1.21949. . . . . . . . . . . . . . . . . . . . . . . . . . . . . . . . . . . . . . . 0.740 1.322 99. . . . . . . . . . . . . . . . . . . . . . . . . . . . . . . . . . . . . . . 0.813 1.21750. . . . . . . . . . . . . . . . . . . . . . . . . . . . . . . . . . . . . . . 0.742 1.318

National Vital Statistics Reports,Vol. 64, No. 9, August 6, 2015 29
U.S. Department of First Class mail HealtH & HUman ServiceS Postage & Fees Paid
CdC/NCHs Centers for Disease Control and Prevention Permit No. g-284National Center for Health Statistics 3311 Toledo Road, Room 5419 Hyattsville, MD 20782-2064
OffiCial BuSiNeSS PeNalTy fOR PRivaTe uSe, $300
For more NCHs NVsrs, visit: http://www.cdc.gov/nchs/products/nvsr.htm.
National Vital Statistics Reports, Vol. 64, No. 9, August 6, 2015
Contents
Abstract . . . . . . . . . . . . . . . . . . . . . . . . . . . . . . . . . . . . . . . . . . . . . . . . . . . . . . . . . .1 References . . . . . . . . . . . . . . . . . . . . . . . . . . . . . . . . . . . . . . . . . . . . . . . . . . . . . .11Introduction . . . . . . . . . . . . . . . . . . . . . . . . . . . . . . . . . . . . . . . . . . . . . . . . . . . . . . .2 List of Detailed Tables . . . . . . . . . . . . . . . . . . . . . . . . . . . . . . . . . . . . . . . . . . . . . .13Methods . . . . . . . . . . . . . . . . . . . . . . . . . . . . . . . . . . . . . . . . . . . . . . . . . . . . . . . . . .2 Technical Notes . . . . . . . . . . . . . . . . . . . . . . . . . . . . . . . . . . . . . . . . . . . . . . . . . . .24
Data by maternal and infant characteristics . . . . . . . . . . . . . . . . . . . . . . . . . . . . .2Results and Discussion . . . . . . . . . . . . . . . . . . . . . . . . . . . . . . . . . . . . . . . . . . . . . . .3
Trends in infant mortality . . . . . . . . . . . . . . . . . . . . . . . . . . . . . . . . . . . . . . . . . . . .3 AcknowledgmentsInfant mortality by race and Hispanic origin of mother . . . . . . . . . . . . . . . . . . . . . .3
This report was prepared under the general direction of Delton Atkinson, Director of Age at death . . . . . . . . . . . . . . . . . . . . . . . . . . . . . . . . . . . . . . . . . . . . . . . . . . . . .3the Division of Vital Statistics (DVS), and Amy M. Branum, Chief of the Reproductive Infant mortality by state and race and ethnicity . . . . . . . . . . . . . . . . . . . . . . . . . . .4Statistics Branch (RSB). Rajesh Vikar, Chief of Information Technology Branch (ITB), Sex of infant . . . . . . . . . . . . . . . . . . . . . . . . . . . . . . . . . . . . . . . . . . . . . . . . . . . . .5and Steve Steimel and Annie Liu, ITB provided computer programming support and Multiple births . . . . . . . . . . . . . . . . . . . . . . . . . . . . . . . . . . . . . . . . . . . . . . . . . . .5statistical tables. Sharon Kirmeyer of RSB provided assistance with content review.
Period of gestation . . . . . . . . . . . . . . . . . . . . . . . . . . . . . . . . . . . . . . . . . . . . . . . .5The Data Acquisition, Classification, and Evaluation Branch provided consultation to
Birthweight . . . . . . . . . . . . . . . . . . . . . . . . . . . . . . . . . . . . . . . . . . . . . . . . . . . . . .6state vital statistics offices regarding collection of the birth and death certificate data
Maternal age . . . . . . . . . . . . . . . . . . . . . . . . . . . . . . . . . . . . . . . . . . . . . . . . . . . .7 on which this report is based. Live-birth order . . . . . . . . . . . . . . . . . . . . . . . . . . . . . . . . . . . . . . . . . . . . . . . . . . .8Marital status . . . . . . . . . . . . . . . . . . . . . . . . . . . . . . . . . . . . . . . . . . . . . . . . . . . .8Nativity . . . . . . . . . . . . . . . . . . . . . . . . . . . . . . . . . . . . . . . . . . . . . . . . . . . . . . . . .8Leading causes of infant death . . . . . . . . . . . . . . . . . . . . . . . . . . . . . . . . . . . . . . .9Preterm-related causes of death . . . . . . . . . . . . . . . . . . . . . . . . . . . . . . . . . . . . .10Sudden unexpected infant deaths . . . . . . . . . . . . . . . . . . . . . . . . . . . . . . . . . . . .11Contribution of leading causes of death to racial and ethnic infant mortality differences . . . . . . . . . . . . . . . . . . . . . . . . . . . . . . . . . . .11
Suggested citation Copyright information National Center for Health Statistics
Charles J. Rothwell, M.S., M.B.A., DirectorMathews TJ, MacDorman MF, Thoma ME. All material appearing in this report is in the Nathaniel Schenker, Ph.D., Deputy DirectorInfant mortality statistics from the 2013 public domain and may be reproduced or
Jennifer H. Madans, Ph.D., Associate period linked birth/infant death data set. copied without permission; citation as to Director for ScienceNational vital statistics reports; vol 64 no 9. source, however, is appreciated.
Hyattsville, MD: National Center for Health Division of Vital StatisticsStatistics. 2015. Delton Atkinson, M.P.H., M.P.H., P.M.P.,
Director
For e-mail updates on NCHS publication releases, subscribe online at: http://www.cdc.gov/nchs/govdelivery.htm. For questions or general information about NCHS: Tel: 1–800–CDC–INFO (1–800–232–4636) • TTY: 1–888–232–6348
Internet: http://www.cdc.gov/nchs • Online request form: http://www.cdc.gov/info DHHS Publication No. 2015–1120 • CS257783