Embed Size (px)
Citation preview

National VitalStatistics ReportsVolume 70, Number 11 October 26, 2021
Fetal Mortality: United States, 2019by Elizabeth C.W. Gregory, M.P.H., Claudia P. Valenzuela, M.P.H., and Donna L. Hoyert, Ph.D., Division of Vital Statistics
AbstractObjectives—This report presents 2019 fetal mortality data
by maternal race and Hispanic origin, age, tobacco use during pregnancy, and state of residence, as well as by plurality, sex, gestational age, birthweight, and selected causes of death. Trends in fetal mortality are also examined.
Methods—Descriptive tabulations of data are presented and interpreted for all fetal deaths reported for the United States for 2019 with a stated or presumed period of gestation of 20 or more weeks. Cause-of-fetal-death data only are restricted to
residents of the 42 states and the District of Columbia where cause of death was based on the 2003 fetal death report revision and less than 50% of deaths were attributed to Fetal death of unspecified cause (P95).
Results—A total of 21,478 fetal deaths at 20 or more weeks of gestation were reported in the United States in 2019. The U.S. fetal mortality rate was 5.70 fetal deaths at 20 or more weeks of gestation per 1,000 live births and fetal deaths, 3% lower than in 2018 (5.89) and a historic low for the United States. The fetal mortality rate in 2019 for deaths occurring at 20–27 weeks of gestation was 2.98, a 4% decline from 2018 (3.11). The rate for
U.S. DEPARTMENT OF HEALTH AND HUMAN SERVICESCenters for Disease Control and Prevention
National Center for Health Statistics National Vital Statistics System
NCHS reports can be downloaded from: https://www.cdc.gov/nchs/products/index.htm.
Figure 1. Fetal mortality rate: United States, 1990–2019
6
5
7
8
Rat
e pe
r 1,0
00 li
ve b
irths
and
feta
l dea
ths
NOTE: Fetal mortality rate is the number of fetal deaths at 20 or more weeks of gestation per 1,000 live births and fetal deaths.SOURCE: National Center for Health Statistics, National Vital Statistics System.
020192010 2015200520001990 1995
2 National Vital Statistics Reports, Vol. 70, No. 11, October 26, 2021
deaths occurring at 28 or more weeks of gestation in 2019 (2.73) was not significantly lower than the rate for 2018 (2.79). In 2019, the fetal mortality rate was highest for non-Hispanic black (10.41) and Native Hawaiian or Other Pacific Islander (10.03) women and lowest for non-Hispanic Asian women (4.02). Fetal mortality rates were highest for women aged 40 and over, for women who smoked during pregnancy, and for women with multiple gestation pregnancies. Five selected causes accounted for 89.9% of fetal deaths in the 42-state and District of Columbia reporting area.
Keywords: fetal death • stillbirth • pregnancy loss • National Vital Statistics System
IntroductionFetal mortality—the intrauterine death of a fetus at any
gestational age—is a major but often overlooked public health issue. Much of the public concern surrounding reproductive loss has focused on infant mortality, due in part to a lesser knowledge of the incidence, etiology, and prevention strategies for fetal mortality. This report presents detailed data on numbers and rates of fetal deaths for the United States for 2019. Data are presented by maternal race and Hispanic origin, age, tobacco use during pregnancy, and state of residence, as well as by plurality, sex, gestational age at delivery, birthweight, and selected causes of death. Trends in fetal mortality are also examined.
This annual report replaces the earlier annual National Vital Statistics Report series on fetal and perinatal mortality (1). It has been redesigned to focus exclusively on fetal deaths and includes information not available in earlier reports, including tobacco use during pregnancy and fetal cause of death.
In addition to the tabulations included in this report, more detailed analysis of fetal mortality is possible by using the annual fetal death public-use file. The data file may be downloaded from: https://www.cdc.gov/nchs/data_access/Vitalstatsonline.htm. The public-use file does not include geographic detail; a file with this information may be available upon special request (see the Division of Vital Statistics data release policy: https://www.cdc.gov/nchs/nvss/dvs_data_release.htm). Fetal death data may also be accessed via the Centers for Disease Control and Prevention’s (CDC) “Wide-ranging Online Data for Epidemiologic Research”(WONDER). WONDER is a web-based data query system thatmakes the data of CDC available to public health professionalsand the public (2).
Methods
Data sources Data in this report are drawn from two National Center
for Health Statistics (NCHS) vital statistics data files: the 2019 fetal death data set (for fetal deaths) and the 2019 birth data set (for births). The 2019 fetal death data set contains information from all reports of fetal death filed in the 50 states, the District of Columbia, Guam, the Northern Marianas, and Puerto Rico (American Samoa and the Virgin Islands did not report data
for 2019). The 2019 birth data set contains information from all Certificates of Live Birth filed in the 50 states, the District of Columbia, Guam, the Northern Marianas, and Puerto Rico (American Samoa and the Virgin Islands did not report data for 2019). Tables showing data by jurisdiction also provide separate information for Guam, the Northern Marianas, and Puerto Rico; however, these data are not included in U.S. totals.
Fetal mortalityFetal death refers to the intrauterine death of a fetus
prior to delivery (Technical Notes). Fetal mortality is generally divided into three periods based on gestational age: less than 20 completed weeks of gestation, 20–27 weeks of gestation (early fetal deaths), and 28 or more weeks of gestation (late fetal deaths). Although the vast majority of fetal deaths occur early in pregnancy, most states in the United States only require the reporting of fetal deaths at 20 or more weeks of gestation (3), and fetal mortality data from the National Vital Statistics System are usually presented for fetal deaths at 20 or more weeks of gestation. Therefore, only fetal deaths reported at 20 or more weeks of gestation are included in this report. Numbers and rates for early and late fetal deaths are shown separately for selected variables. Statistics on fetal death exclude data for induced terminations of pregnancy. Fetal mortality rates in this report are computed as the number of fetal deaths at 20 or more weeks of gestation per 1,000 live births and fetal deaths at 20 or more weeks (Technical Notes).
Data limitations Variation exists among states in reporting requirements
and possibly in completeness of reporting of fetal death data, and these variations can have implications for data quality and completeness (Technical Notes). Correct interpretation of fetal death data should include an evaluation of the completeness of reporting of fetal deaths, as well as an evaluation of the completeness of reporting for the specific variables of interest (4–6). The percentage of not-stated responses for fetal death data varies markedly among variables and states (see “User Guide to the 2019 Fetal Death Public Use File”).
2003 revision of U.S. Standard Report of Fetal Death
Starting in 2018, all 50 states, the District of Columbia, Puerto Rico, Guam, and the Northern Marianas reported data based on the 2003 U.S. Report of Fetal Death. American Samoa and the U.S. Virgin Islands continue to report based on the 1989 report of fetal death revision.
With the implementation of the 2003 revision, two worksheets, the “Patient’s Worksheet” (7) and the “Facility Worksheet” (8), were developed to encourage collection of data from the best sources. For the Patient’s Worksheet, data are directly obtained from the mother and include items such as mother’s date of birth, race, Hispanic origin, level of education, tobacco use during pregnancy, and place of residence. For the Facility Worksheet, data are obtained from the medical records

National Vital Statistics Reports, Vol. 70, No. 11, October 26, 2021 3
of the mother for items such as prenatal care, medical risk factors, maternal morbidity, plurality, sex of fetus, gestational age, birthweight, and cause of death. Detailed definitions for data items that are collected from the Facility Worksheet are in the “Guide to the Facility Worksheet” (9).
This report uses the latest fetal death data to present information on fetal deaths and fetal death rates by race and Hispanic origin, maternal age, tobacco use during pregnancy, plurality, sex of fetus, gestational age, birthweight, state of residence, and selected causes of death.
Race and Hispanic originThe 2003 revision of the U.S. Standard Report of Fetal Death
allows the reporting of more than one race (multiple races) for the mother (10) in accordance with the revised standards issued by the Office of Management and Budget (OMB) in 1997 (11). Starting in 2018, all 50 states and the District of Columbia, Puerto Rico, Guam, and Northern Marianas reported race data in accordance with these 1997 OMB standards, which allow for the reporting of a minimum of five race categories either by single race (reported alone) or in combination (more than one race or multiple races) (11). The race and Hispanic-origin groups shown in this report follow the 1997 standards and differ from the bridged-race categories shown in previous reports (1). The new categories are: non-Hispanic single-race white, non-Hispanic single-race black or African American, non-Hispanic single-race American Indian or Alaska Native (AIAN), non-Hispanic single-race Asian, non-Hispanic single-race Native Hawaiian or Other Pacific Islander (NHOPI), and Hispanic (for brevity in text, references to the race groups omit “single-race”).
Race and Hispanic origin are reported independently on the report of fetal death. Most tables in this report show data for the categories of non-Hispanic white, non-Hispanic black, and Hispanic. Selected tables also include data for the categories non-Hispanic AIAN, non-Hispanic Asian, and non-Hispanic NHOPI. Data are also presented in some tables for Hispanic subgroups: Mexican, Puerto Rican, Cuban, Central and South American, Dominican, and Other and unknown Hispanic. Data are presented separately for Dominican women for the first time beginning with the 2018 data year. Data for this subgroup had previously been included in the category Other and unknown Hispanic.
Fetal deaths by stateComparisons of fetal mortality rates by state can be affected
by differences in reporting requirements for fetal deaths among registration areas, particularly for fetal deaths occurring early in the reporting period (Technical Notes). Further, the small numbers of fetal deaths in some states by year can result in lack of reliability for state-specific fetal mortality rates. To try to address these issues, in addition to showing fetal mortality rates at 20 or more weeks by state for 2019, this report also presents fetal deaths and fetal mortality rates by state for fetal deaths at 24 or more weeks of gestation for the latest combined 3-year period (2017–2019).
Cause of deathNCHS codes the cause of fetal death reported by the certifier
using the International Classification of Diseases, 10th Revision (ICD–10) (12). In this report, the five frequently reported causes of death shown, including unspecified cause, are drawn from 45 causes in the List of 124 Selected Causes of Fetal Death as defined in Instruction manual, part 9 (13), and ranked according to the number of fetal deaths.
Data on the five causes of death are included for the 42 states and the District of Columbia that reported cause of death based on the 2003 revision of the U.S. Standard Report of Fetal Death and met the reporting requirement of having less than 50% of records assigned to unspecified cause (P95). This reporting area includes 15,636 fetal deaths, representing 72.8% of all fetal deaths in 2019. These statistics based on a subnational area are not generalizable to the entire United States. In tables and figures, the five selected causes are shown in descending order according to the number of deaths assigned to each cause.
Statistical significance Statements in this report have been tested for statistical
significance. A statement that a given mortality rate is higher or lower than another rate indicates that the rates are significantly different unless otherwise noted. For information on the methods used to test for statistical significance, as well as more detailed information on the collection, interpretation, and availability of fetal death data, see the 2019 User Guide.
Results
Trends in fetal mortality
• In 2019, 21,478 fetal deaths occurring at 20 or more weeks of gestation were reported in the United States, a decline of 4% from 2018 (22,459) (Table 1, Figure 1).
• The fetal mortality rate was 5.70 fetal deaths at 20 or more weeks of gestation per 1,000 live births and fetal deaths in 2019, down 3% from the 2018 rate of 5.89 and a record low for the nation (14). With minor fluctuations, the total U.S. fetal mortality rate has declined 24% since 1990 (7.49).
• The early fetal mortality rate (20–27 weeks of gestation) declined 4% from 2018 (3.11) to 2019 (2.98). This rate had remained generally unchanged from 2014 (3.16) to 2018 except for a decrease in 2017.
• The late fetal mortality rate (28 or more weeks of gestation) declined from 2018 (2.79) to 2019 (2.73), although this change was not significant. The late fetal mortality rate has been essentially unchanged since 2014 (2.83).
Race and Hispanic origin
• From 2018 to 2019, fetal mortality rates declined 4% for non-Hispanic white (from 4.89 to 4.71) and 5% for Hispanic (5.06 to 4.79) women. Declines in fetal mortality rates for

4 National Vital Statistics Reports, Vol. 70, No. 11, October 26, 2021
non-Hispanic black (10.64 to 10.41) and non-Hispanic Asian (4.26 to 4.02) women were not significant. Increases in rates for non-Hispanic AIAN (6.25 to 7.47) and non-Hispanic NHOPI (9.93 to 10.03) women were also not significant (Table 2, Figure 2).
• Among Hispanic-origin subgroups, fetal mortality rates declined 6% for Mexican (5.19 to 4.86) and 16% for Central and South American (4.90 to 4.12) women from 2018 to 2019. The decline in the fetal mortality rate for Dominican women (from 5.09 to 4.75) was not significant. Increases in rates for Puerto Rican, Cuban, and Other and unknown Hispanic women were also not significant (Table 3).
• In 2019, fetal mortality rates continued to vary by race and Hispanic origin; rates for non-Hispanic black (10.41) and non-Hispanic NHOPI (10.03) women were the highest among all race and Hispanic-origin groups, followed by the rate for non-Hispanic AIAN (7.47) women (the rate for non-Hispanic AIAN women was not significantly different from the rate for NHOPI women).
• The lowest rate was for non-Hispanic Asian women (4.02), followed by non-Hispanic white (4.71) and Hispanic (4.79) women.
• Among Hispanic-origin subgroups in 2019, rates ranged from 4.12 for Central and South American women to 5.29 for Other and unknown Hispanic women; however, differences among the groups were generally not significant (Table 3).
Maternal age
• In 2019, age-specific fetal mortality rates followed a J-shaped curve, with rates declining for each age group 15–19 (6.88 fetal deaths per 1,000 births and fetal deaths) through 30–34 (5.09), and then increasing among older women, reaching highs of 9.06 for women aged 40–44 and 9.79 for women aged 45 and over. The number of events was too small (fewer than 20 events in the numerator) to calculate a reliable rate for females under age 15 (Table 4).
• Rates for women aged 40–44 and 45 and over were nearly twice as high as the rate for women aged 30–34, the group with the lowest rate.
• Fetal mortality rates for teenagers aged 15–17 (7.23) and 18–19 (6.78) were 42% and 33% higher, respectively, than rates for women aged 30–34 (5.09).
• Rates by maternal age for the three largest race and Hispanic-origin groups also followed a J-shaped pattern.
• Among non-Hispanic white women, rates were lowest for women aged 25–29 and 30–34 (4.37 and 4.18, respectively); for non-Hispanic black and Hispanic women, rates were lowest for women aged 20–24 and 25–29 (9.84 and 9.50 for non-Hispanic black women, and 4.21 and 4.30 for Hispanic women).
• Age-specific rates for non-Hispanic black women were higher than those for non-Hispanic white and Hispanic women for those aged 15–44; rates for women aged 45 and
Figure 2. Fetal mortality rates, by race and Hispanic origin of mother: United States, 2018 and 2019
0
2
4
6
8
10
12
White Black Asian HispanicNative Hawaiian or Other Pacific Islander
4.795.06
4.024.26
10.039.93
4.71
7.47
6.25
10.4110.64
4.89
SOURCE: National Center for Health Statistics, National Vital Statistics System.
Rat
e pe
r 1,0
00 li
ve b
irths
and
feta
l dea
ths
in s
peci
fied
grou
p
American Indian or Alaska Native
Non-Hispanic
2018 2019

National Vital Statistics Reports, Vol. 70, No. 11, October 26, 2021 5
over were not significantly different. The number of events was too small (fewer than 20 events in the numerator) to calculate reliable rates for females under age 15 for all three race and Hispanic-origin groups.
Tobacco use during pregnancy
• The fetal mortality rate for women who smoked during pregnancy (8.52) was more than one and one-half times higher than that for women who did not smoke during pregnancy (5.06) (Table 5).
• The pattern was similar for the three largest race and Hispanic-origin groups. The fetal mortality rate for women who smoked during pregnancy compared with those who did not was more than one and one-half times higher for non-Hispanic white women (7.26 and 4.11, respectively) and non-Hispanic black women (15.03 and 9.50), and more than twice as high for Hispanic women (9.82 and 4.42). See Table 5 for fetal mortality rates by tobacco use during pregnancy by age.
Plurality
• The fetal mortality rate for twins (11.95) was more than twice that for singletons (5.47) (Table A). The rate for triplet or higher-order deliveries (25.50) was nearly five times that for singletons.
• The pattern was similar for the three largest race and Hispanic-origin groups. The fetal mortality rate for twins compared with singletons was more than twice as high for non-Hispanic white (10.01 and 4.50, respectively) and Hispanic (11.69 and 4.61) women, and nearly twice as high for non-Hispanic black (17.89 and 10.07) women. For non-Hispanic white women, the rate for triplet or higher-order deliveries (27.63) was more than six times that for
singletons. The number of events was too small (fewer than 20 events in the numerator) to calculate reliable rates for triplet or higher-order deliveries for non-Hispanic black and Hispanic women.
Sex of fetus
• In 2019, the fetal mortality rate for male fetuses was 5.84, which was 5% higher than for female fetuses (5.55) (Table A).
• The fetal mortality rate for male fetuses compared with female fetuses was 6% higher for both non-Hispanic white (4.84 and 4.57, respectively) and non-Hispanic black (10.72 and 10.09) women. No significant difference was seen for Hispanic (4.85 and 4.72) women.
Period of gestation
• In 2019, just over one-half (52.2%) of all fetal deaths at 20 or more weeks of gestation occurred at 20–27 weeks (early fetal deaths) and 47.8% occurred at 28 or more weeks of gestation (late fetal deaths) (Table 6).
• The fetal mortality rate was highest at 20–23 weeks of gestation (536.47), declined to a low at 39–40 (0.60) and 41 weeks of gestation (0.63), and then increased to 4.22 at 42 or more weeks of gestation.
Birthweight
• In 2019, more than one-third (36.5%) of fetal deaths at 20 or more weeks of gestation weighed less than 500 grams (1 lb. 1 oz.) at delivery, and nearly one-half (48.3%) weighed less than 750 grams (1 lb. 12 oz.) (Table 6).
• The fetal mortality rate was highest for fetuses weighing less than 500 grams (584.78) and decreased with increasing
Table A. Fetal mortality rates, by selected characteristics and race and Hispanic origin of mother: United States, 2019
Fetal mortality rates1 Fetal deaths Live births
Non-Hispanic, single race2
Non-Hispanic, single race2
Non-Hispanic, single race2
Characteristic All races3 White Black Hispanic4 All races3 White Black Hispanic4 All races3 White Black Hispanic4
Plurality . . . . . . . . . . . . . . . . 5.70 4.71 10.41 4.79 21,478 9,067 5,766 4,264 3,747,540 1,915,912 548,075 886,467 Single . . . . . . . . . . . . . . . . 5.47 4.50 10.07 4.61 19,937 8,367 5,339 3,998 3,623,963 1,850,036 525,089 864,066 Twin . . . . . . . . . . . . . . . . . 11.95 10.01 17.89 11.69 1,455 647 408 258 120,291 64,011 22,397 21,811 Triplet or higher . . . . . . . . 25.50 27.63 * * 86 53 19 8 3,286 1,865 589 590Sex of fetus . . . . . . . . . . . . . 5.70 4.71 10.41 4.79 21,478 9,067 5,766 4,264 3,747,540 1,915,912 548,075 886,467 Male . . . . . . . . . . . . . . . . . 5.84 4.84 10.72 4.85 11,268 4,779 3,018 2,207 1,917,446 981,620 278,494 452,492 Female . . . . . . . . . . . . . . . 5.55 4.57 10.09 4.72 10,210 4,288 2,748 2,057 1,830,094 934,292 269,581 433,975 Male–female ratio . . . . . . 1.05 1.06 1.06 1.03 … … … … … … … …
* Figure does not meet National Center for Health Statistics standards of reliability or precision; based on fewer than 20 fetal deaths in the numerator.… Category not applicable.1Rate per 1,000 live births and fetal deaths in specified group.2Race and Hispanic origin are reported separately on the report of fetal death; persons of Hispanic origin may be of any race. In this table, non-Hispanic women are classified by race. Race categories are consistent with the 1997 Office of Management and Budget standards; see Technical Notes. Single race is defined as only one race reported on the report of fetal death.3Includes fetal deaths to race and origin groups not shown separately.4Includes all persons of Hispanic origin of any race; see Technical Notes.
SOURCE: National Center for Health Statistics, National Vital Statistics System.

6 National Vital Statistics Reports, Vol. 70, No. 11, October 26, 2021
birthweight to a low of 0.57 for fetuses weighing 3,500–3,999 grams. Fetal mortality rates then increased slightly for fetuses weighing 4,000 or more grams (1.20).
Fetal mortality rates by state
• For combined years 2017–2019, the U.S. fetal mortality rate for fetal deaths at 24 or more weeks was 3.68 fetal deaths at 24 or more weeks of gestation per 1,000 live births and fetal deaths (Table B).
• For combined years 2017–2019, fetal mortality rates were highest (above 5.00) in the District of Columbia (5.07), Alabama (5.37), and Mississippi (6.60), and lowest (below 3.00) in New Mexico (2.39), Massachusetts (2.88), Texas (2.91), and Connecticut (2.92).
• See Table 7 for fetal deaths at 20 or more weeks of gestation by state for 2019.
Selected causes of fetal death
• Five selected causes of fetal death accounted for 89.9% of fetal deaths in the 42-state and District of Columbia reporting area (Table 8, Figure 3). By order of frequency, these were: a) Fetal death of unspecified cause (unspecified cause); b) Fetus affected by complications of placenta, cord and membranes (placental, cord, and membrane complications); c) Fetus affected by maternal complications of pregnancy (maternal complications); d) Fetus affected by maternal conditions that may be unrelated to present pregnancy (maternal conditions unrelated to pregnancy); and e) Congenital malformations, deformations and chromosomal abnormalities (congenital malformations).
• The five most common selected causes of fetal death and the top two causes were the same for non-Hispanic white, non-Hispanic black, and Hispanic women, while the ranking of the other causes differed (Table 8, Figure 3).
• Unspecified cause and placental, cord and membrane complications were the two most common of the selected causes for all three groups.
Area Fetal deaths Fetal mortality rate1
New Jersey . . . . . . . . . . . 1,111 3.66New Mexico . . . . . . . . . . 167 2.39New York . . . . . . . . . . . . 2,533 3.72North Carolina . . . . . . . . 1,583 4.40North Dakota . . . . . . . . . 113 3.54Ohio . . . . . . . . . . . . . . . . 1,712 4.19Oklahoma . . . . . . . . . . . . 551 3.68Oregon . . . . . . . . . . . . . . 409 3.19Pennsylvania . . . . . . . . . 1,604 3.92Rhode Island . . . . . . . . . 106 3.37
South Carolina . . . . . . . . 796 4.64South Dakota . . . . . . . . . 129 3.62Tennessee . . . . . . . . . . . . 1,034 4.25Texas . . . . . . . . . . . . . . . 3,319 2.91Utah . . . . . . . . . . . . . . . . 528 3.69Vermont . . . . . . . . . . . . . 50 3.03Virginia . . . . . . . . . . . . . . 970 3.25Washington . . . . . . . . . . 841 3.24West Virginia . . . . . . . . . 226 4.09Wisconsin . . . . . . . . . . . . 637 3.30Wyoming . . . . . . . . . . . . 64 3.19
American Samoa . . . . . . --- ---Guam . . . . . . . . . . . . . . . 98 10.21Northern Marianas . . . . . 19 *Puerto Rico . . . . . . . . . . 396 5.96Virgin Islands . . . . . . . . . --- ---
Area Fetal deaths Fetal mortality rate1
Total . . . . . . . . . . . . . . . . . . 42,112 3.68Alabama . . . . . . . . . . . . . 947 5.37Alaska . . . . . . . . . . . . . . . 126 4.13Arizona . . . . . . . . . . . . . . 965 3.97Arkansas . . . . . . . . . . . . . 544 4.87California . . . . . . . . . . . . 4,405 3.20Colorado . . . . . . . . . . . . . 614 3.22Connecticut . . . . . . . . . . 305 2.92Delaware . . . . . . . . . . . . . 139 4.32District of Columbia . . . . 142 5.07Florida . . . . . . . . . . . . . . 2,831 4.24
Georgia . . . . . . . . . . . . . . 1,770 4.61Hawaii . . . . . . . . . . . . . . . 190 3.69Idaho . . . . . . . . . . . . . . . 210 3.19Illinois . . . . . . . . . . . . . . . 1,528 3.51Indiana . . . . . . . . . . . . . . 935 3.81Iowa . . . . . . . . . . . . . . . . 355 3.11Kansas . . . . . . . . . . . . . . 381 3.51Kentucky . . . . . . . . . . . . . 643 3.96Louisiana . . . . . . . . . . . . 624 3.46Maine . . . . . . . . . . . . . . . 119 3.26
Maryland . . . . . . . . . . . . 863 4.04Massachusetts . . . . . . . . 603 2.88Michigan . . . . . . . . . . . . . 1,223 3.70Minnesota . . . . . . . . . . . . 701 3.46Mississippi . . . . . . . . . . . 737 6.60Missouri . . . . . . . . . . . . . 821 3.74Montana . . . . . . . . . . . . . 107 3.10Nebraska . . . . . . . . . . . . 263 3.45Nevada . . . . . . . . . . . . . . 426 3.98New Hampshire . . . . . . . 116 3.22
Table B. Fetal deaths at 24 or more weeks of gestation and fetal mortality rates, by state or territory: United States, 2017–2019
--- Data not available.* Figure does not meet National Center for Health Statistics standards of reliability or precision; based on fewer than 20 fetal deaths in the numerator.1Rate per 1,000 live births and specified fetal deaths.
NOTES: Fetal deaths with not-stated period of gestation were proportionally distributed to less than 24 weeks and 24 or more weeks; see Technical Notes. Numbers may not add to totals due to rounding.
SOURCE: National Center for Health Statistics, National Vital Statistics System.

National Vital Statistics Reports, Vol. 70, No. 11, October 26, 2021 7
• Congenital malformations was the third most commoncause for fetal deaths to non-Hispanic white women,followed by maternal complications and maternalconditions unrelated to pregnancy.
• Among non-Hispanic black women, maternalcomplications was the third most common cause offetal death, maternal conditions unrelated to pregnancywas fourth, and congenital malformations was fifth.
• Among Hispanic women, maternal complications wasthe third most common cause of fetal death, congenitalmalformations was fourth, and maternal conditionsunrelated to pregnancy was fifth.
References1. MacDorman MF, Gregory ECW. Fetal and perinatal mortality:
United States, 2013. National Vital Statistics Reports; vol 64no 8. Hyattsville, MD: National Center for Health Statistics.2015.
2. Centers for Disease Control and Prevention. CDC WONDER:Fetal deaths information. Available from: https://wonder.cdc.gov/fetal.html.
3. National Center for Health Statistics. User guide to the2019 fetal death public use file. Hyattsville, MD. 2021.Available from: https://ftp.cdc.gov/pub/Health_Statistics/NCHS/Dataset_Documentation/DVS/fetaldeath/2019FetalUserGuide.pdf.
4. Makelarski JA, Romitti PA, Caspers KM, PuzhankaraS, McDowell BD, Piper KN. Use of active surveillancemethodologies to examine over-reporting of stillbirths onfetal death certificates. Birth Defects Res A Clin Mol Teratol91(12):1004–10. 2011.
5. Heuser CC, Hunn J, Varner M, Hossain S, Vered S, SilverRM. Correlation between stillbirth vital statistics and medical records. Obstet Gynecol 116(6):1296–301. 2010.
6. Lydon-Rochelle MT, Cárdenas V, Nelson JL, Tomashek KM,Mueller BA, Easterling TR. Validity of maternal and perinatalrisk factors reported on fetal death certificates. Am J PublicHealth 95(11):1948–51. 2005.
7. National Center for Health Statistics. Patient’s worksheetfor the report of fetal death. 2019. Available from: https://www.cdc.gov/nchs/data/dvs/fetal-death-mother-worksheet-english-2019-508.pdf.
8. National Center for Health Statistics. Facility worksheet for the report of fetal death. 2019. Available from: https://www.cdc.gov/nchs/data/dvs/fetal-death-facility-worksheet-2019-508.pdf.
9. National Center for Health Statistics. Guide to completing the facility worksheets for the Certificate of Live Birth and Report of Fetal Death (2003 revision). Hyattsville, MD: NationalCenter for Health Statistics. 2019. Available from: https://www.cdc.gov/nchs/data/dvs/GuidetoCompleteFacilityWks.pdf.
All others
Maternal complications (P01)
Placental, cord and membrane complications (P02)
Maternal conditions unrelated to pregnancy (P00)
Congenital malformations (Q00–Q99)
Unspecified cause (P95)
Total
100
80
60
40
20
0Hispanic
30.2
23.1
14.1
9.3
11.6
11.8
30.1
25.6
15.1
13.6
9.2
6.4
32.6
26.3
10.4
9.2
9.7
11.8
31.3
25.5
12.5
10.3
10.0
10.3
NOTES: Codes in parentheses are cause-of-death codes as classified by the International Classification of Diseases, 10th Revision. Totals may not add to 100 due to rounding.SOURCE: National Center for Health Statistics, National Vital Statistics System.
Perc
ent
White Black
Non-Hispanic
Figure 3. Percent distribution of fetal deaths, by selected causes of death and race and Hispanic origin of mother: 42 states and the District of Columbia, 2019

8 National Vital Statistics Reports, Vol. 70, No. 11, October 26, 2021
10. National Center for Health Statistics. 2003 revision of the U.S. Standard Report of Fetal Death. Available from: https:// www.cdc.gov/nchs/data/dvs/FDEATH11-03finalACC.pdf.
11. Office of Management and Budget. Revisions to the standards for the classification of federal data on race and ethnicity. Fed Regist 62(210):58782–90. 1997.
12. World Health Organization. International statistical classification of diseases and related health problems, 10th revision (ICD–10). Geneva, Switzerland. 2009.
13. National Center for Health Statistics. Instruction manual, part 9: ICD–10 cause-of-death lists for tabulating mortality statistics (updated September 2020 to include WHO updates to ICD–10 for data year 2019). Available from: https://www. cdc.gov/nchs/data/dvs/Part9InstructionManual2019-508. pdf.
14. National Center for Health Statistics. Vital Statistics of the United States, 1993: Volume II – Mortality, Part A. Available from: https://www.cdc.gov/nchs/data/vsus/mort93_2a.pdf.
15. National Center for Health Statistics. Model State Vital Statistics Act and Regulations, 1992 Revision. Public Health Service. PHS 94–1115. Hyattsville, MD. 1994. Available from: https://www.cdc.gov/nchs/data/misc/mvsact92b.pdf.
16. Kowaleski J. State definitions and reporting requirements for live births, fetal deaths, and induced terminations of pregnancy (1997 revision). Hyattsville, MD: National Center for Health Statistics. 1997. Available from: https://www.cdc. gov/nchs/data/misc/itop97.pdf.
17. National Center for Health Statistics. Report of the Panel to Evaluate the U.S. Standard Certificates. 2000.
18. Hoyert DL. Perinatal mortality in the United States, 1985– 91. National Center for Health Statistics. Vital Health Stat 20(26). 1995. Available from: https://www.cdc.gov/nchs/ data/series/sr_20/sr20_026.pdf.
19. Office of Management and Budget. Race and ethnic standards for federal statistics and administrative reporting. Statistical Policy Directive No. 15. 1977.
20. Martin JA, Osterman MJK, Kirmeyer SE, Gregory ECW. Measuring gestational age in vital statistics data: Transitioning to the obstetric estimate. National Vital Statistics Reports; vol 64 no 5. Hyattsville, MD: National Center for Health Statistics. 2015.
21. National Center for Health Statistics. Editing specifications for fetal death records [unpublished]. Hyattsville, MD. 2020.
22. National Center for Health Statistics. User guide to the 2017 fetal death public use file. Hyattsville, MD. 2019. Available from: https://ftp.cdc.gov/pub/Health_Statistics/ NCHS/Dataset_Documentation/DVS/fetaldeath/2017Fetal UserGuide.pdf.
23. National Center for Health Statistics. User guide to the 2018 fetal death public use file. Hyattsville, MD. 2020. Available from: https://ftp.cdc.gov/pub/Health_Statistics/ NCHS/Dataset_Documentation/DVS/fetaldeath/2018Fetal UserGuide.pdf.
List of Detailed Tables 1. Number of fetal deaths and births and fetal mortality rates
for 1990–2019 and early and late fetal deaths and fetal mortality rates for 2014–2019: United States . . . . . . . . . . . 9
2. Fetal deaths and mortality rates, by race and Hispanic origin of mother: United States, 2018–2019 . . . . . . . . . . . . . . . . . 10
3. Fetal deaths and mortality rates, by Hispanic origin of mother: United States, 2018–2019 . . . . . . . . . . . . . . . . . . . 11
4. Total, early, and late fetal deaths and mortality rates, by race and Hispanic origin and age of mother: United States, 2019 12
5. Fetal mortality rates, by tobacco use during pregnancy, age, and race and Hispanic origin of mother: United States, 2019. . . . . . . . . . . . . . . . . . . . . . . . . . . . . . . . . . . . . . . . . . . 13
6. Fetal deaths and mortality rates, by birthweight, gestational age, and race and Hispanic origin of mother: United States, 2019. . . . . . . . . . . . . . . . . . . . . . . . . . . . . . . . . . . . . . . . . . . 14
7. Fetal deaths and mortality rates: United States and each state and territory, 2019 . . . . . . . . . . . . . . . . . . . . . . . . . . . . 16
8. Fetal deaths and percentage of total deaths for five selected causes, by race and Hispanic origin of mother: 42 states and the District of Columbia, 2019 . . . . . . . . . . . . . . . . . . . . . . . 17

National Vital Statistics Reports, Vol. 70, No. 11, October 26, 2021 9
Table 1. Number of fetal deaths and births and fetal mortality rates for 1990–2019 and early and late fetal deaths and fetal mortality rates for 2014–2019: United States
Fetal deaths Fetal mortality rate1
Year Total2 20–27 weeks3 28 or more weeks3 Live births Total2 20–27 weeks3 28 or more weeks3
2019. . . . . . . . . . . . . 21,478 11,216 10,262 3,747,540 5.70 2.98 2.732018. . . . . . . . . . . . . 22,459 11,844 10,615 3,791,712 5.89 3.11 2.792017. . . . . . . . . . . . . 22,827 11,861 10,966 3,855,500 5.89 3.07 2.842016. . . . . . . . . . . . . 23,880 12,486 11,394 3,945,875 6.02 3.15 2.882015. . . . . . . . . . . . . 23,776 12,407 11,369 3,978,497 5.94 3.11 2.8520144 . . . . . . . . . . . . 23,980 12,652 11,328 3,988,076 5.98 3.16 2.832013. . . . . . . . . . . . . 23,595 --- --- 3,932,181 5.96 --- ---2012. . . . . . . . . . . . . 24,073 --- --- 3,952,841 6.05 --- ---2011. . . . . . . . . . . . . 24,289 --- --- 3,953,590 6.11 --- ---2010. . . . . . . . . . . . . 24,258 --- --- 3,999,386 6.03 --- ---2009. . . . . . . . . . . . . 24,872 --- --- 4,130,665 5.99 --- ---2008. . . . . . . . . . . . . 26,335 --- --- 4,247,726 6.16 --- ---2007. . . . . . . . . . . . . 26,593 --- --- 4,316,233 6.12 --- ---2006. . . . . . . . . . . . . 25,972 --- --- 4,265,593 6.05 --- ---2005. . . . . . . . . . . . . 25,894 --- --- 4,138,573 6.22 --- ---2004. . . . . . . . . . . . . 26,001 --- --- 4,112,055 6.28 --- ---2003. . . . . . . . . . . . . 26,004 --- --- 4,090,007 6.32 --- ---2002. . . . . . . . . . . . . 25,943 --- --- 4,021,825 6.41 --- ---2001. . . . . . . . . . . . . 26,373 --- --- 4,026,036 6.51 --- ---2000. . . . . . . . . . . . . 27,003 --- --- 4,058,882 6.61 --- ---1995. . . . . . . . . . . . . 27,294 --- --- 3,899,589 6.95 --- ---1990. . . . . . . . . . . . . 31,386 --- --- 4,158,445 7.49 --- ---
--- Data not available.1Number of fetal deaths in specified group per 1,000 live births and fetal deaths.2Fetal deaths with stated or presumed period of gestation of 20 or more weeks.3Not stated gestational age proportionally distributed.4Beginning with the 2014 data year, the obstetric estimate of gestation at delivery replaces the measure based on the date of last normal menses as the standard for measuring gestational age; see Technical Notes.
SOURCE: National Center for Health Statistics, National Vital Statistics System.

10 National Vital Statistics Reports, Vol. 70, No. 11, October 26, 2021
Table 2. Fetal deaths and mortality rates, by race and Hispanic origin of mother: United States, 2018–2019
Non-Hispanic, single race1
YearAll races and
origins2 White BlackAmerican Indian or
Alaska Native Asian
Native Hawaiian or Other Pacific
Islander Hispanic3
Rate2019. . . . . . . . . . . . . 5.70 4.71 10.41 7.47 4.02 10.03 4.792018. . . . . . . . . . . . . 5.89 4.89 10.64 6.25 4.26 9.93 5.06
Number of deaths2019. . . . . . . . . . . . . 21,478 9,067 5,766 214 963 99 4,2642018. . . . . . . . . . . . . 22,459 9,621 5,938 183 1,029 95 4,510
1Race and Hispanic origin are reported separately on reports of fetal death; persons of Hispanic origin may be of any race. In this table, non-Hispanic women are classified by race. Race categories are consistent with the 1997 Office of Management and Budget standards. Single race is defined as only one race reported on the report of fetal death.2Includes fetal deaths to race and origin groups not shown separately.3Includes all persons of Hispanic origin of any race.
SOURCE: National Center for Health Statistics, National Vital Statistics System.

National Vital Statistics Reports, Vol. 70, No. 11, October 26, 2021 11
Table 3. Fetal deaths and mortality rates, by Hispanic origin of mother: United States, 2018–2019
Year Total Mexican Puerto Rican Cuban DominicanCentral and South
AmericanOther and unknown
Hispanic
Rate2019. . . . . . . . . . . . . 4.79 4.86 5.17 4.71 4.75 4.12 5.292018. . . . . . . . . . . . . 5.06 5.19 5.07 4.16 5.09 4.90 4.90
Number of deaths2019. . . . . . . . . . . . . 4,264 2,427 369 112 155 683 5182018. . . . . . . . . . . . . 4,510 2,587 365 98 164 726 570
NOTES: In this table, Hispanic women are classified only by place of origin; non-Hispanic women are not shown.
SOURCE: National Center for Health Statistics, National Vital Statistics System.

12 National Vital Statistics Reports, Vol. 70, No. 11, October 26, 2021
Table 4. Total, early, and late fetal deaths and mortality rates, by race and Hispanic origin and age of mother: United States, 2019
Race and Hispanic origin and age of mother
Fetal deaths Fetal mortality rate1
Total 20–27 weeks2 28 or more weeks2 Total 20–27 weeks2 28 or more weeks2
All races3 . . . . . . . . . . . . . . . . . . . . . . . . . 21,478 11,216 10,262 5.70 2.98 2.73Under 15 . . . . . . . . . . . . . . . . . . . . . . . 17 10 7 * * *15–19 . . . . . . . . . . . . . . . . . . . . . . . . . . 1,190 678 512 6.88 3.93 2.97
15–17 . . . . . . . . . . . . . . . . . . . . . . . . 299 181 118 7.23 4.39 2.8618–19 . . . . . . . . . . . . . . . . . . . . . . . . 891 497 394 6.78 3.79 3.01
20–24 . . . . . . . . . . . . . . . . . . . . . . . . . . 4,112 2,109 2,003 5.80 2.99 2.8425–29 . . . . . . . . . . . . . . . . . . . . . . . . . . 5,750 2,963 2,787 5.31 2.74 2.5830–34 . . . . . . . . . . . . . . . . . . . . . . . . . . 5,577 2,916 2,661 5.09 2.67 2.4435–39 . . . . . . . . . . . . . . . . . . . . . . . . . . 3,638 1,941 1,697 6.31 3.38 2.9540–44 . . . . . . . . . . . . . . . . . . . . . . . . . . 1,099 552 547 9.06 4.57 4.5345 and over . . . . . . . . . . . . . . . . . . . . . 95 49 46 9.79 5.07 4.76
Non-Hispanic, single race4:White . . . . . . . . . . . . . . . . . . . . . . . . . . 9,067 4,491 4,576 4.71 2.34 2.38
Under 15 . . . . . . . . . . . . . . . . . . . . . . 3 2 1 * * *15–19 . . . . . . . . . . . . . . . . . . . . . . . . 354 182 172 5.82 3.00 2.84
15–17 . . . . . . . . . . . . . . . . . . . . . . 73 44 29 6.12 3.70 2.4418–19 . . . . . . . . . . . . . . . . . . . . . . 281 138 143 5.75 2.83 2.93
20–24 . . . . . . . . . . . . . . . . . . . . . . . . 1,577 728 849 5.01 2.32 2.7025–29 . . . . . . . . . . . . . . . . . . . . . . . . 2,442 1,210 1,232 4.37 2.17 2.2130–34 . . . . . . . . . . . . . . . . . . . . . . . . 2,592 1,304 1,288 4.18 2.10 2.0835–39 . . . . . . . . . . . . . . . . . . . . . . . . 1,615 822 793 5.25 2.68 2.5940–44 . . . . . . . . . . . . . . . . . . . . . . . . 449 224 225 7.83 3.92 3.9445 and over . . . . . . . . . . . . . . . . . . . . 35 18 17 8.09 * *
Black . . . . . . . . . . . . . . . . . . . . . . . . . . . 5,766 3,227 2,539 10.41 5.85 4.61Under 15 . . . . . . . . . . . . . . . . . . . . . . 6 4 2 * * *15–19 . . . . . . . . . . . . . . . . . . . . . . . . 426 263 163 11.48 7.12 4.42
15–17 . . . . . . . . . . . . . . . . . . . . . . 113 72 41 12.08 7.73 4.4218–19 . . . . . . . . . . . . . . . . . . . . . . 313 191 122 11.27 6.91 4.42
20–24 . . . . . . . . . . . . . . . . . . . . . . . . 1,318 732 586 9.84 5.49 4.4025–29 . . . . . . . . . . . . . . . . . . . . . . . . 1,589 882 707 9.50 5.30 4.2530–34 . . . . . . . . . . . . . . . . . . . . . . . . 1,354 742 612 10.60 5.84 4.8235–39 . . . . . . . . . . . . . . . . . . . . . . . . 809 460 349 11.72 6.70 5.0940–44 . . . . . . . . . . . . . . . . . . . . . . . . 242 130 112 14.36 7.77 6.7045 and over . . . . . . . . . . . . . . . . . . . . 22 14 8 15.35 * *
Hispanic5 . . . . . . . . . . . . . . . . . . . . . . . . . 4,264 2,240 2,024 4.79 2.52 2.28Under 15 . . . . . . . . . . . . . . . . . . . . . . . 4 2 2 * * *15–19 . . . . . . . . . . . . . . . . . . . . . . . . . . 304 175 129 4.83 2.79 2.05
15–17 . . . . . . . . . . . . . . . . . . . . . . . . 84 53 31 4.89 3.09 1.8118–19 . . . . . . . . . . . . . . . . . . . . . . . . 220 122 98 4.81 2.67 2.15
20–24 . . . . . . . . . . . . . . . . . . . . . . . . . . 878 471 407 4.21 2.26 1.9625–29 . . . . . . . . . . . . . . . . . . . . . . . . . . 1,108 554 554 4.30 2.16 2.1630–34 . . . . . . . . . . . . . . . . . . . . . . . . . . 972 524 448 4.62 2.50 2.1435–39 . . . . . . . . . . . . . . . . . . . . . . . . . . 712 381 331 5.98 3.21 2.7940–44 . . . . . . . . . . . . . . . . . . . . . . . . . . 263 125 138 8.84 4.22 4.6645 and over . . . . . . . . . . . . . . . . . . . . . 23 8 15 11.83 * *
* Figure does not meet National Center for Health Statistics standards of reliability or precision; based on fewer than 20 fetal deaths in the numerator.1Rate per 1,000 live births and fetal deaths in specified group.2Fetal deaths with gestational age not stated were proportionally distributed; see Technical Notes.3Includes fetal deaths to race and origin groups not shown separately.4Race and Hispanic origin are reported separately on reports of fetal death; persons of Hispanic origin may be of any race. In this table, non-Hispanic women are classified by race. Race categories are consistent with the 1997 Office of Management and Budget standards; see Technical Notes. Single race is defined as only one race reported on the report of fetal death.5Includes all persons of Hispanic origin of any race.
SOURCE: National Center for Health Statistics, National Vital Statistics System.

National Vital Statistics Reports, Vol. 70, No. 11, October 26, 2021 13
Table 5. Fetal mortality rates, by tobacco use during pregnancy, age, and race and Hispanic origin of mother: United States, 2019
Tobacco use during pregnancy and race and Hispanic origin of mother
Fetal deaths All ages Under 20 20–24 25–29 30–34 35–39 40–54 Not stated
All races and origins1 Number Fetal mortality rate2 Number
Total . . . . . . . . . . . . . . . . . . . . . . . . . 21,478 5.70 6.91 5.80 5.31 5.09 6.31 9.12 1,737
Yes . . . . . . . . . . . . . . . . . . . . . . . . . 1,909 8.52 6.61 7.04 7.57 8.93 13.63 15.85 …No . . . . . . . . . . . . . . . . . . . . . . . . . . 17,832 5.06 6.36 5.26 4.68 4.51 5.48 8.03 …
Non-Hispanic, single race3
White:Total . . . . . . . . . . . . . . . . . . . . . . . 9,067 4.71 5.83 5.01 4.37 4.18 5.25 7.85 661
Yes . . . . . . . . . . . . . . . . . . . . . . . . 1,225 7.26 5.76 6.54 6.36 7.56 10.96 13.42 …No . . . . . . . . . . . . . . . . . . . . . . . . . 7,181 4.11 5.38 4.42 3.80 3.64 4.52 6.91 …
Black:Total . . . . . . . . . . . . . . . . . . . . . . . 5,766 10.41 11.46 9.84 9.50 10.60 11.72 14.44 397
Yes . . . . . . . . . . . . . . . . . . . . . . . . 399 15.03 * 12.72 14.19 14.51 20.78 * …No . . . . . . . . . . . . . . . . . . . . . . . . . 4,970 9.50 10.57 9.03 8.61 9.67 10.70 13.07 …
Hispanic4
Total . . . . . . . . . . . . . . . . . . . . . . . . . 4,264 4.79 4.83 4.21 4.30 4.62 5.98 9.02 271
Yes . . . . . . . . . . . . . . . . . . . . . . . . . . 133 9.82 * 6.74 7.58 9.84 22.52 * …No . . . . . . . . . . . . . . . . . . . . . . . . . . 3,860 4.42 4.53 3.93 4.00 4.27 5.36 8.19 …
… Category not applicable.* Figure does not meet National Center for Health Statistics standards of reliability or precision; based on fewer than 20 fetal deaths in the numerator.1Includes fetal deaths to race and origin groups not shown separately.2Rate per 1,000 live births and fetal deaths in specified group.3Race and Hispanic origin are reported separately on the report of fetal death; persons of Hispanic origin may be of any race. In this table, non-Hispanic women are classified by race. Race categories are consistent with the 1997 Office of Management and Budget standards; see Technical Notes. Single race is defined as only one race reported on the report of fetal death.4Includes all persons of Hispanic origin of any race; see Technical Notes.
SOURCE: National Center for Health Statistics, National Vital Statistics System.

14
National Vital Statistics Reports, Vol. 70, No. 11, October 26, 2021Table 6. Fetal deaths and mortality rates, by birthweight, gestational age, and race and Hispanic origin of mother: United States, 2019
Birthweight (grams) and race and Hispanic origin of mother Total
Gestational age (weeks)Fetal mortality
rate120–23 24–27 28–31 32–33 34–36 37–38 39–40 41 42 or more Not stated
All races2 . . . . . . . . . . . . . . . . . . . . 21,478 7,892 3,267 2,625 1,506 2,636 2,002 1,277 123 40 110 5.70Less than 500 . . . . . . . . . . . . . . . 7,308 5,881 1,110 197 30 34 29 10 – – 17 584.78500–749 . . . . . . . . . . . . . . . . . . . 2,343 961 1,041 274 30 25 5 1 – – 6 210.78750–999 . . . . . . . . . . . . . . . . . . . 1,386 173 598 486 74 37 9 4 – – 5 121.031,000–1,249 . . . . . . . . . . . . . . . . 1,015 50 187 549 138 67 17 2 1 – 4 76.161,250–1,499 . . . . . . . . . . . . . . . . 905 24 65 461 198 128 24 1 – – 4 55.531,500–1,999 . . . . . . . . . . . . . . . . 1,736 23 34 433 571 499 130 32 – 2 12 27.582,000–2,499 . . . . . . . . . . . . . . . . 1,641 – 12 77 296 834 304 95 11 3 9 8.212,500–2,999 . . . . . . . . . . . . . . . . 1,581 – 8 16 71 562 628 271 9 9 7 2.213,000–3,499 . . . . . . . . . . . . . . . . 1,191 – – 5 22 197 472 442 44 6 3 0.813,500–3,999 . . . . . . . . . . . . . . . . 560 – – – 2 76 170 265 35 9 3 0.574,000 or more . . . . . . . . . . . . . . 336 – – – 4 50 139 113 18 7 5 1.20Not stated . . . . . . . . . . . . . . . . . . 1,476 780 212 127 70 127 75 41 5 4 35 …
Fetal mortality rate1 . . . . . . . . . . 5.70 536.47 164.60 70.24 32.91 9.35 1.95 0.60 0.63 4.22 … …
Non-Hispanic, single race3:White . . . . . . . . . . . . . . . . . . . . . 9,067 3,158 1,317 1,088 681 1,167 892 643 68 21 32 4.71
Less than 500 . . . . . . . . . . . . . 2,920 2,341 450 81 12 12 19 3 – – 2 647.88500–749 . . . . . . . . . . . . . . . . . 890 362 391 112 9 12 3 – – – 1 232.80750–999 . . . . . . . . . . . . . . . . . 601 94 245 194 39 20 4 3 – – 2 139.411,000–1,249 . . . . . . . . . . . . . . 417 22 78 226 56 23 10 1 1 – – 79.471,250–1,499 . . . . . . . . . . . . . . 372 10 29 183 90 49 10 – – – 1 55.071,500–1,999 . . . . . . . . . . . . . . 764 11 22 199 253 207 52 14 – 1 5 27.952,000–2,499 . . . . . . . . . . . . . . 741 – 6 40 143 365 122 52 8 1 4 8.552,500–2,999 . . . . . . . . . . . . . . 747 – 2 7 33 288 295 114 2 4 2 2.383,000–3,499 . . . . . . . . . . . . . . 571 – – 2 10 88 211 229 26 4 1 0.783,500–3,999 . . . . . . . . . . . . . . 306 – – – 2 37 86 158 16 6 1 0.544,000 or more . . . . . . . . . . . . . 127 – – – 1 19 41 50 12 3 1 0.72Not stated . . . . . . . . . . . . . . . . 611 318 94 44 33 47 39 19 3 2 12 …
Fetal mortality rate1 . . . . . . . . . 4.71 593.61 181.50 68.76 32.44 8.65 1.82 0.57 0.61 3.42 … …
Black . . . . . . . . . . . . . . . . . . . . . . 5,766 2,264 952 762 398 665 453 231 18 4 19 10.41Less than 500 . . . . . . . . . . . . . 2,207 1,762 348 63 9 10 5 4 – – 6 530.40500–749 . . . . . . . . . . . . . . . . . 689 259 326 82 14 4 1 1 – – 2 181.79750–999 . . . . . . . . . . . . . . . . . 380 32 158 165 13 10 2 – – – – 105.731,000–1,249 . . . . . . . . . . . . . . 281 14 41 160 39 22 5 – – – – 71.011,250–1,499 . . . . . . . . . . . . . . 249 6 17 136 54 31 4 1 – – – 56.681,500–1,999 . . . . . . . . . . . . . . 473 6 6 103 168 146 32 10 – – 2 30.062,000–2,499 . . . . . . . . . . . . . . 387 – 3 12 65 219 75 10 1 – 2 8.322,500–2,999 . . . . . . . . . . . . . . 335 – 2 3 16 117 142 52 2 1 – 2.373,000–3,499 . . . . . . . . . . . . . . 236 – – – 3 46 106 78 2 1 – 1.133,500–3,999 . . . . . . . . . . . . . . 101 – – – – 18 27 47 9 – – 1.024,000 or more . . . . . . . . . . . . . 79 – – – – 10 43 18 4 2 2 3.49Not stated . . . . . . . . . . . . . . . . 349 185 51 38 17 32 11 10 – – 5 …
Fetal mortality rate1 . . . . . . . . . 10.41 483.24 150.47 78.65 39.01 12.68 2.71 0.83 * * … …
See footnotes at end of table.

National Vital Statistics Reports, Vol. 70, No. 11, October 26, 2021
15Table 6. Fetal deaths and mortality rates, by birthweight, gestational age, and race and Hispanic origin of mother: United States, 2019—Con.
Birthweight (grams) and race and Hispanic origin of mother Total
Gestational age (weeks)Fetal mortality
rate120–23 24–27 28–31 32–33 34–36 37–38 39–40 41 42 or more Not stated
Hispanic4 . . . . . . . . . . . . . . . . . . . . 4,264 1,593 633 496 262 531 433 256 24 10 26 4.79Less than 500 . . . . . . . . . . . . . . . 1,457 1,204 196 34 4 8 5 2 – – 4 568.70500–749 . . . . . . . . . . . . . . . . . . . 487 212 204 55 6 8 – – – – 2 201.74750–999 . . . . . . . . . . . . . . . . . . . 274 38 127 86 14 4 1 1 – – 3 110.391,000–1,249 . . . . . . . . . . . . . . . . 200 9 49 101 24 14 1 1 – – 1 69.541,250–1,499 . . . . . . . . . . . . . . . . 185 5 15 93 32 34 5 – – – 1 52.981,500–1,999 . . . . . . . . . . . . . . . . 311 3 3 78 98 90 32 5 – 1 1 23.602,000–2,499 . . . . . . . . . . . . . . . . 332 – – 14 55 166 72 21 – 2 2 7.692,500–2,999 . . . . . . . . . . . . . . . . 310 – 2 4 16 104 115 61 5 2 1 1.823,000–3,499 . . . . . . . . . . . . . . . . 272 – – 3 6 42 117 88 13 1 2 0.753,500–3,999 . . . . . . . . . . . . . . . . 98 – – – – 17 31 43 4 2 1 0.434,000 or more . . . . . . . . . . . . . . 86 – – – – 16 39 28 1 1 1 1.43Not stated . . . . . . . . . . . . . . . . . . 252 122 37 28 7 28 15 6 1 1 7 …
Fetal mortality rate1 . . . . . . . . . . 4.79 508.78 142.92 60.52 26.05 8.07 1.70 0.51 0.58 * … …
– Quantity zero.… Category not applicable.* Figure does not meet National Center for Health Statistics standards of reliability or precision; based on fewer than 20 fetal deaths in the numerator.1Rate per 1,000 live births and fetal deaths in specified group.2Includes fetal deaths to race and origin groups not shown separately.3Race and Hispanic origin are reported separately on the report of fetal death; persons of Hispanic origin may be of any race. In this table, non-Hispanic women are classified by race. Race categories are consistent with the 1997 Office of Management and Budget standards; see Technical Notes. Single race is defined as only one race reported on the report of fetal death.4Includes all persons of Hispanic origin of any race; see Technical Notes.
SOURCE: National Center for Health Statistics, National Vital Statistics System.
16 National Vital Statistics Reports, Vol. 70, No. 11, October 26, 2021
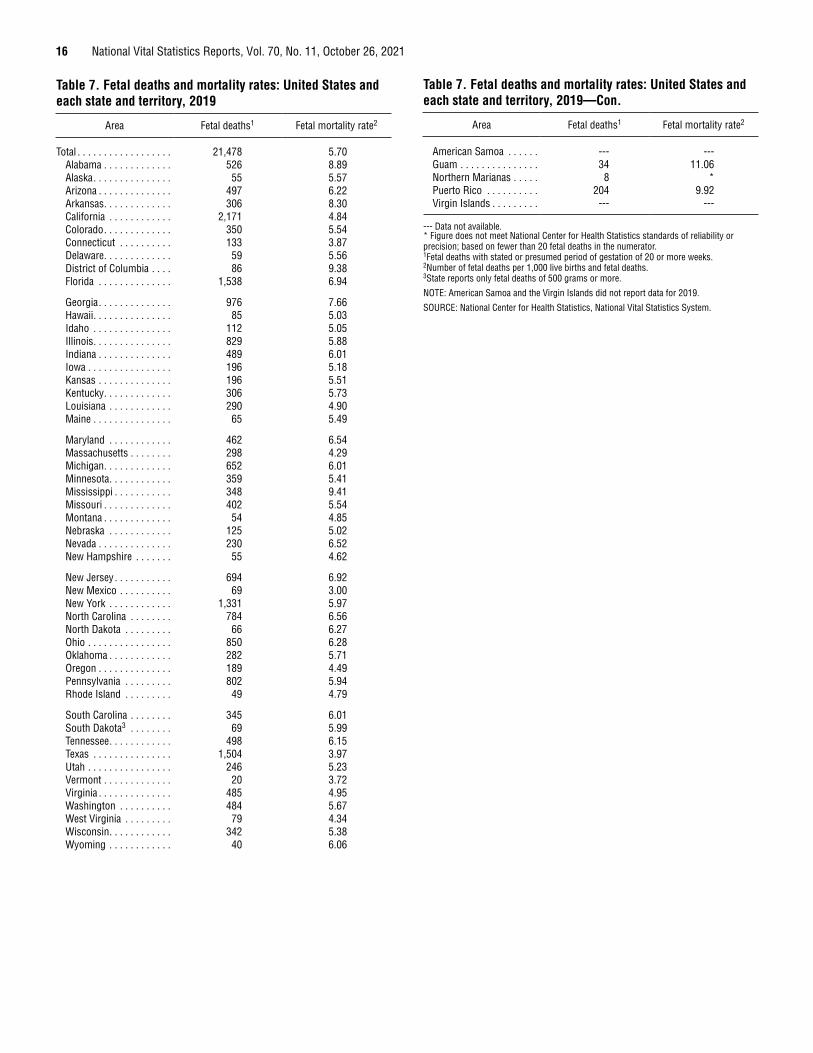
Table 7. Fetal deaths and mortality rates: United States and each state and territory, 2019
Area Fetal deaths1 Fetal mortality rate2
Total . . . . . . . . . . . . . . . . . . 21,478 5.70Alabama . . . . . . . . . . . . . 526 8.89Alaska . . . . . . . . . . . . . . . 55 5.57Arizona . . . . . . . . . . . . . . 497 6.22Arkansas . . . . . . . . . . . . . 306 8.30California . . . . . . . . . . . . 2,171 4.84Colorado . . . . . . . . . . . . . 350 5.54Connecticut . . . . . . . . . . 133 3.87Delaware . . . . . . . . . . . . . 59 5.56District of Columbia . . . . 86 9.38Florida . . . . . . . . . . . . . . 1,538 6.94
Georgia . . . . . . . . . . . . . . 976 7.66Hawaii . . . . . . . . . . . . . . . 85 5.03Idaho . . . . . . . . . . . . . . . 112 5.05Illinois . . . . . . . . . . . . . . . 829 5.88Indiana . . . . . . . . . . . . . . 489 6.01Iowa . . . . . . . . . . . . . . . . 196 5.18Kansas . . . . . . . . . . . . . . 196 5.51Kentucky . . . . . . . . . . . . . 306 5.73Louisiana . . . . . . . . . . . . 290 4.90Maine . . . . . . . . . . . . . . . 65 5.49
Maryland . . . . . . . . . . . . 462 6.54Massachusetts . . . . . . . . 298 4.29Michigan . . . . . . . . . . . . . 652 6.01Minnesota . . . . . . . . . . . . 359 5.41Mississippi . . . . . . . . . . . 348 9.41Missouri . . . . . . . . . . . . . 402 5.54Montana . . . . . . . . . . . . . 54 4.85Nebraska . . . . . . . . . . . . 125 5.02Nevada . . . . . . . . . . . . . . 230 6.52New Hampshire . . . . . . . 55 4.62
New Jersey . . . . . . . . . . . 694 6.92New Mexico . . . . . . . . . . 69 3.00New York . . . . . . . . . . . . 1,331 5.97North Carolina . . . . . . . . 784 6.56North Dakota . . . . . . . . . 66 6.27Ohio . . . . . . . . . . . . . . . . 850 6.28Oklahoma . . . . . . . . . . . . 282 5.71Oregon . . . . . . . . . . . . . . 189 4.49Pennsylvania . . . . . . . . . 802 5.94Rhode Island . . . . . . . . . 49 4.79
South Carolina . . . . . . . . 345 6.01South Dakota3 . . . . . . . . 69 5.99Tennessee . . . . . . . . . . . . 498 6.15Texas . . . . . . . . . . . . . . . 1,504 3.97Utah . . . . . . . . . . . . . . . . 246 5.23Vermont . . . . . . . . . . . . . 20 3.72Virginia . . . . . . . . . . . . . . 485 4.95Washington . . . . . . . . . . 484 5.67West Virginia . . . . . . . . . 79 4.34Wisconsin . . . . . . . . . . . . 342 5.38Wyoming . . . . . . . . . . . . 40 6.06
Table 7. Fetal deaths and mortality rates: United States and each state and territory, 2019—Con.
Area Fetal deaths1 Fetal mortality rate2
American Samoa . . . . . . --- ---Guam . . . . . . . . . . . . . . . 34 11.06Northern Marianas . . . . . 8 *Puerto Rico . . . . . . . . . . 204 9.92Virgin Islands . . . . . . . . . --- ---
--- Data not available.* Figure does not meet National Center for Health Statistics standards of reliability or precision; based on fewer than 20 fetal deaths in the numerator.1Fetal deaths with stated or presumed period of gestation of 20 or more weeks.2Number of fetal deaths per 1,000 live births and fetal deaths.3State reports only fetal deaths of 500 grams or more.
NOTE: American Samoa and the Virgin Islands did not report data for 2019.
SOURCE: National Center for Health Statistics, National Vital Statistics System.

National Vital Statistics Reports, Vol. 70, No. 11, October 26, 2021 17
Table 8. Fetal deaths and percentage of total deaths for five selected causes, by race and Hispanic origin of mother: 42 states and the District of Columbia, 2019
Rank Cause and race and Hispanic origin of mother Deaths Percent
All races and origins1
… All causes . . . . . . . . . . . . . . . . . . . . . . . . . . . . . . . . . . . . . . . . . . . . . . . . . . . . . . . . . . . . . . . . . . . . . . . . . . . . . . . . . . . . . . . . 15,636 100.0
1 Fetal death of unspecified cause (P95) . . . . . . . . . . . . . . . . . . . . . . . . . . . . . . . . . . . . . . . . . . . . . . . . . . . . . . . . . . . . . . . . . 4,899 31.32 Fetus affected by complications of placenta, cord and membranes (P02) . . . . . . . . . . . . . . . . . . . . . . . . . . . . . . . . . . . . . . . 3,981 25.53 Fetus affected by maternal complications of pregnancy (P01) . . . . . . . . . . . . . . . . . . . . . . . . . . . . . . . . . . . . . . . . . . . . . . . . 1,960 12.54 Fetus affected by maternal conditions that may be unrelated to present pregnancy (P00) . . . . . . . . . . . . . . . . . . . . . . . . . . 1,614 10.35 Congenital malformations, deformations and chromosomal abnormalities (Q00–Q99) . . . . . . . . . . . . . . . . . . . . . . . . . . . . . 1,613 10.3… All other causes . . . . . . . . . . . . . . . . . . . . . . . . . . . . . . . . . . . . . . . . . . . . . . . . . . . . . . . . . . . . . . . . . . . . . . . . . . . . . . . . . . . 1,569 10.0
Non-Hispanic, single race white2
… All causes . . . . . . . . . . . . . . . . . . . . . . . . . . . . . . . . . . . . . . . . . . . . . . . . . . . . . . . . . . . . . . . . . . . . . . . . . . . . . . . . . . . . . . . . 7,274 100.0
1 Fetal death of unspecified cause (P95) . . . . . . . . . . . . . . . . . . . . . . . . . . . . . . . . . . . . . . . . . . . . . . . . . . . . . . . . . . . . . . . . . 2,374 32.62 Fetus affected by complications of placenta, cord and membranes (P02) . . . . . . . . . . . . . . . . . . . . . . . . . . . . . . . . . . . . . . . 1,915 26.33 Congenital malformations, deformations and chromosomal abnormalities (Q00–Q99) . . . . . . . . . . . . . . . . . . . . . . . . . . . . . 859 11.84 Fetus affected by maternal complications of pregnancy (P01) . . . . . . . . . . . . . . . . . . . . . . . . . . . . . . . . . . . . . . . . . . . . . . . . 755 10.45 Fetus affected by maternal conditions that may be unrelated to present pregnancy (P00) . . . . . . . . . . . . . . . . . . . . . . . . . . 668 9.2… All other causes . . . . . . . . . . . . . . . . . . . . . . . . . . . . . . . . . . . . . . . . . . . . . . . . . . . . . . . . . . . . . . . . . . . . . . . . . . . . . . . . . . . 703 9.7
Non-Hispanic, single race black2
… All causes . . . . . . . . . . . . . . . . . . . . . . . . . . . . . . . . . . . . . . . . . . . . . . . . . . . . . . . . . . . . . . . . . . . . . . . . . . . . . . . . . . . . . . . . 4,006 100.0
1 Fetal death of unspecified cause (P95) . . . . . . . . . . . . . . . . . . . . . . . . . . . . . . . . . . . . . . . . . . . . . . . . . . . . . . . . . . . . . . . . . 1,204 30.12 Fetus affected by complications of placenta, cord and membranes (P02) . . . . . . . . . . . . . . . . . . . . . . . . . . . . . . . . . . . . . . . 1,027 25.63 Fetus affected by maternal complications of pregnancy (P01) . . . . . . . . . . . . . . . . . . . . . . . . . . . . . . . . . . . . . . . . . . . . . . . . 606 15.14 Fetus affected by maternal conditions that may be unrelated to present pregnancy (P00) . . . . . . . . . . . . . . . . . . . . . . . . . . 546 13.65 Congenital malformations, deformations and chromosomal abnormalities (Q00–Q99) . . . . . . . . . . . . . . . . . . . . . . . . . . . . . 255 6.4… All other causes . . . . . . . . . . . . . . . . . . . . . . . . . . . . . . . . . . . . . . . . . . . . . . . . . . . . . . . . . . . . . . . . . . . . . . . . . . . . . . . . . . . 368 9.2
Hispanic3
… All causes . . . . . . . . . . . . . . . . . . . . . . . . . . . . . . . . . . . . . . . . . . . . . . . . . . . . . . . . . . . . . . . . . . . . . . . . . . . . . . . . . . . . . . . . 2,798 100.0
1 Fetal death of unspecified cause (P95) . . . . . . . . . . . . . . . . . . . . . . . . . . . . . . . . . . . . . . . . . . . . . . . . . . . . . . . . . . . . . . . . . 845 30.22 Fetus affected by complications of placenta, cord and membranes (P02) . . . . . . . . . . . . . . . . . . . . . . . . . . . . . . . . . . . . . . . 645 23.13 Fetus affected by maternal complications of pregnancy (P01) . . . . . . . . . . . . . . . . . . . . . . . . . . . . . . . . . . . . . . . . . . . . . . . . 394 14.14 Congenital malformations, deformations and chromosomal abnormalities (Q00–Q99) . . . . . . . . . . . . . . . . . . . . . . . . . . . . . 329 11.85 Fetus affected by maternal conditions that may be unrelated to present pregnancy (P00) . . . . . . . . . . . . . . . . . . . . . . . . . . 260 9.3… All other causes . . . . . . . . . . . . . . . . . . . . . . . . . . . . . . . . . . . . . . . . . . . . . . . . . . . . . . . . . . . . . . . . . . . . . . . . . . . . . . . . . . . 325 11.6
… Category not applicable.1Includes fetal deaths to race and origin groups not shown separately.2Race and Hispanic origin are reported separately on the report of fetal death; persons of Hispanic origin may be of any race. In this table, non-Hispanic women are classified by race. Race categories are consistent with the 1997 Office of Management and Budget standards; see Technical Notes. Single race is defined as only one race reported on the report of fetal death.3Includes all persons of Hispanic origin of any race; see Technical Notes.
NOTES: Excludes data for jurisdictions (Georgia, Hawaii, Michigan, Mississippi, New York City, North Carolina, North Dakota, and Vermont) for which the cause of death was unspecified (P95) for 50% or more of records. Also excludes data for California, which did not report cause of death based on the 2003 revision of the U.S. Standard Report of Fetal Death. Totals may not add to 100 due to rounding.
SOURCE: National Center for Health Statistics, National Vital Statistics System.

18 National Vital Statistics Reports, Vol. 70, No. 11, October 26, 2021
Technical Notes
Definition of fetal deathFetal death means death prior to the complete expulsion or
extraction from its mother of a product of human conception, irrespective of the duration of pregnancy and which is not an induced termination of pregnancy. The death is indicated by the fact that after such expulsion or extraction, the fetus does not breathe or show any other evidence of life such as beating of the heart, pulsation of the umbilical cord, or definite movement of voluntary muscles. Heartbeats are to be distinguished from transient cardiac contractions; respirations are to be distinguished from fleeting respiratory efforts or gasps.
This definition (15) has been adopted by the Centers for Disease Control and Prevention’s (CDC) National Center for Health Statistics (NCHS) as the nationally recommended standard and is based on the definition published by the World Health Organization in 1950 and revised in 1988. The term fetal death is defined on an all-inclusive basis to end confusion arising from the use of such terms as stillbirth, spontaneous abortion, and miscarriage. All U.S. states and registration areas have definitions similar to the standard definition, except for Puerto Rico and Wisconsin, which have no formal definition (16). Fetal deaths do not include induced terminations of pregnancy.
Reporting requirements for fetal death data Variation exists among states in reporting requirements
(3) and possibly in completeness of reporting for fetal death data, and this can have important implications for comparisons of fetal mortality rates by state. The majority of states require reporting of fetal deaths at 20 or more weeks of gestation, or a minimum birthweight of 350 grams (roughly equal to 20 weeks), or some combination of the two. However, six states, New York City, American Samoa, and the U.S. Virgin Islands require reporting of fetal deaths at all periods of gestation, two states require reporting beginning at 12 weeks of gestation, and one state requires reporting beginning at 16 weeks of gestation. At the other end of the spectrum, one state (South Dakota) requires reporting of fetal deaths with birthweights of 500 or more grams (roughly equal to 22 weeks of gestation). Areas that report fetal deaths at all periods of gestation appear to have a higher percentage of fetal deaths occurring at 20–27 weeks of gestation than those that begin reporting at later gestational ages. Table B presents fetal mortality rates for fetal deaths at 24 or more weeks of gestation for a combined 3-year period to better account for state differences in reporting requirements and to improve on the reliability of rates based on smaller numbers. Aside from this one exception, this report presents data on fetal deaths with a stated or presumed period of gestation of 20 or more weeks.
Percentage of unknown responses In the tables in this report, unknown responses are shown
in frequencies tables but are excluded from the computation of percent distributions and fetal mortality rates. Thus, rates published in this report by variables with a substantial percentage
of unknown responses (such as birthweight) may understate the true rates of fetal mortality for that characteristic.
2003 revision of U.S. Standard Report of Fetal Death
Data for 2018 and 2019 presented in this report are based on the 2003 revision of the U.S. Standard Report of Fetal Death; data for earlier years are based on both the 1989 and the 2003 fetal death report revisions. The 2003 revision is described in detail elsewhere (17).
Computation of rates Fetal mortality rates in this report are computed as the
number of fetal deaths at 20 or more weeks of gestation per 1,000 live births and fetal deaths at 20 or more weeks. The denominators for all fetal mortality rates are live births plus fetal deaths in the specified gestational age group, thus representing the population at risk of the event.
Fetal mortality rate = Fetal deaths at 20 or more weeks of gestation
× 1,000Live births and fetal deaths at 20 or more weeks
In each case, the fetal deaths included in the denominator of each rate mirror the fetal deaths included in the numerator. A previous NCHS report (18) contains information on the historical development of various perinatal measures. An asterisk (*) is shown in place of any rate based on fewer than 20 fetal deaths in the numerator.
Hispanic origin and raceHispanic origin
Hispanic origin and race are reported separately on the report of fetal death. Data are presented in some tables for specific Hispanic subgroups: Mexican, Puerto Rican, Cuban, Central and South American, Dominican, and Other and unknown Hispanic. Data are presented separately for Dominican women for the first time beginning in 2018. Data for this subgroup had previously been included in the category Other and unknown Hispanic. In tabulations of fetal death data by race and Hispanic origin, data for persons of Hispanic origin are not further classified by race because the vast majority of fetal deaths to Hispanic women are reported as white.
Race
This report presents data on race and Hispanic origin based on the 1997 Office of Management and Budget (OMB) standards (11). The 2003 revision of the U.S. Standard Report of Fetal Death allows the reporting of the five race categories either alone (single race) or in combination (more than one race or multiple races) for the mother (10), in accordance with OMB’s 1997 revised standards (11). The five categories for race specified in the revised standards are: American Indian or Alaska Native (AIAN), Asian, Black or African American, Native Hawaiian or Other Pacific Islander (NHOPI), and White.

National Vital Statistics Reports, Vol. 70, No. 11, October 26, 2021 19
Beginning in 2018, all states and the District of Columbia, in addition to Puerto Rico, Guam, and Northern Marianas, were reporting race on fetal death reports according to the 1997 revised OMB standards. In 2019, 2.2% of women in the United States reported more than one race. Before this time, the number of states that reported multiple-race information varied widely, increasing from 1 state in 2003 to the 50 states, the District of Columbia, and all territories except American Samoa and the U.S. Virgin Islands in 2018. Data from American Samoa and the U.S. Virgin Islands still follow the 1977 OMB standards (19).
Period of gestationBeginning with the 2014 data year, NCHS began using the
obstetric estimate of gestation at delivery (OE) as the primary measure for estimating gestational age (20). The OE data are edited for gestational ages that are clearly inconsistent with birthweight. If the OE data are not reported, or are inconsistent with birthweight, the last menstrual period (LMP)-based gestational age is used (0.6% of fetal death records and 0.1% of live birth records in 2019). These procedures are described in more detail elsewhere (21).
See the “User Guide to the 2017 Fetal Death Data File” for a more detailed description of the transition and Table 1 of the “User Guide to the 2018 Fetal Death Data File” for trends in total, early, and late fetal mortality based on both the OE- and LMP-based measures (22,23).
Gestational age not stated Fetal deaths with not-stated gestational age are presumed to
be 20 or more weeks of gestation if the state requires reporting of all fetal deaths at 20 or more weeks, or if the fetus weighed 350 or more grams in those states requiring reporting of all fetal deaths regardless of gestational age. In Tables 1 and 4, fetal deaths with not-stated gestational age are allocated to the 20–27 weeks and 28 or more weeks categories according to the proportion of fetal deaths with stated gestational age that fall into each category (proportional distribution). Similarly, for Table B, fetal deaths with not-stated gestational age are proportionally distributed into the 20–23 weeks and 24 or more weeks categories. Proportional distribution is not performed for data in tables that show more detailed gestational age categories (Table 6). The allocation of not-stated gestational age for fetal deaths is made individually for each maternal age, race, Hispanic-origin group, and state in the computation of fetal mortality rates.
Cause of deathCause-of-death data are included for the 42 states and the
District of Columbia that reported cause of death based on the 2003 revision of the U.S. Standard Report of Fetal Death and met the reporting requirement of having less than 50% of records assigned to unspecified cause (P95) (cause-of-death data did not meet these requirements for California, Georgia, Hawaii, Michigan, Mississippi, North Carolina, North Dakota, Vermont, and New York City).
Random variation in fetal mortality Please see the “User Guide to the 2019 Fetal Death Public
Use File” for more detailed information and formulas.

FIRST CLASS MAILPOSTAGE & FEES PAID
CDC/NCHSPERMIT NO. G-284
U.S. DEPARTMENT OFHEALTH & HUMAN SERVICES
Centers for Disease Control and PreventionNational Center for Health Statistics3311 Toledo Road, Room 4551, MS P08Hyattsville, MD 20782–2064
OFFICIAL BUSINESS PENALTY FOR PRIVATE USE, $300
National Vital Statistics Reports, Vol. 70, No. 11, October 26, 2021
FIRST CLASS MAIL POSTAGE & FEES PAID
CDC/NCHS PERMIT NO. G-284
U.S. DEPARTMENT OF HEALTH & HUMAN SERVICES
Centers for Disease Control and Prevention National Center for Health Statistics 3311 Toledo Road, Room 4551, MS P08 Hyattsville, MD 20782–2064
OFFICIAL BUSINESS PENALTY FOR PRIVATE USE, $300
National Vital Statistics Reports, Vol. 70, No. 11, October 26, 2021
For more NCHS NVSRs, visit: https://www.cdc.gov/nchs/products/nvsr.htm.
For e-mail updates on NCHS publication releases, subscribe online at: https://www.cdc.gov/nchs/email-updates.htm. For questions or general information about NCHS: Tel: 1–800–CDC–INFO (1–800–232–4636) • TTY: 1–888–232–6348
Internet: https://www.cdc.gov/nchs • Online request form: https://www.cdc.gov/info • CS326516
Suggested citation
Gregory ECW, Valenzuela CP, Hoyert DL. Fetal mortality: United States, 2019. National Vital Statistics Reports; vol 70 no 11. Hyattsville, MD: National Center for Health Statistics. 2021. DOI: https://dx.doi.org/10.15620/cdc:109456.
Copyright information
All material appearing in this report is in the public domain and may be reproduced or copied without permission; citation as to source, however, is appreciated.
National Center for Health Statistics
Brian C. Moyer, Ph.D., DirectorAmy M. Branum, Ph.D., Associate
Director for Science
Division of Vital Statistics
Steven Schwartz, Ph.D., DirectorAndrés A. Berruti, Ph.D., M.A., Acting
Associate Director for Science
ContentsAbstract . . . . . . . . . . . . . . . . . . . . . . . . . . . . . . . . . . . . . . . . . . . . . . . . . . . . . . . 1Introduction . . . . . . . . . . . . . . . . . . . . . . . . . . . . . . . . . . . . . . . . . . . . . . . . . . . . 2Methods . . . . . . . . . . . . . . . . . . . . . . . . . . . . . . . . . . . . . . . . . . . . . . . . . . . . . . . 2
Data sources . . . . . . . . . . . . . . . . . . . . . . . . . . . . . . . . . . . . . . . . . . . . . . . . . . 2Fetal mortality . . . . . . . . . . . . . . . . . . . . . . . . . . . . . . . . . . . . . . . . . . . . . . . . . 2Data limitations. . . . . . . . . . . . . . . . . . . . . . . . . . . . . . . . . . . . . . . . . . . . . . . . 22003 revision of U.S. Standard Report of Fetal Death . . . . . . . . . . . . . . . . . . 2Race and Hispanic origin . . . . . . . . . . . . . . . . . . . . . . . . . . . . . . . . . . . . . . . . 3Fetal deaths by state . . . . . . . . . . . . . . . . . . . . . . . . . . . . . . . . . . . . . . . . . . . . 3Cause of death . . . . . . . . . . . . . . . . . . . . . . . . . . . . . . . . . . . . . . . . . . . . . . . . 3Statistical significance . . . . . . . . . . . . . . . . . . . . . . . . . . . . . . . . . . . . . . . . . . 3
Results . . . . . . . . . . . . . . . . . . . . . . . . . . . . . . . . . . . . . . . . . . . . . . . . . . . . . . . 3Trends in fetal mortality . . . . . . . . . . . . . . . . . . . . . . . . . . . . . . . . . . . . . . . . . 3Race and Hispanic origin . . . . . . . . . . . . . . . . . . . . . . . . . . . . . . . . . . . . . . . . 3Maternal age . . . . . . . . . . . . . . . . . . . . . . . . . . . . . . . . . . . . . . . . . . . . . . . . . . 4Tobacco use during pregnancy . . . . . . . . . . . . . . . . . . . . . . . . . . . . . . . . . . . 5Plurality . . . . . . . . . . . . . . . . . . . . . . . . . . . . . . . . . . . . . . . . . . . . . . . . . . . . . 5Sex of fetus . . . . . . . . . . . . . . . . . . . . . . . . . . . . . . . . . . . . . . . . . . . . . . . . . . 5Period of gestation . . . . . . . . . . . . . . . . . . . . . . . . . . . . . . . . . . . . . . . . . . . . . 5Birthweight . . . . . . . . . . . . . . . . . . . . . . . . . . . . . . . . . . . . . . . . . . . . . . . . . . 5Fetal mortality rates by state . . . . . . . . . . . . . . . . . . . . . . . . . . . . . . . . . . . . . . 6Selected causes of fetal death . . . . . . . . . . . . . . . . . . . . . . . . . . . . . . . . . . . . 6
References . . . . . . . . . . . . . . . . . . . . . . . . . . . . . . . . . . . . . . . . . . . . . . . . . . . . . 7List of Detailed Tables . . . . . . . . . . . . . . . . . . . . . . . . . . . . . . . . . . . . . . . . . . . . 8Technical Notes . . . . . . . . . . . . . . . . . . . . . . . . . . . . . . . . . . . . . . . . . . . . . . . . 18
AcknowledgmentsThis report was prepared in the Division of Vital Statistics (DVS) under the general direction of Steven Schwartz, Director, DVS; Isabelle Horon, Branch Chief, Reproductive Statistics Branch (RSB); and Joyce A. Martin, Team Lead, RSB Birth Team.