Embed Size (px)
Citation preview
Neighbor-Aware Search for Approximate Labeled GraphMatching using the Chi-Square Statistics
Sourav Dutta∗
Nokia Bell Labs,Dublin, Ireland
Pratik Nayek†
Microsoft Development CenterBengaluru, India
Arnab BhattacharyaComputer Sc. & Engg.,
Indian Institute of Technology,Kanpur, India
ABSTRACTLabeled graphs provide a natural way of representing entities, re-lationships and structures within real datasets such as knowledgegraphs and protein interactions. Applications such as question an-swering, semantic search, and motif discovery entail efficient ap-proaches for subgraph matching involving both label and structuralsimilarities. Given the NP-completeness of subgraph isomorphismand the presence of noise, approximate graph matching techniquesare required to handle queries in a robust and real-time manner.This paper presents a novel technique to characterize the subgraphsimilarity based on statistical significance captured by chi-squarestatistic. The statistical significance model takes into account thebackground structure and label distribution in the neighborhood ofvertices to obtain the best matching subgraph and, therefore, ro-bustly handles partial label and structural mismatches. Based onthe model, we propose two algorithms, VELSET and NAGA, that,given a query graph, return the top-k most similar subgraphs froma (large) database graph. While VELSET is more accurate and ro-bust to noise, NAGA is faster and more applicable for scenarioswith low label noise. Experiments on large real-life graph datasetsdepict significant improvements in terms of accuracy and runningtime in comparison to the state-of-the-art methods.
KeywordsApproximate subgraph matching; Statistical significance; Chi-squarestatistic; Subgraph similarity;
1. INTRODUCTIONWith the proliferation of social networks, bioinformatics, chemoin-
formatics, road networks, etc., the problem of efficient graph query-ing and mining poses a challenging area of research [1]. The under-lying data is generally represented as a labeled graph where nodesrepresent entities and edges capture the relationships and interac-tions among the entities while the labels on the nodes define thecharacteristics of the entities. Given a set of graphs, the aim of
∗Work done while the author was at Max Planck Institute for Informatics, Germany.†Work done while the author was at Indian Institute of Technology, Kanpur, India.
c©2017 International World Wide Web Conference Committee (IW3C2),published under Creative Commons CC BY 4.0 License.WWW 2017, April 3–7, 2017, Perth, Australia.ACM 978-1-4503-4913-0/17/04.http://dx.doi.org/10.1145/3038912.3052561
.
United States of AmericaAustria
JournalistGovernorActor
Arnold AloisSchwarze-negger
Maria OwingsShriver
SpouseOfWorksAs
CitizenO
f
WorksA
s
WorksAs
CitizenO
f
CitizenOf
?
United States of America
JournalistActor
Arnold Sch-arzenegger
SpouseOf
WorksAs
WorksAs
CitizenO
f
CitizenOf
Which American journalist is the spouse of the famous American actor
Arnold Schwarzenegger?
Graph Representation of Natural Language Query
Knowledge Graph Representation
Figure 1: Approx. subgraph matching for question answering.
query graph matching is to retrieve graphs similar to the query [24].For example, in chemoinformatics or bioinformatics, an importanttask is to search for compounds or protein structures similar to aquery [40] for motif discovery [12]. Traditional approaches forsuch queries involve graph isomorphism where an exact match isrequired in the context of both graph structure and labels. The prob-lem of graph isomorphism has recently been shown to be quasi-polynomial [3], while subgraph isomorphism is NP-complete [10].
Consequently, approximate subgraph matching has been explored[24,27]. With the availability of extremely large graphs in the formof social networks, road networks, etc., the field of graph query-ing has extended to the scenario where the aim is to find similarsubgraphs from a large database graph [24, 27]. The match canbe approximate, allowing for insertions and deletions of structuralelements such as nodes and edges as well as label mismatches.
1.1 Applications of Approximate MatchingThe problem of approximate subgraph matching caters to myr-
iad applications across various domains including knowledge graphbased search for question answering, bioinformatics for genomeand protein interaction detection, and social network analysis.
For example, consider Fig. 1 to depict the snapshot of a knowl-edge graph (KG) containing attributes and relationships about thefamous actor Arnold Schwarzenegger. Facts about named-entities(e.g., person, organization, etc.) extracted from Wikipedia infoboxesor other Web sources are typically represented as labeled graphicalstructures, with labeled vertices denoting the entities and the edgesdenoting relationships between the entities. Such KGs form thebackbone repository for question answering systems such as IBMWatson or Google semantic search enabling efficient and precise
1281

computation of natural language queries or entity-based search. Anexample is “Which American journalist is the spouse of the famousAmerican actor Arnold Schwarzenegger?”
Downstream processing of such queries entails the extraction ofsubgraphs (representing the input query) having similar structuresand labels from the underlying knowledge graph [6, 20]. As such,“similar” subgraphs demonstrating exact matches or with slightvariations in labels (mis-spellings or different surface forms involv-ing acronyms, aliases, etc.) and/or edges (absence of information)with that of the query provide probable candidate answers for fur-ther investigation to generate the desired result (as seen in Fig. 1).
In bioinformatics, approximate graph matching plays a vital rolein detecting regions in genome that undergo abnormal mutationsand interaction of proteins and chemicals therein [37, 47].
However, use of exhaustive techniques utilizing elaborate sub-graph isomorphism tests does not scale to large graphs. Thus, mod-ern applications resort to heuristics to retrieve subgraphs that are“similar” to the query graph but may not match exactly. Since it iscomputationally infeasible to either generate or store all such sub-graphs, subgraph querying techniques depend on paradigms thatgenerate subgraphs on-the-fly and quickly filter them based on var-ious pruning conditions. Although “similar” subgraph generationbased on various measures have been proposed [24,27,38,41], lim-ited work exists for efficient extraction of matching subgraphs interms of both running time and accuracy considering both struc-tural and label similarity. We propose robust subgraph matchingbased on statistical significance, previously shown to be successfulfor mining connected subgraphs [2], and sequence mining [14,35].
1.2 Motivation for Statistical SignificanceThe degree of structural similarity between a query graph and
regions in the graph database provides a paramount criteria for ap-proximate subgraph matching. As such, various works have cap-tured these characteristics using a variety of features, includingnumber of vertices (with a certain label), number of edges, degreedistribution, centrality, diameter, and neighborhood [24, 27].
Nevertheless, the one critical information that has not been cap-tured is the relationship of the labels in the query graph with theunderlying background distribution of the labels of the larger graphthat is being searched. Assuming a uniform distribution of graphlabels (from a countable set), the probability of near exact labelmatches in contiguous regions (i.e., neighborhood) of the databasefor the entire query is quite low. Hence, such regions tend to exhibithigh statistical significance, and can be detected using such.
Using an analogy from the domain of string matching, supposethe query string q = abac is to be searched within a large strings = cabacbac composed from the alphabet set Σ = {a, b, c}. Notethat, 3-gram level matching of triplets from q over s matches atpositions 2-4, 3-5 and 6-8. Assuming a probability distribution onΣ where a is less frequent than b and c, the statistical significance ofmatching at position 2 is greater than that at 3 and 6, as the chanceof two a’s occurring is less likely. Another interesting feature ofthis approach is its robustness to noise or near-exact matches. Forexample, a query q′ = cbab in s would also return cbac as the bestmatching region with high statistical significance. This strategywas successfully used in [13] for approximate substring matching.
The above intuition of using statistical significance can be cap-tured formally by the notion of p-value [34]. The p-value of anobserved event is the probability of occurrence of events at least asextreme as this one. For example, in a coin toss experiment, the p-value of observing 8 heads in a series of 10 tosses is the probabilityof obtaining 8, 9 or 10 heads. Since extreme events are rare, thelesser the p-value, the more statistically significant is the event.
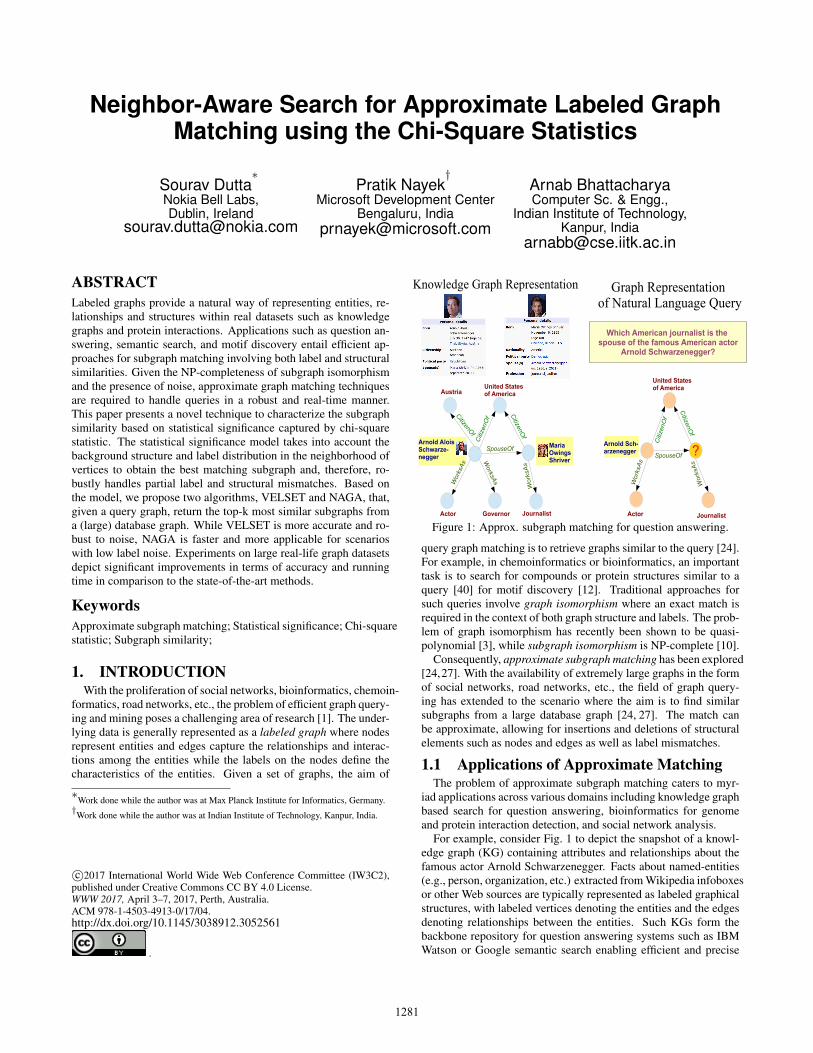
Label
A
B
C
D
EA
v3v2,v5
v1
v6v4
Vertex
Label
A
B
C
q3q2,q5
q1,q4
Vertex
q2
q1
q3q4q5
Vertex Neighbor
B,C
A,B
A,A,B
A,C,C
C,C
v2,C v4,EA
v5,C
v1,A
v3,B v6,D
q1,A
q3,B
q2,C q4,A
q5,C
v2
v1
v4v5v6
v3
NeighborVertex
B,C
A,B,EA
D,EA
B,C
A,C,D
C,C
Q
G
Figure 2: Running example: Input graph G and query Q.
Adopting the notion for graph structures, each vertex in the graphdatabase is represented by a label set composed of the labels of itsneighboring vertices. Similarly, the vertices of the query graph arealso represented as label sets. The vertices with higher degreesof match depict higher statistical significance, thereby serving asbetter candidates for subgraph matching. Such a strategy is notonly computationally fast but also inherently robust in capturingthe approximation criteria for both label and structural similarities.
As an example, in Fig. 2, the vertex v2 ∈ G is represented by thelabel set {A,B,EA} (pertaining to its neighbors), while q2 ∈ Qand q5 ∈ Q are represented as {A,A,B} and {A,B} respectively.Considering only structural similarity, v2 can be matched with ei-ther q2, or even q3, since it has three adjacent nodes. Using labels,v2 can be matched with q2 or q5. Only using both the criteria, andtaking into consideration the background distribution of labels, canit be found out the best match of v2 is with q2 (depicting higher sta-tistical significance). In other words, q2 provides a higher degreeof match (based on label and structure) and would, thus, depict ahigher statistical significance. This forms the basis of our proposedalgorithms for approximate labeled graph querying.
Since computing the p-value is practically inefficient due to theexponential number of possibilities, the Pearson’s chi-square statis-tic [34] has been shown to provide a good estimate [33]. The chi-square statistic, χ2, computes the (normalized squared) differencebetween the expected and observed occurrences of outcome values:
χ2 =∑∀i
[(Oi − Ei)
2/Ei
](1)
where Oi and Ei are the observed and expected number of occur-rences, respectively, of the possible outcomes i of an experiment. Ifpi represents the probability of occurrence of event i, the expectedcounts are Ei = len× pi for len number of observations.
The χ2 statistic follows the chi-square distribution [34] with de-grees of freedom one less than the number of possible outcomes.Higher the χ2 statistics, lower is the p-value and, thus, higher isthe statistical significance. Hence, retrieving a more “similar” sub-graph, i.e., one with more statistical significance, translates to find-ing a subgraph with a larger χ2 value.
1.3 Problem StatementWe propose to solve the approximate subgraph matching prob-
lem utilizing the statistical significance of matches (based on chi-square measure) as the similarity measure based on both structuraland label similarity. Formally,
PROBLEM 1. Given a labeled undirected graph G and a querygraph Q where the vertices of G and Q are labeled, retrieve fromG the top-k statistically significant subgraphs similar to Q.
In this paper, we only consider the cases of vertices being labeled(with a single label) and that the labels are drawn from a count-
1282
able set. The scenarios of edge labels (handled via construction ofauxiliary vertices) and missing labels, are discussed in Sec. 4.6.Contributions: In a nutshell, our major contributions are:• We propose the formulation of approximate “similar” subgraph
querying problem in terms of statistical significance, and usethe chi-square statistics to jointly incorporate graph label andstructural similarities. To the best of our knowledge, there existsno prior literature that works along these lines.• We present two algorithms to efficiently and effectively solve the
above subgraph matching problem. The first algorithm, VELSET,is more generic and robust to noisy edges and/or noisy labels.• We also present an efficient algorithm, NAGA, that uses an ag-
gressive pruning strategy based on labels.• We perform extensive experiments on real-life graph datasets to
depict improved running time performance and accuracy com-pared to the state-of-the-art approaches.
2. RELATED WORKGraph Matching: Graph querying is a well researched problemcatering to various application domains. While the graph isomor-phism problem is quasi-polynomial [3], exact subgraph isomor-phism is NP-complete [10]. Some earlier works targeting this prob-lem involve tree-pruning [46], Swift-Index [36] and VF2 [11]. Bio-logical networks are handled in PathBlast [23], SAGA [41], NetAl-ign [31] and IsoRank [38]. They are mostly suited for smaller net-works, though. An ordered-search algorithm for determining error-correcting isomorphism was proposed in [45]. An algorithm basedon random walk to find the best matching in a large graph was pro-posed in [43, 44]. GraphGrep [18] uses hash-based fingerprintingfor subsequent filtering. A variant of the graph isomorphism prob-lem, with vertices characterized by their labels as the only attributeand edges denoting the connectivity in a data graph for a prede-fined number of hops, was shown to be polynomial-time boundedin [16], with a cost-effective incremental version presented in [15].
Another similar domain of work involves frequent subgraph find-ing and pattern mining over a set of graphs or a single large graph.The frequent sub-graph discovery algorithm [28] uses sparse graphrepresentation. gSpan [49] uses a canonical labeling system, sup-porting depth-first search, to find frequently occurring subgraphs.Similar works include GREW [29], mining proximity pattern [25]and frequent patterns in large sparse graphs [30].
In [2], the chi-square measure was used to mine subgraphs thatare statistically significantly different from the background distri-bution of labels in a vertex-labeled graph.
For large data with noise, the approximate subgraph matchingproblem was formulated to tolerate a small amount of mismatch.An efficient index based approximate subgraph matching tool, TALE[42], maintains the topology of the query using a best-effort patternmatching, and uses a maximum weighted bipartite graph match-ing algorithm. Zhang et al. [53] proposed another indexing ap-proach based on graph distance. A set-cover-based inexact sub-graph matching technique, SIGMA [32], and a regular expressionbased approach for graph pattern matching [4]. were also studied.SAPPER [54], based on edge edit distance, was shown to be effi-cient and scalable for large noisy graph databases. APGM [21] pro-poses a method to mine useful patterns from noisy graph databases.C-Tree [56] proposed a technique for a generalized representationof graphs usable for both subgraph querying and subgraph similar-ity computation. A semantic-based search algorithm, GString [22],introduced a sequencing method to capture the semantics of the un-derlying graph data. Some other relevant subgraph matching worksinclude gIndex [50], FG-Index [8], iGraph [19], Grafil [51], Gcod-ing [55], GPTree [52], cIndex [7], and iGQ [48].
NeMa [24] and SIM-T [27] are two recently proposed workstackling both structural and label noises for the approximate graphmatching problem. NeMa involves a fast neighborhood-based sub-graph matching algorithm with efficient indexing. It uses a cost-metric based node selection mechanism which helps in coveringboth structural and label noise. SIM-T performs tabu search on aninitialized known subset of optimal solution, and shows high accu-racy when initialized with a potentially good solution.
Two extensive surveys on graph matching are in [9, 17].Statistical Significance: Statistical models and measures involveestablishing a relation between the empirical or observed results ofan experiment with factors affecting the system or to pure chance.An observation is deemed to be statistically significant if its pres-ence cannot be attributed to randomness alone. The experimentalsetup for computing the p-value of an observed event is describedusing a null hypothesis. However, the computation can be practi-cally infeasible as it can entail the generation of all possible out-comes. To alleviate this problem, various branch-and-bound meth-ods have been studied [5]. The literature hosts a number of statisti-cal models to approximate the p-value, such as chi-square, z-score,log-likelihood ratio (G2), and Hotelling’s T 2 measure [34].
The chi-square distribution (χ2) is widely used to compute thegoodness-of-fit of a set of observations to the theoretical modeldescribing the null hypothesis. In most situations, the chi-squaredistribution provides a good approximation of the p-value [33].Hence, in this paper, we measure the statistical significance usingthe Pearson’s χ2 measure based on the chi-square distribution.
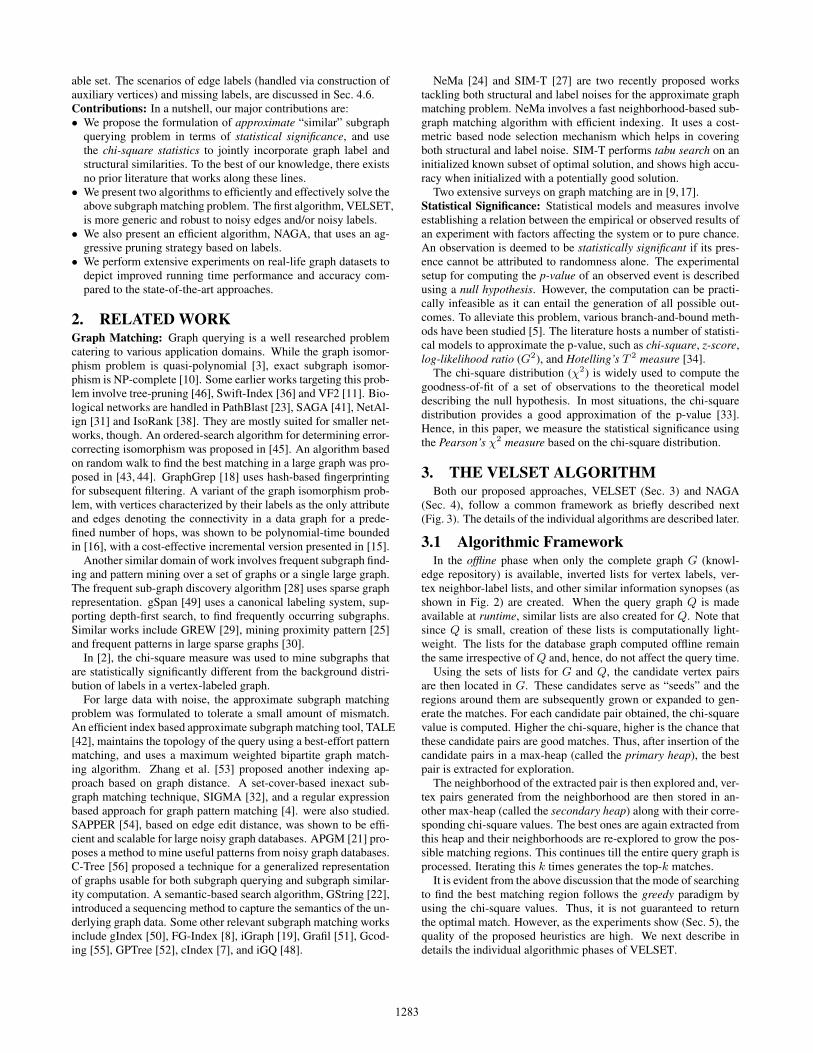
3. THE VELSET ALGORITHMBoth our proposed approaches, VELSET (Sec. 3) and NAGA
(Sec. 4), follow a common framework as briefly described next(Fig. 3). The details of the individual algorithms are described later.
3.1 Algorithmic FrameworkIn the offline phase when only the complete graph G (knowl-
edge repository) is available, inverted lists for vertex labels, ver-tex neighbor-label lists, and other similar information synopses (asshown in Fig. 2) are created. When the query graph Q is madeavailable at runtime, similar lists are also created for Q. Note thatsince Q is small, creation of these lists is computationally light-weight. The lists for the database graph computed offline remainthe same irrespective of Q and, hence, do not affect the query time.
Using the sets of lists for G and Q, the candidate vertex pairsare then located in G. These candidates serve as “seeds” and theregions around them are subsequently grown or expanded to gen-erate the matches. For each candidate pair obtained, the chi-squarevalue is computed. Higher the chi-square, higher is the chance thatthese candidate pairs are good matches. Thus, after insertion of thecandidate pairs in a max-heap (called the primary heap), the bestpair is extracted for exploration.
The neighborhood of the extracted pair is then explored and, ver-tex pairs generated from the neighborhood are then stored in an-other max-heap (called the secondary heap) along with their corre-sponding chi-square values. The best ones are again extracted fromthis heap and their neighborhoods are re-explored to grow the pos-sible matching regions. This continues till the entire query graph isprocessed. Iterating this k times generates the top-k matches.
It is evident from the above discussion that the mode of searchingto find the best matching region follows the greedy paradigm byusing the chi-square values. Thus, it is not guaranteed to returnthe optimal match. However, as the experiments show (Sec. 5), thequality of the proposed heuristics are high. We next describe indetails the individual algorithmic phases of VELSET.
1283
Vertex Pairs
Candidate
Vertex Pairs
CandidateComputation
Chi−Square Primary
Heap Best Pair
ExtractNeighborhood
Candidate
PairsComputation
Chi−Square Secondary
Heap Augment Match
Extract andLists in Q
Creation of
offlinephase
run k times
online phase
Creation of
Lists in G
Figure 3: Algorithmic framework overview for VELSET and NAGA.
Algorithm 1 VELSETInput: Database graph G, Query graph Q, Number of matches kOutput: Top-k subgraphs of G similar to Q1: Compute ILG and LNLG of input graph G . Offline2: Compute ILQ and LNLQ of query graph Q3: VP← {〈u, v〉 | u ∈ G ∧ v ∈ Q ∧ lGu ' l
Qv }
4: Primary max-heap PH← Φ5: for all 〈u, v〉 ∈ VP do6: Tu, Tv ← triplets centered at u, v respectively7: Initialize Ou to empty string of length lenv =
(deg(v)2
)8: for all triplet tv ∈ Tv do9: tu ← largest overlapping match of tv
10: Symbol s← match of tu with tv . s is s2, s1 or s011: Append Ou with s12: end for13: Eu ← lenv × [Pr(s0), P r(s1), P r(s2)] . Eqs. (6), (7), (8)14: Compute χ2
〈u,v〉 using expected Eu and observed Ou . Eq. (1)
15: Insert 〈u, v, χ2〈u,v〉.JS(lu, lv)〉 into PH
16: end for17: for i = 1 to k do18: repeat19: 〈u, v〉 ← Extract(PH)20: until neither u nor v are marked “done”21: Match(i)← 〈u, v〉22: Mark u and v as “done”23: Secondary max-heap SH← Φ24: U ′, V ′ ← adjacent nodes of u, v respectively25: Insert {〈u′ ∈ U ′, v′ ∈ V ′, χ2
〈u′,v′〉.JS(lu′ , lv′ )〉 | lGu′ ' lQ
v′}into SH
26: while |Match(i)| 6= |Q| and SH 6= Φ do27: Expand Match(i) by “best” unmarked vertex pair 〈u′, v′〉
from SH28: Insert unmarked vertex pairs from neighborhood of u′, v′ into
secondary heap SH29: end while30: end for31: return Top-k matches Match(1), ..., Match(k)
3.2 Creation of Different ListsWe initially propose the VErtex Label Similarity on Edge Triplets
or VELSET algorithm (pseudocode shown in Algorithm 1). Thefirst step involves the construction of different indexing lists sum-marizing the labels of the vertices and their neighbors. We createinverted lists mapping the vertex labels to the corresponding ver-tices, and are denoted as ILG and ILQ for graphs G and Q respec-tively. The second index, the label neighbor list (denoted by LNL)stores the label information of the neighbors for each vertex. Thus,the set of labels in the neighbors of u ∈ G is denoted by LNLG
u ,and those in the neighbors of v ∈ Q is denoted by LNLQ
v , etc. As arunning example throughout the paper, consider the input graph Gand query Q shown in Fig. 2 with the corresponding inverted listsand label neighbor lists.
3.3 Vertex Pair ConstructionFor each label in Q, VELSET next identifies similar labels in
G. The notion of similarity between two labels, either identical orfuzzy matching above a threshold, can be appropriately defined by
the application. If a label lQi inQ is similar to lGj inG, it is denotedas lQi ' l
Gj ; otherwise, they are not similar: lQi � lGj .
Adopting the approach of [24], we use the Jaccard similarityabove a threshold to identify similar labels. The Jaccard similar-ity between two strings s and t composed of characters from thesame alphabet set is defined as the number of common charactersin s and t, over the total number of characters in the two strings:JS(s, t) = |s∩t|/|s∪t|. Hence, in Fig. 2, considering a similaritythreshold of τ = 0.5, the label EA is similar to the label A.
For each vertex v in Q with label lQv , all the vertices u in G hav-ing labels lGu where lQv ' lGu , are identified. The vertex pairs 〈u, v〉then form the candidate vertex pairs, denoted by VP. Formally,
VP = {〈u, v〉 | u ∈ G ∧ v ∈ Q ∧ lGu ' lQv } (2)
VP can be constructed by performing a join operation on theinverted lists. The vertex pairs obtained for the example in Fig. 2are VP = {〈v1, q1〉, 〈v1, q4〉, . . . , 〈v5, q5〉, . . . , 〈v4, q4〉}.
3.4 Statistical Significance ComputationVELSET next chooses the most statistically significant vertex
pair from VP using the following procedure. The chi-square statis-tic, χ2
〈u,v〉 for each candidate vertex pair (u, v) ∈ VP, is computedon the basis of “label triplets” using the following steps.(1) Triplet Generation: A triplet of vertices centered at u ∈ Gis the 3-tuple 〈x, u, y〉 where vertices x and y are adjacent to u.The corresponding label triplet 〈lGx , lGu , lGy 〉 of u is then constructedfrom the respective vertex labels of x, u, y. The ordering of neigh-boring labels within a triplet does not matter in subsequent compu-tations, i.e., 〈lGx , lGu , lGy 〉 ≡ 〈lGy , lGu , lGx 〉. For the example in Fig. 2,vertex v3 with label B have neighbors v1, v2 and v6 with labels A,C and D respectively. Hence, the possible label triplets centeredat v3 are 〈A,B,C〉, 〈C,B,D〉, and 〈D,B,A〉. Similarly, the onlylabel triplet generated with q5 at the center is 〈B,C,A〉.
While algorithms can be developed to capture two-hop or moredetailed neighborhoods, there are two main reasons for not doingso. First, the neighborhood information becomes progressively lessprecise with more hops. Second, the resulting statistical signifi-cance model becomes unnecessarily complex.(2) Degree of Label Overlap: For a vertex pair 〈u, v〉, the tripletsof v ∈ Q are then matched with those of u ∈ G. A one-to-onematching is considered and the number of triplet matches is thenumber of triplets of u ∈ G corresponding to v ∈ Q.
The similarity between two label triplets is characterized by thedegree of overlap of the labels. Consider the labels 〈lGx , lGu , lGy 〉 and〈lQa , lQv , lQb 〉 for (u, v) ∈ VP (i.e., lGu ' lQv ) centered at u ∈ G andv ∈ Q respectively. Based on label similarity, the degree of overlapis classified into 3 classes (with symbols s2, s1, and s0) as:• s2: Both the neighboring vertex labels of u and v are similar.
s2 : (lGx ' lQa ∧ lGy ' lQb ) (3)
• s1: Only one adjacent vertex label is similar.
s1 : (lGx ' lQa ∧ lGy � lQb ) ∨ (lGx � lQa ∧ lGy ' lQb ) (4)
• s0: None of the neighboring vertex labels are similar.
s0 : (lGx � lQa ∧ lGy � lQb ) (5)
1284

A triplet match gets the highest symbol it can achieve as maxi-mum amount of matching is preferred for best candidate extraction;hence, s2 � s1 � s0. The matched vertex in G is then representedby a sequence of symbols, O, corresponding to the triplet matchwith the query vertex. The fact that two triplets are matched es-tablishes the structural similarity between the regions centered at uand v while the degree of overlap establishes the label similarity.
Consider the vertex pair 〈v3, q3〉 in the example. The label triplet〈A,B,C〉 of q3 matches exactly with 〈A,B,C〉 generated from〈v1, v3, v2〉 and, therefore, corresponds to symbol s2. The nextquery label triplet 〈C,B,C〉 is best matched with 〈C,B,D〉, therebyproviding symbol s1. Similarly, the best match of 〈C,B,A〉 of q3is with 〈D,B,A〉, yielding another s1 symbol. Thus, v3 is repre-sented by the sequence {s2, s1, s1} when matched with q3.
Note that for a query with less than 3 vertices, pseudo-verticeswith dummy labels matching any other label, are assumed.(3) Expected Symbol Occurrence: The computed symbol sequenceOu for a candidate vertex u ∈ G signifies its degree of subgraphmatching with Q. The statistical significance of the match is mea-sured by computing the chi-square statistic of Ou having length l.The expected probabilities of the symbols characterize their chanceof occurring at random. For simplicity, we assume that there are Lgroups of equally likely labels, and labels in the same group arenecessarily similar and are, therefore, matched.
Consider the event when the label of an adjacent vertex of u isnot similar to the particular label lQa of the query triplet. The chanceof this happening is (1 − 1/L). Since there are d = deg(u) suchadjacent vertices, the probability that none of the adjacent verticesis similar to lQa is (1− 1/L)d. Considering the two query labels lQaand lQb to be independent, the probability that the triplet match getsthe symbol s0 (i.e., there is no label match), therefore, is,
Pr(s0) =(
(1− 1/L)d)2
(6)
The event of a matching label is complementary to all d adjacentvertices having dissimilar labels and is, therefore, 1− (1− 1/L)d.As for s1 one of the triplet labels do not match, the probability is,
Pr(s1) = 2.(
1− (1− 1/L)d).(
(1− 1/L)d)
(7)
The factor 2 depicts that any one label of the triplet can be similar.The symbol s2 encodes the situation when both the labels of a
triplet are similar, and its probability of occurrence is given by,
Pr(s2) =(
1− (1− 1/L)d)2
(8)
Note that the symbols are exhaustive and they complete the eventspace: Pr(s0) + Pr(s1) + Pr(s2) = 1.
Since the maximum number of possible triplets for v ∈ Q withdegree deg(v) is lenv =
(deg(v)
2
), the vertex u ∈ G is represented
by a sequence of lenv symbols. No triplet in G is matched to morethan one query triplet. If the number of triplets centered at u is lessthan that centered at v, the rest of the deg(v)− deg(u) triplets areassumed to match with null triplets with their symbols as s0.(4) Chi-Square Computation: VELSET computes the expectednumber of symbol occurrences for vertex u by multiplying theabove probabilities (Eqs. (6) to (8)) by lenv . The observed numberof each symbol is calculated from the actual match. The chi-squarestatistic, χ2
〈u,v〉, for vertex pair 〈u, v〉 is computed by Eq. (1).For modeling both structural and label similarity for subgraph
matching, the computed chi-square values of the candidate verticesare multiplied with the Jaccard similarities of their labels to thequery vertex labels, and the 3-tuples, 〈u, v, (χ2
〈u,v〉 · JS(lu, lv))〉,are inserted in a primary max-heap structure, PH. While higher
Jaccard similarity prefers better matching labels, higher chi-squareprefers closer structural matches.
Returning to the example vertex pair 〈v3, q3〉, the symbol se-quence for v3 is {s2, s1, s1}, as explained earlier. Hence, the ob-served count isO[lv3 ] = [0, 2, 1]. Using |L| = 4 and d = deg(q3) =3, the expected count vector for v3, using Eqs. (6)–(8), is E[lv3 ] =3×[0.178, 0.488, 0.334]. Hence, χ2
〈v3,q3〉 = 0.731 (using Eq. (1)).
3.5 Generating Approximate MatchAfter the primary heap PH is populated, the pair 〈u, v〉 with
the largest χ2 is extracted from PH. It seeds the further subgraphsearch and is marked “done” to avoid duplicate and conflicting pair-ing. Any triplet containing either u or v as one of the vertices can-not be matched any further. This ensures that the same region is notexplored more than once.
Next, a secondary max-heap SH is created to expand the matchregion neighborhood. Triplets centered at the adjacent vertices of uand v are created and inserted into SH along with their χ2 values.The best vertex pair according to its χ2 value from these adjacentvertex pairs is then extracted from SH; the corresponding verticesare marked as “done”, and related triplets are deleted.
Assume that for the example, 〈v2, q2〉 exhibits the maximum χ2
value. It is extracted from PH and vertices v2 and q2 are markedas “done”. The top-1 matching subgraph Match(1) is initializedto {(v2, q2)}. Its neighbor sets {v1, v3, v4}, and {q1, q3, q4} areexamined. The similar vertex pairs {〈v1, q1〉, 〈v1, q4〉, 〈v4, q1〉,〈v4, q4〉, 〈v3, q3〉} along with their χ2 values are inserted into SHas 3-tuples. From SH, the highest scoring pair 〈v1, q1, χ2
〈v1,q1〉〉 isextracted and Match(1) is expanded to {(v2, q2), (v1, q1)}.
The process is repeated till Q is exhausted, i.e., the size of thesubgraph match becomes equal to the size of Q, or, SH becomesempty. The subgraph of G thus matched, is reported as the top-1approximate matching subgraph to Q.
To retrieve more approximate matches in case of a top-k query,the secondary heap is reset and the process starts again by pickingup the currently best unmarked vertex pair from the primary heapPH. The procedure is then repeated till k matches are obtained.
3.6 AnalysisThe running time of VELSET mainly depends on the vertex pair
construction and the heap operations. For input graphG containingn vertices and query graphQ comprising p vertices, the inverted in-dex construction for Q requires O(p) time (and O(n) offline timefor G). Assuming that the label matching operation, i.e., comput-ing Jaccard similarity, can be performed in O(1) time, the time tofind similar labels is |ILQ|× |ILG|. In the worst case, every label inILQ is similar to every label in ILG and, therefore, the total numberof vertex pairs is ν = O(n.p). Since each vertex pair is insertedat most once into the primary and secondary heaps, the heap op-erations require O(ν log ν) time. Since the process is repeated ktimes, the total time for VELSET is O(k.ν log ν).
The index construction time for VELSET for building the in-verted list for G is O(n), and the space required is O(n). Duringrunning time, the extra space consumed by VELSET is O(p) forthe inverted index of Q and O(ν) for the max-heaps.
4. THE NAGA ALGORITHMThe construction of vertex pairs in VELSET using label simi-
larities is a double-edged sword: while it provides robustness indetecting approximate subgraphs (noisy scenarios) with high accu-racy, it also makes the algorithm computationally expensive. Tocater to real-time applications favoring faster running times witha less stringent criteria for accuracy, we propose Neighbor-AwareGreedy Algorithm or NAGA (pseudocode in Algorithm 2).
1285

Algorithm 2 NAGAInput: Database graph G, Query graph Q, Number of matches kOutput: Top-k subgraphs of G similar to Q1: Compute ILG and LNLG of input graph G . Offline2: Compute ILQ and LNLQ of query graph Q3: VP← {〈u, v〉 | u ∈ G ∧ v ∈ Q ∧ lGu = lQv }4: Primary max-heap PH← Φ5: for all 〈u, v〉 ∈ VP do6: Su, Sv ← label strings of LNLu, LNLv respectively7: Initialize Ou to empty string of length lenv = |LNLv | − 18: for all window wv ∈ Sv do9: wu ← largest overlapping match of wv
10: Symbol s← match of wu with wv . s is s2, s1 or s011: Append Ou with s12: end for13: Eu ← lenv × [Pr(s0), P r(s1), P r(s2)] . Eqs. (13) – (15)14: Compute χ2
〈u,v〉 using expected Eu and observed Ou . Eq. (1)
15: Insert 〈u, v, χ2〈u,v〉〉 into PH
16: end for17: for i = 1 to k do18: repeat19: 〈u, v〉 ← Extract(PH)20: until neither u nor v are marked “done”21: Match(i)← 〈u, v〉22: Mark u and v as “done”23: Secondary max-heap SH← Φ24: U ′, V ′ ← adjacent nodes of u, v respectively25: Insert {〈u′ ∈ U ′, v′ ∈ V ′, χ2
〈u′,v′〉〉 | lGu′ = lQ
v′} into SH26: while |Match(i)| 6= |Q| and SH 6= Φ do27: Expand Match(i) by “best” unmarked vertex pair 〈u′, v′〉
from SH28: Insert unmarked vertex pairs from neighborhood of u′, v′ into
secondary heap SH29: end while30: end for31: return Top-k matches Match(1), ..., Match(k)
The steps in NAGA broadly follow the same outline as VELSET.It primarily differs in label similarity computation and the mannerin which the neighborhood labels of a vertex are modeled.
4.1 Creation of Different ListsThe creation of inverted lists for input graph G and query graph
Q is exactly the same as VELSET (Sec. 3.2).
4.2 Vertex Pair ConstructionThe first difference of this approach is that, unlike VELSET,
NAGA considers only those vertex pairs that have the exact samelabel for the vertex pair construction:
VP = {〈u, v〉 | u ∈ G ∧ v ∈ Q ∧ lGu = lQv } (9)
This reduces the cost of computing and storing VP considerably.The vertex pairs thus obtained for the example in Fig. 2 are VP ={〈v1, q1〉, 〈v1, q4〉, . . . , }; it does not include 〈v4, q1〉 and 〈v4, q4〉.
4.3 Statistical Significance ComputationThe next step is to choose the most statistically significant vertex
pair from VP. NAGA takes a different approach from VELSETby considering all the labels in the neighborhood of the candidatevertex together. The different steps involved are:(1) Choosing Vertex Pairs: The vertex pair 〈u, v〉 that providesthe maximal label overlap between the vertex neighbor lists LNLG
u
and LNLQv is inserted into the primary heap PH with its χ2 value.
However, to consider the intersection, the lists are considered assets. Thus, LNLq2 = {A,A,B} is modified into set LNL′
q2 =
{A,B}. Since vertex labels rarely repeat in real graphs such asknowledge graphs, the reduction is rarely significant.
The query vertex q2 in Fig. 2 is involved in two vertex pairswith v2 and v5. Since the intersection of LNL′
q2 = {A,B} withLNL′
v2 = {A,B,EA} is larger than that with LNL′v5 = {D,EA},
q2 is matched with v2, and 〈v2, q2〉 is inserted into PH. All othervertex pairs of the form 〈u′, v〉(u′ 6= u) are removed from VP sothat each v ∈ Q is matched only once. Hence, 〈v5, q2〉 is pruned.(2) Matching: The χ2 value of each vertex pair in PH is computedby considering the entire label neighborhood as a string with thelabels arranged alphabetically. The neighborhood label string LNLv
of v ∈ Q is queried over the neighborhood label string LNLu ofu ∈ G using the procedure suggested in [13], as described next.
Both the strings LNLu and LNLv are first divided into slidingwindows of size 2. Consider the window lGx l
Gy from LNLu. Since
it pertains to the vertex u ∈ G, it is augmented with lGu . Thus, the3-window label set considered is lGx , lGu , lGy . Similarly, consideringlabels lQa l
Qb from LNLv , the label window lQa , l
Qv , l
Qb is obtained.
For each window in LNLu, the best matching window in LNLv isfound. Depending on label overlap, the match is characterized into3 symbols s2, s1, and s0 (note that lGu = lQv in NAGA):• s2: All the labels in the window match.
s2 : (lGx = lQa ∧ lGy = lQb ) (10)
• s1: Only one of the labels in the window matches.
s1 : (lGx = lQa ∧ lGy 6= lQb ) ∨ (lGx 6= lQa ∧ lGy = lQb ) (11)
• s0: None of the labels match.
s0 : (lGx 6= lQa ∧ lGy 6= lQb ) (12)
As in VELSET, a window triplet match assumes the symbol withthe largest matching, i.e., the preference order is s2 � s1 � s0.
Consider the example vertex pair 〈v2, q2〉. The label neighborlists obtained are respectively LNLv2 = {A,B,EA} and LNLq2 ={A,A,B}. The first window of v2 is {A,B}, and is best matchedwith the query window {A,B} of q2, yielding the symbol s2. Simi-larly, the next window {B,EA} of v2 is best matched with {A,B}of q2 to produce s1 (only one label matched). Similar to VELSET,the obtained symbols are cast as a match sequence for the vertex u.Thus, the observed symbol vector for 〈v2, q2〉 is {s2, s1}.
Note that the same query window is used to match with both theinput windows. This apparent anomaly is resolved later when theneighborhood is expanded and matched.
If query Q has less than 3 vertices, as in VELSET, we assignpseudo-vertices with dummy labels that match any other label.(3) Expected Symbol Occurrence: The expected probabilities ofthe symbols are computed in the same manner as in VELSET.Since no label is similar to any other label except itself in NAGA,L = |Σ|, i.e., the label alphabet cardinality. Thus, for W possiblewindows, the probabilities are,
Pr(s0) =(
(1− 1/|Σ|)W)2
(13)
Pr(s1) = 2.(
1− (1− 1/|Σ|)W).(
(1− 1/|Σ|)W)
(14)
Pr(s2) =(
1− (1− 1/|Σ|)W)2
(15)
The number of windows in v ∈ Q denotes the cardinality ofthe symbol sequence for the candidate vertex u. Hence, for vertexpair 〈u, v〉, u is represented by a sequence of lenv = |LNLv| − 1symbols, where |LNLv| is the length of the neighboring list of v.(4) Chi-Square Statistic Computation: The above computed sym-bol probabilities are multiplied by lenv to obtain the expected oc-
1286

currence counts of the symbols. The overlap between the label listsLNLG
u and LNLQv provides the actual observed occurrences for the
symbols. Using these, the χ2 value is computed (from Eq. (1)).The 3-tuple 〈u, v, χ2
uv〉 is pushed into the primary heap, PH, as acandidate. This procedure is performed for all the vertex pairs.
Returning to our example, the observed symbol count for 〈v2, q2〉isO[lv2 ] = [0, 1, 1] corresponding to s0, s1, s2 respectively. UsingEq. (13) to (15), the expected symbol counts (W = 2, |Σ| = 5) areE[lv2 ] = 2 × [0.4096, 0.4608, 0.1296]. The chi-square statisticalsignificance, therefore, is χ2
〈v2,q2〉 = 2.9424.
4.4 Generating Approximate MatchThe approximate subgraph generation process for NAGA is sim-
ilar to VELSET, albeit with one significant difference; it greedilyconsiders only the adjacent vertices present in the neighborhood ofboth G and Q (with exact label match constraint).
The top match Match(1) is initialized with the pair 〈u, v〉 hav-ing the maximum χ2 value. An empty secondary max-heap SH isinitialized, and the vertices u and v are marked as “done”. Theneighborhoods of u and v are then explored by visiting their ad-jacent vertices. Vertex pairs of the form 〈x, y〉 with x and y hav-ing the same label, and adjacent to u and v respectively, are con-structed. The χ2 values for the new vertex pairs are computed andthe corresponding 3-tuples are inserted into SH. The tuple with themaximum χ2 value is next extracted from SH, the correspondingpair is added to Match(1), and neighbors of the newly extractedvertices are visited. The procedure is iterated till Q is exhaustedor SH is empty. Match(1) is reported as the best approximatematching subgraph.
To obtain top-k matches, SH is reset, the next best candidatefrom PH is extracted, and the process is repeated.
4.5 AnalysisAlthough the worst-case theoretical time complexity of NAGA
remains the same as that of VELSET, the use of exact label matchduring vertex pair generation along with overlapped neighborhoodsearch for subgraph matching significantly reduces the number ofcandidate vertex pairs constructed by NAGA, thereby leading tolesser heap operations during the subsequent operational stages.Hence, overall, NAGA is much faster than VELSET. AlthoughNAGA can withstand structural noise robustly, it is susceptible tonoisy vertex labels due to the constraint of exact label matching.
In effect, NAGA provides an efficient “light-weight” approachfor approximate subgraph matching for real-time applications ascompared to VELSET. Hence, the combination of them caters tovaried applications with diverse characteristics.
4.6 Missing Labels and Edge LabelsWe now briefly discuss possible modifications to VELSET and
NAGA for applicability to different input scenarios.The graphs may suffer from missing labels due to unknown val-
ues or garbled information obtained during the graph construction.Both VELSET and NAGA handle that by matching only the ver-tices with available labels. The subsequent adjacent vertices withmissing labels are considered to match any other label and will,thus, match any vertex for insertion into the secondary heap.
If the graphs contain labeled edges, the algorithms can be adaptedby augmenting the label alphabet set with the edge labels. There-after, the graphs are modified by replacing the labeled edge by in-serting an extra vertex, with its label as the original edge label, inbetween the pair of vertices connected by the edge. In this manner,the entire graph is converted to have only vertex labels.
5. EXPERIMENTAL RESULTS5.1 Experimental SetupDatasets: We use the following two large publicly available knowl-edge graph corpora for our evaluation:• YAGO Entity Relationship Graph (http://www.yago-knowledge.
org/): This dataset provides a knowledge graph [39] containingnamed-entities (i.e., persons, organizations, etc.) harvested fromWikipedia and the inter-relations linking the entities. The under-lying graph, stored as RDF triples (subject-predicate-object) [26],contains 12,811,149 vertices and 18,282,215 edges with 9,505,202unique named entities forming the node labels.• IMDB Network (http://www.imdb.com/interfaces): The Internet
Movie Database contains named-entities as movies, actors, etc.,along with their relationships represented as RDF triples com-prising of 2,932,657 vertices and 11,040,166 edges. The entitiesare considered as vertex labels (and are, thus, unique), while thetype information for each vertex was ignored in our setup.
Query Generation: The queries were generated by extracting sub-graphs from the target graph and subsequently introducing noise:(1) structural noise: a small fraction (up to 33%) of edges in thesubgraph were randomly and uniformly inserted or deleted,(2) label noise: a small fraction (up to 33%) of vertex labels wererandomly and uniformly modified by insertion of random strings.
We thus benchmark the performance of the algorithms acrossfour different query scenarios:(a) exact matching subgraphs with no noise (Exact Match),(b) subgraphs with structural noise only (Noisy Edges),(c) subgraphs with label noise only (Noisy Labels), and(d) subgraphs with both structural and label noise (Combined).
For each dataset and for each query scenario, we generated 20random queries with the following query sizes: 3, 5, 7, 9, 11, 13.Competing Methods: We compare our proposed algorithms againsttwo state-of-the-art approaches that claim to the best in runningtime and/or accuracy: (1) NeMa [24], and (2) SIM-T [27].Quality Evaluation: For each query graph Q, the original sub-graph of G perturbing which Q was generated, was considered asthe “ground truth” of the best match. Although other subgraphs ofG might match a query subgraph, the probability of such chancematches under random noise insertion is quite low. Further, sincethere is no way to ascertain the ground truth for second or later bestsubgraph matches, the quality results were assessed only for k = 1.We report precision (P), recall (R), and F1 score (F1) for the algo-rithms. The Jaccard similarity threshold was fixed to τ = 0.5.Setup: The algorithms were implemented in C++ and experimentsconducted on 64-bit 4-core 2.4GHz Intel Xeon with 512GB RAM.
5.2 Comparison ResultsWe use the aforementioned 480 (4×6×20) queries to compare
against the two benchmark algorithms for both the datasets.Fig. 4 and Fig. 5 depict the obtained results. Table 1 and Table 2
summarize the overall averaged results over the different querysizes, and also show the individual precision recall, and F1 scores.Exact Match: When an exact subgraph of G is posed as a query,both VELSET and NAGA exhibit very high accuracy. This hap-pens as exact vertex matches have the largest χ2 values. NeMa alsoshows good accuracy although SIM-T suffers a bit. The runningtime increases with the query size since the number of neighbor-hood candidate regions increases in a super-linear manner with thenumber of vertices. For the IMDB dataset, NAGA always finds thebest match and has, therefore, a 100% F1 score. NAGA is also thefastest algorithm, although for larger query sizes in YAGO, NeMais seen to be slightly better. Overall, NAGA performs the best interms of both running time and quality as evident from the tables.
1287
Table 1: Average F1 score (%) and running time results over varying graph matching queries for YAGO dataset.
Query ScenarioQuality Performance Running Time Performance (in sec)
NeMa SIM-T VELSET NAGA NeMa SIM-T VELSET NAGAP R F1 P R F1 P R F1 P R F1Exact Match 99.11 86.08 92.14 82.19 82.19 82.19 95.24 95.24 95.24 98.91 98.91 98.91 224.94 564.83 275.99 177.58Noisy Edges 99.57 86.46 92.55 86.40 86.40 86.40 96.63 96.63 96.63 97.32 97.32 97.32 226.14 644.25 272.22 185.70Noisy Labels 98.61 84.62 91.08 68.72 68.72 68.72 95.26 95.26 95.26 97.32 52.78 68.44 226.67 544.70 262.69 163.96
Combined 99.55 86.59 92.62 71.63 71.63 71.63 94.67 94.67 94.67 95.64 53.18 68.36 225.48 631.97 248.19 196.70Average 99.21 85.94 92.10 77.23 77.23 77.23 95.45 95.45 95.45 97.30 75.55 85.06 225.81 596.44 264.77 180.98
Table 2: Average F1 score (%) and running time results over varying graph matching queries for IMDB dataset.
Query ScenarioQuality Performance Running Time Performance (in sec)
NeMa SIM-T VELSET NAGA NeMa SIM-T VELSET NAGAP R F1 P R F1 P R F1 P R F1Exact Match 92.70 92.31 92.50 80.29 80.29 80.29 95.95 95.95 95.95 100 100 100 29.43 152.75 43.32 7.03Noisy Edges 91.22 90.98 91.10 79.68 79.68 79.68 98.94 98.94 98.94 100 100 100 29.50 170.18 42.35 6.98Noisy Labels 92.65 62.16 74.40 60.31 60.31 60.31 98.90 98.90 98.90 100 53.73 69.90 29.33 153.02 42.79 6.34
Combined 91.44 58.61 71.43 63.48 63.48 63.48 97.84 97.84 97.84 98.33 45.92 62.61 28.98 171.76 45.31 6.51Average 92.00 76.01 83.25 70.94 70.94 70.94 97.91 97.91 97.91 99.58 74.91 85.50 29.31 161.93 43.44 6.71
Table 3: Overall performance synopsis of the algorithms.
MethodsYAGO IMDB
F1 Running Indexing F1 Running Indexing(%) Time (s) Time (s) (%) Time (s) Time (s)
VELSET 95.45 264.77 1,205 97.91 43.44 209NAGA 85.06 180.98 250 85.50 6.71 132NeMa 92.10 225.81 ∼10,000 83.25 29.31 ∼10,000SIM-T 77.23 596.44 374 70.94 161.93 107
Noisy Edges: When only structural mismatch is introduced in theform of noisy edges, NAGA again performs the best. Interestingly,it still maintains an F1 of 100% for IMDB 97% for YAGO. Thisestablishes the robustness of the formulated chi-square measure inextracting the best regions. Since in IMDB, the labels are uniqueand, therefore, there is only a slight increase in the number of can-didate vertices with increase in query size, NAGA exhibits almostconstant running time. The results also show that the overtly con-servative strategy of generating all vertex pairs that have similarlabels (and not strictly the same) in VELSET is an overkill whenthere are no noisy labels. In fact, it may lead to extraction of wrongsubgraph regions. NeMa is reasonably accurate and fast as well.Noisy Labels: However, the situation is quite different when noisylabels are introduced but the structure is unaltered. VELSET out-performs NAGA by a large margin for both the datasets. NAGA ismuch faster than NeMa. VELSET is much better overall with onlyslightly more running time than NeMa. SIM-T does not seem toperform well for any dataset. For YAGO, NeMa shows reasonableaccuracy. However, for IMDB, NeMa performs much worse as allthe labels in IMDB are unique and it fails to leverage the close-ness of labels in the query to that in the input graph. The recall ofNAGA suffers since it has a strict label equality requirement and,hence, refuses to examine nodes with even a slight label mismatch.Consequently, it misses out on good regions. As a result, the F1score is low as well. However, the candidate regions returned byNAGA are always good, thereby letting it achieve high precision.Combined: The fourth and final query scenario where both struc-tural and label noise are combined show similar trends: NAGA isextremely fast but has poor recall while VELSET has very highaccuracy and has comparable running times with NeMa. SIM-Tperforms poorly in terms of both running time and quality. Thus,VELSET is able to handle both types of errors effectively.Overall Comparison: The overall synopsis of the comparisonsis shown in Table 3. It is clear that VELSET is the most accu-rate heuristic. The comparative advantage is larger for IMDB thanYAGO due to larger fraction of unique labels. VELSET achievesclose to 95% F1 score or more in all the datasets and query scenar-ios. NAGA achieves more than 85% F1 score for both the datasetsand is comparable with NeMa for IMDB. Strangely enough, thetabu search based SIM-T (designed for such applications) fails toachieve a high quality. This may be due to its dependency on theinitial solution guess which, if bad, does not allow it to recover.
When running times are compared, NAGA is undoubtedly thefastest. For the million scale IMDB dataset, it produces resultswithin 7 seconds. NeMa is 4 times slower while VELSET requires7 times more running time. SIM-T is orders of magnitude slower.On YAGO, NAGA is again the most efficient, and runs 1.25 timesfaster than NeMa. VELSET is slightly slower than NeMa. SIM-Tis slower due to the inherent complexity of the tabu search method.
Table 3 also shows the indexing time required for the differentalgorithms. The only index information required for VELSET andNAGA are the lists created from the input graph. Consequently, thepre-processing time spent offline is quite low. This also imparts anupdate-friendly nature to these proposed algorithms. Any changein the input graph in either the structure or the labels including ad-dition and deletion of nodes and edges can be quickly absorbed byboth VELSET and NAGA. VELSET requires more pre-processingtime than NAGA due to computation of Jaccard similarities to as-certain which labels are considered similar. SIM-T does not requiremuch indexing either. NeMa, on the other hand, builds an elaborateindex based on the two-hop neighborhood of each vertex, therebyrequiring a substantial amount of indexing time.
Finally, the index sizes required by the different algorithms are∼5GB for NeMa,∼8GB for SIM-T, and∼10GB for VELSET andNAGA. Hence, all of them are good enough to run in standard com-modity machines with 16GB of RAM or more.Summary: The above empirical results help establish the follow-ing insights. If accuracy is of paramount importance, the VELSETalgorithm should be chosen. However, if there is no fuzziness interms of labels and only structural mismatches can happen, or run-time is the decisive criterion, NAGA should be employed. Thus,our suite of algorithms, VELSET and NAGA, cater to different ap-plication scenarios and can be selected based on need.
5.3 Effect of ParametersWe next explored the performance of VELSET and NAGA with
variations in parameter settings. Results on the IMDB dataset wereaveraged over 120 randomly generated queries of varying lengthsranging from 3 to 13 uniformly across the different query scenarios.Top-k: We varied the number of top-k approximate subgraph matches.Fig. 6(a) shows the results. The running time of both VELSET andNAGA shows a linear increase with k, due to the iterative natureof extracting the top-k matches. The time spent on initial candi-date generation is constant irrespective of k. NAGA shows betterscalability than VELSET since the sizes of its secondary heaps aresmaller due to more stringent label matching criterion.Label Similarity Threshold: The label similarity threshold, τ ,controls the number of candidate vertex pairs generated for VELSET.(NAGA does not use τ .) A low value of τ provides an aggressiveapproach, whereby even weakly matching vertex labels are con-sidered as candidates, thereby leading to the generation of large
1288

60
70
80
90
100
(a) Exact
F1
Sco
re (
%)
NeMaVELSET
NAGASim-T (b) Edge
NeMaVELSET
NAGASim-T
60
70
80
90
100
3 5 7 9 11 13
(c) Label
F1
Sco
re (
%)
Query Size
NeMaVELSET
NAGASim-T
3 5 7 9 11 13
(d) Combined
Query Size
NeMaVELSET
NAGASim-T
20200
500
750
1100
(a) Exact
Ru
n T
ime
(se
c)
NeMaVELSET
NAGASim-T
(b) Edge NeMaVELSET
NAGASim-T
20200
500
750
1100
3 5 7 9 11 13
(c) Label
Ru
n T
ime
(se
c)
Query Size
NeMaVELSET
NAGASim-T
3 5 7 9 11 13
(d) Combined
Query Size
NeMaVELSET
NAGASim-T
(i) Quality (ii) Running timeFigure 4: YAGO dataset: (i) F1 score and (ii) Running time performance for varying query sizes for different query scenarios.
50
60
70
80
90
100
(a) Exact
F1
Sco
re (
%)
NeMaVELSET
NAGASim-T (b) Edge
NeMaVELSET
NAGASim-T
50
60
70
80
90
100
3 5 7 9 11 13
(c) Label
F1
Sco
re (
%)
Query Size
NeMaVELSET
NAGASim-T
3 5 7 9 11 13
(d) Combined
Query Size
NeMaVELSET
NAGASim-T
5
50
100
150
225
300
(a) Exact
Ru
n T
ime
(se
c)
NeMaVELSET
NAGASim-T
(b) Edge NeMaVELSET
NAGASim-T
5
50
100
150
225
300
3 5 7 9 11 13
(c) Label
Ru
n T
ime
(se
c)
Query Size
NeMaVELSET
NAGASim-T
3 5 7 9 11 13
(d) Combined
Query Size
NeMaVELSET
NAGASim-T
(i) Quality (ii) Running timeFigure 5: IMDB dataset: (i) F1 score and (ii) Running time performance for varying query sizes for different query scenarios.
0
10
20
30
40
50
60
70
1 2 3 4 5 6 7 8 9 10
Run T
ime (
sec)
Top-k Subgraphs
VELSETNAGA
40
42
44
46
48
50
52
54
0.2 0.3 0.4 0.5 0.6 0.7 0.8 0.9 1 75
80
85
90
95
100
Run T
ime (
sec)
F1 S
core
(%
)
Similarity Threshold
Run-time
Accuracy
(a) Effect of k (b) Effect of τFigure 6: Performance on IMDB dataset: Effect of (a) size of an-swer set, k, on running time, (b) similarity threshold τ on VELSET.
80
85
90
95
100
0 20 40 60 80 100
F1
sco
re (
%)
% of dataset used
VELSET
NAGA 0
50
100
150
200
0 20 40 60 80 100
Tim
e (
se
c)
% of dataset used
VELSET QueryNAGA Query
VELSET IndexNAGA Index
(a) Quality (b) Running timeFigure 7: Scalability results on IMDB dataset.
number of candidate vertex pairs. A large τ has the opposite effect.Hence, the running time of VELSET decreases with τ , as shownin Fig. 6(b). Smaller values of τ , however, affect the quality sincetoo many vertex candidate pairs are generated. On the other hand,a large value of τ does not allow enough candidate pairs to be ex-plored. An extreme τ = 1 ensures that the labels must be exactlythe same, making VELSET behave similar to NAGA. Empirically,τ = 0.5 provided the best balance, and was hence set as default.Scalability: We next evaluated the impact of varying input graphsizes. We extracted different sized datasets from IMDB by ran-domly sampling 10% to 100% of its vertices and the associatededges. With increase in size, the number of matching vertices in-creases, thereby generating more vertex pairs and increasing the
70
75
80
85
90
95
100
0 5 10 15 20
F1
sco
re (
%)
Avg. vertex degree
VELSET
NAGA 0
100
200
300
400
0 5 10 15 20
Tim
e (
se
c)
Avg. vertex degree
VELSET Query
NAGA Query
VELSET Index
NAGA Index
(a) Quality (b) Running timeFigure 8: Robustness results on dense Pokec dataset.
running time, as shown in Fig. 7. The increments in running timeare sub-linear, thereby showcasing the scalability of the algorithms.Density: To evaluate the robustness of the proposed algorithmsin tackling denser graphs, we used the Pokec social network fromsnap.stanford.edu/data/soc-pokec.html. The network consists of1,632,803 vertices (with unique labels) and 30,622,564 friendshiplinks representing edges. We created multiple datasets by varyingthe average vertex degree by randomly sampling 10% to 100% ofthe edges while retaining all the vertices. The results are shown inFig. 8. We observed the density of the input graph to have little im-pact on the quality of the algorithms. VELSET depicts an accuracyof 100%, while NAGA attains a slightly lower accuracy. Interest-ingly, although the number of neighbors per vertex increased, thedensity of the graph had only a slight impact on query runtime.
6. CONCLUSIONSIn this paper, we introduced the use of statistical significance
to efficiently discover the best approximate subgraphs matching aquery. We proposed two algorithms, VELSET and NAGA, tunedtowards accuracy and efficiency respectively, to cater to differentapplication settings. We experimentally showed them to outper-form existing state-of-the-art algorithms on real-life large datasets.
In future, we plan to study the applicability of statistical signifi-cance model to other graph problems.
1289

7. REFERENCES[1] C. C. Aggarwal and H. Wang. Managing and Mining Graph Data,
chapter Graph Data Management and Mining: A Survey ofAlgorithms and Applications, pages 13–68. Springer, 2010.
[2] A. Arora, M. Sachan, and A. Bhattacharya. Mining statisticallysignificant connected subgraphs in vertex labeled graphs. InSIGMOD, pages 1003–1014, 2014.
[3] L. Babai. Graph isomorphism in quasipolynomial time. In STOC,pages 684–697, 2016.
[4] P. Barcelo, L. Libkin, and J. L. Reutter. Querying graph patterns. InPODS, pages 199–210, 2011.
[5] G. Bejerano, N. Friedman, and N. Tishby. Efficient exact p-valuecomputation for small sample, sparse and surprisingly categoricaldata. JCB, 11(5):867–886, 2004.
[6] A. Bordes, S. Chopra, and J. Weston. Question answering withsubgraph embeddings. In EMNLP, pages 615–620, 2014.
[7] C. Chen, X. Yan, P. S. Yu, J. Han, D. qing Zhang, and X. Gu.Towards graph containment search and indexing. In VLDB, pages926–937, 2007.
[8] J. Cheng, Y. Ke, W. Ng, and A. Lu. FG-Index: Towardsverification-free query processing on graph databases. In SIGMOD,pages 857–872, 2007.
[9] D. Conte, P. Foggia, C. Sansone, and M. Vento. Thirty years of graphmatching in pattern recognition. IJPRAI, 18(3):265–298, 2004.
[10] S. A. Cook. The complexity of theorem-proving procedures. InSTOC, pages 151–158, 1971.
[11] L. P. Cordella, P. Foggia, C. Sansone, and M. Vento. A (sub)graphisomorphism algorithm for large graphs. PAMI, 26(10):1367–1372,2004.
[12] M. K. Das and H. K. Dai. A survey of DNA motif finding algorithms.BMC Bioinf., 8(7):1–13, 2007.
[13] S. Dutta. MIST: Top-k approximate sub-string mining using tripletstatistical significance. In ECIR, pages 284–290, 2015.
[14] S. Dutta and A. Bhattacharya. Most significant substring miningbased on chi-square measure. In PAKDD, pages 319–327, 2010.
[15] W. Fan, J. Li, J. Luo, Z. Tan, X. Wang, and Y. Wu. Incremental graphpattern matching. In SIGMOD, pages 925–936, 2011.
[16] W. Fan, J. Li, S. Ma, N. Tang, Y. Wu, and Y. Wu. Graph patternmatching: From intractable to polynomial time. PVLDB,3(1-2):264–275, 2010.
[17] B. Gallagher. Matching structure and semantics: A survey ongraph-based pattern matching. In AAAI, pages 45–53, 2006.
[18] R. Giugno and D. Shasha. GraphGrep: A fast and universal methodfor querying graphs. ICPR, 2:201–212, 2002.
[19] W.-S. Han, J. Lee, M.-D. Pham, and J. X. Yu. iGraph: A frameworkfor comparisons of disk-based graph indexing techniques. PVLDB,3(1-2):449–459, 2010.
[20] B. Hixon, P. Clark, and H. Hajishirzi. Learning knowledge graphs forquestion answering through conversational dialog. In NAACL, pages851–861, 2015.
[21] Y. Jia, J. Zhang, and J. Huan. An efficient graph-mining method forcomplicated and noisy data with real-world applications. Knowledgeand Information Systems, 28(2):423–447, 2011.
[22] H. Jiang, H. Wang, P. S. Yu, and S. Zhou. GString: A novel approachfor efficient search in graph dbs. In ICDE, pages 566–575, 2007.
[23] B. P. Kelley, B. Yuan, F. Lewitter, R. Sharan, B. Stockwell, andT. Ideker. PathBLAST: A tool for alignment of protein interactionnetworks. Nucleic Acids Res., 32:83–88, 2004.
[24] A. Khan, Y. Wu, C. C. Aggarwal, and X. Yan. NeMa: Fast graphsearch with label similarity. VLDB, 6(3):181–192, 2013.
[25] A. Khan, X. Yan, and K.-L. Wu. Towards proximity pattern miningin large graphs. SIGMOD, pages 867–878, 2010.
[26] G. Klyne and J. J. Carroll. Resource description framework (RDF):Concepts and abstract syntax.http://www.citeulike.org/group/2170/article/532408, 2006.
[27] S. Kpodjedo, P. Galinier, and G. Antoniol. Using local similaritymeasures to efficiently address approximate graph matching. Disc.Appl. Math., 164:161–177, 2014.
[28] M. Kuramochi and G. Karypis. Frequent subgraph discovery. ICDM,pages 313–320, 2001.
[29] M. Kuramochi and G. Karypis. GREW – A scalable frequentsubgraph discovery algorithm. ICDM, pages 439–442, 2004.
[30] M. Kuramochi and G. Karypis. Finding frequent patterns in a largesparse graph. Data Mining & Know. Disc., 11(3):243–271, 2005.
[31] Z. Liang, M. Xu, M. Teng, and L. Niu. NetAlign: A web-based toolfor comparison of protein interaction networks. Bioinf.,22(17):2175–2177, 2006.
[32] M. Mongiovi, R. Di Natale, R. Guigno, A. Pulvirenti, A. Ferro, andR. Sharan. SIGMA: A set-cover-based inexact graph matchingalgorithm. JBCB, 8(2):199–218, 2010.
[33] T. Read and N. Cressie. Pearson’s χ2 and the likelihood ratio statisticG2: a comparative review. Int. Statistical Review, 57(1):19–43, 1989.
[34] T. R. C. Read and N. A. C. Cressie. Goodness-of-fit statistics fordiscrete multivariate data. Springer Series in Statistics, 1988.
[35] M. Sachan and A. Bhattacharya. Mining statistically significantsubstrings using the χ2 statistic. PVLDB, 5(10):1052–1063, 2012.
[36] H. Shang, Y. Zhang, X. Lin, and J. Yu. Taming verification hardness:An efficient algorithm for testing subgraph isomorphism. PVLDB,1(1):364–375, 2008.
[37] R. Shen and C. Guda. Applied graph-mining algorithms to studybiomolecular interaction networks. BioMed Research Int.,2014(article 439476):11, 2014.
[38] R. Singh, J. Xu, and B. Berger. Global alignment of multiple proteininteraction networks with application to functional orthologydetection. PNAS, 105(35):12763–12768, 2008.
[39] F. M. Suchanek, G. Kasneci, and G. Weikum. YAGO: A core ofsemantic knowledge. In WWW, pages 697–706, 2007.
[40] B. Sun. Mining, Indexing, and Search Approach to Entity and GraphInformation Retrieval for Chemoinformatics. PhD thesis,Pennsylvania State Univ., 2008.
[41] Y. Tian, R. McEachin, C. Santos, D. States, and J. Patel. SAGA: Asubgraph matching tool for biological graphs. Bioinf.,23(2):232–239, 2006.
[42] Y. Tian and J. Patel. TALE: A tool for approximate large graphmatching. In ICDE, pages 963–972, 2008.
[43] H. Tong and C. Faloutsos. Center-piece subgraphs: problemdefinition and fast solutions. In KDD, pages 404–413, 2006.
[44] H. Tong, C. Faloutsos, B. Gallagher, and T. Eliassi-Rad. Fastbest-effort pattern matching in large attributed graphs. In KDD, pages737–746, 2007.
[45] W. H. Tsai and K. Fu. Error-correcting isomorphisms of attributedrelational graphs for pattern recognition. IEEE Systems, Man, andCybernetics, 9(12):757–768, 1979.
[46] J. R. Ullmann. An algorithm for subgraph isomorphism. JACM,23(1):31–42, 1976.
[47] F. Vandin, E. Upfal, and B. J. Raphael. Algorithms for detectingsignificantly mutated pathways in cancer. JCB, 18(3):507–522, 2011.
[48] J. Wang, N. Ntarmos, and P. Triantafillou. Indexing query graphs tospeedup graph query processing. In EDBT, pages 41–52, 2016.
[49] X. Yan and J. Han. gSpan: Graph-based substructure pattern mining.ICDM, pages 721–724, 2002.
[50] X. Yan, P. S. Yu, and J. Han. Graph indexing based on discriminativefrequent structure analysis. TODS, 30(4):960–993, 2005.
[51] X. Yan, P. S. Yu, and J. Han. Substructure similarity search in graphdatabases. In SIGMOD, pages 766–777, 2005.
[52] S. Zhang, J. Li, H. Gao, and Z. Zou. A novel approach for efficientsupergraph query processing on graph databases. In EDBT, pages204–215, 2009.
[53] S. Zhang, S. Li, and J. Yang. GADDI: Distance index based subgraphmatching in biological networks. In EDBT, pages 192–203, 2009.
[54] S. Zhang, J. Yang, and W. Jin. SAPPER: Subgraph indexing andapproximate matching in large graphs. PVLDB, 3:1185–1194, 2010.
[55] L. Zou, L. Chen, J. X. Yu, and Y. Lu. A novel spectral coding in alarge graph database. In EDBT, pages 181–192, 2008.
[56] Q. Zou, S. Liu, and W. W. Chu. Ctree: A compact tree for indexingXML data. In WIDM, pages 39–46, 2004.
1290

![Dynamic Application Autotuning for Self-aware Approximate ... · 7.2 Autonomic Computing and Application Autotuning In the context of autonomic computing [7], we perceive a computing](https://img.pdfslide.net/doc/110x75/5ea72c8ef794963bf61d4fd8/dynamic-application-autotuning-for-self-aware-approximate-72-autonomic-computing.jpg)
![Selection-Channel-Aware Rich Model for Steganalysis of ... · Using Selection Channel for Steganalysis I [BOSS, IH 2011] no successful attack on HUGO based on approximate knowledge](https://img.pdfslide.net/doc/110x75/5f92cd181c861b46943aa0e9/selection-channel-aware-rich-model-for-steganalysis-of-using-selection-channel.jpg)