Embed Size (px)
Citation preview
Master of Public Health
Master de Santé Publique
Neighborhood risk factors of low birthweight in Paris-
city
Nina AHLERS Class and year of the Master: EOHS, Master II
Location of the practicum: EHESP Broussais Professional & academic advisor: Séverine Deguen
École des hautes études en santé publique

ACKNOWLEDGMENTS
I would like to thank my academic and professional supervisor Dr. Severine Deguen for giving me the
opportunity to take part in this study she proposed, in addition for her support and guidance throughout the
entire placement period. Additionally, I would also like to thank the rest of the Equit’Area team including Dr.
Denis Zmirou Navier and Wahida Kihal-Talantikite, PhD for having acquired the data and resources used in
this study. Personally, I would like to further thank Wahida for her research assistance and technical expertise.
And lastly, a special thanks to researcher Maxim Jeanjean for providing me with analytical support, and David
Kelly and Jovana Dodos for their constructive feedback.
LIST OF ABBREVIATIONS
EU......................................................................................................................................European Union
GIS...........................................................................................................Geographic information systems
INSEE...................................................................... National Institute of Statistics and Economic Studies
IRIS............................................. Îlot Regroupé pour l’Information Statistique (French census block unit)
LBW...................................................................................................................................Low birth weight
LLr.................................................................................................................................Log likelihood ratio
LUR..................................................................................................................Land use regression model
Term LBW...........................................................................................................Full term low birth weight
NO2....................................................................................................................................Nitrogen dioxide
OR..............................................................................................................................................Odds ratio
PM2.5................................................Particulate matter with an aerodynamic diameter of less
PM10.............................
RR............................................................................................................................................Relative risk
SES..........................................................................................................................Socioeconomic Status
SGA.....................................................................................................................Small for gestational age
3
TABLE OF CONTENTS
Page
ACKNOWLEDGMENTS ................................................................................................................... 2
LIST OF ABBREVIATIONS .............................................................................................................. 2
TABLE OF CONTENTS ................................................................................................................... 3
1.INTRODUCTION .............................................................................................................. 4
1.1 Public health context ........................................................................... 4
1.2 Socioecnomic individual risk factors ................................................... 6
1.3 Contextual enviornmental risk factors ................................................. 6
1.3.1 Particulate Matter (PM2.5 & PM10) .............................................. 7
1.3.2 Nitrogen dioxide (NO2) .............................................................. 7
1.4 Policy limitations.................................................................................. 7
1.5 Improved modeling approach ............................................................. 8
1.5.1 Multlevel modeling ..................................................................... 8
1.5.2 Spatial analysis .......................................................................... 8
2.METHODS AND MATERIALS ......................................................................................... 9
2.1 Study setting ....................................................................................... 9
2.2 Neighborhood characteristics ............................................................. 9
2.2.1 IRIS ............................................................................................ 9
2.2.2 Sociol deprivation idex ............................................................ 10
2.2.3 Air pollution data ...................................................................... 10
2.3 Individual data ................................................................................... 10
2.3.1 Study population ...................................................................... 10
2.3.2 Health outcome ....................................................................... 11
2.4 Statistical methods ............................................................................ 11
2.4.1 Spatial methodology ................................................................ 11
2.4.2 Logistic multilevel methodology ............................................... 12
3.RESULTS ....................................................................................................................... 13
3.1 Descriptive analysis .......................................................................... 13
3.1.1 Spatial distribution of LBW and term LBW rate……………… 14
3.1.2 Spatial distribution of exposures ............................................. 14
3.1.3 Individual characteristics ......................................................... 14
3.2 Spatial results .................................................................................... 18
3.2.1 Identification of LBW clusters .................................................. 18
3.2.2 Identification of term LBW clusters .......................................... 19
3.2.2.1 Unadjusted analysis ......................................................... 19
3.2.2.2 Adjusted analysis.............................................................. 20
3.3 Multilvel results.................................................................................. 22
4.DISCUSSION ................................................................................................................. 26
4.1 Study summary ................................................................................. 26
4.2 Interpreation of results and associative findings ............................... 26
4.2 Statistical weaknesses ...................................................................... 28
4.3 Alternative findings and study recommendations ............................ 28
4.4 Exposure assessment limitations ...................................................... 29
4.4 Exposure assessment strengths ....................................................... 29
5.CONCLUSION ............................................................................................................... 30
BIBLIOGRAPHY ............................................................................................................................ 31
ANNEX 1. University of Sheffield ethical approval......................................................................... 36
ABSTRACT .................................................................................................................................... 38
ABSTRACT (Français) ................................................................................................................... 39
4
1. Introduction
1.1 Public Health Context
Low birth weight (LBW) is an adverse pregnancy outcome that has recently been given great attention due to
its relative higher frequency among adverse birth outcomes1 and increased incidence in the past two decades.
Based on epidemiological observations, LBW is defined by the World Health Organization as an infant
weighing less than 2,500 grams (5.5 pounds) at birth and is an international, standardized threshold regarding
measuring infant increased risk of death2. Despite programs and policies in a number of countries designed to
lower the incidence of adverse birth outcomes in the past 10 to 15 years, LBW has not decreased3. On the
contrary, in France, 6.4% of newborns were born with LBW in 2010, having increased by 23% since 19802.
LBW is a major public health burden with subsequent and long term adverse consequences in childhood
health and associated increased costs.
As an indicator of fetal growth restriction, LBW is a condition associated with increased mortality during the first
year of life4 and with adverse health outcomes that could extend well into adulthood. Long term sequelae
include the development of coronary heart disease5,6 hypertension7, non-insulin-dependent diabetes8, and is
also linked to increase incidence of stroke5, such outcomes that are considered as top causes of death in
developed countries9. In addition, LBW is associated with a greater risk of subsequent morbidity and higher
healthcare expenditure. Subsequent complications for infants born with low birth weight include respiratory
failures shortly after birth, and childhood asthma.10,11 Although, no national study has been conducted to date
in France with regards to socio-economic costs due to LBW in the country,12 a US study found that the mean
length of hospital stay for LBW is 12.9 days approximately costing $15,100 compared to an uncomplicated
birth with an average 1.9 hospital days costing approximately $600.13 Furthermore, US national research
estimated that the per-child cost of a LBW birth, throughout the child’s life, is about $51,000.14
As one of the single most important factors determining child survival with straining emotional and economic
costs, low birth weight is a critical child and maternal health issue. Addressing this challenge requires greater
epidemiological investigation to design more effective interventions.
1.2 Socioeconomic individual risk factors
There is a strong causal relationship between individual risk factors associated with maternal socioeconomic
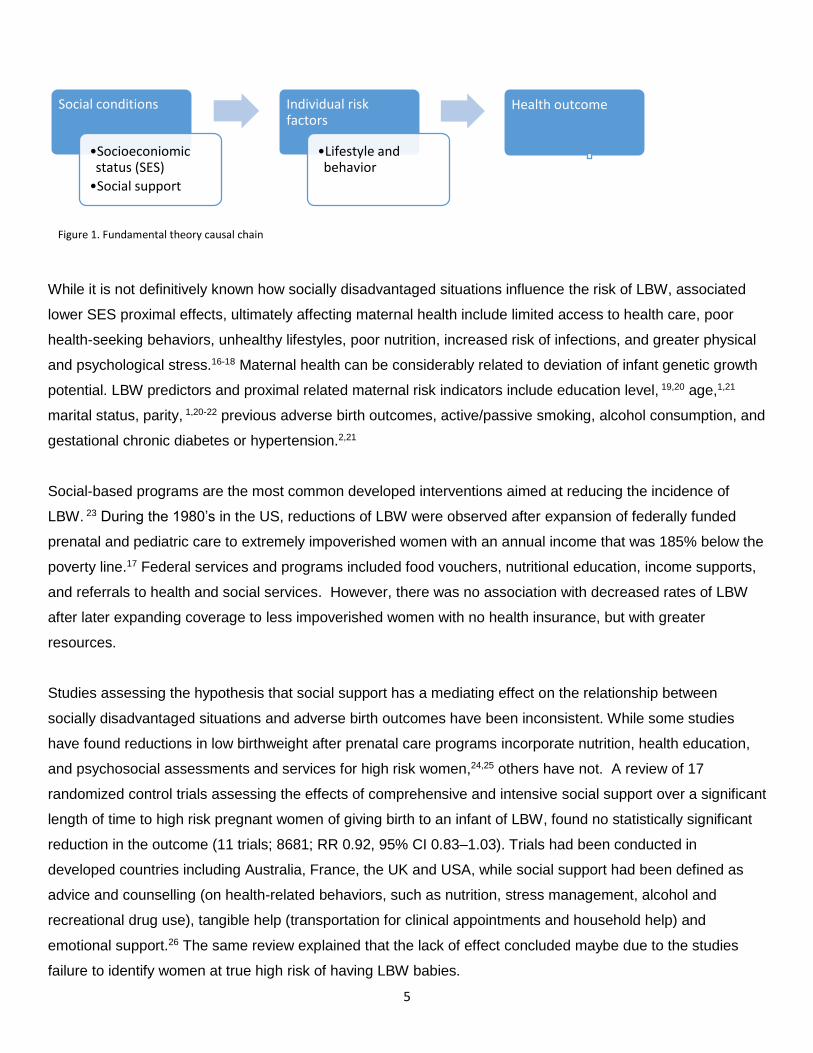
status (SES) to LBW. The fundamental causation theory, according to social epidemiologists, outlines the
causal chain of adverse health outcomes with social factors such as socioeconomic status being the distal,
fundamental cause of disease anteceding the mediate, proximal individual risk factors that directly affect health
such as lifestyle and behavior15 (figure 1).
5
While it is not definitively known how socially disadvantaged situations influence the risk of LBW, associated
lower SES proximal effects, ultimately affecting maternal health include limited access to health care, poor
health-seeking behaviors, unhealthy lifestyles, poor nutrition, increased risk of infections, and greater physical
and psychological stress.16-18 Maternal health can be considerably related to deviation of infant genetic growth
potential. LBW predictors and proximal related maternal risk indicators include education level, 19,20 age,1,21
marital status, parity, 1,20-22 previous adverse birth outcomes, active/passive smoking, alcohol consumption, and
gestational chronic diabetes or hypertension.2,21
Social-based programs are the most common developed interventions aimed at reducing the incidence of
LBW. 23 During the 1980’s in the US, reductions of LBW were observed after expansion of federally funded
prenatal and pediatric care to extremely impoverished women with an annual income that was 185% below the
poverty line.17 Federal services and programs included food vouchers, nutritional education, income supports,
and referrals to health and social services. However, there was no association with decreased rates of LBW
after later expanding coverage to less impoverished women with no health insurance, but with greater
resources.
Studies assessing the hypothesis that social support has a mediating effect on the relationship between
socially disadvantaged situations and adverse birth outcomes have been inconsistent. While some studies
have found reductions in low birthweight after prenatal care programs incorporate nutrition, health education,
and psychosocial assessments and services for high risk women,24,25 others have not. A review of 17
randomized control trials assessing the effects of comprehensive and intensive social support over a significant
length of time to high risk pregnant women of giving birth to an infant of LBW, found no statistically significant
reduction in the outcome (11 trials; 8681; RR 0.92, 95% CI 0.83–1.03). Trials had been conducted in
developed countries including Australia, France, the UK and USA, while social support had been defined as
advice and counselling (on health-related behaviors, such as nutrition, stress management, alcohol and
recreational drug use), tangible help (transportation for clinical appointments and household help) and
emotional support.26 The same review explained that the lack of effect concluded maybe due to the studies
failure to identify women at true high risk of having LBW babies.
Social conditions
•Socioeconiomic status (SES)
•Social support
Individual risk factors
•Lifestyle and behavior
Health outcome
Figure 1. Fundamental theory causal chain
6
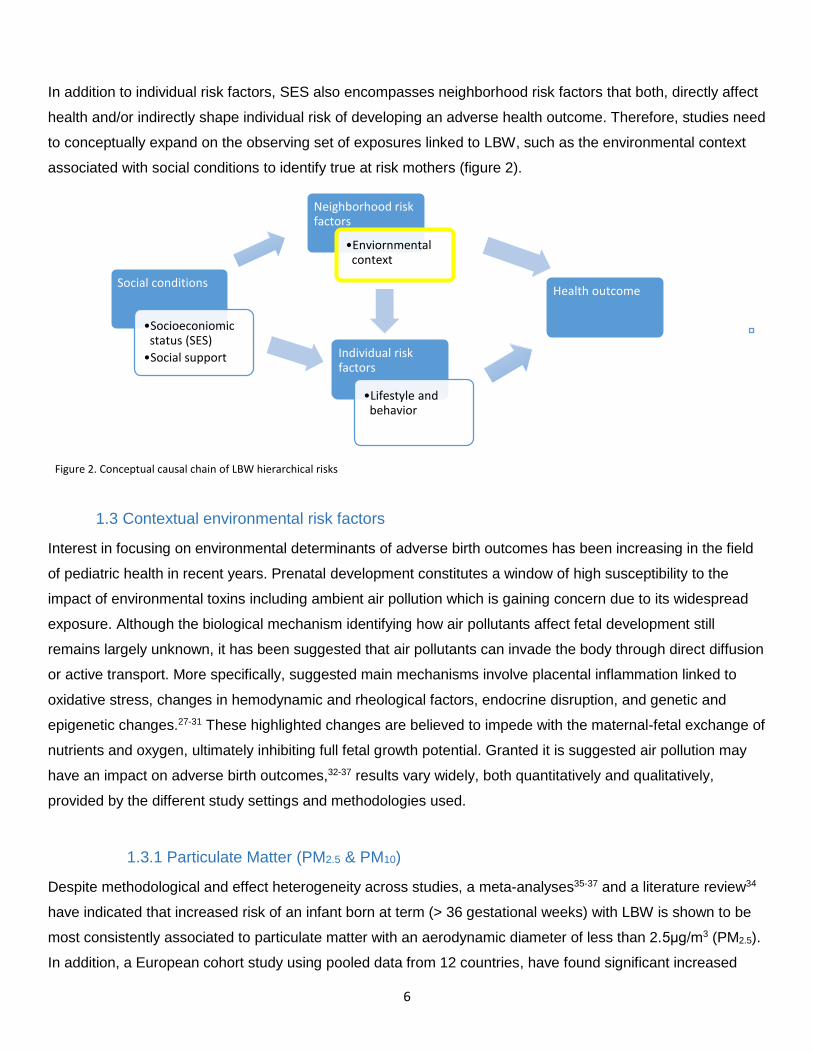
In addition to individual risk factors, SES also encompasses neighborhood risk factors that both, directly affect
health and/or indirectly shape individual risk of developing an adverse health outcome. Therefore, studies need
to conceptually expand on the observing set of exposures linked to LBW, such as the environmental context
associated with social conditions to identify true at risk mothers (figure 2).
1.3 Contextual environmental risk factors
Interest in focusing on environmental determinants of adverse birth outcomes has been increasing in the field
of pediatric health in recent years. Prenatal development constitutes a window of high susceptibility to the
impact of environmental toxins including ambient air pollution which is gaining concern due to its widespread
exposure. Although the biological mechanism identifying how air pollutants affect fetal development still
remains largely unknown, it has been suggested that air pollutants can invade the body through direct diffusion
or active transport. More specifically, suggested main mechanisms involve placental inflammation linked to
oxidative stress, changes in hemodynamic and rheological factors, endocrine disruption, and genetic and
epigenetic changes.27-31 These highlighted changes are believed to impede with the maternal-fetal exchange of
nutrients and oxygen, ultimately inhibiting full fetal growth potential. Granted it is suggested air pollution may
have an impact on adverse birth outcomes,32-37 results vary widely, both quantitatively and qualitatively,
provided by the different study settings and methodologies used.
1.3.1 Particulate Matter (PM2.5 & PM10)
Despite methodological and effect heterogeneity across studies, a meta-analyses35-37 and a literature review34
have indicated that increased risk of an infant born at term (> 36 gestational weeks) with LBW is shown to be
most consistently associated to particulate matter with an aerodynamic diameter of less than 2.5μg/m3 (PM2.5).
In addition, a European cohort study using pooled data from 12 countries, have found significant increased
Figure 2. Conceptual causal chain of LBW hierarchical risks
Social conditions
•Socioeconiomic status (SES)
•Social support Individual risk factors
•Lifestyle and behavior
Neighborhood risk factors
•Enviornmental context
Health outcome
7
risks to LBW among mothers exposed to mean PM2.5 concentrations of less than 25μg/m3 (OR 1.21, 95% CI
1.06–1.38), 20μg/m3 (OR 1.41, 95% CI 1.20-1.65), and 15μg/m3 (OR 1.79, 95% CI 1.29-2.48) during
pregnancy, such exposure mean concentrations that are even lower than the present European Union (EU)
annual limit of 25μg/m3. 20 With regards to maternal exposure to particulate matter with an aerodynamic
diameter of less than 10μg/m3 (PM10), a meta-analysis39 found no association to term LBW (OR 1.02, 95% CI
0.90–1.32), while another meta-analysis35 found an association to term LBW from maternal exposure
throughout the entire pregnancy (OR 1.03, 95% CI 1.01-1.05), consistent to other studies.39,40 The annual EU
exposure mean concentration limit for PM10 is 40 µg/m376.
1.3.1 Nitrogen Dioxide (NO2)
Recent findings on the association between nitrogen dioxide (NO2) and term LBW have been inconsistent
estimated by land use regression models (LUR) observing a positive association,20 negative associations,9,41
and no associations.42-44 The varying results could possibly be due to low spatial variability in the LUR models
with poor distribution heterogeneity of monitoring stations (general and roadside stations) from which the data
had been extracted,41,45 thus consistency may be hindered by exposure misclassification.42 Such
inconsistencies among research findings have set back policy implementation due to exposure measurement
uncertainties.35 The EU exposure mean concentration limit for NO2 per year is 40 µg/m376.
1.4 Policy limitations
Exposure assessments on the relationship between air pollution and adverse birth outcomes are often
challenged by obtaining spatially resolved estimates of exposure in large, population-based studies. Most
exposure assessments rely on regulatory monitoring networks for air pollution data, often assigning maternal
concentration levels according to the nearest, continuous monitor. Although such monitors can provide high
temporal resolution (daily and hourly data), spatial coverage is usually poor as few urban monitoring networks
collect pollutant concentration data at more than 20 locations.46-49 As air pollution geographically varies within a
city, there is a critical need to characterize variation in exposure associated with the spatial location of maternal
residences to identify true risk.
Among other study inconsistencies, a major drawback for policymakers is the lack of adequate control for
confounders20 including the interacting examination of individual and neighborhood level socioeconomic
indicators either alone or in combination, on the effect of air pollution on birth outcomes. 18 Given that air
pollution levels are often highest in the most socioeconomically deprived areas, greater exposure spatial
resolution and adjustment for major SES indicators are needed to capture the intra-urban differences at both,
the individual and neighborhood level to identify the attributable variability explained.50,51 While many studies
have adjusted effect estimates of air pollutants on term LBW for major risk factors indicative of growth
8
restriction (i.e. socioeconomic factors), only a few have looked at the potential confounding and interacting
effects of individual and neighborhood socioeconomic related variables.52,53 However, these studies have only
used one level models, thus neighborhood contextual variables were assessed as individual risk factors.
1.5 Improved modeling approach
1.5.1 Multilevel modeling
Multilevel modeling is indicated to be a useful way to analyze the relationships between community level
environmental data, individual risk factors, and birth outcomes.54 Studies using multilevel hierarchical models,
of which only a few have done, have observed differed risks by neighborhood stratified SES. One study
observed a greater risk of adverse birth outcomes in the most deprived areas (-1.7g, 95% CI -4.6-1.3) and no
significant association in high SES neighborhoods (0.6g 95% CI -1.3-2.5) after adjusting for both individual
characteristics and air pollution exposure on reduced birth weight,18 consistent with other studies.54,55 However,
two studies used proxy measures such as distance to highways to measure air pollution exposure,18 of which
one also focused on preterm births.55 Multilevel modeling is warranted as these authors have highlighted the
interaction of which a mother’s individual susceptibility to adverse birth outcomes can be altered by not only
social and economic conditions, but also further exacerbated by the physical environment in which she resides
in. However, these studies have been done in the US, where major cofounders explaining the disparity include
individual risk factors such as maternal race/ethnicity, lack of prenatal care and access to health insurance, all
of which are most strongly prevalent in the most socially deprived neighborhoods.
Although a European meta-analysis didn’t observe a significant change on the effect of air pollution on term
LBW after adjusting for individual SES indicators based on educational level,20 area level deprivation on
adverse birth outcomes has still been poorly examined in Europe. Adjusting for neighborhood level deprivation
may yield different effects in Europe, particularly in France, due to full national coverage of health insurance
and free pre-natal care in comparison to other countries like the US where health coverage is limited, but
nonetheless, isn’t deemed any less relevant. On the contrary, a multi-level study in Spain, although air pollution
was not measured, found that term LBW varied among the different socioeconomically stratified
neighborhoods (unemployment by census tract) with greater risks in poorer neighborhoods (OR 1.56, 95% CI
1.37–1.78) after adjustment for individual risk factors.56 Other independent variables measured at the
contextual neighborhood level included educational attainment and maternal ethnic origin, also having found
similar findings.
1.5.2 Spatial Analysis
Exploratory spatial data analysis is a common spatial technique used to support ongoing epidemiological
investigations of health-related events. Only a few studies have assessed the effect of the geospatial
9
distribution of air pollution on adverse birth outcomes, although not looking at term LBW as an outcome
specifically.44,49,57,58 Geographic information systems (GIS) is suggested to be an improved exposure
assessment approach in conjunction with improved spatial data such as census data versus regional, to take
into account small-area variations and minimize exposure misclassification. In addition, other known
contextual, predictive risk factors (i.e. SES) can be accounted for in the geospatial exposure assessment. With
the exception of infant mortality studies,49,57,58 to our knowledge, there has been no such birth outcome study
conducted in France on reduced birth weight. By characterizing and geographically identifying maternal areas
of vulnerability to reduced birthweight from both environmental and social factors, such findings could aid
policy decision making in designing effective regulation.
As such, the aim of our study is to assess the role of environmental exposures and social characteristics on the
risk of LBW at both the individual and neighborhood levels in Paris-city. Two methodological objectives are
included in this study: i) a spatial analysis to assess the correlation between the distributions of the contextual
exposures with adjusted covariates in relation to LBW and term LBW ii) a multilevel analysis to analyze the
effect of social and environmental determinants on the risk of LBW at the individual and contextual level.
2. Methods and Material
2.1 Study setting
The study takes place in Paris metropolitan area, the most populous city in France and the most populous
urban area in the European Union. The City of Paris is one out of Ile-de-France’s eight departments (Northern
region) with an area of 105.4 km² (40.7 mi²) and a population of approximately 2.2 million inhabitants in 2009.
The city is subdivided into 20 administrative districts (arrondissments) and 992 census blocks.59
2.2 Neighborhood characteristics
2.2.1 IRIS
The sub-municipal French census block called IRIS (“Îlot Regroupé pour l’Information Statistique”) defined by
the National Institute of Statistics and Economic Studies (INSEE) is the statistical unit used. It is the smallest
administrative unit with available socioeconomic data in France and is constructed to be as homogenous as
possible in terms of socio-demographic characteristics and land use. Each geographical unit is home to
approximately 2000 inhabitants. We did not have data from 46 IRIS’s, thus our analysis included a total of 946
census blocks.
2.1.2 Social deprivation index
10
Socioeconomic and demographical data were obtained from the 2006 national census provided by INSEE at
census block level to create the index. The index is used to characterize neighborhood deprivation
encompassing a total of 48 census block variables from different socioeconomic domains including household
demographics, immigration, income, education, and housing characteristics.
The methodology and contextual variables used to construct the index is described elsewhere. 60 In short,
successive principal-component analysis were used to maximize the inertia of the first component and
eliminate the poorly correlated variables. A final 20 variables were included in the index explaining 59% of the
inertia for the first component. In addition, these variables alone are assessed on the effect of term LBW at the
census tract level in the multi-level analysis. These variables include foreigners (%), Immigrant population (%),
Single-parent families (%), Unemployed people (%), Employed workers (%), People with stable job (%), Non-
owner occupying primary residence (%), Population 15 years and over without diploma (%), Population 15
years and over with post-secondary or secondary diploma (%), Individual house as a primary residence (%),
Apartment building as a primary residence (%), Primary residence with a minimum surface area of 100 m (%),
Subsidized housing among all primary residences (%), Primary residence with a garage or other parking space
(%), Households without a car (%), Households with 2 or more cars (%), Self-employed people (%), Managers
workers (%), Blue-collar workers (%) and Median income per consumption unit. Refer to Figure 8 for the
spatial distribution of the index distribution by tertiles at the census blocks level in Paris-city.
2.2.4 Air pollution data
Annual ambient air concentrations of NO2, PM2.5 and PM10 were modeled by the local air quality monitoring
networks (AirPARIF and ‘petite couronne’) for each census block within Paris metropolitan area during the
study period (2007-2010). The air quality monitoring networks in Paris uses the ESMERALDA deterministic
methodology to describe and characterize environmental exposure disparities at a local scale. 61 This modeling
method was tested for effectiveness and reliability for assessing air quality in health assessment research, 62
integrating meteorological data (air temperature, wind speed and direction, relative humidity, barometric
pressure, supplied by Météo France, the French meteorological service), emission sources of air pollutants,
and background pollution measurements, as input parameters. Selected emission sources included linear
sources (main sources), surface sources (diffuse road sources, residential and tertiary emissions) and
important point sources.
The total mean of each annual mean concentration level for each air pollutant type during the study period
(2007-2009) was used in the analysis. Refer to figure 5, 6 and 7 for the spatial distribution of NO2, PM2.5, and
PM10, respectively, by tertiles at the census block level in Paris-city.
11
2.3 Individual data
2.3.1 Study population
The study population include all live births in Paris- city metropolitan area between the years of 2007 to 2009
obtained from ”Certifcat de santé du 8ème jour” (translated: health certificate of infant aged 8 days) provided
by l'agence Centre de Protection Infantile et maternelle (translated: Central agency of infant and maternal
protection) agency, or PMI of Paris. A total sample of 79,876 births were used in the spatial analysis. Due to
missing maternal socio-economic information, our sample size for the multilevel analysis had been reduced to
35,314 births. All births were geocoded according to the postal address of maternal residence by the Geocible
institution.
Individual characteristics obtained with the certificates that were used in the multilevel analysis include the
following set of variables: infant sex and maternal related variables such as level of education, occupation,
activity, age, parity, and number of deliveries. Paternal variables such as level of education, occupation, and
activity, were not used in the analysis due to collinearity issues with the maternal variables.
2.3.2 Health outcome
To investigate the incidence of reduced birth weight, our outcome measures include both LBW and term LBW
(dichotomous variables). LBW is defined as an infant weighing less than 2,500 grams (5.5 pounds) at birth,
and term LBW is defined as an infant born full term with a gestational age ranging between 37 – 41 weeks,
weighing less than 2,500 grams. In our final dataset for the spatial analysis, there are a total of 5499 cases of
LBW (6.9 percent) and 3340 cases of term LBW (4.18 percent) between the time period of 2007-2009. Refer to
Fig. 3 and 4 for the spatial distribution of the prevalence of LBW and term LBW by tertiles at the census blocks
level in Paris-city. However, the prevalence of term LBW drops to a total of 862 cases (1.84 percent) for our
final dataset used in the multilevel analysis. LBW was not assessed due to the conclusion of its distribution
obtained in the spatial analysis.
2.4 Statistical methods
2.4.1 Spatial methodology
The spatial analysis uses census data and generated spatial models to identify geographical areas of
susceptibility of mothers to give birth to an infant with reduced birth weight in Paris-City. The spatial analysis
carried out by the SaTScan software63 is comprised of two major components including the descriptive and the
clustering analysis. The descriptive analysis aims to give us a visualization of the spatial display of both LBW
and term LBW, in addition to the exposures: atmospheric air pollutants NO2, PM2.5 and PM10, and social
deprivation. The identification of a spatial pattern for the rate of LBW and term LBW is facilitated by the clustering

12
analysis, and the inclusive multivariate analysis aims to measure spatial relationships with the corresponding
exposures to reveal risk factors.
All explanatory data extracted from Paris-City’s 946 census blocks, including social deprivation index and the
concentration of atmospheric air pollutants NO2, PM2.5 and PM10 are categorized into tertiles for both the
descriptive and multivariate analysis. However, we did not have social deprivation scores for a total of 11 census
blocks, thus the descriptive analysis for social deprivation alone and the multivariate analysis including social
deprivation (alone and with covariates NO2, PM2.5 and PM10) were reduced to 935 census blocks. The rates for
both LBW and term LBW are also categorized into tertiles for the descriptive analysis, but left continous for the
multivariate analysis.
The number of cases for both LBW and term LBW in each census block is assumed to follow a Poisson
distribution (rare outcome). The procedure used by SaTScan works as follows: a circle or window of variable
radius (from zero up to 50% of the population size) is placed at the longitude and latitude of every census block
centroid and moves across the whole study area to compare the incidence rate in the windows with what would
be expected under a random distribution. The identification of the most likely clusters is based on a likelihood
ratio test with an associated p-value (0.05) obtained using Monte Carlo replications. The ArcGis 10.1 software
(ESRI, Inc., Redlands, California) was used to map the results.
2.4.2 Logistic multilevel methodology
The multilevel mixed-effects logistic regression was carried out to produce a two level model for the binomial
data. Using the STATA 12.0 software64 with reference to the model form for the binary outcome term LBW,
Logit(Pr Yij = 1|Xij, uj) = H(xijβ + zij uj )
Yij is the outcome in the ith subject in the jth census tract, where uj is the random census tract intercept. This
model form is an example of a generalized linear mixed model, generalizing the linear mixed-effects model to
non-Gaussian responses. On the left side of the equation, the covariates of interest in our study are noted by
the group i subject level which includes all individual characteristics (maternal agei, infant genderi, etc.) and the
group j census tract level includes all contextual, longitudinal variables (NO2j, SES indexj, etc.). The random
effects uj are group realizations, thus summarizes the variance components at the census tract level (IRIS). This
is to assume that the random effects shared within the individual level are unique to the IRIS level groups,
concluding if a spatial structure exists.
On the right side of the equation, H() is the logistic cumulative distribution function, which maps the linear
predictor to the probability that yij = 1. Vector xij are the covariates for the fixed effects, similar to the covariates
one would find in a classical regression model with regression coefficients β. Vector zij are the covariates
13
corresponding to the random effects and can be used to represent both random intercepts and random
coefficients.
3. Results
3.1 Descriptive Analysis
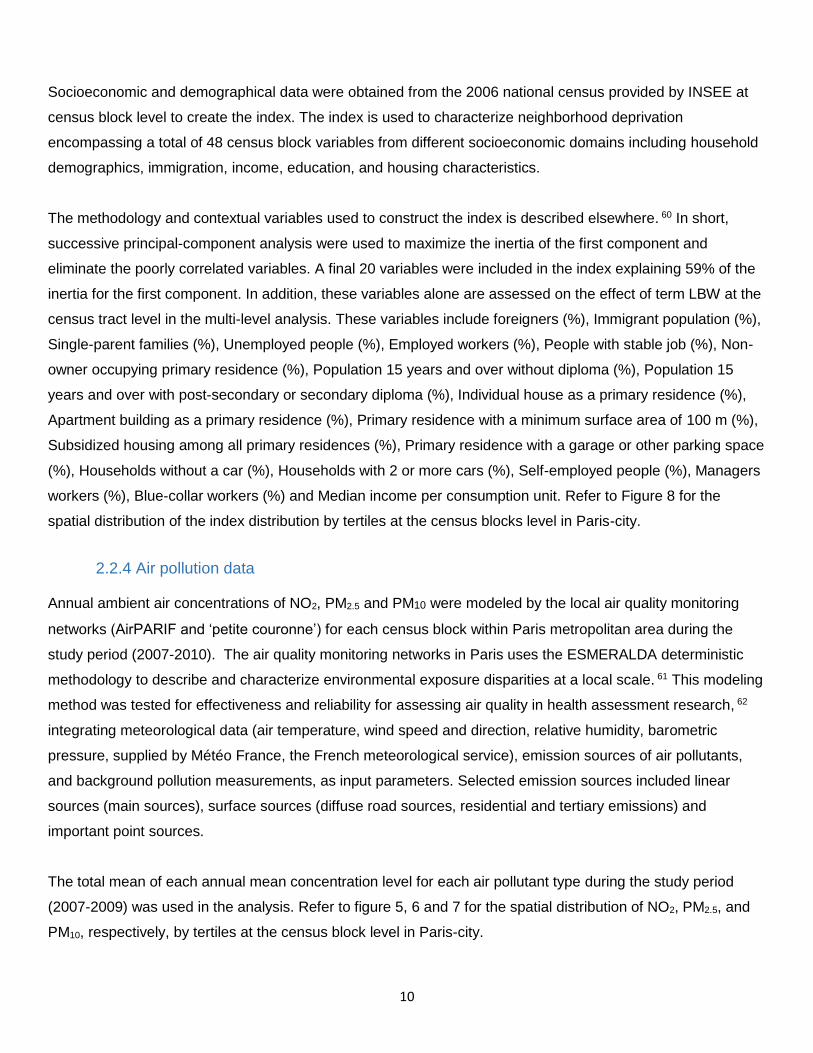
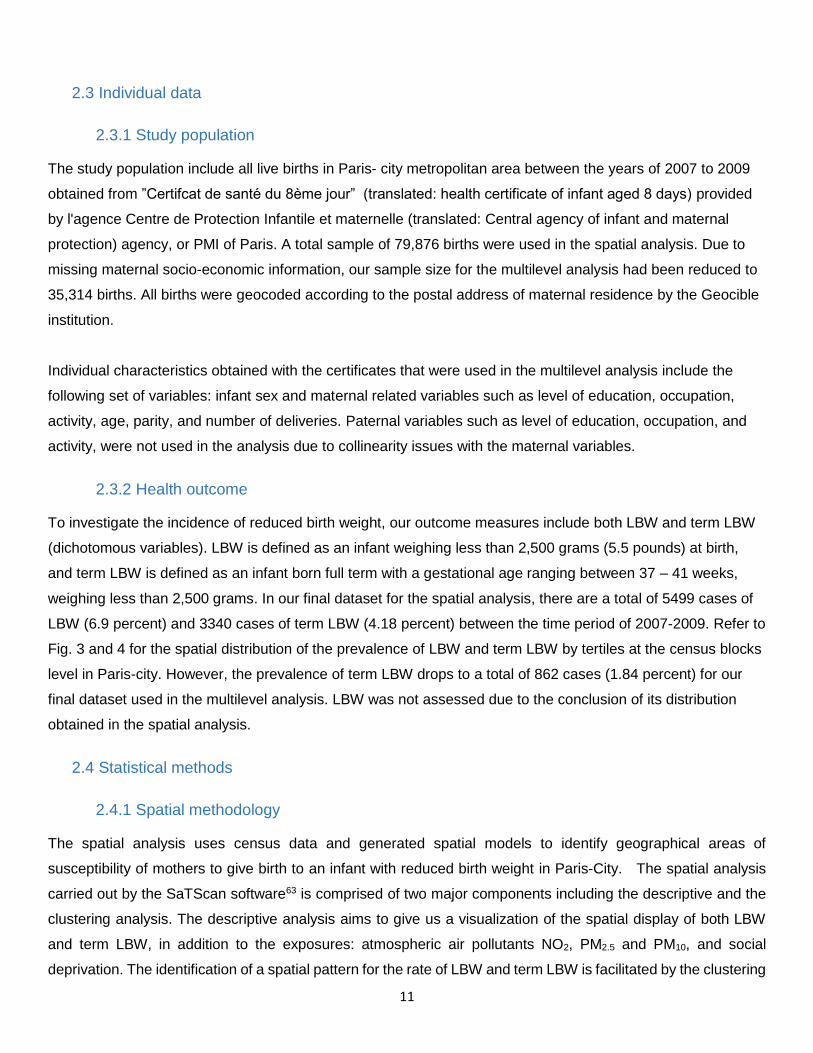
3.1.1 Spatial distribution of LBW and term LBW rate
LBW rate: The lowest level of the LBW rate (<4 cases) is concentrated in the west-central part of Paris, as well
as in the eastern and western census blocks that extend outside the Paris island. Meanwhile the highest level
(8 – 27 cases) is concentrated in the north eastern part of the city. The medium level (5 – 7 cases) with the
highest level almost encircle the west-central part of the city (Figure 3).
Term LBW rate: With reference to LBW, the spatial distribution of term LBW can be similarly described, however
concentrations for both the low (<2 cases) and high levels (5 – 21 cases) are less aggregately concentrated
(figure 4).
3.1.2 Spatial distribution of exposures
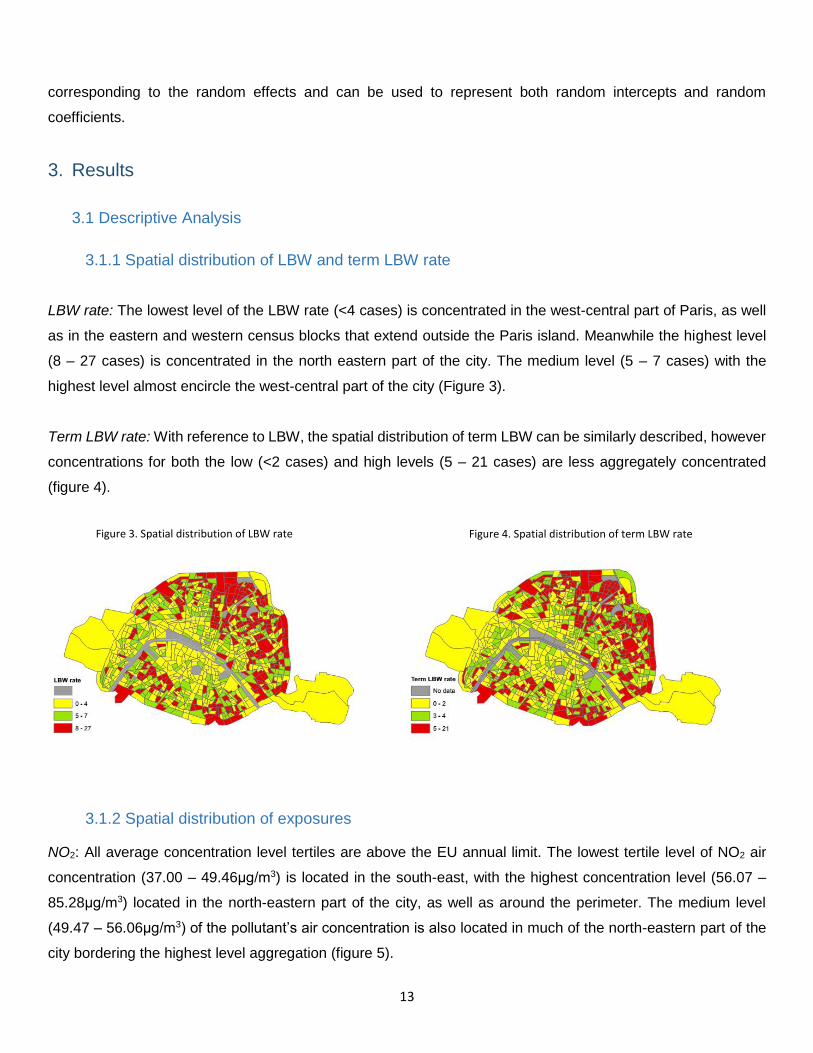
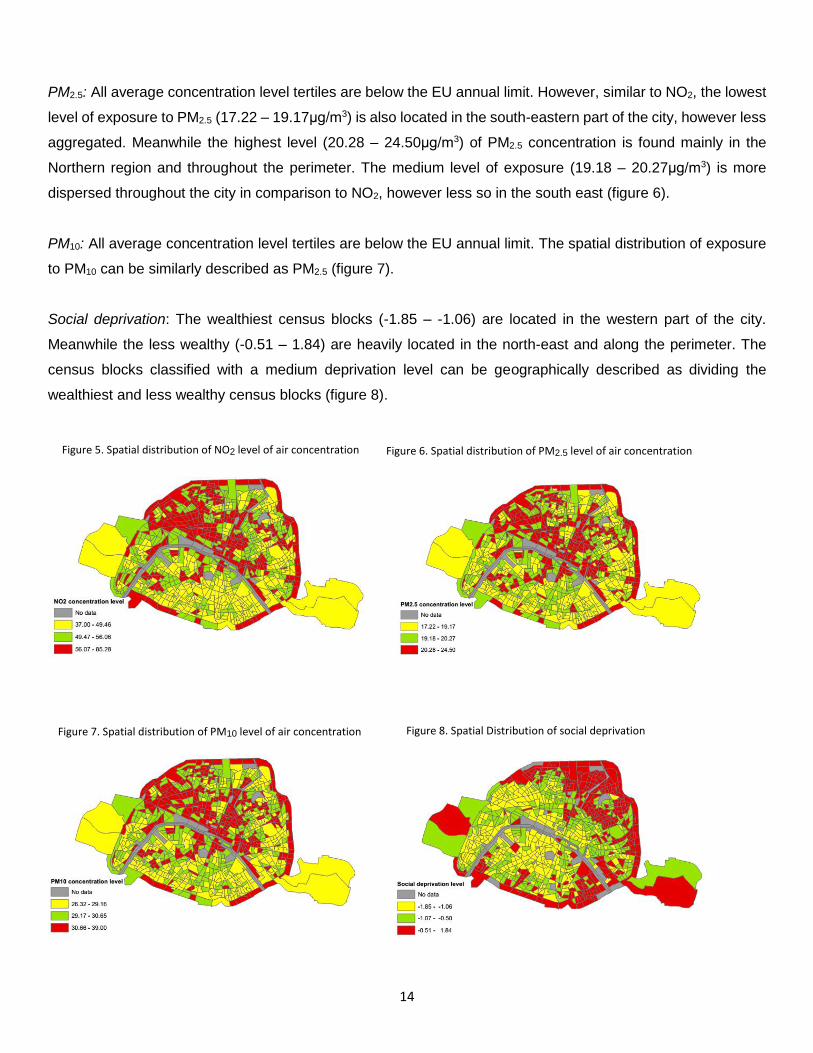
NO2: All average concentration level tertiles are above the EU annual limit. The lowest tertile level of NO2 air
concentration (37.00 – 49.46μg/m3) is located in the south-east, with the highest concentration level (56.07 –
85.28μg/m3) located in the north-eastern part of the city, as well as around the perimeter. The medium level
(49.47 – 56.06μg/m3) of the pollutant’s air concentration is also located in much of the north-eastern part of the
city bordering the highest level aggregation (figure 5).
Figure 3. Spatial distribution of LBW rate Figure 4. Spatial distribution of term LBW rate
14
PM2.5: All average concentration level tertiles are below the EU annual limit. However, similar to NO2, the lowest
level of exposure to PM2.5 (17.22 – 19.17μg/m3) is also located in the south-eastern part of the city, however less
aggregated. Meanwhile the highest level (20.28 – 24.50μg/m3) of PM2.5 concentration is found mainly in the
Northern region and throughout the perimeter. The medium level of exposure (19.18 – 20.27μg/m3) is more
dispersed throughout the city in comparison to NO2, however less so in the south east (figure 6).
PM10: All average concentration level tertiles are below the EU annual limit. The spatial distribution of exposure
to PM10 can be similarly described as PM2.5 (figure 7).
Social deprivation: The wealthiest census blocks (-1.85 – -1.06) are located in the western part of the city.
Meanwhile the less wealthy (-0.51 – 1.84) are heavily located in the north-east and along the perimeter. The
census blocks classified with a medium deprivation level can be geographically described as dividing the
wealthiest and less wealthy census blocks (figure 8).
Figure 8. Spatial Distribution of social deprivation
Figure 5. Spatial distribution of NO2 level of air concentration
Figure 7. Spatial distribution of PM10 level of air concentration
Figure 6. Spatial distribution of PM2.5 level of air concentration
15
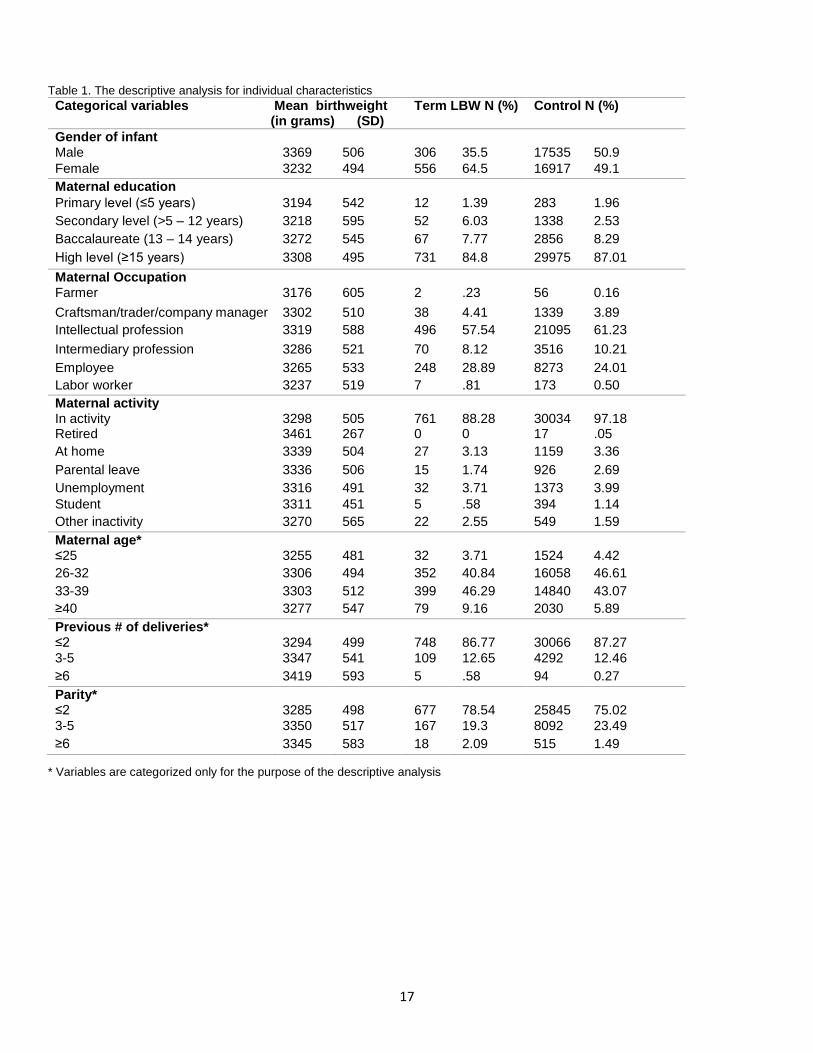
3.1.3 Individual level summary
The individual explanatory variables used in the multilevel analysis are summarized by category with the
birthweight mean for the entire sample population, and with the frequency percentage between both term LBW
and it’s comparison group (all births: 24 – 44 weeks, 299 – 5550 grams) in table 1. Fetal growth predictor and
socio-economic related variables are infant specific such as gender and maternal specific: education level,
occupation, activity type, age, number of pregnancies and number of deliveries. Variables including maternal
age, number or pregnancies and number of deliveries were categorized for the purpose of the descriptive
analysis only.
On average, the birthweight for female infants is 137 grams lower than the mean birthweight for male infants. In
addition, there are almost twice as many female infants (64.5%) within the term LBW case group than there are
male infants (35.5%), while the infant gender ratio is approximately equal within the control group.
With regards to maternal education, the observed average birthweight increases in parallel with each increase
in educational level achievement. However, the proportion of mothers with lower educational achievement is
greater in the case group in comparison to the control group. Although the prevalence of primary level attainment
is slightly higher in the control group by 0.57%, secondary level attainment is more than twice as great in the
case group, with lower proportions of higher educational achievement including Baccalaureeate (7.77%) and
higher level achievement (84.8%) compared to the control (8.29 and 87.01% respectively).
Infants with higher mean birth weights are observed from mothers with an intellectual profession (3319g)
compared to the lowest mean birthweight from mothers who are farmers (3176g). The control group has a greater
proportion of mothers from intellectual (61.23% compared 57.54%) and intermediary (10.21% compared to
8.12%) professions with lower proportions observed in the rest of the categories (farmer, craftsman/trader,
employee, labor worker) compared to the case group.
As per maternal activity, the lowest average birthweight (3270g) is found among mothers who are inactive
compared to the highest mean birthweight from mothers who are retired (3461g). The case group has a higher
proportion of inactive mothers (2.55% in comparison to 1.59%) with lower proportions found among all other
categories (active, retired, at home, parental leave, unemployment, and student) in comparison to the control
group.
Younger mothers (≤25) have on average, newborns with lower birthweight (3255g) compared to older mothers
(age groups 26-32 and 33-39, 3306g and 3303g, respectively). However, the observed risk of low birthweight
also increases for mothers who are 40 years old and older. Among term LBW infants, the proportion of mothers
who are 40 years old and older are almost a twice as great (9.16%) in comparison to the control group (5.89%).
16
Newborn birthweight increases in parallel with the maternal number of deliveries. However, mothers who have
had 2 deliveries or less are slightly more prevalent among the control group (87.27%). Furthermore, the
prevalence of mothers whom have had 3 deliveries or more is greater among infants with term LBW (3-5 and
≥6, 12.65% and 0.58%, respectively) than the control group (3-5 and ≥6, 12.46% and .27%, respectively).
Similar to the number of deliveries, mothers who have had 2 pregnancies or less, have on average infants with
lower birthweights (3285g), although mothers who have in between 3 to 5 pregnancies as opposed to 6 or greater
like the deliveries category, give birth to infants with the greatest birthweight (3350g). As such, there is smaller
proportion of mothers who have had 3 to 5 deliveries in the case group (19.3%) compared to the control group
(23.49%) while proportions among the other two categories are greater in the cases compared to the control.
17
Table 1. The descriptive analysis for individual characteristics
* Variables are categorized only for the purpose of the descriptive analysis
Categorical variables Mean_birthweight (in grams) (SD)
Term LBW N (%) Control N (%)
Gender of infant Male 3369 506 306 35.5 17535 50.9
Female 3232 494 556 64.5 16917 49.1
Maternal education
Primary level (≤5 years) 3194 542 12 1.39 283 1.96
Secondary level (>5 – 12 years) 3218 595 52 6.03 1338 2.53
Baccalaureate (13 – 14 years) 3272 545 67 7.77 2856 8.29
High level (≥15 years) 3308 495 731 84.8 29975 87.01
Maternal Occupation Farmer 3176 605 2 .23 56 0.16
Craftsman/trader/company manager 3302 510 38 4.41 1339 3.89
Intellectual profession 3319 588 496 57.54 21095 61.23
Intermediary profession 3286 521 70 8.12 3516 10.21
Employee 3265 533 248 28.89 8273 24.01
Labor worker 3237 519 7 .81 173 0.50
Maternal activity In activity 3298 505 761 88.28 30034 97.18 Retired 3461 267 0 0 17 .05
At home 3339 504 27 3.13 1159 3.36
Parental leave 3336 506 15 1.74 926 2.69
Unemployment 3316 491 32 3.71 1373 3.99
Student 3311 451 5 .58 394 1.14
Other inactivity 3270 565 22 2.55 549 1.59
Maternal age* ≤25 3255 481 32 3.71 1524 4.42
26-32 3306 494 352 40.84 16058 46.61
33-39 3303 512 399 46.29 14840 43.07
≥40 3277 547 79 9.16 2030 5.89
Previous # of deliveries* ≤2 3294 499 748 86.77 30066 87.27
3-5 3347 541 109 12.65 4292 12.46
≥6 3419 593 5 .58 94 0.27
Parity* ≤2 3285 498 677 78.54 25845 75.02
3-5 3350 517 167 19.3 8092 23.49
≥6 3345 583 18 2.09 515 1.49
18
3.2 Spatial results
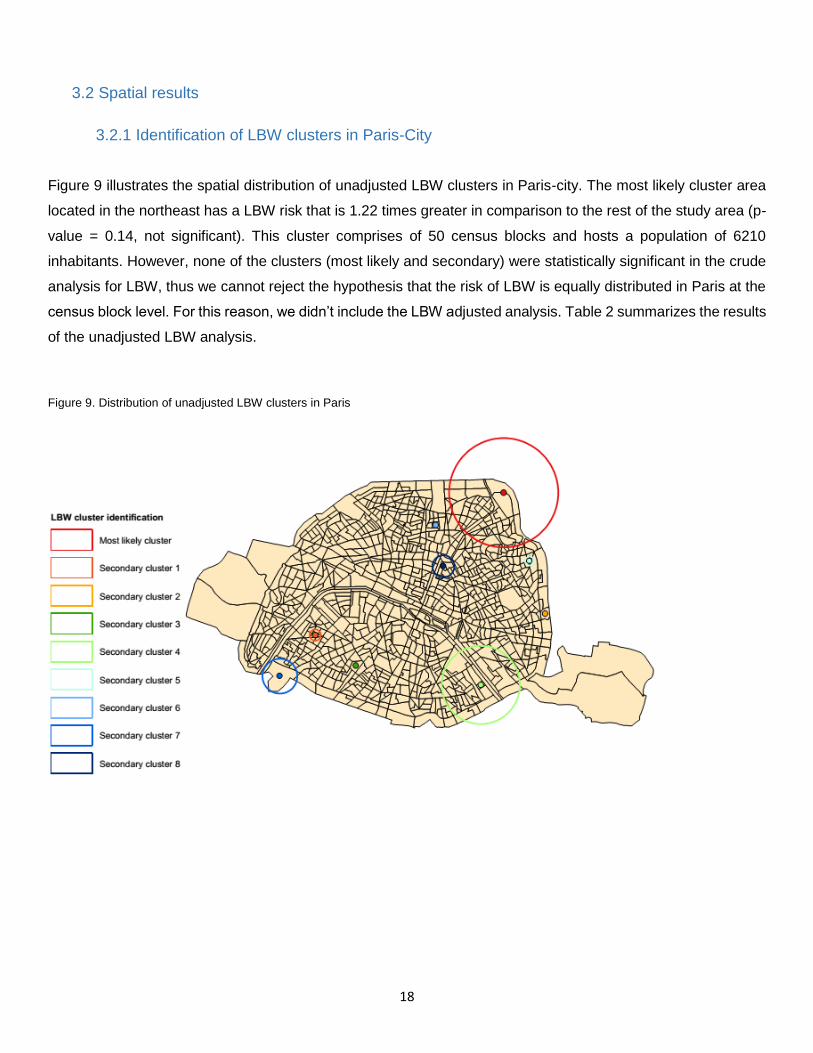
3.2.1 Identification of LBW clusters in Paris-City
Figure 9 illustrates the spatial distribution of unadjusted LBW clusters in Paris-city. The most likely cluster area
located in the northeast has a LBW risk that is 1.22 times greater in comparison to the rest of the study area (p-
value = 0.14, not significant). This cluster comprises of 50 census blocks and hosts a population of 6210
inhabitants. However, none of the clusters (most likely and secondary) were statistically significant in the crude
analysis for LBW, thus we cannot reject the hypothesis that the risk of LBW is equally distributed in Paris at the
census block level. For this reason, we didn’t include the LBW adjusted analysis. Table 2 summarizes the results
of the unadjusted LBW analysis.
Figure 9. Distribution of unadjusted LBW clusters in Paris
19
Table 2. The mostly likely and secondary clusters for LBW resulting from the unadjusted analysis
LLr: log likelihood ratio. RR: Relative Risks.
3.2.1 Identification of term LBW clusters
3.2.1.1 Unadjusted analysis
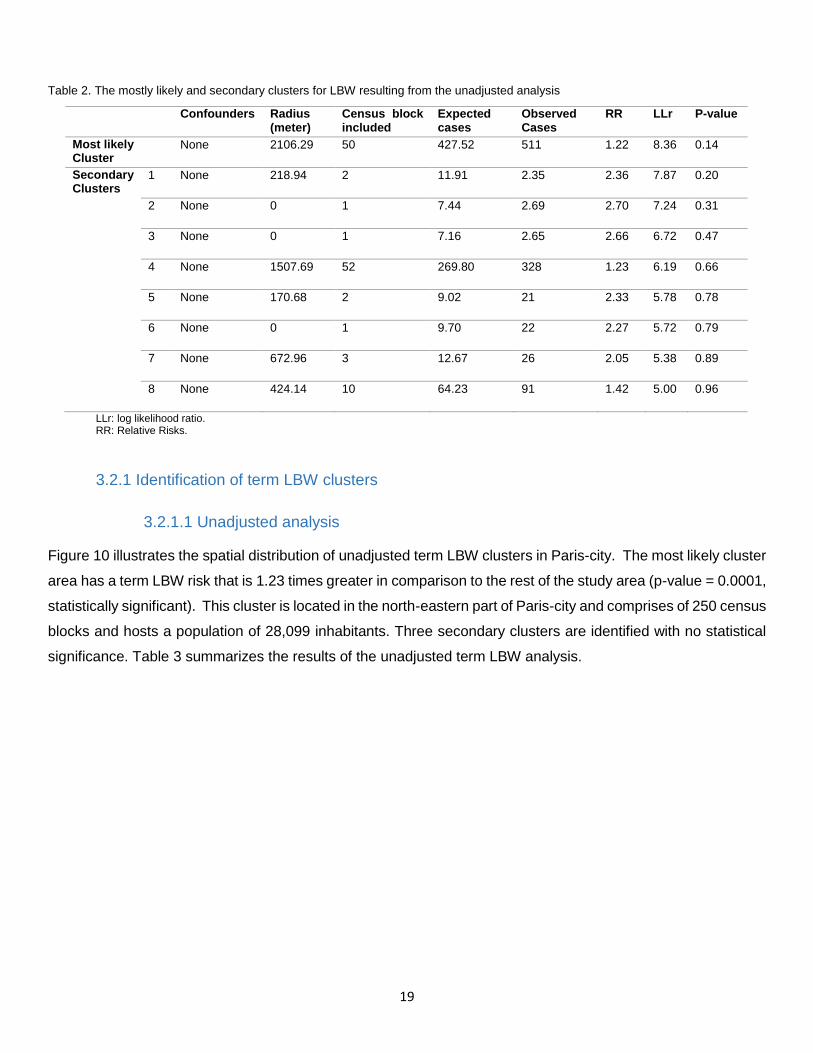
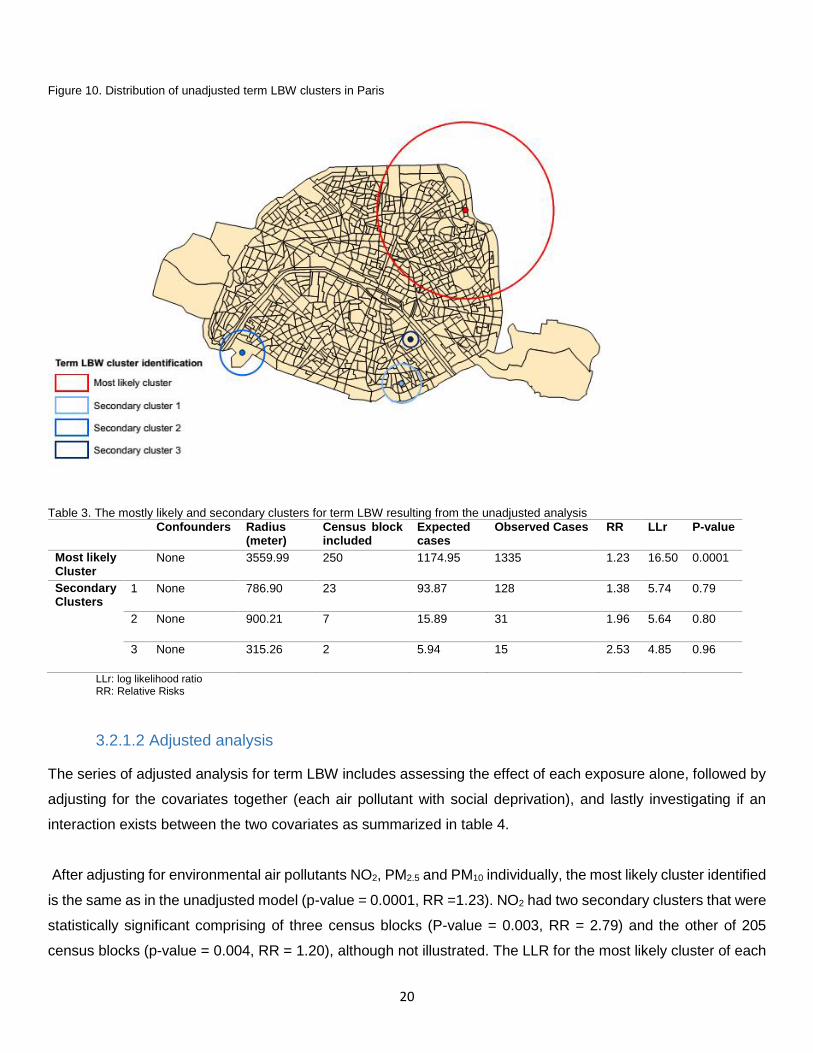
Figure 10 illustrates the spatial distribution of unadjusted term LBW clusters in Paris-city. The most likely cluster
area has a term LBW risk that is 1.23 times greater in comparison to the rest of the study area (p-value = 0.0001,
statistically significant). This cluster is located in the north-eastern part of Paris-city and comprises of 250 census
blocks and hosts a population of 28,099 inhabitants. Three secondary clusters are identified with no statistical
significance. Table 3 summarizes the results of the unadjusted term LBW analysis.
Confounders Radius (meter)
Census block included
Expected cases
Observed Cases
RR LLr P-value
Most likely Cluster
None 2106.29 50 427.52 511 1.22 8.36 0.14
Secondary Clusters
1 None 218.94 2 11.91 2.35 2.36 7.87 0.20
2 None 0 1 7.44 2.69 2.70 7.24 0.31
3 None 0 1 7.16 2.65 2.66 6.72 0.47
4 None 1507.69 52 269.80 328 1.23 6.19 0.66
5 None 170.68 2 9.02 21 2.33 5.78 0.78
6 None 0 1 9.70 22 2.27 5.72 0.79
7 None 672.96 3 12.67 26 2.05 5.38 0.89
8 None 424.14 10 64.23 91 1.42 5.00 0.96
20
Figure 10. Distribution of unadjusted term LBW clusters in Paris
Table 3. The mostly likely and secondary clusters for term LBW resulting from the unadjusted analysis
Confounders Radius (meter)
Census block included
Expected cases
Observed Cases RR LLr P-value
Most likely Cluster
None 3559.99 250 1174.95 1335 1.23 16.50 0.0001
Secondary Clusters
1 None 786.90 23 93.87 128 1.38 5.74 0.79
2 None 900.21 7 15.89 31 1.96 5.64 0.80
3 None 315.26 2 5.94 15 2.53 4.85 0.96
LLr: log likelihood ratio RR: Relative Risks
3.2.1.2 Adjusted analysis
The series of adjusted analysis for term LBW includes assessing the effect of each exposure alone, followed by
adjusting for the covariates together (each air pollutant with social deprivation), and lastly investigating if an
interaction exists between the two covariates as summarized in table 4.
After adjusting for environmental air pollutants NO2, PM2.5 and PM10 individually, the most likely cluster identified
is the same as in the unadjusted model (p-value = 0.0001, RR =1.23). NO2 had two secondary clusters that were
statistically significant comprising of three census blocks (P-value = 0.003, RR = 2.79) and the other of 205
census blocks (p-value = 0.004, RR = 1.20), although not illustrated. The LLR for the most likely cluster of each

21
pollutant decreased in the adjusted model from the LLR obtained in the unadjusted model (16.50), suggesting
that each air pollutant alone partially explain the excess risk.
The most likely cluster shifts location and decreases in size to one census block with no radius after adjusting
for social deprivation index (p-value = 0.01, statistically significant). One secondary cluster with borderline
significance was also detected (p-value = 0.08, RR = 1.64, LLR = 9.15), although not illustrated. The most likely
cluster has an increased risk of 3.75, in addition to a decreased LLR of 11.16, indicating that social deprivation
explains a great part of the excess risk.
With reference to the adjustment of social deprivation alone, the mostly likely clusters for the interaction between
social deprivation and each air pollutant (NO2, PM2.5, PM10) increases in size to three census blocks, but does
not shift in location (figure 9.). The risk increases from the unadjusted model (RR = 1.23), but decreases from
the effect of social deprivation alone (RR = 3.75) on term LBW to 2.43 for NO2 and 2.41 for PM2.5 and PM10. In
addition, the LLR further decreases after adjusting for the interacting covariates to 10.20 for NO2 (p-value = 0.03,
statistically significant) and 9.95 for both PM2.5 and PM10 (p-value = 0.03 and 0.04, respectively, both
statistically significant) indicating that the covariates between social deprivation and environmental air pollutants
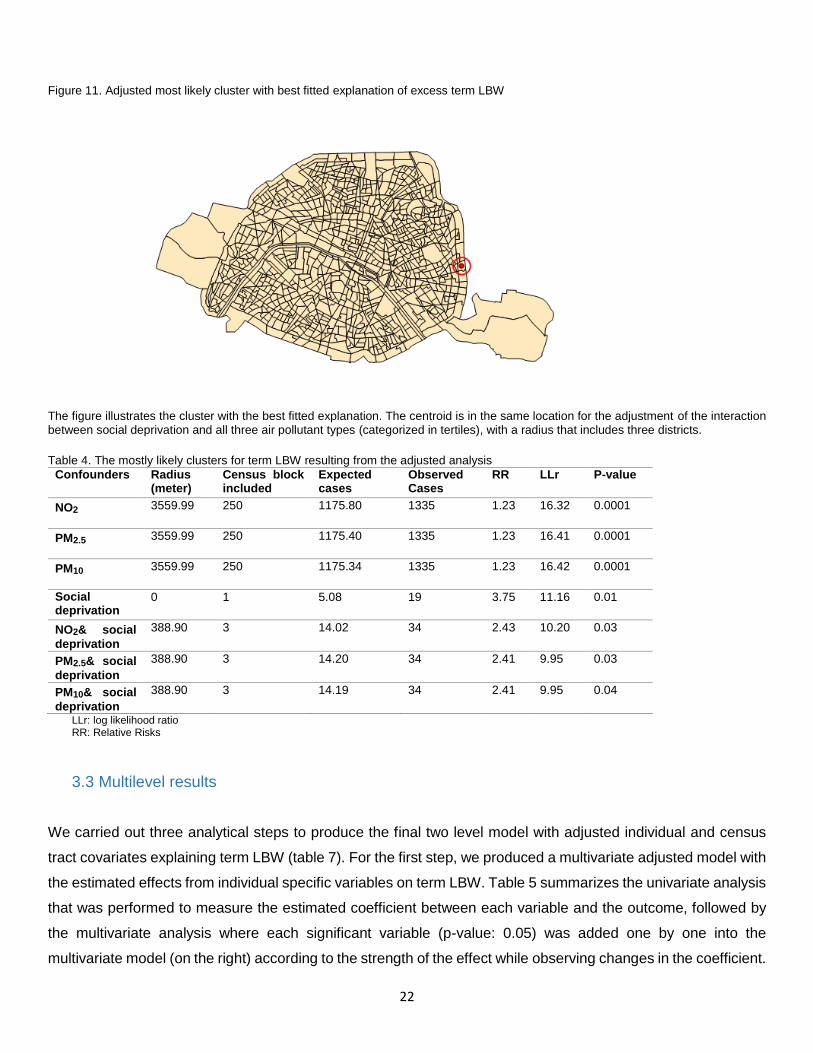
in the adjusted model explains the greatest part of excess term LBW observed in the unadjusted model. Figure
9 illustrates the spatial distribution of the adjusted most likely cluster with the best fitted explanation of excess
term LBW.
As such, we suspected an interaction, of which social deprivation may possibly be moderated by air pollution
exposure. However, after assessing the effect of each interaction term between each air pollutant NO2, PM2.5
and PM2.5 with social deprivation, no model yielded an improved LLR value (10.63, 10.78, and 10.93,
respectively, with global p-value = 0.02).
After a final cluster analysis done, with all exposures classified into quantiles instead of tertiles, the cluster
disappears in total. Social deprivation adjusted with each air pollutant NO2, PM2.5, and PM10 yields a risk of
3.19 (p-value = 0.09, LLR = 8.95), 2.24 (p-value = 0.13, LLR = 8.6) and 2.25 (p-value = 0.11, LLR = 8.6)
respectively. Although all adjusted covariates are borderline significant, the LLR further reduces, producing the
best fitted models in fully explaining term LBW excess risk.
22
Figure 11. Adjusted most likely cluster with best fitted explanation of excess term LBW
The figure illustrates the cluster with the best fitted explanation. The centroid is in the same location for the adjustment of the interaction between social deprivation and all three air pollutant types (categorized in tertiles), with a radius that includes three districts.
Table 4. The mostly likely clusters for term LBW resulting from the adjusted analysis
Confounders Radius (meter)
Census block included
Expected cases
Observed Cases
RR LLr P-value
NO2 3559.99 250 1175.80 1335 1.23 16.32 0.0001
PM2.5 3559.99 250 1175.40 1335 1.23 16.41 0.0001
PM10 3559.99 250 1175.34 1335 1.23 16.42 0.0001
Social deprivation
0 1 5.08 19 3.75 11.16 0.01
NO2& social
deprivation
388.90 3 14.02 34 2.43 10.20 0.03
PM2.5& social
deprivation
388.90 3 14.20 34 2.41 9.95 0.03
PM10& social
deprivation
388.90 3 14.19 34 2.41 9.95 0.04
LLr: log likelihood ratio RR: Relative Risks
3.3 Multilevel results
We carried out three analytical steps to produce the final two level model with adjusted individual and census
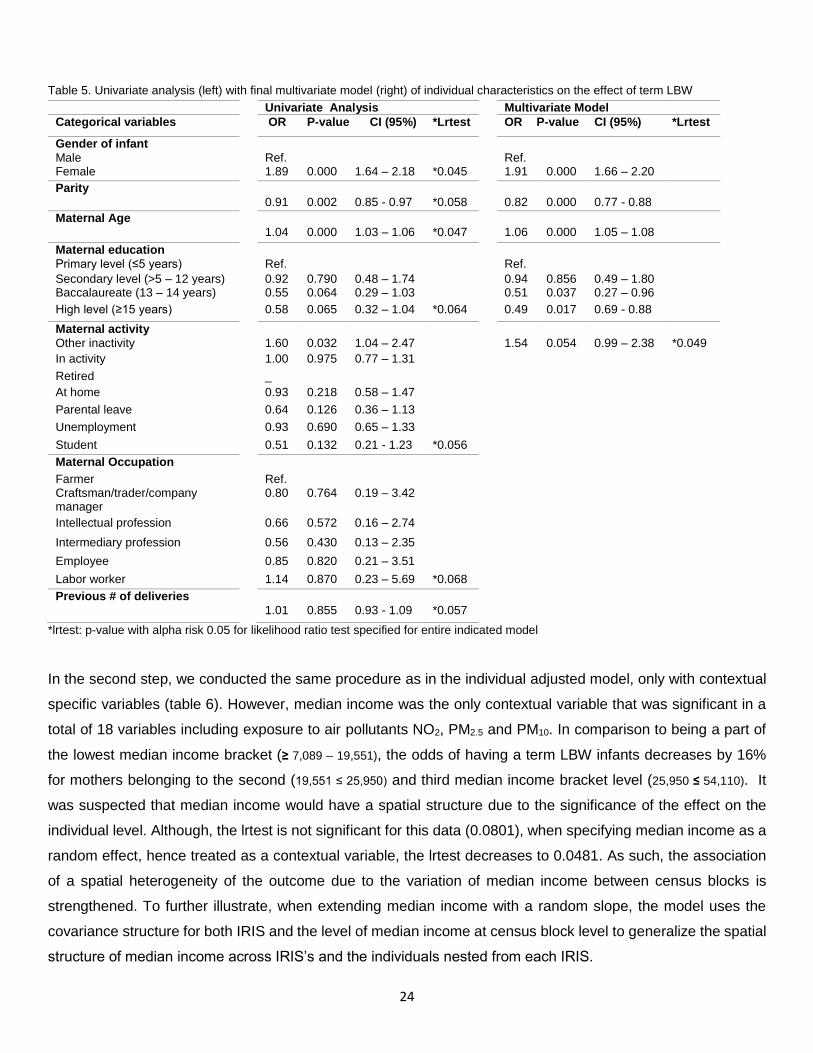
tract covariates explaining term LBW (table 7). For the first step, we produced a multivariate adjusted model with
the estimated effects from individual specific variables on term LBW. Table 5 summarizes the univariate analysis
that was performed to measure the estimated coefficient between each variable and the outcome, followed by
the multivariate analysis where each significant variable (p-value: 0.05) was added one by one into the
multivariate model (on the right) according to the strength of the effect while observing changes in the coefficient.

23
Based on the univariate estimates, the effect of infant gender, maternal parity, and maternal age were highly
significant (p-value: 0.000) on the effect of term LBW. Female infants are 1.89 times as likely to be term LBW in
comparison to male infants. In addition, per every unit increase in parity and maternal age, the odds of having a
term LBW infant decreases by 9% and increases by 4%, respectively. The inverse association found between
parity and term LBW can be due to a lack of sampling validity, as the cases are disproportionately comparable
to the controls resulting in a lack of statistical power (descriptive table). When adjusting for other individual
specific covariates based on a 0.20 p-value cutoff, the effect of infant gender did not significantly change, while
the effect of parity further decreased by approximately 9% and maternal age slightly increased by 2%. Maternal
education was borderline significant in the univariate analysis (Baccalaureate and high level, p-value: 0.06 and
0.07, respectively), but becomes significant (0.04 and 0.02, respectively) when adjusted with the covariates,
suspecting of being modified with the presence of maternal age. The effect of having obtained a Baccalaureate
degree and received more than 15 years of education in comparison to having only obtained a primary level of
education decreases a mother’s odds of having a term LBW infant by 49% and 51%, respectively. Maternal
activity category “other inactivity” was the only significant category (p-value: 0.03) with an effect that slightly
decreased in the multivariate model where the chance of giving birth to a term LBW is multiplied by 1.54 per
every unit increase in maternal inactivity (p-value: 0.05, 95%CI 0.99 – 2.38). Maternal occupation and previous
number of deliveries were not significant in the univariate analysis, thus were not considered for the multivariate
model.
Although, the model’s estimates (table 5) are analogous to the estimates one would find from a classical logistic
regression, the random effect had been specified to the iris level, thus these models generalize the random
effects at both the iris and the individuals within the iris level. The likelihood-ratio test (lrtest) comparing the
specified model with one-level ordinary linear regression (model without uj), is provided and is highly significant
for these data.
24
Table 5. Univariate analysis (left) with final multivariate model (right) of individual characteristics on the effect of term LBW
*lrtest: p-value with alpha risk 0.05 for likelihood ratio test specified for entire indicated model
In the second step, we conducted the same procedure as in the individual adjusted model, only with contextual
specific variables (table 6). However, median income was the only contextual variable that was significant in a
total of 18 variables including exposure to air pollutants NO2, PM2.5 and PM10. In comparison to being a part of
the lowest median income bracket (≥ 7,089 – 19,551), the odds of having a term LBW infants decreases by 16%
for mothers belonging to the second (19,551 ≤ 25,950) and third median income bracket level (25,950 ≤ 54,110). It
was suspected that median income would have a spatial structure due to the significance of the effect on the
individual level. Although, the lrtest is not significant for this data (0.0801), when specifying median income as a
random effect, hence treated as a contextual variable, the lrtest decreases to 0.0481. As such, the association
of a spatial heterogeneity of the outcome due to the variation of median income between census blocks is
strengthened. To further illustrate, when extending median income with a random slope, the model uses the
covariance structure for both IRIS and the level of median income at census block level to generalize the spatial
structure of median income across IRIS’s and the individuals nested from each IRIS.
Univariate Analysis Multivariate Model
Categorical variables OR P-value CI (95%) *Lrtest OR P-value CI (95%) *Lrtest
Gender of infant Male Ref. Ref. Female 1.89 0.000 1.64 – 2.18 *0.045 1.91 0.000 1.66 – 2.20
Parity 0.91 0.002 0.85 - 0.97 *0.058 0.82 0.000 0.77 - 0.88
Maternal Age 1.04 0.000 1.03 – 1.06 *0.047 1.06 0.000 1.05 – 1.08
Maternal education Primary level (≤5 years) Ref. Ref.
Secondary level (>5 – 12 years) 0.92 0.790 0.48 – 1.74 0.94 0.856 0.49 – 1.80 Baccalaureate (13 – 14 years) 0.55 0.064 0.29 – 1.03 0.51 0.037 0.27 – 0.96
High level (≥15 years) 0.58 0.065 0.32 – 1.04 *0.064 0.49 0.017 0.69 - 0.88
Maternal activity Other inactivity 1.60 0.032 1.04 – 2.47 1.54 0.054 0.99 – 2.38 *0.049
In activity 1.00 0.975 0.77 – 1.31
Retired _
At home 0.93 0.218 0.58 – 1.47
Parental leave 0.64 0.126 0.36 – 1.13
Unemployment 0.93 0.690 0.65 – 1.33
Student 0.51 0.132 0.21 - 1.23 *0.056
Maternal Occupation
Farmer Ref. Craftsman/trader/company manager
0.80 0.764 0.19 – 3.42
Intellectual profession 0.66 0.572 0.16 – 2.74
Intermediary profession 0.56 0.430 0.13 – 2.35
Employee 0.85 0.820 0.21 – 3.51
Labor worker 1.14 0.870 0.23 – 5.69 *0.068
Previous # of deliveries 1.01 0.855 0.93 - 1.09 *0.057
25
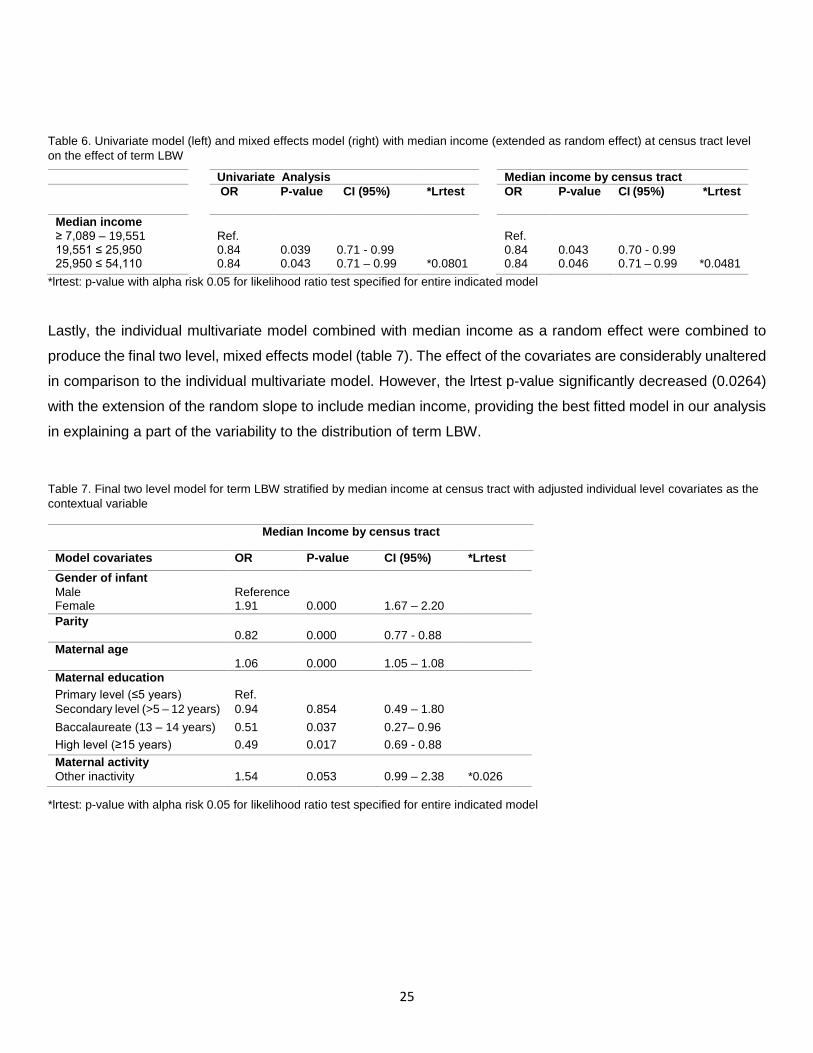
Table 6. Univariate model (left) and mixed effects model (right) with median income (extended as random effect) at census tract level
on the effect of term LBW
*lrtest: p-value with alpha risk 0.05 for likelihood ratio test specified for entire indicated model
Lastly, the individual multivariate model combined with median income as a random effect were combined to
produce the final two level, mixed effects model (table 7). The effect of the covariates are considerably unaltered
in comparison to the individual multivariate model. However, the lrtest p-value significantly decreased (0.0264)
with the extension of the random slope to include median income, providing the best fitted model in our analysis
in explaining a part of the variability to the distribution of term LBW.
Table 7. Final two level model for term LBW stratified by median income at census tract with adjusted individual level covariates as the
contextual variable
*lrtest: p-value with alpha risk 0.05 for likelihood ratio test specified for entire indicated model
Univariate Analysis Median income by census tract
OR P-value CI (95%) *Lrtest OR P-value CI (95%) *Lrtest
Median income ≥ 7,089 – 19,551 Ref. Ref. 19,551 ≤ 25,950 0.84 0.039 0.71 - 0.99 0.84 0.043 0.70 - 0.99 25,950 ≤ 54,110 0.84 0.043 0.71 – 0.99 *0.0801 0.84 0.046 0.71 – 0.99 *0.0481
Median Income by census tract
Model covariates OR P-value CI (95%) *Lrtest
Gender of infant Male Reference
Female 1.91 0.000 1.67 – 2.20
Parity 0.82 0.000 0.77 - 0.88
Maternal age 1.06 0.000 1.05 – 1.08
Maternal education
Primary level (≤5 years) Ref.
Secondary level (>5 – 12 years) 0.94 0.854 0.49 – 1.80
Baccalaureate (13 – 14 years) 0.51 0.037 0.27– 0.96
High level (≥15 years) 0.49 0.017 0.69 - 0.88
Maternal activity
Other inactivity 1.54 0.053 0.99 – 2.38 *0.026
26
4. Discussion
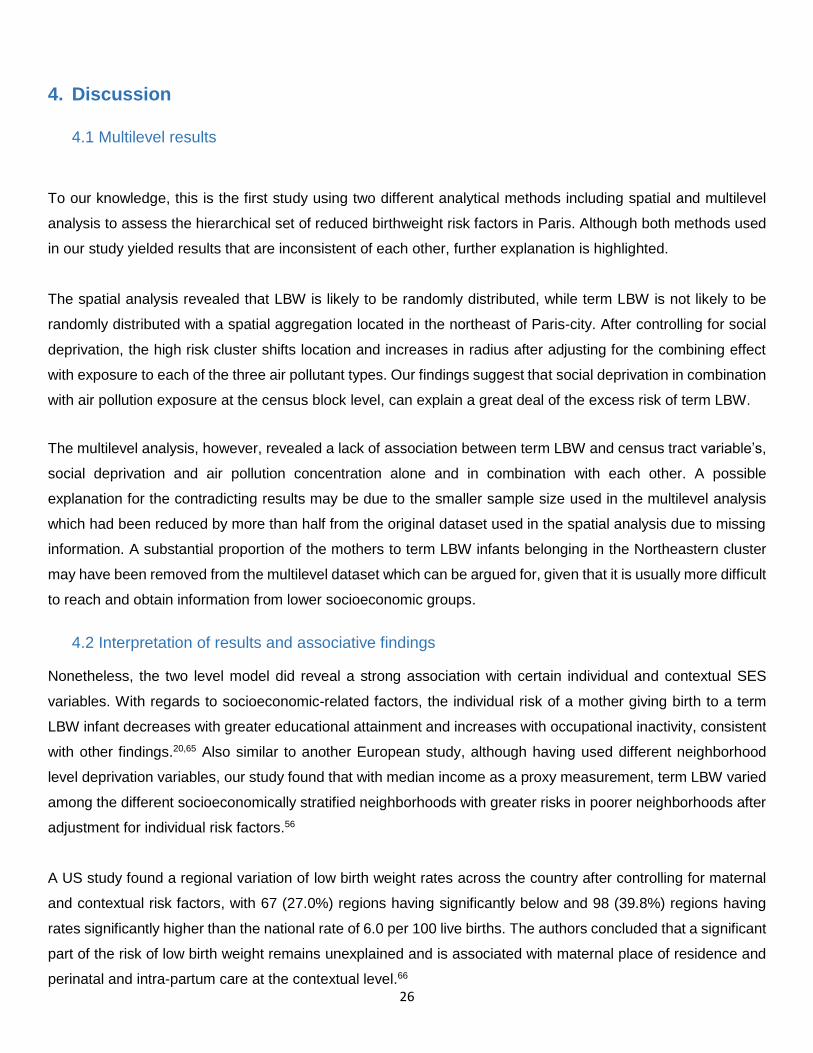
4.1 Multilevel results
To our knowledge, this is the first study using two different analytical methods including spatial and multilevel
analysis to assess the hierarchical set of reduced birthweight risk factors in Paris. Although both methods used
in our study yielded results that are inconsistent of each other, further explanation is highlighted.
The spatial analysis revealed that LBW is likely to be randomly distributed, while term LBW is not likely to be
randomly distributed with a spatial aggregation located in the northeast of Paris-city. After controlling for social
deprivation, the high risk cluster shifts location and increases in radius after adjusting for the combining effect
with exposure to each of the three air pollutant types. Our findings suggest that social deprivation in combination
with air pollution exposure at the census block level, can explain a great deal of the excess risk of term LBW.
The multilevel analysis, however, revealed a lack of association between term LBW and census tract variable’s,
social deprivation and air pollution concentration alone and in combination with each other. A possible
explanation for the contradicting results may be due to the smaller sample size used in the multilevel analysis
which had been reduced by more than half from the original dataset used in the spatial analysis due to missing
information. A substantial proportion of the mothers to term LBW infants belonging in the Northeastern cluster
may have been removed from the multilevel dataset which can be argued for, given that it is usually more difficult
to reach and obtain information from lower socioeconomic groups.
4.2 Interpretation of results and associative findings
Nonetheless, the two level model did reveal a strong association with certain individual and contextual SES
variables. With regards to socioeconomic-related factors, the individual risk of a mother giving birth to a term
LBW infant decreases with greater educational attainment and increases with occupational inactivity, consistent
with other findings.20,65 Also similar to another European study, although having used different neighborhood
level deprivation variables, our study found that with median income as a proxy measurement, term LBW varied
among the different socioeconomically stratified neighborhoods with greater risks in poorer neighborhoods after
adjustment for individual risk factors.56
A US study found a regional variation of low birth weight rates across the country after controlling for maternal
and contextual risk factors, with 67 (27.0%) regions having significantly below and 98 (39.8%) regions having
rates significantly higher than the national rate of 6.0 per 100 live births. The authors concluded that a significant
part of the risk of low birth weight remains unexplained and is associated with maternal place of residence and
perinatal and intra-partum care at the contextual level.66
27
However, as opposed to the US where there are greater health access inequalities due to limited health
insurance coverage, a French population based study assessing the relationship between poor antenatal care
and LBW, showed that very few women in France received little or no ante-natal care.67 In addition, the study
found that poor attenders of antenatal care, defined as women who had attended fewer than four visits (national
recommendation is 7 visits) or if they had begun antenatal care during the last three months, was not statistically
significantly associated with adverse birth outcomes for vulnerable subgroups including women under 20 and
foreigners. However, there was a significant association with LBW for French women over 20 (OR: 2.6, 95% CI:
1.5 - 4.4). According to the survey, reasons for poor attendance for these women included unwanted pregnancy
or serious worries such as unemployment, marital conflicts, and financial difficulties. The authors suggested that
special attention should be given to women who are confronted with no major structural barrier to medical care
to prevent adverse birth outcomes by helping them overcome their psychological distress.
Another French-based study having found green space associated with infant mortality after adjusting for
neighborhood deprivation (p value = 0.12) in Lyon, suggested a pathway by stress reduction from exposure to
green space towards a more favorable birth outcome.58 Proposed biological mechanisms of stress reduction
from contact with natural environments include psycho-neuroendocrine mechanisms, including the functioning
of the hypothalamic pituitary adrenal axis which regulates cortisol secretion, processes associated with the
nutrition and oxygenation fetal-maternal exchanges restricting fetal growth.68 Future analysis can be done to
focus on green space at contextual level adjusting for neighborhood socioeconomic deprivation to assess its
potential contributing role in explaining a part of the reduced birth weight variation in Paris metropolitan area.
Apart from SES related indicators, other individual risk factors for a mother to give birth to a term LBW infant
include maternal age, maternal parity and gender of infant after adjustment for SES variables. The risk of term
LBW is positively associated with maternal age as a continuous variable, and in addition, the proportion of cases
increases with each age group compared to the control with the greatest contrast found among the oldest age
group (>40) according to the descriptive analysis. It has been suggested the increased risk among older mothers
could be in part due to increased morbidity and obstetric problems during pregnancy and delivery, although the
underlying mechanisms are substantially unknown.69 Maternal parity which is a common fetal growth predictor,
inconsistent with most studies,1.20-22 has an inverse relationship most likely due to population sampling
inadequacy as indicated in the results section. Results for infant sex has been poorly examined in existing studies
as a factor influencing adverse birth outcomes. However, male infants generally have a consistently higher
birthweight mean throughout gestation compared to females, thus a higher proportion of females tend to be
LBW.70
28
4.3 Statistical weaknesses
A major weakness in our study is that we did not control for other measures that are also known to be strongly
associated to reduced birth weight due to unavailable information. Such unaccounted confounders include
maternal smoking, alcohol consumption and marital status as indicated in the literature review. Furthermore, a
major hindrance in our study is that we did not adjust our sample population by the number of fetuses carried to
term. Most studies we reviewed have only included singleton births in their study sample population, as multiple
births (more than one fetus) is the most common reason for babies to be born with low birthweight. In addition,
research indicates that the overall increase of low birthweight rates after 1980, is partly due to a parallel increase
of multiple births, though the rate of low birthweight among singleton births have also increased.71
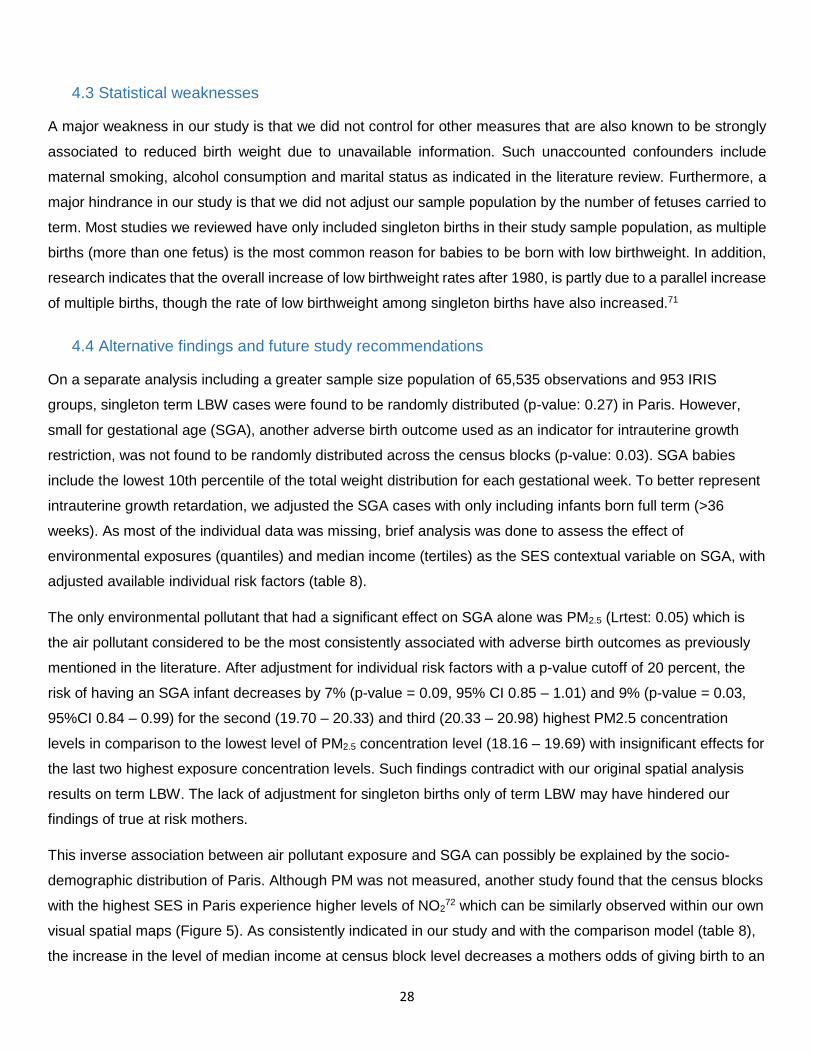
4.4 Alternative findings and future study recommendations
On a separate analysis including a greater sample size population of 65,535 observations and 953 IRIS
groups, singleton term LBW cases were found to be randomly distributed (p-value: 0.27) in Paris. However,
small for gestational age (SGA), another adverse birth outcome used as an indicator for intrauterine growth
restriction, was not found to be randomly distributed across the census blocks (p-value: 0.03). SGA babies
include the lowest 10th percentile of the total weight distribution for each gestational week. To better represent
intrauterine growth retardation, we adjusted the SGA cases with only including infants born full term (>36
weeks). As most of the individual data was missing, brief analysis was done to assess the effect of
environmental exposures (quantiles) and median income (tertiles) as the SES contextual variable on SGA, with
adjusted available individual risk factors (table 8).
The only environmental pollutant that had a significant effect on SGA alone was PM2.5 (Lrtest: 0.05) which is
the air pollutant considered to be the most consistently associated with adverse birth outcomes as previously
mentioned in the literature. After adjustment for individual risk factors with a p-value cutoff of 20 percent, the
risk of having an SGA infant decreases by 7% (p-value = 0.09, 95% CI 0.85 – 1.01) and 9% (p-value = 0.03,
95%CI 0.84 – 0.99) for the second (19.70 – 20.33) and third (20.33 – 20.98) highest PM2.5 concentration
levels in comparison to the lowest level of PM2.5 concentration level (18.16 – 19.69) with insignificant effects for
the last two highest exposure concentration levels. Such findings contradict with our original spatial analysis
results on term LBW. The lack of adjustment for singleton births only of term LBW may have hindered our
findings of true at risk mothers.
This inverse association between air pollutant exposure and SGA can possibly be explained by the socio-
demographic distribution of Paris. Although PM was not measured, another study found that the census blocks
with the highest SES in Paris experience higher levels of NO272 which can be similarly observed within our own
visual spatial maps (Figure 5). As consistently indicated in our study and with the comparison model (table 8),
the increase in the level of median income at census block level decreases a mothers odds of giving birth to an
29
SGA infant. This could possibly indicate that the protection against SGA arising from a better SES is stronger
than the effect of exposure to air pollution. Such a conclusion would be interesting, as higher exposure to air
pollution found among richer populations has been very much exclusively found in European cities44,73,74
despite the literature usually generalizing the opposite.
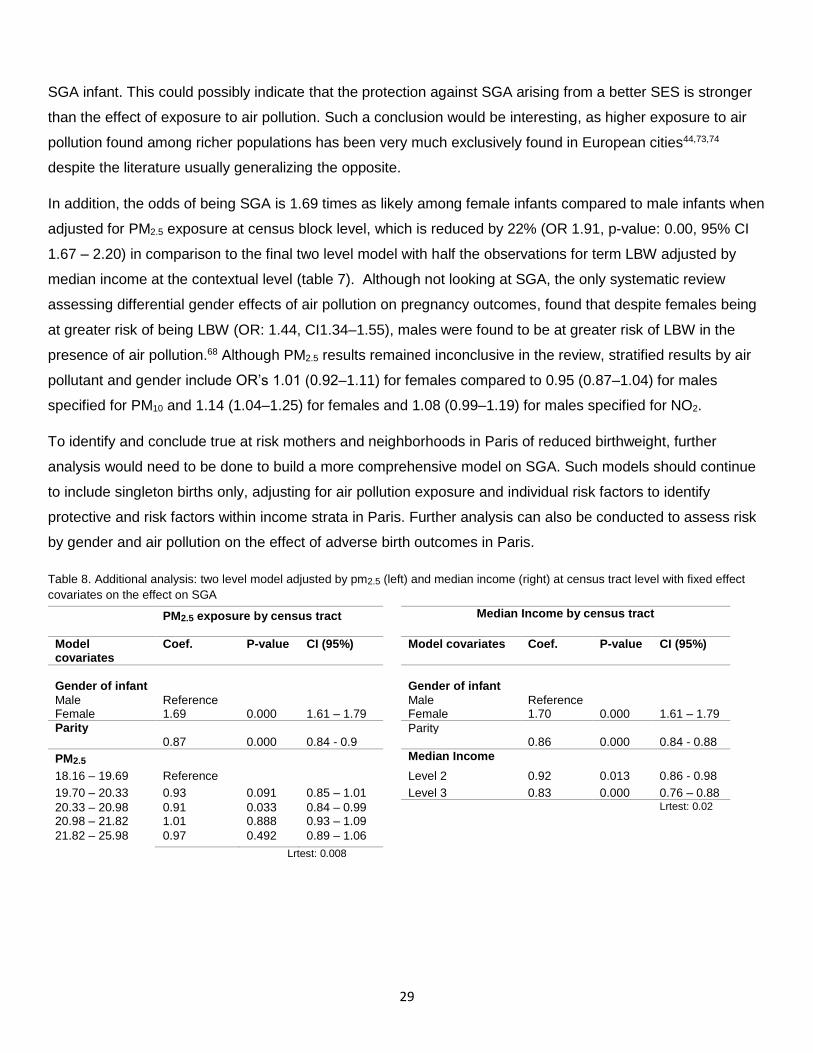
In addition, the odds of being SGA is 1.69 times as likely among female infants compared to male infants when
adjusted for PM2.5 exposure at census block level, which is reduced by 22% (OR 1.91, p-value: 0.00, 95% CI
1.67 – 2.20) in comparison to the final two level model with half the observations for term LBW adjusted by
median income at the contextual level (table 7). Although not looking at SGA, the only systematic review
assessing differential gender effects of air pollution on pregnancy outcomes, found that despite females being
at greater risk of being LBW (OR: 1.44, CI1.34–1.55), males were found to be at greater risk of LBW in the
presence of air pollution.68 Although PM2.5 results remained inconclusive in the review, stratified results by air
pollutant and gender include OR’s 1.01 (0.92–1.11) for females compared to 0.95 (0.87–1.04) for males
specified for PM10 and 1.14 (1.04–1.25) for females and 1.08 (0.99–1.19) for males specified for NO2.
To identify and conclude true at risk mothers and neighborhoods in Paris of reduced birthweight, further
analysis would need to be done to build a more comprehensive model on SGA. Such models should continue
to include singleton births only, adjusting for air pollution exposure and individual risk factors to identify
protective and risk factors within income strata in Paris. Further analysis can also be conducted to assess risk
by gender and air pollution on the effect of adverse birth outcomes in Paris.
Table 8. Additional analysis: two level model adjusted by pm2.5 (left) and median income (right) at census tract level with fixed effect
covariates on the effect on SGA
Lrtest: 0.008
PM2.5 exposure by census tract Median Income by census tract
Model covariates
Coef. P-value CI (95%) Model covariates Coef. P-value CI (95%)
Gender of infant
Gender of infant
Male Reference Male Reference Female 1.69 0.000 1.61 – 1.79 Female 1.70 0.000 1.61 – 1.79
Parity Parity 0.87 0.000 0.84 - 0.9 0.86 0.000 0.84 - 0.88
PM2.5 Median Income
18.16 – 19.69 Reference Level 2 0.92 0.013 0.86 - 0.98
19.70 – 20.33 0.93 0.091 0.85 – 1.01 Level 3 0.83 0.000 0.76 – 0.88
20.33 – 20.98 0.91 0.033 0.84 – 0.99 Lrtest: 0.02
20.98 – 21.82 1.01 0.888 0.93 – 1.09
21.82 – 25.98 0.97 0.492 0.89 – 1.06
30
4.4 Exposure assessment limitations
With regards to our exposure level measurements for air pollution concentration, other limitations need to be
considered. Although the dispersion model used in Paris such as the ESMERALDA give acceptable results,
uncertainty may arise from data sources, estimation methods or measurement tools, thus the amount of input
data required by the model is limited. However, the air pollutant modeling provides estimate pollutant
concentrations over a fine spatial scale, showing high correlations between the model’s predictions and the
measured air pollutant values obtained from the monitoring stations.72 Another weakness in our exposure
assessment is that by using annual mean concentration values, we didn’t account for time series or seasonality
of exposure compromising temporal resolution and pregnancy duration sensitivity.
4.5 Exposure assessment strengths
Nonetheless, there are major strengths found regarding the exposure assessment. The fine spatial resolution
yields a stronger associative relationship between SES and air pollution, capturing the intra-urban differences
and identifying the geographical distribution of existing neighborhood inequalities. Several studies that had
used SES characteristics measured at a macro-scale level (cities, counties, and states) did not find the effect
of pollution to vary across different areas.75 In contrast, studies that have measured SES indicators at a more
micro scale (district, neighborhood or census block) did reveal a variation of the combining effects, as in our
study.
5. Conclusion
In conclusion, there is a citywide variation in the incidence of reduced birthweight in the metropolitan area of
Paris after adjustment for environmental exposures and socioeconomic risk factors at the French census block
level. Intra-urban differences were identified with regards to the different levels of exposure to air pollution and
social deprivation, of which, we speculate this variation can explain the remaining difference. However, greater
study elaboration is needed in extending research towards the development of low birth weight interventions
and environmental policy regulation in Paris-city. Furthermore, addressing the issue requires a multidisciplinary
approach from both public health sociologists and environmentalists to protect at risk neighborhoods.
31
Bibliography
1. Habermann M, Gouveia N. Socioeconomic Position and Low Birth Weight among Mothers Exposed to Traffic-Related Air Pollution. PLoS ONE. 2014;9(11):e113900. - 2
2. Organization for Economic Cooperation and Development (OECD): Health at a glance Report 2013. Low Birthweight. Retrieved 15/03/15 from http://www.oecd.org/els/health-systems/Health-at-a-Glance-2013.pdf - 11
3. Blondel B, Kogan M, Alexander G, Dattani N, Kramer M, Macfarlane A et al. The Impact of the Increasing Number of Multiple Births on the Rates of Preterm Birth and Low Birthweight: An International Study. Am J Public Health. 2002;92(8):1323-1330. – 12
4. Wilcox, A.J., Russell, I.T., 1983. Birthweight and perinatal mortality: I. On the frequency distribution of birthweight. Int. J. Epidemiol. 12, 314–318.
5. Lawlor, D.A., et al., 2005. Birth weight is inversely associated with incident coronary heart disease and stroke among individuals born in the 1950s: findings from the Aberdeen children of the 1950s Prospective Cohort Study. Circulation 112, 1414–1418.
6. Vos, L.E., et al., 2006. Birth size and coronary heart disease risk score in young adulthood. The Atherosclerosis Risk in Young Adults (ARYA) study. Eur. J. Epidemiol. 21, 33–38.
7. Bergvall, N., et al., 2007. Genetic and shared environmental factors do not confound the association between birth weight and hypertension: a study among Swedish twins. Circulation 115, 2931–2938.
8. Hattersley, A.T., Tooke, J.E., 1999. The fetal insulin hypothesis: an alternative explanation of the association of low birthweight with diabetes and vascular disease. Lancet 353, 1789–1792.
9. Laurent O, Wu J, Li L, Chung J, Bartell S. Investigating the association between birth weight and complementary air pollution metrics: a cohort study. Environ Health. 2013;12(1):18.
10. Escobar, G.J., et al., 2006. Short-term outcomes of infants born at 35 and 36 weeks gestation: we need to ask more questions. Semin. Perinatol. 30, 28–33.
11. Sonnenschein-van der Voort, A.M., et al., 2014. Preterm birth, infant weight gain, and childhood asthma risk: a meta-analysis of 147,000 European children. J. Allergy Clin. Immunol.
12. https://www.premup.org/media/documents/presse/dpassises2014_16nov14vdef_.pdf
13. Russell R, Green N, Steiner C, Meikle S, Howse J, Poschman K et al. Cost of Hospitalization for Preterm and Low Birth Weight Infants in the United States. PEDIATRICS. 2007;120(1):e1-e9.
14. Berhman RE, Butler AS, eds. Preterm birth: Causes, consequences and prevention. Washington, DC: The National Academies Press; 2007
32
15. Link, Bruce G. and Jo C. Phelan. 1995. “Social Conditions as Fundamental Causes of Disease.” Journal of Health and Social Behavior (extra issue):80-94.
16. Langer A. Support during pregnancy for women at increased risk of low birth weight babies: RHL commentary (last revised: 1 October 2011). The WHO Reproductive Health Library; Geneva: World Health Organization.
17. Hughes D, Simpson L. The Role of Social Change in Preventing Low Birth Weight. The Future of Children. 1995;5(1):87.
18. Zeka A, Melly SJ, Schwartz J (2008) The effects of socioeconomic status and indices of physical environment on reduced birth weight and preterm births in Eastern Massachusetts. Environ Health 7:1–13doi:10.1186/1476-069X-7-60
19. Slama R, Morgenstern V, Cyrys J, Zutavern A, Herbarth O, Wichmann H et al. Traffic-Related Atmospheric Pollutants Levels during Pregnancy and Offspring’s Term Birth Weight: A Study Relying on a Land-Use Regression Exposure Model. Environ Health Perspect. 2007;115(9):1283-1292.
20. Pedersen M, Giorgis-Allemand L, Bernard C, Aguilera I, Andersen A, Ballester F et al. Ambient air pollution and low birthweight: a European cohort study (ESCAPE). The Lancet Respiratory Medicine. 2013;1(9):695-704.
21. Ha S, Hu H, Roussos-Ross D, Haidong K, Roth J, Xu X. The effects of air pollution on adverse birth outcomes. Environmental Research. 2014;134:198-204.
22. Vinikoor-Imler L, Davis J, Meyer R, Messer L, Luben T. Associations between prenatal exposure to air pollution, small for gestational age, and term low birthweight in a state-wide birth cohort. Environmental Research. 2014;132:132-139.
23. Msall ME, Park JJ. The spectrum of behavioral outcomes after extreme prematurity: regulatory, attention, social, and adaptive dimensions.Seminars in Perinatology. 2008; 32(1):42-50.
24. Korenbrot, K.C. Risk reduction in pregnancies of low income women. Mobius (1984) 4,3:34-43.76
25. Lennie,J.A., Klun,J.R., and Hausner, T. Low birthweight rate reduced by the Obstetrical Access Project. Health Care Financing Review (1984) 8,3:83-86.
26. Langer A. Support during pregnancy for women at increased risk of low birth weight babies: RHL commentary (last revised: 1 October 2011). The WHO Reproductive Health Library; Geneva: World Health Organization.
27. Ghio, A.J., Carraway, M.S., Madden, M.C., 2012. Composition of air pollution particles and oxidative stress in cells, tissues, and living systems. J. Toxicol. Environ. Health B Crit. Rev. 15, 1–21.Brook and rajagopalan 2012
28. Peters, A., et al., 1997. Increased plasma viscosity during an air pollution episode: a link to mortality? Lancet 349, 1582–1587.Rurta et al 2004
29. Takeda, K., et al., 2004. Endocrine-disrupting activity of chemicals in diesel exhaust and diesel exhaust particles. Environ. Sci. 11, 33–45.
30. Somers, C.M., Cooper, D.N., 2009. Air pollution and mutations in the germline: are humans at risk? Hum. Genet. 125, 119–130.
33
31. Baccarelli, A., et al., 2009. Rapid DNA methylation changes after exposure to traffic particles. Am. J. Respir. Crit. Care. Med. 179, 572–578.
32. Stieb DM, Chen L, Eshoul M, Judek S. Ambient air pollution, birth weight and preterm birth: A systematic review and meta-analysis. Environ Res. 2012;117:100–111.
33. Parker J, Rich D, Leem J, Glinianaia S. International Collaboration on Air Pollution and Pregnancy Outcomes (ICAPPO): Pilot Study Analytic Plan for Data Re-Analysis. Epidemiology. 2009;20:S246.
34. Shah, P.S., et al., 2011. Air pollution and birth outcomes: a systematic review. Environ. Int. 37, 498–516.
35. Dadvand P, Parker J, Bell ML, et al. Maternal exposure to particulate air pollution and term birth weight: a multi-country evaluation of effect and heterogeneity. Environ Health Perspect 2013; 121: 267–373.
36. Cheong JL, Hunt RW, Anderson PJ, et al. Head growth in preterm infants: correlation with magnetic resonance imaging and neurodevelopmental outcome. Pediatrics 2008; 121: e1534–40.
37. Mauad T, Rivero DH, de Oliveira RC, et al. Chronic exposure to ambient levels of urban particles affects mouse lung development. Am J Respir Crit Care Med 2008; 178: 721–28.
38. Sapkota A, Chelikowsky AP, Nachman KE, Cohen AJ, Ritz B. Exposure to particulate matter and adverse birth outcomes: a comprehensive review and meta-analysis. Air Qual Atmos Health.2010;5(4):369–381.
39. Parker JD, Woodruff TJ. Influences of study design and location on the relationship between particulate matter air pollution and birthweight. Paediatr Perinat Epidemiol. 2008;22(3):214–227.
40. Parker JD, Woodruff TJ, Basu R, Schoendorf KC. Air pollution and birth weight among term infants in California. Pediatrics. 2005;115(1):121–128
41. Kashima S, Naruse H, Yorifuji T, Ohki S, Murakoshi T, Takao S et al. Residential proximity to heavy traffic and birth weight in Shizuoka, Japan. Environmental Research. 2011;111(3):377-387.
42. Brauer M, Lencar C, Tamburic L, Koehoorn M, Demers P, Karr C. A Cohort Study of Traffic-Related Air Pollution Impacts on Birth Outcomes. Environ Health Perspect. 2008;116(5):680-686.
43. Slama R, Morgenstern V, Cyrys J, Zutavern A, Herbarth O, Wichmann H et al. Traffic-Related Atmospheric Pollutants Levels during Pregnancy and Offspring’s Term Birth Weight: A Study Relying on a Land-Use Regression Exposure Model. Environ Health Perspect. 2007;115(9):1283-1292.
44. Aguilera I, Guxens M, Garcia-Esteban R, Corbella T, Nieuwenhuijsen MJ, Foradada CM, et al. 2009. Association between GIS-based exposure to urban air pollution during pregnancy and birth weight in the INMA Sabadell Cohort. Environ Health Perspect 117:1322–1327; doi: 10.1289/ehp.0800256.
45. Woodruff TJ, Parker JD, Darrow LA, Slama R, Bell ML, Choi H, et al. Methodological issues in studies of air pollution and reproductive health. Environ Res. 2009;109(3):311–320.
46. Olsson D, Ekstrom M, Forsberg B: Temporal variation in Air pollution concentrations and preterm birth-a population based epidemiological study. Int J Env Res Public Health 2012, 9:272-285.
47. Darrow LA, Klein M, Strickland MJ, Mulholland JA, Tolbert PE: Ambient Air pollution and birth weight in full-term infants in atlanta, 1994–2004. Env Health Perspect 2011, 119:731-737.
34
48. Sagiv SK, Mendola P, Loomis D, Herring AH, Neas LM, Savitz DA, Poole C: A time-series analysis of air pollution and preterm birth in Pennsylvania, 1997–2001.
49. Ross Z, Ito K, Johnson S, Yee M, Pezeshki G, Clougherty J et al. Spatial and temporal estimation of air pollutants in New York City: exposure assignment for use in a birth outcomes study. Environ Health. 2013;12(1):51.
50. Savitz D, Bobb J, Carr J, Clougherty J, Dominici F, Elston B et al. Ambient Fine Particulate Matter, Nitrogen Dioxide, and Term Birth Weight in New York, New York. American Journal of Epidemiology. 2013;179(4):457-466.
51. O'Neill MS, Jerrett M, Kawachi I, Levy JI, Cohen AJ, Gouveia N, Wilkinson P, Fletcher T, Cifuentes L, Schwartz J, Workshop on Air Pollution and Socioeconomic Conditions Environ Health Perspect. 2003 Dec; 111(16):1861-70
52. Bell M, Ebisu K, Belanger K. Ambient Air Pollution and Low Birth Weight in Connecticut and Massachusetts. Environ Health Perspect. 2007;115(7):1118-1124.
53. Morello-Frosch R, Jesdale B, Sadd J, Pastor M. Ambient air pollution exposure and full-term birth weight in California. Environ Health. 2010;9(1):44.
54. Williams B, Pennock-Román M, Suen H, Magsumbol M, Ozdenerol E. Assessing the impact of the local environment on birth outcomes: a case for HLM. Journal of Exposure Science and Environmental Epidemiology. 2006;17(5):445-457.
55. Ponce NA, Hoggatt KJ, Wilhelm M, Ritz B. Preterm birth: the interaction of traffic-related air pollution with economic hardship in Los Angeles neighborhoods. Am J Epidemiol.2005;162:140–148. doi: 10.1093/aje/kwi173.
56. Garcia-Subirats I, Pérez G, Rodríguez-Sanz M, Ruiz-Muñoz D, Salvador J. Erratum to: Neighborhood Inequalities in Adverse Pregnancy Outcomes in an Urban Setting in Spain: A Multilevel Approach. J Urban Health. 2012;89(5):872-872.
57. Padilla C, Deguen S, Lalloue B, Blanchard O, Beaugard C, Troude F et al. Cluster analysis of social and environment inequalities of infant mortality. A spatial study in small areas revealed by local disease mapping in France. Science of The Total Environment. 2013;454-455:433-441.
58. Kihal-Talantikite W, Padilla C, Lalloué B, Gelormini M, Zmirou-Navier D, Deguen S. Green space, social inequalities and neonatal mortality in France. BMC Pregnancy and Childbirth. 2013;13(1):191.
59. INSEE. "Estimation de population au 1er janvier, par région, sexe et grande classe d'âge – Année 2014" (in French). Retrieved 29 March 2015
60. Lalloué B, Monnez J-M, Padilla C, Kihal W, Le Meur N, Zmirou-Navier D, Deguen S. A statistical procedure to create a neighborhood socioeconomic index for health inequalities analysis. Int J Equity Health. 2013;12:21.
61. Carruthers DJ, Edmunds HA, Lester AE, McHugh CA, Singles RJ. Use and validation of ADMS-Urban in contrasting urban and industrial locations. International Journal of Environment and Pollution. 2000;14:364–374.
62. Jerrett M, Gale S, Kontgis C. Spatial Modeling in Environmental and Public Health Research. IJERPH. 2010;7(4):1302-1329.
35
63. Information Management Services, Inc. SaTScan: software for the spatial, temporal, and space-time
scan statistics, version 6.0.2005.
64. Stahl D. Book review: Rabe-Hesketh S, Skrondal A 2008: Multilevel and Longitudinal Modeling Using Stata, second edition. College Station, TX: Stata Press. 562pp. USD 59.00. ISBN 978-1-59718-040-5. Statistical Methods in Medical Research. 2009;18(1):111-112.
65. Meyer J, Nichols G, Warren N, Reisine S. Maternal Occupation and Risk for Low Birth Weight Delivery: Assessment Using State Birth Registry Data. Journal of Occupational and Environmental Medicine. 2008;50(3):306-315.
66. Thompson L. Regional Variation in Rates of Low Birth Weight. PEDIATRICS. 2005;116(5):1114-1121.
67. Blondel B, Marshall B. Poor antenatal care in 20 French districts: risk factors and pregnancy outcome. Journal of Epidemiology & Community Health. 1998;52(8):501-506.
68. Acute maternal stress and fetal hypoxia in the baboon Morishima H, Yeh M, James L: Reduced uterine blood flow and fetal hypoxemia with acute maternal stress: Experimental observation in the pregnant baboon. Am J Obstet Gynecol 134:270, 1979. Journal of Nurse-Midwifery. 1980;25(1):33.
69. Astolfi P, De Pasquale A, Zonta L. Late childbearing and its impact on adverse pregnancy outcome: stillbirth, preterm delivery and low birth weight. Revue d'Épidémiologie et de Santé Publique. 2005;53:97-105.
70. GHOSH R, RANKIN J, PLESSMULLOLI T, GLINIANAIA S. Does the effect of air pollution on
pregnancy outcomes differ by gender? A systematic review☆. Environmental Research.
2007;105(3):400-408.
71. Mathews, T. J., MacDorman, M. F. (2005) Infant mortality statistics from the 2004 period linked birth/infant death data set.National Vital Statistics Reports, 55(14). Hyattsville, Maryland: National Center for Health Statistics.
72. Padilla C, Kihal-Talantikite W, Vieira V, Rossello P, Nir G, Zmirou-Navier D et al. Air quality and social deprivation in four French metropolitan areas—A localized spatio-temporal environmental inequality analysis. Environmental Research. 2014;134:315-324.
73. Forastiere F, Stafoggia M, Tasco C, Picciotto S, Agabiti N, Cesaroni G, et al. Socioeconomic status, particulate air pollution, and daily mortality: differential exposure or differential susceptibility. Am J Ind Med 2007; 50:208-16.
74. Hoek G, Brunekreef B, Goldbohm S, Fischer P, van den Brandt PA. Association between mortality and indicators of traffic-related air pollution in the Netherlands: a cohort study. Lancet 2002; 360:1203-9.
75. Laurent O, Bard D, Filleul L, Segala C. Effect of socioeconomic status on the relationship between atmospheric pollution and mortality. Journal of Epidemiology & Community Health. 2007;61(8):665-675.
76. European Commission: Air quality standards. Updated 22/04/2015. Retrieved 02/06/15 from http://ec.europa.eu/environment/air/quality/standards.htm

36
Annex 1. University of Sheffield ethical approval
37
38
Abstract
Introduction: As one of the single most important factors determining child survival with straining emotional and
economic costs, low birth weight is a critical child and maternal health issue. Addressing this challenge
requires greater epidemiological investigation to design more effective interventions. Studies need to
conceptually expand on the observing set of exposures linked to LBW, such as the environmental context
associated with social conditions to identify true at risk mothers.
Methods: Census block data including environmental exposures (NO2, PM2.5, and PM10) and socioeconomic
measures from the 2006 national French census are assessed simultaneously with individual characteristics
extracted from 79,876 birth certificates on the effect of low birth weight and full term low birth weight in Paris
metropolitan area. Two methodological objectives include: i) a spatial analysis to assess the correlation
between the distributions of the contextual exposures to low birthweight (LBW) and full term low birthweight
(term LBW) ii) a multilevel analysis to analyze the effect of social and environmental determinants on the risk of
LBW at the individual and contextual level. As such, the aim of our study is to assess the role of environmental
exposures and social characteristics on the risk of LBW at both the individual and neighborhood levels in Paris-
city.
Results: Both methods used in our study yielded results that are inconsistent of each other with regards to air
pollution exposures, most likely due to different population sample sizes. Nonetheless, adjusting for both
socioeconomic related contextual (median income specific) and individual characteristics, the two-level model
improves significantly in explaining a part of the variability to the distribution of term LBW (LLr p-value = 0.03).
Where the logistic multilevel model did not find any significant association with air pollution exposure, the
spatial analysis revealed that the covariates between social deprivation with each air pollutant exposure at
census block level: NO2 (RR 2.43, p-value = 0.03), PM2.5 (RR 2.41, p-value = 0.03) and PM10 (RR 2.41, p-value
= 0.04) provides the best fitted model in explaining the greatest part of excess term LBW risk in Paris-city.
Conclusion: There is a citywide variation in the incidence of reduced birthweight in the metropolitan area of
Paris after adjustment for environmental exposures and socioeconomic risk factors at the French census block
level. Intra-urban differences were identified with regards to the different levels of exposure to air pollution and
social deprivation, of which, we speculate this variation can explain the remaining difference.
39
Abstrait
Introduction: Le poids de naissance faible est un sujet critique dans le domaine de la santé maternelle et des enfants, qui reste un des facteurs les plus importants qui déterminent la survie des enfants nés dans des circonstances de difficultés émotionnelles et économiques. Relever ce défi exige une plus grande enquête épidémiologique afin d’effectuer des interventions plus efficaces. Les études doivent élargir conceptuellement sur l'ensemble observant des expositions liées à l'IPN, tels que le contexte environnemental associé aux conditions sociales pour identifier des mères qui sont à vrai risque.
Méthodes: Les données de blocs de recensement, y compris les expositions environnementales (NO2, PM2.5
et PM10) et les mesures socio-économiques du recensement de 2006 sont évalués en même temps que les
caractéristiques individuelles extraites de 79,876 certificats de naissance sur l'effet de faible poids de naissance et de faible poids de naissance à terme en Paris région métropolitaine. Deux objectifs méthodologiques comprennent: i) une analyse spatiale pour évaluer la corrélation entre les distributions des expositions contextuels avec covariables rajusté en fonction de l'IPN et l'IPN terme ii) une analyse à plusieurs niveaux pour analyser l'effet des déterminants sociaux et environnementaux sur le risque de faible poids de naissance au niveau individuel et contextuel. En tant que tel, le but de notre étude est d'évaluer le rôle des expositions environnementales et les caractéristiques sociales sur le risque de faible poids de naissance à la fois au niveau individuel et de quartier à Paris intra-muraux.
Résultats: probablement lié aux différentes tailles d'échantillon de la population, les deux méthodes utilisées dans notre étude ont donné des résultats qui sont incompatibles les uns des autres en ce qui concerne l'exposition à la pollution atmosphérique. Néanmoins, l’ajustement sur les caractéristiques individuelles (revenus médians spécifiques) et contextuelle liées au statut socio-économique, le modèle à deux niveaux s’améliore significativement en expliquant une partie de la variabilité dans la distribution du poids de naissance faible (LLR p: 0,03). Lorsque le modèle à plusieurs niveaux logistique n'a pas trouvé d'association significative pour l'exposition à la pollution de l'air, l'analyse spatiale a révélé que les covariantes entre la précarité sociale
avec chaque exposition à des polluants de l'air au niveau de l'îlot de recensement: NO2 (RR 2,43, p: 0,03),
PM2.5 (RR 2,41, p: 0,03) et les PM10 (RR 2,41, p-valeur: 0,04) fournissent le modèle le mieux équipé pour
expliquer la plus grande partie du risque IPN excès terme à Paris intra-muraux.
Conclusion: Il existe une variation dans toute la ville de l'incidence du poids de naissance réduit dans la zone métropolitaine de Paris après l’ajustement pour les expositions environnementales et les facteurs de risque socio-économiques au niveau de l'îlot de recensement français. Des différences intra-urbaines ont été identifiés en ce qui concerne les différents niveaux d'exposition à la pollution de l'air et de privation sociale, dont, nous spéculons cette variation peut expliquer la différence restante.