Embed Size (px)
Citation preview
THIS REPORT CONTAINS ASSESSMENTS OF COMMODITY AND TRADE ISSUES MADE BY
USDA STAFF AND NOT NECESSARILY STATEMENTS OF OFFICIAL U.S. GOVERNMENT
POLICY
Date:
GAIN Report Number:
Approved By:
Prepared By:
Report Highlights:
The Dutch foodservice industry is expected to grow annually by over two percent due to a recovering economy
and changing consumer eating culture. The growing segments within the foodservice industry are especially the
specialist coffee shops, juice/smoothie bars and food trucks. Young consumers are increasingly looking for new
and convenient food solutions. The report furthermore presents a road map for U.S. exporters who wish to
expand business in the Dutch market. U.S. food product with clean ingredients and healthy food products have
the best sales potential on the Dutch market.
Marcel H. Pinckaers
Susan Phillips
An Overview of the Foodservice Industry in the Netherlands
Food Service - Hotel Restaurant Institutional
Netherlands
NL6014
7/6/2016
Required Report - public distribution
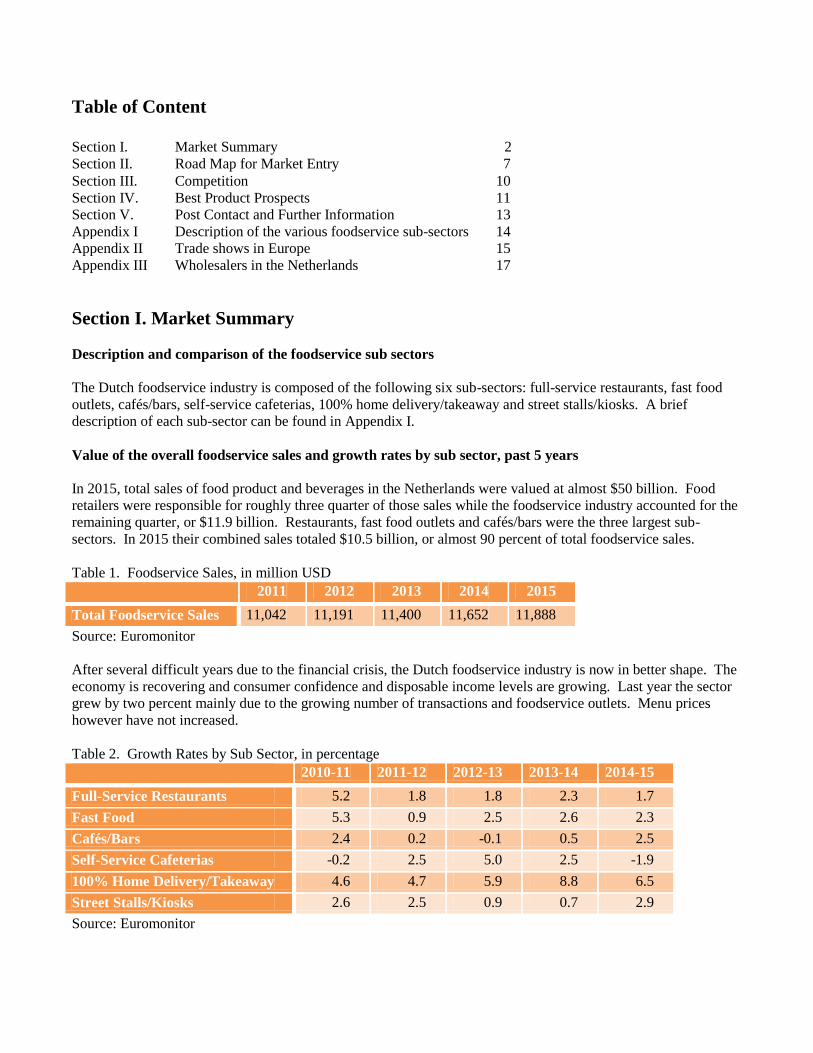
Table of Content
Section I. Market Summary 2
Section II. Road Map for Market Entry 7
Section III. Competition 10
Section IV. Best Product Prospects 11
Section V. Post Contact and Further Information 13
Appendix I Description of the various foodservice sub-sectors 14
Appendix II Trade shows in Europe 15
Appendix III Wholesalers in the Netherlands 17
Section I. Market Summary
Description and comparison of the foodservice sub sectors
The Dutch foodservice industry is composed of the following six sub-sectors: full-service restaurants, fast food
outlets, cafés/bars, self-service cafeterias, 100% home delivery/takeaway and street stalls/kiosks. A brief
description of each sub-sector can be found in Appendix I.
Value of the overall foodservice sales and growth rates by sub sector, past 5 years
In 2015, total sales of food product and beverages in the Netherlands were valued at almost $50 billion. Food
retailers were responsible for roughly three quarter of those sales while the foodservice industry accounted for the
remaining quarter, or $11.9 billion. Restaurants, fast food outlets and cafés/bars were the three largest sub-
sectors. In 2015 their combined sales totaled $10.5 billion, or almost 90 percent of total foodservice sales.
Table 1. Foodservice Sales, in million USD
2011 2012 2013 2014 2015
Total Foodservice Sales 11,042 11,191 11,400 11,652 11,888
Source: Euromonitor
After several difficult years due to the financial crisis, the Dutch foodservice industry is now in better shape. The
economy is recovering and consumer confidence and disposable income levels are growing. Last year the sector
grew by two percent mainly due to the growing number of transactions and foodservice outlets. Menu prices
however have not increased.
Table 2. Growth Rates by Sub Sector, in percentage
2010-11 2011-12 2012-13 2013-14 2014-15
Full-Service Restaurants 5.2 1.8 1.8 2.3 1.7
Fast Food 5.3 0.9 2.5 2.6 2.3
Cafés/Bars 2.4 0.2 -0.1 0.5 2.5
Self-Service Cafeterias -0.2 2.5 5.0 2.5 -1.9
100% Home Delivery/Takeaway 4.6 4.7 5.9 8.8 6.5
Street Stalls/Kiosks 2.6 2.5 0.9 0.7 2.9
Source: Euromonitor
Annual growth rates for full-service restaurants have been stable for the past few years at almost two percent. The
same applies to fast food outlets. They demonstrated an annual growth rates between two and three percent. The
growth rate for cafés/bars picked up in 2015, driven by growing sales at specialist coffee shops and
juice/smoothie bars. The opposite development happened for self-service cafeterias. After several years of
positive growth rates, the turnover in this segment dropped by almost two percent in 2015. Chained self-service
cafeterias like La Place and HEMA struggled to maintain transaction levels while independent self-service
cafeterias saw their number of outlets decline. Although the annual growth rate dropped, last year was another
good year for the 100% home delivery/takeaways sub-segment. The growth rate of almost seven percent was
driven by strong consumer demand for convenience consumption. Young urban consumers who live in single
households are an important group. This group finds it convenient to not prepare food themselves while being
able to stay at home. Another important target group is consumers who work out-of-home late in the evening and
prefer to order from 100% home delivery/takeaway companies over consuming evening meals brought to work
from home.
Expected growth rates of the foodservice sector and its sub sectors
Table 3. Expected Growth Rates of total Foodservice Sales, in percentage
2015-16 2016-17 2017-18 2018-19 2019-20
Foodservice 2.0 2.3 2.3 2.6 2.8
Source: Euromonitor
The future for the Dutch Foodservice industry looks bright. Annual growth rates are expected to increase from
two percent this year to almost three percent in 2020. There are two main developments that drive this positive
outlook. The first one is the positive performance of the Dutch economy. The Netherlands Bureau for Economic
Policy Analysis (CPB) forecasts that Dutch GDP will grow this year by 1.8 percent and 2.1 percent next year.
The unemployment rate is forecasted to further drop from 6.4 percent this year to 6.2 percent next year while the
annual inflation rate is expected to pick up from 0.1 percent this year to 0.9 percent in 2017.
The Dutch eating culture is changing; this trend is driven by the millennials1. The traditional 3 meals-a-day
(breakfast, lunch and dinner) is slowly being replaced by five snacking moments. At the same time, eating at
home is slowly transitioning to eating while traveling, working or meeting friends. Food choices and eating
moments are becoming more tailor-made. These developments will all have a positive effect on consumer
spending in foodservice outlets.
Figure 1: Turnover of the Consumer Foodservice Sub-Sectors, in million USD, 2011-2020
1 A consumer group born between the early 1980s to around 2000.
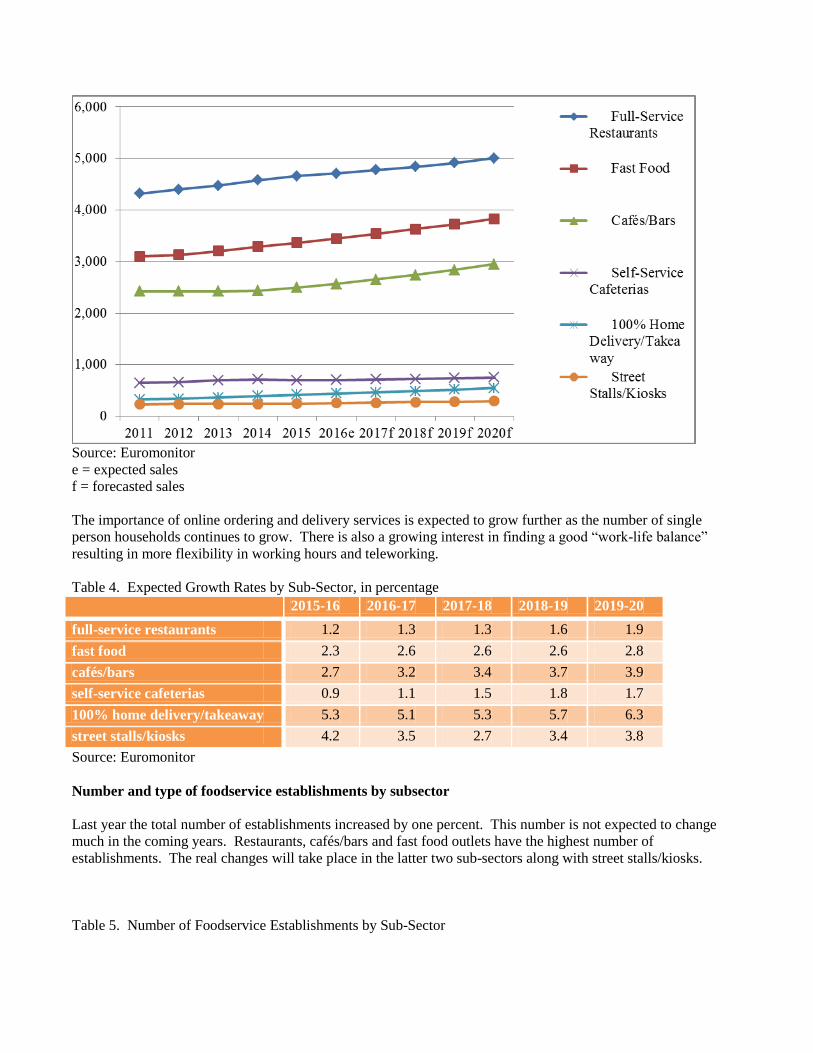
Source: Euromonitor
e = expected sales
f = forecasted sales
The importance of online ordering and delivery services is expected to grow further as the number of single
person households continues to grow. There is also a growing interest in finding a good “work-life balance”
resulting in more flexibility in working hours and teleworking.
Table 4. Expected Growth Rates by Sub-Sector, in percentage
2015-16 2016-17 2017-18 2018-19 2019-20
full-service restaurants 1.2 1.3 1.3 1.6 1.9
fast food 2.3 2.6 2.6 2.6 2.8
cafés/bars 2.7 3.2 3.4 3.7 3.9
self-service cafeterias 0.9 1.1 1.5 1.8 1.7
100% home delivery/takeaway 5.3 5.1 5.3 5.7 6.3
street stalls/kiosks 4.2 3.5 2.7 3.4 3.8
Source: Euromonitor
Number and type of foodservice establishments by subsector
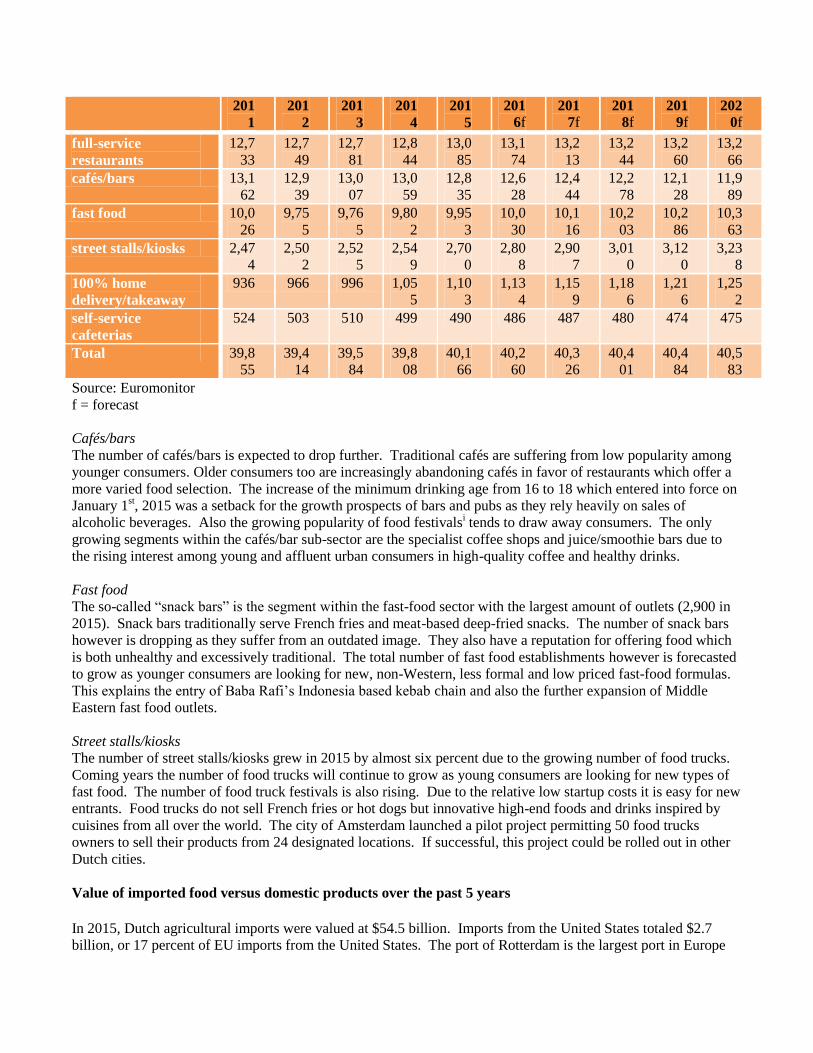
Last year the total number of establishments increased by one percent. This number is not expected to change
much in the coming years. Restaurants, cafés/bars and fast food outlets have the highest number of
establishments. The real changes will take place in the latter two sub-sectors along with street stalls/kiosks.
Table 5. Number of Foodservice Establishments by Sub-Sector
201
1
201
2
201
3
201
4
201
5
201
6f 201
7f 201
8f 201
9f 202
0f
full-service
restaurants
12,7
33
12,7
49
12,7
81
12,8
44
13,0
85
13,1
74
13,2
13
13,2
44
13,2
60
13,2
66
cafés/bars 13,1
62
12,9
39
13,0
07
13,0
59
12,8
35
12,6
28
12,4
44
12,2
78
12,1
28
11,9
89
fast food 10,0
26
9,75
5
9,76
5
9,80
2
9,95
3
10,0
30
10,1
16
10,2
03
10,2
86
10,3
63
street stalls/kiosks 2,47
4
2,50
2
2,52
5
2,54
9
2,70
0
2,80
8
2,90
7
3,01
0
3,12
0
3,23
8
100% home
delivery/takeaway
936 966 996 1,05
5
1,10
3
1,13
4
1,15
9
1,18
6
1,21
6
1,25
2
self-service
cafeterias
524 503 510 499 490 486 487 480 474 475
Total 39,8
55
39,4
14
39,5
84
39,8
08
40,1
66
40,2
60
40,3
26
40,4
01
40,4
84
40,5
83
Source: Euromonitor
f = forecast
Cafés/bars
The number of cafés/bars is expected to drop further. Traditional cafés are suffering from low popularity among
younger consumers. Older consumers too are increasingly abandoning cafés in favor of restaurants which offer a
more varied food selection. The increase of the minimum drinking age from 16 to 18 which entered into force on
January 1st, 2015 was a setback for the growth prospects of bars and pubs as they rely heavily on sales of
alcoholic beverages. Also the growing popularity of food festivalsi tends to draw away consumers. The only
growing segments within the cafés/bar sub-sector are the specialist coffee shops and juice/smoothie bars due to
the rising interest among young and affluent urban consumers in high-quality coffee and healthy drinks.
Fast food
The so-called “snack bars” is the segment within the fast-food sector with the largest amount of outlets (2,900 in
2015). Snack bars traditionally serve French fries and meat-based deep-fried snacks. The number of snack bars
however is dropping as they suffer from an outdated image. They also have a reputation for offering food which
is both unhealthy and excessively traditional. The total number of fast food establishments however is forecasted
to grow as younger consumers are looking for new, non-Western, less formal and low priced fast-food formulas.
This explains the entry of Baba Rafi’s Indonesia based kebab chain and also the further expansion of Middle
Eastern fast food outlets.
Street stalls/kiosks
The number of street stalls/kiosks grew in 2015 by almost six percent due to the growing number of food trucks.
Coming years the number of food trucks will continue to grow as young consumers are looking for new types of
fast food. The number of food truck festivals is also rising. Due to the relative low startup costs it is easy for new
entrants. Food trucks do not sell French fries or hot dogs but innovative high-end foods and drinks inspired by
cuisines from all over the world. The city of Amsterdam launched a pilot project permitting 50 food trucks
owners to sell their products from 24 designated locations. If successful, this project could be rolled out in other
Dutch cities.
Value of imported food versus domestic products over the past 5 years
In 2015, Dutch agricultural imports were valued at $54.5 billion. Imports from the United States totaled $2.7
billion, or 17 percent of EU imports from the United States. The port of Rotterdam is the largest port in Europe
and the world's sixth largest port. The Dutch are excellent traders and much of the agricultural imports are re-
exported directly or after adding value.
The vast majority of fresh and processed food products destined for the Foodservice industry fall in the
Consumer-Oriented and Fish and Seafood Products category. The Netherlands is the largest market within the
EU for these products from the United States. The United States is the 6th largest supplier of Consumer-Oriented
Products to the Netherlands and trade continues to grow. The U.S. market share also grew from almost three
percent in 2011 to over four percent last year. In 2015, the highest export levels since at least 1970 were posted
for beef & beef products, processed vegetables, tree nuts and condiments & sauces.
After Iceland, Germany, Russia, Norway, Belgium and Vietnam, the United States is the 7th largest supplier of
Fish and Seafood Products to the Netherlands. U.S. exports of Fish and Seafood Products to the Netherlands are
also growing, especially for scallops, shrimp and prawns, hake, dogfish and octopus. The U.S. market share grew
from three percent in 2011 to five percent last year. On the following website,
http://apps.fas.usda.gov/gats/BicoReport.aspx?type=country, you will find additional trade statistics and an
overview of the various products that fall under Consumer-Oriented products and under Fish and Seafood
products.
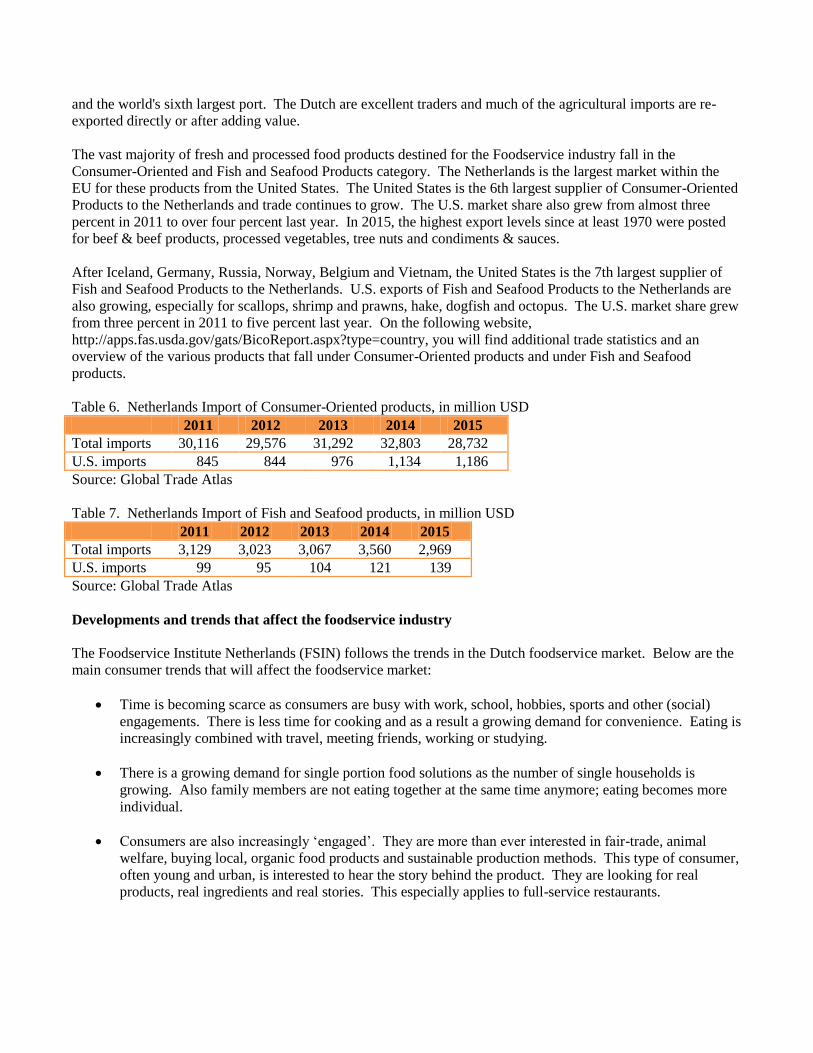
Table 6. Netherlands Import of Consumer-Oriented products, in million USD
2011 2012 2013 2014 2015
Total imports 30,116 29,576 31,292 32,803 28,732
U.S. imports 845 844 976 1,134 1,186
Source: Global Trade Atlas
Table 7. Netherlands Import of Fish and Seafood products, in million USD
2011 2012 2013 2014 2015
Total imports 3,129 3,023 3,067 3,560 2,969
U.S. imports 99 95 104 121 139
Source: Global Trade Atlas
Developments and trends that affect the foodservice industry
The Foodservice Institute Netherlands (FSIN) follows the trends in the Dutch foodservice market. Below are the
main consumer trends that will affect the foodservice market:
Time is becoming scarce as consumers are busy with work, school, hobbies, sports and other (social)
engagements. There is less time for cooking and as a result a growing demand for convenience. Eating is
increasingly combined with travel, meeting friends, working or studying.
There is a growing demand for single portion food solutions as the number of single households is
growing. Also family members are not eating together at the same time anymore; eating becomes more
individual.
Consumers are also increasingly ‘engaged’. They are more than ever interested in fair-trade, animal
welfare, buying local, organic food products and sustainable production methods. This type of consumer,
often young and urban, is interested to hear the story behind the product. They are looking for real
products, real ingredients and real stories. This especially applies to full-service restaurants.
It is very common in the Netherlands to have a smart phone. Consumers inform themselves by visiting
websites of foodservice outlets and they take decisions online. Sending an email, a text message or
what’s app is preferred above ringing up a restaurant.
Through social media consumers inform one another about ‘what’s hot’ and ‘what’s not’. What was the
service like? Was the food any good? Where there any extras? What was the atmosphere like? Was it
affordable? These are all part of the discussion. Pictures of the dishes, along with a comment, are often
shared through social media. Consumers use platforms like iens.nl, eetnu.nl, zoover.nl and tripadvisor.nl
to recommend a foodservice establishment or not.
The number of international tourists that visit the Netherlands is growing. Foodservice establishments are
likely to benefit by drawing in more tourists as customers. This also means that more customers will
order in English and will want to learn about what food or dishes are offered. Product information,
service and hospitality are ‘key’ for tourists.
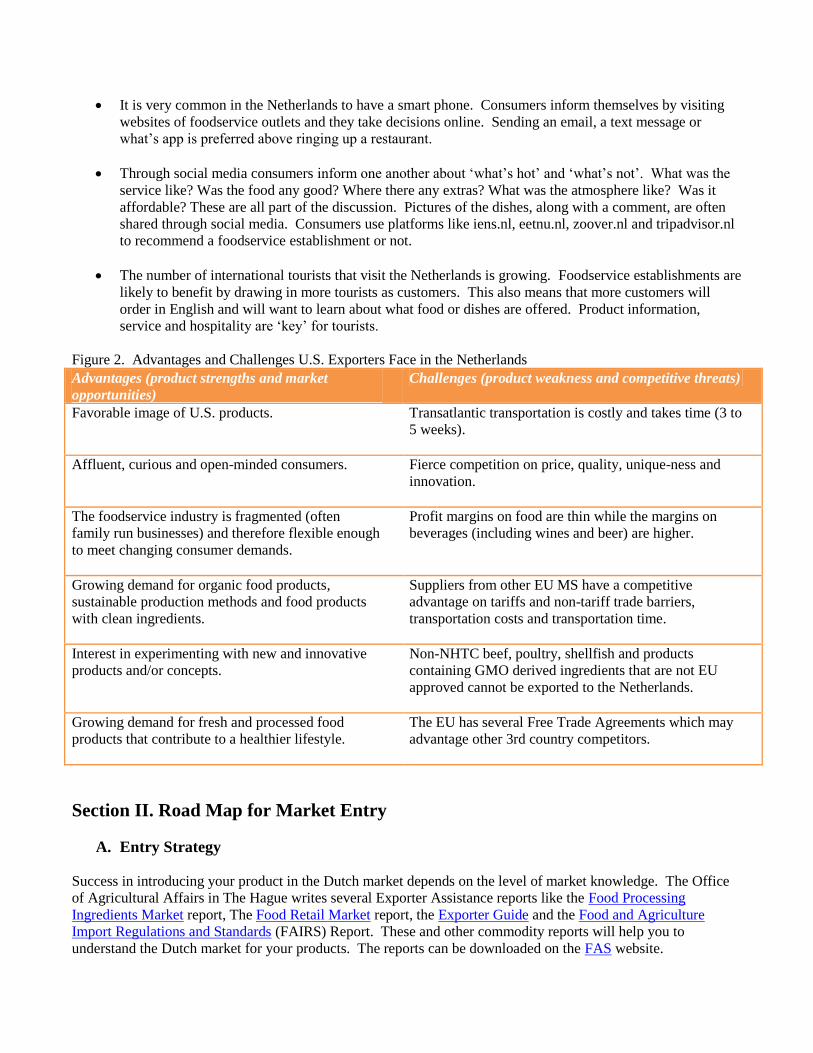
Figure 2. Advantages and Challenges U.S. Exporters Face in the Netherlands
Advantages (product strengths and market
opportunities)
Challenges (product weakness and competitive threats)
Favorable image of U.S. products. Transatlantic transportation is costly and takes time (3 to
5 weeks).
Affluent, curious and open-minded consumers.
Fierce competition on price, quality, unique-ness and
innovation.
The foodservice industry is fragmented (often
family run businesses) and therefore flexible enough
to meet changing consumer demands.
Profit margins on food are thin while the margins on
beverages (including wines and beer) are higher.
Growing demand for organic food products,
sustainable production methods and food products
with clean ingredients.
Suppliers from other EU MS have a competitive
advantage on tariffs and non-tariff trade barriers,
transportation costs and transportation time.
Interest in experimenting with new and innovative
products and/or concepts.
Non-NHTC beef, poultry, shellfish and products
containing GMO derived ingredients that are not EU
approved cannot be exported to the Netherlands.
Growing demand for fresh and processed food
products that contribute to a healthier lifestyle.
The EU has several Free Trade Agreements which may
advantage other 3rd country competitors.
Section II. Road Map for Market Entry
A. Entry Strategy
Success in introducing your product in the Dutch market depends on the level of market knowledge. The Office
of Agricultural Affairs in The Hague writes several Exporter Assistance reports like the Food Processing
Ingredients Market report, The Food Retail Market report, the Exporter Guide and the Food and Agriculture
Import Regulations and Standards (FAIRS) Report. These and other commodity reports will help you to
understand the Dutch market for your products. The reports can be downloaded on the FAS website.
The relationship with the buyer is also very important. Not only does he know the market, the specialized
importer also knows what document and certificate needs to accompany your product. Final approval of any
product is subject to the Dutch rules and regulations as interpreted by border officials at the time of product entry.
More detailed information on the Netherlands import regulations and standards can be found in the above FAIRS
report. The Office of Agricultural Affairs (OAA) in The Hague maintains a list of buyers of various Consumer
Oriented products and Seafood products.
Trade shows are excellent venues for U.S. exporters to make contact with potential Dutch buyers, to conduct
product introductions and to gauge buyers’ interest. Depending on the products, U.S. exporters should consider
visiting or exhibiting at one of the many trade shows in Europe. A detailed overview of the trade shows can be
found in Appendix II.
For more information, please contact:
Marcel H. Pinckaers
Embassy of the United States
Lange Voorhout 102, 2514 EJ The Hague, The Netherlands
Phone: +31 (0)70 3102 305
www.fas.usda.gov
B. Market Structure
The overall Dutch foodservice industry is highly fragmented and characterized by independent entrepreneurs.
This is especially the case for cafés/bars, restaurants, cafeterias and street stalls/kiosks. The majority of fast food
outlets on the other hand are not fragmented as they are often part of a chain. Well-known examples of chained
fast food outlets in the Netherlands are McDonalds, Burger King, KFC, Délifrance and Bakker Bart, together
responsible for 60 percent of the fast food market. Also 100% delivery/takeaway outlets are often part of a larger
chain. Domino’s Pizza, New York Pizza and Spare Rib Express are all active on the Dutch market.
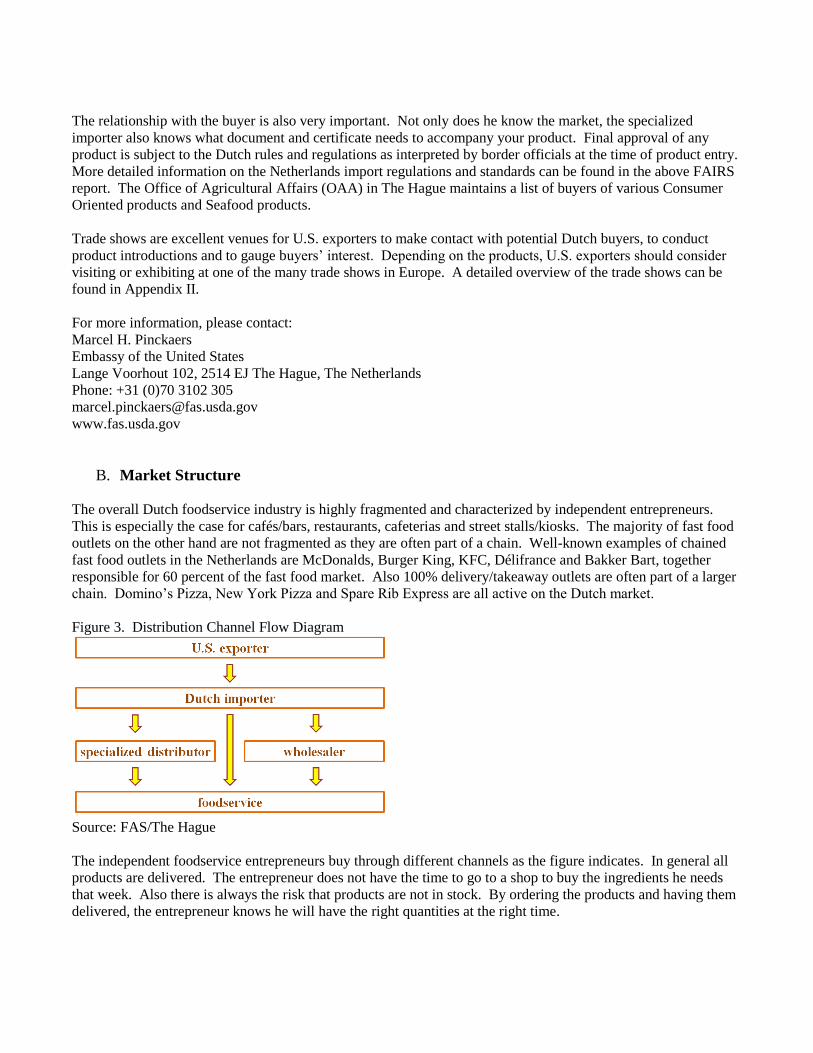
Figure 3. Distribution Channel Flow Diagram
Source: FAS/The Hague
The independent foodservice entrepreneurs buy through different channels as the figure indicates. In general all
products are delivered. The entrepreneur does not have the time to go to a shop to buy the ingredients he needs
that week. Also there is always the risk that products are not in stock. By ordering the products and having them
delivered, the entrepreneur knows he will have the right quantities at the right time.
Appendix III gives an overview of all wholesalers active in the Netherlands. Almost all wholesalers have shops
and delivery services. DeliXL and HORESCA have no shops and only deliver their products while Marko only
has shops and hardly delivers. Most wholesalers operate nationwide with the exception of Kweker, Zegro and
HORESCA who are active regionally.
Fresh products like bread, cakes, produce and dairy products are predominantly bought via specialized
distributors. The added value lies in the possibility to have tailor-made orders, the interpersonal relationship and
the guarantee you will receive the product and right amount you were looking for. Depending on the product, the
distributors source their products directly from primary producers, food companies or Dutch importers. In some
cases the distributor and the importer are the same company. This is especially the case for fresh products like
meat and seafood.
For shelf stable grocery products, such as spices, nuts, sauces, and cooking ingredients, foodservice entrepreneurs
turn to wholesalers. Wholesalers traditionally do not import from outside the European Union but work with
specialized importers.
Alcoholic drinks like beer and wines are often bought directly from a brewery and local wine importer who also
buy directly from the foreign supplier.
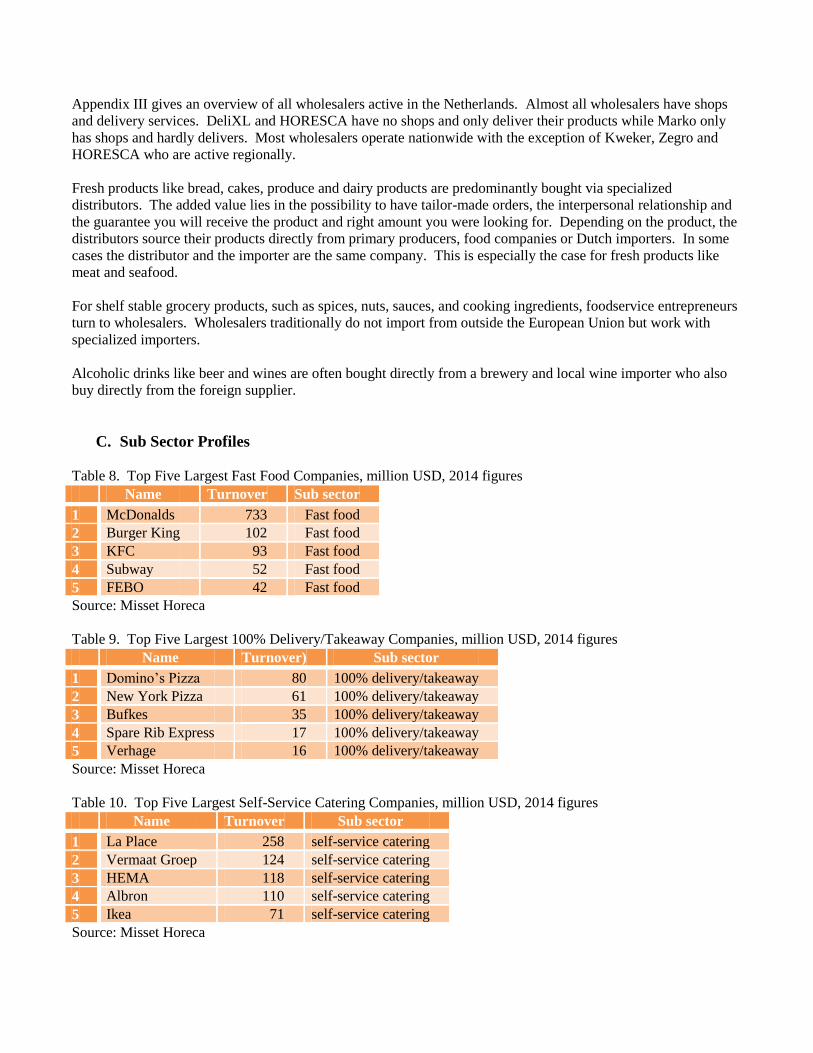
C. Sub Sector Profiles
Table 8. Top Five Largest Fast Food Companies, million USD, 2014 figures
Name Turnover Sub sector
1 McDonalds 733 Fast food
2 Burger King 102 Fast food
3 KFC 93 Fast food
4 Subway 52 Fast food
5 FEBO 42 Fast food
Source: Misset Horeca
Table 9. Top Five Largest 100% Delivery/Takeaway Companies, million USD, 2014 figures
Name Turnover) Sub sector
1 Domino’s Pizza 80 100% delivery/takeaway
2 New York Pizza 61 100% delivery/takeaway
3 Bufkes 35 100% delivery/takeaway
4 Spare Rib Express 17 100% delivery/takeaway
5 Verhage 16 100% delivery/takeaway
Source: Misset Horeca
Table 10. Top Five Largest Self-Service Catering Companies, million USD, 2014 figures
Name Turnover Sub sector
1 La Place 258 self-service catering
2 Vermaat Groep 124 self-service catering
3 HEMA 118 self-service catering
4 Albron 110 self-service catering
5 Ikea 71 self-service catering
Source: Misset Horeca
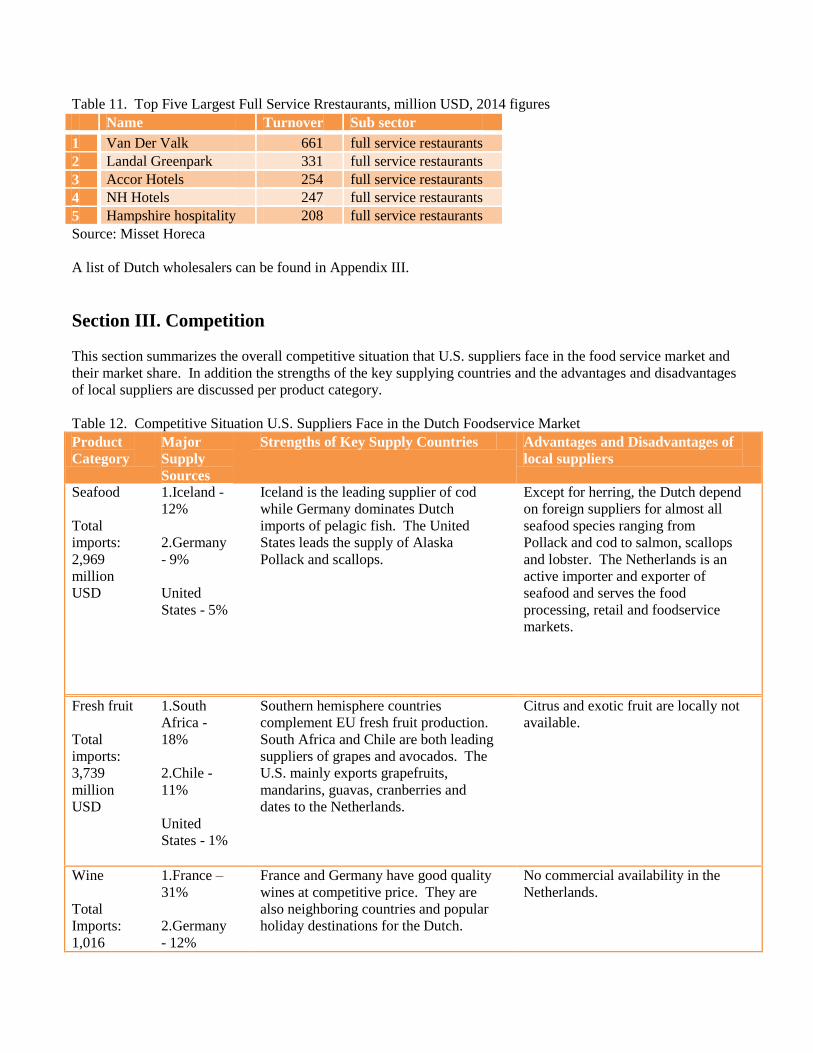
Table 11. Top Five Largest Full Service Rrestaurants, million USD, 2014 figures
Name Turnover Sub sector
1 Van Der Valk 661 full service restaurants
2 Landal Greenpark 331 full service restaurants
3 Accor Hotels 254 full service restaurants
4 NH Hotels 247 full service restaurants
5 Hampshire hospitality 208 full service restaurants
Source: Misset Horeca
A list of Dutch wholesalers can be found in Appendix III.
Section III. Competition
This section summarizes the overall competitive situation that U.S. suppliers face in the food service market and
their market share. In addition the strengths of the key supplying countries and the advantages and disadvantages
of local suppliers are discussed per product category.
Table 12. Competitive Situation U.S. Suppliers Face in the Dutch Foodservice Market
Product
Category
Major
Supply
Sources
Strengths of Key Supply Countries Advantages and Disadvantages of
local suppliers
Seafood
Total
imports:
2,969
million
USD
1.Iceland -
12%
2.Germany
- 9%
United
States - 5%
Iceland is the leading supplier of cod
while Germany dominates Dutch
imports of pelagic fish. The United
States leads the supply of Alaska
Pollack and scallops.
Except for herring, the Dutch depend
on foreign suppliers for almost all
seafood species ranging from
Pollack and cod to salmon, scallops
and lobster. The Netherlands is an
active importer and exporter of
seafood and serves the food
processing, retail and foodservice
markets.
Fresh fruit
Total
imports:
3,739
million
USD
1.South
Africa -
18%
2.Chile -
11%
United
States - 1%
Southern hemisphere countries
complement EU fresh fruit production.
South Africa and Chile are both leading
suppliers of grapes and avocados. The
U.S. mainly exports grapefruits,
mandarins, guavas, cranberries and
dates to the Netherlands.
Citrus and exotic fruit are locally not
available.
Wine
Total
Imports:
1,016
1.France –
31%
2.Germany
- 12%
France and Germany have good quality
wines at competitive price. They are
also neighboring countries and popular
holiday destinations for the Dutch.
No commercial availability in the
Netherlands.
million
USD
United
States - 1%
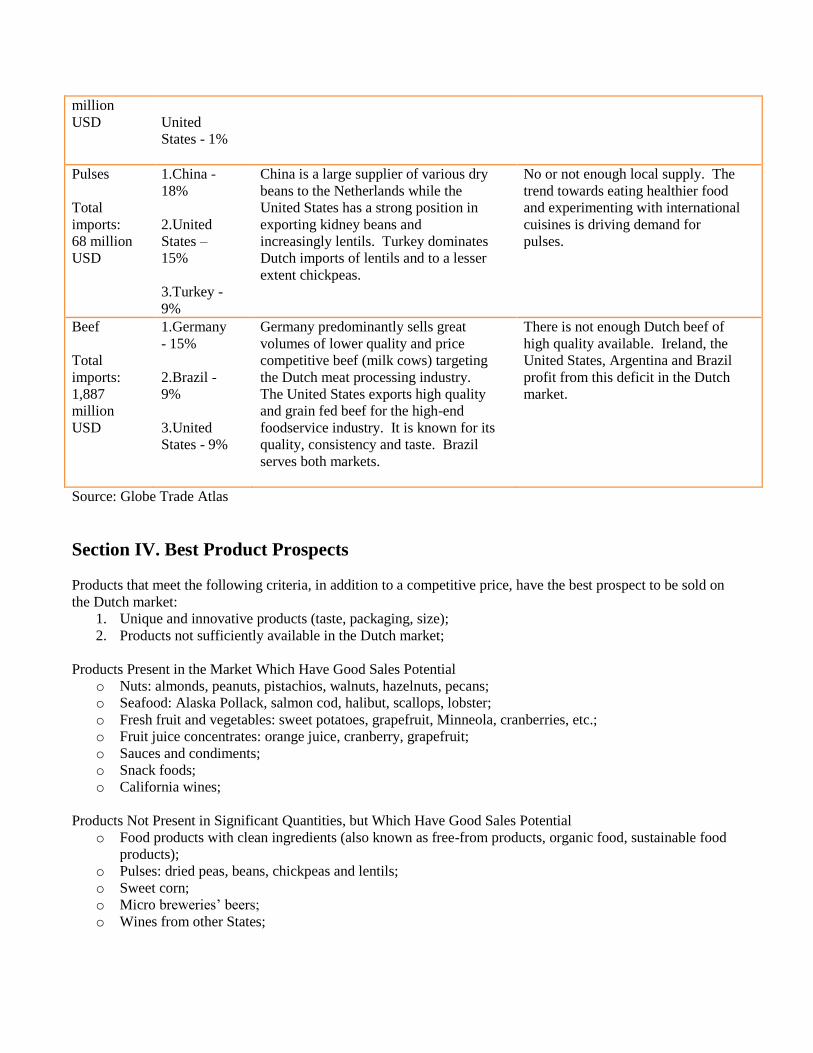
Pulses
Total
imports:
68 million
USD
1.China -
18%
2.United
States –
15%
3.Turkey -
9%
China is a large supplier of various dry
beans to the Netherlands while the
United States has a strong position in
exporting kidney beans and
increasingly lentils. Turkey dominates
Dutch imports of lentils and to a lesser
extent chickpeas.
No or not enough local supply. The
trend towards eating healthier food
and experimenting with international
cuisines is driving demand for
pulses.
Beef
Total
imports:
1,887
million
USD
1.Germany
- 15%
2.Brazil -
9%
3.United
States - 9%
Germany predominantly sells great
volumes of lower quality and price
competitive beef (milk cows) targeting
the Dutch meat processing industry.
The United States exports high quality
and grain fed beef for the high-end
foodservice industry. It is known for its
quality, consistency and taste. Brazil
serves both markets.
There is not enough Dutch beef of
high quality available. Ireland, the
United States, Argentina and Brazil
profit from this deficit in the Dutch
market.
Source: Globe Trade Atlas
Section IV. Best Product Prospects
Products that meet the following criteria, in addition to a competitive price, have the best prospect to be sold on
the Dutch market:
1. Unique and innovative products (taste, packaging, size);
2. Products not sufficiently available in the Dutch market;
Products Present in the Market Which Have Good Sales Potential
o Nuts: almonds, peanuts, pistachios, walnuts, hazelnuts, pecans;
o Seafood: Alaska Pollack, salmon cod, halibut, scallops, lobster;
o Fresh fruit and vegetables: sweet potatoes, grapefruit, Minneola, cranberries, etc.;
o Fruit juice concentrates: orange juice, cranberry, grapefruit;
o Sauces and condiments;
o Snack foods;
o California wines;
Products Not Present in Significant Quantities, but Which Have Good Sales Potential
o Food products with clean ingredients (also known as free-from products, organic food, sustainable food
products);
o Pulses: dried peas, beans, chickpeas and lentils;
o Sweet corn;
o Micro breweries’ beers;
o Wines from other States;
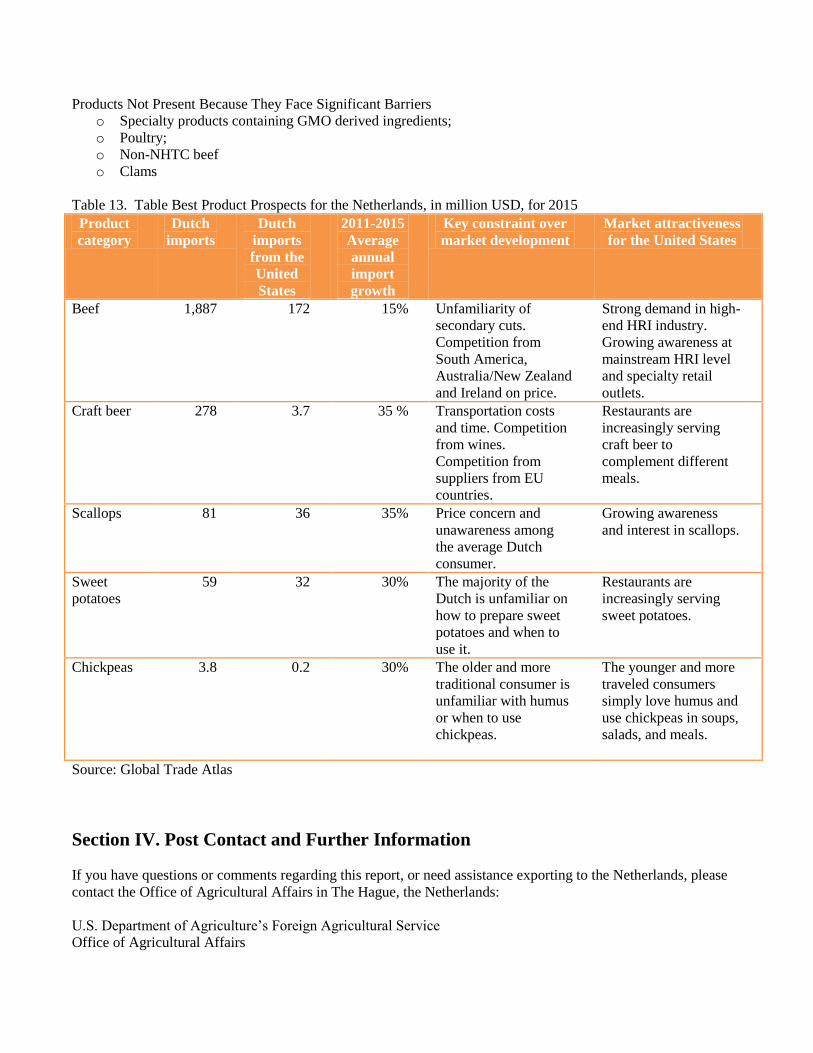
Products Not Present Because They Face Significant Barriers
o Specialty products containing GMO derived ingredients;
o Poultry;
o Non-NHTC beef
o Clams
Table 13. Table Best Product Prospects for the Netherlands, in million USD, for 2015
Product
category
Dutch
imports
Dutch
imports
from the
United
States
2011-2015
Average
annual
import
growth
Key constraint over
market development
Market attractiveness
for the United States
Beef 1,887 172 15% Unfamiliarity of
secondary cuts.
Competition from
South America,
Australia/New Zealand
and Ireland on price.
Strong demand in high-
end HRI industry.
Growing awareness at
mainstream HRI level
and specialty retail
outlets.
Craft beer 278 3.7 35 % Transportation costs
and time. Competition
from wines.
Competition from
suppliers from EU
countries.
Restaurants are
increasingly serving
craft beer to
complement different
meals.
Scallops 81 36 35% Price concern and
unawareness among
the average Dutch
consumer.
Growing awareness
and interest in scallops.
Sweet
potatoes
59 32 30% The majority of the
Dutch is unfamiliar on
how to prepare sweet
potatoes and when to
use it.
Restaurants are
increasingly serving
sweet potatoes.
Chickpeas 3.8 0.2 30% The older and more
traditional consumer is
unfamiliar with humus
or when to use
chickpeas.
The younger and more
traveled consumers
simply love humus and
use chickpeas in soups,
salads, and meals.
Source: Global Trade Atlas
Section IV. Post Contact and Further Information
If you have questions or comments regarding this report, or need assistance exporting to the Netherlands, please
contact the Office of Agricultural Affairs in The Hague, the Netherlands:
U.S. Department of Agriculture’s Foreign Agricultural Service
Office of Agricultural Affairs
Mr. Marcel H. Pinckaers
Embassy of the United States
Lange Voorhout 102, 2514 EJ The Hague, The Netherlands
Phone: +31 (0)70 3102 305
www.fas.usda.gov
FoodService Instituut Nederland (FSIN)
Ms. Inga Blokker
Galvanistraat 1
6716 AE Ede
+31 (0)88 730 48 00
www.fsin.nl
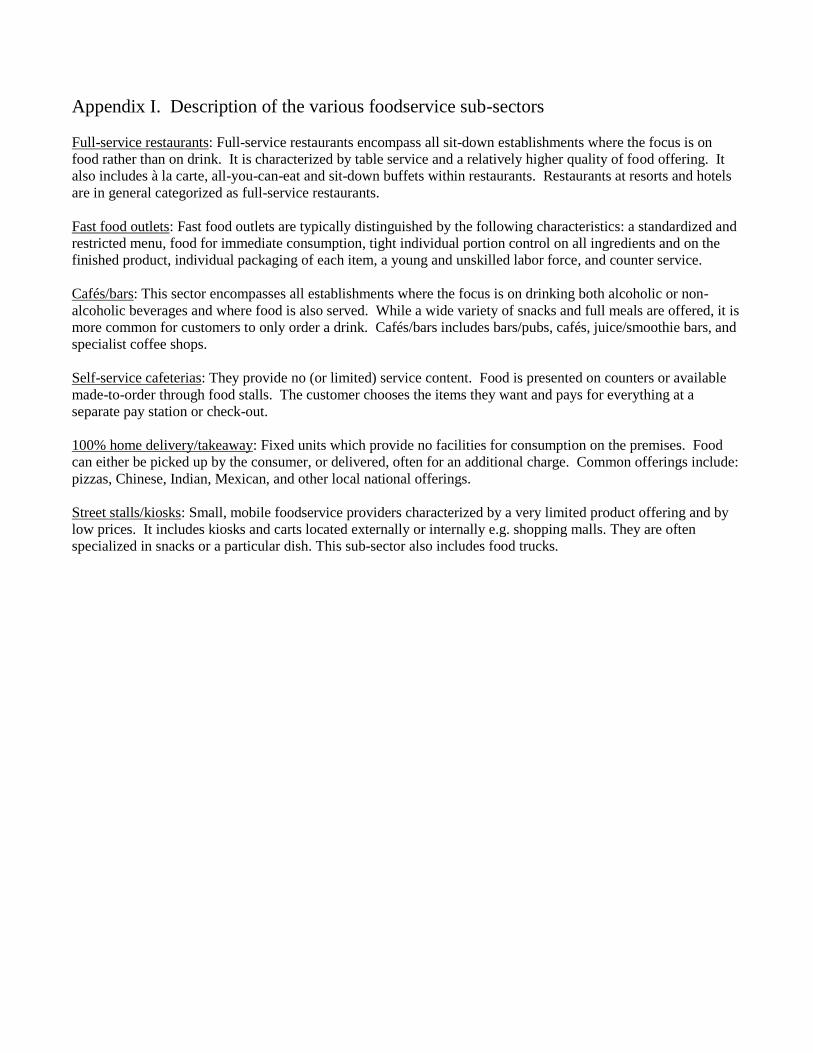
Appendix I. Description of the various foodservice sub-sectors
Full-service restaurants: Full-service restaurants encompass all sit-down establishments where the focus is on
food rather than on drink. It is characterized by table service and a relatively higher quality of food offering. It
also includes à la carte, all-you-can-eat and sit-down buffets within restaurants. Restaurants at resorts and hotels
are in general categorized as full-service restaurants.
Fast food outlets: Fast food outlets are typically distinguished by the following characteristics: a standardized and
restricted menu, food for immediate consumption, tight individual portion control on all ingredients and on the
finished product, individual packaging of each item, a young and unskilled labor force, and counter service.
Cafés/bars: This sector encompasses all establishments where the focus is on drinking both alcoholic or non-
alcoholic beverages and where food is also served. While a wide variety of snacks and full meals are offered, it is
more common for customers to only order a drink. Cafés/bars includes bars/pubs, cafés, juice/smoothie bars, and
specialist coffee shops.
Self-service cafeterias: They provide no (or limited) service content. Food is presented on counters or available
made-to-order through food stalls. The customer chooses the items they want and pays for everything at a
separate pay station or check-out.
100% home delivery/takeaway: Fixed units which provide no facilities for consumption on the premises. Food
can either be picked up by the consumer, or delivered, often for an additional charge. Common offerings include:
pizzas, Chinese, Indian, Mexican, and other local national offerings.
Street stalls/kiosks: Small, mobile foodservice providers characterized by a very limited product offering and by
low prices. It includes kiosks and carts located externally or internally e.g. shopping malls. They are often
specialized in snacks or a particular dish. This sub-sector also includes food trucks.
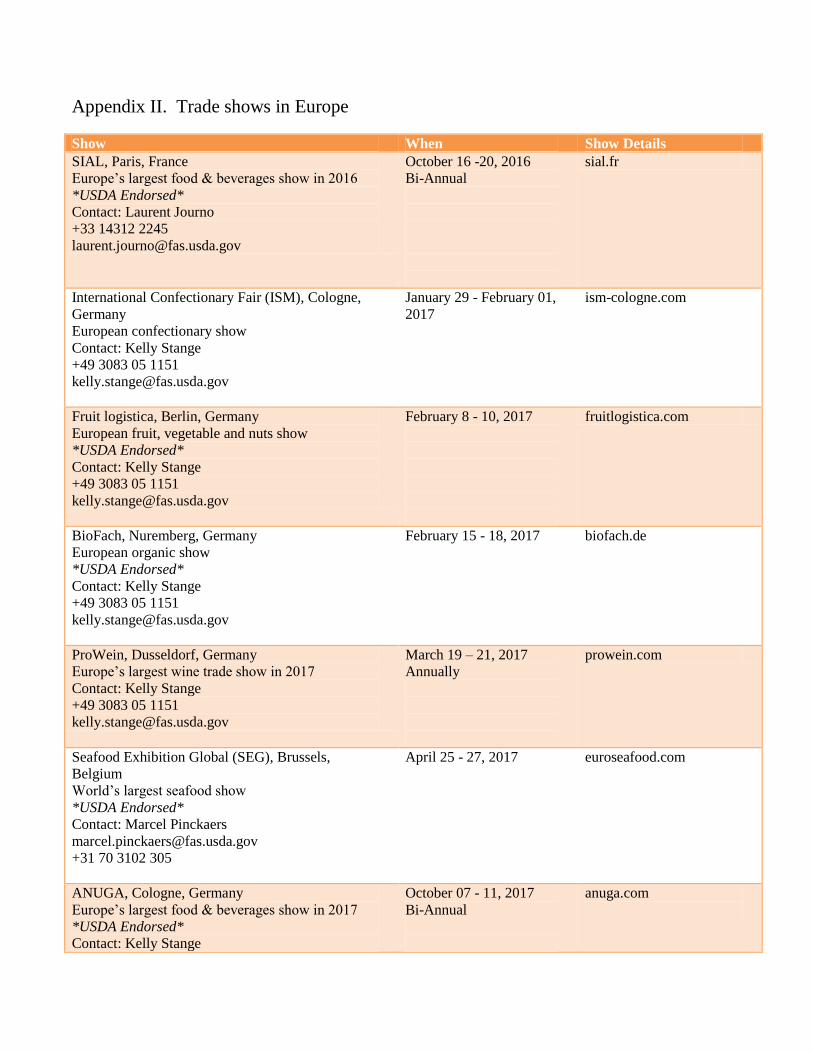
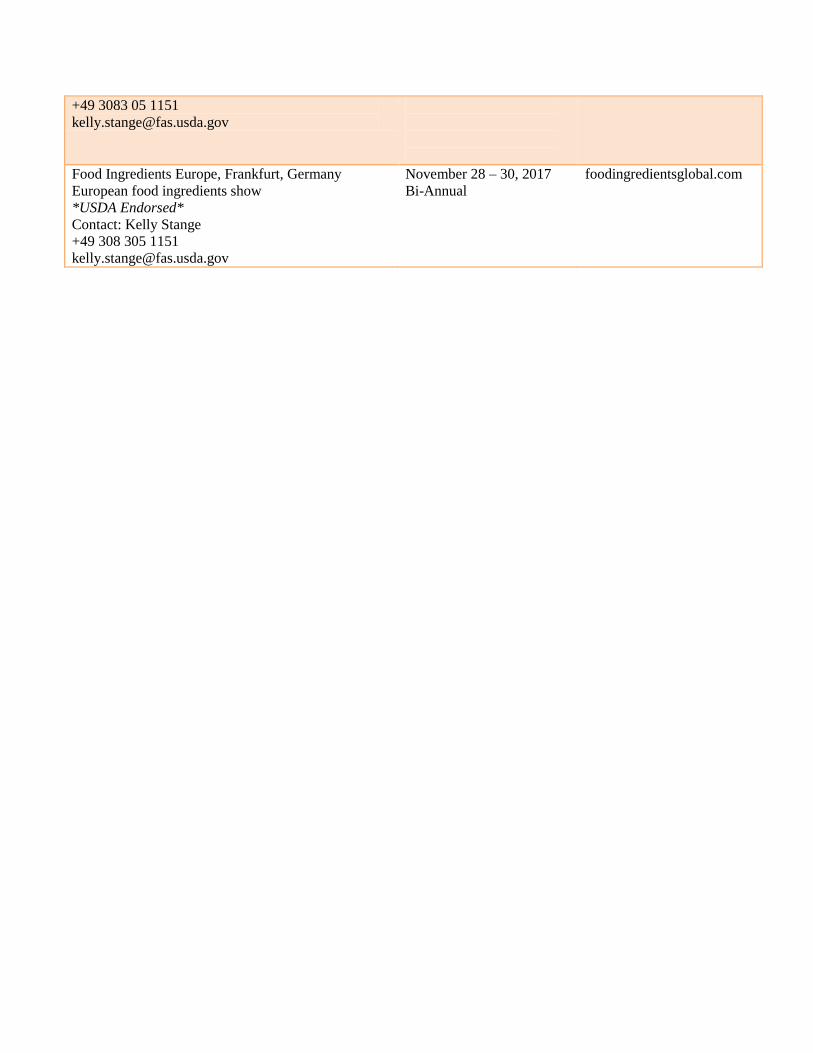
Appendix II. Trade shows in Europe
Show When Show Details
SIAL, Paris, France
Europe’s largest food & beverages show in 2016
*USDA Endorsed*
Contact: Laurent Journo
+33 14312 2245
October 16 -20, 2016
Bi-Annual
sial.fr
International Confectionary Fair (ISM), Cologne,
Germany
European confectionary show
Contact: Kelly Stange
+49 3083 05 1151
January 29 - February 01,
2017
ism-cologne.com
Fruit logistica, Berlin, Germany
European fruit, vegetable and nuts show
*USDA Endorsed*
Contact: Kelly Stange
+49 3083 05 1151
February 8 - 10, 2017
fruitlogistica.com
BioFach, Nuremberg, Germany
European organic show
*USDA Endorsed*
Contact: Kelly Stange
+49 3083 05 1151
February 15 - 18, 2017
biofach.de
ProWein, Dusseldorf, Germany
Europe’s largest wine trade show in 2017
Contact: Kelly Stange
+49 3083 05 1151
March 19 – 21, 2017
Annually
prowein.com
Seafood Exhibition Global (SEG), Brussels,
Belgium
World’s largest seafood show
*USDA Endorsed*
Contact: Marcel Pinckaers
+31 70 3102 305
April 25 - 27, 2017
euroseafood.com
ANUGA, Cologne, Germany
Europe’s largest food & beverages show in 2017
*USDA Endorsed*
Contact: Kelly Stange
October 07 - 11, 2017
Bi-Annual
anuga.com
+49 3083 05 1151
Food Ingredients Europe, Frankfurt, Germany
European food ingredients show
*USDA Endorsed*
Contact: Kelly Stange
+49 308 305 1151
November 28 – 30, 2017
Bi-Annual
foodingredientsglobal.com
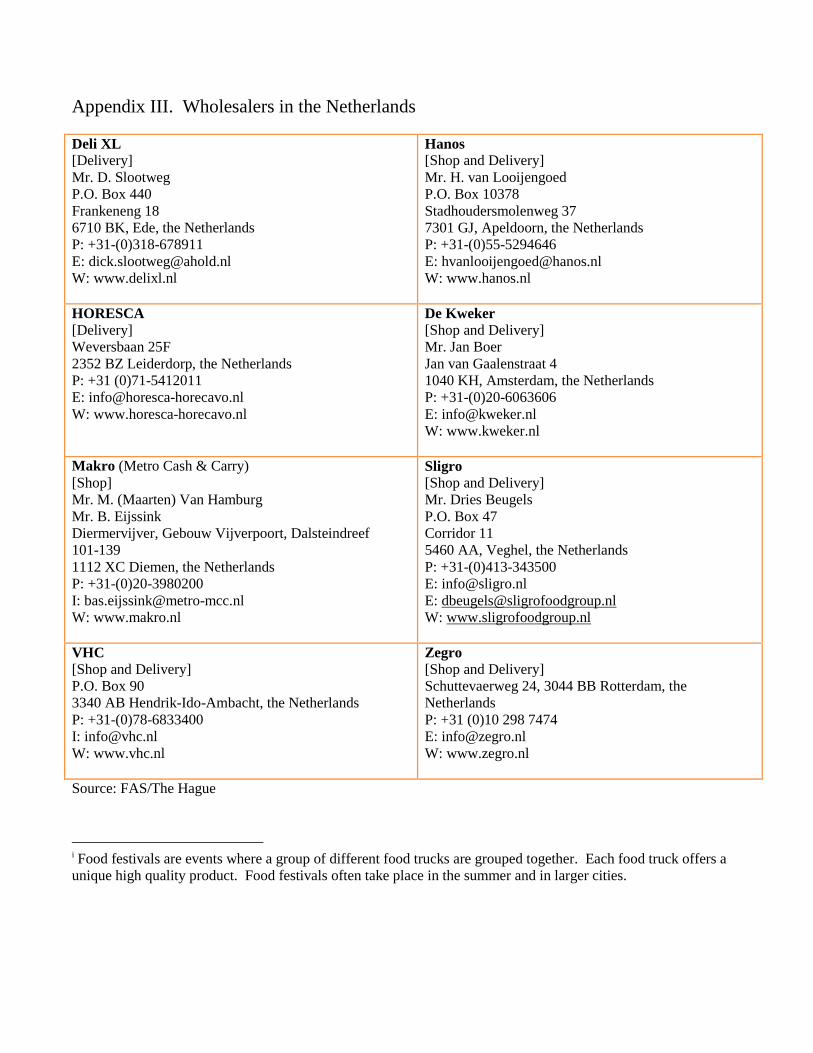
Appendix III. Wholesalers in the Netherlands
Deli XL
[Delivery]
Mr. D. Slootweg
P.O. Box 440
Frankeneng 18
6710 BK, Ede, the Netherlands
P: +31-(0)318-678911
W: www.delixl.nl
Hanos
[Shop and Delivery]
Mr. H. van Looijengoed
P.O. Box 10378
Stadhoudersmolenweg 37
7301 GJ, Apeldoorn, the Netherlands
P: +31-(0)55-5294646
W: www.hanos.nl
HORESCA
[Delivery]
Weversbaan 25F
2352 BZ Leiderdorp, the Netherlands
P: +31 (0)71-5412011
W: www.horesca-horecavo.nl
De Kweker
[Shop and Delivery]
Mr. Jan Boer
Jan van Gaalenstraat 4
1040 KH, Amsterdam, the Netherlands
P: +31-(0)20-6063606
W: www.kweker.nl
Makro (Metro Cash & Carry)
[Shop]
Mr. M. (Maarten) Van Hamburg
Mr. B. Eijssink
Diermervijver, Gebouw Vijverpoort, Dalsteindreef
101-139
1112 XC Diemen, the Netherlands
P: +31-(0)20-3980200
W: www.makro.nl
Sligro
[Shop and Delivery]
Mr. Dries Beugels
P.O. Box 47
Corridor 11
5460 AA, Veghel, the Netherlands
P: +31-(0)413-343500
W: www.sligrofoodgroup.nl
VHC
[Shop and Delivery]
P.O. Box 90
3340 AB Hendrik-Ido-Ambacht, the Netherlands
P: +31-(0)78-6833400
W: www.vhc.nl
Zegro
[Shop and Delivery]
Schuttevaerweg 24, 3044 BB Rotterdam, the
Netherlands
P: +31 (0)10 298 7474
W: www.zegro.nl
Source: FAS/The Hague
i Food festivals are events where a group of different food trucks are grouped together. Each food truck offers a
unique high quality product. Food festivals often take place in the summer and in larger cities.