Embed Size (px)
Citation preview

NTP ReseaRch RePoRT oN
IN VIVo RePeaT Dose BIologIcal PoTeNcy sTuDy of TRIPheNyl PhosPhaTe (cas No. 115-86-6) IN Male sPRague Dawley RaTs (hsD: sPRague Dawley sD) (gaVage sTuDIes)NTP RR 8
DECEMBER 2018

NTP Research Report on In Vivo Repeat Dose Biological Potency Study of Triphenyl Phosphate (CAS No. 115-86-6) in Male Sprague Dawley Rats (Hsd: Sprague Dawley SD)
(Gavage Studies) Research Report 8
National Toxicology Program
December 2018
National Toxicology Program
Public Health Service
U.S. Department of Health and Human Services
ISSN: 2473-4756

In Vivo Repeat Dose Biological Potency Study of Triphenyl Phosphate in Male Sprague Dawley Rats
ii
Table of Contents
About This Report.......................................................................................................................... iv
Peer Review ................................................................................................................................... vi
Publication Details ........................................................................................................................ vii
Acknowledgments......................................................................................................................... vii
Abstract ........................................................................................................................................ viii
Background ......................................................................................................................................1
Materials and Methods .....................................................................................................................2
Study Design ...............................................................................................................................2
Dose Selection Rationale ............................................................................................................2
Chemistry ....................................................................................................................................2 Procurement, Characterization, and Formulation ................................................................2
Clinical Examinations and Sample Collection ............................................................................3 Clinical Observations ...........................................................................................................3
Clinical Pathology ................................................................................................................3 Transcriptomics ...........................................................................................................................3
Sample Collection for Transcriptomics ...............................................................................3
RNA Isolation and cDNA Synthesis....................................................................................3 Analysis of GeneChip Data Quality ....................................................................................4
Data Analysis ..............................................................................................................................4 Statistical Analysis of Body Weights, Organ Weights, Clinical Chemistry ........................4 Benchmark Dose (BMD) Analysis of Organ Weights and Clinical Pathology ...................5
BMD Analysis of Transcriptomics Data..............................................................................6
Data Accessibility ................................................................................................................7
Results ..............................................................................................................................................8 Animal Condition, Body and Organ Weights .............................................................................8
Clinical Chemistry ......................................................................................................................8
Hormones and Enzymes ............................................................................................................10 Apical Endpoint and Clinical Chemistry Benchmark Dose Summary Table ...........................10 Gene Set BMD Analysis ...........................................................................................................11 Differentially Expressed Gene Analysis ...................................................................................13
Discussion ......................................................................................................................................15
References ......................................................................................................................................17
Appendix A Animal Identifiers and Endpoint Analyses .................................................... A-1
Appendix B Analytical Chemistry ......................................................................................B-1
Appendix C Toxicology Data Tables ..................................................................................C-1
Appendix D Transcriptomic Quality Control and Additional Data Analysis ..................... D-1
Appendix E Apical Endpoint Quality Control and Additional Data Analysis .................... E-1

In Vivo Repeat Dose Biological Potency Study of Triphenyl Phosphate in Male Sprague Dawley Rats
iii
Tables
Table 1. Mean Body Weight Summary ...........................................................................................8 Table 2. Organ Weights Summary...................................................................................................9
Table 3. Clinical Chemistry Summary.............................................................................................9 Table 4. Hormone and Enzymes Summary ...................................................................................10 Table 5. BMD, NOEL, and LOEL Summary for Apical Endpoints, Sorted by LOEL or
BMDL from Low to High ...........................................................................................11 Table 6. Top 20 GO Biological Process Gene Sets Ranked by Potency of Perturbation
(Sorted by BMD Median) ...........................................................................................12 Table 7. Top Differentially Expressed Probe Sets Ranked by Fold Change .................................14

In Vivo Repeat Dose Biological Potency Study of Triphenyl Phosphate in Male Sprague Dawley Rats
iv
About This Report
National Toxicology Program1 1Division of the National Toxicology Program, National Institute of Environmental Health
Sciences, Research Triangle Park, North Carolina, USA
Collaborators
Scott S. Auerbach, Mamta V. Behl, Bradley J. Collins, Michelle C. Cora, Jennifer M. Fostel,
Alison H. Harrill, Andrew J. Shapiro, Suramya Waidyanatha
Division of the National Toxicology Program, National Institute of Environmental Health
Sciences, Research Triangle Park, North Carolina, USA
Evaluated and interpreted the results and reported findings in the technical report; developed
reporting framework
Scott S. Auerbach, Ph.D.
Mamta V. Behl, Ph.D.
Michelle C. Cora, D.V.M.
Alison H. Harrill, Ph.D.
Andrew J. Shapiro, M.S.P.H.
Coordination of data integration
Jennifer M. Fostel, Ph.D.
Analysis and interpretation of analytical chemistry data
Bradley J. Collins, M.S.P.H
Suramya Waidyanatha, Ph.D.
Contributors
Division of the National Toxicology Program, National Institute of Environmental Health
Sciences, Research Triangle Park, North Carolina, USA
Critical review of the manuscript and results
Chad R. Blystone, Ph.D.
B. Alex Merrick, Ph.D.
Coordination of data assembly
Georgia K. Roberts, Ph.D.
Directed in life studies
Daniel L. Morgan, Ph.D. (formerly at Alion)
Contribution to development and review of reporting framework
John R. Bucher, Ph.D.
Michael J. DeVito, Ph.D.
William M. Gwinn, Ph.D.
Scott A. Masten, Ph.D.

In Vivo Repeat Dose Biological Potency Study of Triphenyl Phosphate in Male Sprague Dawley Rats
v
Matthew D. Stout, Ph.D.
Greg Travlos, D.V.M.
Mary S. Wolfe, Ph.D.
ASRC Federal Vistronix, Morrisville, North Carolina, USA
Development of data tables and supplemental materials
Julie Berke, B.S.
Isabel Lea, Ph.D.
Dario Motti, Ph.D.
Nicole Sayers, B.S.
German Segura, B.S.
Ying Wen, M.S.
ICF, Durham, North Carolina, USA
Technical editing and document production
Natalie Blanton, M.P.H.
Katherine Helmick, M.P.H.
Penelope Kellar, M.S.
Whitney Mitchell, B.S.
MRIGlobal, Kansas City, Missouri, USA
Provided chemical formulations
Kristin Aillon, Ph.D.
Joseph Algaier, Ph.D.
In Vivo Repeat Dose Biological Potency Study of Triphenyl Phosphate in Male Sprague Dawley Rats
vi
Peer Review
The draft NTP Research Report on In Vivo Repeat Dose Biological Potency Study of Triphenyl
Phosphate (CAS No. 115-86-6) in Male Sprague Dawley Rats (Hsd: Sprague Dawley SD)
(Gavage Studies) was evaluated by the reviewers listed below. These reviewers served as
independent scientists, not as representatives of any institution, company, or governmental
agency. In this capacity, reviewers determined if the design and conditions of these NTP studies
were appropriate and ensured that this NTP Research Report presented the experimental results
and conclusions fully and clearly.
Peer Reviewers
Rebecca Clewell, Ph.D.
Associate Director
ToxStrategies
Cary, North Carolina
Jeffrey Gift, Ph.D.
Senior Health Scientist, National Center for Environmental Assessment
Office of Research and Development
U.S. Environmental Protection Agency
Research Triangle Park, North Carolina
Jorge Naciff, Ph.D.
Principal Scientist
Global Product Stewardship, Central Product Safety Division
The Procter & Gamble Company
Mason, Ohio
Craig Rowlands, Ph.D., DABT
Senior Toxicologist, Business Development and Innovation
Supply Chain & Sustainability
Underwriters Laboratories, LLC
Northbrook, Illinois

In Vivo Repeat Dose Biological Potency Study of Triphenyl Phosphate in Male Sprague Dawley Rats
vii
Publication Details
Publisher: National Toxicology Program
Publishing Location: Research Triangle Park, NC
ISSN: 2473-4756
DOI: https://doi.org/10.22427/NTP-RR-8
Report Series: NTP Research Report Series
Report Series Number: 8
Official citation: National Toxicology Program. 2018. NTP Research Report on In Vivo Repeat
Dose Biological Potency Study of Triphenyl Phosphate (CAS No. 115-86-6) in Male Sprague
Dawley Rats (Hsd: Sprague Dawley SD) (Gavage Studies). NTP RR 8. Research Triangle Park,
NC: National Toxicology Program (8): 1-36.
Acknowledgments
The authors thank the technical staff at Alion for assistance with the in-life studies.

In Vivo Repeat Dose Biological Potency Study of Triphenyl Phosphate in Male Sprague Dawley Rats
viii
Abstract
Background: Triphenyl phosphate (TPHP) is an organophosphate flame retardant currently on
the market and used as a replacement for phased-out polybrominated diphenyl ethers. Toxicity
information on this class of chemicals is inadequate. Herein, we use short-term, in vivo
transcriptomic studies to inform potential points of departure for TPHP.
Methods: The National Toxicology Program (NTP) conducted a transcriptomic study on TPHP,
in male Harlan Sprague Dawley rats. TPHP was dissolved in corn oil. Exposure was once daily
for 4 days by oral gavage. TPHP (>99%) was tested at six doses (0, 55, 110, 220, 441, and
881 mg/kg body weight). On Day 5, animals were sacrificed, standard toxicological measures
assessed, and the liver taken for gene expression studies using Affymetrix microarrays. Modeling
was conducted to identify the benchmark doses (BMDs) associated with the most sensitive apical
toxicological endpoints and with transcriptional changes in the liver at a benchmark response of
one standard deviation from the mean.
Results: The most sensitive apical endpoints for which BMD values could be obtained were
serum HDL (high-density lipoprotein) cholesterol levels, absolute liver weights, relative liver
weights, and serum cholesterol levels. The benchmark dose lower confidence limit BMDLs (and
BMDs) were 39 (79), 48 (136), 71 (103), and 90 (142) mg/kg, respectively. Although serum
cholinesterase appeared to be a sensitive endpoint (35–70% decrease) at all doses, beginning
with 55 mg/kg (the lowest-observed-effect level), its BMD could not be determined due to poor
model fit.
Sensitive transcriptional gene set changes by potency included 14 Gene Ontology Biological
Processes with BMD median values below the lower limit of extrapolation (<18.3 mg/kg). The
most sensitive gene sets for which a reliable estimate of the BMD could be made were cellular
polysaccharide biosynthetic process and oligodendrocyte development with median BMD of
19 mg/kg and BMDL medians of 11 mg/kg for both gene sets. The most potently affected single
genes ranking in the top 10 for increased fold expression change respective to control were
Ces2c and Cyp2b1 with BMDs <18.3 mg/kg (the lower limit of extrapolation, 3× lower than the
lowest tested dose) and maximal fold increases of 16.3 and 10.5, respectively. The most potently
affected single genes ranking in the top 10 for decreased fold expression change respective to
control were Scd and G6pc with BMD of <18.3 mg/kg and BMDL of 16 mg/kg, respectively, and
maximal fold decreases of −11.1 and −5.1, respectively.
Conclusion: Taken together, the most sensitive BMD gene set medians that could be reported
occurred at 19 mg/kg (BMDL 11 mg/kg) and the most sensitive apical endpoint was increased
serum HDL cholesterol, with a BMDL of 39 mg/kg. Cholinesterase inhibition was observed, with
effects occurring at all doses including the lowest tested dose of 55 mg/kg. Future studies
investigating lower doses would be helpful to obtain more accurate estimates of BMD values for
the most sensitively affected genes and for cholinesterase inhibition.

In Vivo Repeat Dose Biological Potency Study of Triphenyl Phosphate in Male Sprague Dawley Rats
1
Background
Polybrominated diphenyl ether (PBDE) flame retardant chemicals were voluntarily phased out in
2005 due to concerns about their environmental persistence, bioaccumulation, and association
with several adverse human health effects including altered circulating hormone levels,
decreased fertility, and impaired neurodevelopment1-3. They have been replaced by
organophosphate flame retardants (OPFRs) that are increasingly used in commerce. Like
PBDEs, OPFRs can leach from treated materials and persist in the environment. They have been
detected in indoor air, household dust, wastewater treatment plant effluent, drinking water, and
wildlife samples4-7. They also have been detected in human tissues at levels similar to those of
PBDEs8. Information is lacking on the incidence and potency of health effects associated with
exposure to this chemical class. Furthermore, OPFRs are manufactured as isomeric and
commercial mixtures with other non-OPFR flame retardants.
Reported here are the results of a repeat dose study performed in male rats. The goal of this study
is to provide a rapid assessment of in vivo biological potency by evaluating a combination of
traditional toxicological endpoints and transcriptomics analysis to broadly query biological space
for any dose-related change. The justification for using this type of assessment relates to the
observation that gene set benchmark dose (BMD) values from short-term transcriptomic studies
have been shown to approximate dose responsiveness of the most sensitive apical endpoints from
resource intensive guideline toxicological assessments (e.g., carcinogenicity)9; 10. Importantly,
the study reported here is not intended to assess or identify hazards. In particular, any
observations related to traditional toxicological hazards that are gleaned from qualitative
interpretation of the transcriptomics data should be considered hypotheses requiring further
evaluation.
This report presents the study results for triphenyl phosphate (TPHP), one of the OPFRs
nominated to NTP. Reports on additional OPFRs, once completed, will be published on the NTP
website.
In Vivo Repeat Dose Biological Potency Study of Triphenyl Phosphate in Male Sprague Dawley Rats
2
Materials and Methods
Study Design
Male Hsd: Sprague Dawley SD rats were obtained from Harlan Laboratories (now Envigo, Inc)
(Indianapolis, IN). Males were selected because of the historical precedent of using males in
transcriptomic studies to avoid challenges with hormonal cyclicity in female rats that can affect
interpretation of gene expression data. On receipt, the rats were 7–8 weeks of age. Animals were
quarantined for 7 days, and then randomly assigned to one of five dose groups, each containing
five rats. The rats in each dose group then were administered TPHP by gavage in corn oil at a
dose level of 0, 55, 110, 220, 441, or 881 mg/kg body weight. These doses correspond to molar
equivalencies of 0, 0.169, 0.338, 0.675, 1.35, and 2.7 mmol/kg. Corn oil was selected as the
vehicle based on physical chemical properties that indicated the test article would exhibit
maximal solubility in corn oil relative to other commonly used vehicles. Dosing of the test article
occurred on 4 consecutive days. Dosage volume was 5 mL/kg body weight and was based on the
most recently measured body weight. Euthanasia, blood/serum collection, and tissue sample
collection were completed on the day following the final administration of the test article
(Day 5). Animal identification numbers and a summary of collected endpoints for each animal
are presented in Appendix A.
Dose Selection Rationale
Doses were selected based on comparison to NTP subchronic studies of tricresyl phosphate, a
chemical structurally similar to TPHP. At dose levels of approximately 1000 mg/kg/day, tricresyl
phosphate produced significant histopathological manifestations in the liver of rats after 90 days,
which indicated the animals were adequately challenged. An equimolar dose of TPHP was
estimated to be approximately 881 mg/kg/day; thus, this dose was selected as the highest dose in
the present study.
Chemistry
Procurement, Characterization, and Formulation
Triphenyl phosphate (TPHP; CAS No. 115-86-6; C18H15O4P; molar mass 326.29 g/mol) was
obtained from Acros Organics (Geel, Belgium) in three lots (A0293313, A0299574, A0321681).
Lots were combined to form a single lot (A8609-1NP), characterized, and formulated by MRI
Global (Kansas City, MO).
The identity of the combined lot was confirmed using Fourier transform infrared spectroscopy
and 1H and 13C nuclear magnetic resonance spectroscopy. Purity was determined by gas
chromatography (GC) with flame ionization detection (FID) as >99%. Dose formulations were
prepared in corn oil at target concentrations of 0 (vehicle), 0.0338, 0.0676, 0.135, 0.270, and
0.540 mmol/mL, analyzed by GC-FID, and shipped to Alion (Alion, Research Triangle Park,
NC). All formulations were within ±10% of target concentrations. The stability of the corn oil
formulations was assessed using the 0.0338-mmol/mL concentration for up to 21 days when
stored at ambient temperature in sealed glass bottles under inert gas; the actual concentration was

In Vivo Repeat Dose Biological Potency Study of Triphenyl Phosphate in Male Sprague Dawley Rats
3
within 10% of the nominal target concentration on Day 0, demonstrating the stability during the
period of use. A summary of the analytical results is presented in Appendix B.
Clinical Examinations and Sample Collection
Clinical Observations
Standard clinical observations were performed within 4 hours post dosing on all study days.
Animals were observed for signs of cholinesterase inhibition with specific signs recorded, such
as weakness, lethargy, tremors, eye-bulging, salivation, lacrimation, and diarrhea. Animals were
weighed on the first day of exposure and on the day of necropsy.
Clinical Pathology
Animals were terminated in random order by CO2/O2 (70/30) anesthesia one day after the final
day of exposure. Blood samples were taken via cardiocentesis. Five mL of blood was collected
into a tube void of anticoagulant and the serum harvested for clinical chemistry, free thyroxine
(T4), and cholinesterase measurements. The following clinical chemistry parameters were
measured on an Olympus AU400e chemistry analyzer (Olympus America, Inc., Irvin, TX) using
reagents obtained from Beckman Coulter (Brea, CA) or Diazyme (Poway, CA): urea nitrogen,
creatinine, total protein, albumin, sorbitol dehydrogenase, alanine aminotransferase, aspartate
aminotransferase, bile acids, cholesterol, triglycerides, low-density lipoprotein (LDL)
cholesterol, HDL cholesterol, and cholinesterase. Free T4 was measured using an MP
Biomedical T4 radioimmunoassay kit with an Apex automatic gamma counter (ICN Micromedic
Systems, Inc., Huntsville, AL). Toxicological study data tables are presented in Appendix C.
Transcriptomics
Sample Collection for Transcriptomics
Liver transcriptomics were performed on samples taken from three animals per dose group
(randomly selected). During necropsy, the entire liver was removed, and liver weight was
recorded for each animal. Half the left liver lobe was processed for RNA (ribonucleic acid)
isolation. Specifically, three pieces (3-mm cubes) were dissected and transferred to a weigh boat
containing liquid nitrogen. Once flash frozen, the liver tissue for each animal was placed into a
single, prechilled 2-mL cryotube and stored at or below −70°C. Frozen liver samples were
shipped to the Battelle Biomedical Research Center (West Jefferson, OH) on dry ice.
RNA Isolation and cDNA Synthesis
The frozen liver tissues were submerged in 10 volumes of prechilled RNAlater®-ICE (Life
Technologies, Carlsbad, CA) and stored at −20°C ± 10°C for a minimum of 16 hours. The
tissues were removed from the RNAlater®-ICE and weighed. Each liver tissue sample, weighing
between 21 and 30 mg, was added to lysis buffer and homogenized using plastic disposable
pestles (Fisher Scientific, Pittsburgh, PA). Following homogenization, samples were stored at
−70°C ± 10°C until RNA was isolated. Samples were thawed and centrifuged. RNA was
extracted from the supernatant, subjected to DNase digestion, and isolated using the Qiagen
RNeasy Mini Kit (Cat #: 74104; Qiagen, Valencia, CA). Each RNA sample was analyzed for
quantity and purity by UV analysis using a NanoDrop ND-1000 Spectrophotometer (NanoDrop

In Vivo Repeat Dose Biological Potency Study of Triphenyl Phosphate in Male Sprague Dawley Rats
4
Technologies, Wilmington, DE). All samples were evaluated for RNA integrity using an RNA
6000 Nano Kit with an Agilent 2100 Bioanalyzer (Agilent, Santa Clara, CA) and then stored at
−70°C ± 10°C until further processing.
Total RNA (100 ng), isolated from each liver sample, was used to synthesize single-stranded
DNA, which was subsequently converted into a double-stranded complementary DNA (cDNA)
template for transcription. An in vitro transcription (IVT) reaction, which incorporates
biotinylated ribonucleotide analogs, then was used to create labeled amplified RNA (aRNA).
This RNA target preparation was performed using the Affymetrix GeneChip® 3’ IVT Express Kit
(Cat #: 901228; Affymetrix Inc., Santa Clara, CA) and an Eppendorf Mastercycler® thermal
cycler (Eppendorf, Hamburg, Germany).
Labeled aRNA was fragmented and subsequently hybridized to the Affymetrix Rat Genome 230
2.0 Array (Cat #: 900505; 31,099 probe sets) using an Affymetrix GeneChip® Hybridization
Oven 645. The arrays were washed and stained using the Affymetrix GeneChip® Hybridization
Wash and Stain kit (Cat #: 900720) and a Fluidics Station 450 according to the Affymetrix-
recommended protocol (FS450_0001). After washing and staining, arrays were scanned using an
Affymetrix GeneChip® Scanner 3000 7G, and the raw microarray data (.CEL files) were
acquired using Affymetrix GeneChip® Command Console® Software. The Rat Genome 230 2.0
Array provides coverage of more than 30,000 known transcripts; although the array provides
comprehensive coverage of global transcript expression, it should be noted that it does not cover
the entirety of the rat transcriptome.
Analysis of GeneChip Data Quality
Quality control (QC) measurements were evaluated to determine if the data generated from each
Affymetrix GeneChip® array were of sufficient quality. Affymetrix-recommended guidelines for
evaluating quality were used to evaluate the output files for each GeneChip® array using the
R/Bioconductor package, Simpleaffy11. The following QC parameters were evaluated for each
array: average background, scale factor, percentage of genes scored as present, 3’ to 5’ ratios for
the internal control genes beta-actin and glyceraldehyde-3-phosphate dehydrogenase, values for
hybridization control transcripts, and values for poly (A) controls.
For samples that failed to pass QC evaluation due to insufficient data quality, an additional round
of RNA isolation and cDNA synthesis was performed and additional GeneChip® arrays were run,
which were designated with –R after each sample number.
Data Analysis
Statistical Analysis of Body Weights, Organ Weights, Clinical Chemistry
Two approaches were employed to assess the significance of pairwise comparisons between
dosed and control groups in the analysis of continuous variables. Organ and body weight data,
which have approximately normal distributions, were analyzed using the parametric multiple
comparison procedures of Williams12; 13 and Dunnett14. Hormone data and clinical chemistry,
which typically have skewed distributions, were analyzed using the nonparametric multiple
comparison methods of Shirley15 and Dunn16. Jonckheere’s test17 was used to assess the
significance of dose-response trends and determine whether a trend-sensitive test (the Williams’
or Shirley’s test) was more appropriate for pairwise comparisons than a test that assumes no
In Vivo Repeat Dose Biological Potency Study of Triphenyl Phosphate in Male Sprague Dawley Rats
5
monotonic dose response (Dunnett’s or Dunn’s test). Trend-sensitive tests were used when
Jonckheere’s test was significant at p < 0.01.
Prior to analysis, values identified by the outlier test of Dixon and Massey18 were examined by
NTP staff. Values from animals suspected of illness due to causes other than experimental
treatment and values the laboratory indicated as inadequate due to measurement problems were
eliminated from the analysis.
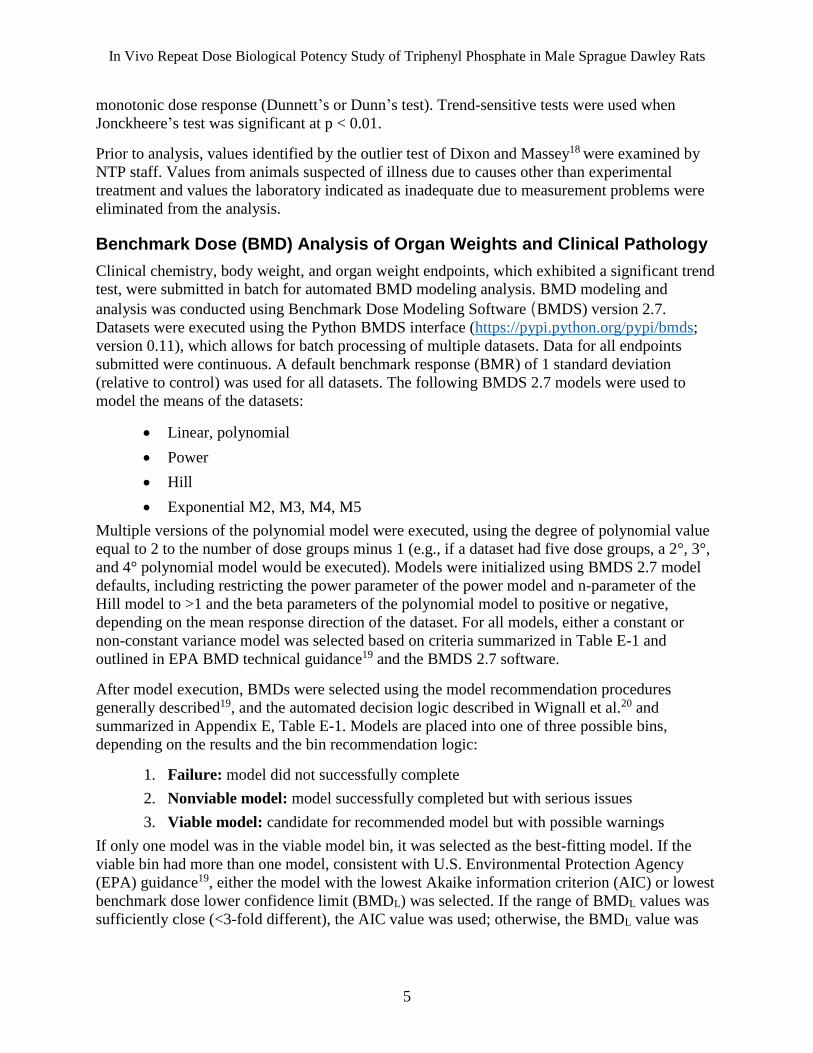
Benchmark Dose (BMD) Analysis of Organ Weights and Clinical Pathology
Clinical chemistry, body weight, and organ weight endpoints, which exhibited a significant trend
test, were submitted in batch for automated BMD modeling analysis. BMD modeling and
analysis was conducted using Benchmark Dose Modeling Software (BMDS) version 2.7.
Datasets were executed using the Python BMDS interface (https://pypi.python.org/pypi/bmds;
version 0.11), which allows for batch processing of multiple datasets. Data for all endpoints
submitted were continuous. A default benchmark response (BMR) of 1 standard deviation
(relative to control) was used for all datasets. The following BMDS 2.7 models were used to
model the means of the datasets:
Linear, polynomial
Power
Hill
Exponential M2, M3, M4, M5
Multiple versions of the polynomial model were executed, using the degree of polynomial value
equal to 2 to the number of dose groups minus 1 (e.g., if a dataset had five dose groups, a 2°, 3°,
and 4° polynomial model would be executed). Models were initialized using BMDS 2.7 model
defaults, including restricting the power parameter of the power model and n-parameter of the
Hill model to >1 and the beta parameters of the polynomial model to positive or negative,
depending on the mean response direction of the dataset. For all models, either a constant or
non-constant variance model was selected based on criteria summarized in Table E-1 and
outlined in EPA BMD technical guidance19 and the BMDS 2.7 software.
After model execution, BMDs were selected using the model recommendation procedures
generally described19, and the automated decision logic described in Wignall et al.20 and
summarized in Appendix E, Table E-1. Models are placed into one of three possible bins,
depending on the results and the bin recommendation logic:
1. Failure: model did not successfully complete
2. Nonviable model: model successfully completed but with serious issues
3. Viable model: candidate for recommended model but with possible warnings
If only one model was in the viable model bin, it was selected as the best-fitting model. If the
viable bin had more than one model, consistent with U.S. Environmental Protection Agency
(EPA) guidance19, either the model with the lowest Akaike information criterion (AIC) or lowest
benchmark dose lower confidence limit (BMDL) was selected. If the range of BMDL values was
sufficiently close (<3-fold different), the AIC value was used; otherwise, the BMDL value was

In Vivo Repeat Dose Biological Potency Study of Triphenyl Phosphate in Male Sprague Dawley Rats
6
used. If no model was recommended, no BMD was reported. Details on the analysis criteria and
decision tree are provided in Appendix E, Table E-1, and Figure E-2 respectively.
BMD Analysis of Transcriptomics Data
The BMD analysis of the transcriptomic data was performed in accordance with NTP best
practices for genomic dose-response modeling as reviewed by an independent panel of experts in
October, 2017. These recommendations are described in the 2018 publication National
Toxicology Program Approach to Genomic Dose Response Modeling21.
Probe set intensities from raw microarray data (CEL files from Affymetrix Rat Genome 230 2.0
Arrays) were normalized by applying the Robust Multi-array Average (RMA) algorithm from
the genomics analysis tool, GeneSpring GX 12.6 (Agilent Technology, Foster City, CA). The
microarray studies of multiple organophosphate phosphates (data to be reported elsewhere) were
performed at the same time such that .CEL files from those related studies were normalized
together. Principal component analysis (PCA) of the primary RMA-normalized data indicated a
batch effect; due to randomization of the samples in the processing and detailed metadata
capture, the source of the batch effect could be identified as the hybridization date. To correct the
batch effect, the primary normalized data were loaded into Partek Genomic Suite version
6.16.0812 (St. Louis, MO) and annotated with chemical treatment/dose group and hybridization
date annotations. The ANOVA-based remove batch effect function in Partek Genomic Suite then
was used to remove quantitative impacts on the hybridization date batch effect. Quality control
of the batch-corrected, normalized data was performed by visual inspection, using a PCA plot
and normalized intensity histograms (Appendix D).
Dose-response analyses of RMA-normalized, batch-corrected probe set intensities from the
TPHP study samples were performed using BMDExpress 2.20.0148 beta22
(https://github.com/auerbachs/BMDExpress-2/releases), an updated version of BMDExpress
1.41 that uses an updated modeling approach. First, control genes (AFFX-) were removed from
each data set. A trend test (Williams’ trend test12; 13, p < 0.05) and fold change filter (1.5-fold
change up or down relative to vehicle control for probe sets) was applied to each data set to
remove probe sets demonstrating no response to chemical treatment from subsequent analysis.
These filter criteria were empirically determined, with the goal of balancing false discovery with
reproducibility. The criteria are consistent with the MicroArray Quality Control
recommendations to combine the nominal p-value threshold with a fold-change filter to
maximize replicability of transcriptomic findings across labs. Hill, power, linear, polynomial 2°,
exponential 2, exponential 3, exponential 4, and exponential 5 dose-response models then were
fit to the probe sets that passed the trend test and fold change filter. All gene expression data
analyzed in BMDExpress were log2 transformed, and thus nearly all probe sets exhibit constant
variance across the doses. For this reason and for efficiency purposes, each model was run
assuming constant variance. Lacking any broadly applicable guidance regarding the level of
change in gene expression that is considered to be biologically significant, a BMR of
1 × standard deviation was used in this study. This approach enables standardization of the BMR
between apical endpoints and transcriptomic endpoints and provides a standard for use across
multiple chemicals tested in this rapid screening paradigm. The expression direction (up- or
down-regulated) for each probe set was determined by a trend test intrinsic to the model
executables contained in BMDExpress provided by EPA.

In Vivo Repeat Dose Biological Potency Study of Triphenyl Phosphate in Male Sprague Dawley Rats
7
To identify the best-fit model for each fitted probe set, the AIC for each fitted model was
compared and the model with the lowest AIC selected. The best model for each probe set was
used to calculate the BMD, BMDL, and BMD upper confidence limit (BMDU). The specific
parameter settings, selected from the BMDExpress software when performing probe set-level
BMD analysis, were as follows: maximum iterations – 250, confidence level – 0.95, BMR
factor – 1 (the multiplier of the SD that defined the BMD), restrict power – no restriction, and
constant variance – selected. The specific model selection setting in the BMDExpress software
when performing probe set-level BMD analysis was as follows: best poly model test – lowest
AIC, flag Hill model with ‘k’ parameters – <1/3 the lowest positive dose, and best model
selection with flagged Hill model – include flagged Hill model. The inclusion of the flagged
models is deviation from EPA guidance. The justification for this deviation relates to subsequent
use of the data in which the probe set BMD values are grouped into gene sets from which a
median BMD is derived. If the probe sets were removed from the analysis or forced to another
model, the probe set might not be counted in the gene set analysis and could lead to loss of
“active” gene sets. Importantly, most of the probe sets that produce flagged Hill models show
highly potent responses and should therefore be counted in the analysis. Probe-level data ranked
by fold change are reported; probe sets were removed according to the following criteria: global
goodness-of-fit p-value <0.1 and BMDU/BMDL ratio >40.
To perform Gene Ontology (GO Annotation accession date: 10/7/2017) gene set analysis, only
GO terms with ≥10 or ≤250 annotated genes measured on the gene expression platform were
considered. Before populating the GO terms, the best-fit model for each probe set was subject to
a filtering process to remove those probe sets (1) with a BMD >highest tested dose, (2) that
mapped to more than one gene, (3) that had a global goodness-of-fit p-value <0.1, and (4) with a
BMDU/BMDL ratio >40. GO terms that were at least 5% populated and contained 3 genes that
passed the above criteria were considered “active” (i.e., responsive to chemical treatment). For
reporting in the body of the manuscript, GO terms populated with identical sets of differentially
expressed genes were filtered to limit redundancy in reporting based on the following selection
criteria: (1) highest percentage populated and (2) most specific/highest GO level. Redundant GO
terms failing to differentiate based on these criteria were retained and reported. A complete list
of “active” GO terms is included in supplemental material accessible online at
https://doi.org/10.22427/NTP-DATA-RR-8. Finally, to avoid effects of model extrapolation, GO
terms exhibiting a median BMD 3-fold less than the lowest positive dose (due, in some cases, to
inclusion of flagged Hill models, as noted above) were assigned a default value threshold value
and no BMDL or BMDU value was reported. A summary of the BMDExpress gene expression
analysis pipeline used in this study is shown in Appendix E, Figure E-2.
Data Accessibility
Primary and analyzed data used this study are available to the public at
https://doi.org/10.22427/NTP-DATA-RR-8.

In Vivo Repeat Dose Biological Potency Study of Triphenyl Phosphate in Male Sprague Dawley Rats
8
Results
Animal Condition, Body and Organ Weights
All animals survived to the end of the study. Final mean body weight was significantly decreased
in the highest dose group as compared to the vehicle control group (Table 1). The BMD (BMDL)
for terminal body weight at study Day 4 (SD4) was 486 (278) mg/kg. Assessment of clinical
parameters in a subset of animals found sporadic effects, including red nasal discharge and loose
stools with no difference in incidence between vehicle controls and those animals exposed to
TPHP (data not shown).
Table 1. Mean Body Weight Summary
Study Day
(SD)
0 mg/kg
N = 5
55 mg/kg
N = 5
110 mg/kg
N = 5
220 mg/kg
N = 5
441 mg/kg
N = 5
881 mg/kg
N = 5
BMD1Std
(mg/kg)
BMDL1Std
(mg/kg)
SD0 (g) 258.9 ± 3.6 256.6 ± 5.4 253.5 ± 3.8 261.5 ± 4.2 254.0 ± 6.7 247.8 ± 4.5 NST NST
SD4 (g) 276.3 ± 4.6** 271.3 ± 5.1 271.9 ± 3.7 278.8 ± 4.7 262.4 ± 8.1 232.5 ± 9.4** 486 278
Data are displayed as mean ± standard error of the mean.
Statistical analysis performed by Jonckheere’s (trend) and Williams’ or Dunnett’s (pairwise) tests.
Statistical significance for the control group indicates a significant trend test.
**Statistically significant at p ≤ 0.01.
Benchmark response (BMR) set at 1 standard deviation from the mean.
SD0 = Study Day 0, the first day of dosing; SD4 = Study Day 4, the day of necropsy.
NST = BMD modeling not conducted due to nonsignificant trend test.
At necropsy, a dose-dependent increase in absolute and relative liver weights and relative brain
weight occurred (Table 2). The BMD (BMDL) for increased absolute liver weight was
136 (48) mg/kg and for relative liver weight was 103 (71) mg/kg. Of note is that the change in
relative brain weight is an artifact of significant dose-dependent decreases in body weight. The
absolute brain weight was not affected by chemical exposure (Table 2).
Clinical Chemistry
Among the clinical chemistry endpoints evaluated, the most sensitive to TPHP exposure were
increased serum levels of HDL cholesterol and total cholesterol with BMD (BMDL) of 79 (39)
and 142 (90) mg/kg, respectively (Table 3). LDL cholesterol levels were also increased in this
study, although at a relatively higher dose [BMD (BMDL) = 213 (123) mg/kg].
Albumin concentrations were decreased in the high-dose group (p < 0.05) and exhibited a BMD
(BMDL) of 576 (322) mg/kg. Globulin concentrations had a statistically significant trend
increase, but not a significant pairwise change from the vehicle control group at any specific
dose level (trend; p < 0.05). Globulin levels exhibited a BMD (BMDL) of 328 (174) mg/kg. The
combination of these changes resulted in a significant decrease in the albumin:globulin ratio for
the 220 mg/kg and higher dose groups. The BMD (BMDL) for the albumin:globulin ratio was
147 (103) mg/kg.

In Vivo Repeat Dose Biological Potency Study of Triphenyl Phosphate in Male Sprague Dawley Rats
9
Table 2. Organ Weights Summary
Endpoint 0 mg/kg
N = 5
55 mg/kg
N = 5
110 mg/kg
N = 5
220 mg/kg
N = 5
441 mg/kg
N = 4–5
881 mg/kg
N = 5
BMD1Std
(mg/kg)
BMDL1Std
(mg/kg)
Terminal Body
Weight (SD4) (g)
276.3 ± 4.6** 271.3 ± 5.1 271.9 ± 3.7 278.8 ± 4.7 262.4 ± 8.1 232.5 ± 9.4** 486 278
Brain Weight
Absolute (g)
1.73 ± 0.05 1.74 ± 0.03 1.77 ± 0.04 1.81 ± 0.03 1.81 ± 0.03 1.78 ± 0.01 NST NST
Brain Weight
Relative (mg/g)
6.28 ± 0.23** 6.43 ± 0.06 6.52 ± 0.13 6.48 ± 0.03 7.03 ± 0.14* 7.73 ± 0.37** PMF PMF
Liver Weight
Absolute (g)
11.46 ± 0.19** 11.83 ± 0.56 11.84 ± 0.29 12.95 ± 0.48* 12.92 ± 0.64* 13.09 ± 0.38* 136 48
Liver Weight
Relative (mg/g)
41.50 ± 0.58** 43.52 ± 1.41 43.51 ± 0.63 46.42 ± 1.28 49.14 ± 1.00** 56.74 ± 3.22** 103 71
Data are displayed as mean ± standard error of the mean.
Relative organ weights (organ-weight-to-body-weight ratios) are given as mg organ weight/g body weight.
Statistical analysis performed by Jonckheere’s (trend) and Williams’ or Dunnett’s (pairwise) tests.
Statistical significance for the control group indicates a significant trend test.
*Statistically significant at p ≤ 0.05; **statistically significant at p ≤ 0.01.
Benchmark response (BMR) set at 1 standard deviation from the mean.
Statistical significance for a treatment group indicates a significant pairwise test compared to the vehicle control group.
PMF = no BMD/BMDL selected due to poor model fit; NST = BMD modeling not conducted due to nonsignificant trend test.
Table 3. Clinical Chemistry Summary
Endpoint 0 mg/kg
N = 5
55 mg/kg
N = 5
110 mg/kg
N = 5
220 mg/kg
N = 5
441 mg/kg
N = 5
881 mg/kg
N = 5
BMD1Std
(mg/kg)
BMDL1Std
(mg/kg)
Globulin (g/dL) 2.5 ± 0.07** 2.56 ± 0.07 2.52 ± 0.05 2.66 ± 0.05 2.76 ± 0.06 2.72 ± 0.15 328 174
A/G Ratio 1.38 ± 0.03** 1.31 ± 0.01 1.34 ± 0.02 1.28 ± 0.02* 1.22 ± 0.03** 1.16 ± 0.07** 147 103
Albumin (g/dL) 3.44 ± 0.07* 3.36 ± 0.07 3.38 ± 0.04 3.4 ± 0.04 3.36 ± 0.06 3.12 ± 0.06* 576 322
Cholesterol (mg/dL) 101.0 ± 5.8** 115.0 ± 6.5 122.4 ± 6.2 127.8 ± 6.3* 145.4 ± 7.3** 170.0 ± 19.4** 142 90
LDL Cholesterol (mg/dL) 21.8 ± 0.7** 21.8 ± 1.1 23.2 ± 0.9 23.8 ± 1.5 23.4 ± 1.1 32.8 ± 6.4* 213 123
HDL Cholesterol (mg/dL) 46.0 ± 2.9** 54.6 ± 2.7 56.8 ± 2.8* 60.6 ± 2.9** 70.6 ± 3.2** 78.2 ± 5.1** 79 39
Data are displayed as mean ± standard error of the mean.
Statistical analysis performed by Jonckheere’s (trend) and Shirley’s or Dunn’s (pairwise) tests.
Statistical significance for the control group indicates a significant trend test.
*Statistically significant at p ≤ 0.05; **statistically significant at p ≤ 0.01.
Benchmark response (BMR) set at 1 standard deviation from the mean.
Statistical significance for a treatment group indicates a significant pairwise test compared to the vehicle control group.
A/G Ratio = ratio of albumin to globulin.

In Vivo Repeat Dose Biological Potency Study of Triphenyl Phosphate in Male Sprague Dawley Rats
10
Hormones and Enzymes
A dose-dependent decrease in free thyroxine was observed, beginning with the 220 mg/kg dose
group (p < 0.05; Table 4). The BMD (BMDL) for free thyroxine was 178 (139) mg/kg. A
statistically significant decrease in serum cholinesterase (−36 to 70%) was noted in all dose
groups, beginning with the 55 mg/kg group (p < 0.01); however, a BMD (BMDL) could not be
calculated due to the inability to fit the data to an appropriate model. Testing lower doses in
future studies will therefore be necessary to calculate a benchmark dose associated with
increased cholinesterase in the context of TPHP exposure.
Table 4. Hormone and Enzymes Summary
Endpoint 0 mg/kg
N = 5
55 mg/kg
N = 5
110 mg/kg
N = 5
220 mg/kg
N = 5
441 mg/kg
N = 5
881 mg/kg
N = 5
BMD1Std
(mg/kg)
BMDL1Std
(mg/kg)
Free Thyroxine
(g/dL)
5.122 ±
0.227**
5.114 ±
0.196
4.678 ±
0.304
4.274 ±
0.263*
4.066 ±
0.331*
1.870 ±
0.429**
178
139
Cholinesterase
(IU/L)
277.4 ±
16.6**
178.4 ±
8.0**
162.6 ±
7.6**
116.6 ±
5.8**
108.8 ±
8.3**
82.8 ±
2.1**
PMF PMF
Data are displayed as mean ± standard error of the mean.
Statistical analysis performed by Jonckheere’s (trend) and Shirley’s or Dunn’s (pairwise) tests.
Statistical significance for the control group indicates a significant trend test.
*Statistically significant at p ≤ 0.05; ** statistically significant at p ≤ 0.01.
Benchmark response (BMR) set at 1 standard deviation from the mean.
Statistical significance for a treatment group indicates a significant pairwise test compared to the vehicle control group.
PMF = no BMD/BMDL selected due to poor model fit.
Apical Endpoint and Clinical Chemistry Benchmark Dose Summary Table
A summary of the calculated BMDs for each toxicological endpoint is provided in Table 5. The
lowest-observed-effect level (LOEL)and no observed effect level (NOEL) is provided and may
be informative for endpoints that lack a calculated BMD due to poor model fit or deficiencies in
model performance characteristics.

In Vivo Repeat Dose Biological Potency Study of Triphenyl Phosphate in Male Sprague Dawley Rats
11
Table 5. BMD, NOEL, and LOEL Summary for Apical Endpoints, Sorted by LOEL or BMDL from
Low to High
Table Number Endpoint NOEL (mg/kg) LOEL (mg/kg) BMDL1Std (mg/kg) BMD1Std (mg/kg)
3 HDL Cholesterol 55 110 39 79
2 Liver Weight
Absolute
110 220 48 136
4 Cholinesterase ND 55 – –
2 Liver Weight
Relative
220 441 71 103
3 Cholesterol 110 220 90 142
3 A/G Ratio 110 220 103 147
3 LDL Cholesterol 441 881 123 213
4 Free Thyroxine 110 220 139 178
3 Globulin ND ND 174 328
2 Terminal Body
Weight (SD4)
441 881 278 486
3 Albumin 441 881 322 576
2 Brain Weight
Relative
220 441a – –
aChange in relative brain weight is an artifact of decreases in overall body weight. The chemical had no effect on absolute brain
weight. Benchmark response (BMR) set at 1 standard deviation from the mean. ND = not determined. – indicates value not
reported due to poor model performance. Values in bold text indicate the LOEL of endpoints for which a BMD could not be
calculated.
Gene Set BMD Analysis
Chemical-induced alterations in liver gene transcript expression were examined to determine
those gene sets most sensitively affected by exposure to TPHP. To that end, BMD analysis of
transcripts and gene sets (GO Biological Processes) was conducted to determine the potency of
the chemical to elicit gene expression changes in the liver. This analysis used transcript-level
BMD data to assess an aggregate score of gene set potency (median transcript BMD) and
enrichment.
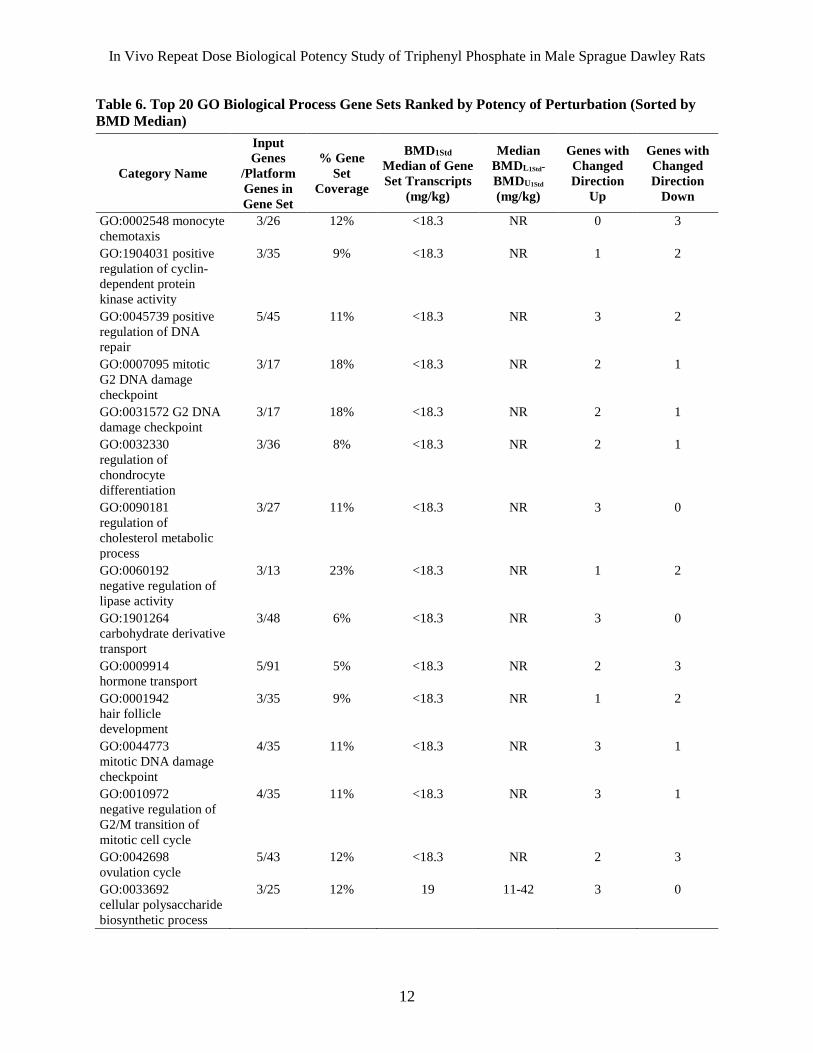
The “active” gene sets with the lowest BMD median value are shown in Table 6. The gene sets
in Table 6 should be interpreted with caution from the standpoint of the underlying biology and
instead should be considered a metric of potency for chemical-induced transcriptional changes.
Fourteen gene sets had estimated BMD median values below the lower limit of extrapolation
(<18.3 mg/kg, or three times smaller than the lowest tested dose). These sensitive gene sets
included GO:0090181 Regulation of cholesterol metabolic process and GO:0009914 Hormone
transport. The most sensitively affected GO Biological Processes for which a BMD value could
be reliably calculated were GO:0033692 Cellular polysaccharide biosynthetic process and
GO:0014003 Oligodendrocyte development, each with BMDs of 19 mg/kg and BMDLs of
11 mg/kg. The full list of affected gene sets is available at https://doi.org/10.22427/NTP-DATA-
RR-8.
In Vivo Repeat Dose Biological Potency Study of Triphenyl Phosphate in Male Sprague Dawley Rats
12
Table 6. Top 20 GO Biological Process Gene Sets Ranked by Potency of Perturbation (Sorted by
BMD Median)
Category Name
Input
Genes
/Platform
Genes in
Gene Set
% Gene
Set
Coverage
BMD1Std
Median of Gene
Set Transcripts
(mg/kg)
Median
BMDL1Std-
BMDU1Std
(mg/kg)
Genes with
Changed
Direction
Up
Genes with
Changed
Direction
Down
GO:0002548 monocyte
chemotaxis
3/26 12% <18.3 NR 0 3
GO:1904031 positive
regulation of cyclin-
dependent protein
kinase activity
3/35 9% <18.3 NR 1 2
GO:0045739 positive
regulation of DNA
repair
5/45 11% <18.3 NR 3 2
GO:0007095 mitotic
G2 DNA damage
checkpoint
3/17 18% <18.3 NR 2 1
GO:0031572 G2 DNA
damage checkpoint
3/17 18% <18.3 NR 2 1
GO:0032330
regulation of
chondrocyte
differentiation
3/36 8% <18.3 NR 2 1
GO:0090181
regulation of
cholesterol metabolic
process
3/27 11% <18.3 NR 3 0
GO:0060192
negative regulation of
lipase activity
3/13 23% <18.3 NR 1 2
GO:1901264
carbohydrate derivative
transport
3/48 6% <18.3 NR 3 0
GO:0009914
hormone transport
5/91 5% <18.3 NR 2 3
GO:0001942
hair follicle
development
3/35 9% <18.3 NR 1 2
GO:0044773
mitotic DNA damage
checkpoint
4/35 11% <18.3 NR 3 1
GO:0010972
negative regulation of
G2/M transition of
mitotic cell cycle
4/35 11% <18.3 NR 3 1
GO:0042698
ovulation cycle
5/43 12% <18.3 NR 2 3
GO:0033692
cellular polysaccharide
biosynthetic process
3/25 12% 19 11-42 3 0

In Vivo Repeat Dose Biological Potency Study of Triphenyl Phosphate in Male Sprague Dawley Rats
13
Category Name
Input
Genes
/Platform
Genes in
Gene Set
% Gene
Set
Coverage
BMD1Std
Median of Gene
Set Transcripts
(mg/kg)
Median
BMDL1Std-
BMDU1Std
(mg/kg)
Genes with
Changed
Direction
Up
Genes with
Changed
Direction
Down
GO:0014003
oligodendrocyte
development
3/31 10% 19 11-39 3 0
GO:0060487
lung epithelial cell
differentiation
3/28 11% 22 9-64 3 0
GO:0051453
regulation of
intracellular pH
4/60 7% 23 6-95 1 3
GO:0030004
cellular monovalent
inorganic cation
homeostasis
6/79 8% 24 6-98 2 4
GO:0072348
sulfur compound
transport
4/27 15% 25 14-59 1 3
NR = The BMDL-BMDU range is not reportable because the BMD median is below the lower limit of extrapolation (less than 1/3
of the lowest tested dose in this study).
Differentially Expressed Gene Analysis
The top 10 up- and down-regulated genes based on maximum fold change relative to control that
passed the criteria for BMD estimation (fold change >|1.5| and significant Williams’ trend test,
global goodness of fit >0.1, and BMDU/BMDL <40), are shown in Table 7.
The most potently affected genes, experiencing the greatest maximal fold change increase, were
Ces2c (carboxylesterase 2c) and Cyp2b1 (cytochrome P450 2b1) and an unmapped transcript,
each with a median BMD below the lower limit of extrapolation. Hepatic transcript expression
increased dose-dependently and maximal fold changes for Ces2c and Cyp2b1 occurred at the
highest tested dose at 16.3- and 10.5-fold above vehicle exposed animals. The most potently
induced genes with maximal fold increase for which a BMD and BMDL could be calculated
reliably were Abcc3 [also known as multidrug resistance 3 (MDR3), BMDL = 26 mg/kg,
maximal fold increase of 12.7] and Per2 (period circadian regulator 2, BMDL = 36 mg/kg,
maximal fold increase of 7.2).
The most potently affected genes experiencing the greatest maximal fold change decrease were
Scd (stearoyl-CoA desaturase) with a median BMD below the lower limit of extrapolation
(<18.3 mg/kg; maximal fold change of −11.1) and G6pc (glucose-6-phosphatase, catalytic
subunit) with a median BMDL value of 16 mg/kg (maximal fold change of −5.1).

In Vivo Repeat Dose Biological Potency Study of Triphenyl Phosphate in Male Sprague Dawley Rats
14
Table 7. Top Differentially Expressed Probe Sets Ranked by Fold Change
Affymetrix
Probe ID
Gene Symbol and
Aliases
Gene
Name
BMD1Std
(BMDL1Std –BMDU1Std)
in mg/kg
Fold
Change
55 mg/kg
Fold
Change
110 mg/kg
Fold
Change
220 mg/kg
Fold
Change
441 mg/kg
Fold
Change
881 mg/kg
Increased transcripts with maximal fold change vs. vehicle control
1368718_at Aldh1a7 aldehyde dehydrogenase family 1,
subfamily A7
414 (263–962) −1.8 4.2 8.6 9.5 69.4
1368569_at Akr1b7 aldo-keto reductase family 1, member B7 238 (186–329) −1.4 1.1 2.5 2.9 29.0
1368905_at Ces2c;
LOC100910040
carboxylesterase 2C <18.3 (NR) 2.3 2.8 4.4 10.3 16.3
1369698_at Abcc3 ATP binding cassette subfamily C
member 3
48 (26–80) 1.3 2.8 5.6 9.8 12.7
1371076_at Cyp2b1; Cyp2b2;
LOC100909962
cytochrome P450, family 2, subfamily b,
polypeptide 1
<18.3 (NR) 3.1 5.5 6.9 9.0 10.5
1368303_at Per2 period circadian regulator 2 48 (36–73) 2.1 2.8 3.3 7.2 4.6
1397924_at – – <18.3 (NR) 2.2 2.9 3.4 6.7 5.8
1371089_at
Gsta3 glutathione S-transferase alpha 3 84 (57–152) 1.1 1.4 2.5 4.6 6.6
1370269_at Cyp1a1 cytochrome P450, family 1, subfamily a,
polypeptide 1
153 (115–278) 1.2 1.2 1.6 3.0 6.1
1381811_at – – 58 (42–94) 1.2 2.2 2.6 5.9 2.1
Decreased transcripts with maximal fold change vs. vehicle control
1395403_at Stac3 SH3 and cysteine rich domain 3 81 (56–143) −1.4 −1.5 −2.4 −7.0 −11.6
1370355_at Scd; Scd1 stearoyl-CoA desaturase <18.3 (NR) −3.8 −6.9 −6.0 −10.5 −11.1
1386977_at Car3 carbonic anhydrase 3 201 (141–332) −1.0 −1.1 −1.6 −2.5 −9.8
1397205_at Dhrs7;
LOC100364391
dehydrogenase/reductase 7 163 (118–255) 1.9 1.2 −1.3 −2.4 −7.7
1390672_at Rprm reprimo, TP53 dependent G2 arrest
mediator homolog
59 (42–95) −2.2 −2.2 −2.9 −5.9 −3.3
1371102_x_at LOC100134871;
LOC689064
beta-globin 485 (273–825) −1.2 −1.0 −1.1 −1.4 −5.4
1368171_at Lox lysyl oxidase 208 (122–262) −1.1 1.3 −2.7 −5.4 −5.2
1370725_a_at Aoc3; G6pc; Psme3 glucose-6-phosphatase, catalytic subunit 27 (16–53) −2.0 −2.3 −3.8 −5.1 −4.5
1371143_at Serpina7 serpin family A member 7 330 (167–546) −1.1 −1.3 −1.4 −1.5 −5.1
1368172_a_at Lox lysyl oxidase 210 (119–306) −1.4 1.1 −2.7 −4.7 −5.1
– = A gene name cannot be identified because the probes no longer align to the rat genome (i.e., no perfect sequence matches the most recent rat genome assembly, Rnor_6.0).
<18.3 = A best-fit model as identified calculated a BMD that was less than 1/3 of the lowest tested dose in this study.
NR = The BMDL-BMDU range is not reportable because the BMD median is below the lower limit of extrapolation (less than 1/3 of the lowest tested dose in this study).

In Vivo Repeat Dose Biological Potency Study of Triphenyl Phosphate in Male Sprague Dawley Rats
15
Discussion
As PBDE flame retardants have been phased out due to concerns regarding their toxicity and
persistence, the use of replacement OPFRs such as TPHP has increased. Limited toxicity data are
available to estimate the potential adverse health effects of OPFRs. This study used a
transcriptomic approach and standard toxicological endpoints to determine short-term biological
activity of TPHP.
Serum cholinesterase was significantly and markedly decreased for all dose groups and appeared
to be a sensitive apical measure. These findings are consistent with several reports that show the
classic cholinesterase inhibition in organophosphates including TPHP23. As the LOEL for the
study, cholinesterase inhibition appeared to be the most sensitive apical measure; cholinesterase
inhibition was so marked at all doses that a BMD value could not be determined due to poor
model fit. Further studies are warranted to assess cholinesterase effects at concentrations
<55 mg/kg to obtain an accurate point of departure. The most sensitive apical endpoint for which
a BMD could be determined was HDL cholesterol with a BMDL (BMD) of 39 (79) mg/kg. Dose-
dependent increases in absolute and relative liver weight [48 (136) mg/kg and 71 (103) mg/kg]
and cholesterol [90 (142) mg/kg] for BMDL (BMD) were the next most sensitive apical endpoint
changes.
Not surprisingly, transcriptional changes in the liver following TPHP exposure occurred at dose
levels below that for which changes in circulating cholinesterase and cholesterol levels were
observed. The most sensitively affected gene sets for which a reliable BMDL could be estimated
were cellular polysaccharide biosynthetic process and oligodendrocyte development, both with a
BMDL median value of 11 mg/kg. Fourteen GO Biological Processes were potently affected
below the lower limit of extrapolation from the dose curve (BMD < 18.3 mg/kg). This finding
suggests that further testing at doses lower than 55 mg/kg would be useful toward refining
estimates of the transcriptional point of departure.
The most potently affected single genes with maximal fold increases in hepatic expression
included Ces2c (carboxylesterase 2C) and Cyp2b1 (cytochrome P450 family 2, subfamily b,
polypeptide 1), each with median BMD values below the lower limit of extrapolation
(<18.3 mg/kg). Prior studies investigating hepatic lipid metabolism and effects of TPHP
exposure in mice indicated the potential for TPHP to inhibit activity of carboxylesterases using
proteomic approaches; this effect was confirmed using activity assays derived from in vitro
mouse crude liver lysates, using 50 M TPHP24. Other genes with maximal fold increases and
potency estimated below the lowest tested dose were Abcc3 [also known as MRP3 or multidrug
resistance 3 transporter; BMDL (BMD) of 26 (48) mg/kg] and Per2 [period circadian regulator 2;
BMDL (BMD) of 36 (48) mg/kg], which each have functions in xenobiotic metabolism
regulation and transport.
The most potently affected single genes with maximal fold decreases in hepatic expression
included Scd (stearoyl-CoA desaturase, an enzyme involved in fatty acid synthesis;
BMD < 18.3 mg/kg) and G6pc (glucose-6-phosphate catalytic subunit, a key enzyme in
maintaining glucose homeostasis; BMDL of 16 mg/kg).
Because the target organ(s) were unknown, identifying meaningful gene sets from a single organ
(e.g., liver) that were correlated with noncancer apical responses was not necessarily expected, as

In Vivo Repeat Dose Biological Potency Study of Triphenyl Phosphate in Male Sprague Dawley Rats
16
has been suggested in the literature. This analysis therefore focused on dose-response
relationships9. Our data indicate the TPHP doses associated with the initiation of molecular
transcriptional changes and with alterations in apical endpoints.
Under the conditions of this short-duration transcriptomic study in Harlan Sprague Dawley rats,
the most sensitive point of departure with a reliable estimate was 11 mg/kg (BMDL) for hepatic
transcriptional gene set alterations. Increased serum HDL cholesterol was the most sensitive
apical endpoint, with a BMDL of 39 mg/kg, followed by cholinesterase inhibition, which was
marked at all tested doses, starting at 55 mg/kg. Follow-up studies that investigate transcriptional
and apical endpoint changes at lower doses will be a useful future direction to better resolve
transcriptional changes that occur with the greatest potency.

In Vivo Repeat Dose Biological Potency Study of Triphenyl Phosphate in Male Sprague Dawley Rats
17
References
1. Frederiksen M, Thomsen M, Vorkamp K, Knudsen LE. Patterns and concentration levels of
polybrominated diphenyl ethers (PBDEs) in placental tissue of women in Denmark.
Chemosphere. 2009; 76(11):1464-1469. http://dx.doi.org/10.1016/j.chemosphere.2009.07.017
2. Herbstman JB, Sjodin A, Kurzon M, Lederman SA, Jones RS, Rauh V, Needham LL, Tang D,
Niedzwiecki M, Wang RY et al. Prenatal exposure to PBDEs and neurodevelopment. Environ
Health Perspect. 2010; 118(5):712-719. http://dx.doi.org/10.1289/ehp.0901340
3. Meeker JD, Stapleton HM. House dust concentrations of organophosphate flame retardants in
relation to hormone levels and semen quality parameters. Environ Health Perspect. 2010;
118(3):318-323. http://dx.doi.org/10.1289/ehp.0901332
4. Meeker JD, Cooper EM, Stapleton HM, Hauser R. Urinary metabolites of organophosphate
flame retardants: temporal variability and correlations with house dust concentrations.
Environmental Health Perspectives. 2013; 121(5):580-585.
http://dx.doi.org/10.1289/ehp.1205907
5. Porte C, Barcelo D, Albaiges J. Quantitation of total versus selected polychlorinated biphenyl
congeners in marine biota samples. J Chromatogr. 1988; 442:386-393.
http://dx.doi.org/10.1016/S0021-9673(00)94488-1
6. Sundkvist AM, Olofsson U, Haglund P. Organophosphorus flame retardants and plasticizers in
marine and fresh water biota and in human milk. J Environ Monit. 2010; 12(4):943-951.
http://dx.doi.org/10.1039/b921910b
7. van der Veen I, de Boer J. Phosphorus flame retardants: properties, production, environmental
occurrence, toxicity and analysis. Chemosphere. 2012; 88(10):1119-1153.
http://dx.doi.org/10.1016/j.chemosphere.2012.03.067
8. Hoffman K, Fang M, Horman B, Patisaul HB, Garantziotis S, Birnbaum LS, Stapleton HM.
Urinary tetrabromobenzoic acid (TBBA) as a biomarker of exposure to the flame retardant
mixture Firemaster(R) 550. Environ Health Perspect. 2014; 122(9):963-969.
https://doi.org/10.1289/ehp.1308028
9. Thomas RS, Wesselkamper SC, Wang NC, Zhao QJ, Petersen DD, Lambert JC, Cote I, Yang
L, Healy E, Black MB et al. Temporal concordance between apical and transcriptional points of
departure for chemical risk assessment. Toxicol Sci. 2013; 134(1):180-194.
http://dx.doi.org/10.1093/toxsci/kft094
10. Dean JL, Zhao QJ, Lambert JC, Hawkins BS, Thomas RS, Wesselkamper SC. Editor's
Highlight: Application of gene set enrichment analysis for identification of chemically induced,
biologically relevant transcriptomic networks and potential utilization in human health risk
Assessment. Toxicol Sci. 2017; 157(1):85-99. http://dx.doi.org/10.1093/toxsci/kfx021
11. Wilson CL, Miller CJ. Simpleaffy: a BioConductor package for Affymetrix quality control
and data analysis. Bioinformatics (Oxford, England). 2005; 21(18):3683-3685.
http://dx.doi.org/10.1093/bioinformatics/bti605

In Vivo Repeat Dose Biological Potency Study of Triphenyl Phosphate in Male Sprague Dawley Rats
18
12. Williams DA. A test for differences between treatment means when several dose levels are
compared with a zero dose control. Biometrics. 1971; 27(1):103-117.
http://dx.doi.org/10.2307/2528930
13. Williams DA. The comparison of several dose levels with a zero dose control. Biometrics.
1972; 28(2):519-531. http://dx.doi.org/10.2307/2556164
14. Dunnett CW. A multiple comparison procedure for comparing several treatments with a
control. Journal of the American Statistical Association. 1955; 50(272):1096-1121.
http://dx.doi.org/10.1080/01621459.1955.10501294
15. Shirley E. A non-parametric equivalent of Williams' test for contrasting increasing dose
levels of a treatment. Biometrics. 1977; 33(2):386-389. http://dx.doi.org/10.2307/2529789
16. Dunn OJ. Multiple comparisons using rank sums. Technometrics. 1964; 6(3):241-252.
http://dx.doi.org/10.1080/00401706.1964.10490181
17. Jonckheere AR. A distribution-free k-sample test against ordered alternatives. Biometrika.
1954; 41(1/2):133-145. http://dx.doi.org/10.2307/2333011
18. Dixon WJ, Massey FJ. Introduction to statistical analysis. New York,: McGraw-Hill; 1951.
19. US EPA. 2012. Benchmark dose technical guidance. Washington, DC: U.S. EPA.
20. Wignall JA, Shapiro AJ, Wright FA, Woodruff TJ, Chiu WA, Guyton KZ, Rusyn I.
Standardizing benchmark dose calculations to improve science-based decisions in human health
assessments. Environ Health Perspect. 2014; 122(5):499-505.
http://dx.doi.org/10.1289/ehp.1307539
21. NTP 2018. NTP research report on National Toxicology Program approach to genomic dose-
response modeling. Research Triangle Park, NC: National Toxicology Program. No. 5.
https://doi.org/10.22427/NTP-RR-5
22. Phillips JR, Svoboda DL, Tandon A, Patel S, Sedykh A, Mav D, Kuo B, Yauk CL, Yang L,
Thomas RS et al. BMDExpress 2: Enhanced transcriptomic dose-response analysis workflow.
Bioinformatics (Oxford, England). 2018. http://dx.doi.org/10.1093/bioinformatics/bty878
23. ATSDR. 2012. Toxicological profile for phosphate ester flame retardants. Atlanta, GA: US
Department of Health and Human Services, Public Health Service.
24. Morris PJ, Medina-Cleghorn D, Heslin A, King SM, Orr J, Mulvihill MM, Krauss RM,
Nomura DK. Organophosphorus flame retardants inhibit specific liver carboxylesterases and
cause serum hypertriglyceridemia. ACS Chem Biol. 2014; 9(5):1097-1103.
http://dx.doi.org/10.1021/cb500014
25. Thomas RS, Allen BC, Nong A, Yang L, Bermudez E, Clewell HJ, III, Andersen ME. A
method to integrate benchmark dose estimates with genomic data to assess the functional effects
of chemical exposure. Toxicological Sciences. 2007; 98(1):240-248.
http://dx.doi.org/10.1093/toxsci/kfm092

In Vivo Repeat Dose Biological Potency Study of Triphenyl Phosphate in Male Sprague Dawley Rats
A-1
Appendix A Animal Identifiers and Endpoint Analyses
Table A-1. Animal Numbers, Completed Endpoint Analyses, and Microarray Data File Names
Animal
Number Group
Dose
(mmol/
kg/day)
Dose
(mg/kg/
day)
Found
Dead
Gavage
Accident
Mori-
bund
Body
Weight
Clinical
Obser-
vations
Organ
Weight
Clinical
Chemistry
Hema-
tology
Cholin-
esterase T4 Array ID
173 Corn
Oil
0 0 No No No Yes Yes Yes Yes Yes Yes Yes 041-052014-MW_(Rat230_2).CEL
174 Corn
Oil
0 0 No No No Yes Yes Yes Yes Yes Yes Yes 001-051914-MW_(Rat230_2).CEL
184 Corn
Oil
0 0 No No No Yes Yes Yes Yes Yes Yes Yes 073-052714-JAP_(Rat230_2).CEL
210 Corn
Oil
0 0 No No No Yes Yes Yes Yes Yes Yes Yes 009-051914-MW_(Rat230_2).CEL
215 Corn
Oil
0 0 No No No Yes Yes Yes Yes Yes Yes Yes 037-052014-MW_(Rat230_2).CEL
159 TPHP 0.169 55 No No No Yes Yes Yes Yes Yes Yes Yes NA
164 TPHP 0.169 55 No No No Yes Yes Yes Yes Yes Yes Yes 002-051914-MW_(Rat230_2).CEL
168 TPHP 0.169 55 No No No Yes Yes Yes Yes Yes Yes Yes NA
171 TPHP 0.169 55 No No No Yes Yes Yes Yes Yes Yes Yes 038-052014-MW_(Rat230_2).CEL
223 TPHP 0.169 55 No No No Yes Yes Yes Yes Yes Yes Yes 074-052714-JAP_(Rat230_2).CEL
148 TPHP 0.338 110 No No No Yes Yes Yes Yes Yes Yes Yes 003-051914-MW_(Rat230_2).CEL
162 TPHP 0.338 110 No No No Yes Yes Yes Yes Yes Yes Yes NA
176 TPHP 0.338 110 No No No Yes Yes Yes Yes Yes Yes Yes 039-052014-MW_(Rat230_2).CEL
179 TPHP 0.338 110 No No No Yes Yes Yes Yes Yes Yes Yes 075-052714-JAP_(Rat230_2).CEL
194 TPHP 0.338 110 No No No Yes Yes Yes Yes Yes Yes Yes NA
160 TPHP 0.675 220 No No No Yes Yes Yes Yes Yes Yes Yes 004-051914-MW_(Rat230_2).CEL
175 TPHP 0.675 220 No No No Yes Yes Yes Yes Yes Yes Yes NA
192 TPHP 0.675 220 No No No Yes Yes Yes Yes Yes Yes Yes 040-052014-MW_(Rat230_2).CEL
193 TPHP 0.675 220 No No No Yes Yes Yes Yes Yes Yes Yes NA
206 TPHP 0.675 220 No No No Yes Yes Yes Yes Yes Yes Yes 076-052714-JAP_(Rat230_2).CEL

In Vivo Repeat Dose Biological Potency Study of Triphenyl Phosphate in Male Sprague Dawley Rats
A-2
Animal
Number Group
Dose
(mmol/
kg/day)
Dose
(mg/kg/
day)
Found
Dead
Gavage
Accident
Mori-
bund
Body
Weight
Clinical
Obser-
vations
Organ
Weight
Clinical
Chemistry
Hema-
tology
Cholin-
esterase T4 Array ID
186 TPHP 1.35 441 No No No Yes Yes Yes Yes Yes Yes Yes 005-051914-MW_(Rat230_2).CEL
204 TPHP 1.35 441 No No No Yes Yes Yes Yes Yes Yes Yes NA
205 TPHP 1.35 441 No No No Yes Yes Yes Yes Yes Yes Yes NA
219 TPHP 1.35 441 No No No Yes Yes Yes Yes Yes Yes Yes 042-052114-MW_(Rat230_2).CEL
230 TPHP 1.35 441 No No No Yes Yes Yes Yes Yes Yes Yes 077-052714-JAP_(Rat230_2).CEL
161 TPHP 2.7 881 No No No Yes Yes Yes Yes Yes Yes Yes 006-051914-MW_(Rat230_2).CEL
191 TPHP 2.7 881 No No No Yes Yes Yes Yes Yes Yes Yes NA
200 TPHP 2.7 881 No No No Yes Yes Yes Yes Yes Yes Yes 043-052114-MW_(Rat230_2).CEL
213 TPHP 2.7 881 No No No Yes Yes Yes Yes Yes Yes Yes 078-052714-JAP_(Rat230_2).CEL
NA = No liver transcriptomics data collected for selected animal.

In Vivo Repeat Dose Biological Potency Study of Triphenyl Phosphate in Male Sprague Dawley Rats
B-1
Appendix B Analytical Chemistry
Table B-1. Summary of Analytical Results for Triphenyl Phosphate (CAS No. 115-86-6)
Analysis Results
FTIR and NMR spectroscopy Consistent with proposed structure and reference spectra
Ultraviolet/visible spectroscopy Maxima at λ 267.5, 261.0, and 255.5 nm, consistent with reference
spectrum
Direct infusion mass spectrometry Confirmation of monoisotopic mass of 327.1 Da representing [M+H]+ and
consistent with the test article molecular weight
Elemental analysis Average % Determined/Theoretical
Carbon 66.43% 100.26%
Hydrogen 4.42% 95.46%
Phosphorus 9.84% 103.69%
Karl Fischer titration <0.01% water
Melting point 48.7° to 49.8 (s)°C
Differential scanning calorimetry Purity of 99.72 ± 0.05(d)%
log P 4.66
GC purity profile with DB-5 column
and flame ionization detection
Purity of 99.35% with four (4) impurities greater than or equal to 0.05%,
totaling 0.66%
Residual solvent content using
GC/headspace analysis
No residual solvents present at levels greater than the Class 1 and Class 2
standard mixtures
GC = gas chromatography; FTIR = Fourier transform infrared; NMR = nuclear magnetic resonance.

In Vivo Repeat Dose Biological Potency Study of Triphenyl Phosphate in Male Sprague Dawley Rats
C-1
Appendix C Toxicology Data Tables
Tables
Table C-1. I04: Mean Body Weight Summary ............................................................................C-1 Table C-2. PA06: Organ Weights Summary ...............................................................................C-1
Table C-3. PA41: Clinical Chemistry Summary .........................................................................C-2 Table C-4. R07: Hormone Summary ...........................................................................................C-2
Table C-1. I04: Mean Body Weight Summary
Phase 0 mg/kg
N = 5
55 mg/kg
N = 5
110 mg/kg
N = 5
220 mg/kg
N = 5
441 mg/kg
N = 5
881 mg/kg
N = 5
SD0 (g) 258.9 ± 3.6 256.6 ± 5.4 253.5 ± 3.8 261.5 ± 4.2 254.0 ± 6.7 247.8 ± 4.5
SD4 (g) 276.3 ± 4.6** 271.3 ± 5.1 271.9 ± 3.7 278.8 ± 4.7 262.4 ± 8.1 232.5 ± 9.4** Data are displayed as mean ± standard error of the mean.
Statistical analysis performed by Jonckheere’s (trend) and Williams’ or Dunnett’s (pairwise) tests.
Statistical significance for the control group indicates a significant trend test.
**Statistically significant at p ≤ 0.01.
SD = Study Day.
Table C-2. PA06: Organ Weights Summary
Endpoint 0 mg/kg
N = 5
55 mg/kg
N = 5
110 mg/kg
N = 5
220 mg/kg
N = 5
441 mg/kg
N = 4–5
881 mg/kg
N = 5
Terminal Body
Weight (g)
276.3 ± 4.6** 271.3 ± 5.1 271.9 ± 3.7 278.8 ± 4.7 262.4 ± 8.1 232.5 ± 9.4**
Brain Weight
Absolute (g)
1.73 ± 0.05 1.74 ± 0.03 1.77 ± 0.04 1.81 ± 0.03 1.81 ± 0.03 1.78 ± 0.01
Brain Weight
Relative
6.28 ± 0.23** 6.43 ± 0.06 6.52 ± 0.13 6.48 ± 0.03 7.03 ± 0.14* 7.73 ± 0.37**
Liver Weight
Absolute (g)
11.46 ± 0.19** 11.83 ± 0.56 11.84 ± 0.29 12.95 ± 0.48* 12.92 ± 0.64* 13.09 ± 0.38*
Liver Weight
Relative
41.50 ± 0.58** 43.52 ± 1.41 43.51 ± 0.63 46.42 ± 1.28 49.14 ± 1.00** 56.74 ± 3.22**
Data are displayed as mean ± standard error of the mean.
Relative organ weights (organ weight-to-body weight ratios) are given as mg organ weight/g body weight.
Statistical analysis performed by Jonckheere’s (trend) and William’s or Dunnett’s (pairwise) tests.
Statistical significance for the control group indicates a significant trend test.
*Statistically significant at p ≤ 0.05.
Statistical significance for a treatment group indicates a significant pairwise test compared to the vehicle control group.
**Statistically significant at p ≤ 0.01.

In Vivo Repeat Dose Biological Potency Study of Triphenyl Phosphate in Male Sprague Dawley Rats
C-2
Table C-3. PA41: Clinical Chemistry Summary
Endpoint Name 0 mg/kg
N = 5
55 mg/kg
N = 5
110 mg/kg
N = 5
220 mg/kg
N = 5
441 mg/kg
N = 5
881 mg/kg
N = 5
Urea Nitrogen
(mg/dL)
12.0 ± 0.8 11.6 ± 0.7 12.8 ± 1.3 13.8 ± 0.7 13.2 ± 1.2 30.6 ± 17.2
Creatinine (mg/dL) 0.29 ± 0.01 0.28 ± 0.01 0.29 ± 0.02 0.26 ± 0.01 0.29 ± 0.01 0.4 ± 0.11
Total Protein (g/dL) 5.94 ± 0.13 5.92 ± 0.14 5.9 ± 0.07 6.06 ± 0.08 6.12 ± 0.1 5.84 ± 0.15
Globulin (g/dL) 2.5 ± 0.07** 2.56 ± 0.07 2.52 ± 0.05 2.66 ± 0.05 2.76 ± 0.06 2.72 ± 0.15
A/G Ratio 1.38 ± 0.03** 1.31 ± 0.01 1.34 ± 0.02 1.28 ± 0.02* 1.22 ± 0.03** 1.16 ± 0.07**
Albumin (g/dL) 3.44 ± 0.07* 3.36 ± 0.07 3.38 ± 0.04 3.4 ± 0.04 3.36 ± 0.06 3.12 ± 0.06*
Cholesterol (mg/dL) 101.0 ± 5.8** 115.0 ± 6.5 122.4 ± 6.2 127.8 ± 6.3* 145.4 ± 7.3** 170.0 ± 19.4**
Triglyceride (mg/dL) 54.0 ± 6.0* 53.8 ± 1.4 61.6 ± 6.8 74.0 ± 6.1 53.0 ± 5.3 140.6 ± 59.1
LDL Cholesterol
(mg/dL)
21.8 ± 0.7** 21.8 ± 1.1 23.2 ± 0.9 23.8 ± 1.5 23.4 ± 1.1 32.8 ± 6.4*
HDL Cholesterol
(mg/dL)
46.0 ± 2.9** 54.6 ± 2.7 56.8 ± 2.8* 60.6 ± 2.9** 70.6 ± 3.2** 78.2 ± 5.1**
Alanine
Aminotransferase
(IU/L)
61.4 ± 4.46 77.4 ± 6.55 63.8 ± 5.54 65.0 ± 5.37 65.6 ± 6.25 116.6 ± 32.1
Aspartate
Aminotransferase
(U/L)
107.4 ± 10.21 94.6 ± 10.38 97.8 ± 9.82 73.0 ± 2.17* 80.8 ± 9.89 150.8 ± 46.99
Sorbitol
Dehydrogenase
(IU/L)
10.4 ± 0.7 11.8 ± 1.1 12.7 ± 1.6 10.4 ± 0.7 10.8 ± 0.7 11.9 ± 1.0
Bile Salt/Acids
(μmol/L)
57.4 ± 8.8 39.5 ± 5.5 26.6 ± 3.2* 37.2 ± 6.3 36.2 ± 10.2 38.9 ± 5.5
Statistical analysis performed by Jonckheere’s (trend) and Shirley’s or Dunn’s (pairwise) tests.
Statistical significance for the control group indicates a significant trend test.
*Statistically significant at p ≤ 0.05.
Statistical significance for a treatment group indicates a significant pairwise test compared to the vehicle control group.
**Statistically significant at p ≤ 0.01.
Table C-4. R07: Hormone Summary
Endpoint
Name
0 mg/kg
N = 5
55 mg/kg
N = 5
110 mg/kg
N = 5
220 mg/kg
N = 5
441 mg/kg
N = 5
881 mg/kg
N = 5
Free Thyroxine
(μg/dL)
5.122 ± 0.227** 5.114 ± 0.196 4.678 ± 0.304 4.274 ± 0.263* 4.066 ± 0.331* 1.870 ± 0.429**
Cholinesterase
(IU/L)
277.4 ± 16.6** 178.4 ± 8.0** 162.6 ± 7.6** 116.6 ± 5.8** 108.8 ± 8.3** 82.8 ± 2.1**
Data are displayed as mean ± standard error of the mean.
Statistical analysis performed by Jonckheere’s (trend) and Shirley’s or Dunn’s (pairwise) tests.
Statistical significance for a treatment group indicates a significant pairwise test compared to the vehicle control group.
Statistical significance for the control group indicates a significant trend test.
*Statistically significant at p ≤ 0.05.
**Statistically significant at p ≤ 0.01.
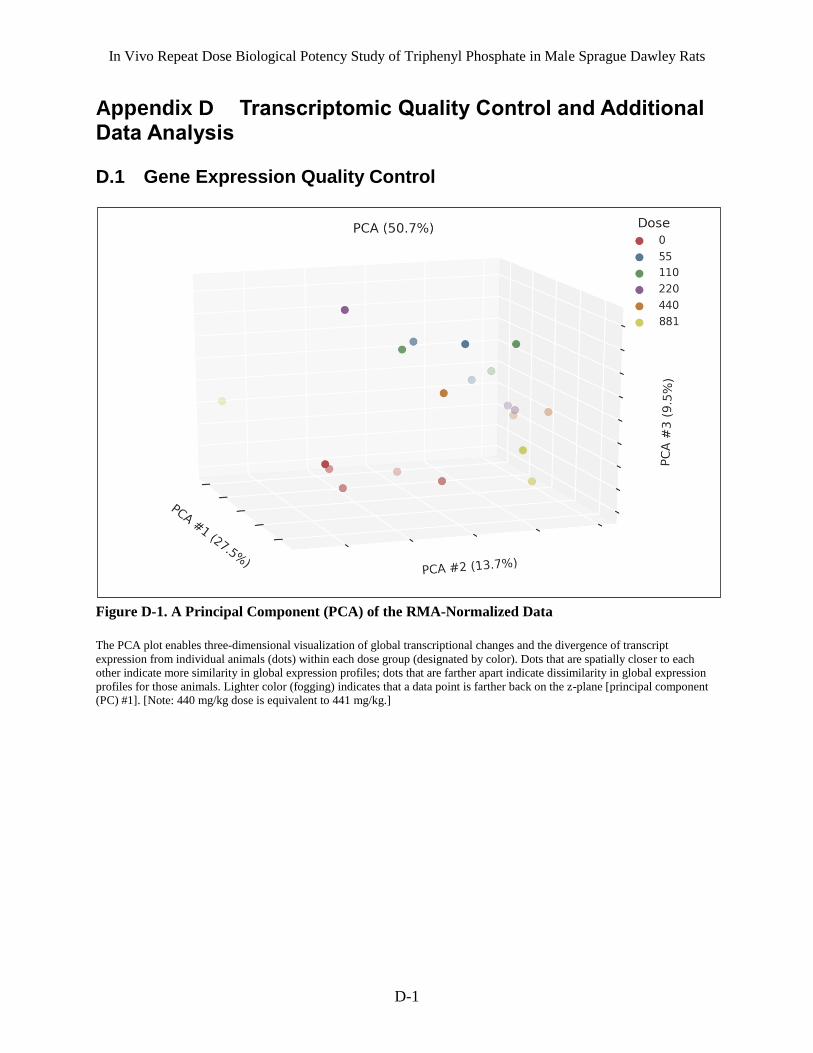
In Vivo Repeat Dose Biological Potency Study of Triphenyl Phosphate in Male Sprague Dawley Rats
D-1
Appendix D Transcriptomic Quality Control and Additional Data Analysis
D.1 Gene Expression Quality Control
Figure D-1. A Principal Component (PCA) of the RMA-Normalized Data
The PCA plot enables three-dimensional visualization of global transcriptional changes and the divergence of transcript
expression from individual animals (dots) within each dose group (designated by color). Dots that are spatially closer to each
other indicate more similarity in global expression profiles; dots that are farther apart indicate dissimilarity in global expression
profiles for those animals. Lighter color (fogging) indicates that a data point is farther back on the z-plane [principal component
(PC) #1]. [Note: 440 mg/kg dose is equivalent to 441 mg/kg.]

In Vivo Repeat Dose Biological Potency Study of Triphenyl Phosphate in Male Sprague Dawley Rats
D-2
D.2 Additional Data Analysis
Figure D-2. An Alternative View of the Principal Component (PCA) of the RMA-Normalized Data
This alternative view of the PCA plot enables visualization of global transcriptional changes in two dimensions, with each plot
showing a different angle, based on the principle components plotted. Global transcript data are shown for individual animals
(dots) within each dose group (designated by color). Dots that are spatially closer to each other indicate more similarity in global
expression profiles; dots that are farther apart indicate dissimilarity in global expression profiles for those animals. [Note:
440 mg/kg dose is equivalent to 441 mg/kg.]
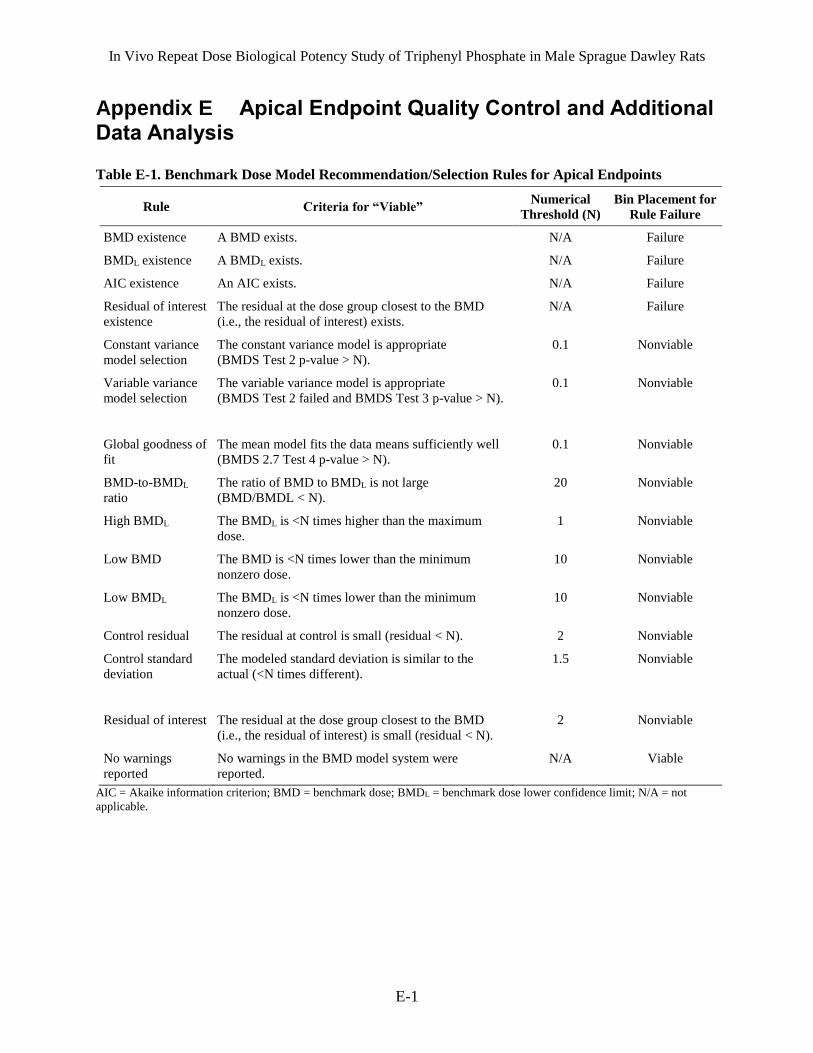
In Vivo Repeat Dose Biological Potency Study of Triphenyl Phosphate in Male Sprague Dawley Rats
E-1
Appendix E Apical Endpoint Quality Control and Additional Data Analysis
Table E-1. Benchmark Dose Model Recommendation/Selection Rules for Apical Endpoints
Rule Criteria for “Viable” Numerical
Threshold (N)
Bin Placement for
Rule Failure
BMD existence A BMD exists. N/A Failure
BMDL existence A BMDL exists. N/A Failure
AIC existence An AIC exists. N/A Failure
Residual of interest
existence
The residual at the dose group closest to the BMD
(i.e., the residual of interest) exists.
N/A Failure
Constant variance
model selection
The constant variance model is appropriate
(BMDS Test 2 p-value > N).
0.1 Nonviable
Variable variance
model selection
The variable variance model is appropriate
(BMDS Test 2 failed and BMDS Test 3 p-value > N).
0.1 Nonviable
Global goodness of
fit
The mean model fits the data means sufficiently well
(BMDS 2.7 Test 4 p-value > N).
0.1 Nonviable
BMD-to-BMDL
ratio
The ratio of BMD to BMDL is not large
(BMD/BMDL < N).
20 Nonviable
High BMDL The BMDL is <N times higher than the maximum
dose.
1 Nonviable
Low BMD The BMD is <N times lower than the minimum
nonzero dose.
10 Nonviable
Low BMDL The BMDL is <N times lower than the minimum
nonzero dose.
10 Nonviable
Control residual The residual at control is small (residual < N). 2 Nonviable
Control standard
deviation
The modeled standard deviation is similar to the
actual (<N times different).
1.5 Nonviable
Residual of interest The residual at the dose group closest to the BMD
(i.e., the residual of interest) is small (residual < N).
2 Nonviable
No warnings
reported
No warnings in the BMD model system were
reported.
N/A Viable
AIC = Akaike information criterion; BMD = benchmark dose; BMDL = benchmark dose lower confidence limit; N/A = not
applicable.

In Vivo Repeat Dose Biological Potency Study of Triphenyl Phosphate in Male Sprague Dawley Rats
E-2
Figure E-1. Benchmark Dose Model Recommendation/Selection Methodology for Automated
Benchmark Dose Execution of Apical Endpoints
Source: Figure from Wignall et al. 201420.

In Vivo Repeat Dose Biological Potency Study of Triphenyl Phosphate in Male Sprague Dawley Rats
E-3
Figure E-2. Benchmark Dose Model Recommendation/Selection Methodology for Benchmark Dose
Execution of Gene Sets with Expression Changes Enacted by Chemical Exposure
Adapted from Thomas et al. 25.
Abbreviations: AIC = Akaike information criterion; BMD = benchmark dose; BMDL = benchmark dose lower confidence limit;
BMDU = BMD upper confidence limit; GGOF = global goodness of fit; GO = Gene Ontogeny.
Gene expression dose response data
Identify features that are affected by treatment (significant Williams trend test and fold change cut-off >|1.5|)
Fit 8 dose-response models to data from each transcript affected by treatment
Power Model
Hill Model
Exp2Model
Exp3Model
Exp4Model
Exp5Model
LinearModel
Poly2Model
Report best model based on lowest AIC
Group genes by annotated gene sets (e.g., GO Biological Processes)
Report gene set potency based on median gene BMDL
Remove models with non-convergent BMD, BMDL or BMDU values
Remove features where best model GGOF p-value <0.1, BMDU/BMDL >40, or BMD >highest dose tested
Map features to genes and remove features that map to more than one gene
Identify “active” gene sets (≥3 genes and ≥5% populated) Flag and provide default threshold BMD, BMDL,
BMDU for gene sets with median BMD values 3-fold < lowest positive
dose

National Toxicology ProgramNTP Central Data Managment, MD K2-05National Insitute of Enviromental Health SciencesP.O. Box 12233Research Triangle Park, NC 27709
http://ntp.niehs.nih.gov
ISSN 2473-4756