Embed Size (px)
Citation preview
© 2019 Electric Power Research Institute, Inc. All rights reserved. w w w . e p r i . c o m
Sherry Bernhoft EPRI Senior Program Manager 2019 IEA Workshop on Nuclear Power 25 February 2019
Nuclear Mission in
an Integrated
Energy Future Nuclear Power in a Clean Energy System
Date: Add submission date and/or revision date & #
© 2019 Electric Power Research Institute, Inc. All rights reserved. w w w . e p r i . c o m 2
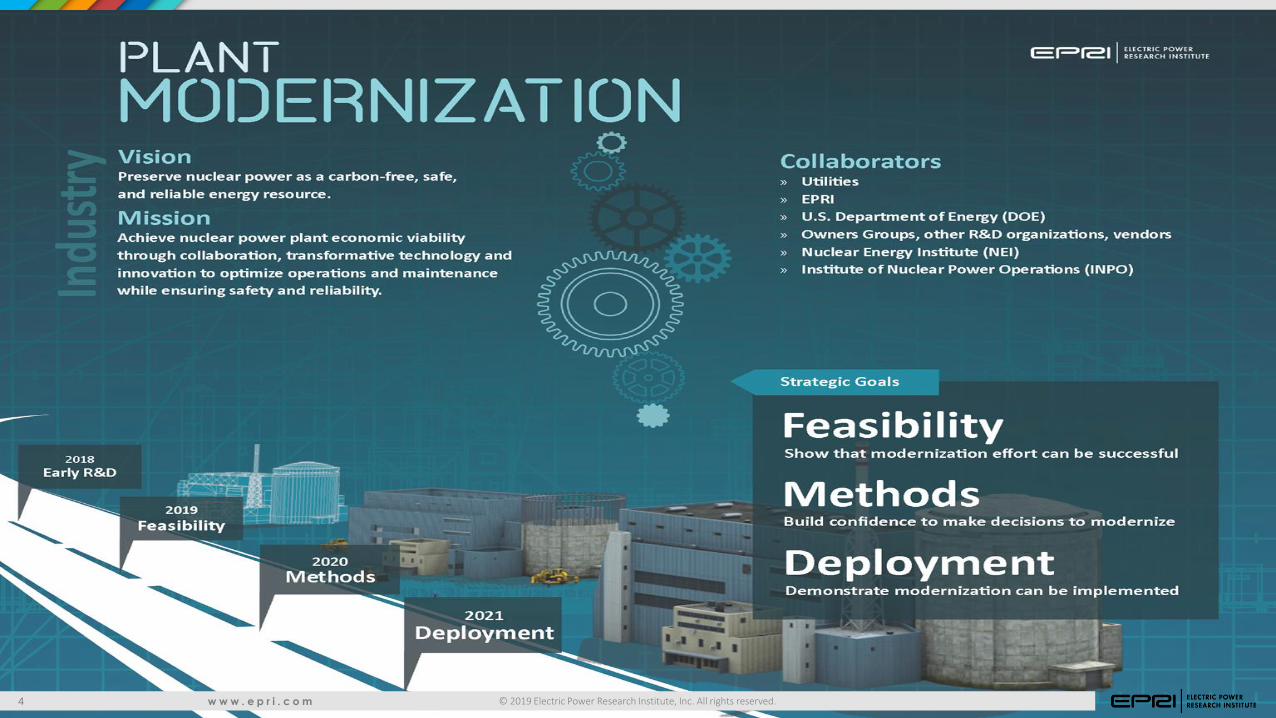
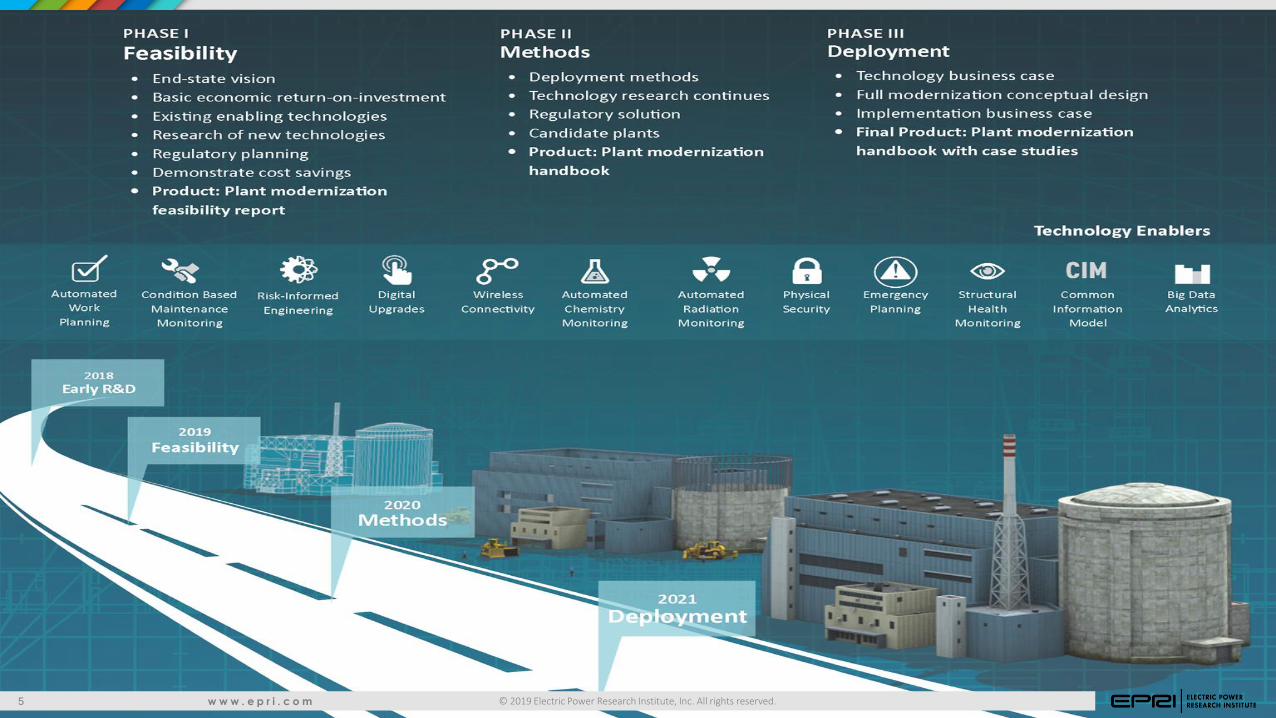
Sustained Nuclear Power in a Clean Energy System
Long Term Operations/Extended Operations
Investment in Plant Modernization to Improve Efficiencies & Reduce Costs
State the Nuclear Role in a Clean Energy System:
– Carbon-free
– Large synchronous generator
– Fuel diversity
– Provides system flexibility
© 2019 Electric Power Research Institute, Inc. All rights reserved. w w w . e p r i . c o m 3
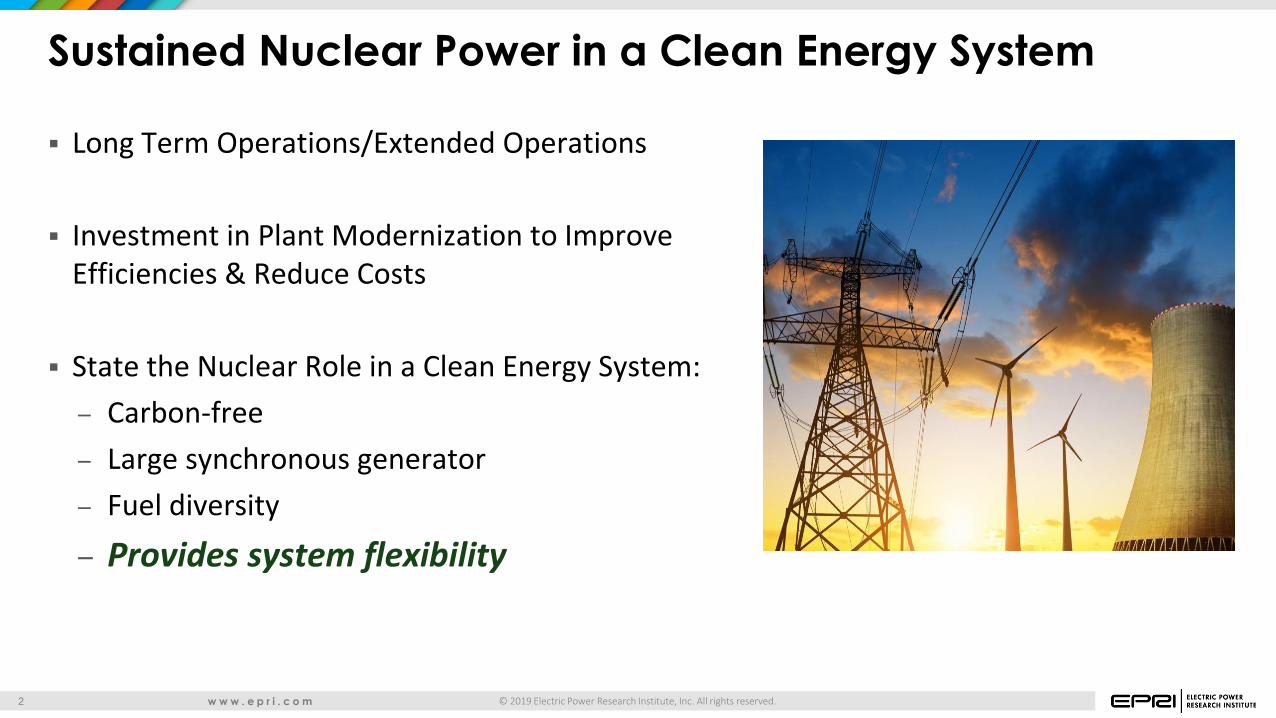
U.S. Second License Renewal (SLR)
Experience from 99 U.S. operating reactors:
– Greater than 80% have an approved LR for 40 to 60 years
– Greater than 50% have over 40 years of operations
Regulatory basis for SLR, 60 to 80 years is established:
– Generic Aging Lessons Learned Report (GALL) for SLR
Technical basis for SLR is established:
– Aging Management Programs are in use
– Living programs supported by research and operating experience
Three (3) SLR Applications submitted to the U.S. Nuclear Regulatory Commission
– Based on a recent survey ~ 50% of the utilities in the U.S. are considering SLR
Building on a Success Story for Global Life Extension
Turkey Point
Surry
Peach Bottom
© 2019 Electric Power Research Institute, Inc. All rights reserved. w w w . e p r i . c o m 4
© 2019 Electric Power Research Institute, Inc. All rights reserved. w w w . e p r i . c o m 5
© 2019 Electric Power Research Institute, Inc. All rights reserved. w w w . e p r i . c o m 6
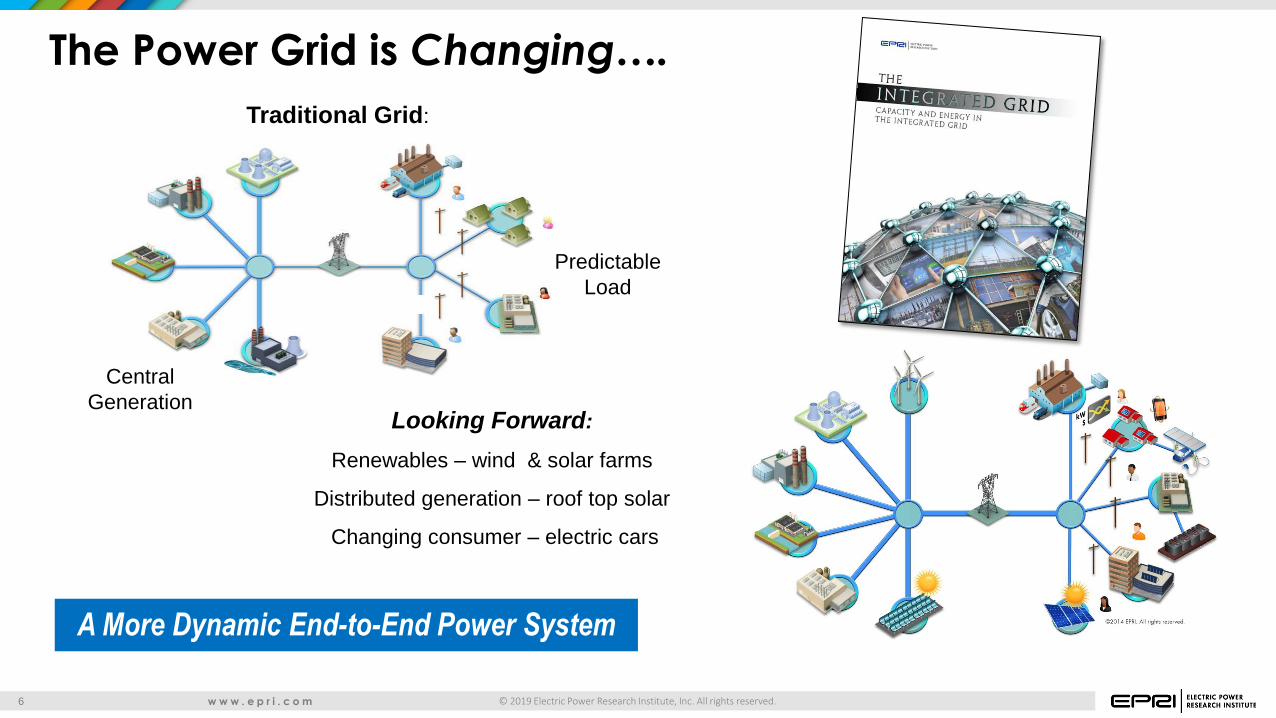
The Power Grid is Changing….
A More Dynamic End-to-End Power System
Traditional Grid:
Central
Generation
Predictable
Load
Looking Forward:
Renewables – wind & solar farms
Distributed generation – roof top solar
Changing consumer – electric cars
© 2019 Electric Power Research Institute, Inc. All rights reserved. w w w . e p r i . c o m 7
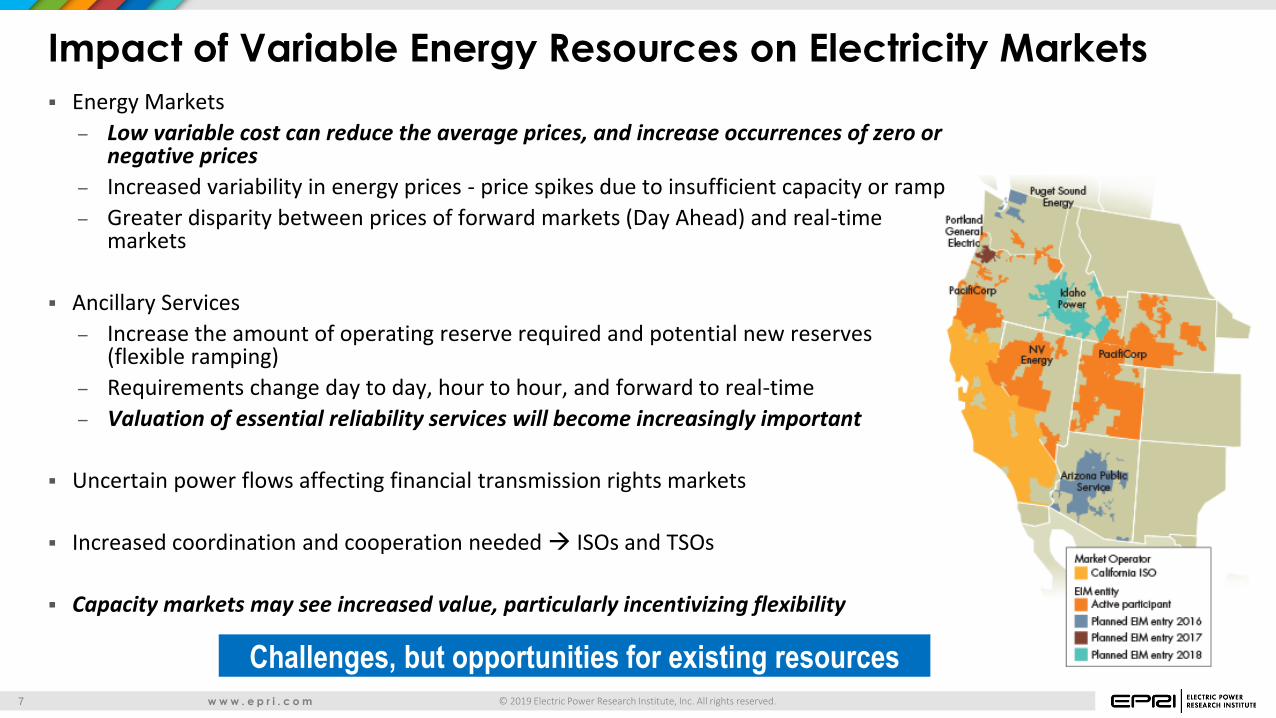
Impact of Variable Energy Resources on Electricity Markets
Energy Markets
– Low variable cost can reduce the average prices, and increase occurrences of zero or negative prices
– Increased variability in energy prices - price spikes due to insufficient capacity or ramp
– Greater disparity between prices of forward markets (Day Ahead) and real-time markets
Ancillary Services
– Increase the amount of operating reserve required and potential new reserves (flexible ramping)
– Requirements change day to day, hour to hour, and forward to real-time
– Valuation of essential reliability services will become increasingly important
Uncertain power flows affecting financial transmission rights markets
Increased coordination and cooperation needed ISOs and TSOs
Capacity markets may see increased value, particularly incentivizing flexibility
Challenges, but opportunities for existing resources
© 2019 Electric Power Research Institute, Inc. All rights reserved. w w w . e p r i . c o m 8
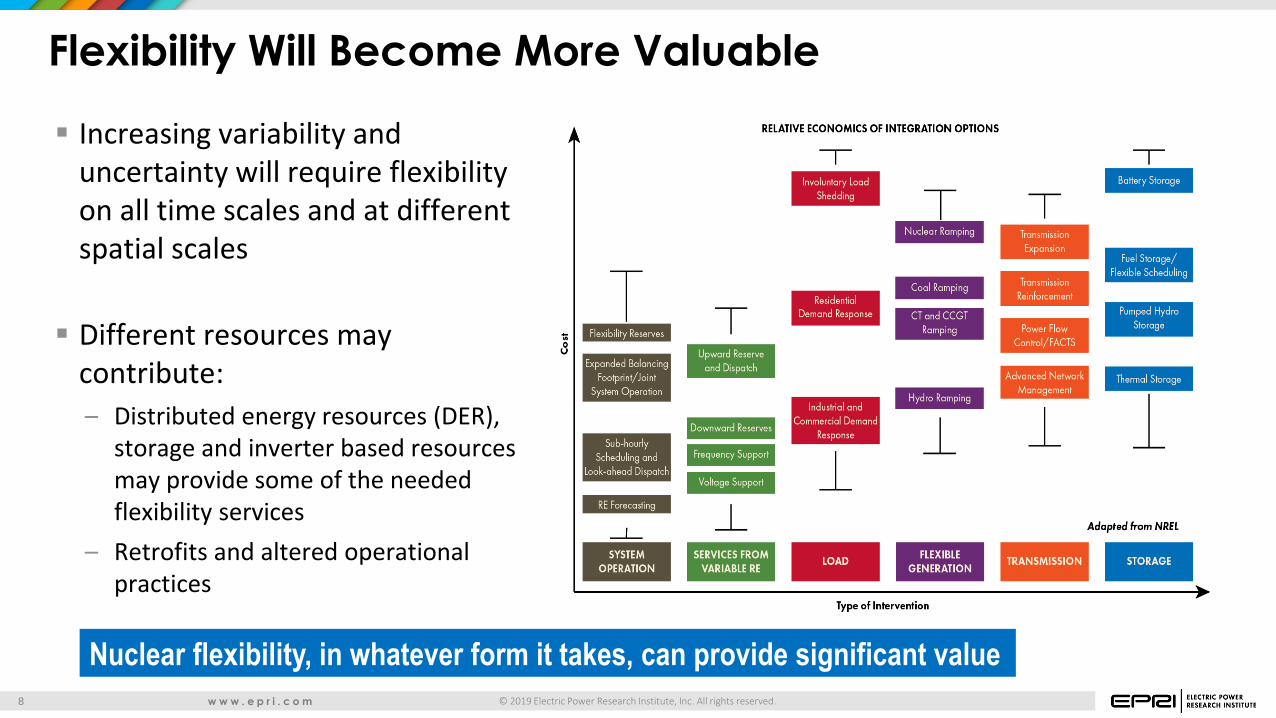
Flexibility Will Become More Valuable
Nuclear flexibility, in whatever form it takes, can provide significant value
Increasing variability and uncertainty will require flexibility on all time scales and at different spatial scales
Different resources may contribute:
– Distributed energy resources (DER), storage and inverter based resources may provide some of the needed flexibility services
– Retrofits and altered operational practices
© 2019 Electric Power Research Institute, Inc. All rights reserved. w w w . e p r i . c o m 9
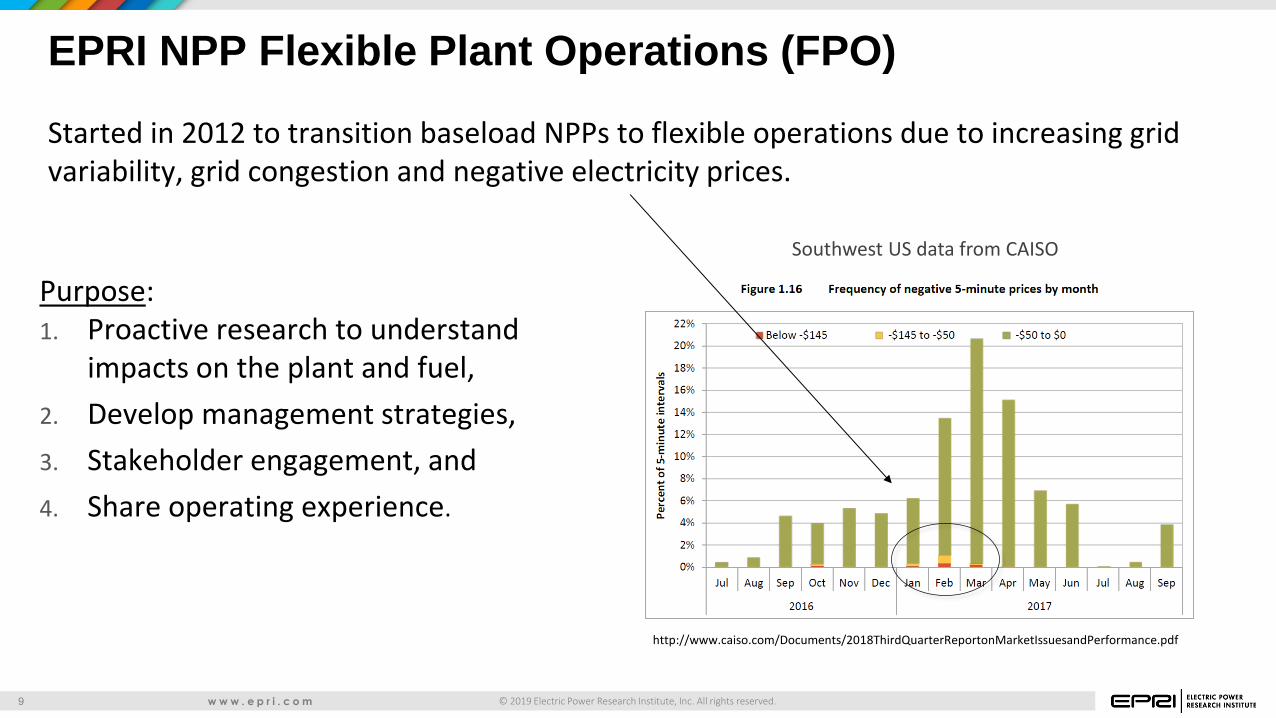
EPRI NPP Flexible Plant Operations (FPO)
Started in 2012 to transition baseload NPPs to flexible operations due to increasing grid variability, grid congestion and negative electricity prices.
Purpose: 1. Proactive research to understand
impacts on the plant and fuel,
2. Develop management strategies,
3. Stakeholder engagement, and
4. Share operating experience.
http://www.caiso.com/Documents/2018ThirdQuarterReportonMarketIssuesandPerformance.pdf
Southwest US data from CAISO
© 2019 Electric Power Research Institute, Inc. All rights reserved. w w w . e p r i . c o m 10
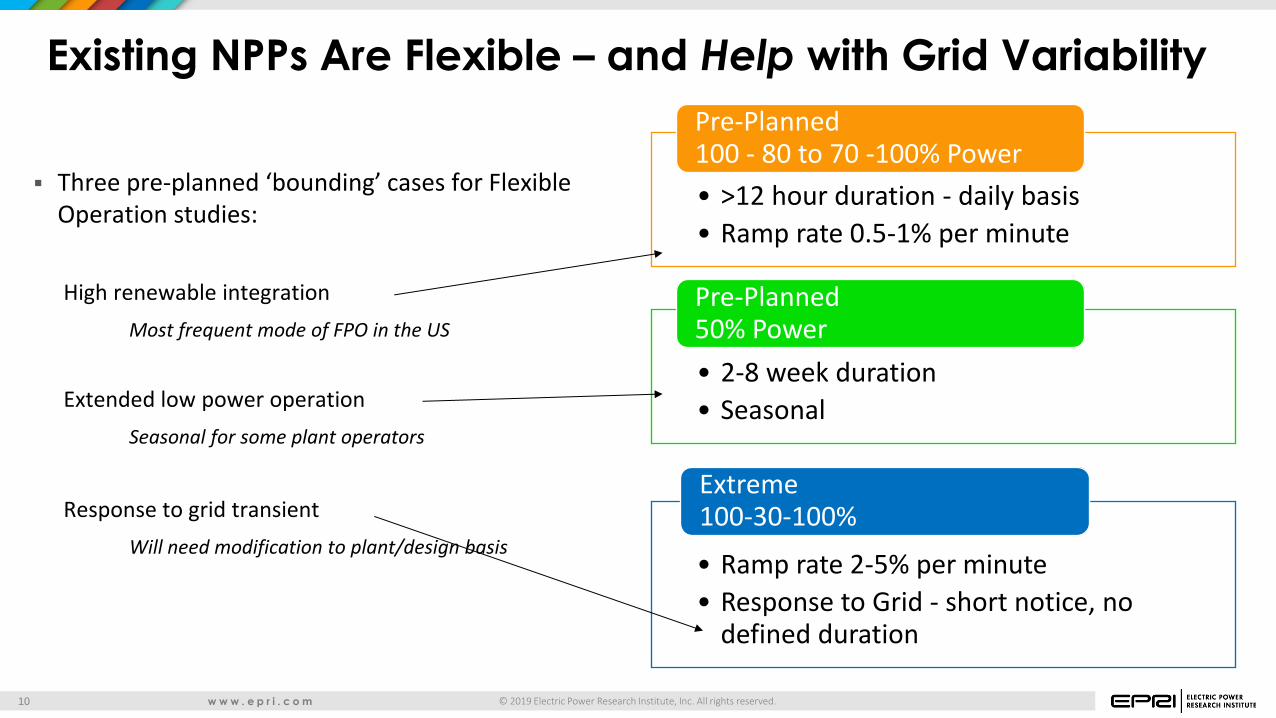
Existing NPPs Are Flexible – and Help with Grid Variability
Three pre-planned ‘bounding’ cases for Flexible Operation studies:
High renewable integration
Most frequent mode of FPO in the US
Extended low power operation
Seasonal for some plant operators
Response to grid transient
Will need modification to plant/design basis
• >12 hour duration - daily basis
• Ramp rate 0.5-1% per minute
Pre-Planned 100 - 80 to 70 -100% Power
• 2-8 week duration
• Seasonal
Pre-Planned 50% Power
• Ramp rate 2-5% per minute
• Response to Grid - short notice, no defined duration
Extreme 100-30-100%
© 2019 Electric Power Research Institute, Inc. All rights reserved. w w w . e p r i . c o m 11
Ni2+
Ni2+
Ni2+
Ni2+
Ni2+
Fe2+
Fe2+
Fe2+
Fe2+
Fe2+ NiO
NiFe2O4
Ni°
Ni2+
555°F 290°C
325°C 618°F
Fe2+
Ni°
Ni2+
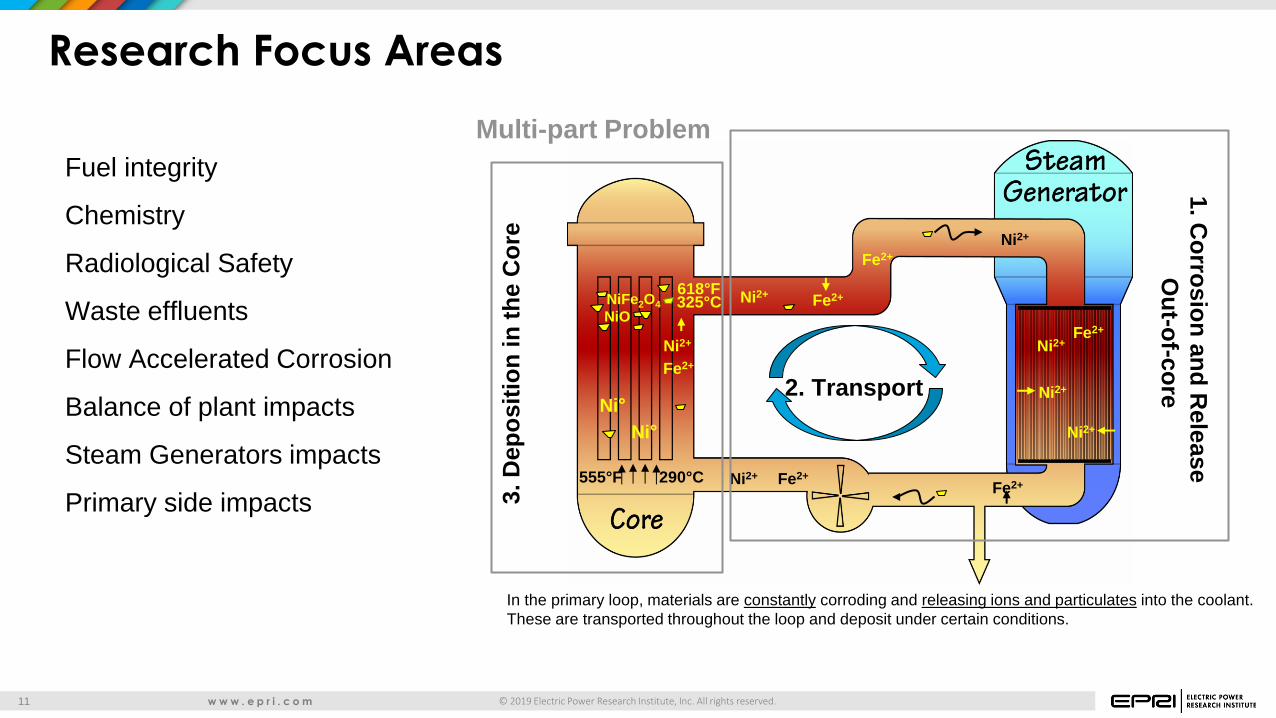
Research Focus Areas
In the primary loop, materials are constantly corroding and releasing ions and particulates into the coolant.
These are transported throughout the loop and deposit under certain conditions.
Multi-part Problem
3. D
ep
osit
ion
in
th
e C
ore
1. C
orro
sio
n a
nd
Rele
ase
Ou
t-of-c
ore
2. Transport
Fuel integrity
Chemistry
Radiological Safety
Waste effluents
Flow Accelerated Corrosion
Balance of plant impacts
Steam Generators impacts
Primary side impacts
© 2019 Electric Power Research Institute, Inc. All rights reserved. w w w . e p r i . c o m 12
What We Have Learned …
Best Practices: – Establish integrated team to transition and monitor for impacts – Define a ‘safe operating envelope’* and train the operators and
plant staff – Establish a protocol with ISO/TSO – in the U.S. and other countries
only a licensed operator can maneuver the plant
Observations: – Chemistry is challenged – needs more frequent monitoring – Core internals inspection frequency may need to be increased – Flow accelerated corrosion wear rates change – Maintenance schedules and practices need to be reviewed and
adjusted – Most plant impacts are latent – need to be checking for precursors
such as vibrations or unexpected noises
*Safe operating envelope:
Define the rate, depth, duration, frequency and time in core life
Flexible Operations is being successfully implemented with manageable impacts
© 2019 Electric Power Research Institute, Inc. All rights reserved. w w w . e p r i . c o m 13
Example – Wind Energy Impacts on Nuclear in the US
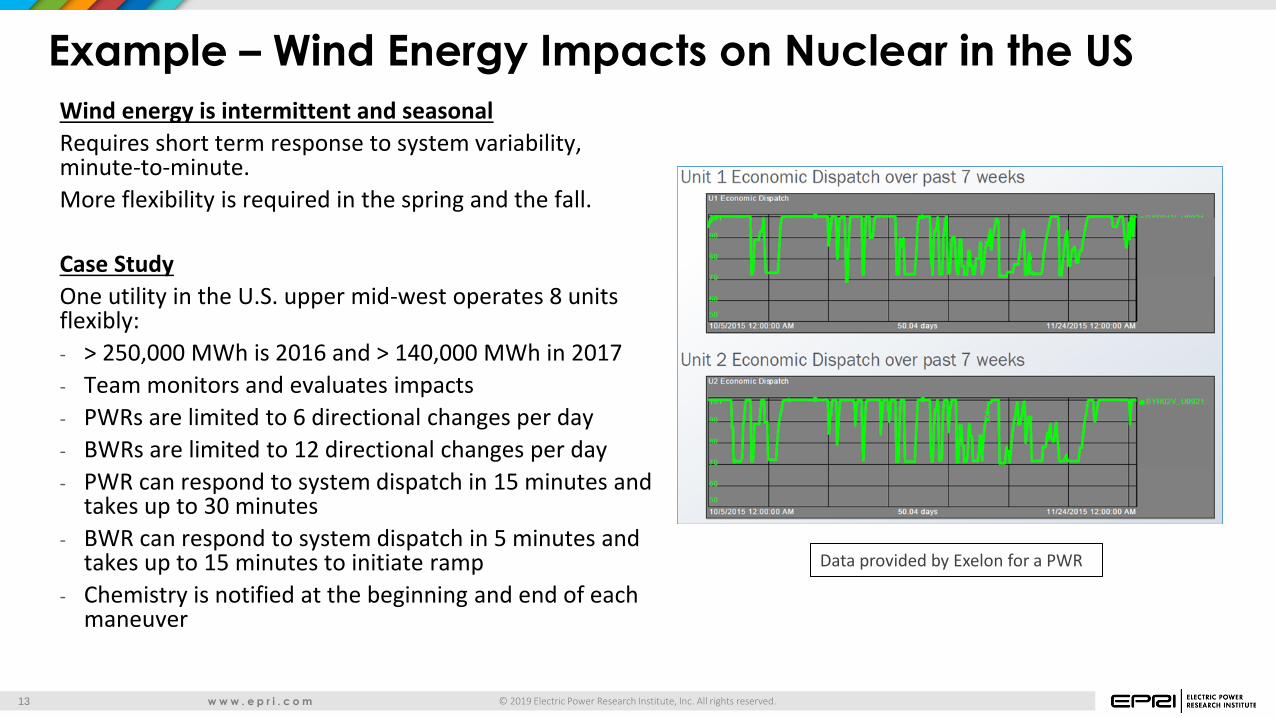
Wind energy is intermittent and seasonal
Requires short term response to system variability, minute-to-minute.
More flexibility is required in the spring and the fall.
Case Study
One utility in the U.S. upper mid-west operates 8 units flexibly:
- > 250,000 MWh is 2016 and > 140,000 MWh in 2017
- Team monitors and evaluates impacts
- PWRs are limited to 6 directional changes per day
- BWRs are limited to 12 directional changes per day
- PWR can respond to system dispatch in 15 minutes and takes up to 30 minutes
- BWR can respond to system dispatch in 5 minutes and takes up to 15 minutes to initiate ramp
- Chemistry is notified at the beginning and end of each maneuver
Data provided by Exelon for a PWR
© 2019 Electric Power Research Institute, Inc. All rights reserved. w w w . e p r i . c o m 14
Example – Hydro Impacts on a Nuclear Plant in the US
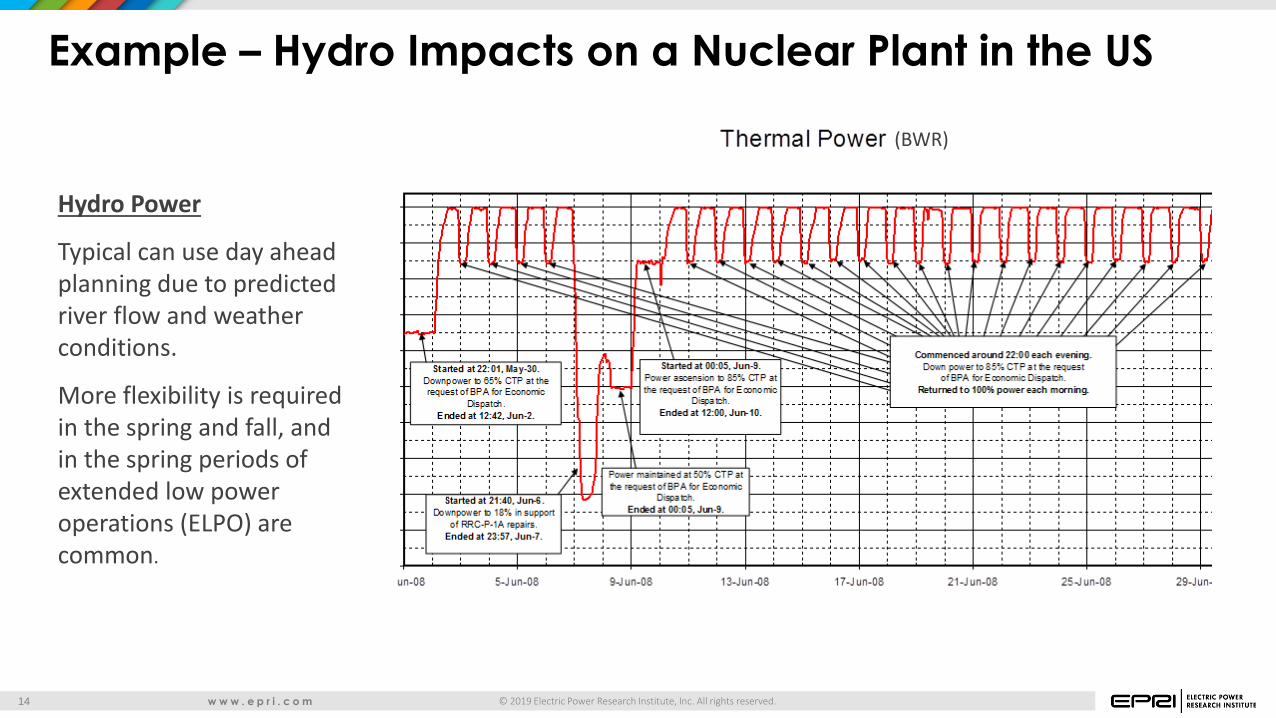
Hydro Power
Typical can use day ahead planning due to predicted river flow and weather conditions.
More flexibility is required in the spring and fall, and in the spring periods of extended low power operations (ELPO) are common.
(BWR)
© 2019 Electric Power Research Institute, Inc. All rights reserved. w w w . e p r i . c o m 15
Example – Solar Impacts on Nuclear in the US
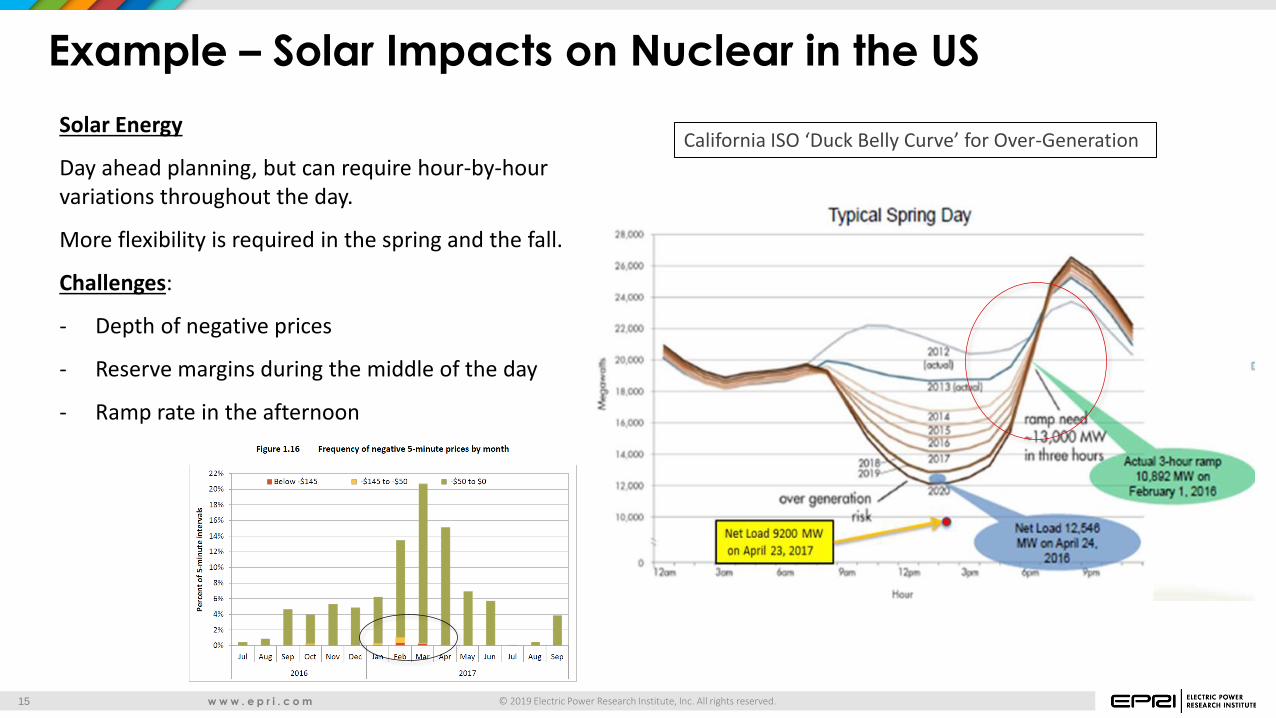
Solar Energy
Day ahead planning, but can require hour-by-hour variations throughout the day.
More flexibility is required in the spring and the fall.
Challenges:
- Depth of negative prices
- Reserve margins during the middle of the day
- Ramp rate in the afternoon
California ISO ‘Duck Belly Curve’ for Over-Generation
© 2019 Electric Power Research Institute, Inc. All rights reserved. w w w . e p r i . c o m 16
What Role Can Energy Storage Play?
© 2019 Electric Power Research Institute, Inc. All rights reserved. w w w . e p r i . c o m 17
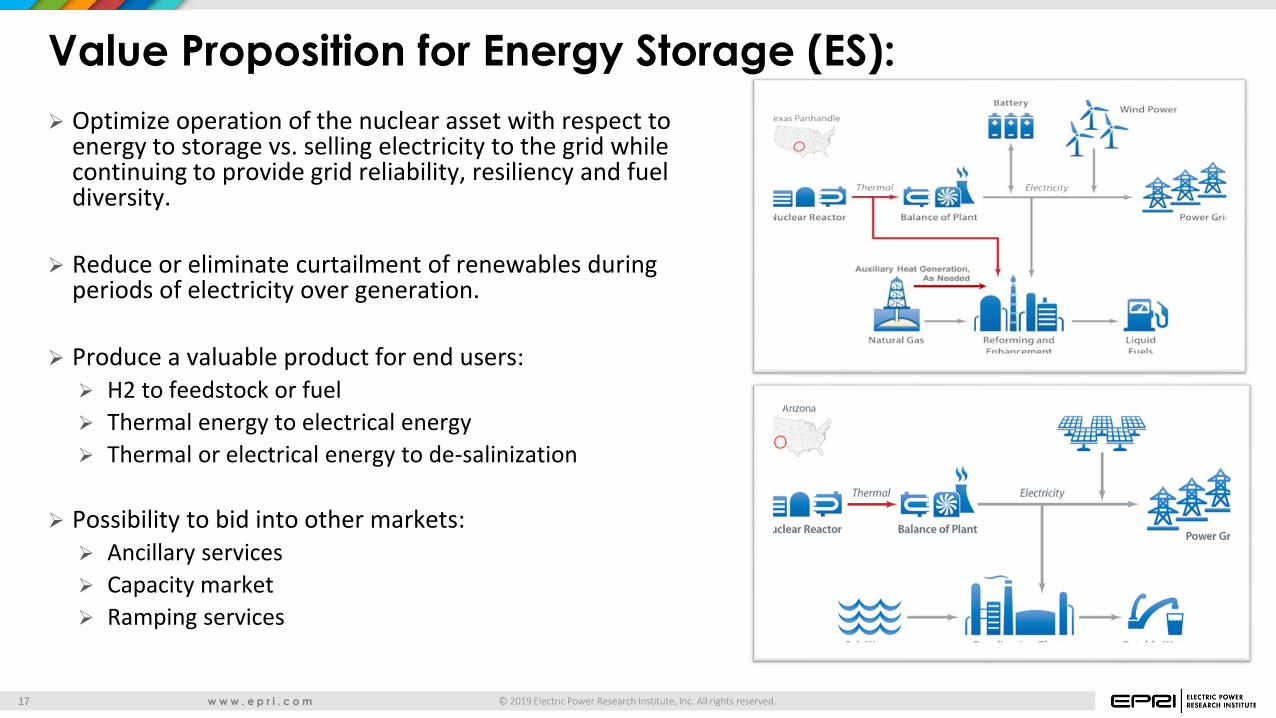
Value Proposition for Energy Storage (ES):
Optimize operation of the nuclear asset with respect to energy to storage vs. selling electricity to the grid while continuing to provide grid reliability, resiliency and fuel diversity.
Reduce or eliminate curtailment of renewables during periods of electricity over generation.
Produce a valuable product for end users: H2 to feedstock or fuel
Thermal energy to electrical energy
Thermal or electrical energy to de-salinization
Possibility to bid into other markets: Ancillary services
Capacity market
Ramping services
© 2019 Electric Power Research Institute, Inc. All rights reserved. w w w . e p r i . c o m 18
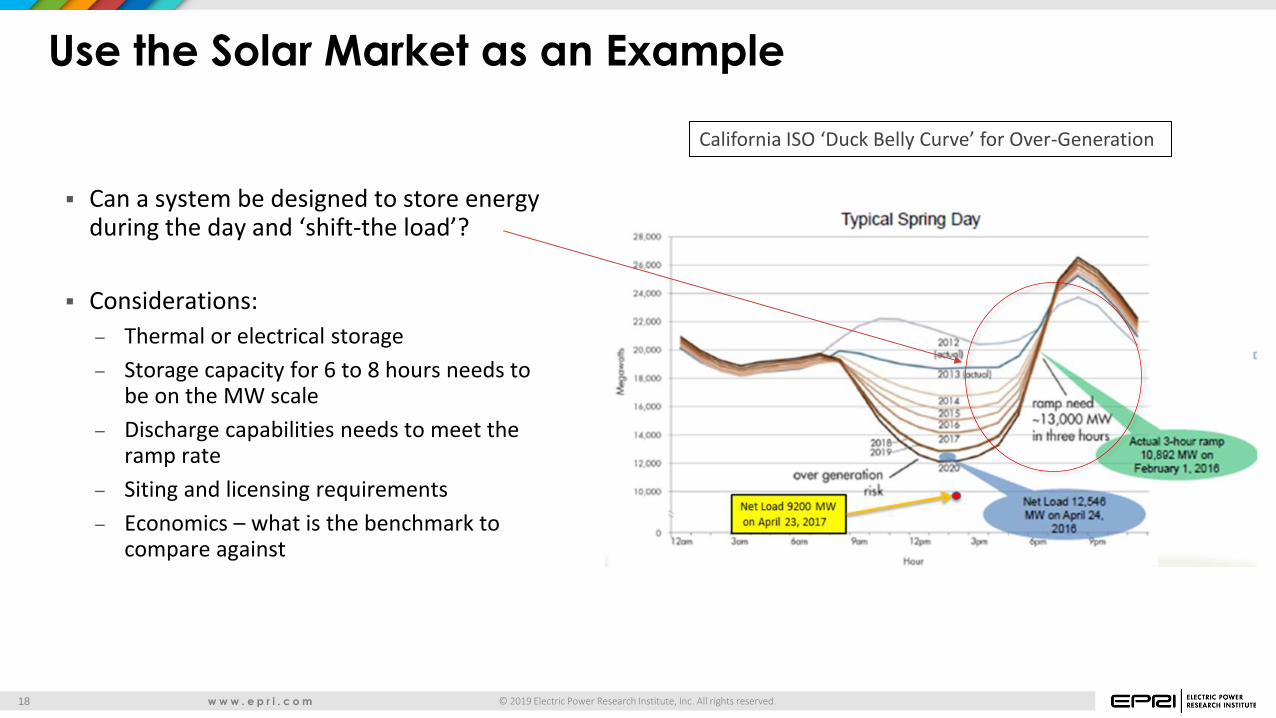
Use the Solar Market as an Example
Can a system be designed to store energy during the day and ‘shift-the load’?
Considerations:
– Thermal or electrical storage
– Storage capacity for 6 to 8 hours needs to be on the MW scale
– Discharge capabilities needs to meet the ramp rate
– Siting and licensing requirements
– Economics – what is the benchmark to compare against
California ISO ‘Duck Belly Curve’ for Over-Generation
© 2019 Electric Power Research Institute, Inc. All rights reserved. w w w . e p r i . c o m 19
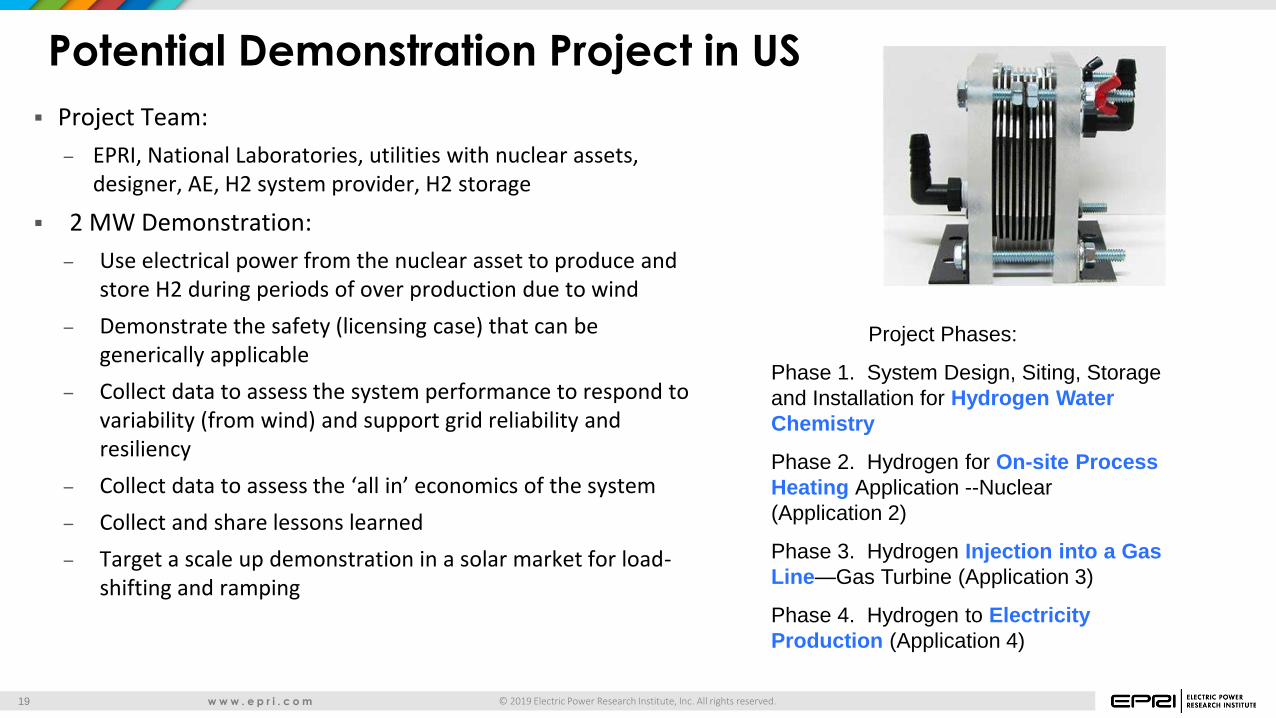
Potential Demonstration Project in US
Project Team:
– EPRI, National Laboratories, utilities with nuclear assets, designer, AE, H2 system provider, H2 storage
2 MW Demonstration:
– Use electrical power from the nuclear asset to produce and store H2 during periods of over production due to wind
– Demonstrate the safety (licensing case) that can be generically applicable
– Collect data to assess the system performance to respond to variability (from wind) and support grid reliability and resiliency
– Collect data to assess the ‘all in’ economics of the system
– Collect and share lessons learned
– Target a scale up demonstration in a solar market for load-shifting and ramping
Project Phases:
Phase 1. System Design, Siting, Storage
and Installation for Hydrogen Water
Chemistry
Phase 2. Hydrogen for On-site Process
Heating Application --Nuclear
(Application 2)
Phase 3. Hydrogen Injection into a Gas
Line—Gas Turbine (Application 3)
Phase 4. Hydrogen to Electricity
Production (Application 4)
© 2019 Electric Power Research Institute, Inc. All rights reserved. w w w . e p r i . c o m 20
Electricity Markets –Some Closing Thoughts
© 2019 Electric Power Research Institute, Inc. All rights reserved. w w w . e p r i . c o m 21
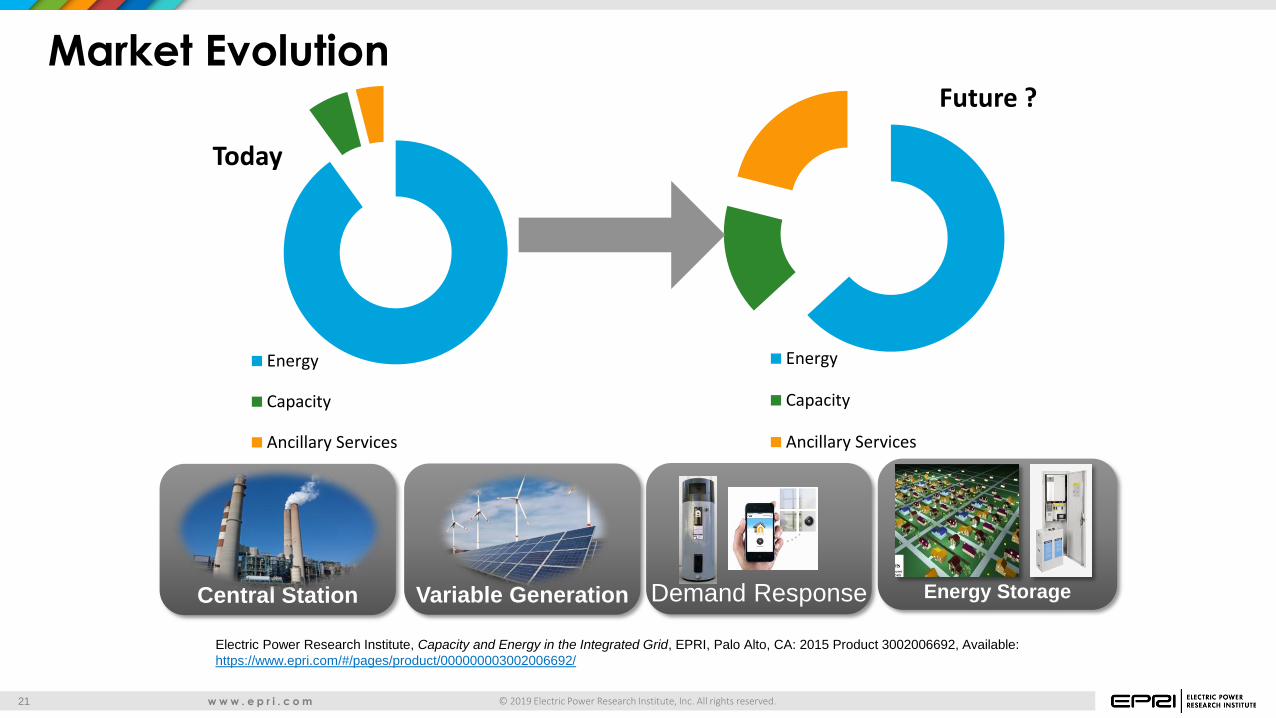
Today
Energy
Capacity
Ancillary Services
Future ?
Energy
Capacity
Ancillary Services
Central Station Energy Storage Demand Response
Market Evolution
Variable Generation
Electric Power Research Institute, Capacity and Energy in the Integrated Grid, EPRI, Palo Alto, CA: 2015 Product 3002006692, Available:
https://www.epri.com/#/pages/product/000000003002006692/
© 2019 Electric Power Research Institute, Inc. All rights reserved. w w w . e p r i . c o m 22
What does Mr. Webster or Mrs. Oxford say?
Reliability:
– Consistently good in quality of performance, able to be trusted
– Suitable or fit to be relied on
Resilience
– The capacity to recover quickly from difficulties; toughness
– An ability to recover from or adjust easily to misfortune or change
© 2019 Electric Power Research Institute, Inc. All rights reserved. w w w . e p r i . c o m 23
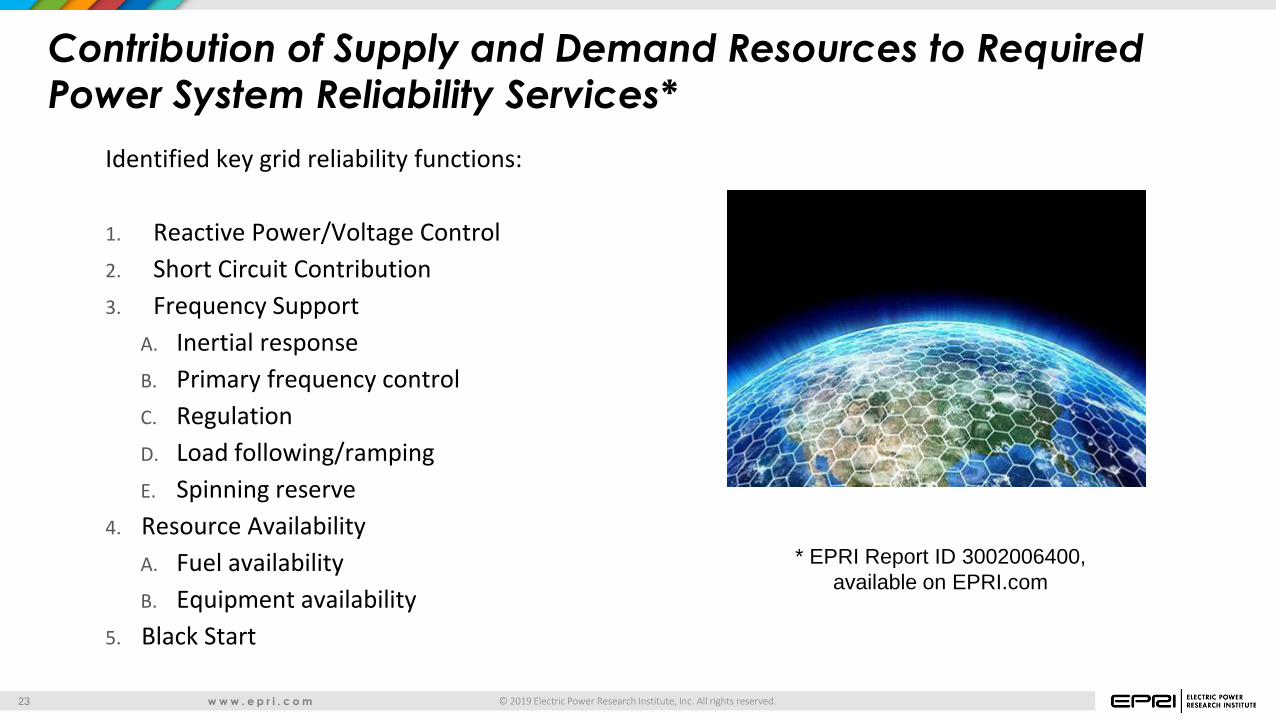
Contribution of Supply and Demand Resources to Required
Power System Reliability Services* Identified key grid reliability functions:
1. Reactive Power/Voltage Control
2. Short Circuit Contribution
3. Frequency Support
A. Inertial response
B. Primary frequency control
C. Regulation
D. Load following/ramping
E. Spinning reserve
4. Resource Availability
A. Fuel availability
B. Equipment availability
5. Black Start
* EPRI Report ID 3002006400,
available on EPRI.com
© 2019 Electric Power Research Institute, Inc. All rights reserved. w w w . e p r i . c o m 24
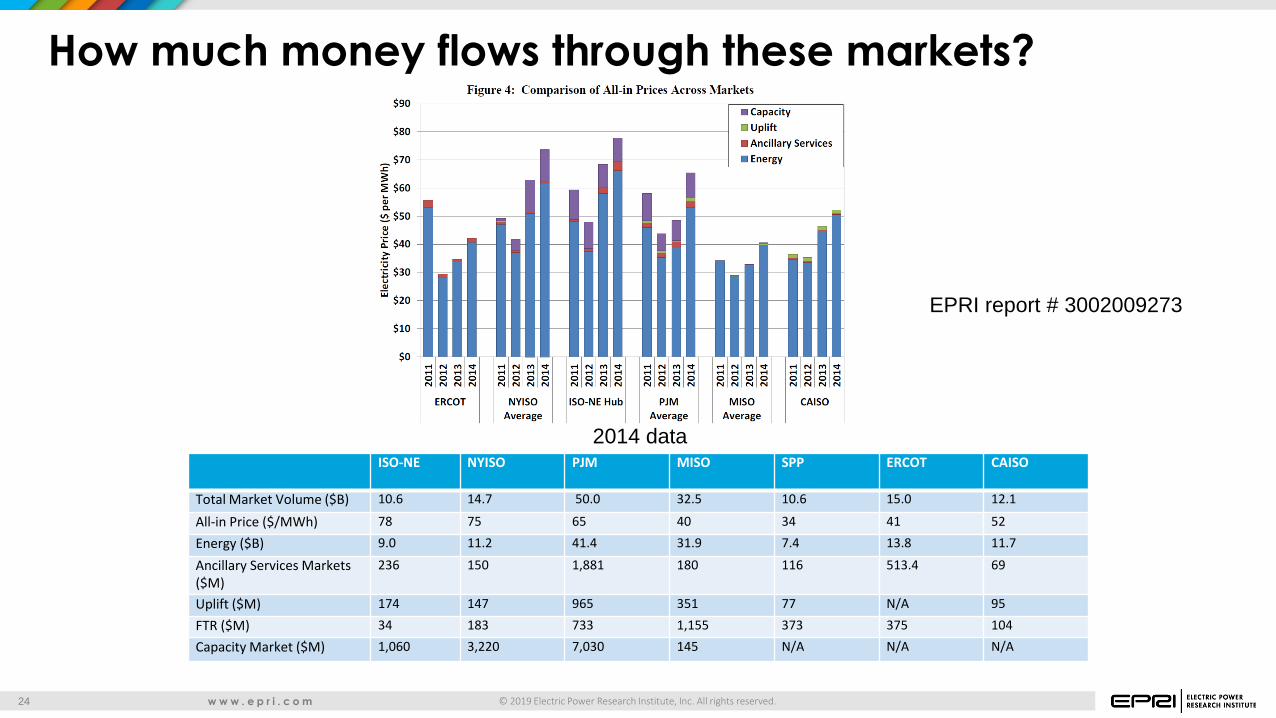
How much money flows through these markets?
Potomac Economics, ERCOT State of the Market Report, 2014
ISO-NE NYISO PJM MISO SPP ERCOT CAISO
Total Market Volume ($B) 10.6 14.7 50.0 32.5 10.6 15.0 12.1
All-in Price ($/MWh) 78 75 65 40 34 41 52
Energy ($B) 9.0 11.2 41.4 31.9 7.4 13.8 11.7
Ancillary Services Markets ($M)
236 150 1,881 180 116 513.4 69
Uplift ($M) 174 147 965 351 77 N/A 95
FTR ($M) 34 183 733 1,155 373 375 104
Capacity Market ($M) 1,060 3,220 7,030 145 N/A N/A N/A
2014 data
EPRI report # 3002009273
© 2019 Electric Power Research Institute, Inc. All rights reserved. w w w . e p r i . c o m 25
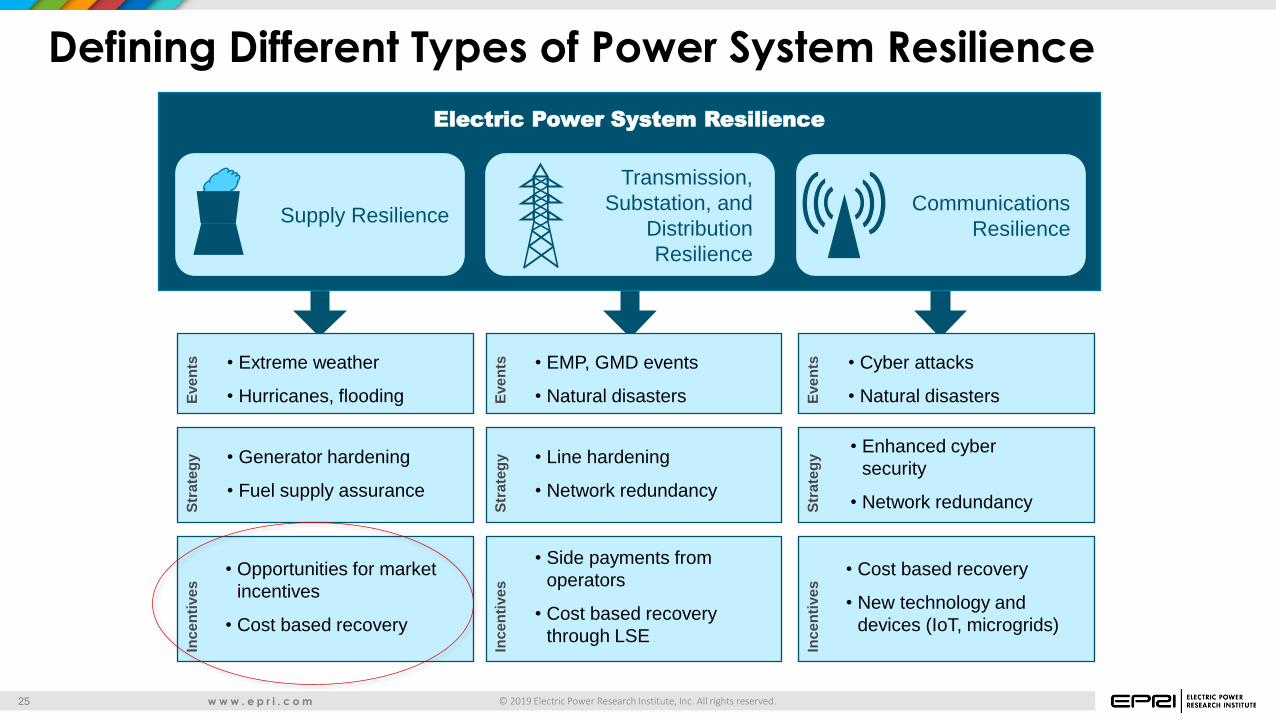
Defining Different Types of Power System Resilience
Ince
nti
ve
s
Str
ate
gy
Electric Power System Resilience
Supply Resilience Communications
Resilience
• Generator hardening
• Fuel supply assurance
• Opportunities for market
incentives
• Cost based recovery
Ince
nti
ve
s
Str
ate
gy
• Line hardening
• Network redundancy
• Side payments from
operators
• Cost based recovery
through LSE
Ince
nti
ve
s
Str
ate
gy • Enhanced cyber
security
• Network redundancy
• Cost based recovery
• New technology and
devices (IoT, microgrids)
Eve
nts
• Extreme weather
• Hurricanes, flooding Eve
nts
• EMP, GMD events
• Natural disasters Eve
nts
• Cyber attacks
• Natural disasters
Transmission,
Substation, and
Distribution
Resilience
© 2019 Electric Power Research Institute, Inc. All rights reserved. w w w . e p r i . c o m 26
Together…Shaping the Future of Electricity