Embed Size (px)
Citation preview

International Journal of Solids and Structures 51 (2014) 1670–1685
Contents lists available at ScienceDirect
International Journal of Solids and Structures
journal homepage: www.elsevier .com/locate / i jsolst r
Numerical analysis of progressive damage in nonwoven fibrousnetworks under tension
http://dx.doi.org/10.1016/j.ijsolstr.2014.01.0150020-7683/� 2014 Elsevier Ltd. All rights reserved.
⇑ Corresponding author. Tel.: +44 1509227504; fax: +44 1509227502.E-mail address: [email protected] (V.V. Silberschmidt).
Farukh Farukh a, Emrah Demirci a, Baris Sabuncuoglu a, Memis� Acar a, Behnam Pourdeyhimi b,Vadim V. Silberschmidt a,⇑a Wolfson School of Mechanical and Manufacturing Engineering, Loughborough University, UKb Nonwovens Cooperative Research Center, North Carolina State University, Raleigh, NC, USA
a r t i c l e i n f o
Article history:Received 24 May 2013Received in revised form 10 December 2013Available online 29 January 2014
Keywords:Non-woven fabricsDamageMicrostructuresFailureFinite element
a b s t r a c t
Understanding a mechanical behaviour of polymer-based nonwoven materials that include large-straindeformation and damage can help to evaluate a response of nonwoven fibrous networks to various load-ing conditions. Here, a nonwoven felt made by thermal bonding of polypropylene fibres was used as amodel system. Its deformation and damage behaviour was analysed by means of experimental assess-ment of damage evolution based on single-fibre failure and finite-element simulations. Tensile tests ofnonwoven fabrics were carried out to characterise their damage behaviour under in-plane mechanicalloading. It was found that progressive failure of fibres led to localization of damage initiation and prop-agation, ultimately resulting in failure of the nonwoven felt. To obtain the criteria that control the onsetand propagation of damage in these materials, tensile tests on single fibres, extracted from the felt withbond points attached to their ends, were performed. A finite-element model was developed to studydamage initiation and propagation in nonwovens. In the model, structural randomness of a nonwovenfibrous network was implemented by means of direct introduction of fibres according to the orientationdistribution function. The evolution of damage in the network was controlled by a single-fibre failure cri-terion obtained experimentally. The proposed numerical model not only captured the macroscopicresponse of the felt successfully but also reproduced the underlying mechanisms involved in deformationand damage of nonwovens.
� 2014 Elsevier Ltd. All rights reserved.
1. Introduction
Nonwoven fibrous networks demonstrate complex deformationand damage behaviour linked to randomness of their microstruc-ture and properties of constituent fibres. In thermally bonded cal-endered nonwovens, a fabric’s structure is composed of continuousand discontinuous regions. These continuous regions called bondpoints are connected by a network of randomly oriented fibresforming a discontinuous region with voids and gaps in it. This com-bination of two regions with different microstructures, with con-tinuous domains embedded into discontinuous medium, makes itdifficult to predict the deformation and damage behaviour of ther-mally bonded fibrous networks. Experimental characterisation isnot always viable and sufficient for a comprehensive understand-ing of complex phenomena involved in deformation and damageof nonwoven fibrous mats. The challenges involved in experimen-tation are linked to the need for specialised experimental devices
as well as to significant efforts required for experimentation, espe-cially for this type of materials, in which mechanical properties aredefined by their non-trivial microstructure and constituent fibres’properties. To tailor and optimise properties of these materials,an understanding of the relationship between their macroscopicbehaviour and microstructure along with manufacturing-definedsingle-fibre properties is essential. Therefore, the aim of this workis to develop a numerical model incorporating the fabric’s micro-structure, properties of constituent fibres and main deformationand damage mechanisms.
The behaviour of woven fibrous networks that are mostly used incomposites for various multi-functional applications, is betterunderstood than that of nonwoven fibrous networks (either asstandalone fabrics or in combination with epoxies in the form ofcomposites) (Li et al., 2010; Blacklock et al., 2012; Rinaldi et al.,2012; Parsons et al., 2013). Still, several studies were performed tomodel and predict the mechanical response of nonwoven fibrousnetworks. Most of the work in this field is related to paper, whichis a very special type of nonwoven (Schulgasser, 1981;Ostoja-Starzewski and Stahl, 2000; Isaksson et al., 2004; Isaksson

F. Farukh et al. / International Journal of Solids and Structures 51 (2014) 1670–1685 1671
and Hagglund, 2007; Isaksson and Hagglund, 2009; Harrysson andRistinmaa, 2008; Bronkhorst, 2003). In the context of nonwoven net-works, several techniques were used to simulate a mechanicalbehaviour of these materials. A continuum model incorporating anorientation distribution of fibres by considering orthotropicsymmetric planes was developed (Demirci et al., 2011, 2012). Thismodel was used successfully to predict the stress–strain behaviourof high-density nonwovens but it was incapable to account forchanges in the network’s topology with localization of damage.Ridruejo et al. (2010, 2012) introduced a continuum model topredict a meso-level response of the fabric without explicit intro-duction of fibres into the model, and thus, it was unable to reproducethe effect of the actual microstructure; mechanisms of fabric’s defor-mation and damage were implemented in a phenomenological way.In order to resolve the issues with continuum models, anothertechnique based on a composite laminate model, incorporating theeffect of non-uniform orientation distribution of fibres, was used(Bais-Singh et al., 1998). In that model, fibre layers were stackedon top of each other in a way that the fibres in each new layer wereat an angle relative to that in the preceding one. This model was un-able to capture all the aspects of the real fabric’s behaviour such asre-orientation of fibres since they were fixed within the layer andcould not slide on top of each other. In an effort to incorporate arealistic non-uniform microstructure of nonwovens into the model,an approach based on homogenisation was developed using a repre-sentative volume element (RVE). Petterson (1959) introduced themodel to predict a macroscopic response of the fabric by homogen-ising the behaviour of a unit cell incorporating a random distributionof fibres’ orientation. More recently, Silberstein et al. (2012)suggested an approach of employing a similar RVE-based techniqueto predict a macroscopic behaviour of the fabric. The model consistsof a multilayer triangular network and uses a homogenisation tech-nique to predict a response to monotonic and cyclic loading. Suchmodels based on the homogenisation technique do not predictlocalization of damage and changes in material’s microstructurecaused by this damage. In order to overcome these shortcomings,microstructure-based models employing direct introduction of indi-vidual fibres according to their orientation distribution were devel-oped (Hou et al., 2009, 2011a, 2011b; Sabuncuoglu et al., 2012;Farukh et al., 2012a). Though this modelling technique is computa-tionally not as efficient as a continuum one, however, it can accountexplicitly for all the main mechanisms involved in deformation andfracture of nonwovens. Moreover, a model based on this techniquenaturally introduces voids and gaps into consideration that are a dis-tinctive feature of fibrous networks especially in case of low-densitynonwovens. Such models can simulate the deformation behaviour ofthe fabric very accurately but up to a certain level of deformation;none of these models can predict the damage initiation and propaga-tion in nonwovens. A model, based on the same approach to intro-duction of discontinuous microstructure, was presented byRidruejo et al. (2011) who employed bundles of random fibres, with-out using their actual orientation in the real fabric, in the model.With that approach, a glass-fibre nonwoven felt, in which damageof the fabric occurred as failure of bonds rather than fibre bundles,was studied. In addition to these, models have been proposed byIsaksson et al. (2012) and Wilbrink et al. (2013) focussed on acrack-growth direction and bond failure in fibrous networks, respec-tively. Thus, it can be concluded that despite of the benefits of differ-ent reviewed models for analysis of various aspects of mechanicalbehaviour and mechanisms involved in deformation and failure ofnonwoven fibrous networks, they present only partial solutions.None of the models can predict evolution of deformation and dam-age of the fabric up to its failure in terms of progressive failure of fi-bres while incorporating explicitly the realistic material’smicrostructure by introducing fibres and constituent fibre proper-ties into the model.
In this paper, a thermally bonded nonwoven fibrous networkwith its actual microstructure was modelled in finite-elementenvironment using a parametric modelling technique based on aspecially developed user subroutine. A random anisotropic natureof the fabric was captured by introducing the fibres directly intothe model according to their orientation distribution in the fabric.The variability of elastic–plastic mechanical properties of constitu-ent fibres and a single-fibre failure criterion were introduced intothe model. Damage initiation and evolution in the model were con-trolled by this criterion as progressive failure of fibres resulted indamage initiation and propagation in nonwovens.
2. Experimentation
The model developed in this paper is based on experimentswith single fibres and a nonwoven fabric reported in Farukhet al. (2012b). These experiments provided information necessaryfor development of a finite-element model, such as a number of fi-bres and their orientation distribution function, dimensions ofbond points, their shape, and a pattern obtained from morpholog-ical characterisation of the fabric as well as material properties ob-tained in single-fibre experiments. Moreover, tensile testsperformed on specimens of the fabric provided a basis for physicalinterpretations of the results obtained with the model not only interms of material’s constitutive behaviour but also the mecha-nisms involved in its deformation and damage. Therefore, single-fi-bre and fabric experiments crucial for this study are briefly recalledhere.
2.1. Material
The materials used in this study were low-density (<50 g/m2)thermally bonded calendered nonwovens based on polypropylene(PP) fibres, manufactured by FibreVisions
�, USA. Polypropylene fi-
bres of 18 lm diameter were used to manufacture a fabric. The sta-ple fibre with length of 38.1 mm were laid randomly on a conveyorbelt resulting in an anisotropic web, in which more fibres were ori-ented along the direction of the belt, called machine direction (MD)as compared to that in the direction perpendicular to MD on theplane of the web, called cross direction (CD). The web was thenbonded with a hot calendering technique at a temperature of156 �C, which lies within the optimal temperature window forPP. Different basis weights of material, i.e. 20, 30 and 40 g/m2 wereused in this study. The overall microstructure of the fabric is shownat different scales in Fig. 1.
2.2. Assessment of properties
2.2.1. Single-fibre behaviourThe material properties, especially related to failure, of single fi-
bres extracted from the studied thermally bonded fabric are differ-ent from those of the virgin fibres due to the pressure andtemperature involved in the bonding process (Chidambaramet al., 2000; Wang and Michielsen, 2001; Michielsen and Wang,2002; Wang and Michielsen, 2002; Bhat et al., 2004; Farukhet al., 2012b). Therefore, individual fibres extracted from the fabricwere used to obtain their material properties as these are its basicconstituent. A complete detail on fibre extraction and preparationof the specimen is given in (Farukh et al., 2012b). Tensile tests werecarried out on those extracted fibres at various levels of constantengineering strain rates – 0.5, 0.1 and 0.01 1/s – using Instron�
Micro Tester 5848 with a high-precision ±5 N load cell. Due to dif-ficulties to control the fibre’s length, a constant engineering strainrate was achieved by modifying the velocity of the cross-head with

Fig. 1. SEM images of 20 g/m2 PP fibre nonwoven.
Fig. 2. Mechanical behaviour of PP fibre at various strain rates.
1672 F. Farukh et al. / International Journal of Solids and Structures 51 (2014) 1670–1685
respect to the length of each fibre specimen. The following rela-tionship was used for this purpose:
mlo¼ e�¼ const; ð1Þ
where m is the cross-head velocity and lo is the initial length of thefibre. In order to assess variability of the obtained results, at leastten samples were tested for each strain rate. True strains (etrue)and true stresses (rtrue) were recorded during the tests:
etrue ¼Z l
lo
dll¼ ln
llo
� �; ð2Þ
rtrue ¼Fð1þ eengÞ
Ao; ð3Þ
where l is the current specimen length, F is the load, Ao is the initialarea of fibre’s cross-section and eeng is engineering strain. In thesecalculations, it was assumed that the fibre’s cross-section was per-fectly circular and its diameter was constant along its length. Truestress and true strain were computed based on the hypothesis thatdeformation in fibre took place at constant volume. The true stress-true strain curves obtained from the tests had a sigmoidal shapewith elastic–plastic region (Fig. 2). The values of material density(qf ), elastic modulus (Ef ), Poisson’s ratio (mf ) and initial yield stress(ry) are given in Table 1. The tested fibres showed a scatter in re-sults along with variation in their stress–strain behaviour with astrain rate, which is due to viscous properties of the material. Theelastic–plastic properties obtained from the single-fibre tensiletests were used as input into the finite-element model.
2.2.2. Microstructural characterisationCharacterisation of microstructural features of the undeformed
network (fabric) was performed using scanning electron micros-copy (SEM) (Carl Zeiss, Leo, 1530VP FEGSEM). One of the typicalimages obtained with SEM is shown in Fig. 1a. Dimensions of struc-tural entities such as bond points and their pattern as well as ori-entation distribution of fibres required for the development of thefinite-element model were obtained from these images. The com-plete details of determining the orientation distribution function(ODF) of fibres using an in-house software Nonwoven AnisotropyV1 were given in Farukh et al. (2012a). The ODF obtained fromthese experiments is presented as a histogram in Fig. 3, whichshows preferential orientation of fibres in MD as compared to CDand, thus, quantifies anisotropy of the studied fabric.
2.2.3. Mechanical behaviourRectangular coupons along the machine direction and cross
direction were cut from the studied nonwoven fabric with the ba-sis weight of 20 g/m2, and uniaxial tensile tests were performed onthese specimens at strain rate of 0.1 and 0.01 1/s using HounsfieldBenchtop Tester with pneumatic grips. The force–extension graphsobtained from these experiments for both MD and CD directionare given in Fig. 4. These experiments demonstrated not only

Table 1Properties of polypropylene fibre (as extracted from nonwovens).
qf ðg=cm3Þ Ef ðMPaÞ mf ryðMPaÞ
0.89 350 ± 42 0.42 (FiberVisions, 2010) 75 ± 9
Fig. 3. Orientation distribution function of fibres (90� corresponds to MD whereas0� and 180� correspond to CD).
F. Farukh et al. / International Journal of Solids and Structures 51 (2014) 1670–1685 1673
differences in the mechanical behaviour of the fabric in MD and CDbut a significant scatter in results for both directions due to theirregularities in fabric’s microstructure as well as geometric andmaterial properties of constituent fibres. Along MD, the maximumload was attained at lower fabric’s extension as compared to thatin CD followed by a gradual process of fibre failure giving thebell-shaped form to the force–extension curve. In contrast, arapid fibre-failure process following large fabric’s extension was
Fig. 4. Force–elongation curves in tension at str
observed in CD resulting in a sudden drop on the force–extensioncurve. The features presented by the curves for various specimensin any particular direction – MD or CD – were the same, shown bysolid lines in Fig. 4, even with a significant scatter among them.These lines correspond to experimental results giving the approx-imately median values of force and extension. The difference inload-carrying capacity of the material in MD and CD ascertainthe anisotropic nature of the fabric.
In order to study microstructural features of the deformed fab-ric, a high-speed camera (Photron Fastcam SA3) with advancedmacro capabilities was used. Large rotations of fibres towards theloading direction followed by their progressive failure when theyreached their stress or strain threshold were observed in thesetests. The progressive failure of fibres was associated with thedevelopment and growth of localised fracture zones, formed byremaining fibres aligned along the loading direction, leading ulti-mately to failure of the fabric specimen; the sequence of these phe-nomena is shown in Fig. 5. When these experiments were repeatedon fabrics with different basis weights, it was observed that themain mechanisms involved in deformation and damage of thosematerials remained the same. Furthermore, the strain rate didnot cause any effect on the sequence of deformation and damagephenomena. These observations were close to those presented byRidruejo et al. (2011).
The phenomena of deformation as well as damage initiationand progression were effectively the same for both MD and CD ex-cept for the fact that rotation of fibres before their full engagementin load transfer was rather large in CD as compared to that in MD;this was due to the preferential orientation of fibres along MD.Moreover, this orientation resulted in a significantly higher load-bearing capacity in MD than CD apparent in Fig. 4. During deforma-tion and damage of nonwovens, only rotation of bond points wasobserved, without any significant deformation of them. However,they played an important role in progressive failure of fabric as fi-bres always break at bond-point periphery.
2.2.4. Damage analysisDamage in the studied thermally bonded nonwovens was initi-
ated by failure of fibres reaching their stress or strain thresholdsduring the loading. This triggered the development of fracturezones within the fabric growing with subsequent fibre failures.This growth of fracture zones due to progressive failure of fibresultimately led to rupture of the fabric. In thermally calendered
ain rate of 0.1 1/s along MD (a) and CD (b).
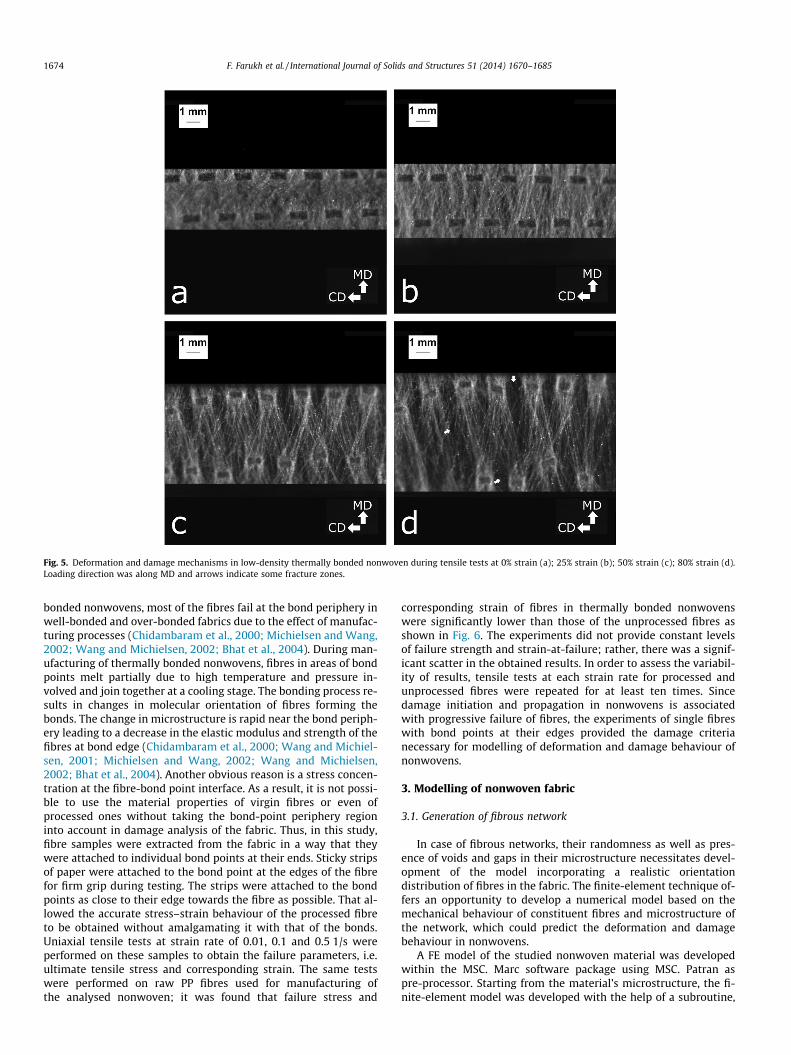
Fig. 5. Deformation and damage mechanisms in low-density thermally bonded nonwoven during tensile tests at 0% strain (a); 25% strain (b); 50% strain (c); 80% strain (d).Loading direction was along MD and arrows indicate some fracture zones.
1674 F. Farukh et al. / International Journal of Solids and Structures 51 (2014) 1670–1685
bonded nonwovens, most of the fibres fail at the bond periphery inwell-bonded and over-bonded fabrics due to the effect of manufac-turing processes (Chidambaram et al., 2000; Michielsen and Wang,2002; Wang and Michielsen, 2002; Bhat et al., 2004). During man-ufacturing of thermally bonded nonwovens, fibres in areas of bondpoints melt partially due to high temperature and pressure in-volved and join together at a cooling stage. The bonding process re-sults in changes in molecular orientation of fibres forming thebonds. The change in microstructure is rapid near the bond periph-ery leading to a decrease in the elastic modulus and strength of thefibres at bond edge (Chidambaram et al., 2000; Wang and Michiel-sen, 2001; Michielsen and Wang, 2002; Wang and Michielsen,2002; Bhat et al., 2004). Another obvious reason is a stress concen-tration at the fibre-bond point interface. As a result, it is not possi-ble to use the material properties of virgin fibres or even ofprocessed ones without taking the bond-point periphery regioninto account in damage analysis of the fabric. Thus, in this study,fibre samples were extracted from the fabric in a way that theywere attached to individual bond points at their ends. Sticky stripsof paper were attached to the bond point at the edges of the fibrefor firm grip during testing. The strips were attached to the bondpoints as close to their edge towards the fibre as possible. That al-lowed the accurate stress–strain behaviour of the processed fibreto be obtained without amalgamating it with that of the bonds.Uniaxial tensile tests at strain rate of 0.01, 0.1 and 0.5 1/s wereperformed on these samples to obtain the failure parameters, i.e.ultimate tensile stress and corresponding strain. The same testswere performed on raw PP fibres used for manufacturing ofthe analysed nonwoven; it was found that failure stress and
corresponding strain of fibres in thermally bonded nonwovenswere significantly lower than those of the unprocessed fibres asshown in Fig. 6. The experiments did not provide constant levelsof failure strength and strain-at-failure; rather, there was a signif-icant scatter in the obtained results. In order to assess the variabil-ity of results, tensile tests at each strain rate for processed andunprocessed fibres were repeated for at least ten times. Sincedamage initiation and propagation in nonwovens is associatedwith progressive failure of fibres, the experiments of single fibreswith bond points at their edges provided the damage criterianecessary for modelling of deformation and damage behaviour ofnonwovens.
3. Modelling of nonwoven fabric
3.1. Generation of fibrous network
In case of fibrous networks, their randomness as well as pres-ence of voids and gaps in their microstructure necessitates devel-opment of the model incorporating a realistic orientationdistribution of fibres in the fabric. The finite-element technique of-fers an opportunity to develop a numerical model based on themechanical behaviour of constituent fibres and microstructure ofthe network, which could predict the deformation and damagebehaviour in nonwovens.
A FE model of the studied nonwoven material was developedwithin the MSC. Marc software package using MSC. Patran aspre-processor. Starting from the material’s microstructure, the fi-nite-element model was developed with the help of a subroutine,

Fig. 6. Effect of bonding on single-fibre’s ultimate tensile stress (a) and strain (b).
Table 2Number of elements for MD and CD models.
Shell (element 139) Truss (element type 9)
MD 11420 2285CD 9750 2067
Table 3Parameters of fabric (see Fig. 7).
Parameter Magnitude
Fabric AFabric (W � L) (mm �mm) MD: 10 � 16.5CD: 16.5 � 10
qFabric (g/m2) 20
Bond points A (mm) 1.0668B (mm) 0.5588
Pattern C (mm) 0.7D (mm) 1.8E (mm) 0.2
Fibres aFibre (mm2) 2.54 � 10�4
LFibre (mm) 38.1qFibre (g/mm3) 0.89 � 10�3
Model coefficient K 1
F. Farukh et al. / International Journal of Solids and Structures 51 (2014) 1670–1685 1675
written in Patran Command Language (PCL), employing a paramet-ric modelling technique as mentioned in (Sabuncuoglu et al., 2012,2013; Farukh et al., 2012a). In the model, the anisotropic nature ofthe fabric microstructure was introduced by modelling the fibresdirectly according to their orientation distribution in the fabric.Modelling of fibres according to their determined ODF (Fig. 3)was performed using the subroutine that incorporates a realisticmicrostructure of the fabric into the model. The FE model of thefabric developed in this study consists of bond points connectedby the linking fibres. The bond points were modelled with shellelements (element type 139 in MSC. Marc) with thickness identicalto those in the fabric. The chosen finite element is a four-node,thin-shell element with global displacements and rotations as de-grees of freedoms; a bilinear interpolation is used for the displace-ments and rotations. All the constitutive relations including aviscoelastic–plastic one can be used with this element. Becauseof these attributes, element 139 is suitable for representation ofbond points and used in our simulations. It is defined geometricallyby (x, y) coordinates of its four corner nodes. Due to the bilinearinterpolation, the surface forms a hyperbolic paraboloid, which isallowed to degenerate to a plate. The shell elements are suitableto simulate the bond points in this study with a high edge-length-to-thickness ratio. Besides, they provide the opportunityto extend the use of the developed FE model to out-of-plane load-ing regimes (published elsewhere).
Fibres were modelled with truss elements (element type 9 inMSC. Marc), which have only axial stiffness. Since truss elementscannot carry any bending moment, they were appropriate for rep-resentation of fibres characterised by a rather low flexural stiffness.The chosen element type for fibres can describe properly a high le-vel of deformations, characteristic to this type of nonwovens, aswell as stress stiffening. This was verified by performing FEsimulations of a case study for a single-fibre experiment beforeimplementing the full numerical model. The total numbers of bothtypes of elements for MD and CD models are given in Table 2. Infor-mation about the size, shape and pattern of bond points wasobtained from SEM images of the fabric (see Table 3 and Fig. 7).In order to introduce the real material properties into the model,it is essential to determine the number of fibres to be modelled.This is calculated with the following relation:
NFibre ¼qFabric AFabric
LFibre qFibre aFibrek; ð4Þ
where LFibre is the length of single fibre, qFibre is the density of con-stituent fibre material, aFibre is the fibre’s cross-sectional area, qFabric
is the areal density of the fabric, AFabric is the area of the fabric withdimensions equal to those of the FE model and k is the model coef-ficient equal to a number of fibres represented by a single truss ele-ment in the model. The value of k can be changed from 1 to a highermagnitudes depending upon the efficiency of the computationalsystem. If k ¼ 1, each truss element represents the behaviour of asingle fibre, and the number of truss elements introduced into themodel is exactly equal to the number of fibres in the fabric’s samplewith dimensions equal to those of the FE model. If the efficiency ofthe computational system is low and a higher value of the modelcoefficient k is used, the geometric properties related to fibre shouldbe updated respectively. For example, if k ¼ 4 is used, the diameterof the truss element should be two times the diameter of a singlefibre. The numbers of fibres calculated with Eq. (4) were modelledin a way that if a segment of a fibre fell outside the modelling area,this segment was removed and re-introduced in the modelling areaat a random initial position. These steps were repeated for all the
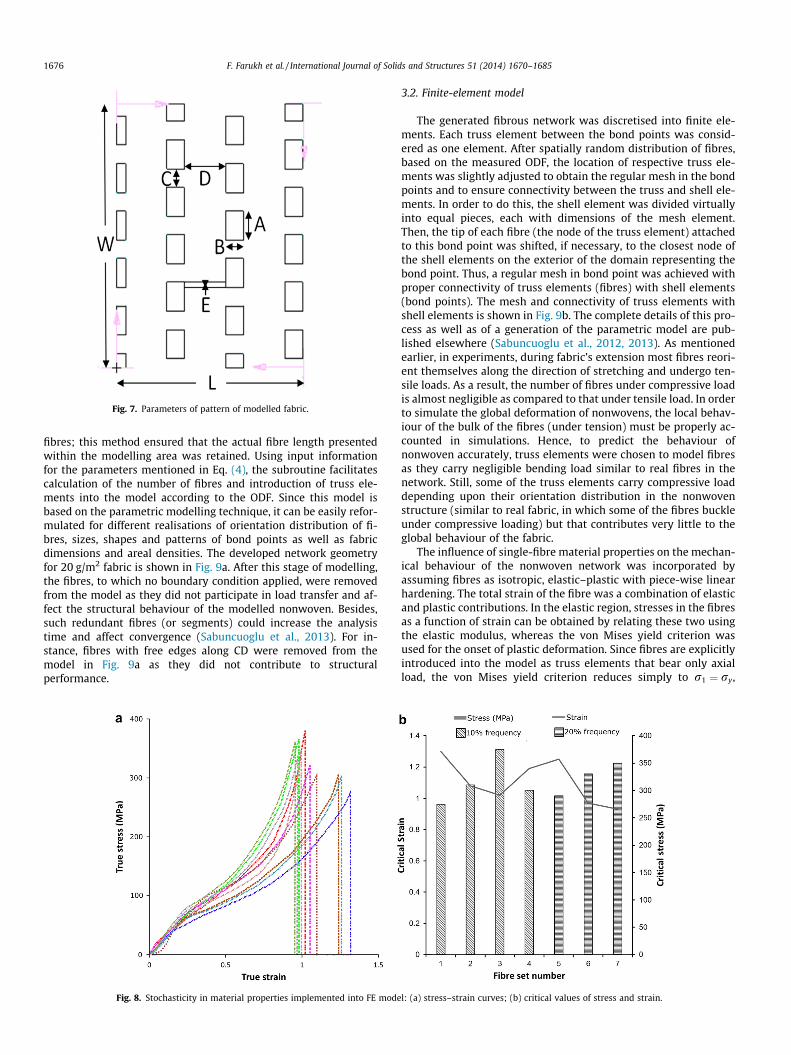
Fig. 7. Parameters of pattern of modelled fabric.
1676 F. Farukh et al. / International Journal of Solids and Structures 51 (2014) 1670–1685
fibres; this method ensured that the actual fibre length presentedwithin the modelling area was retained. Using input informationfor the parameters mentioned in Eq. (4), the subroutine facilitatescalculation of the number of fibres and introduction of truss ele-ments into the model according to the ODF. Since this model isbased on the parametric modelling technique, it can be easily refor-mulated for different realisations of orientation distribution of fi-bres, sizes, shapes and patterns of bond points as well as fabricdimensions and areal densities. The developed network geometryfor 20 g/m2 fabric is shown in Fig. 9a. After this stage of modelling,the fibres, to which no boundary condition applied, were removedfrom the model as they did not participate in load transfer and af-fect the structural behaviour of the modelled nonwoven. Besides,such redundant fibres (or segments) could increase the analysistime and affect convergence (Sabuncuoglu et al., 2013). For in-stance, fibres with free edges along CD were removed from themodel in Fig. 9a as they did not contribute to structuralperformance.
Fig. 8. Stochasticity in material properties implemented into FE mode
3.2. Finite-element model
The generated fibrous network was discretised into finite ele-ments. Each truss element between the bond points was consid-ered as one element. After spatially random distribution of fibres,based on the measured ODF, the location of respective truss ele-ments was slightly adjusted to obtain the regular mesh in the bondpoints and to ensure connectivity between the truss and shell ele-ments. In order to do this, the shell element was divided virtuallyinto equal pieces, each with dimensions of the mesh element.Then, the tip of each fibre (the node of the truss element) attachedto this bond point was shifted, if necessary, to the closest node ofthe shell elements on the exterior of the domain representing thebond point. Thus, a regular mesh in bond point was achieved withproper connectivity of truss elements (fibres) with shell elements(bond points). The mesh and connectivity of truss elements withshell elements is shown in Fig. 9b. The complete details of this pro-cess as well as of a generation of the parametric model are pub-lished elsewhere (Sabuncuoglu et al., 2012, 2013). As mentionedearlier, in experiments, during fabric’s extension most fibres reori-ent themselves along the direction of stretching and undergo ten-sile loads. As a result, the number of fibres under compressive loadis almost negligible as compared to that under tensile load. In orderto simulate the global deformation of nonwovens, the local behav-iour of the bulk of the fibres (under tension) must be properly ac-counted in simulations. Hence, to predict the behaviour ofnonwoven accurately, truss elements were chosen to model fibresas they carry negligible bending load similar to real fibres in thenetwork. Still, some of the truss elements carry compressive loaddepending upon their orientation distribution in the nonwovenstructure (similar to real fabric, in which some of the fibres buckleunder compressive loading) but that contributes very little to theglobal behaviour of the fabric.
The influence of single-fibre material properties on the mechan-ical behaviour of the nonwoven network was incorporated byassuming fibres as isotropic, elastic–plastic with piece-wise linearhardening. The total strain of the fibre was a combination of elasticand plastic contributions. In the elastic region, stresses in the fibresas a function of strain can be obtained by relating these two usingthe elastic modulus, whereas the von Mises yield criterion wasused for the onset of plastic deformation. Since fibres are explicitlyintroduced into the model as truss elements that bear only axialload, the von Mises yield criterion reduces simply to r1 ¼ ry,
l: (a) stress–strain curves; (b) critical values of stress and strain.

Fig. 9. (a) FE model showing stochasticity in material properties and fibres’orientation distribution; (b) zoomed view of bond point showing truss elementsconnected to shell elements.
F. Farukh et al. / International Journal of Solids and Structures 51 (2014) 1670–1685 1677
meaning that fibres start yielding when the stress level in themreaches their corresponding yield strengths. The latter were ob-tained from single-fibre uniaxial tensile tests performed in thisstudy. Thus, the incremental stress–strain relation in fibres in elas-tic region is given as (Simo and Hughes, 1998; MSC. Marc, 2013a):
rnþ1e ¼ rn
e þ EDenþ1e ; ð5Þ
where E is the Young’s modulus. The table-based input of flowstress was used, representing stresses and respective plastic strainsobtained in single-fibre tensile tests. The hardening slope at eachincrement of simulations was obtained by numerical differentiationof the data in the table. Apparently, the initial value of equivalentplastic strain in the input table, corresponding to yield stress, is zero(MSC. Marc, 2013b). The generalised form of the work-hardeningcoefficient has the following form:
H ¼ d�rd�ep ; ð6Þ
where d�ep and d�r are equivalent plastic strain and equivalent stress.The flow rule, describing changes in plastic strain component as afunction of the current stress state), essential to define the incre-mental stress–strain relation for plastic material, can be expressedas:
dep ¼ d�ep : r�r where r�r ¼ @�r@rij
: ð7Þ
It can be shown (MSC. Marc, 2013a) that by rearrangement
d�eP ¼ r�r : C : deH þr�r : C : r�r
; ð8Þ
where C is the stiffness matrix.
3.3. Material properties and boundary conditions
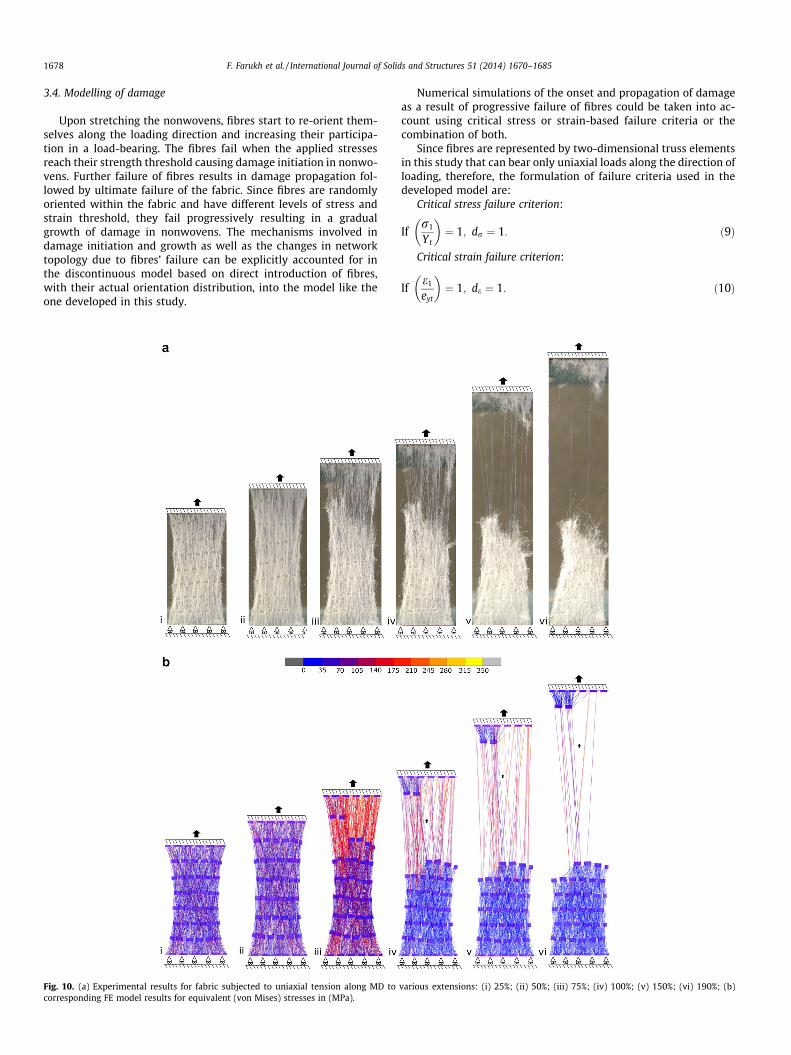
The material properties implemented into the model were ob-tained from the single-fibre tensile tests. The experimental curvesof single-fibre tensile tests (Fig. 8a) were used to define the elastic–plastic behaviour of the fibres in the developed model. It was foundthat there was a significant scatter in results of single-fibre exper-iment results (Fig. 8a), which show the randomness in materialproperties of the constituent fibres. This scatter was the result ofsome local shape irregularities of the tested fibres due to the effectof heat or physical contact during the web-forming or hot-calen-dering stages. In addition to shape irregularities, SEM images ofthe fabric showed that a fibre diameter is not constant along itslength; this is another reason for a significant scatter in the results.This scatter in single-fibre experimental results was introducedinto the model; it means that different flow curves (and, respec-tively, yield points) were assigned to the fibres in the model basedon the experimental data. It was found that implementation of var-iation in fibres’ material properties not only in terms of their failureparameters but also the stress–strain curves along with the fibreorientation distribution into the FE model is essential to simulatea realistic deformation and damage behaviour of the fabric (Farukhet al., 2012b). Therefore, different stress–strain curves and damageparameters were assigned in a random way to the truss elementsin the FE model according to the data obtained from the tensileexperiments at strain rate of 0.1 1/s performed on ten processedsingle-fibre specimens. These data was used as an indicator of scat-ter in material properties for all the fibres within the fabric.According to this, seven sets of fibres with different material prop-erties in terms of stress–strain relationships and damage parame-ters were implemented in the model (Fig. 8). The numbers of fibresin each set as a fraction of the overall number of fibres within thefabric, obtained with the random sampling technique, with theircorresponding stress and strain threshold values are given in
Fig. 8. Since damage was not observed in the bond points duringthe fabric’s tensile tests, therefore, damage criteria discussed be-low were not applied to them. The simulations of tensile tests werecarried out by applying a set of boundary conditions to the FE mod-el, within the framework of the implicit algorithm for quasi-staticloading with large displacements and rotations. The FE solver(MSC. Marc,) in this study is based on the total Lagrangian method,using the second Piola–Kirchhoff stress and Green-Lagrange strain(the details can be found in MSC. Marc (2013a)). The nodes on theside R–S of the model (Fig. 9) were fully constrained whereas a uni-form axial displacement condition corresponding to the strain rateof 0.1 1/s was applied to the nodes on side P–Q of the model asshown in Fig. 9.
1678 F. Farukh et al. / International Journal of Solids and Structures 51 (2014) 1670–1685
3.4. Modelling of damage
Upon stretching the nonwovens, fibres start to re-orient them-selves along the loading direction and increasing their participa-tion in a load-bearing. The fibres fail when the applied stressesreach their strength threshold causing damage initiation in nonwo-vens. Further failure of fibres results in damage propagation fol-lowed by ultimate failure of the fabric. Since fibres are randomlyoriented within the fabric and have different levels of stress andstrain threshold, they fail progressively resulting in a gradualgrowth of damage in nonwovens. The mechanisms involved indamage initiation and growth as well as the changes in networktopology due to fibres’ failure can be explicitly accounted for inthe discontinuous model based on direct introduction of fibres,with their actual orientation distribution, into the model like theone developed in this study.
Fig. 10. (a) Experimental results for fabric subjected to uniaxial tension along MD tocorresponding FE model results for equivalent (von Mises) stresses in (MPa).
Numerical simulations of the onset and propagation of damageas a result of progressive failure of fibres could be taken into ac-count using critical stress or strain-based failure criteria or thecombination of both.
Since fibres are represented by two-dimensional truss elementsin this study that can bear only uniaxial loads along the direction ofloading, therefore, the formulation of failure criteria used in thedeveloped model are:
Critical stress failure criterion:
Ifr1
Yt
� �¼ 1; dr ¼ 1: ð9Þ
Critical strain failure criterion:
Ife1
eyt
� �¼ 1; de ¼ 1: ð10Þ
various extensions: (i) 25%; (ii) 50%; (iii) 75%; (iv) 100%; (v) 150%; (vi) 190%; (b)

F. Farukh et al. / International Journal of Solids and Structures 51 (2014) 1670–1685 1679
Here, r1 and e1 are longitudinal stress and strain at integrationpoint of a truss element, respectively; Yt and eyt represent maxi-mum allowable longitudinal tensile stress and maximum allow-able longitudinal tensile strain, respectively. dr and de are thedamage variables associated with the failure mode of an elementunder tensile stress and strain, respectively. As was observed inthe tensile tests on the studied fabric at various strain rates, someof the fibres sustained their participation in load bearing even atstrain levels larger than critical strain values for single fibres at cor-responding strain rates (Fig. 10a). Following these experimentalobservations, it was decided to use only the maximum tensilestress for the single-fibre failure in FE model; the respective valuesused in the FE model are given in Fig. 8. Since fibres wereintroduced explicitly into the model, the critical stress values offibres obtained with the single-fibres tensile tests performed atthe strain rate corresponding to model’s boundary conditionswere used as failure criterion in this study. In FE simulations, an
Fig. 11. (a) Experimental results for fabric subjected to uniaxial tension along CD to vcorresponding FE model results for equivalent (von Mises) stresses in (MPa).
element-deletion approach was used to remove the elements fromthe model based on the value of damage variables as calculatedwith Eq. (9). An element (fibre in this study) was assumed to failand removed from the model when the damage condition (i.e.dr ¼ 1) was satisfied at its integration location to avoid the conver-gence problem. Thus, the damage parameters were calculated forall the fibres and the elements with dr ¼ 1 were removed fromthe model and did not offer any resistance to subsequentdeformation.
4. Numerical results and discussion
The parametric computational model that captures the fabric’sanisotropic behaviour linked to its microstructure and materialproperties of its constituent fibres was developed; it also incorpo-rates the critical stress-based single-fibre failure criterion. Thismodel was used to predict the behaviour of thermally bonded
arious extensions: (i) 25%; (ii) 50%; (iii) 75%; (iv) 100%; (v) 150%; (vi) 190%; (b)

Fig. 13. Flow chart on implementation of stochasticity in FE model.
1680 F. Farukh et al. / International Journal of Solids and Structures 51 (2014) 1670–1685
nonwoven. The deformation and damage behaviour in the fabric,which is a result of large rotations and progressive failure of fibres,was simulated for both MD and CD, as shown in Figs. 10b and 11b.Apparently, the main features of deformation and damage process,observed in real specimens of the modelled fabric, including for-mation and growth of localised zones, are reproduced in simula-tions. In order to compare the model’s predictions withexperimental results, the force–extension graphs were used asshown in Fig. 12. The shaded areas in Fig. 12 represent the bandsof experimental results performed on multiple specimens for thecorresponding directions. A good agreement between the simula-tions and experimental results was observed, including the extentof material’s anisotropy. Implementing different statistical realisa-tions of material properties by changing them for corresponding fi-bre sets based on the experimentally obtained data (Fig. 8), led tochanges in force–extension curve as shown in Fig. 12.
Apparently, an initial slightly stiffer behaviour in CD as com-pared to experiments can be attributed to the fact that a curl of fi-bres was not introduced into the model. This can be explained bypredominant orientation of fibres along MD, with a small fractionaligned along CD. When stretched in MD, most of fibres in the fab-ric start participating in load-bearing early, reducing the effect ofcurl. Thus, the tested specimens showed an almost negligible por-tion of compliant behaviour in MD, whereas the fabric’s subse-quent response was dominated by the stretching behaviour ofthe fibres, which the developed model can predict rather well.However, in the specimens stretched in CD, most fibres at firstreoriented along the direction of loading, with fibre curl playingan important part in this process. Hence, a significant portion ofthe fabric’s initial response for this direction (CD) was dominatedby uncurling and rotation of fibres rather than their stretching. Thisresulted in a compliant initial behaviour of the fabric tested in CD,which the model without the account for fibre curl could notreproduce fully adequately, predicting somewhat stiffer results.
Another apparent difference between the model’s predictionand experimental results is the scatter being higher in the lattercase. The experimental scatter can be related to the followingfactors: variation in material properties and strength of fibres,randomness in microstructure and variation in fibres’ geometry.The first source of scatter was taken into account in the simula-tions by providing different material properties and levels ofstrength to different sets of fibres as shown in Fig. 13. Randomness
Fig. 12. Calculated responses to uniaxial tensile test for MD (a) and
in material’s microstructure can be easily implemented into themodel by using the parametric modelling technique based onthe subroutine, developed in this study. In the experiments onthe studied fabric, all the testing parameters such as specimen sizeand boundary conditions were kept constant; the variation waslinked to the orientation distribution, material properties and posi-tion of fibres. Thus, it is obvious that using different microstruc-tures by changing the ODF for developing the model and seedingrandom numbers to fibre positions (Fig. 13) would increase the ex-tent of variability in simulation results providing better agreementwith the experimental results. The effect of varying the material
CD (b) (shaded area represents scatter in experimental results).

F. Farukh et al. / International Journal of Solids and Structures 51 (2014) 1670–1685 1681
properties of individual fibres in the form of force–extension curveis given in Fig. 12. It should be noted that the variation in themechanical response based on assigning different material proper-ties to fibres in the models was identical to scatter reportedexperimentally.
Explicit introduction of fibres into the model can help to predictthe levels of stresses and strains in each element (fibre in this case)of the model. Since fibres were modelled randomly according tothe ODF measured for the real fabric and their participation in loadbearing changed as they were aligned along the loading direction,the level of strain (ef ) and corresponding stress (rf ) in each fibrevaried from the global strain in the fabric (�e) depending upon itsorientation with respect to the loading direction and position inthe network as shown in Figs. 14 and 15. The probability distribu-tion functions of normalised strains in fibres with respect to globalstrain and corresponding stresses at various levels of fabric’sextension are presented for each interval of strains and stressesin Figs. 14 and 15, respectively. As most of the fibres failed at levelsless than 100% of fabric’s extension along MD, therefore, the fig-ures present the data for strains and corresponding stresses notexceeding this magnitude. Two different patterns of change inthe probability distributions for MD and CD with increasing defor-mation of the fabric are obvious in Fig. 14. For CD (Fig. 14b), thedistribution effectively retains its shape for different strains withonly minor changes to the bands. For MD (Fig. 14a), in contrast, sig-nificant shifts of the distribution’s median are observed. The peakfor normalised fibre strains shifts to lower values with increasingfabric strain. The difference in patterns for stress distributions for
Fig. 14. Distribution of normalised strains for fibres for various
MD and CD (Fig. 15) is also similar to that for normalised strains.Still, if for CD the character of changes is practically the same,the case of MD (Fig. 15a) has its specific development. Here, atthe initial stage (up to fabric strain of 50%), the shift is to higherlevels of stress of fibres, reflecting their increasing participationin the load-bearing process as a result of reorientation towardsthe loading direction. However, this trend reversed between 75%and 100% of fabric’s extension when many fibres reached theirstress threshold and failed resulting in the stretch back of fibresoutside the localised failure zones due to elasticity (Fig. 10a). Thus,the developed model can be used to predict stress distributions atany level of fabric’s extension. Besides, explicit introduction of fi-bres into the model helped to understand the evolution in stressesin fibres and arrangement of the neighbouring elements caused byprogressive failure of fibres. This demonstrates that model is alsocapable to qualitatively reproduce the changes in the topology ofthe network. Since most of the fibres regain their unstressed orlow-magnitude-stress state at 100% of fabric’s extension alongMD (Fig. 15a), therefore, the stretch back in the fabric after 100%fabric extension is negligible as shown in Fig 10a (v) and (vi).
The discussed change in distributions of fibres’ parameters withincreasing deformation of the fabric is also reflected in changes ofthe maximum and minimum values of stresses shown in Fig. 16.Apparently, the maximum stress in fibres along MD and CD in-creased continuously until it reached its maximum value. How-ever, this increase for MD was rapid as compared to that for CD;fibres in the former case started to participate in load bearing ear-lier than in the latter; this is consistent with the fabric’s structure
values of fabric strain deformed along MD (a) and CD (b).

1682 F. Farukh et al. / International Journal of Solids and Structures 51 (2014) 1670–1685
having preferential orientation of fibres along MD. The minimumvalue of stress in fibres for CD was negative as a result of lateralshrinking. Such fibres under compressive load offered resistanceto reorientation of other fibres along the loading direction duringthe fabric’s extension process; therefore, the model predicted aslightly stiffer behaviour compared to that observed in the exper-
Fig. 15. Distribution of stresses for fibres for various valu
Fig. 16. Minimum and maximum values of stress in fibres for vario
iments as shown in Fig. 12b. An interesting point can be notedhere: the variation in the minimum value of stresses for both MDand CD was negligible for all the levels of fabric’s extension as a re-sult of a continuous transfer of stresses to the neighbouring ele-ments caused by progressive failure of fibres. Due to this stressshift, some fibres start to take load during fabric’s extension while
es of fabric strain deformed along MD (a) and CD (b).
us values of strain in fabric deformed along MD (a) and CD (b).

F. Farukh et al. / International Journal of Solids and Structures 51 (2014) 1670–1685 1683
some fibres return back to the unstressed state due to failure oftheir neighbours.
The process of reorientation of fibres towards the loading direc-tion followed by their failure upon reaching the critical stress led tolocalisation of damage in the form of fracture zones as shown inFigs. 10 and 11, which appearance was similar to that observedin experiments. (A fracture zone in this study is a narrow gap inthe direction of loading caused by the localised failure of fibresand formed by remaining fibres adjoining this gap.) The develop-ment of localised fracture zones was caused by an avalanche offailures due to load redistribution (i.e. increase in the load of neigh-bouring fibres transferred from the ruptured ones). Subsequentloading caused more fibres to fail, resulting in the growth of frac-ture zones. These phenomena of initiation and growth of fracturezones with fabric’s extension are shown in Figs. 10 and 11. Thegrowth in fracture zones for loading along MD was slower as com-pared to that along CD. Since multiple fracture zones were devel-oped in the fabric during its extension, the ones shown by thearrows in Figs. 10 and 11 are presented in Fig. 17 in terms of thenormalised length of the fracture zone. The latter is introducedto quantify this process and is defined as a ratio of the length offracture zone lfz measured as the average distance between twosides of the zone along the loading direction (i.e. parallel to themain specimen’s axis) to the current total length of fabric (L).The fracture zone developed along MD after fabrics’ extension of50% and reached approximately half of the fabric’s length at200% extension. In contrast, for CD it started only after 180% exten-sion, and the specimen of fabric failed at that fracture zone at fab-ric’s extension of 200%. This shows that the development offracture zone by the progressive failure of fibres was rapid for load-ing along CD and more protracted for MD. This phenomenon can beattributed to the preferential orientation of fibres along MD, i.e. inthis case fibres, already more aligned along the loading direction(coinciding with MD), started participating in a load transfer whileother fibres still re-oriented, resulting in more gradual damageevolution. Whereas, during loading in CD, most of the fibresreoriented along the loading direction and started participatingin the load-bearing process practically at the same stage of thedeformation process. Since the process of individual fibre failuresresponsible for damage evolution in the fabric was more gradualalong MD than CD, a longer tail in the force–extension curveswas observed in the former case as shown in Fig. 11.
Fig. 17. Growth in fracture zone with fabric’s extension.
The model developed in this study is not only capable to predictthe deformation and damage behaviour accurately in terms ofanisotropy, nominal strength, force–extension behaviour andchanges in network topology as a result of damage evolution butit also properly reflects the effect of grip constraints on the defor-mation behaviour of the fabric specimen (Figs. 10 and 11). Thetransverse strain in the fabric gradually increases from the gripon each end of the fabric to the region of maximum transversestrains in the middle. Such transverse strains in the fabric were sig-nificantly higher for MD, producing a visible necking effect in thiscase as compared to that in CD with negligibly small transversestrains at the initial stages of fabric’s extension as shown in Figs. 10and 11. However, after a certain level of fabric’s extension alongCD, significant transverse strains and, thus, necking was observedthere (Fig. 11a). The reason for this different behaviour was thepreferential orientation of fibres along MD in the fabric. In themodel, for MD, visible necking in the fabric was observed similarto the experimental observations. Since fibres were taking thecompressive load during fabric’s extension along CD (shown inFig. 16b) the necking in fabric was negligible even at higher levelsof strains along that direction.
The damage evolution in fibrous networks can be characterisedby a ratio Nf =�N, where Nf is the accumulated number of fibresfailed at any particular level of fabric’s extension and �N is the totalnumber of fibres failed during deformation and damage of the fab-ric up to its rupture. As the number of failed fibres depending uponfailure locus can vary with variation in the ODF and positions of fi-bres within the fabric, therefore, the total number of fibres withinthe fabric specimen was not used as denominator in the introduceddamage measure. Evolution of the damage parameter Nf =�N withfabric’s extension for both studied cases – MD and CD – is givenin Fig. 18. It shows that the growth of damage caused by progres-sive fibre failure, a key feature of deformation and damage of fi-brous networks, was more gradual along MD than CD because ofthe reasons discussed above.
Another interesting observation was that the concentration ofstresses at the edges of the bond points perpendicular to the direc-tion of loading was very pronounced as compared to their otherparts as shown in Fig. 19. Since fibres in thermally bonded nonwo-vens always fail at bond points, as mentioned in Section 2.2, thesharp stress concentration at bond points’ edges is consistent withthe experimental observations and various studies in the literature.
Fig. 18. Evolution of damage parameter with fabric’s deformation.

Fig. 19. Equivalent von Mises (MPa) stress concentration at edges of bond points(loading direction was along MD).
1684 F. Farukh et al. / International Journal of Solids and Structures 51 (2014) 1670–1685
However, the stress concentration at edges of bond points parallelto the loading direction was limited because these edges undergocompressive loading due to lateral contraction of the fabric asmentioned before (Figs. 10 and 11). Thus, the model developedin this study is also capable to simulate the stress distributionwithin bond points along with the areas of high stress concentra-tion along its edges.
5. Conclusions
A micromechanical numerical model was developed in thisstudy to simulate deformation as well as damage initiation andpropagation in thermally bonded nonwoven fibrous networks. Asubroutine, based on the parametric modelling technique, wasused to develop this model. The fibres were introduced directlyinto the model according to their ODF obtained from the SEMimages of the fabric using the image-analysis technique. This directmicrostructure-based numerical approach maintains a relation be-tween the microstructure of a nonwoven fibrous network and itsdeformation and damage behaviour. Moreover, this technique nat-urally introduced voids and gaps in fabric’s microstructure, ob-served experimentally, into the model that cannot be achievedwith a traditional continuous model.
All the parameters necessary for simulation of such a fibrousnetwork, including the orientation distribution function for fibres,geometric properties, material properties, failure criteria as well asthe shape, size, dimensions and pattern of bond points were ob-tained with single-fibre and fabric experiments. The developedmodel reproduced mechanisms of fabric deformation and progres-sive damage observed in the uniaxial tensile tests. The simulationresults were validated by means of comparison with these tests.The model was not only found to be in good agreement with exper-iments in terms of deformed shape of specimens and force–exten-sion curves but also reproduced all the main features of fabricdeformation and damage behaviour including:
� anisotropic behaviour;� fibre re-orientation towards the loading direction that was
more pronounced for CD than MD;� failure of fibres on reaching their stress or strain thresholds
leading to development of fracture zones;� growth of the fracture zones due to progressive failure of fibres;
the growth rate for fracture zones was higher for CD than MD;
� character of transverse strain including the grip effect;� stress concentration at edges of the bond points.
The model developed with direct introduction of fibres accord-ing to their orientation distribution using the subroutine-basedparametric modelling technique provides an opportunity for a di-rect study of the effects of variation in the fibrous network’s geom-etry on its overall deformation and damage behaviour.Furthermore, the effect of variation in geometric properties of fi-bres and bond points can be studied using this model. This modelnot only captures the anisotropic force–extension behaviour of thematerial linked to its microstructure and material properties ofconstituent fibres but also provides an insight into specific featuresof deformation of fibres and the entire fabric as well as progressivedamage mechanisms. Such capabilities of the model to capture allthe main mechanisms and features of the fabric’s response wouldunderpin understanding the behaviour of the nonwoven fibrousnetworks and their structure–properties relationship.
One of future directions of research will be enhancement of themodel, introduced in the paper, by employing beam elements tomodel fibres. This improvement will enable to account for bucklingof fibres under compression and their flexural stiffness in a moreadequate way. Additionally, beam elements will provide advantagewhen implementing fibre-to-fibre contacts in the FE analysissoftware.
Acknowledgements
We greatly acknowledge support by the Nonwovens Coopera-tive Research Centre of North Carolina State University, Raleigh,USA. FiberVisions�, USA generously provided the material for thisstudy. We also acknowledge the use of Photrom (Fastcam SA3),borrowed from the EPSRC UK Engineering Instrument Pool.
References
Bais-Singh, S., Sherrill, B., Biggers, J.R., Bhuvenesh, C., Goswami, B.C., 1998. Finiteelement modeling of the nonuniform deformation of spun-bonded nonwovens.Text. Res. J. 68 (5), 327–342.
Bhat, G.S., Jangala, P.K., Spruiell, J.E., 2004. Thermal bonding of polypropylenenonwovens: effect of bonding variables on the structure and properties of thefabric. J. Appl. Polymer Sci. 92, 3593–3600.
Blacklock, M., Bale, H., Begley, M.R., Cox, B.N., 2012. Generating virtual textilecomposite specimens using statistical data from micro-computed tomography:1D tow representations for the binary model. J. Mech. Phys. Soilds 60, 451–470.
Bronkhorst, C.A., 2003. Modelling paper as a two-dimensional elastic–plasticstochastic network. Int. J. Solids Struct. 40, 5441–5454.
Chidambaram, A., Davis, H., Batra, S., 2000. Strength loss in thermally bondedpolypropylene fibres. Int. Nonwovens J. 9, 27–35.
Demirci, E., Acar, M., Pourdeyhimi, B., Silberschmidt, V.V., 2011. Finite elementmodelling of thermally bonded bicomponent fibre nonwovens: tensilebehaviour. Comput. Mater. Sci. 50, 1286–1291.
Demirci, E., Acar, M., Pourdeyhimi, B., Silberschmidt, V.V., 2012. Computation ofmechanical anisotropy in thermally bonded component fibre nonwovens.Comput. Mater. Sci. 52, 157–163.
Farukh, F., Demirci, E., Sabuncuoglu, B., Acar, M., Pourdeyhimi, B., Silberschmidt,V.V., 2012a. Numerical modelling of damage initiation in low-density thermallybonded nonwovens. Comput. Mater. Sci. 64, 112–115.
Farukh, F., Demirci, E., Acar, M., Pourdeyhimi, B., Silberschmidt, V.V., 2012b. Meso-scale deformation and damage in thermally bonded nonwovens. J. Mater. Sci.48, 2334–2345.
FiberVisions, 2010. Manufacturer’s Data Sheet, USA.Harrysson, A., Ristinmaa, M., 2008. Large strain elasto-plastic model of paper and
corrugated board. Int. J. Solids Struct. 45, 3334–3352.Hou, X., Acar, M., Silberschmidt, V.V., 2009. 2D finite element analysis of thermally
bonded nonwoven materials: continuous and discontinuous models. Comput.Mater. Sci. 46, 700–707.
Hou, X., Acar, M., Silberschmidt, V.V., 2011a. Finite element simulation of low-density thermally bonded nonwoven materials: effect of orientationdistribution function and arrangement of bond points. Comput. Mater. Sci. 50,1292–1298.
Hou, X., Acar, M., Silberschmidt, V.V., 2011b. Non-uniformity of deformation in low-density thermally bonded nonwoven material: effect of microstructure. J.Mater. Sci. 46, 307–315.

F. Farukh et al. / International Journal of Solids and Structures 51 (2014) 1670–1685 1685
Isaksson, P., Hagglund, R., 2007. Analysis of the strain field in the vicinity of a crack-tip an in-plane isotropic paper material. Int. J. Solids Struct. 44, 659–671.
Isaksson, P., Hagglund, R., 2009. Structural effects on deformation and fracture ofrandom fiber networks and consequences on continuum models. Int. J. SolidsStruct. 46, 2320–2329.
Isaksson, P., Hagglund, R., Gradin, P., 2004. Continuum damage mechanics appliedto paper. Int. J. Solids Struct. 41, 4731–4755.
Isaksson, P., Dumont, P.J.J., Roscoat, S.R., 2012. Crack growth in planar elastic fibermaterials. Int. J. Solids Struct. 49 (13), 1900–1907.
Li, Z., Sun, B., Gu, B., 2010. FEM simulation of 3D angle-interlock woven compositeunder ballistic impact from unit cell approach. J. Mech. Phys. Soilds 49, 171–183.
Michielsen, S., Wang, X., 2002. Rapid morphology (property) changes at the bondperiphery in thermal point-bonded. Int. Nonwovens J. 11 (2), 35–38.
MSC. Marc, 2013a. Theory and User Information. MSC, vol. A.MSC. Marc, 2013b. Program Input. MSC, vol. C.Ostoja-Starzewski, M., Stahl, D.C., 2000. Random fibre networks and special elastic
orthotropy of paper. J. Elast. 60, 131–1349.Parsons, E.M., King, M.J., Socrate, S., 2013. Modeling yarn slip in woven fabric at the
continuum level: simulations of ballistic impact. J. Mech. Phys. Soilds 61, 265–292.
Petterson, D.R., 1959. On the Mechanics of Nonwoven Fabrics (Ph.D. thesis).Massachusetts Institute of Technology.
Ridruejo, A., Gonzalez, C., Llorca, J., 2010. Damage micromechanisms and notchsensitivity of glass-fiber non-woven felts: an experimental and numericalstudy. J. Mech. Phys. Solids 58, 1628–1645.
Ridruejo, A., Gonzalez, C., Llorca, J., 2011. Micromechanisms of deformation andfracture of polypropylene nonwoven fabrics. Int. J. Solids Stuct. 48, 153–162.
Ridruejo, A., Gonzalez, C., Llorca, J., 2012. A constitutive model for the in-planemechanical behavior of nonwoven fabrics. Int. J. Solids Struct. 49 (17), 2215–2229.
Rinaldi, R.G., Blacklock, M., Bale, H., Begley, M.R., Cox, B.N., 2012. Generating virtualtextile composite specimens using statistical data from micro-computedtomography: 3D tow representations. J. Mech. Phys. Soilds 60, 1561–1581.
Sabuncuoglu, B., Acar, M., Silberschmidt, V.V., 2012. A parametric finite elementanalysis method for low-density thermally bonded nonwovens. Comput. Mater.Sci. 52, 164–170.
Sabuncuoglu, B., Acar, M., Silberschmidt, V.V., 2013. Parametric code for generationof finite-element model of nonwovens accounting for orientation distribution offibres. Int. J. Numer. Methods Eng. 94, 441–453.
Schulgasser, K., 1981. On the in-plane elastic constants of paper. Fibre Sci. Technol.15, 257–270.
Silberstein, M.N., Pai, Chia-Ling, Rutledge, G.C., Boyce, M.C., 2012. Elastic–plasticbehavior of non-woven fibrous mats. J. Mech. Phys. Solids 60 (2), 295–318.
Simo, J.C., Hughes, T.J.R., 1998. Computational Inelasticity. Springer.Wang, X., Michielsen, S., 2001. Morphology gradients in thermally point-bonded
polypropylene nonwovens. Text. Res. J. 7, 475–480.Wang, X., Michielsen, S., 2002. Morphology gradients in thermally point-bonded
poly(ethylene terephthalate) nonwovens. Text. Res. J. 72, 394–398.Wilbrink, D.V., Beex, L.A.A., Peelings, R.H.J., 2013. A discrete network model for bond
failure and frictional sliding in fibrous materials. Int. J. Solids Stuct. 50, 1354–1363.