Embed Size (px)
Citation preview

NUTRIENTS IN THE ESSEX
REGION WATERSHED & ITS
NEARSHORE WATERS
Raj BejankiwarWater Quality Specialist
Essex Region Conservation Authority

Outline of the Presentation
Study Area
Data Sources & Monitoring Programs
Results (mainly Total Phosphorus)
-Tributaries
- Nearshore waters
- Sturgeon Creek Watershed
-Tributary loadings and the raw water intakes
Conclusion
Questions

Essex Region Watershed and Lake Erie Basin
Integrated Land Cover – Lake Erie (1992)
Essex Region Watershed: Land Cover 2000

Data SourcesProvincial Water Quality Monitoring Network (PWQMN)Over 32 long-term monitoring stations (1964-1998)
8 Active Stations (1964-2009)
ERCA’s Regionwide Surface Water Monitoring ProgramOver 36 in-stream monitoring stations (general chemistry, nutrients, chlorides and E.coli etc) (since 2001)
Around 28 nearshore monitoring stations (2008 onwards)
Wet weather /regular weather samples.
Flows are also monitored at selected locations.
The 4-Pilot Watershed Monitoring Study Belle River, Little River, Canard River and Big Creek watershed
Over 28 stations including in-stream and nearshore region
Wet weather and regular weather sampling
General chemistry, nutrients, chloride and E.coli

Current Water Quality Monitoring Programs in the Essex Region WS

Why do we care?Human Health Concerns
Drinking Water Quality Bacterial Contamination at beaches
Harmful algal blooms produce toxins that if ingested cause liver damage in humans.
Fish and Wildlife Impacts Low Oxygen Levels in streams and lakes
Impairments to fish and wildlife habitats
Socio-economic Impacts Recreation and Tourism (i.e. Beach Closures) Fishing and Aesthetics Water Intake Clogging Added costs for treating drinking water
Algal blooms : Pelee Island Westshore
(Summer 09)

Key Results : Snap shot of Monitoring Duration & Data
1964 2001 20091996PWQMN
Over 14 Subwatersheds (34 stations)7 Subwatersheds
Data Gap
200920082001ERCA
Over 10 Subwatersheds (36 stations)
Over 17 Subwatersheds (40 stations) + 4 Pilot watersheds (nearshore sites , wet weather and flows)

1
10
100
1000
10000
1964
1966
1968
1970
1972
1974
1976
1978
1980
1982
1984
1986
1988
1990
1992
1994
1996
1998
To
tal
Ph
osp
ho
rus,
mic
ro-g
/L
Big Creek
Cedar Creek
Muddy Creek (Site 1)
Sturgeon Creek
1
10
100
1000
10000
100000
To
tal
Ph
osp
ho
rus,
mic
ro-g
/L
Little River Canard River (Up)
Canard River Dwn Turkey Creek
0
100
200
300
400
500
600
700
800
900
1000
1964
1966
1968
1970
1972
1974
1976
1978
1980
1982
1984
1986
1988
1990
1992
1994
1996
To
tal
Ph
osp
ho
rus,
mic
ro-g
/L Ruscom River
Belle River
Pike Creeek
Puce River

Total P (2001 – 2009)


Essex Region TP Long Term Profile
0
0.5
1
1.5
2
2.5
3
Mean Median 75th Percentile
To
tal P
, µ
g/L
1965-1970 (N=480)
1975-1980 (N=480)
2000-2005 (N= 260)

Drainage Area = 46.6 km2
Agriculture = 63.8 %Urban = 30 %Wooded = 5.6 %Wetlands = 0.6%
Nutrients in the Sturgeon Creek Watershed : Current Status
2,525 µg/L
1,145 µg/L
2,707 µg/L
3,520 µg/L
3,925 µg/L
578 µg/L

Key Conclusions (preliminary)
SC is heavily polluted with nutrients compared to other subwatersheds in the Region
High levels of Total Phosphorus and Nitrates and normal TKN levels
Total Phosphate values are closely equal to Total Phosphorous values
Suggesting sources are likely inorganic fertilizers and not organic sources (manure r septics)
SC watershed and surrounding area has clusters of green house and other horticulture operations
Data base (industrial C of A) does not show any other significant sources of P and N

Impact of Local Watersheds on Nearshore Water Quality
Objective of the Study: Understanding the impacts of tributary loadings on the nearshore water
quality.
Indicator Parameter: Turbidity
Events: Rain, Wind Direction and Wave Height
WTPs: Belle River WTP, Amherstburg WTP, Harrow WTP and Union WTP
Tributary : Ruscom River (gauging stations with long term data).
Method: Frequency Analysis (Statistical)

0
5
10
15
20
25
30
35
40
45
50
Fre
qu
en
cy,
%
Turbidity, NTU
Belle River WTP
Amherstburg WTP
Harrow-Colchester S WTP
Union WTP
2 5 10 20 50 100 200 500 10000
5
10
15
20
25
30
35
0 to 0.1 0.1 to 0.3 0.3 to 1 1 to 3.2 3.2 to 10.0
10.0 to 31.6
31.6 to 100
Fre
qu
en
cy,
%
River Flow, CMS
Belle River WTP
Amherstburg WTP
Harrow-Cochester S WTP
Union WTP
The most common turbidity level is in the range of 10 to 50 NTU (51% of occurrences).
Almost 97% of high turbidity events occur between October and May.
About 57% of the high turbidity events occurred when river flow rates exceeded the mean flow.
This implies that the high turbidity events at the intake are linked to the river flows.
Belle River WTP Intake

WTP % Distribution of events exceeding 100 NTU
Windstorm and
tribs flow
Windstorm
with no river
flow
Only river
flow
Belle River WTP* 90 7 3
Amherstburg WTP 78 4 18
Harrow-Colchester 87 8 5
Union WTP 85 12 3
Summary of Results
Conclusions
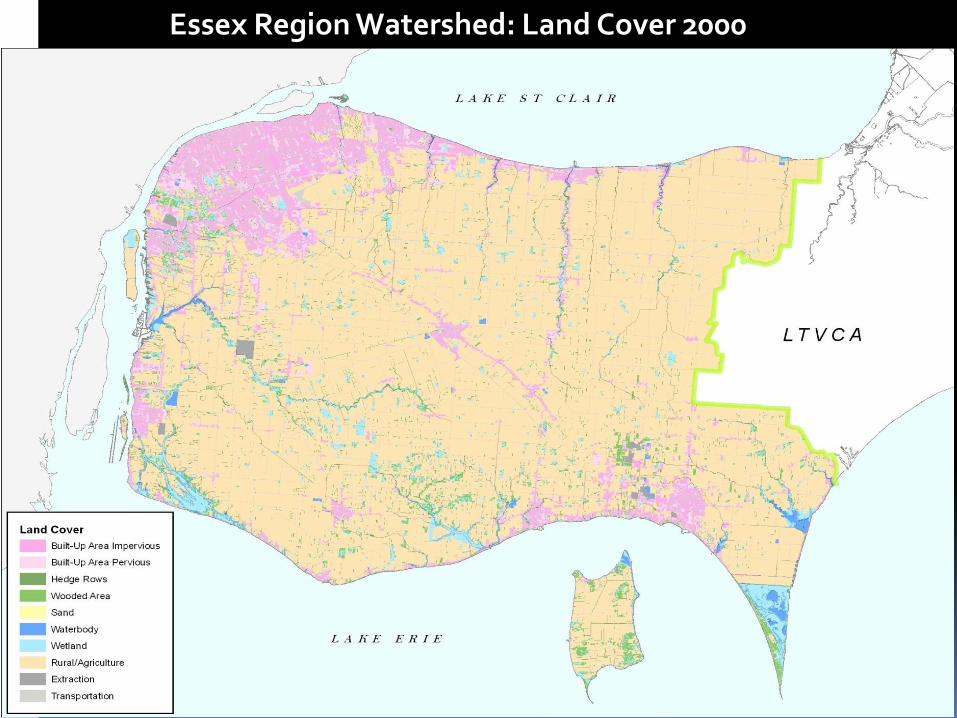
Historic
Significant decrease in TP concentration during 1964 and 1998.
The Essex Region tributaries are consistently high in nutrient levels.
Current
Increasing trend in TP concentrations (in terms of annual mean) at some sites in the Region.
Sturgeon Creek, Lebo Drain and Muddy Creek showed very high levels of TP on consistent basis.
Nearshore & Pilot Watershed Study
High levels of TP and E.coli during wet weather events compared to regular weather samples.
Over 89 % of the samples collected (112 samples) during 2008-2009 exceeded the PWQO limit of 30 µg/L.
Statistical Analysis of daily turbidity data, streams flows and wind data suggest strong correlation between high turbidity levels at the intakes and peak flow events at inland streams.
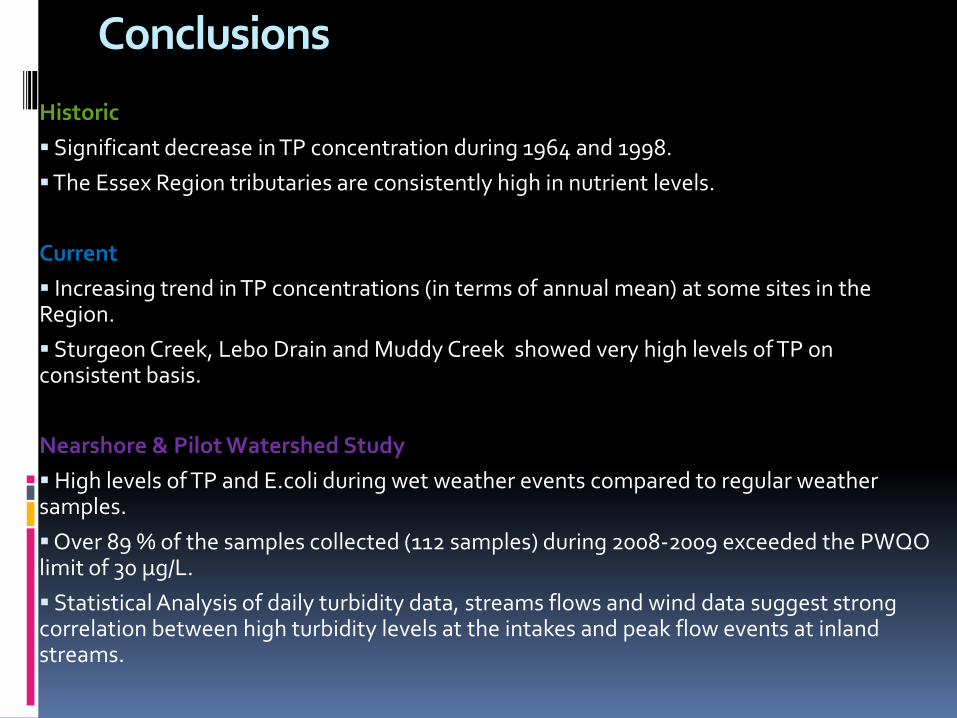
Total Nitrate profiles were very similar to that of TP in terms of historic data, however, a significant decrease in nitrate values in the current data set
Data Gaps
Prior to 2008, water quality monitoring did not consider capturing wet weather events .
Nearshore water quality data was not collected on regular basis.
Flow data for major streams in the Region are not available.
Future Work
Focus on nearshore water quality and loadings from the inland streams, creeks and rivers etc.
Land use and water quality relationship
Soluble Reactive P (SRP) will be included in the ambient monitoring program.
Conclusions….

September 7/8, 2009
September 12, 2009 (Pelee Island, Westshore)
Summer 2002

Thank you!
Special thanks to Tom Dufour (GIS Tech, ERCA)
THANK YOU
the buoy station in Lake St. Clair operated by NOAA (LSCM4) forthe period 2001 to 2006, and the meteorological station operated by the Atmospheric Environment Service(AES) at the Windsor Airport for the period 1953 to 2007. All wind speed data measured at the stations wereconverted to the wind speed at 10 m above the water surface.
High turbidity events occur most frequently when winds are onshore (73%). The offshore winds only accounted for 27% of high turbidity events. During onshore winds there is increased wave activity due to thehigher fetch lengths.