Embed Size (px)
Citation preview

ASEAN INTEGRATION
Obesogenic television food advertising to children inMalaysia: sociocultural variations
See H. Ng1, Bridget Kelly2, Chee H. Se1, Karuthan Chinna3,Mohd Jamil Sameeha4, Shanhi Krishnasamy1, Ismail MN5 andTilakavati Karupaiah1*
1Dietetics Program, School of Healthcare Sciences, Faculty of Health Sciences, National University ofMalaysia, Kuala Lumpur, Malaysia; 2Early Start Research Institute, Faculty of Social Sciences,University of Wollongong, Wollongong, Australia; 3Epidemiology and Biostatistics Unit, Departmentof Social and Preventive Medicine, Faculty of Medicine, University of Malaya, Kuala Lumpur,Malaysia; 4Nutrition Program, School of Healthcare Sciences, Faculty of Health Sciences, NationalUniversity of Malaysia, Kuala Lumpur, Malaysia; 5Nutrition & Dietetics Department, Faculty of HealthSciences, UiTM, Puncak Alam, Malaysia
Background: Food advertising on television (TV) is well known to influence children’s purchasing requests
and models negative food habits in Western countries. Advertising of unhealthy foods is a contributor to the
obesogenic environment that is a key driver of rising rates of childhood obesity. Children in developing
countries are more at risk of being targeted by such advertising, as there is a huge potential for market growth
of unhealthy foods concomitant with poor regulatory infrastructure. Further, in developing countries with
multi-ethnic societies, information is scarce on the nature of TV advertising targeting children.
Objectives: To measure exposure and power of TV food marketing to children on popular multi-ethnic TV
stations in Malaysia.
Design: Ethnic-specific popular TV channels were identified using industry data. TV transmissions were
recorded for each channel from November 2012 to August 2013 (16 hr/day) for randomly selected weekdays
and weekend days during normal days and repeated during school holidays (n�88 days). Coded food/
beverage advertisements were grouped into core (healthy), non-core (non-healthy), or miscellaneous
(unclassified) food categories. Peak viewing time (PVT) and persuasive marketing techniques were identified.
Results: Non-core foods were predominant in TV food advertising, and rates were greater during school
holidays compared to normal days (3.51 vs 1.93 food ads/hr/channel, pB0.001). During normal days’ PVT, the
ratio of non-core to core food advertising was higher (3.25 food ads/hr/channel), and this more than trebled
during school holidays to 10.25 food ads/hr/channel. Popular channels for Indian children had the lowest rate of
food advertising relative to other ethnic groups. However, sugary drinks remained a popular non-core product
advertised across all broadcast periods and channels. Notably, promotional characters doubled for non-core
foods during school holidays compared to normal days (1.91 vs 0.93 food ads/hr/channel, pB0.001).
Conclusions: This study highlights non-core food advertising, and predominantly sugary drinks are
commonly screened on Malaysian TV channels. The majority of these sugary drinks were advertised by
multinational companies, and this observation warrants regulatory attention.
Keywords: content analysis; food marketing; television; sugar-sweetened drink; obesogenic environment
Responsible Editor: Peter Byass, Umea University, Sweden.
*Correspondence to: Tilakavati Karupaiah, Dietetics Program, School of Healthcare Sciences, Faculty of
Health Sciences, National University of Malaysia, Kuala Lumpur, Malaysia, Email: [email protected]
Received: 11 June 2014; Revised: 11 July 2014; Accepted: 28 July 2014; Published: 19 August 2014
Food marketing is an important environmental and
contextual factor influencing eating behaviours
and is a worldwide public health concern (1).
Within marketing, food promotion is a form of commu-
nication designed to increase the recognition, appeal and/
or consumption of specific food products (2). In this
communication environment, television (TV) is a major
source of children’s exposure to food advertisements (1, 3).
TV advertising has long been recognised as an effec-
tive medium to reach out to children by food industry
Global Health Action �
Global Health Action 2014. # 2014 See H. Ng et al. This is an Open Access article distributed under the terms of the Creative Commons CC-BY 4.0 License(http://creativecommons.org/licenses/by/4.0/), allowing third parties to copy and redistribute the material in any medium or format and to remix, transform, andbuild upon the material for any purpose, even commercially, provided the original work is properly cited and states its license.
1
Citation: Glob Health Action 2014, 7: 25169 - http://dx.doi.org/10.3402/gha.v7.25169(page number not for citation purpose)
and is a primary promotional channel for food marketers
(4, 5). Exposure and the power of marketing are two
important elements to assess the impact of food market-
ing on children, as emphasised by the World Health
Organization (WHO) (1). ‘Exposure’ is defined as the
number of times a viewer is exposed to a message,
whereas ‘power’ is defined as a food advertiser’s technique
to target young and impressionable consumers through
the use of promotional characters and premium offers
(1, 6). Although content analyses of TV food marketing
in developed countries have provided information on the
use of the elements of exposure and power in advertise-
ments targeting children (7), such data in developing
countries are still scarce.
Gorn and Goldberg (8) were the first to experimentally
demonstrate that daily exposure to televised candy adver-
tisements could influence children choosing candy over
fruits. The United States National Health Examination
Survey indicated that for both young and teenage children,
the amount of time spent watching TV was linked to
prevalence of obesity (9). Subsequently, systematic reviews
have provided modest evidence showing food marketing
generates positive beliefs, affects nutrition knowledge, and
influences children’s food preferences and food consump-
tion patterns, as well as strong evidence that marketing
enhances purchase requests to parents (4, 10�12). It is
proposed that the impact of food promotion on children in
developing countries may be greater compared to those in
developed countries (13). Such children may be less
familiar with advertising and less practiced in navigating
commercial messages. The growing middle classes in
emerging market economies such as China, India, and
many Southeast Asian countries provide unparalleled
growth opportunities for global multinational food com-
panies who need to generate new growth after saturation in
developed markets (14).
Indeed, it is noted that the world’s food system is not a
competitive marketplace of small or local producers but
driven by multinational food companies (15). It has been
documented that in developed countries, marketing
strategies employed by multinational food companies
target young people to become lifelong consumers and
influence household purchases (4, 16). The excessive
consumption of often energy-dense ultra-processed foods
is blamed for the rising obesity epidemics and incidence
of non-communicable diseases (NCDs) in Western na-
tions (17). Of concern is that such marketing strategies,
when transplanted to developing countries, would also
ultimately result in these health issues if expansion of
trade, foreign direct investments, and transnational food
corporations proliferate in emerging economies (18). Yet,
public health professionals have responded slowly to such
nutritional threats in developed countries and even slower
in developing countries (15). In a transitional society such
as Malaysia which has witnessed economic expansion in
the last three decades, overall childhood obesity preva-
lence in 2006 was reported to be 19.9% in Malaysia, but
prevalence patterns by ethnicity were indicated to be
26.6% in Chinese, 26.1% in Indian, and 18.9% in Malay
communities (19).
The obesogenic environment in Malaysia is poorly
defined. Multinational food companies’ signatories to the
International Food and Beverage Alliance (IFBA) have a
presence in Malaysia (20). But the specific regulatory
criteria promoted by IFBA appear to be permissive in the
type of foods suitable for advertising to children (authors’
opinion). A preliminary study in Malaysia conducted in
2006�2007 highlighted that a large proportion of TV
advertising (56%) promoted foods high in fat, refined
sugars, and salt (21). Concurrent to the time period of
this study, Malaysian government guidelines restricted
advertising and sponsorship by fast-food companies
during children’s TV programs (22). In this study, the
majority of food advertisements broadcasted on local TV
channels were snack foods, dairy products, confectionary,
biscuits, and fast food. The limitation of this study was
advertising data were provided by participating TV
stations rather than adapting live telecast recordings as
an independent approach. The method for data analysis
changed with a recent study employing live recording in
Singapore (5) and evaluating persuasive marketing tech-
niques used by the food industry in Australia (6). Given
the evolution of assessments over time in TV food
marketing, a need is suggested to adopt new methodolo-
gies to effectively evaluate the local TV food marketing
scenario.
This study aimed to measure exposure and power of
TV food marketing to children in Malaysia, which is a
multi-ethnic, developing country. We expect that the
outcomes from this study will contribute to existing
evidence on the obesogenic environment in three ways:
1) it will explore variations in advertising patterns with
seasonal variation (normal days vs school holidays)
which is recognised as an evidence gap (21, 23) and
peak versus non-peak viewing time; 2) it will explore
differences in marketing techniques used to target differ-
ent cultural groups as highlighted by previous researchers
(5, 24); and 3) it will explore the use of persuasive
techniques in food advertising.
Methods
TV channel identification
Popular channels were identified based on ethnic-specific
viewership data generated by Nielsen’s Television Audi-
ence Measurement (TAM) (25). The channels deemed
popular were determined through TV viewer rating.
Ratings for a 1-week period (9�15 October 2011) identified
the most popular channels for children aged 4�14 years
based on three major ethnic groups � Malay, Chinese, and
See H. Ng et al.
2(page number not for citation purpose)
Citation: Glob Health Action 2014, 7: 25169 - http://dx.doi.org/10.3402/gha.v7.25169
Indian. Viewership share (%) of channels was defined as
the proportion of individuals’ viewership per channel com-
pared to the total viewership for all channels for same time
period (25). Based on these criteria for popular viewership,
selected channels were free-to-air (FTA) and satellite TV
(Pay-TV) channels that had a household penetration of
more than 50%. Selected Pay-TV channels were Astro
Cartoon Network (CTWK), Astro Hua Hee Dai (HHD),
Astro Wah Lai Toi (WLT), Astro SUN TV (Sun TV),
Astro Adithya and Astro Vellithirai (VT). FTA channels
excluded were Al-Hijrah and TV1. The majority of the
selected channels were not exclusive to children viewership
except for the CTWK channel. However, as per TAM data,
these channels were still drawing the largest child audience
(data not shown). Overall 103 TV channels were assessed
by Nielsen’s TAM ratings to identify the ethnic-specific
popular channels to be used in the data sampling.
Data sampling
The TV sampling method has been described elsewhere
(26, 27). Transmissions from live TV channels were
recorded onto hard discs. In brief, TV transmissions
were recorded using a personal video recorder (PVR,
Kworld Analog TV Card II, Taipei, Taiwan) and software
(Windows Media Centre) between 06:00 and 22:00 hours
daily (16 hr/day) on randomly selected days falling
between November 2012 to August 2013. For each
channel, transmissions were recorded for two weekdays
and two weekend days in a week during normal days and
this cycle was repeated during the school holiday seasons
(n�88 days). Normal days were defined as schooling
days in Malaysia which excluded public holidays or large
sporting competitions. This 10-month recording period
excluded the Muslim month of Ramadhan and Syawal
which otherwise has been noted to cause variation in
advertising exposure (21). The Hindu festive season
of Diwali also falls outside of the recording period.
However, Christmas and Chinese New Year did fall within
the stated 10-month recording period. In Malaysia,
Christmas is only a single public holiday, and there was
no change to advertising patterns observed. Chinese New
Year has a greater impact on TV advertising patterns,
particularly for the popular Chinese TV channels related
to a significantly large Chinese population in Malaysia.
Therefore, recording transmission data was stopped 2
weeks before Chinese New Year.
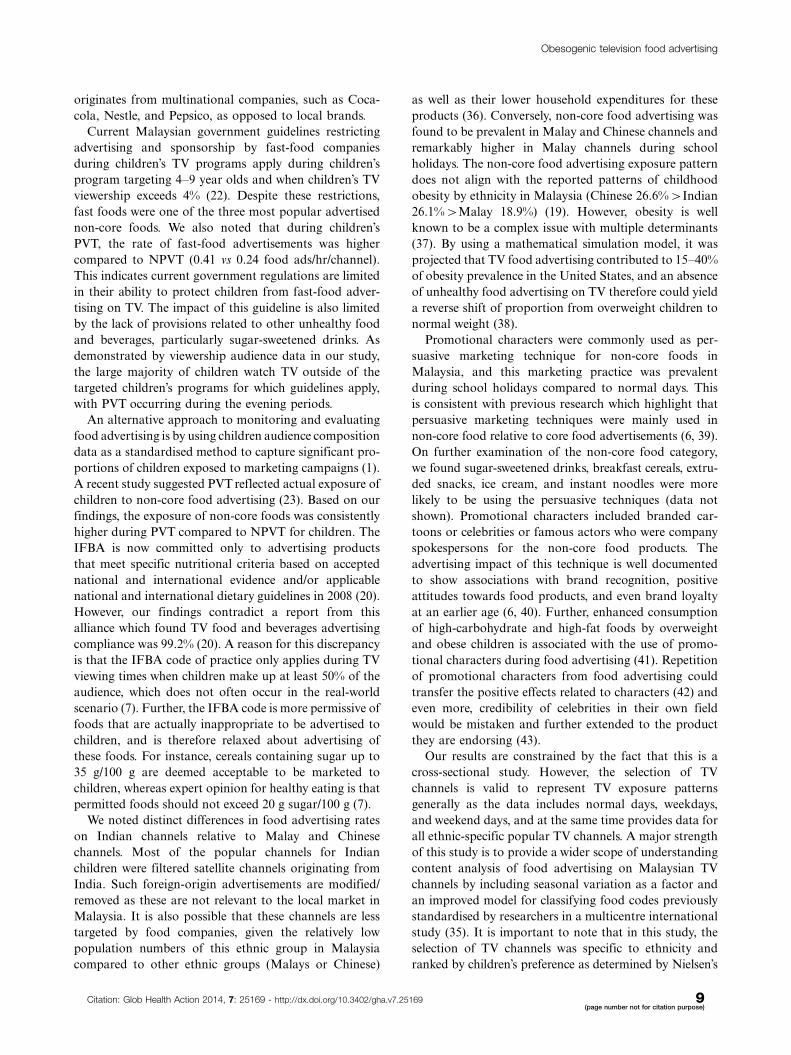
Data coding
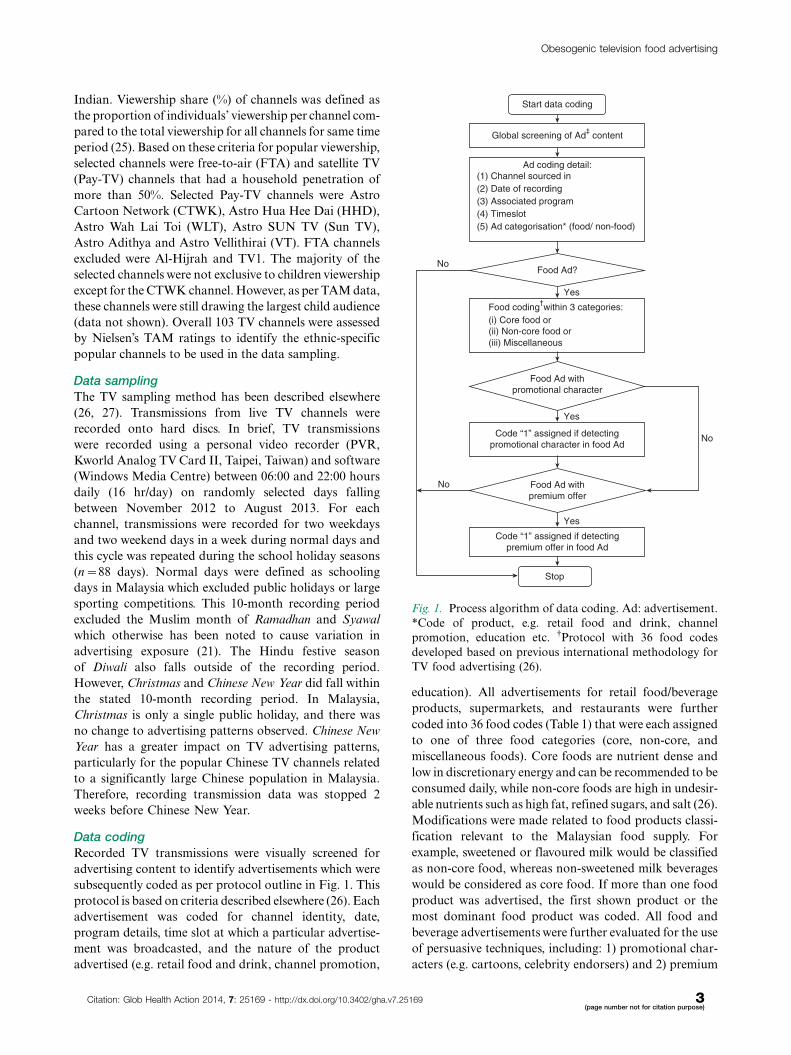
Recorded TV transmissions were visually screened for
advertising content to identify advertisements which were
subsequently coded as per protocol outline in Fig. 1. This
protocol is based on criteria described elsewhere (26). Each
advertisement was coded for channel identity, date,
program details, time slot at which a particular advertise-
ment was broadcasted, and the nature of the product
advertised (e.g. retail food and drink, channel promotion,
education). All advertisements for retail food/beverage
products, supermarkets, and restaurants were further
coded into 36 food codes (Table 1) that were each assigned
to one of three food categories (core, non-core, and
miscellaneous foods). Core foods are nutrient dense and
low in discretionary energy and can be recommended to be
consumed daily, while non-core foods are high in undesir-
able nutrients such as high fat, refined sugars, and salt (26).
Modifications were made related to food products classi-
fication relevant to the Malaysian food supply. For
example, sweetened or flavoured milk would be classified
as non-core food, whereas non-sweetened milk beverages
would be considered as core food. If more than one food
product was advertised, the first shown product or the
most dominant food product was coded. All food and
beverage advertisements were further evaluated for the use
of persuasive techniques, including: 1) promotional char-
acters (e.g. cartoons, celebrity endorsers) and 2) premium
Food Ad?
Ad coding detail:(1) Channel sourced in(2) Date of recording(3) Associated program (4) Timeslot (5) Ad categorisation* (food/ non-food)
Food Ad withpromotional character
Stop
Global screening of Ad‡ content
Start data coding
Food coding†within 3 categories: (i) Core food or(ii) Non-core food or(iii) Miscellaneous
Code “1” assigned if detectingpromotional character in food Ad
Food Ad withpremium offer
Code “1” assigned if detectingpremium offer in food Ad
Yes
Yes
Yes
No
No
No
Fig. 1. Process algorithm of data coding. Ad: advertisement.
*Code of product, e.g. retail food and drink, channel
promotion, education etc. $Protocol with 36 food codes
developed based on previous international methodology for
TV food advertising (26).
Obesogenic television food advertising
Citation: Glob Health Action 2014, 7: 25169 - http://dx.doi.org/10.3402/gha.v7.25169 3(page number not for citation purpose)

Table 1. Seasonal variation in 11 popular TV channels targeting children
Rate of food advertising (food
ads/hr/channel)
Overall mean (food
ads/hr/channel)
Normal
daysa
School
holidays p
Non-core foodsb 2.73 1.93 3.53 B0.001
Sugar-sweetened drinks 0.80 0.43 1.16
Sweet breads/cakes/muffins/buns/biscuits, glutinous rice balls/cakes/
pudding, high-fat savoury biscuits, pies, pastries
0.29 0.29 0.29
Fast food (not only healthier options advertised) 0.28 0.26 0.29
Savoury snack foods (added salt or fat) � chips, dried spicy peas, fruit
chips, savoury crisps, extruded snacks, popcorn (exclude plain), salted or
coated nuts, other fried snacks
0.20 0.13 0.27
Chocolate and candy 0.17 0.15 0.19
Flavoured/fried instant rice and noodle products 0.16 0.13 0.19
Ice cream, iced confection, and desserts 0.15 0.10 0.20
Flavoured or dairy products with added sugar and alternatives 0.13 0.07 0.19
High-sugar and/or low-fibre breakfast cereals (�20 g sugars/100 g or B5 g
dietary fibre/100 g)
0.13 0.07 0.18
Meat and meat alternatives processed/preserved in salt 0.11 0.14 0.08
High-fat/salt meals � frozen, packaged meals (�6 g saturated fat/serve,
�900 mg sodium/serve)
0.09 0.06 0.12
Sweet snack foods � jelly, sugar-coated dried fruits or nuts, nut/seed
based bars and slices, sweet rice bars, and tinned fruit in syrup
0.09 0.05 0.13
Fruit juice/drinks (B98% fruit) 0.08 0.03 0.13
Other high-fat/salt products � high-fat savoury sauces (�10 g fat/100),
soups (�2 g fat/100 g; all dehydrated)
0.07 0.04 0.10
Alcohol 0.00 0.00 0.00
Core foodsc 0.42 0.45 0.39 0.073
Plain milks and yoghurts, cheese, and alternatives 0.13 0.16 0.10
Breads, rice, and rice products without added fat, sugar, or salt 0.08 0.09 0.07
Low-sugar, high-fibre breakfast cereals (B20 g sugar/100 g and �5 g
fibre/100 g)
0.06 0.07 0.06
Healthy snacks � B600 kJ/serve, B3 g saturated fat/serve, and B200 mg
sodium/serve
0.06 0.05 0.06
Oils high in mono- or polyunsaturated fats, and low-fat sauces (B10 g fat/
100 g)
0.04 0.05 0.03
Fruits and fruit products without added fats, sugars, or salt 0.02 0.02 0.03
Meat and meat alternatives 0.01 0.01 0.02
Water 0.01 0.00 0.02
Vegetables and vegetable products without added fats, sugars, or salt 0.00 0.00 0.00
Low-fat/salt meals: meals (56 g saturated fat/serve, 5900 mg sodium/
serve), soups (B2 g fat/100 g, exclude dehydrated), sandwiches, mixed
salads
0.00 0.00 0.00
Baby foods (exclude milk formulae) 0.00 0.00 0.00
Miscellaneous foods/food-relatedd 0.75 0.74 0.76 0.396
Vitamin/mineral or other dietary supplements, and sugar-free chewing gum 0.28 0.27 0.30
Recipe additions (including soup cubes, oils, dried herbs, and seasonings) 0.16 0.19 0.14
Baby and toddler milk formulae 0.16 0.11 0.21
Tea and coffee 0.07 0.08 0.07
Fast-food restaurant (no foods or beverages advertised) 0.05 0.05 0.04
Supermarkets (non-core foods advertised) 0.02 0.04 0.00
Supermarkets (no foods or beverages advertised) 0.00 0.00 0.00
See H. Ng et al.
4(page number not for citation purpose)
Citation: Glob Health Action 2014, 7: 25169 - http://dx.doi.org/10.3402/gha.v7.25169
offers (e.g. giveaways, competitions, contests, vouchers,
and rebates).
Advertisements were coded by three researchers. To
ensure consistency in data coding, an inter-coder relia-
bility test was carried out between researchers based on
1) the number of food advertisements recorded and 2) the
food code recorded, using an 1-hour random identical
sample of TV data (28). The inter-coder reliability was
100% for both the number of food advertisements
recorded, and food coding too.
Data interpretation
Coded datasets were cleaned and food codes were
validated by three professionals (SCH, MJS, KS) with
nutrition and dietetic knowledge. Differences in profes-
sional opinion were analysed and resolved by an expert
panel (BK, TK). Children’s peak viewing time (PVT) was
defined as the period of the day when ]25% of the
maximum children’s audience were likely to be watching
TV (26) as defined by Nielsen TAM data for weekday
(from 19.00 to 22.00 hours) and weekend (from 15.00 to
16.00 hours and 19.00 to 22.00 hours) periods (29).
Viewing time outside the defined PVT was non-peak
viewing time (NPVT). Aggregation of each sample was
performed to determine the count of advertisements in an
hour as described by previous research (30). The average
number of food advertisements per hour (rate) was
calculated for each food category (core, non-core, and
miscellaneous). Rates of core and non-core food adver-
tising were assessed for normal days versus school
holidays, for peak versus non-peak viewing times, and
also to observe if usage of persuasive techniques in food
marketing influenced these rates.
Statistical analysis
As the rates of food advertisements over time did not
fulfil normality assumptions, non-parametric analyses
(Mann-Whitney U test) was used to examine seasonal
differences between rates of core and non-core food
advertising. Kruskal-Wallis test was applied to detect
differences between ethnic channels for both normal days
and school days. Post hoc analysis for pairwise compari-
sons between channels was carried out using Dunn Test
with Bonferroni correction. A p-value threshold of 0.05
was used to determine statistical significance for all data
analysis. The statistical analysis was conducted using
IBM Statistical Package for Social Sciences, version 19.0
(IBM SPSS Statistics Inc., Chicago, IL).
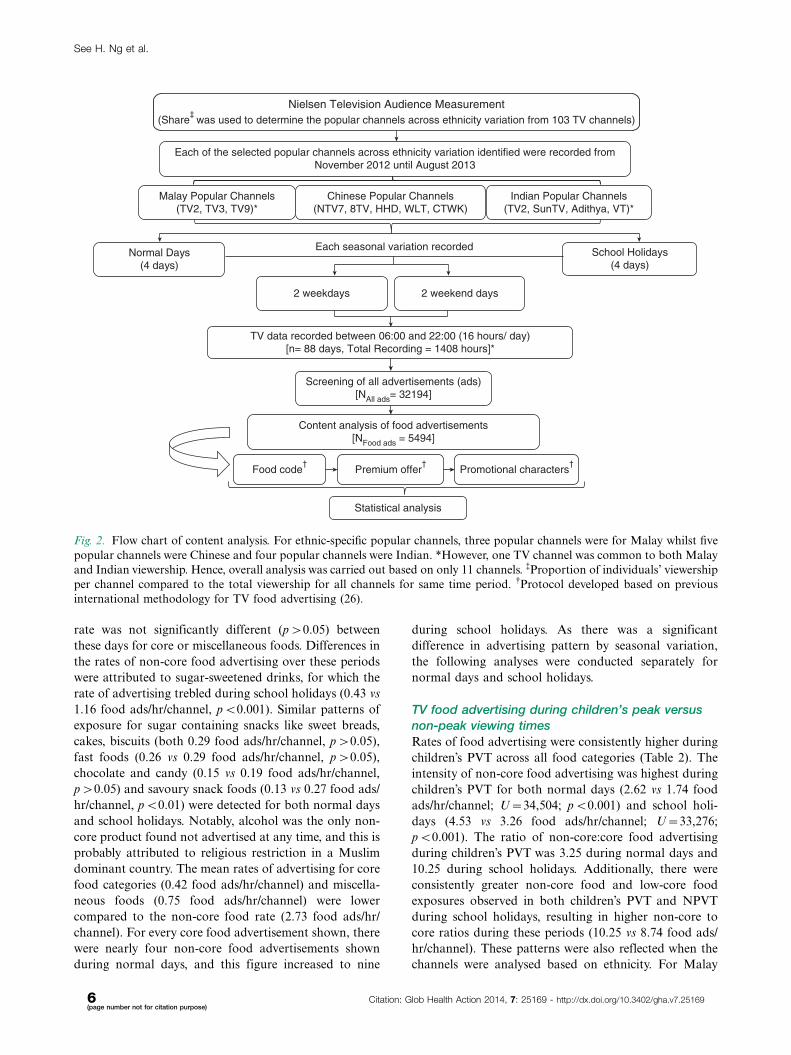
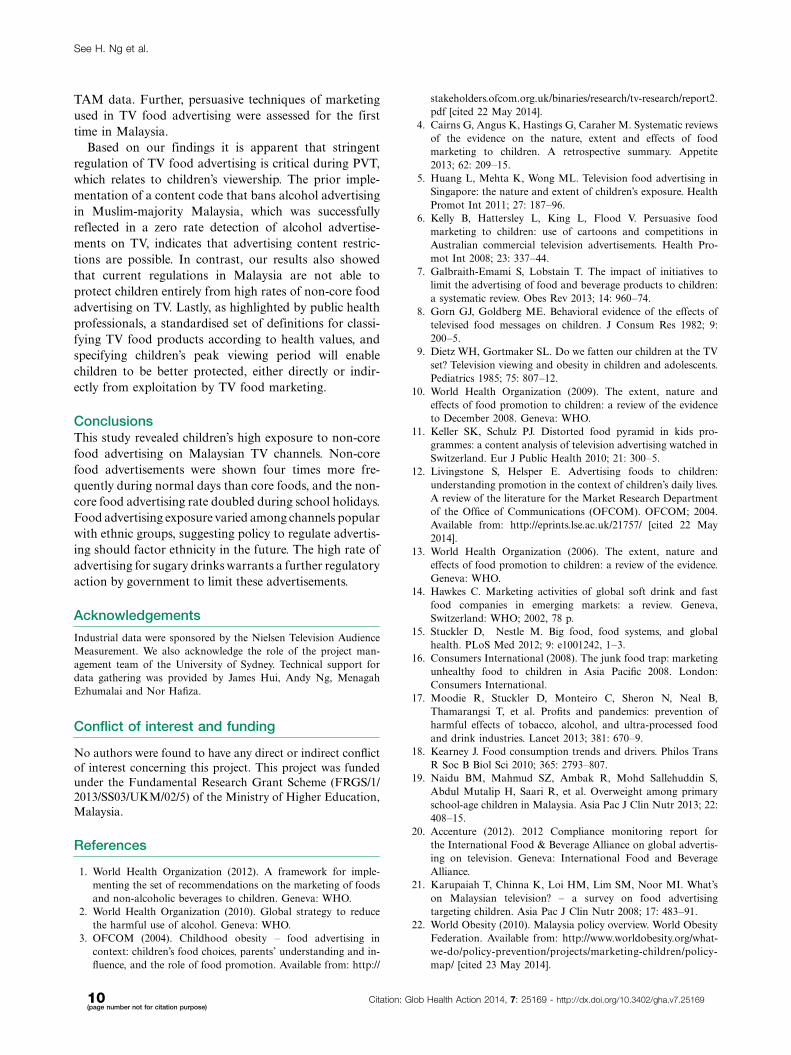
Figure 2 summarises the flow process of content
analysis carried out for this study.
ResultsFrom 103 TV channels identified through Nielsen data,
11 popular channels were related to ethnicity. Malay
popular channels were TV2, TV3, and TV9 whilst NTV7,
8TV, HHD, WLT, and CTWK were Chinese and Sun TV,
VT, and Adithya were Indian popular channels. One
channel (TV2) was common to both Malay and Indian
ethnic groups. A mean rate of 3.90 food ads/hr/channel
across the 11 children’s popular channels in Malaysia was
established. Of the 1,408 hours of TV broadcasting that
were analysed, a total of 32,194 advertisements were
identified of which 5,494 were for food (17.1%).
Food advertising patterns: normal days versus
school holidays
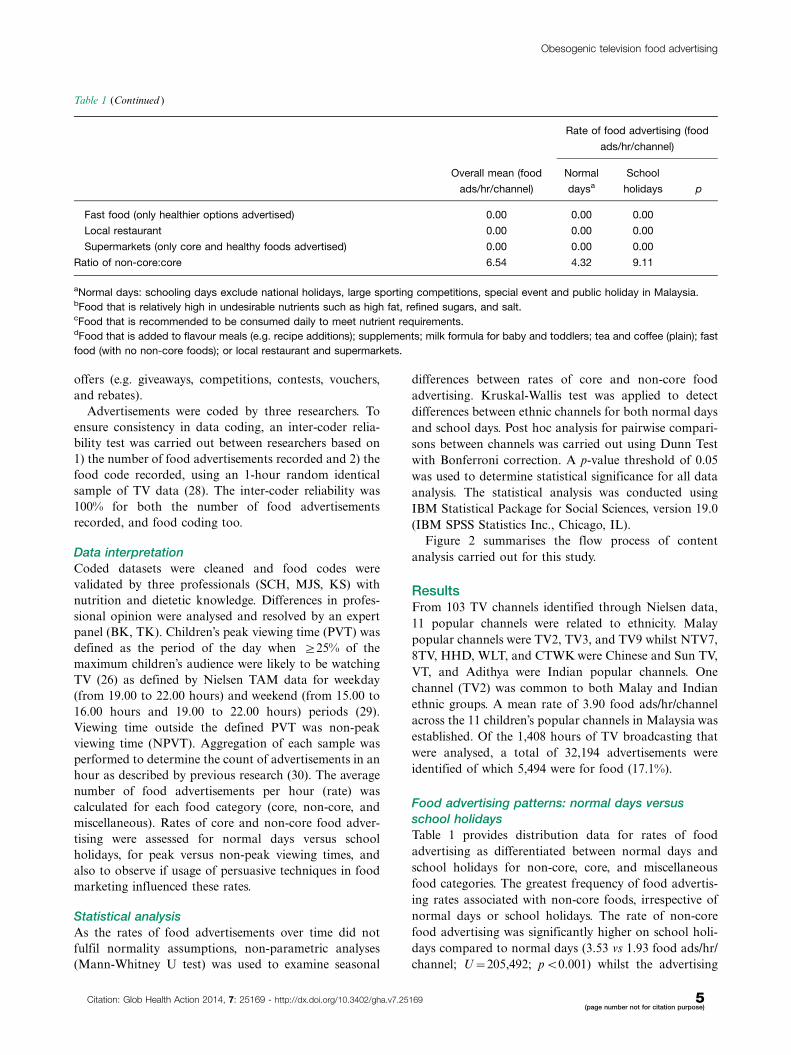
Table 1 provides distribution data for rates of food
advertising as differentiated between normal days and
school holidays for non-core, core, and miscellaneous
food categories. The greatest frequency of food advertis-
ing rates associated with non-core foods, irrespective of
normal days or school holidays. The rate of non-core
food advertising was significantly higher on school holi-
days compared to normal days (3.53 vs 1.93 food ads/hr/
channel; U�205,492; pB0.001) whilst the advertising
Table 1 (Continued )
Rate of food advertising (food
ads/hr/channel)
Overall mean (food
ads/hr/channel)
Normal
daysa
School
holidays p
Fast food (only healthier options advertised) 0.00 0.00 0.00
Local restaurant 0.00 0.00 0.00
Supermarkets (only core and healthy foods advertised) 0.00 0.00 0.00
Ratio of non-core:core 6.54 4.32 9.11
aNormal days: schooling days exclude national holidays, large sporting competitions, special event and public holiday in Malaysia.bFood that is relatively high in undesirable nutrients such as high fat, refined sugars, and salt.cFood that is recommended to be consumed daily to meet nutrient requirements.dFood that is added to flavour meals (e.g. recipe additions); supplements; milk formula for baby and toddlers; tea and coffee (plain); fast
food (with no non-core foods); or local restaurant and supermarkets.
Obesogenic television food advertising
Citation: Glob Health Action 2014, 7: 25169 - http://dx.doi.org/10.3402/gha.v7.25169 5(page number not for citation purpose)
rate was not significantly different (p�0.05) between
these days for core or miscellaneous foods. Differences in
the rates of non-core food advertising over these periods
were attributed to sugar-sweetened drinks, for which the
rate of advertising trebled during school holidays (0.43 vs
1.16 food ads/hr/channel, pB0.001). Similar patterns of
exposure for sugar containing snacks like sweet breads,
cakes, biscuits (both 0.29 food ads/hr/channel, p�0.05),
fast foods (0.26 vs 0.29 food ads/hr/channel, p�0.05),
chocolate and candy (0.15 vs 0.19 food ads/hr/channel,
p�0.05) and savoury snack foods (0.13 vs 0.27 food ads/
hr/channel, pB0.01) were detected for both normal days
and school holidays. Notably, alcohol was the only non-
core product found not advertised at any time, and this is
probably attributed to religious restriction in a Muslim
dominant country. The mean rates of advertising for core
food categories (0.42 food ads/hr/channel) and miscella-
neous foods (0.75 food ads/hr/channel) were lower
compared to the non-core food rate (2.73 food ads/hr/
channel). For every core food advertisement shown, there
were nearly four non-core food advertisements shown
during normal days, and this figure increased to nine
during school holidays. As there was a significant
difference in advertising pattern by seasonal variation,
the following analyses were conducted separately for
normal days and school holidays.
TV food advertising during children’s peak versus
non-peak viewing times
Rates of food advertising were consistently higher during
children’s PVT across all food categories (Table 2). The
intensity of non-core food advertising was highest during
children’s PVT for both normal days (2.62 vs 1.74 food
ads/hr/channel; U�34,504; pB0.001) and school holi-
days (4.53 vs 3.26 food ads/hr/channel; U�33,276;
pB0.001). The ratio of non-core:core food advertising
during children’s PVT was 3.25 during normal days and
10.25 during school holidays. Additionally, there were
consistently greater non-core food and low-core food
exposures observed in both children’s PVT and NPVT
during school holidays, resulting in higher non-core to
core ratios during these periods (10.25 vs 8.74 food ads/
hr/channel). These patterns were also reflected when the
channels were analysed based on ethnicity. For Malay
Each of the selected popular channels across ethnicity variation identified were recorded fromNovember 2012 until August 2013
TV data recorded between 06:00 and 22:00 (16 hours/ day)[n= 88 days, Total Recording = 1408 hours]*
2 weekend days2 weekdays
Screening of all advertisements (ads)[NAll ads= 32194]
Content analysis of food advertisements[NFood ads = 5494]
Promotional characters†
Premium offer†
Food code†
Statistical analysis
Nielsen Television Audience Measurement(Share
‡ was used to determine the popular channels across ethnicity variation from 103 TV channels)
Normal Days(4 days)
School Holidays(4 days)
Chinese Popular Channels(NTV7, 8TV, HHD, WLT, CTWK)
Malay Popular Channels(TV2, TV3, TV9)*
Indian Popular Channels(TV2, SunTV, Adithya, VT)*
Each seasonal variation recorded
Fig. 2. Flow chart of content analysis. For ethnic-specific popular channels, three popular channels were for Malay whilst five
popular channels were Chinese and four popular channels were Indian. *However, one TV channel was common to both Malay
and Indian viewership. Hence, overall analysis was carried out based on only 11 channels. %Proportion of individuals’ viewership
per channel compared to the total viewership for all channels for same time period. $Protocol developed based on previous
international methodology for TV food advertising (26).
See H. Ng et al.
6(page number not for citation purpose)
Citation: Glob Health Action 2014, 7: 25169 - http://dx.doi.org/10.3402/gha.v7.25169
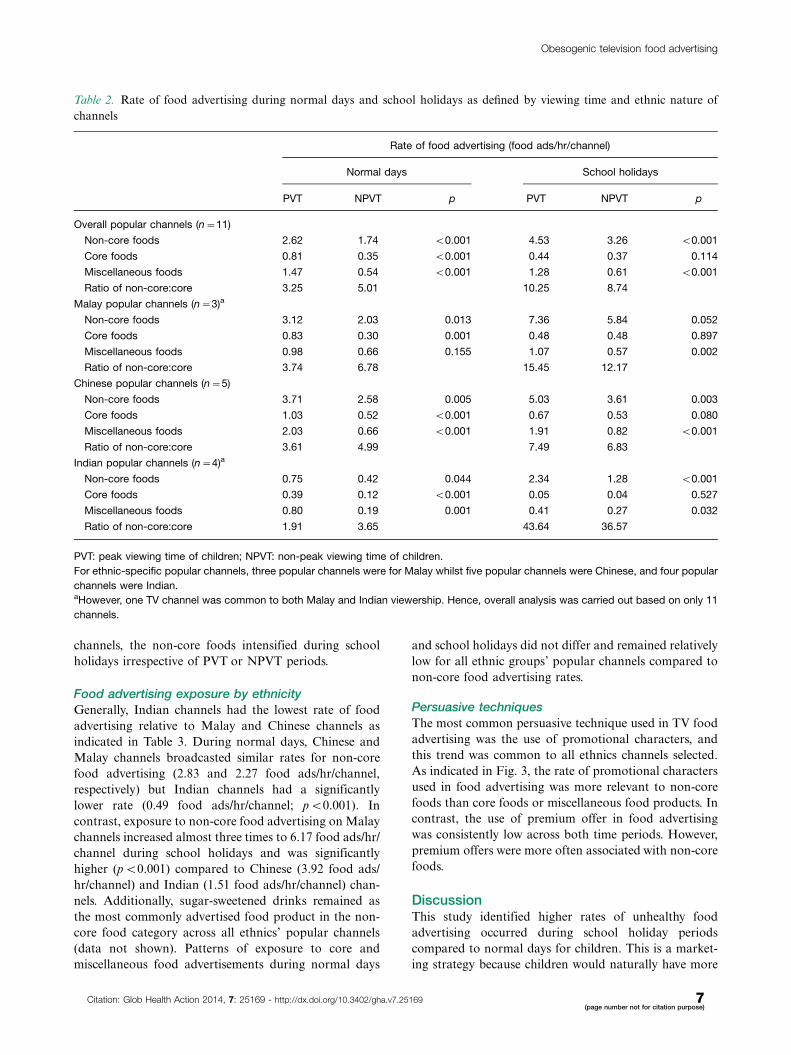
channels, the non-core foods intensified during school
holidays irrespective of PVT or NPVT periods.
Food advertising exposure by ethnicityGenerally, Indian channels had the lowest rate of food
advertising relative to Malay and Chinese channels as
indicated in Table 3. During normal days, Chinese and
Malay channels broadcasted similar rates for non-core
food advertising (2.83 and 2.27 food ads/hr/channel,
respectively) but Indian channels had a significantly
lower rate (0.49 food ads/hr/channel; pB0.001). In
contrast, exposure to non-core food advertising on Malay
channels increased almost three times to 6.17 food ads/hr/
channel during school holidays and was significantly
higher (pB0.001) compared to Chinese (3.92 food ads/
hr/channel) and Indian (1.51 food ads/hr/channel) chan-
nels. Additionally, sugar-sweetened drinks remained as
the most commonly advertised food product in the non-
core food category across all ethnics’ popular channels
(data not shown). Patterns of exposure to core and
miscellaneous food advertisements during normal days
and school holidays did not differ and remained relatively
low for all ethnic groups’ popular channels compared to
non-core food advertising rates.
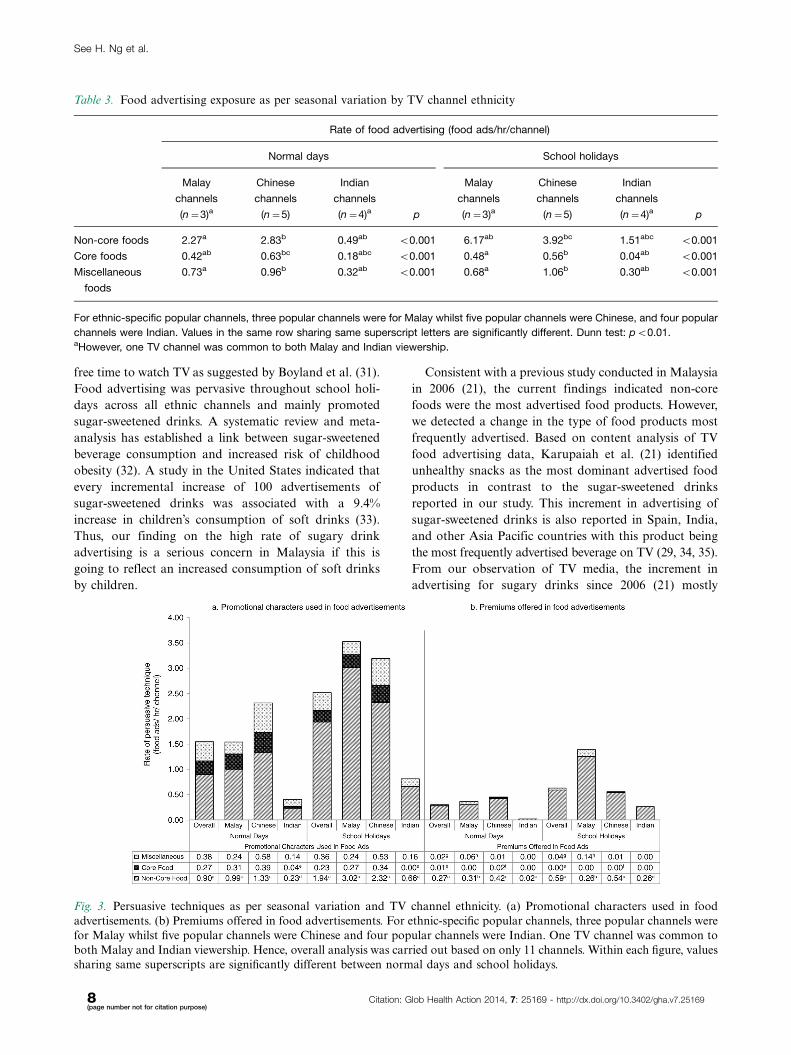
Persuasive techniques
The most common persuasive technique used in TV food
advertising was the use of promotional characters, and
this trend was common to all ethnics channels selected.
As indicated in Fig. 3, the rate of promotional characters
used in food advertising was more relevant to non-core
foods than core foods or miscellaneous food products. In
contrast, the use of premium offer in food advertising
was consistently low across both time periods. However,
premium offers were more often associated with non-core
foods.
DiscussionThis study identified higher rates of unhealthy food
advertising occurred during school holiday periods
compared to normal days for children. This is a market-
ing strategy because children would naturally have more
Table 2. Rate of food advertising during normal days and school holidays as defined by viewing time and ethnic nature of
channels
Rate of food advertising (food ads/hr/channel)
Normal days School holidays
PVT NPVT p PVT NPVT p
Overall popular channels (n�11)
Non-core foods 2.62 1.74 B0.001 4.53 3.26 B0.001
Core foods 0.81 0.35 B0.001 0.44 0.37 0.114
Miscellaneous foods 1.47 0.54 B0.001 1.28 0.61 B0.001
Ratio of non-core:core 3.25 5.01 10.25 8.74
Malay popular channels (n�3)a
Non-core foods 3.12 2.03 0.013 7.36 5.84 0.052
Core foods 0.83 0.30 0.001 0.48 0.48 0.897
Miscellaneous foods 0.98 0.66 0.155 1.07 0.57 0.002
Ratio of non-core:core 3.74 6.78 15.45 12.17
Chinese popular channels (n�5)
Non-core foods 3.71 2.58 0.005 5.03 3.61 0.003
Core foods 1.03 0.52 B0.001 0.67 0.53 0.080
Miscellaneous foods 2.03 0.66 B0.001 1.91 0.82 B0.001
Ratio of non-core:core 3.61 4.99 7.49 6.83
Indian popular channels (n�4)a
Non-core foods 0.75 0.42 0.044 2.34 1.28 B0.001
Core foods 0.39 0.12 B0.001 0.05 0.04 0.527
Miscellaneous foods 0.80 0.19 0.001 0.41 0.27 0.032
Ratio of non-core:core 1.91 3.65 43.64 36.57
PVT: peak viewing time of children; NPVT: non-peak viewing time of children.
For ethnic-specific popular channels, three popular channels were for Malay whilst five popular channels were Chinese, and four popular
channels were Indian.aHowever, one TV channel was common to both Malay and Indian viewership. Hence, overall analysis was carried out based on only 11
channels.
Obesogenic television food advertising
Citation: Glob Health Action 2014, 7: 25169 - http://dx.doi.org/10.3402/gha.v7.25169 7(page number not for citation purpose)
free time to watch TV as suggested by Boyland et al. (31).
Food advertising was pervasive throughout school holi-
days across all ethnic channels and mainly promoted
sugar-sweetened drinks. A systematic review and meta-
analysis has established a link between sugar-sweetened
beverage consumption and increased risk of childhood
obesity (32). A study in the United States indicated that
every incremental increase of 100 advertisements of
sugar-sweetened drinks was associated with a 9.4%
increase in children’s consumption of soft drinks (33).
Thus, our finding on the high rate of sugary drink
advertising is a serious concern in Malaysia if this is
going to reflect an increased consumption of soft drinks
by children.
Consistent with a previous study conducted in Malaysia
in 2006 (21), the current findings indicated non-core
foods were the most advertised food products. However,
we detected a change in the type of food products most
frequently advertised. Based on content analysis of TV
food advertising data, Karupaiah et al. (21) identified
unhealthy snacks as the most dominant advertised food
products in contrast to the sugar-sweetened drinks
reported in our study. This increment in advertising of
sugar-sweetened drinks is also reported in Spain, India,
and other Asia Pacific countries with this product being
the most frequently advertised beverage on TV (29, 34, 35).
From our observation of TV media, the increment in
advertising for sugary drinks since 2006 (21) mostly
Table 3. Food advertising exposure as per seasonal variation by TV channel ethnicity
Rate of food advertising (food ads/hr/channel)
Normal days School holidays
Malay
channels
(n�3)a
Chinese
channels
(n�5)
Indian
channels
(n�4)a p
Malay
channels
(n�3)a
Chinese
channels
(n�5)
Indian
channels
(n�4)a p
Non-core foods 2.27a 2.83b 0.49ab B0.001 6.17ab 3.92bc 1.51abc B0.001
Core foods 0.42ab 0.63bc 0.18abc B0.001 0.48a 0.56b 0.04ab B0.001
Miscellaneous
foods
0.73a 0.96b 0.32ab B0.001 0.68a 1.06b 0.30ab B0.001
For ethnic-specific popular channels, three popular channels were for Malay whilst five popular channels were Chinese, and four popular
channels were Indian. Values in the same row sharing same superscript letters are significantly different. Dunn test: pB0.01.aHowever, one TV channel was common to both Malay and Indian viewership.
Fig. 3. Persuasive techniques as per seasonal variation and TV channel ethnicity. (a) Promotional characters used in food
advertisements. (b) Premiums offered in food advertisements. For ethnic-specific popular channels, three popular channels were
for Malay whilst five popular channels were Chinese and four popular channels were Indian. One TV channel was common to
both Malay and Indian viewership. Hence, overall analysis was carried out based on only 11 channels. Within each figure, values
sharing same superscripts are significantly different between normal days and school holidays.
See H. Ng et al.
8(page number not for citation purpose)
Citation: Glob Health Action 2014, 7: 25169 - http://dx.doi.org/10.3402/gha.v7.25169
originates from multinational companies, such as Coca-
cola, Nestle, and Pepsico, as opposed to local brands.
Current Malaysian government guidelines restricting
advertising and sponsorship by fast-food companies
during children’s TV programs apply during children’s
program targeting 4�9 year olds and when children’s TV
viewership exceeds 4% (22). Despite these restrictions,
fast foods were one of the three most popular advertised
non-core foods. We also noted that during children’s
PVT, the rate of fast-food advertisements was higher
compared to NPVT (0.41 vs 0.24 food ads/hr/channel).
This indicates current government regulations are limited
in their ability to protect children from fast-food adver-
tising on TV. The impact of this guideline is also limited
by the lack of provisions related to other unhealthy food
and beverages, particularly sugar-sweetened drinks. As
demonstrated by viewership audience data in our study,
the large majority of children watch TV outside of the
targeted children’s programs for which guidelines apply,
with PVT occurring during the evening periods.
An alternative approach to monitoring and evaluating
food advertising is by using children audience composition
data as a standardised method to capture significant pro-
portions of children exposed to marketing campaigns (1).
A recent study suggested PVT reflected actual exposure of
children to non-core food advertising (23). Based on our
findings, the exposure of non-core foods was consistently
higher during PVT compared to NPVT for children. The
IFBA is now committed only to advertising products
that meet specific nutritional criteria based on accepted
national and international evidence and/or applicable
national and international dietary guidelines in 2008 (20).
However, our findings contradict a report from this
alliance which found TV food and beverages advertising
compliance was 99.2% (20). A reason for this discrepancy
is that the IFBA code of practice only applies during TV
viewing times when children make up at least 50% of the
audience, which does not often occur in the real-world
scenario (7). Further, the IFBA code is more permissive of
foods that are actually inappropriate to be advertised to
children, and is therefore relaxed about advertising of
these foods. For instance, cereals containing sugar up to
35 g/100 g are deemed acceptable to be marketed to
children, whereas expert opinion for healthy eating is that
permitted foods should not exceed 20 g sugar/100 g (7).
We noted distinct differences in food advertising rates
on Indian channels relative to Malay and Chinese
channels. Most of the popular channels for Indian
children were filtered satellite channels originating from
India. Such foreign-origin advertisements are modified/
removed as these are not relevant to the local market in
Malaysia. It is also possible that these channels are less
targeted by food companies, given the relatively low
population numbers of this ethnic group in Malaysia
compared to other ethnic groups (Malays or Chinese)
as well as their lower household expenditures for these
products (36). Conversely, non-core food advertising was
found to be prevalent in Malay and Chinese channels and
remarkably higher in Malay channels during school
holidays. The non-core food advertising exposure pattern
does not align with the reported patterns of childhood
obesity by ethnicity in Malaysia (Chinese 26.6%�Indian
26.1%�Malay 18.9%) (19). However, obesity is well
known to be a complex issue with multiple determinants
(37). By using a mathematical simulation model, it was
projected that TV food advertising contributed to 15�40%
of obesity prevalence in the United States, and an absence
of unhealthy food advertising on TV therefore could yield
a reverse shift of proportion from overweight children to
normal weight (38).
Promotional characters were commonly used as per-
suasive marketing technique for non-core foods in
Malaysia, and this marketing practice was prevalent
during school holidays compared to normal days. This
is consistent with previous research which highlight that
persuasive marketing techniques were mainly used in
non-core food relative to core food advertisements (6, 39).
On further examination of the non-core food category,
we found sugar-sweetened drinks, breakfast cereals, extru-
ded snacks, ice cream, and instant noodles were more
likely to be using the persuasive techniques (data not
shown). Promotional characters included branded car-
toons or celebrities or famous actors who were company
spokespersons for the non-core food products. The
advertising impact of this technique is well documented
to show associations with brand recognition, positive
attitudes towards food products, and even brand loyalty
at an earlier age (6, 40). Further, enhanced consumption
of high-carbohydrate and high-fat foods by overweight
and obese children is associated with the use of promo-
tional characters during food advertising (41). Repetition
of promotional characters from food advertising could
transfer the positive effects related to characters (42) and
even more, credibility of celebrities in their own field
would be mistaken and further extended to the product
they are endorsing (43).
Our results are constrained by the fact that this is a
cross-sectional study. However, the selection of TV
channels is valid to represent TV exposure patterns
generally as the data includes normal days, weekdays,
and weekend days, and at the same time provides data for
all ethnic-specific popular TV channels. A major strength
of this study is to provide a wider scope of understanding
content analysis of food advertising on Malaysian TV
channels by including seasonal variation as a factor and
an improved model for classifying food codes previously
standardised by researchers in a multicentre international
study (35). It is important to note that in this study, the
selection of TV channels was specific to ethnicity and
ranked by children’s preference as determined by Nielsen’s
Obesogenic television food advertising
Citation: Glob Health Action 2014, 7: 25169 - http://dx.doi.org/10.3402/gha.v7.25169 9(page number not for citation purpose)
TAM data. Further, persuasive techniques of marketing
used in TV food advertising were assessed for the first
time in Malaysia.
Based on our findings it is apparent that stringent
regulation of TV food advertising is critical during PVT,
which relates to children’s viewership. The prior imple-
mentation of a content code that bans alcohol advertising
in Muslim-majority Malaysia, which was successfully
reflected in a zero rate detection of alcohol advertise-
ments on TV, indicates that advertising content restric-
tions are possible. In contrast, our results also showed
that current regulations in Malaysia are not able to
protect children entirely from high rates of non-core food
advertising on TV. Lastly, as highlighted by public health
professionals, a standardised set of definitions for classi-
fying TV food products according to health values, and
specifying children’s peak viewing period will enable
children to be better protected, either directly or indir-
ectly from exploitation by TV food marketing.
ConclusionsThis study revealed children’s high exposure to non-core
food advertising on Malaysian TV channels. Non-core
food advertisements were shown four times more fre-
quently during normal days than core foods, and the non-
core food advertising rate doubled during school holidays.
Food advertising exposure varied among channels popular
with ethnic groups, suggesting policy to regulate advertis-
ing should factor ethnicity in the future. The high rate of
advertising for sugary drinks warrants a further regulatory
action by government to limit these advertisements.
Acknowledgements
Industrial data were sponsored by the Nielsen Television Audience
Measurement. We also acknowledge the role of the project man-
agement team of the University of Sydney. Technical support for
data gathering was provided by James Hui, Andy Ng, Menagah
Ezhumalai and Nor Hafiza.
Conflict of interest and funding
No authors were found to have any direct or indirect conflict
of interest concerning this project. This project was funded
under the Fundamental Research Grant Scheme (FRGS/1/
2013/SS03/UKM/02/5) of the Ministry of Higher Education,
Malaysia.
References
1. World Health Organization (2012). A framework for imple-
menting the set of recommendations on the marketing of foods
and non-alcoholic beverages to children. Geneva: WHO.
2. World Health Organization (2010). Global strategy to reduce
the harmful use of alcohol. Geneva: WHO.
3. OFCOM (2004). Childhood obesity � food advertising in
context: children’s food choices, parents’ understanding and in-
fluence, and the role of food promotion. Available from: http://
stakeholders.ofcom.org.uk/binaries/research/tv-research/report2.
pdf [cited 22 May 2014].
4. Cairns G, Angus K, Hastings G, Caraher M. Systematic reviews
of the evidence on the nature, extent and effects of food
marketing to children. A retrospective summary. Appetite
2013; 62: 209�15.
5. Huang L, Mehta K, Wong ML. Television food advertising in
Singapore: the nature and extent of children’s exposure. Health
Promot Int 2011; 27: 187�96.
6. Kelly B, Hattersley L, King L, Flood V. Persuasive food
marketing to children: use of cartoons and competitions in
Australian commercial television advertisements. Health Pro-
mot Int 2008; 23: 337�44.
7. Galbraith-Emami S, Lobstain T. The impact of initiatives to
limit the advertising of food and beverage products to children:
a systematic review. Obes Rev 2013; 14: 960�74.
8. Gorn GJ, Goldberg ME. Behavioral evidence of the effects of
televised food messages on children. J Consum Res 1982; 9:
200�5.
9. Dietz WH, Gortmaker SL. Do we fatten our children at the TV
set? Television viewing and obesity in children and adolescents.
Pediatrics 1985; 75: 807�12.
10. World Health Organization (2009). The extent, nature and
effects of food promotion to children: a review of the evidence
to December 2008. Geneva: WHO.
11. Keller SK, Schulz PJ. Distorted food pyramid in kids pro-
grammes: a content analysis of television advertising watched in
Switzerland. Eur J Public Health 2010; 21: 300�5.
12. Livingstone S, Helsper E. Advertising foods to children:
understanding promotion in the context of children’s daily lives.
A review of the literature for the Market Research Department
of the Office of Communications (OFCOM). OFCOM; 2004.
Available from: http://eprints.lse.ac.uk/21757/ [cited 22 May
2014].
13. World Health Organization (2006). The extent, nature and
effects of food promotion to children: a review of the evidence.
Geneva: WHO.
14. Hawkes C. Marketing activities of global soft drink and fast
food companies in emerging markets: a review. Geneva,
Switzerland: WHO; 2002, 78 p.
15. Stuckler D, Nestle M. Big food, food systems, and global
health. PLoS Med 2012; 9: e1001242, 1�3.16. Consumers International (2008). The junk food trap: marketing
unhealthy food to children in Asia Pacific 2008. London:
Consumers International.
17. Moodie R, Stuckler D, Monteiro C, Sheron N, Neal B,
Thamarangsi T, et al. Profits and pandemics: prevention of
harmful effects of tobacco, alcohol, and ultra-processed food
and drink industries. Lancet 2013; 381: 670�9.
18. Kearney J. Food consumption trends and drivers. Philos Trans
R Soc B Biol Sci 2010; 365: 2793�807.
19. Naidu BM, Mahmud SZ, Ambak R, Mohd Sallehuddin S,
Abdul Mutalip H, Saari R, et al. Overweight among primary
school-age children in Malaysia. Asia Pac J Clin Nutr 2013; 22:
408�15.
20. Accenture (2012). 2012 Compliance monitoring report for
the International Food & Beverage Alliance on global advertis-
ing on television. Geneva: International Food and Beverage
Alliance.
21. Karupaiah T, Chinna K, Loi HM, Lim SM, Noor MI. What’s
on Malaysian television? � a survey on food advertising
targeting children. Asia Pac J Clin Nutr 2008; 17: 483�91.
22. World Obesity (2010). Malaysia policy overview. World Obesity
Federation. Available from: http://www.worldobesity.org/what-
we-do/policy-prevention/projects/marketing-children/policy-
map/ [cited 23 May 2014].
See H. Ng et al.
10(page number not for citation purpose)
Citation: Glob Health Action 2014, 7: 25169 - http://dx.doi.org/10.3402/gha.v7.25169
23. Smithers LG, Lynch JW, Merlin T. Industry self-regulation and
TV advertising of foods to Australian children. J Paediatr Child
Health 2014; 50: 386�92.
24. Lobstein T. Research needs on food marketing to children.
Report of the StanMark project. Appetite 2013; 62: 185�6.
25. Nielsen Television Audience Measurement (2011). TV viewer-
ship report from 9.10.2011 till 15.10.2011. Kuala Lumpur,
Malaysia: The Nielsen Company.
26. Kelly B, Halford JC, Boyland EJ, Chapman K, Bautista-
Castano I, Berg C, et al. Television food advertising to children:
a global perspective. Am J Public Health 2010; 100: 1730�6.
27. Kelly B, King L, Baur L, Rayner M, Lobstein T, Monteiro C,
et al. Monitoring food and non-alcoholic beverage promotions
to children. Obes Rev 2013; 14: 59�69.
28. Zuppa J, Morton H, Mehta K. Television food advertising:
counterproductive to children’s health? A content analysis using
the Australian Guide to Healthy Eating. Nutr Diet 2003; 60:
78�84.
29. Kelly B, Hebden L, King L, Yang X, Yang Y, Gengsheng H,
et al. Children’s exposure to food advertising on free-to-air
television: an Asia-Pacific perspective. Health Promot Int 2014.
doi:10.1093/heapro/dau055.
30. King L, Hebden L, Grunseit A, Kelly B, Chapman K. Building
the case for independent monitoring of food advertising on
Australian television. Public Health Nutr 2012; 16: 2249�54.
31. Boyland EJ, Harrold JA, Kirkham TC, Halford JCG. The
extent of food advertising to children on UK television in 2008.
Int J Pediatr Obes 2011; 6: 455�61.
32. Malik VS, Pan A, Willett WC, Hu FB. Sugar-sweetened
beverages and weight gain in children and adults: a sys-
tematic review and meta-analysis. Am J Clin Nutr 2013; 98:
1084�102.
33. Andreyeva T, Kelly IR, Harris JL. Exposure to food advertising
on television: associations with children’s fast food and soft
drink consumption and obesity. Econ Hum Biol 2011; 9:
221�33.
34. Romero-Fernandez MM, Royo-Bordonada MA, Rodrıguez-
Artalejo F. Evaluation of food and beverage television advertis-
ing during children’s viewing time in Spain using UK nutrient
profile model. Public Health Nutr 2012; 16: 1314�20.
35. Ghimire N, Rao A. Comparative evaluation of the influence of
television advertisements on children and caries prevalence.
Glob Health Action 2013; 6: 20066. DOI: 10.3402/gha.v6i0.
20066.
36. Department of Statistics Malaysia (2012). Report on household
expenditure survey. Malaysia: Department of Statistic Malaysia.
Available from: http://www.statistics.gov.my/portal/download_
household/files/Expenditure/Laporan_PIR_Report_on_HES_
2009-10.pdf [cited 22 May 2014].
37. Butland B, Jebb S, Kopelman P, McPherson K, Thomas S,
Mardell J, et al. Foresight � tackling obesities: future choices �project report. UK: Government Office for Science; 2007.
Available from: https://www.gov.uk/government/uploads/system/
uploads/attachment_data/file/287937/07-1184x-tackling-obesities-
future-choices-report.pdf [cited 22 May 2014].
38. Veerman JL, Van Beeck EF, Barendregt JJ, Mackenbach JP. By
how much would limiting TV food advertising reduce childhood
obesity? Eur J Public Health 2009; 19: 365�9.
39. Boyland EJ, Harrold JA, Kirkham TC, Halford JCG. Persua-
sive techniques used in television advertisements to market
foods to UK children. Appetite 2012; 58: 658�64.
40. Neeley S, Schumann D. Using animated spokes � characters in
advertising to children. J Adv 2004; 33: 7�23.
41. Boyland EJ, Halford JCG. Television advertising and branding.
Effects on eating behaviour and food preferences in children.
Appetite 2013; 62: 236�41.
42. Mizerski R. The relationship between cartoon trade character
recognition and attitude towards product category in young
children. J Market 1995; 59: 58�71.
43. Kaiser Family Foundation (2007). Food for thought. Television
food advertising to children in the United States. Washington,
DC: The Kaiser Family Foundation.
Obesogenic television food advertising
Citation: Glob Health Action 2014, 7: 25169 - http://dx.doi.org/10.3402/gha.v7.25169 11(page number not for citation purpose)