Embed Size (px)
Citation preview

Observed temperature dependence of precipitation extremes: comparison to results
of climate models and reanalyses of NCEP and ECMWF
Shaw Chen LiuResearch Center for Environmental Change
Academia Sinica, Taipei
WCRP Regional Climate WorkshopLille, France
June 14-16, 2010
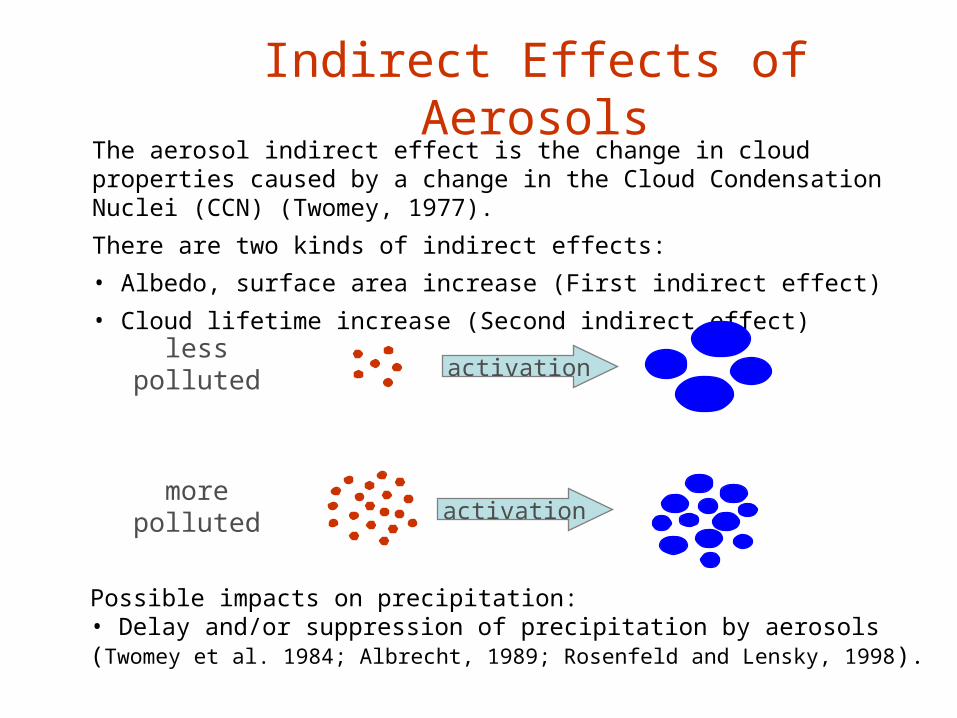
Indirect Effects of Aerosols
The aerosol indirect effect is the change in cloud properties caused by a change in the Cloud Condensation Nuclei (CCN) (Twomey, 1977).
There are two kinds of indirect effects:
• Albedo, surface area increase (First indirect effect)
• Cloud lifetime increase (Second indirect effect)
Possible impacts on precipitation:• Delay and/or suppression of precipitation by aerosols (Twomey et al. 1984; Albrecht, 1989; Rosenfeld and Lensky, 1998).
activation
activation
lesspolluted
morepolluted
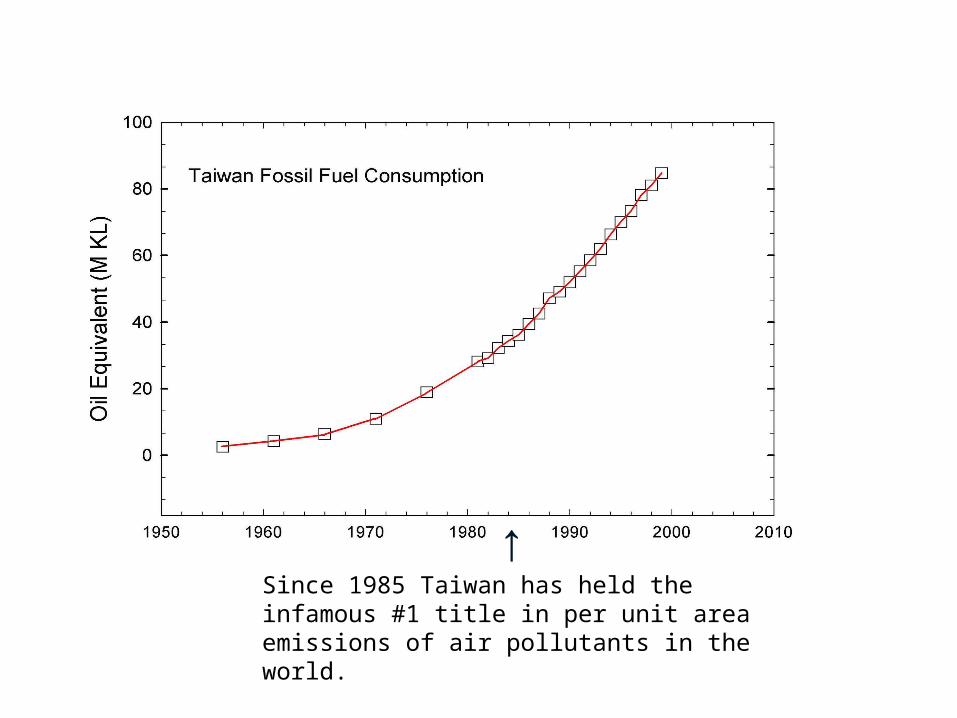
↑Since 1985 Taiwan has held the infamous #1 title in per unit area emissions of air pollutants in the world.
1900 1910 1920 1930 1940 1950 1960 1970 1980 1990 2000 2010
Sunshine duration (hours)
-700
-600
-500
-400
-300
-200
-100
0
100
200
300
400
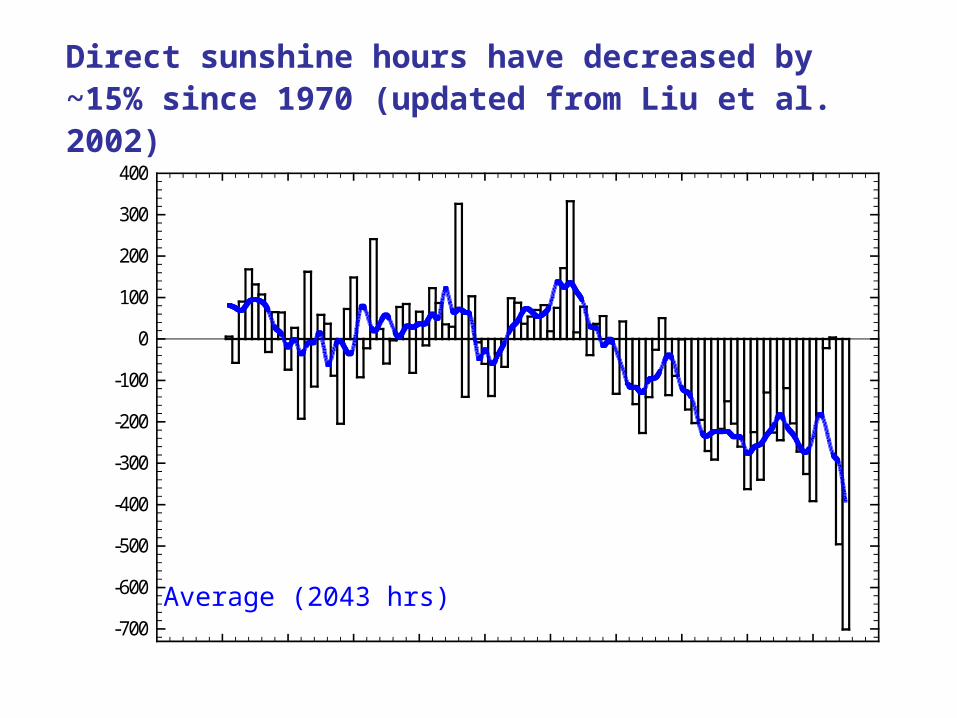
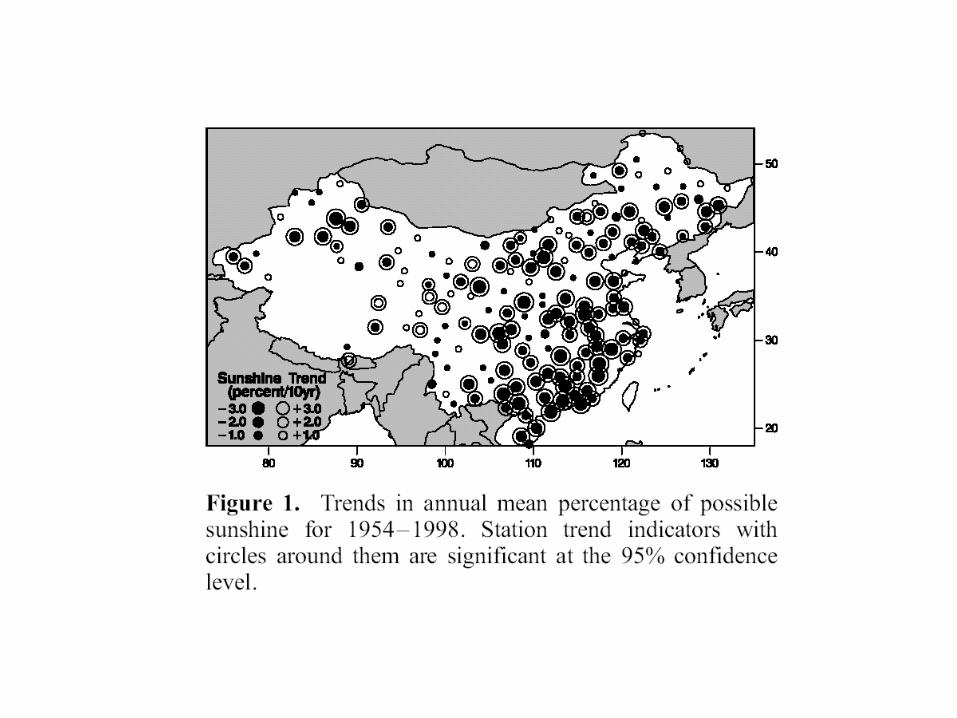
Direct sunshine hours have decreased by ~15% since 1970 (updated from Liu et al. 2002)
Average (2043 hrs)
119 120 121 122
0.2T
oE oE oE oE21oN
22oN
23oN
24oN
25oN
26oN
0.4
0.6
0.8
1.0
119 120 121 122
0.2T
oE oE oE oE21oN
22oN
23oN
24oN
25oN
26oN
0.4
0.6
0.8
1.0
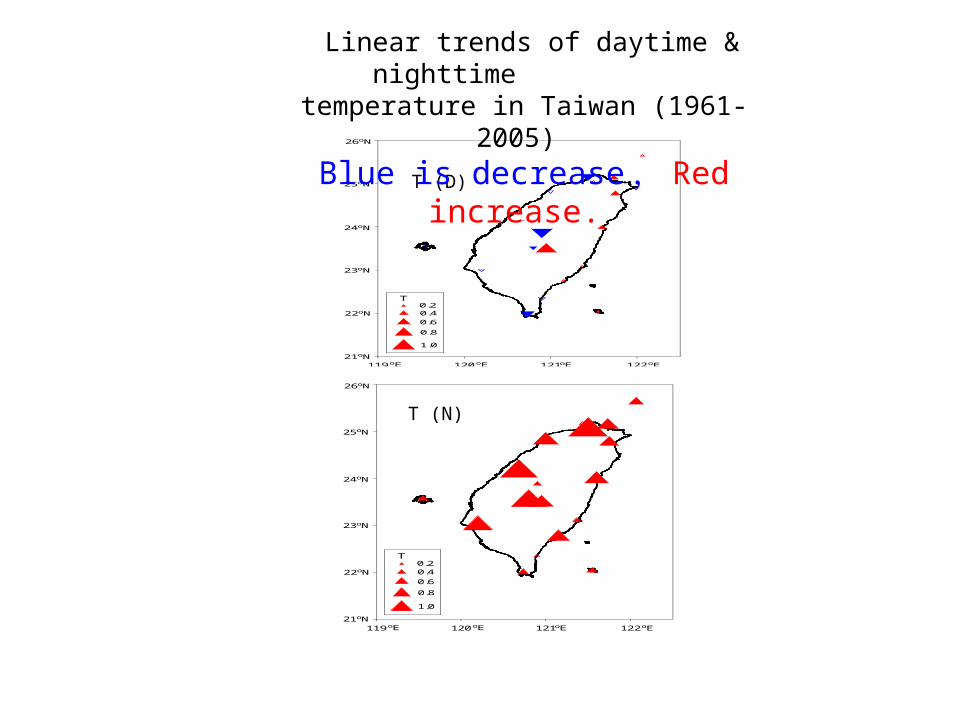
T (D)
T (N)
Linear trends of daytime & nighttime temperature in Taiwan (1961-2005)
Blue is decrease , Red increase.
C. (2.9)
1955 1960 1965 1970 1975 1980 1985 1990 1995 2000 2005 2010
Intensity (mm/hour)
-0.6
-0.4
-0.2
0.0
0.2
0.4
0.6
0.8
1.0
1.2
Rainhour (hour)
-400
-300
-200
-100
0
100
200
300
1955 1960 1965 1970 1975 1980 1985 1990 1995 2000 2005 2010
Precipitation (mm)
-800
-600
-400
-200
0
200
400
600
800
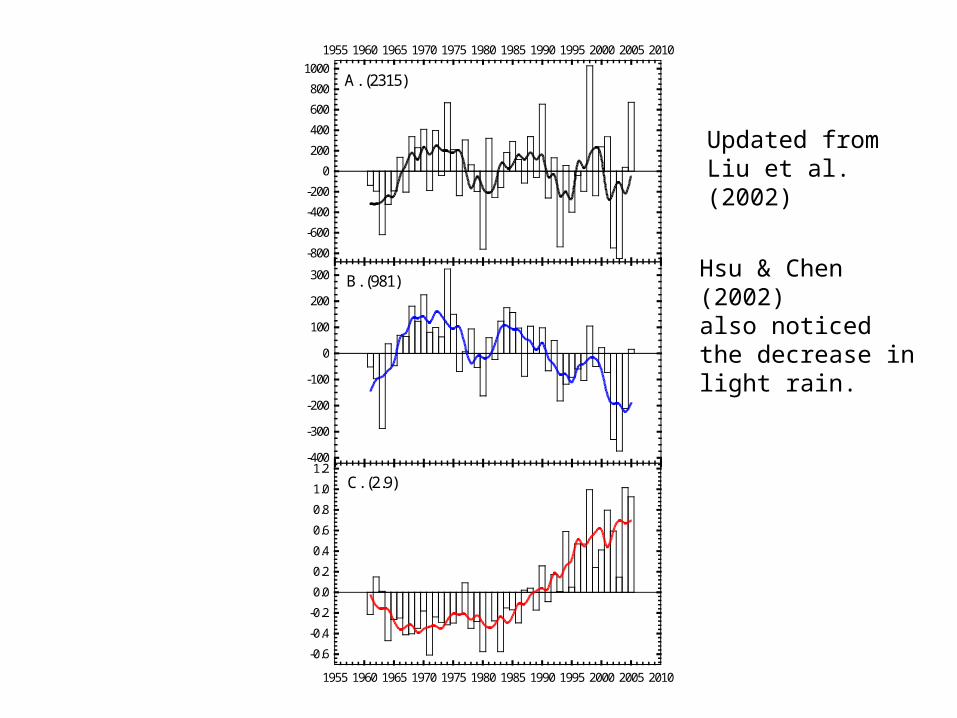
1000A. (2315)
B. (981)
Updated fromLiu et al. (2002)
Hsu & Chen (2002) also noticed the decrease in light rain.
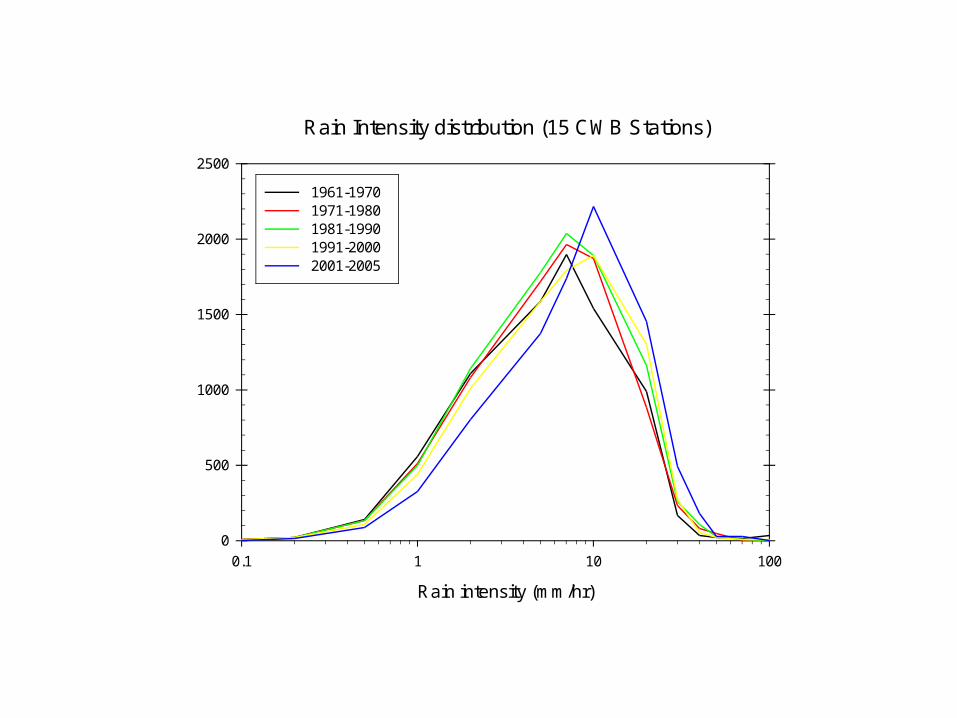
Rain Intensity distribution (15 CWB Stations)
Rain intensity (mm/hr)
0.1 1 10 100Precipitation amounts / delta log (intensity) (mm)0
500
1000
1500
2000
2500
1961-1970 1971-1980 1981-1990 1991-2000 2001-2005
• Increases in very heavy precipitation, and sometimes with decreases in light precipitation have been reported in recent years over most land areas (e.g. Karl & Knight, 1998; Goswami et al., 2006) as well as the tropical oceans (Lau and Wu, 2007).
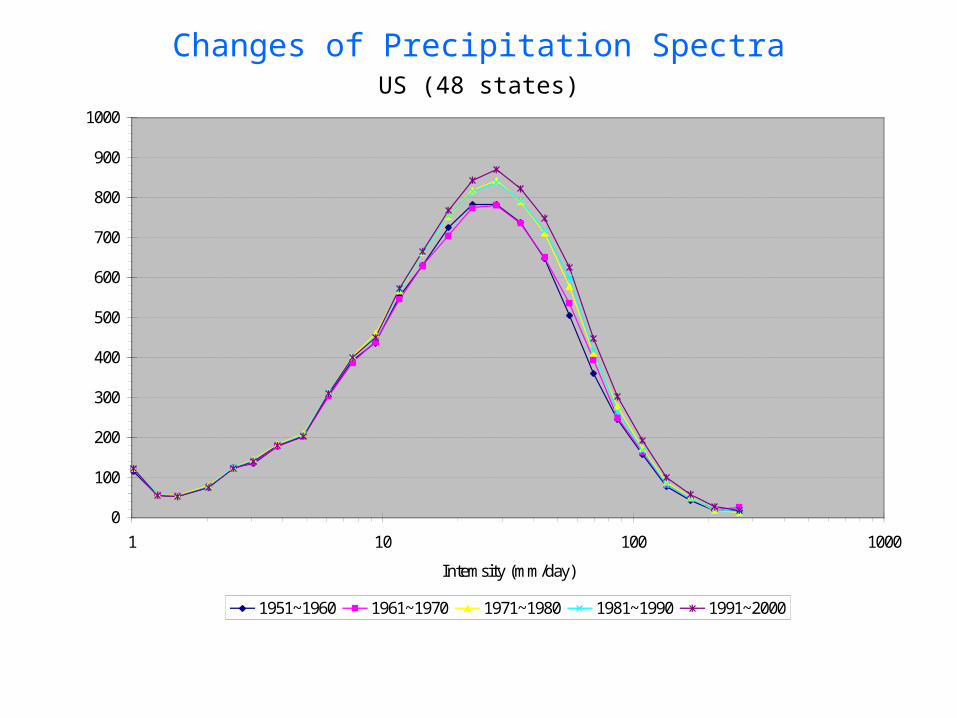
Changes of Precipitation SpectraUS (48 states)
0
100
200
300
400
500
600
700
800
900
1000
1 10 100 1000
Intemsity (mm/day)
Precipitation amounts / delta log(Intensity) (mm)
1951~1960 1961~1970 1971~1980 1981~1990 1991~2000
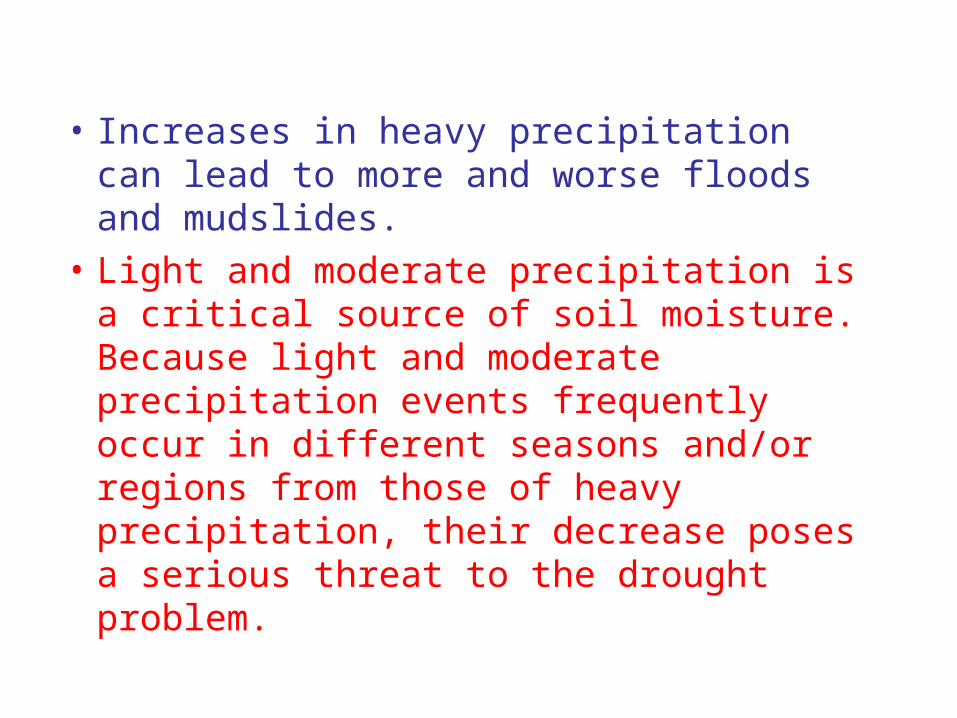
• Increases in heavy precipitation can lead to more and worse floods and mudslides.
• Light and moderate precipitation is a critical source of soil moisture. Because light and moderate precipitation events frequently occur in different seasons and/or regions from those of heavy precipitation, their decrease poses a serious threat to the drought problem.
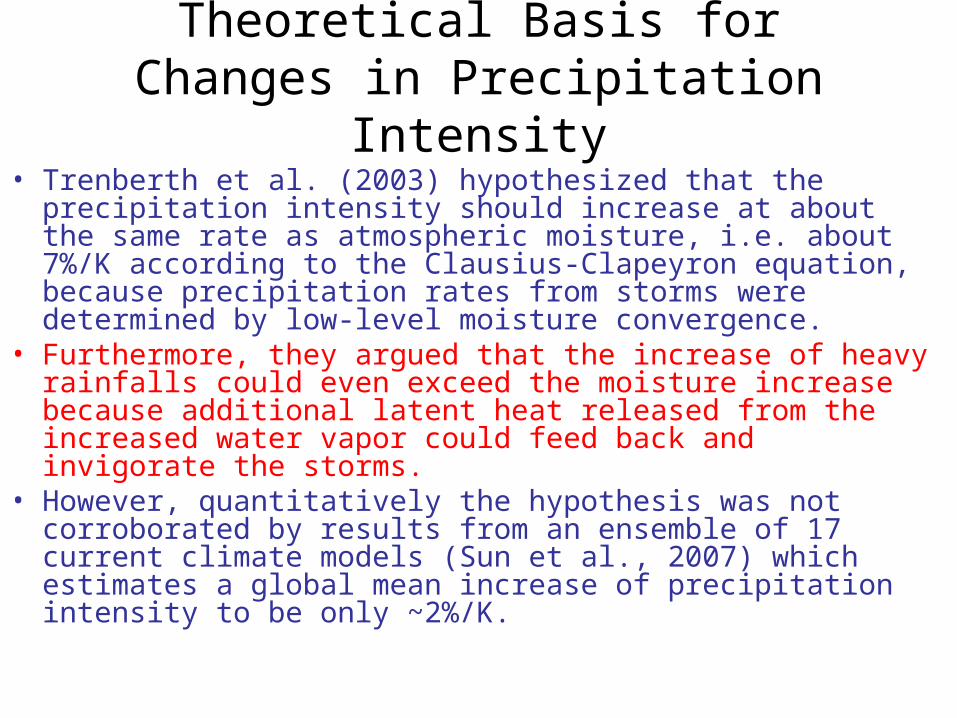
Theoretical Basis for Changes in Precipitation Intensity
• Trenberth et al. (2003) hypothesized that the precipitation intensity should increase at about the same rate as atmospheric moisture, i.e. about 7%/K according to the Clausius-Clapeyron equation, because precipitation rates from storms were determined by low-level moisture convergence.
• Furthermore, they argued that the increase of heavy rainfalls could even exceed the moisture increase because additional latent heat released from the increased water vapor could feed back and invigorate the storms.
• However, quantitatively the hypothesis was not corroborated by results from an ensemble of 17 current climate models (Sun et al., 2007) which estimates a global mean increase of precipitation intensity to be only ~2%/K.
A new analysis strategy
• By focusing on the interannual temperature difference rather than the time-series, we were able to determine a statistically significant relationship between precipitation extremes of the globe and global temperature (Liu et al. 2009).
Acknowledgment A major part of this talk is based on:Liu, S.C., Congbin Fu, Chein-Jung Shiu, Jen-Ping
Chen, and Futing Wu, GRL, 2009.
Intensity categories
1 2 3 4 5 6 7 8 9 10
Δ/PΔ (%/ )T K
-150
-100
-50
0
50
100
150
200
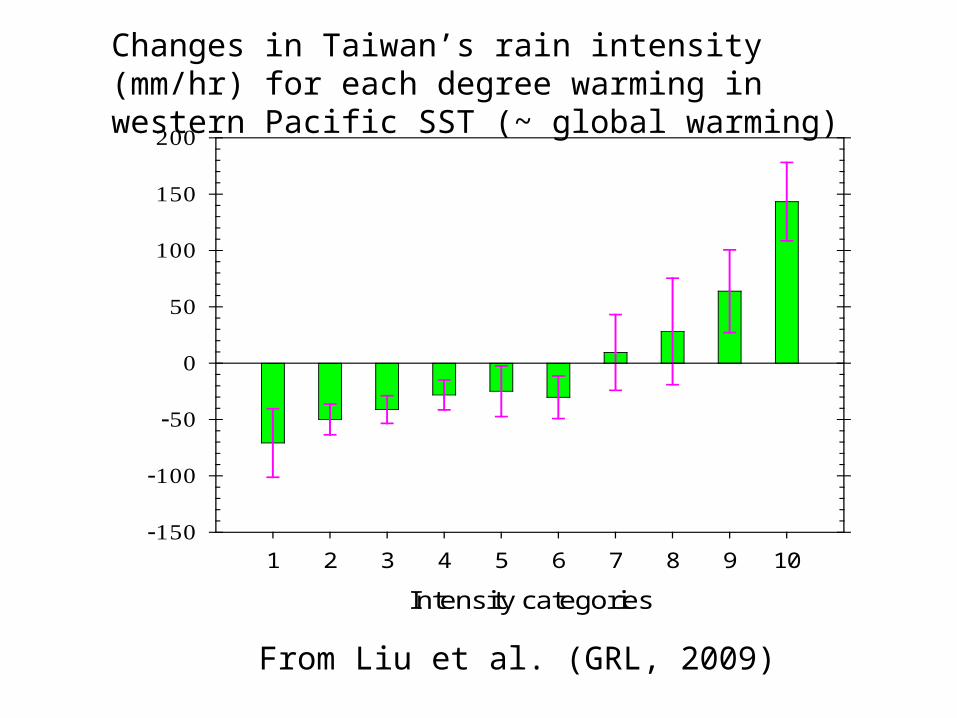
Changes in Taiwan’s rain intensity (mm/hr) for each degree warming in western Pacific SST (~ global warming)
From Liu et al. (GRL, 2009)
Intensity categories
1 2 3 4 5 6 7 8 9 10
Δ/PΔ (%/ )T K
-40
-20
0
20
40
60
80
100
120
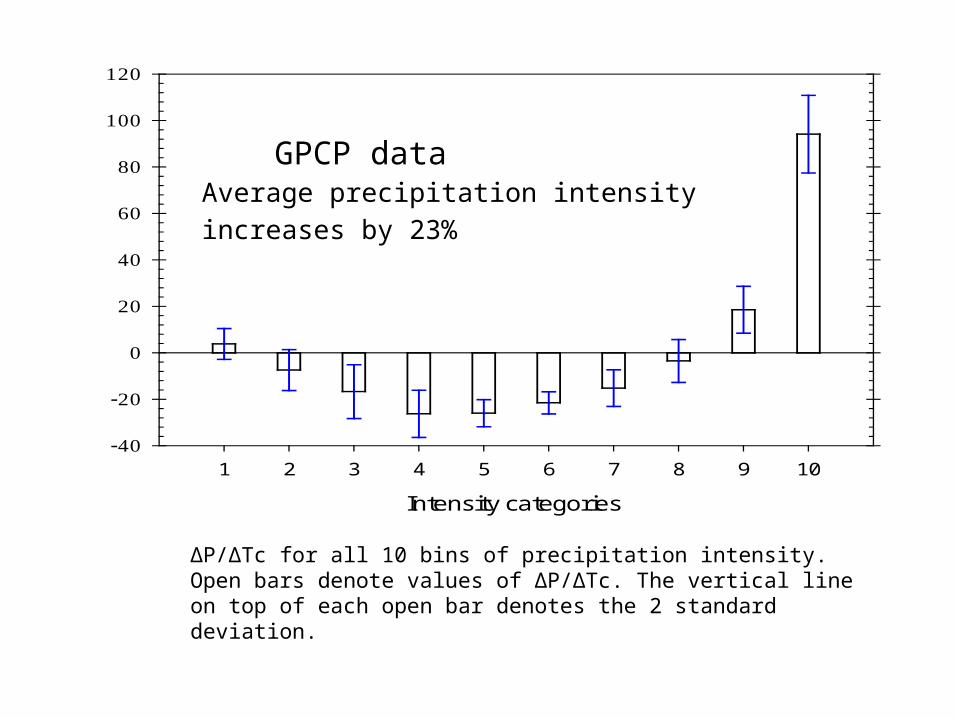
ΔP/ΔTc for all 10 bins of precipitation intensity. Open bars denote values of ΔP/ΔTc. The vertical line on top of each open bar denotes the 2 standard deviation.
GPCP dataAverage precipitation intensity increases by 23%
Intensity categories
1 2 3 4 5 6 7 8 9 10
Normalized
Δ/PΔ (%/ )T K
-40
-20
0
20
40
60
80
100
Normalized
Δ / P
Δ (%/ )T K
-4
-2
0
2
4
6
8
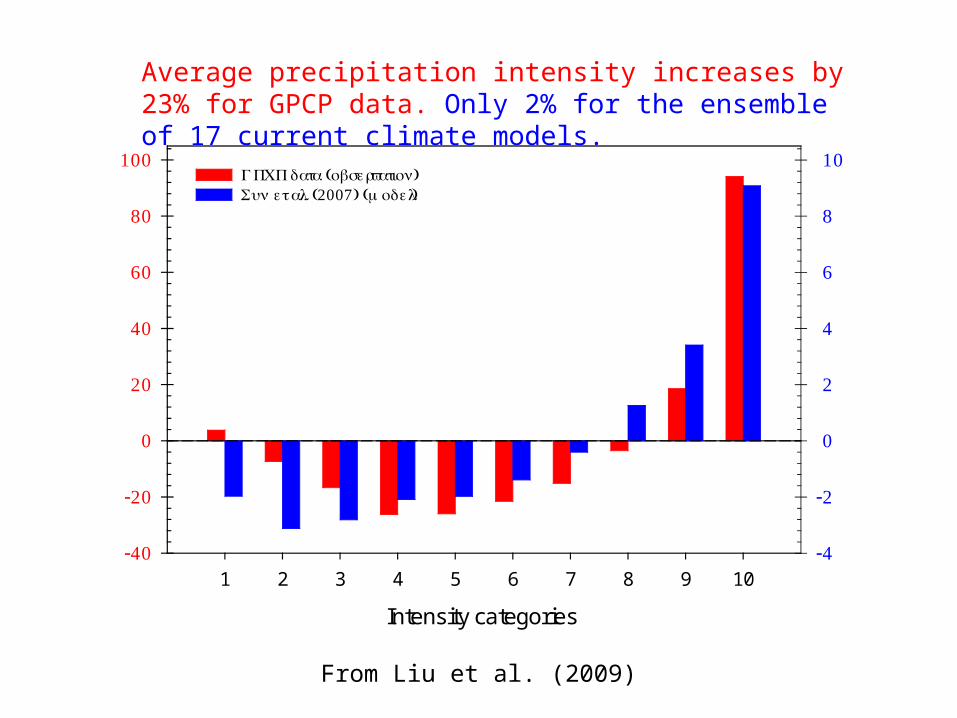
10GPCP data (observation)Sun et al. (2007) (model)
From Liu et al. (2009)
Average precipitation intensity increases by 23% for GPCP data. Only 2% for the ensemble of 17 current climate models.
• The current climate models underestimate the temperature dependence of precipitation extremes by about one order of magnitude, raising a serious concern that the risk of floods, mud slides and droughts due to global warming, is severely underestimated by IPCC2007.
Concerns about the GPCP data
• The short length of time: 1979-2007.• The coarse temporal and spatial resolutions: 2.5o x 2.5o, 5-day
average.• Different satellite data sets, bias, calibrations, and drifts in the
accuracy of instrument.--------------------------So we check GPCP values against results of reanalyses from
operational weather forecast models of NCEP and ECMWF. This check is an objective evaluation of the GPCP results as the precipitation from a reanalysis is a diagnostic quantity. In fact, observed precipitation is not used in the data assimilation of the reanalysis.
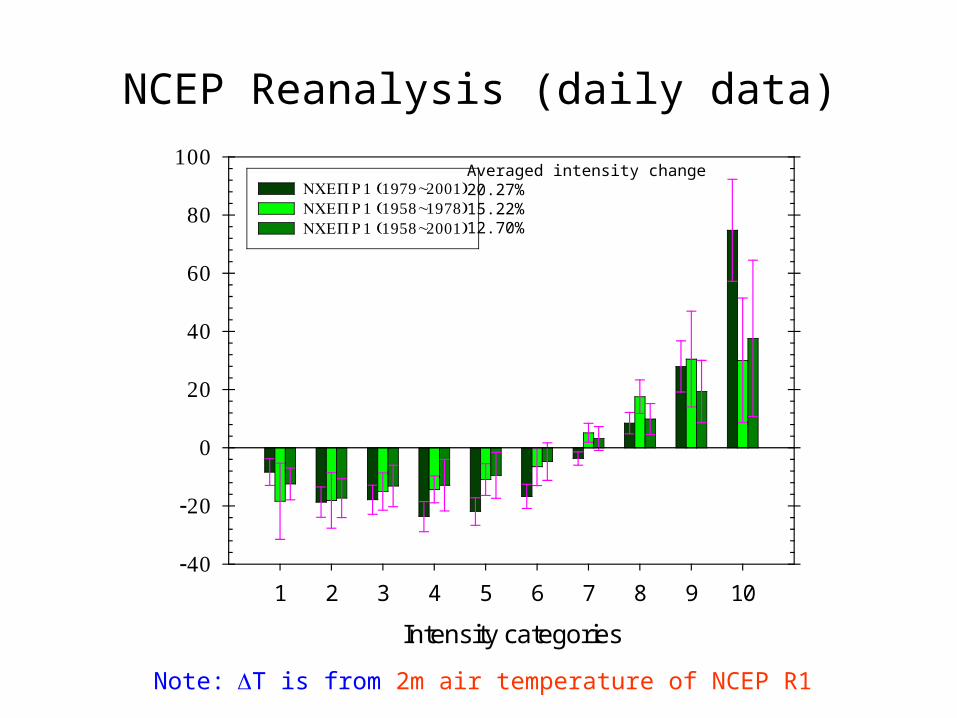
Note: ΔT is from 2m air temperature of NCEP R1
Intensity categories
1 2 3 4 5 6 7 8 9 10
Δ/PΔ (%/ )T K
-40
-20
0
20
40
60
80
100NCEP R1 (1979~2001)NCEP R1 (1958~1978)NCEP R1 (1958~2001)
Averaged intensity change20.27%15.22%12.70%
NCEP Reanalysis (daily data)
Intensity categories
1 2 3 4 5 6 7 8 9 10
Δ/PΔ (%/ )T K
-30
-20
-10
0
10
20
30
40
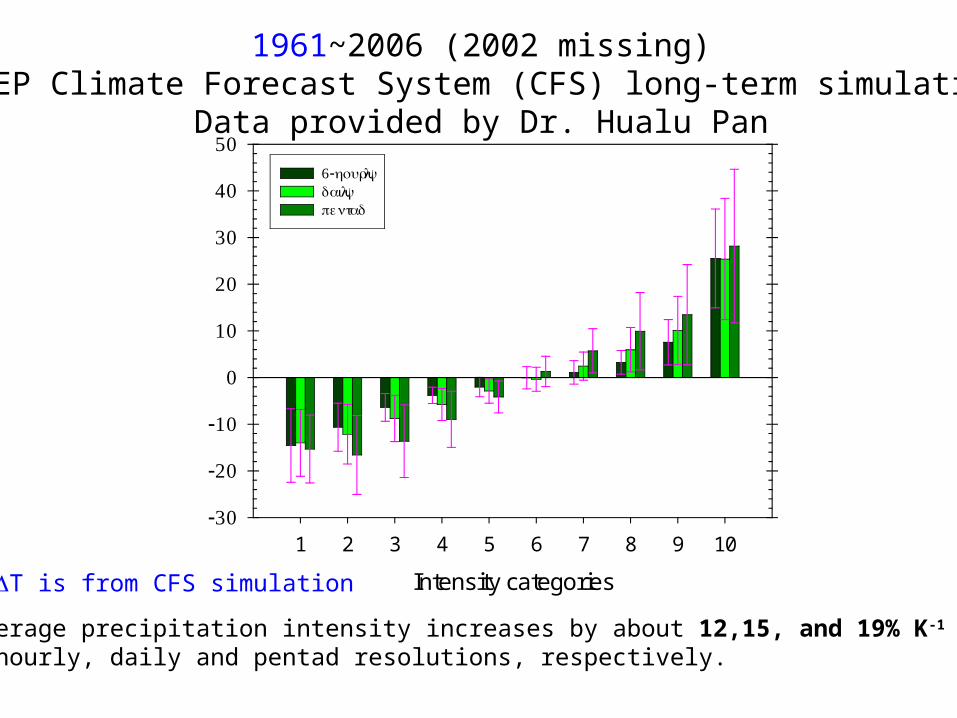
506-hourlydailypentad
1961~2006 (2002 missing)NCEP Climate Forecast System (CFS) long-term simulation
Data provided by Dr. Hualu Pan
Average precipitation intensity increases by about 12,15, and 19% K-1 for6-hourly, daily and pentad resolutions, respectively.
ΔT is from CFS simulation
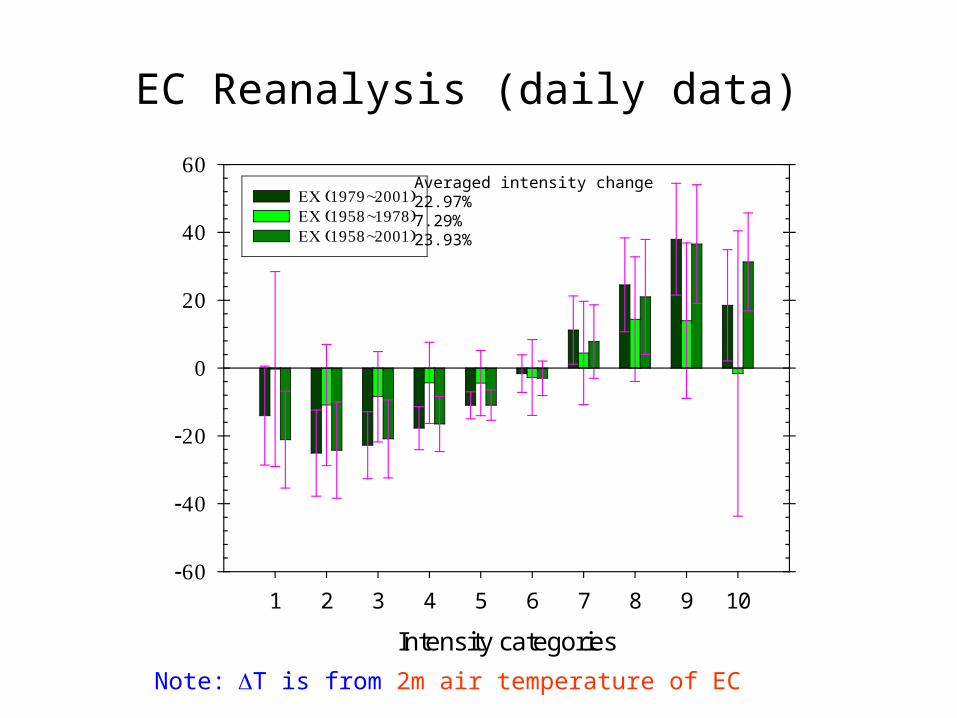
Note: ΔT is from 2m air temperature of EC
Intensity categories
1 2 3 4 5 6 7 8 9 10
Δ/PΔ (%/ )T K
-60
-40
-20
0
20
40
60EC (1979~2001)EC (1958~1978)EC (1958~2001)
Averaged intensity change22.97%7.29%23.93%
EC Reanalysis (daily data)
• The temperature dependence of global precipitation intensity derived from GPCP is in reasonably good agreement with results of reanalyses by NCEP and ECMWF.
• Since the reanalysis doesn’t include effects of aerosols, the increase in precipitation intensity of NCEP and ECMWF is not caused by aerosols.
• It is highly likely that most of the increase in precipitation intensity derived from GPCP is driven by the global temperature increase.
• The increase in the top 10% heavy precipitation with temperature is significantly underestimated by the operational weather forecast models, especially the EC model. Does this mean that their deep convection scheme needs to be reexamined? If so, how about climate models? How would this affect the water vapor and cloud feedbacks in the climate models? Also vertical heat transport?

Thank you for your attention!
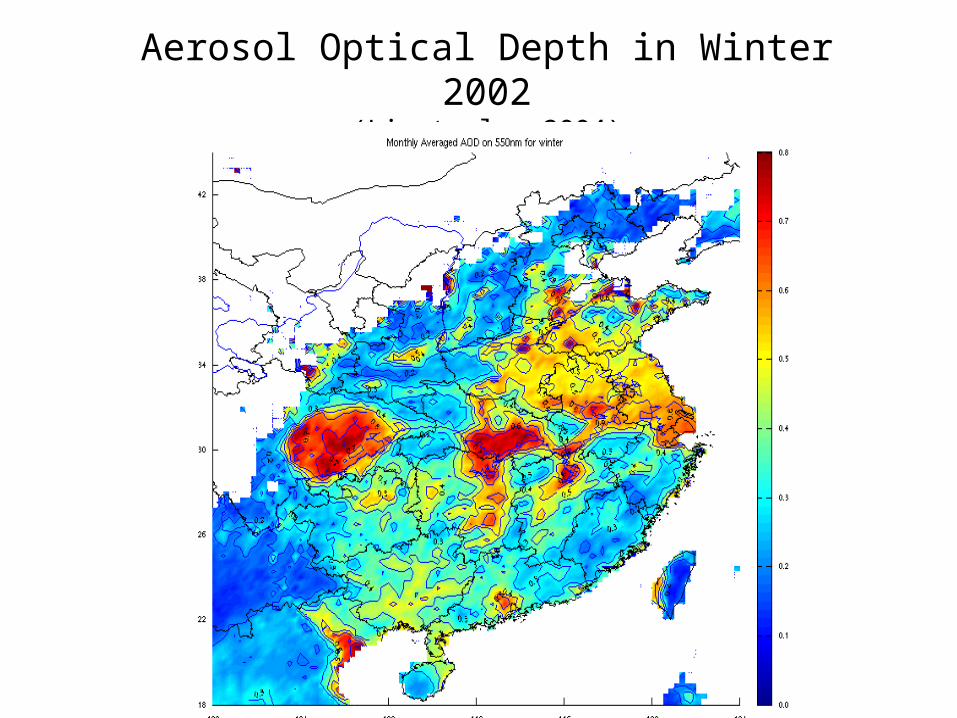
Aerosol Optical Depth in Winter 2002(Li et al., 2004)

Intensity categories
1 2 3 4 5 6 7 8 9 10
Δ/PΔ (%/ )T K
-30
-20
-10
0
10
20
30
40
506-hourlydailypentad
1961~2006 (2002 missing)NCEP Climate Forecast System (CFS) long-term simulation
Data provided by Dr. Hualu Pan
Average precipitation intensity increases by about 12,15, and 19% K-1 for6-hourly, daily and pentad resolutions, respectively.
ΔT is from CFS simulation
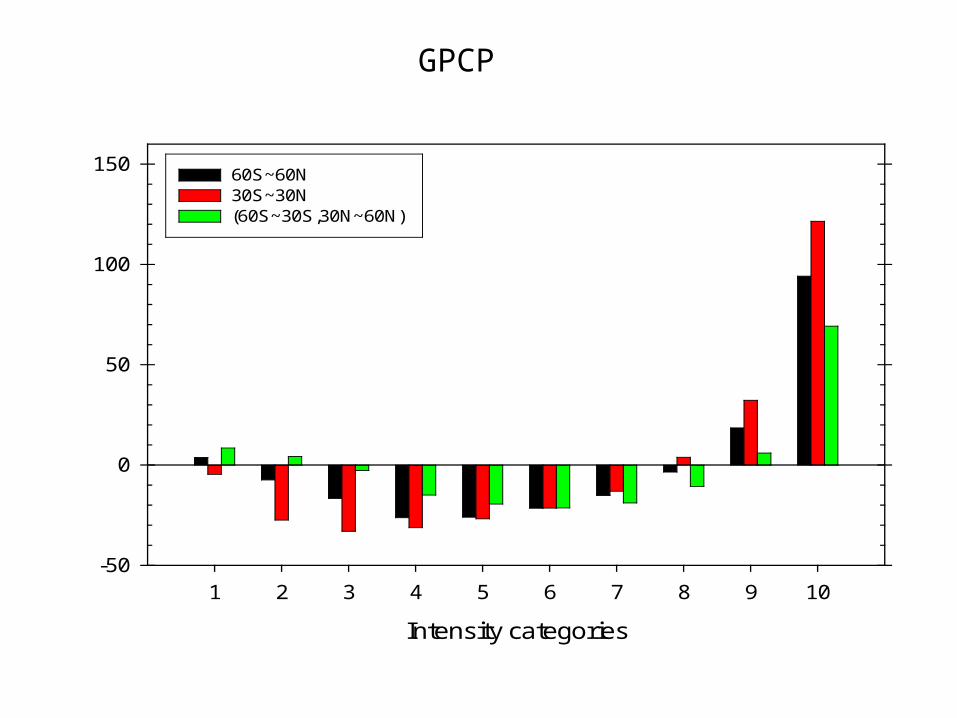
GPCP data
Intensity categories
1 2 3 4 5 6 7 8 9 10
Normalized delta P / delta T (%/K)
-50
0
50
100
15060S~60N 30S~30N (60S~30S,30N~60N)
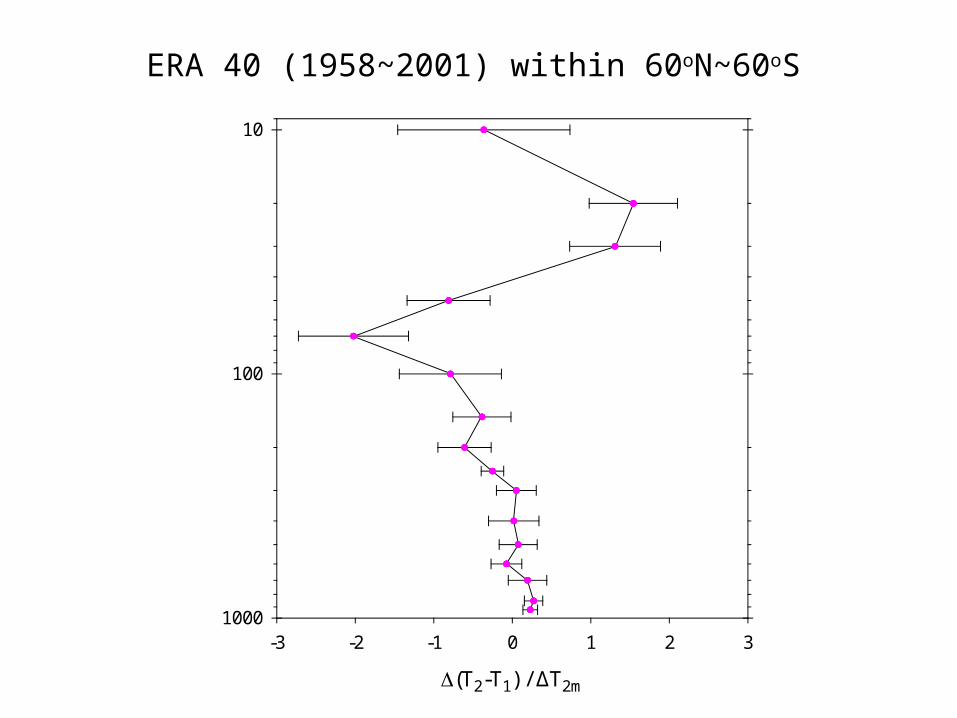
Δ(T2-T1) / ΔT2m
-3 -2 -1 0 1 2 3
Pressure Level (mb)
10
100
1000
ERA 40 (1958~2001) within 60oN~60oS
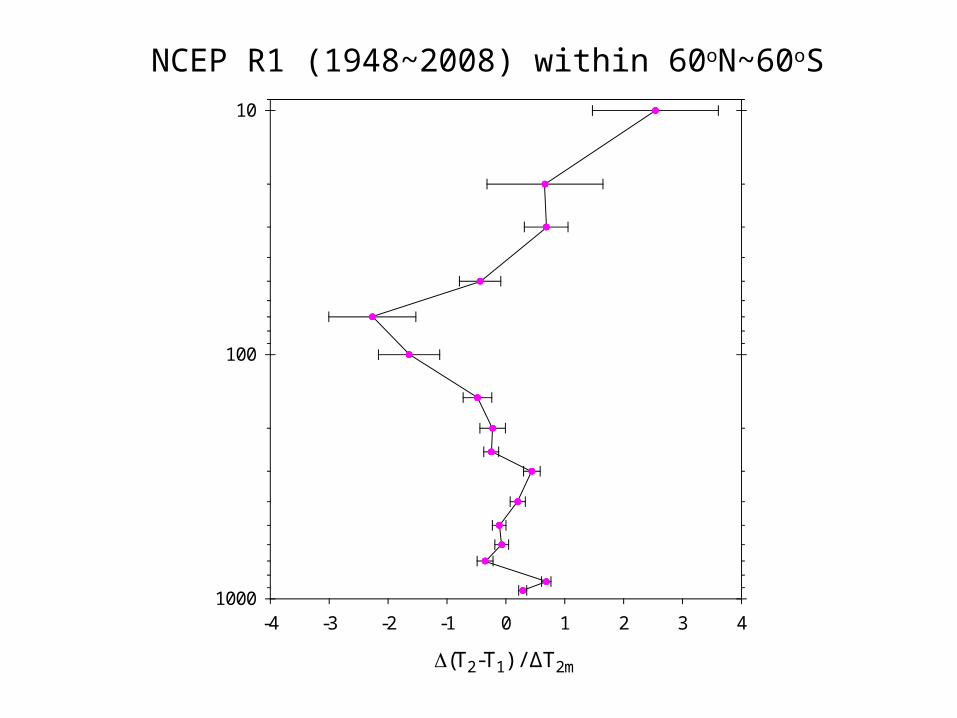
Δ(T2-T1) / ΔT2m
-4 -3 -2 -1 0 1 2 3 4
Pressure Level (mb)
10
100
1000
NCEP R1 (1948~2008) within 60oN~60oS
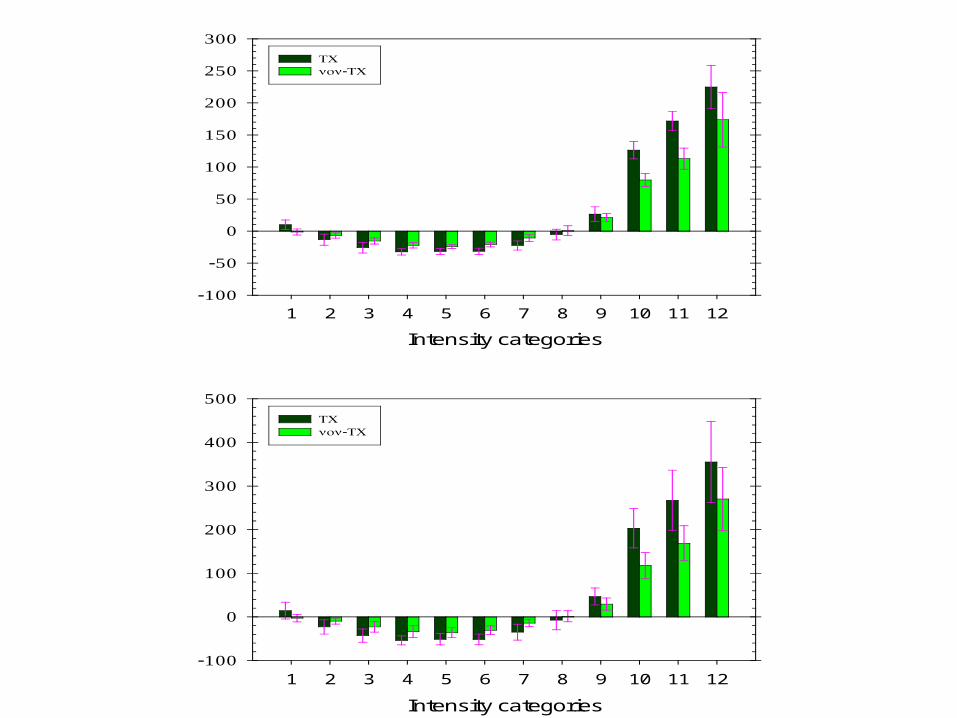
Intensity categories
1 2 3 4 5 6 7 8 9 10 11 12
Δ/PΔ (%/ )T K
-100
-50
0
50
100
150
200
250
300TC non-TC
Intensity categories
1 2 3 4 5 6 7 8 9 10 11 12
Δ/PΔ (%/ )SST K
-100
0
100
200
300
400
500TC non-TC


![Enhanced Predictability During Extreme Winter …...Data: ECMWF, NCEP/NOMADS, NRL-Monterey NRC Postdoc at NRL Monterey [2010-2012] advisor: Dr. Rolf H. Langland Updated research work](https://img.pdfslide.net/doc/110x75/5ed2176d34ed900c2d547253/enhanced-predictability-during-extreme-winter-data-ecmwf-ncepnomads-nrl-monterey.jpg)