Embed Size (px)
Citation preview

Universal Journal of Environmental Research and Technology
All Rights Reserved Euresian Publication © 2013 eISSN 2249 0256
Available Online at: www.environmentaljournal.org
2013 Volume 3, Issue 4: 473-482
Open Access Research Article
473
Hosmani S. P.
Fresh Water Algae as Indicators of Water Quality
Shankar P. Hosmani
Department of Biotechnology, SBRR Mahajana First Grade College, Jayalakshmipuram, Mysore-570012
Corresponding author: [email protected]
Abstract: Algae as indicators of organic pollution in 20 lakes of southern Karnataka have been studied. The Palmer’s
algal index of organic pollution has been discussed. The IDSE/5 Diatom index is calculated using the
OMNIDA software. The order of tolerance to organic pollution was calculated using the Garrett ranking
technique. Nestedness of species in the lakes was also determined using the Nestedness calculator.
According to the Palmer’s index all the 20 lakes are organically polluted. Bogadi Lake was least while
Dadadahalli Lake and Karanji Lake were heavily polluted. The present work compares the use of old and
new techniques of detecting water quality. It also enables to understand weather algae can be of
importance in conserving organically polluted lake waters. The nestedness analysis helps in detecting the
autocathonous algae in each lake in contributing to organic pollution. The species index indicated that
Doddakere Lake, Kabini Lake, Kalale lake, Kurubara lake, Hadhinaru Lake and Bogadi lake had low organic
pollution. The diatom index showed that all lakes ranged between moderate and high organic pollution, but
the degradation levels in the water were always high. Dadadahalli Lake has the highest organic pollution
while Kalale Lake and Makanahally Lake were heavily polluted. Species of Euglena and Scenedesmus were
the most tolerant species. Algae were highly nested in Dadadahalli Lake, Dalvoi Lake, Karanji Lake and were
the most hospitable sites for growth of algae while most of the other lakes had idiosyncratic species. The
matrix fill was low (59.5%) and the system temperature was warm (34.22o) indicating poor distribution of
algal species. The use of modern tools in determining levels of organic pollution in lake ecosystems has been
discussed.
Keywords: Algae, Diatom, Garrett, Idiosyncratic, Nestedness, Organic Pollution, Palmer, Ranking,
1.0 Introduction: As early as (1980) Hosmani and Bharathi,
investigating polluted and unpolluted waters of
Karnataka, published a paper on “Algae as
indicators of organic pollution”. This study was
based on the classic work of Palmer (1969) who
developed “Algal index of Pollution” and it was
based on the observations of 269 reports by 165
authors who reported algae tolerant to organic
pollution. Details of this calculation are presented
in Palmer (1969). The pollution index is based on
the relative number of total points scored by each
alga. The index has been used by several
researchers till date. However, as time progressed
many new algal genera or species indicating
organic pollution have not been added to this list.
Secondly, algal appearance in polluted waters
changes from region to region. Nygaard(1976) also
proposed an index based on the plankton count
but was of lesser importance. Kelly (2006) used
diatoms with other algae as indicators of
ecological status and explained the precise
method of sampling diatoms for calculating the
water quality index. A more advanced pollution
index is that of Louis-Laclereq (IDSE/5) (2008)
which is based on the occurrence of only diatom
species in any water body. This index not only
estimates organic pollution, but also determines
the percentage or status of anthropogenic
pollution in the range of low to very high. It also
determines the degradation levels in the water.
The index can be calculated by using the OMNIDA
software (Lecointe, 2003) and is therefore most
appropriate. Diatoms are considered to be more
precise indicators as compared to other algae that
may be of allocathonus origin .Publications related
to the study are those of Hosmani(2012a), on the
application of benthic diatom community in lake
water quality monitoring, Hosmani and
Mruthunjaya(2013 )on the impact of plankton
diversity on the water quality index in lakes.
Attempts were also made by Hosmani(2012b) to
Universal Journal of Environmental Research and Technology
474
Hosmani S. P.
apply multivariate analysis for distribution of
Euglenaceae while Sudeep et al.,(2007) applied the
Principal Component Analysis for water quality
evaluation. These studies however were not very
precise in explaining the water quality index of
lake waters.
Further, the Palmer’s (1969) index has no measure
for rating of the level of pollution in fresh waters
and a ranking technique is also essential to study
lake systems in order to compare them. It is also
necessary to understand whether the algae were
indigenous to the lakes or were brought into the
lake by human disturbances. The present work
discusses the possibility of using newer techniques
involving algae as indicators of organic pollution
based the Palmer’s (1969) index. The study
involves algae collected from 20 lakes of Mysore
district and its surroundings. (Fig.1) The collections
were made seasonally for a period of at least 10
years (2003 to 2013).
2.0 Materials and Methods:
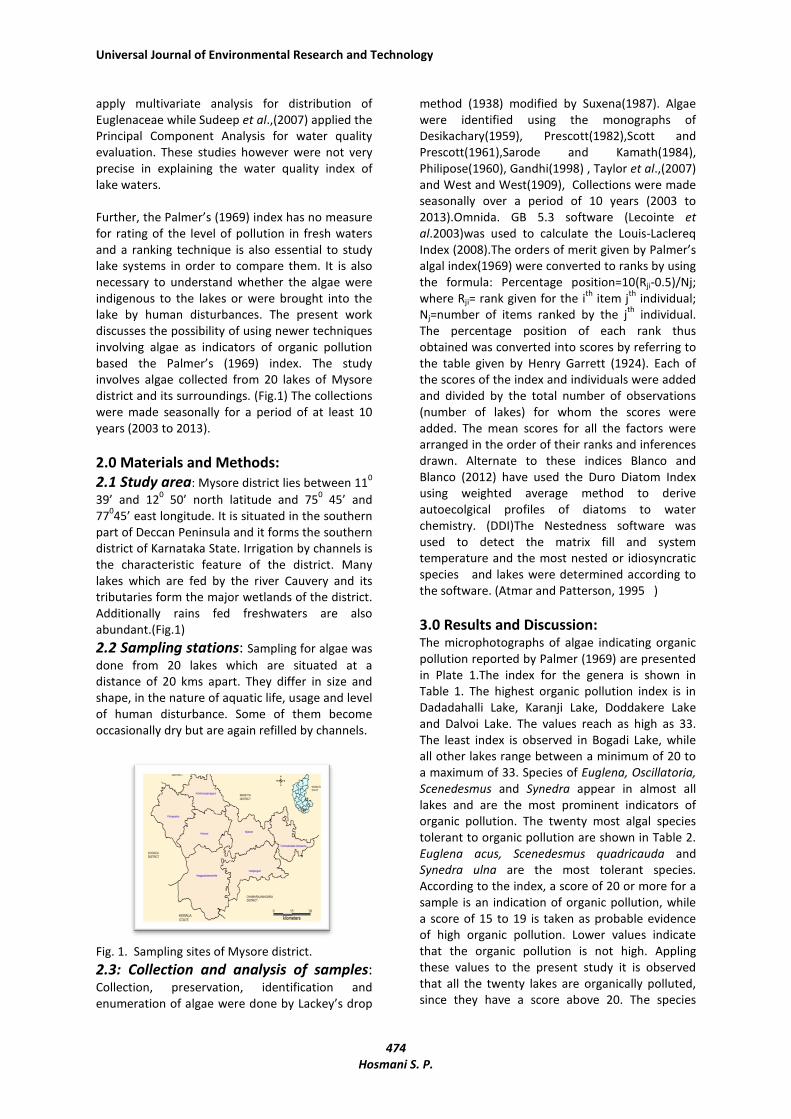
2.1 Study area: Mysore district lies between 110
39’ and 120 50’ north latitude and 75
0 45’ and
77045’ east longitude. It is situated in the southern
part of Deccan Peninsula and it forms the southern
district of Karnataka State. Irrigation by channels is
the characteristic feature of the district. Many
lakes which are fed by the river Cauvery and its
tributaries form the major wetlands of the district.
Additionally rains fed freshwaters are also
abundant.(Fig.1)
2.2 Sampling stations: Sampling for algae was
done from 20 lakes which are situated at a
distance of 20 kms apart. They differ in size and
shape, in the nature of aquatic life, usage and level
of human disturbance. Some of them become
occasionally dry but are again refilled by channels.
Fig. 1. Sampling sites of Mysore district.
2.3: Collection and analysis of samples: Collection, preservation, identification and
enumeration of algae were done by Lackey’s drop
method (1938) modified by Suxena(1987). Algae
were identified using the monographs of
Desikachary(1959), Prescott(1982),Scott and
Prescott(1961),Sarode and Kamath(1984),
Philipose(1960), Gandhi(1998) , Taylor et al.,(2007)
and West and West(1909), Collections were made
seasonally over a period of 10 years (2003 to
2013).Omnida. GB 5.3 software (Lecointe et
al.2003)was used to calculate the Louis-Laclereq
Index (2008).The orders of merit given by Palmer’s
algal index(1969) were converted to ranks by using
the formula: Percentage position=10(Rji-0.5)/Nj;
where Rji= rank given for the ith
item jth
individual;
Nj=number of items ranked by the jth
individual.
The percentage position of each rank thus
obtained was converted into scores by referring to
the table given by Henry Garrett (1924). Each of
the scores of the index and individuals were added
and divided by the total number of observations
(number of lakes) for whom the scores were
added. The mean scores for all the factors were
arranged in the order of their ranks and inferences
drawn. Alternate to these indices Blanco and
Blanco (2012) have used the Duro Diatom Index
using weighted average method to derive
autoecolgical profiles of diatoms to water
chemistry. (DDI)The Nestedness software was
used to detect the matrix fill and system
temperature and the most nested or idiosyncratic
species and lakes were determined according to
the software. (Atmar and Patterson, 1995 )
3.0 Results and Discussion: The microphotographs of algae indicating organic
pollution reported by Palmer (1969) are presented
in Plate 1.The index for the genera is shown in
Table 1. The highest organic pollution index is in
Dadadahalli Lake, Karanji Lake, Doddakere Lake
and Dalvoi Lake. The values reach as high as 33.
The least index is observed in Bogadi Lake, while
all other lakes range between a minimum of 20 to
a maximum of 33. Species of Euglena, Oscillatoria,
Scenedesmus and Synedra appear in almost all
lakes and are the most prominent indicators of
organic pollution. The twenty most algal species
tolerant to organic pollution are shown in Table 2.
Euglena acus, Scenedesmus quadricauda and
Synedra ulna are the most tolerant species.
According to the index, a score of 20 or more for a
sample is an indication of organic pollution, while
a score of 15 to 19 is taken as probable evidence
of high organic pollution. Lower values indicate
that the organic pollution is not high. Appling
these values to the present study it is observed
that all the twenty lakes are organically polluted,
since they have a score above 20. The species

Universal Journal of Environmental Research and Technology
475
Hosmani S. P.
index gives an indication that Hadhinaru Lake and
Bogadi Lake fall under the category of low organic
pollution(Total score of 14) but are tending to be
organically polluted. The species index also
indicates that all lakes are organically polluted.
Hosmani(2010) studied the phytoplankton
diversity in lakes of Mysore district and no
attempt was made to apply the data to derive
pollution indices.
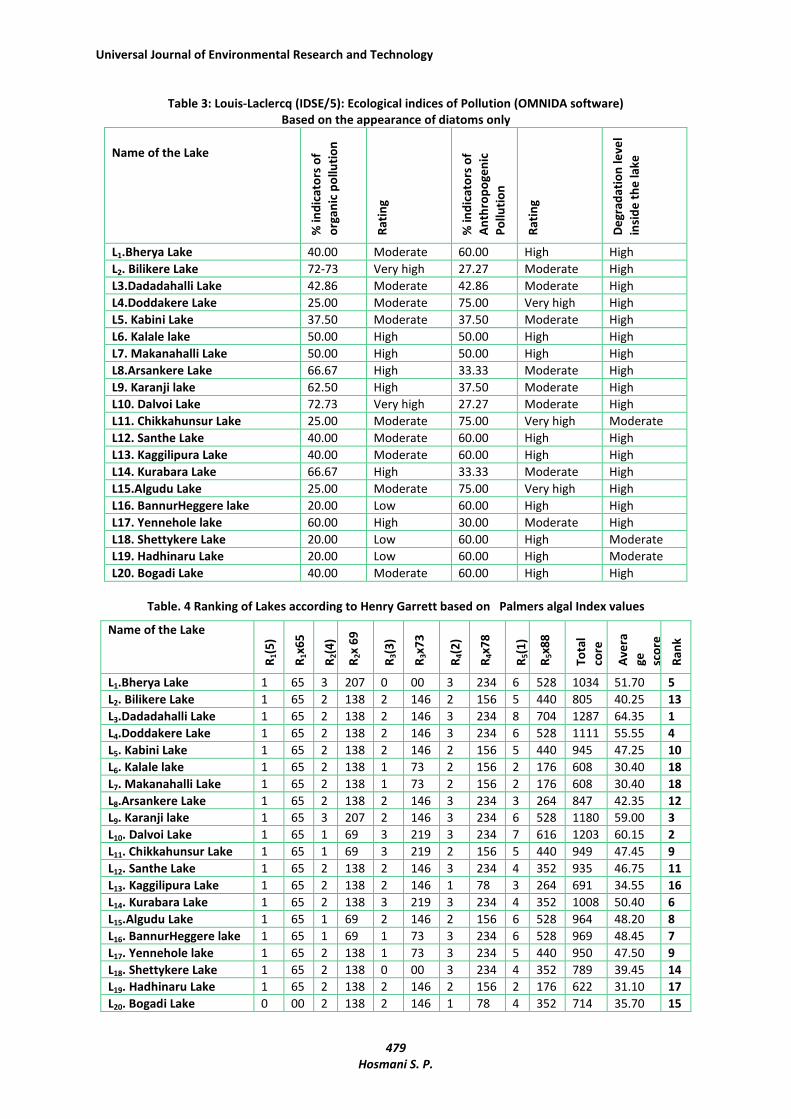
The Louis-Laclercq(2008) index of pollution
derived from the OMNIDA GB5.3 is presented in
Table 2. The percentage indicators of organic
pollution are very high in Bilikere Lake, Arasankere
Lake, Karnaji Lake, Dalvoi Lake, and Kurabura Lake.
The level of organic pollution is low in Bannur
Heggere Lake and Hadhinaru Lake; it is high in 4
lakes and moderate in 9 other lakes. The table also
depicts the level of disturbance by human activity
(Anthropogenic pollution). Doddakere Lake,
Chikkahunsur Lake and Alagudu Lake are heavily
polluted due to human interference while the rest
of the lakes are highly disturbed. Only 8 lakes are
moderately disturbed. The level of degradation in
these lakes is always high. The index is derived
mainly on the basis of the distribution of diatom
species throughout the period of study. Diatom
cells often remain undissolved for a longer
duration and hence can serve as important
indicators of organic as well as anthropogenic
pollution.
Further, in such studies were large number of
lakes are involved, it is necessary to rank lakes in
the order of pollution. The Garrett ranking
technique (1924) is an important tool in attributing
the ranks. The ranking of each lake is presented in
Table 3.The highest polluted lake is Dadadahalli
Lake (ranking 1) followed by Dalvoi Lake (ranking
2). The least polluted lakes are Kalale Lake,
Makanahalli Lake and ShettyKere Lake. The
remaining lakes lie between these values. (Table3).
This ranking enables researchers to select lakes for
conservation strategies.
At this stage it is necessary to know, whether the
indicator algae were indigenous to each of the
lakes (allocathonous) or whether they were of
occasional occurrence. Some may have been
brought into the lake whenever there were rains
or must have been introduced by human activity
surviving for a few months only. There must have
been others that were autochthonous (originating
in the lake itself) and completing their life cycles,
some of them resulting as blooms during certain
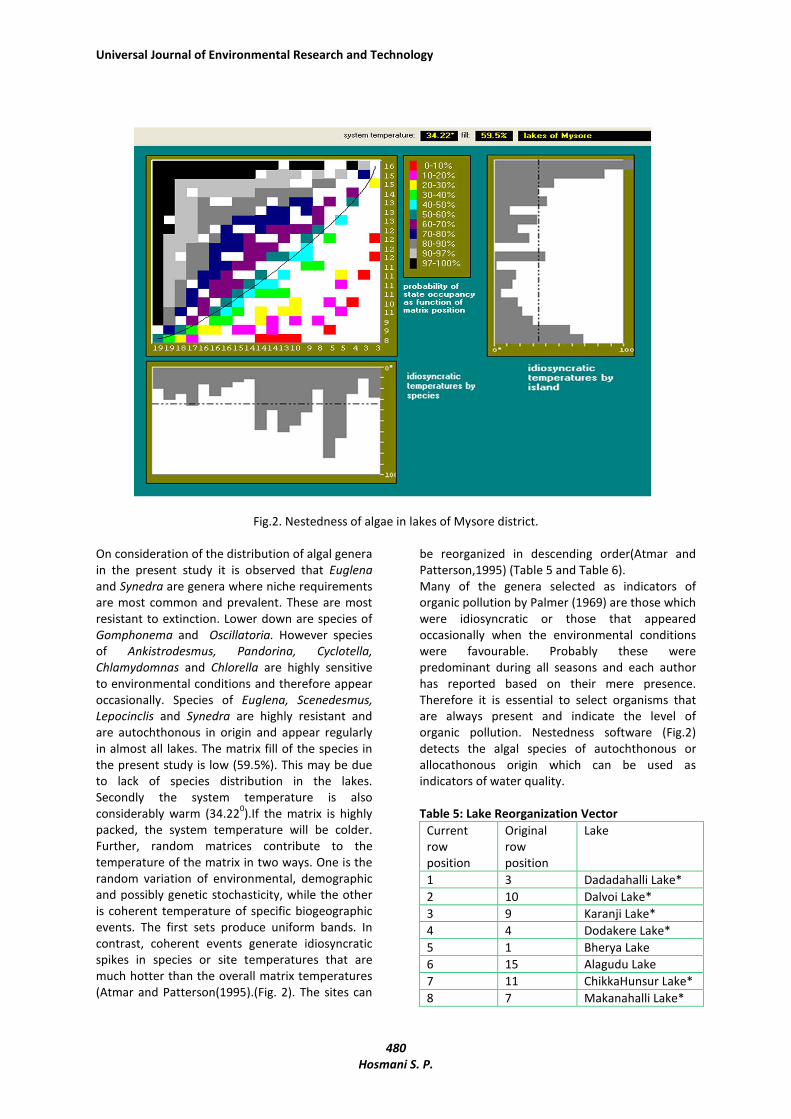
seasons. To understand the distribution the data in
Table 1 was subjected to Nestedness software
(Atmar and Patterson, 1995) and the results are
presented in Fig. 2. Nestedness analysis has
become increasingly popular in the study of
biogeographic patters of species occurrence and
the concept of nestedness was proposed
independently by Hulten(1937), Darlington(1957)
and Daubenmire (1975), Hausdrof and
Hennig(2003) to describe patterns of species
composition within continental biota and isolated
habitats such as islands and landscape
fragments(Ulrich et al.,2009). Nestedness data are
usually organized as a familiar binary, presence-
absence matrix; each row is a species, each
column is a site (or sampling time) and the entries
indicate the presence (1) or absence (0) of a
species in a site (Mckoy and Heck, 1987).According
to Atmar and Patterson(1995), typically, the matrix
is ordered according to the marginal row and
column sums, with common species placed in the
upper rows, and species rich sites placed in the left
hand columns(Fig.2). When the data are
organized, nestedness is expressed as a
concentration of presence in the upper left
triangle of the matrix. The nestedness calculator
measures the biogeographic heat of the matrix
using the distribution of unexpected species
presence and absence within the matrix. Colder
the matrix temperature, more packed will be the
matrix. The presence-absence matrix contains two
levels of information. In addition to specifying
which species occur at which site, these matrices
reflect the relative hospitability of sites to the
species under study as well as the prevalence of
environmental conditions needed to support each
species. The top most sites are judged to be the
most hospitable and the left most species are the
ones where niche requirements are not common
and prevalent; making it the most resistant to
extinction or most prone to colonization. All these
explanations are derived from Atmar and
Patterson (1995).
In the present study (Fig.2.) Dadadahalli Lake,
Dalvoi Lake, Karanji Lake and Doddakere Lake can
be judged to be the most hospitable sites; while
Chikkahunsur Lake, Makanahalli Lake, Hadhinaru
Lake and Kalale Lake take the bottom position in
supporting the growth of algae.

Universal Journal of Environmental Research and Technology
476
Hosmani S. P.

Universal Journal of Environmental Research and Technology
477
Hosmani S. P.
Table 1: Algal Index of Genera (Palmer, 1969)(Genera only)
Algal Genera PI L1 L2 L3 L4 L5 L6 L7 L8 L9 L10 L11 L12 L13 L14 L15 L16 L17 L18 L19 L20
Microcystis 1 - - 1 - - - 1 - 1 1 1 - - - 1 1 - - 1 -
Ankistrodesmus 2 2 - - 2 2 2 2 2 2 2 2 2 2 - 2 - 2 - - -
Chlamydomonas 4 4 - - - - - - - 4 - - - - - - - 4 4 - 4
Chlorella 3 - - - - - - - - - 3 3 3 3 3 - - - - - -
Closterium 1 1 1 1 1 1 - 1 - 1 1 1 1 1 1 1 1 - 1 - 1
Cyclotella 1 1 1 1 1 1 - 1 - - - - - - - 1 1 1 - - -
Euglena 5 5 5 5 5 5 5 5 5 5 5 5 5 5 5 5 5 5 5 5 -
Gomphonema 1 1 1 1 1 1 - - 1 1 1 1 - - 1 1 1 1 - - 1
Lepocinclis 1 1 1 1 1 - 1 1 1 1 1 1 1 1 1 1 1 1 1 - 1
Melosira 1 - - - - 1 - - - 1 - - - - - - - 1 - - -
Micractinium 1 - - 1 - - - - - - 1 - - 1 - - - - - - -
Navicula 3 - 3 3 3 3 - - 3 3 3 3 3 3 3 3 3 3 - 3 3
Nitzschia 3 - 3 3 3 3 3 3 3 3 3 3 - - 3 3 - - - 3 3
Oscillatoria 4 4 4 4 4 4 4 4 4 4 - 4 4 4 4 - - - - 4 -
Pandorina 1 1 - 1 1 1 1 1 - - 1 - 1 - - - - - 1 1 -
Phacus 2 - 2 2 2 - - 2 2 2 2 2 2 2 2 2 2 2 2 2 -
Phormidium 1 1 1 1 1 - - - 1 1 1 1 1 - 1 1 1 1 1 - 1
Scenedesmus 4 4 4 4 4 4 4 4 4 4 4 - 4 4 4 4 4 4 4 4 4
Stegioclonium 2 2 - 2 2 - - - - - - - - - - - - - 2 - -
Synedra 2 2 2 2 - 2 2 2 2 2 2 2 - 2 - 2 2 2 2 2 2
Total Score 29 28 33 31 28 22 27 28 33 31 29 27 28 28 27 22 27 23 25 20
PI=Palmer’s Pollution Index;L1=Bherya Lake; L2=Bilikere Lake; L3= Dadadahalli Lake; L4= Doddakere Lake; L5=Kabini Lake; L6=Kalale Lake;
L7=Makanahalli Lake; L8=Arsankere Lake; L9= Karanji Lake; L10= Dalvoi Lake; L11= Chikkahunsur Lake; L12= Santhe Lake; L13= Kagglipura Lake;
L14=Kurabara Lake; L15=Alagudu Lake; L16= BannurHeggere Lake; L17=Yennehole Lake; L18=Shettykere Lake; L19=Hadhinaru Lake; L20=Bogadi
Lake.

Universal Journal of Environmental Research and Technology
478
Hosmani S. P.
Table 2: Species index (Palmer, 1969)
Algal Species PI L1 L2 L3 L4 L5 L6 L7 L8 L9 L10 L11 L12 L13 L14 L15 L16 L17 L18 L19 L20
Ankistrodesmus falcatus 3 3 - 3 3 - 3 3 3 3 3 3 3 3 3 - 3 3 - - -
Arthrospira jenneri 2 - - 2 - - - - 2 - 2 2 - 2 2 2 - 2 2 - 2
Chlorella vulgaris 2 - - - - - - - - - - 2 2 2 - 2 - - - - -
Cyclotella meneghiniana 2 - 2 2 - 2 2 2 - - 2 - - - - - 2
Euglena viridis 1 1 1 - - - - - 1 - - - - - - 1 - 1 - - -
Euglena acus 6 6 6 6 - - - 6 - 6 6 6 6 6 - 6 6 6 6 6 -
Gomphonema parvalum 1 1 1 - 1 - - - 1 - 1 - 1 - - 1 1 1 - - 1
Melosira islandica 2 - - - - 2 - - - - - - - - - - - - - - 2
Navicula cryptocephala 1 - - 1 1 1 - - - - 1 1 1 1 1 - 1 1 1 1 1
Nitzschia cryptocephala 1 1 - 1 - - 1 - - - - - - - - - - 1 1 - 1
Nitzschia palea 5 - 5 - - - - - 5 5 5 - - - 5 5 5 - - - -
Oscillatoria chlorina 2 - - - - - - 2 2 - - 2 - - - - - - 2 - -
Oscillatoria limosa 4 - - - - - - - - - - - 4 - - - - - - - -
Oscillatoria princeps 1 1 - - 1 - - - - 1 1 - - 1 - 1 1 - 1 - -
Oscillatoria putrida 1 - - - - - - - - - 1 - - - - - - - - - -
Oscillatoria tenuis 4 - - - - 4 - - - - - - - - - - - - 4 - -
Pandorina morum 3 - - 3 3 3 3 3 - - - - 3 - - - - 3 - - -
Scenedesmus quadricauda 4 4 4 4 4 - 4 4 4 4 - 4 4 4 4 - 4 4 4 4 4
Stegioclonium tenue 3 - - 3 3 - - - - - - - - - - - - - - - -
Synedra ulna 3 3 3 3 3 3 3 3 3 3 3 3 3 3 3 3 3 3 3 3 3
Total score 20 22 28 19 15 16 23 21 22 25 23 27 22 18 21 26 25 24 14 14
PI=Palmer’s Pollution Index;L1=Bherya Lake; L2=Bilikere Lake; L3= Dadadahalli Lake; L4= Doddakere Lake; L5=Kabini Lake; L6=Kalale Lake; L7=Makanahalli Lake;
L8=Arsankere Lake; L9= Karanji Lake; L10= Dalvoi Lake; L11= Chikkahunsur Lake; L12= Santhe Lake; L13= Kagglipura Lake; L14=Kurabara Lake; L15=Alagudu Lake; L16=
BannurHeggere Lake; L17=Yennehole Lake; L18=Shettykere Lake; L19=Hadhinaru Lake; L20=Bogadi Lake.
Universal Journal of Environmental Research and Technology
479
Hosmani S. P.
Table 3: Louis-Laclercq (IDSE/5): Ecological indices of Pollution (OMNIDA software)
Based on the appearance of diatoms only
Name of the Lake
% i
nd
ica
tors
of
org
an
ic p
oll
uti
on
Ra
tin
g
% i
nd
ica
tors
of
An
thro
po
ge
nic
Po
llu
tio
n
Ra
tin
g
De
gra
da
tio
n l
ev
el
insi
de
th
e l
ak
e
L1.Bherya Lake 40.00 Moderate 60.00 High High
L2. Bilikere Lake 72-73 Very high 27.27 Moderate High
L3.Dadadahalli Lake 42.86 Moderate 42.86 Moderate High
L4.Doddakere Lake 25.00 Moderate 75.00 Very high High
L5. Kabini Lake 37.50 Moderate 37.50 Moderate High
L6. Kalale lake 50.00 High 50.00 High High
L7. Makanahalli Lake 50.00 High 50.00 High High
L8.Arsankere Lake 66.67 High 33.33 Moderate High
L9. Karanji lake 62.50 High 37.50 Moderate High
L10. Dalvoi Lake 72.73 Very high 27.27 Moderate High
L11. Chikkahunsur Lake 25.00 Moderate 75.00 Very high Moderate
L12. Santhe Lake 40.00 Moderate 60.00 High High
L13. Kaggilipura Lake 40.00 Moderate 60.00 High High
L14. Kurabara Lake 66.67 High 33.33 Moderate High
L15.Algudu Lake 25.00 Moderate 75.00 Very high High
L16. BannurHeggere lake 20.00 Low 60.00 High High
L17. Yennehole lake 60.00 High 30.00 Moderate High
L18. Shettykere Lake 20.00 Low 60.00 High Moderate
L19. Hadhinaru Lake 20.00 Low 60.00 High Moderate
L20. Bogadi Lake 40.00 Moderate 60.00 High High
Table. 4 Ranking of Lakes according to Henry Garrett based on Palmers algal Index values
Name of the Lake
R1(5
)
R1x
65
R2(4
)
R2x
69
R3(3
)
R3x
73
R4(2
)
R4x
78
R5(1
)
R5x
88
To
tal
core
Av
era
ge
sco
re
Ra
nk
L1.Bherya Lake 1 65 3 207 0 00 3 234 6 528 1034 51.70 5
L2. Bilikere Lake 1 65 2 138 2 146 2 156 5 440 805 40.25 13
L3.Dadadahalli Lake 1 65 2 138 2 146 3 234 8 704 1287 64.35 1
L4.Doddakere Lake 1 65 2 138 2 146 3 234 6 528 1111 55.55 4
L5. Kabini Lake 1 65 2 138 2 146 2 156 5 440 945 47.25 10
L6. Kalale lake 1 65 2 138 1 73 2 156 2 176 608 30.40 18
L7. Makanahalli Lake 1 65 2 138 1 73 2 156 2 176 608 30.40 18
L8.Arsankere Lake 1 65 2 138 2 146 3 234 3 264 847 42.35 12
L9. Karanji lake 1 65 3 207 2 146 3 234 6 528 1180 59.00 3
L10. Dalvoi Lake 1 65 1 69 3 219 3 234 7 616 1203 60.15 2
L11. Chikkahunsur Lake 1 65 1 69 3 219 2 156 5 440 949 47.45 9
L12. Santhe Lake 1 65 2 138 2 146 3 234 4 352 935 46.75 11
L13. Kaggilipura Lake 1 65 2 138 2 146 1 78 3 264 691 34.55 16
L14. Kurabara Lake 1 65 2 138 3 219 3 234 4 352 1008 50.40 6
L15.Algudu Lake 1 65 1 69 2 146 2 156 6 528 964 48.20 8
L16. BannurHeggere lake 1 65 1 69 1 73 3 234 6 528 969 48.45 7
L17. Yennehole lake 1 65 2 138 1 73 3 234 5 440 950 47.50 9
L18. Shettykere Lake 1 65 2 138 0 00 3 234 4 352 789 39.45 14
L19. Hadhinaru Lake 1 65 2 138 2 146 2 156 2 176 622 31.10 17
L20. Bogadi Lake 0 00 2 138 2 146 1 78 4 352 714 35.70 15
Universal Journal of Environmental Research and Technology
480
Hosmani S. P.
Fig.2. Nestedness of algae in lakes of Mysore district.
On consideration of the distribution of algal genera
in the present study it is observed that Euglena
and Synedra are genera where niche requirements
are most common and prevalent. These are most
resistant to extinction. Lower down are species of
Gomphonema and Oscillatoria. However species
of Ankistrodesmus, Pandorina, Cyclotella,
Chlamydomnas and Chlorella are highly sensitive
to environmental conditions and therefore appear
occasionally. Species of Euglena, Scenedesmus,
Lepocinclis and Synedra are highly resistant and
are autochthonous in origin and appear regularly
in almost all lakes. The matrix fill of the species in
the present study is low (59.5%). This may be due
to lack of species distribution in the lakes.
Secondly the system temperature is also
considerably warm (34.220).If the matrix is highly
packed, the system temperature will be colder.
Further, random matrices contribute to the
temperature of the matrix in two ways. One is the
random variation of environmental, demographic
and possibly genetic stochasticity, while the other
is coherent temperature of specific biogeographic
events. The first sets produce uniform bands. In
contrast, coherent events generate idiosyncratic
spikes in species or site temperatures that are
much hotter than the overall matrix temperatures
(Atmar and Patterson(1995).(Fig. 2). The sites can
be reorganized in descending order(Atmar and
Patterson,1995) (Table 5 and Table 6).
Many of the genera selected as indicators of
organic pollution by Palmer (1969) are those which
were idiosyncratic or those that appeared
occasionally when the environmental conditions
were favourable. Probably these were
predominant during all seasons and each author
has reported based on their mere presence.
Therefore it is essential to select organisms that
are always present and indicate the level of
organic pollution. Nestedness software (Fig.2)
detects the algal species of autochthonous or
allocathonous origin which can be used as
indicators of water quality.
Table 5: Lake Reorganization Vector
Current
row
position
Original
row
position
Lake
1 3 Dadadahalli Lake*
2 10 Dalvoi Lake*
3 9 Karanji Lake*
4 4 Dodakere Lake*
5 1 Bherya Lake
6 15 Alagudu Lake
7 11 ChikkaHunsur Lake*
8 7 Makanahalli Lake*

Universal Journal of Environmental Research and Technology
481
Hosmani S. P.
9 17 Yennehole Lake
10 2 Bilikere Lake
11 5 Kabini Lake
12 16 Bannur Heggere
Lake
13 13 Kaggilipura Lake
14 14 Kurabara Lake
15 8 Arsankere Lake
16 18 Shettykere Lake
17 12 Santhe Lake
18 19 Hadhinaru Lake
18 20 Bogadi Lake
20 6 Kalale Lake
(Original row position: Table 1)(* Idiosyncracytic
temperatures for Lakes)
Table 6: Algal generation Reorganization Vector
Current
row position
Original
column Position
Species name
1 7 Euglena
2 18 Scenedesmus
3 9 Lepocinclis
4 20 Synedra
5 5 Clsterium
6 12 Navicula
7 16 Phacus
8 17 Phormidium
9 8 Gomphonema*
10 14 Oscillatoria*
11 13 Nitrzschia
12 2 Ankistrodesmus*
13 15 Pandorina*
14 6 Cyclotella*
15 1 Microcystis
16 3 Chlmydomonas*
17 4 Chlorella*
18 19 Stigioclonium
19 11 Micractinium
20 10 Melosira
(Original column position: Table 1)(* Idiosyncratic
temperatures for species showing unexpected
absences))
4.0. Conclusions The pollution index of Plamer(1969) developed for
rating of water samples as high or low organically
polluted is a useful technique, since algal
populations are used. However the number of
genera or species provides a limited scope for the
study. There are several other genera that can
indicate organic pollution but are not included in
the list. So also there are newer techniques for
detection of organic pollution. According to the
Palmer’s algal index all the lakes are categorized as
organically polluted. One of the well developed
technique for detection of organic pollution is the
OMNIDA GB 5.3 soft ware. This software uses only
diatoms for the detection of organic pollution. It
can also suggest the levels of degradation in any
water body and as well detect which diatoms are
autochathonous and which are
allocathonous.Diatoms remain as benthic or
epiphytic forms and can serve as good indicators
of organic pollution. While determining the
quality of any water body it is of importance to
take the help of well developed softwares that can
give precise results. The consise results can be
applied in the conservation of heavily polluted
lakes.Further “Nestedness calculator” is an
excellent tool to understand which algal species
show unexpected absence of presence and
whether the distribution of algal species is well
marked or unevenly distributed. This is however
based on the ecological factors controlling the
growth of algae. The matrix fll and the systems
temperature are important aspects of the
software . Colder system temperatures, have a
highly packed matrix. Idiosyncratic-species
appearing or dissappearing suddenly can be
marked and only algae that survive in the lakes for
longer duration can be used for WQI.Dadadahalli
Lake, Dalvoi Lake and Karanji Lake are the highest
organically polluted and species of Euglena,
Scenedesmus, Lepocinclis and Synedra are the top
indicators of the water quality. The ranking
technique is also another important aspect. The
technique enables the researcher to place the
sities under study from the most polluted to the
least polluted or compare similar sites for
conservation strategies. These techniques put
together can be a better way of studying organic
pollution in lakes. Palmer’s index is highly useful
but is based on the reports of authors and
probably does not consider the season, number or
the place of occurrence. The combination of all the
newer techniques can be very useful in
conservation strategies of lake ecosystems.The
observations in the present study indicate that all
the 20 lakes are organically polluted, but the
degree of pollution varies to a greater
extent.There is also a need to add more species to
the list of algae tolerating organic pollution and
apply integrated techniques of improving water
quality in lakes.

Universal Journal of Environmental Research and Technology
482
Hosmani S. P.
5.0 Acknowledgement The author is greatful to Prof. K.V. Prabhakara,
Principal for facilities and to M.Mahesh,Assistant
Librarian for the technical assistance.
References: 1) Atmar.W. and B.D. Patterson (1995) The
nestedness temperature calculator. A visual
basic program including 294 presence absence
matrices”AICS Research Inc. University Parle
N.M. and the Field Museum. Chicago.IL
2) Blanco. I.A. and S. Blanco (2012) The Duro
Diatom Index(DDI) for river water quality
assessment in N.W. Spain: Design and
Validation. Environ. Monit Assess DVI
10.1007/s 10661-012-2607z
3) Darlington,P.J (.1957). Zoogeography:the
geographical distribution of animals-Wiley
4) Daubenmire,R.(1975). Floristic plant
geography of eastern Washington and
northern Idaho-J.Biogeorg,2:1-18
5) Desikachary. T.V.(1959). Cyanophyta. ICAR
Publications, New Delhi
6) Gandhi.H.P. (1998). Freshwater diatoms of
central Gujarat, with rivew and some others.
Bishen Singh Mahendra Pal Singh Publishers,
Deharadun
7) Garrett, Henrey (1924). An empirical study of
the various methods of combining incomplete
order of merrit ratings. Journal of Educational
Psychology(15)3:157-171.
8) Hausdrof.B and Hening, C. (2003).Nestedness
of north-west European land snail ranges as a
consequence of differential immigration from
Pleistocene glacial refuges-Oeclogia 135:102-
109
9) Hosmani.S.P. and S.G. Bharathi (1980). Algae
as indicators of organic pollution. Phykos
19(1):23-26
10) Hosmani.S.P. 2010. Phytoplankton diversity in
lakes of Mysore district, Karnataka State,
India. The Ecoscan 4(1)53-57.
11) Hosmani,S.P. (2012a). Application of benthic
diatom community in lake water quality
monitoring. OIIRJ.II(III):21-34.
12) Hosmani. S.P. (2012b).Multivariate analysis for
distribution of Euglenophyceae in Karanji Lake
of Mysore. PHYKOS 42(2)74-79
13) Hosmani.S.P and T.B. Mruthunjaya
(2013.)Impact of plankton diversity on the
water quality index in a lake at Thirumakudal
Narasipura, Mysore district. International
Journal of Innovative Research in Science,
Engineering and Technology 2(5):1434-1441.
14) Hultein,E (1937). Outline of the history of
Arctic and Boreal biota during the quartenary
period.Thule, Stockholm.
15) Kelly. M.G (2006) A comparasion of diatoms
with other phytobenthos as indicators of
ecological status of streams of Northern
England. In ed/Witowski.A. Proceedings of the
18th
International Diatom Symposium.
Bristol:131-151.
16) Lackey J.P. (1938) .Public Health Reports
53:2080-2091.
17) Lecoinite C., M.Coste and J. Prygeil (2003).
OMNIDA: Diatom Index Software including
diatom data base with taxanomic names,
references and codes of 11645 diatom taxa.
18) Louis-Laclereq (2008). IDSE Diatom Index of
saprobity-Eutrophication conception (in
Lecoinite et.al. 1993)
19) McKoy,E.D. and Heck,K.L. (1987). Some
observations on the use of taxanomic
similarity in large-scale biogeography.J.
biogeogr.14:79-87
20) Nygaard.G. (1976). Talverna fra
Danst.Phytoplankton. Cyledandl. Pp.22.
21) Palmer. G.M. (1959) Algae of water supplies.
U.S. Publ. Health Services Publication 657:1-85
22) Philipose.M.T. (1960). Chlorococcales. ICAR
Publication New Delhi
23) Prescott.G.W. (1982). Algae of the Western
Great Lakes Area. Otto Kaetz Science
Publishers. W. Germany pp.977.
24) Sarode P.T. and N.D. Kamath (1984). Fresh
water diatoms of Maharastra. Saikrupa
Prakashan, Aurangabad.pp.338.
25) Scott.A. and G.W. Prescott (1961). Indonesian
Desmids, Hydrobiologia XVIII. 25(4):131
26) Sudeep.B.M, T.B. Mruthunjaya and S.P.
Hosmani(2007). Principal Component
Analysis:an appropriate tol for water quality
evaluation and management. Application n
trwo lakes of Mysore District.Indian
Hydrobiology.10(2):381-391
27) Suxena.M.R. (1987). Environmental Analysis:
Water, Air and Soil. Agrobotanical Publishers,
India
28) Taylor.J.C, W.R. Harding and C.G.M. Archibald
(2007). An illustrated guide to common
diatom species from South Africa. WRL Report
TT 282.
29) Ulrich,W, Mario A. Neto and Nicholas J.G.
(2009). A consumers guide to nestedness
analysis. Okios 118: 3-17.
30) West.W and G.S. West (1909)The British
Freshwater Plankton and the distribution of
desmids.Proc.Roy.Soc.D.81:165-206.