Embed Size (px)
Citation preview
May 24, 2021
Sub: Investor Presentation on Audited Financial Results for the quarter and year ended on March 31, 2021
Dear Sir,
Please find enclosed Investor Presentation on Audited Financial Results of the company for the quarter and year ended on March 31, 2021.
The same is for your information and record.
Thanking You,
For Relaxo Footwears Limited,
Vikas Kumar Tak Company Secretary and Compliance Officer Membership No.: FCS 6618
Encl. as above
BSE Ltd. Corporate Relationship Department 1st Floor New Trading Rotunda Building, P J Towers Dalal Street Fort, Mumbai–400001
National Stock Exchange of India Ltd Listing Department, Exchange Plaza, Bandra Kurla Complex, Bandra (East), Mumbai- 400051
Scrip Code – 530517 Scrip Code – RELAXO
Classification: Internal
Classification: Internal
Safe Harbor
This presentation and the accompanying slides (the “Presentation”), which have been prepared by Relaxo Footwears Limited (the “Company”), have beenprepared solely for information purposes and do not constitute any offer, recommendation or invitation to purchase or subscribe for any securities, andshall not form the basis or be relied on in connection with any contract or binding commitment what so ever. No offering of securities of the Company willbe made except by means of a statutory offering document containing detailed information about the Company.
This Presentation has been prepared by the Company based on information and data which the Company considers reliable, but the Company makes norepresentation or warranty, express or implied, whatsoever, and no reliance shall be placed on, the truth, accuracy, completeness, fairness andreasonableness of the contents of this Presentation. This Presentation may not be all inclusive and may not contain all of the information that you mayconsider material. Any liability in respect of the contents of, or any omission from, this Presentation is expressly excluded.
Certain matters discussed in this Presentation may contain statements regarding the Company’s market opportunity and business prospects that areindividually and collectively forward-looking statements. Such forward-looking statements are not guarantees of future performance and are subject toknown and unknown risks, uncertainties and assumptions that are difficult to predict. These risks and uncertainties include, but are not limited to, theperformance of the Indian economy and of the economies of various international markets, the performance of the industry in India and world-wide,competition, the company’s ability to successfully implement its strategy, the Company’s future levels of growth and expansion, technologicalimplementation, changes and advancements, changes in revenue, income or cash flows, the Company’s market preferences and its exposure to marketrisks, as well as other risks. The Company’s actual results, levels of activity, performance or achievements could differ materially and adversely from resultsexpressed in or implied by this Presentation. The Company assumes no obligation to update any forward-looking information contained in thisPresentation. Any forward-looking statements and projections made by third parties included in this Presentation are not adopted by the Company and theCompany is not responsible for such third party statements and projections.
2
Classification: Internal
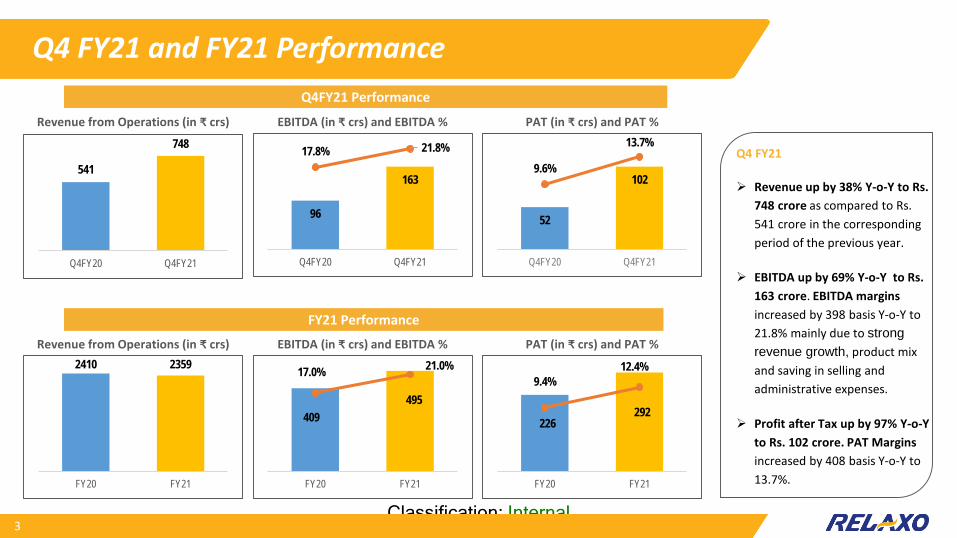
Q4 FY21 and FY21 Performance
Revenue from Operations (in ₹ crs)
52
1029.6%
13.7%
Q4FY20 Q4FY21
PAT (in ₹ crs) and PAT %
96
163
17.8% 21.8%
Q4FY20 Q4FY21
EBITDA (in ₹ crs) and EBITDA %
3
2410 2359
FY20 FY21
409495
17.0% 21.0%
FY20 FY21
Revenue from Operations (in ₹ crs) PAT (in ₹ crs) and PAT %EBITDA (in ₹ crs) and EBITDA %
Q4FY21 Performance
FY21 Performance
Q4 FY21
Revenue up by 38% Y-o-Y to Rs. 748 crore as compared to Rs. 541 crore in the corresponding period of the previous year.
EBITDA up by 69% Y-o-Y to Rs. 163 crore. EBITDA margins increased by 398 basis Y-o-Y to 21.8% mainly due to strong revenue growth, product mix and saving in selling and administrative expenses.
Profit after Tax up by 97% Y-o-Y to Rs. 102 crore. PAT Marginsincreased by 408 basis Y-o-Y to 13.7%.
541
748
Q4FY20 Q4FY21
226292
9.4%12.4%
FY20 FY21

Classification: Internal
Company Overview
Classification: Internal
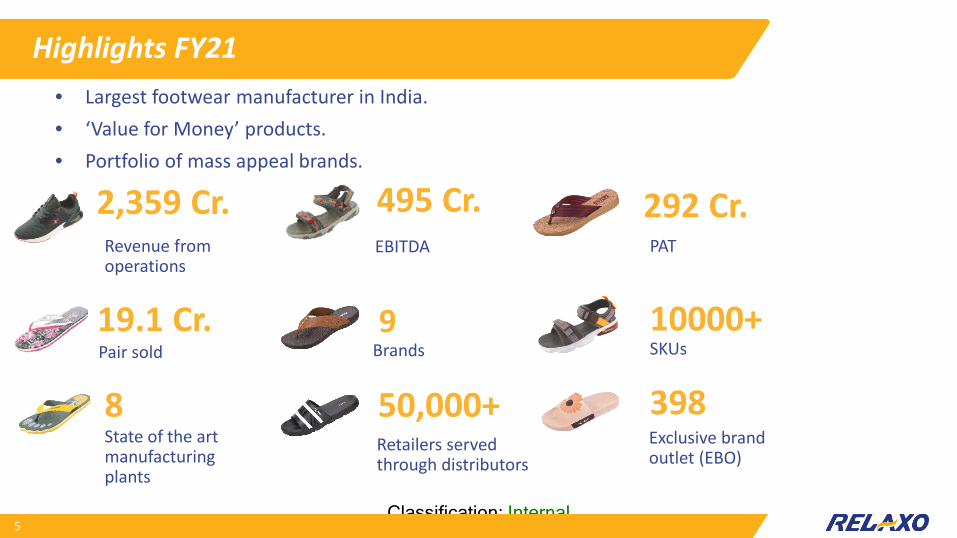
Highlights FY21
5
19.1 Cr.Pair sold
9 Brands
10000+SKUs
8State of the art manufacturing plants
50,000+Retailers served through distributors
398Exclusive brand outlet (EBO)
• Largest footwear manufacturer in India.• ‘Value for Money’ products. • Portfolio of mass appeal brands.
2,359 Cr.Revenue from operations
495 Cr.EBITDA
292 Cr.PAT
Classification: Internal
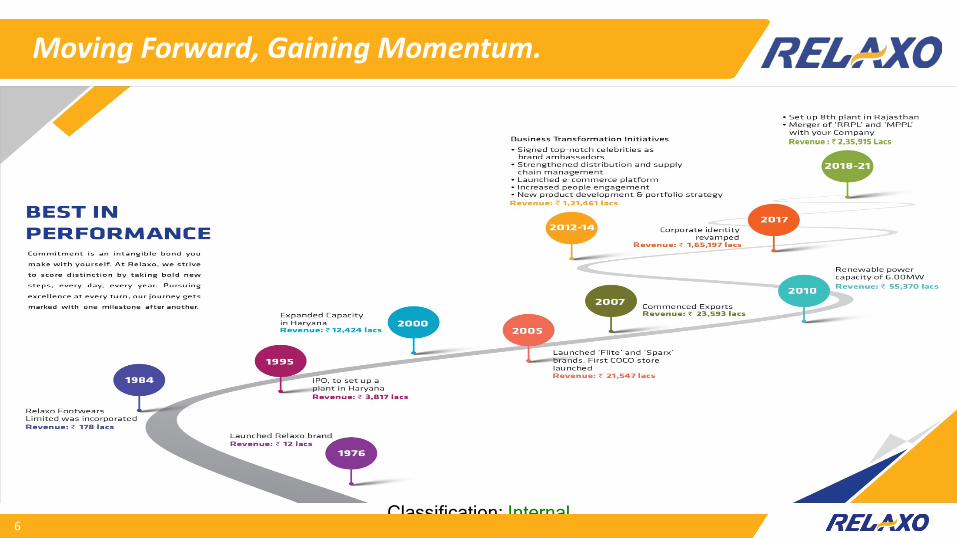
Moving Forward, Gaining Momentum.
6
Classification: Internal
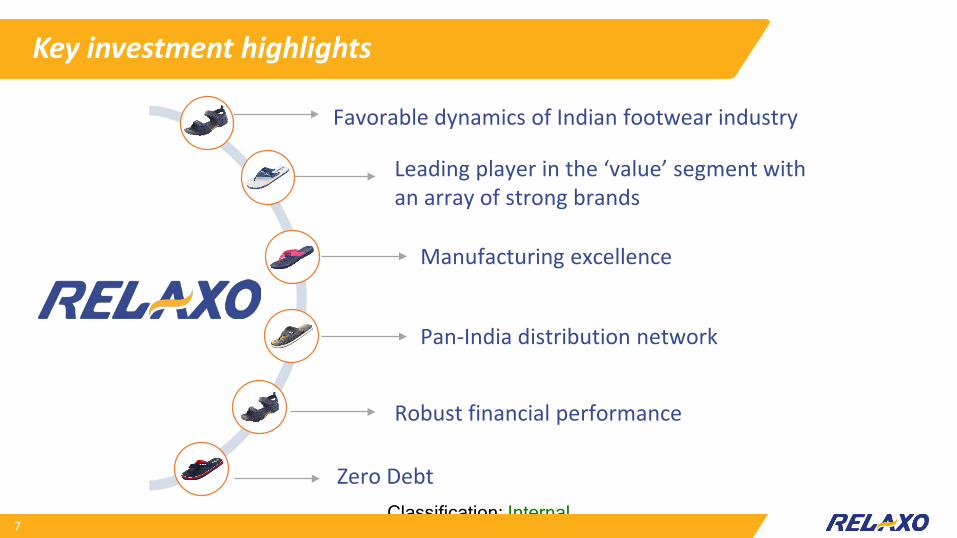
Key investment highlights
7
Favorable dynamics of Indian footwear industry
Robust financial performance
Pan-India distribution network
Zero Debt
Manufacturing excellence
Leading player in the ‘value’ segment with an array of strong brands
Classification: Internal
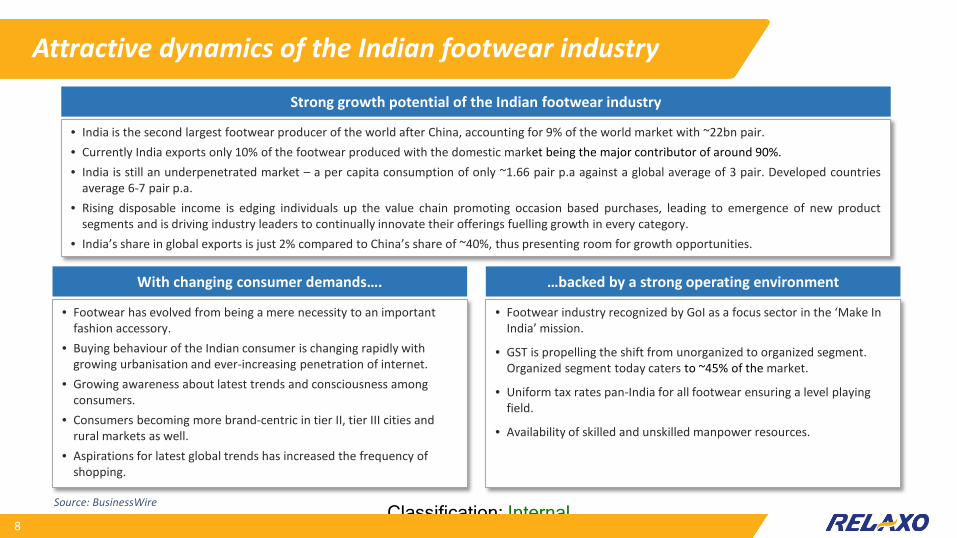
Attractive dynamics of the Indian footwear industry
8
Strong growth potential of the Indian footwear industry
• India is the second largest footwear producer of the world after China, accounting for 9% of the world market with ~22bn pair.• Currently India exports only 10% of the footwear produced with the domestic market being the major contributor of around 90%.• India is still an underpenetrated market – a per capita consumption of only ~1.66 pair p.a against a global average of 3 pair. Developed countries
average 6-7 pair p.a.• Rising disposable income is edging individuals up the value chain promoting occasion based purchases, leading to emergence of new product
segments and is driving industry leaders to continually innovate their offerings fuelling growth in every category.• India’s share in global exports is just 2% compared to China’s share of ~40%, thus presenting room for growth opportunities.
With changing consumer demands….
• Footwear has evolved from being a mere necessity to an important fashion accessory.
• Buying behaviour of the Indian consumer is changing rapidly with growing urbanisation and ever-increasing penetration of internet.
• Growing awareness about latest trends and consciousness among consumers.
• Consumers becoming more brand-centric in tier II, tier III cities and rural markets as well.
• Aspirations for latest global trends has increased the frequency of shopping.
…backed by a strong operating environment
• Footwear industry recognized by GoI as a focus sector in the ‘Make In India’ mission.
• GST is propelling the shift from unorganized to organized segment. Organized segment today caters to ~45% of the market.
• Uniform tax rates pan-India for all footwear ensuring a level playing field.
• Availability of skilled and unskilled manpower resources.
Source: BusinessWire
Classification: Internal
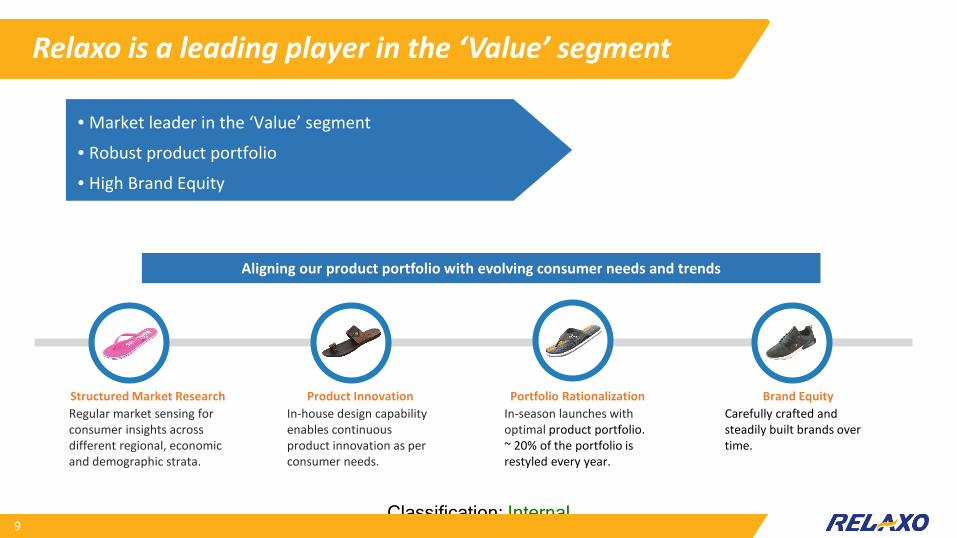
Relaxo is a leading player in the ‘Value’ segment
9
Structured Market ResearchRegular market sensing for consumer insights across different regional, economic and demographic strata.
Product InnovationIn-house design capability enables continuous product innovation as per consumer needs.
Portfolio Rationalization In-season launches with optimal product portfolio. ~ 20% of the portfolio is restyled every year.
Brand EquityCarefully crafted and steadily built brands over time.
Aligning our product portfolio with evolving consumer needs and trends
• Market leader in the ‘Value’ segment
• Robust product portfolio
• High Brand Equity

Classification: Internal
Our portfolio of brands, with strong identities
10
Premium range of sports & canvas shoes, sandals & slippers
Fashionable and light weight footwear
Trendy and fashionable flip-flops
Range of school shoes for boys and girls
Formal shoes for men
Trendy footwear for women
Household name synonymous with quality, comfort & value
Quality, Comfortable shoes for men
Range of cool, colourful footwear for next-gen kids
Most popular iconic brand of Hawai slippers
Classification: Internal
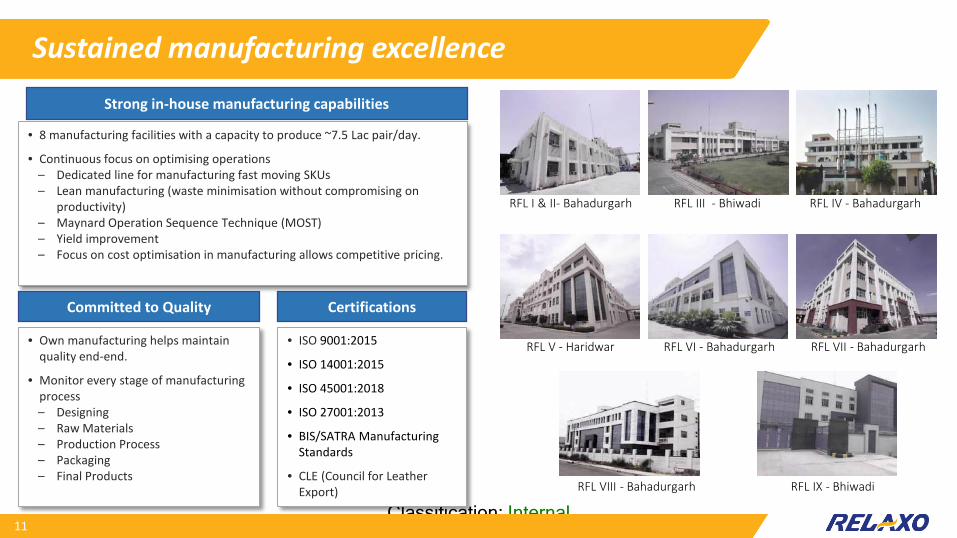
Sustained manufacturing excellence
11
RFL I & II- Bahadurgarh RFL III - Bhiwadi RFL IV - Bahadurgarh
RFL V - Haridwar RFL VI - Bahadurgarh RFL VII - Bahadurgarh
RFL VIII - Bahadurgarh RFL IX - Bhiwadi
• 8 manufacturing facilities with a capacity to produce ~7.5 Lac pair/day.
• Continuous focus on optimising operations– Dedicated line for manufacturing fast moving SKUs– Lean manufacturing (waste minimisation without compromising on
productivity)– Maynard Operation Sequence Technique (MOST)– Yield improvement – Focus on cost optimisation in manufacturing allows competitive pricing.
Strong in-house manufacturing capabilities
• Own manufacturing helps maintain quality end-end.
• Monitor every stage of manufacturing process– Designing– Raw Materials– Production Process– Packaging– Final Products
Committed to Quality
• ISO 9001:2015
• ISO 14001:2015
• ISO 45001:2018
• ISO 27001:2013
• BIS/SATRA Manufacturing Standards
• CLE (Council for Leather Export)
Certifications
Classification: Internal
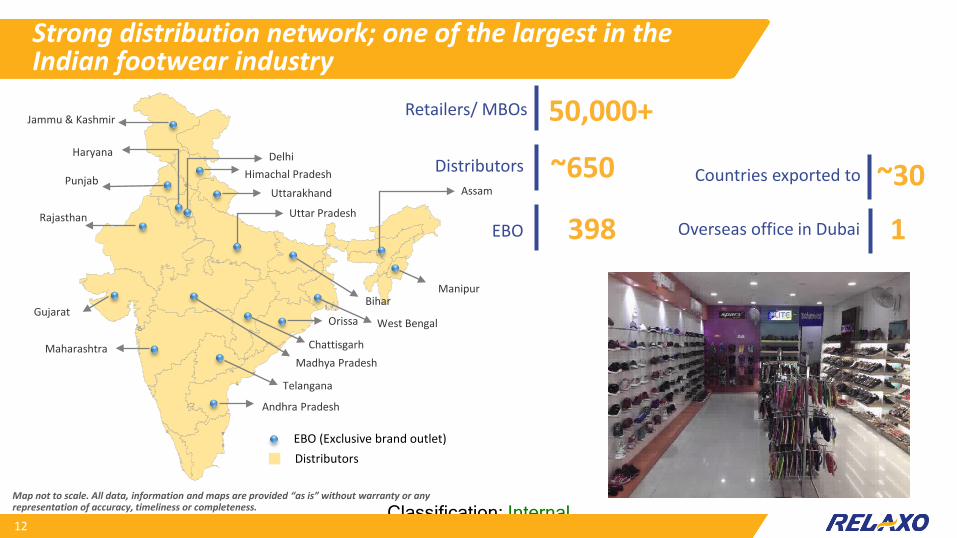
Strong distribution network; one of the largest in the Indian footwear industry
12
Rajasthan
Gujarat
Maharashtra
Punjab
Haryana
Uttarakhand
Jammu & Kashmir
Delhi
Uttar Pradesh
EBO (Exclusive brand outlet)Distributors
Himachal Pradesh
Madhya Pradesh
Bihar
West Bengal
Map not to scale. All data, information and maps are provided “as is” without warranty or any representation of accuracy, timeliness or completeness.
50,000+Retailers/ MBOs
~650Distributors
398EBO
~30Countries exported to
Overseas office in Dubai 1Assam
Manipur
Andhra Pradesh
Telangana
Chattisgarh
Orissa
Classification: Internal
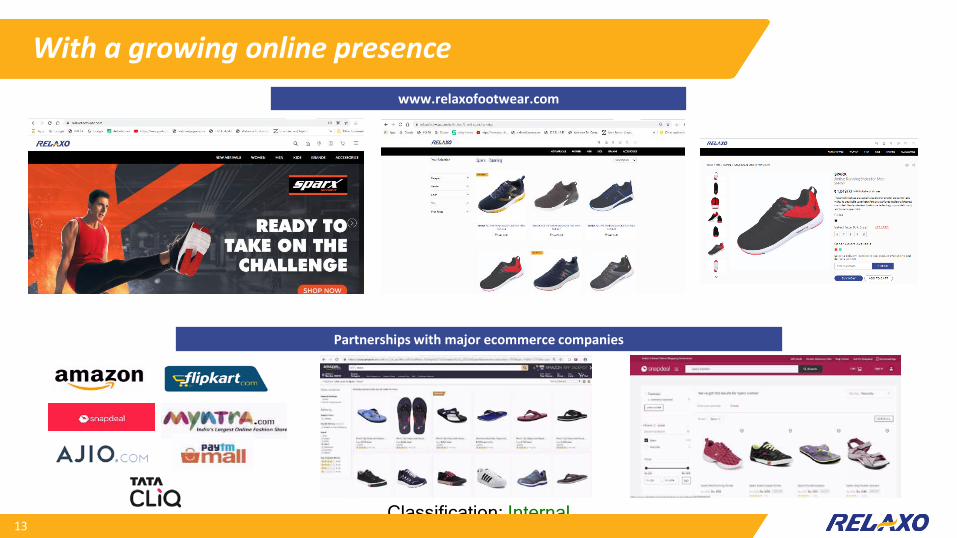
With a growing online presence
13
www.relaxofootwear.com
Partnerships with major ecommerce companies
Classification: Internal
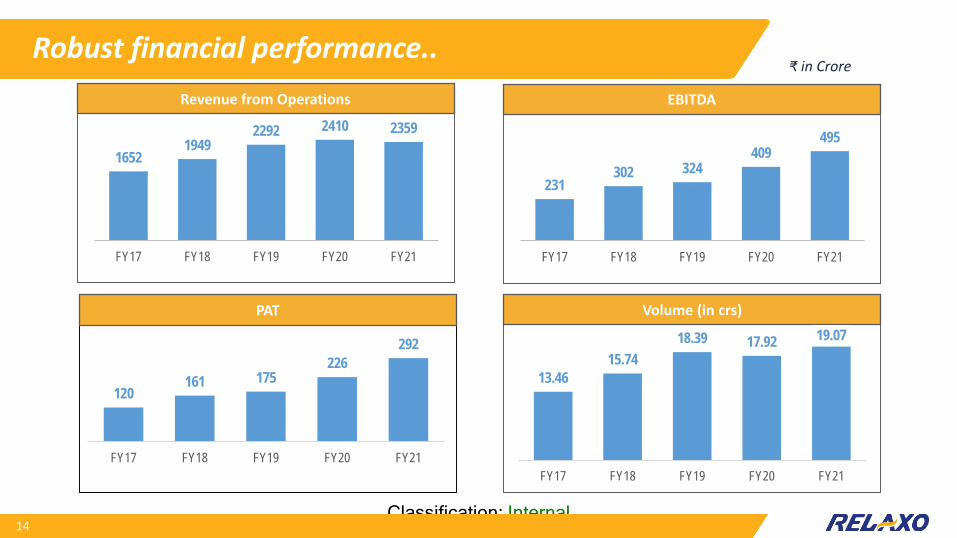
Robust financial performance..EBITDA
231302 324
409495
0
100
200
300
400
500
600
FY17 FY18 FY19 FY20 FY21
Volume (in crs)
13.4615.74
18.39 17.92 19.07
FY17 FY18 FY19 FY20 FY21
₹ in Crore
14
120161 175
226292
0
50
100
150
200
250
300
350
FY17 FY18 FY19 FY20 FY21
PAT
Revenue from Operations
16521949
2292 2410 2359
0100200300400500600700800900
1,0001,1001,2001,3001,4001,5001,6001,7001,8001,9002,0002,1002,2002,3002,4002,5002,600
FY17 FY18 FY19 FY20 FY21
Classification: Internal
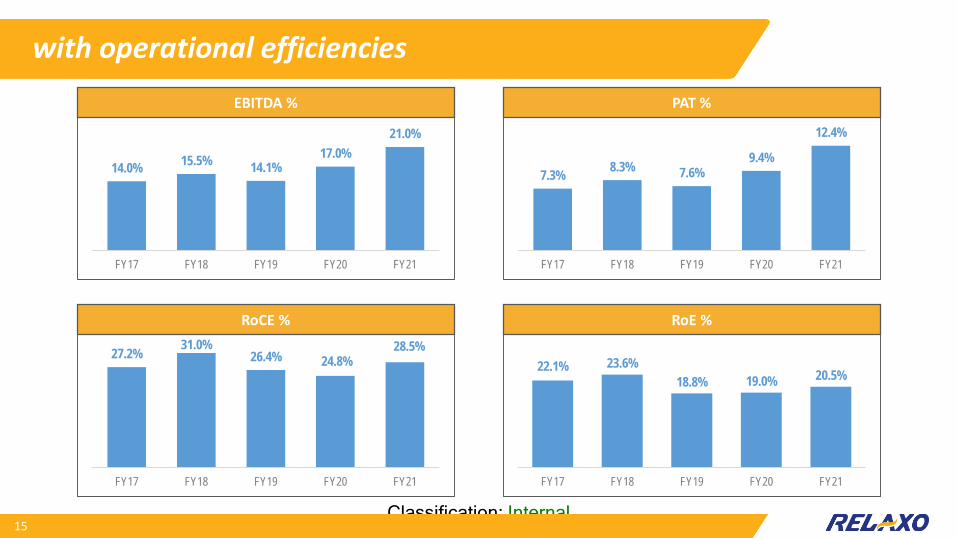
with operational efficienciesEBITDA % PAT %
14.0% 15.5% 14.1%17.0%
21.0%
FY17 FY18 FY19 FY20 FY21
7.3% 8.3% 7.6%9.4%
12.4%
FY17 FY18 FY19 FY20 FY21
27.2% 31.0%26.4% 24.8%
28.5%
FY17 FY18 FY19 FY20 FY21
RoCE % RoE %
22.1% 23.6%18.8% 19.0% 20.5%
FY17 FY18 FY19 FY20 FY21
15
Classification: Internal
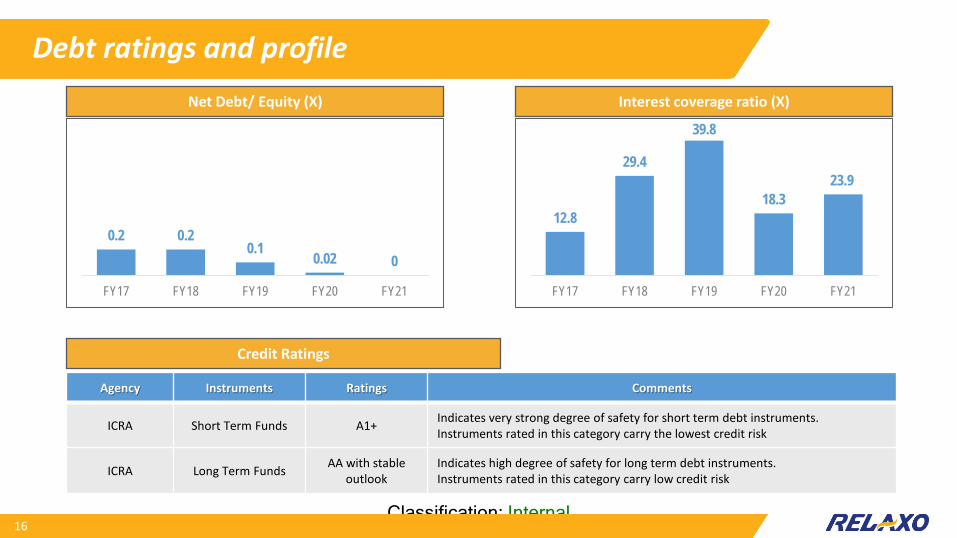
Debt ratings and profile
0.2 0.20.1 0.02 0
FY17 FY18 FY19 FY20 FY21
12.8
29.4
39.8
18.323.9
FY17 FY18 FY19 FY20 FY21
Net Debt/ Equity (X) Interest coverage ratio (X)
Agency Instruments Ratings Comments
ICRA Short Term Funds A1+ Indicates very strong degree of safety for short term debt instruments.Instruments rated in this category carry the lowest credit risk
ICRA Long Term Funds AA with stable outlook
Indicates high degree of safety for long term debt instruments.Instruments rated in this category carry low credit risk
Credit Ratings
16
Classification: Internal17
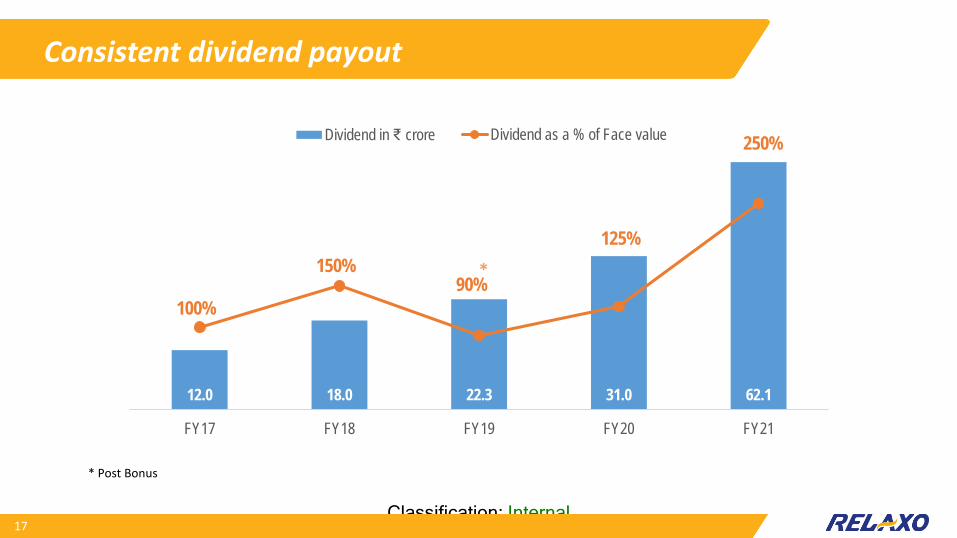
12.0 18.0 22.3 31.0 62.1
100%
150%90%
125%
250%
FY17 FY18 FY19 FY20 FY21
Dividend in ₹ crore Dividend as a % of Face value
Consistent dividend payout
* Post Bonus
Classification: Internal
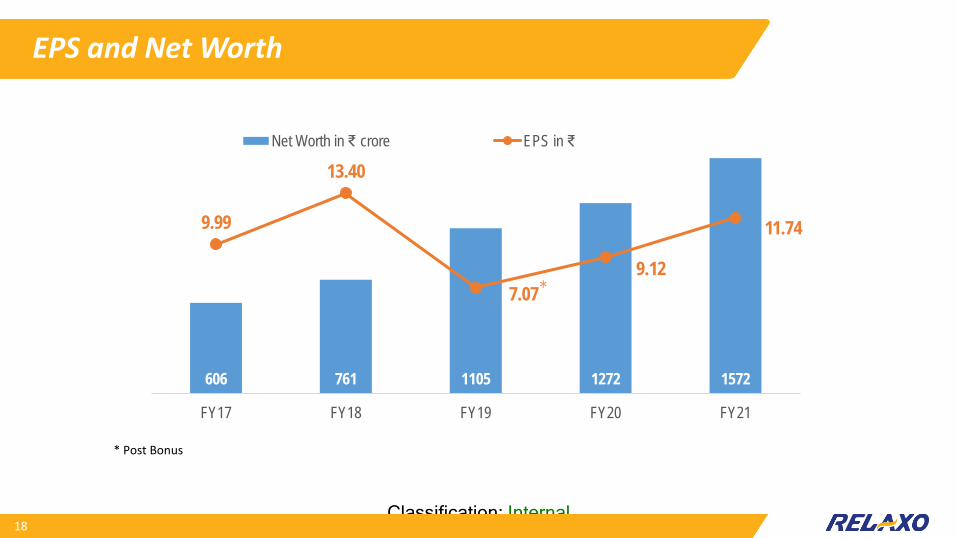
EPS and Net Worth
18
606 761 1105 1272 1572
9.99
13.40
7.079.12
11.74
FY17 FY18 FY19 FY20 FY21
Net Worth in ₹ crore EPS in ₹
* Post Bonus
Classification: Internal
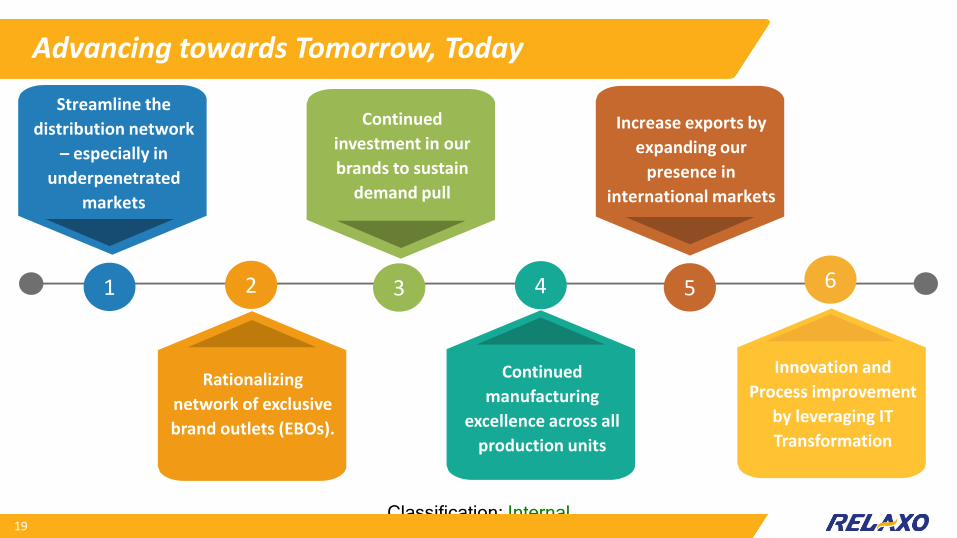
Advancing towards Tomorrow, Today
19
Streamline the distribution network
– especially in underpenetrated
markets
Continued investment in our brands to sustain
demand pull
Increase exports by expanding our
presence in international markets
Continued manufacturing
excellence across all production units
Rationalizing network of exclusive brand outlets (EBOs).
1 2 3 4 5 6
Innovation and Process improvement
by leveraging IT Transformation

Classification: Internal
Highly experienced Board of DirectorsRamesh Kumar Dua, Managing Director Over 45 years of experience in strategic, sales and marketing, production and new
product development in footwear industry Commerce Graduate & Rubber Technologist (LPRI, London) Leading Relaxo to become the largest footwear manufacturer of India, with an
array of strong brands.
Nikhil Dua, Whole Time Director Over 25 years of experience in production and new product development and has
rich knowledge of product mix in Footwear Industry Commerce graduate and has studied from International School of Modern Shoe-
making, Czech Republic
Pankaj Shrimali, Independent Director Over 37 years of experience in areas of finance, accounts, secretarial, corporate
management, legal & corporate consultancy services, strategic management andinvestment banking for reputed corporate houses
Fellow member of ICAI, ICSI, and Institute of Cost Accountants of India
Vivek Kumar, Independent Director Over 21 years experience as Operational Head in leading Indian companies and is
also a management consultant to many corporates in the areas of quality,productivity, environment and safety
MBA from Faculty of Management Studies, Delhi University and ElectricalEngineer from the University of Roorkee (now IIT Roorkee)
Mukand Lal Dua, Whole Time Director Over 48 years of experience in manufacturing excellence in footwear
industry. Science Graduate Providing cutting edge impetus to new product development and quality
control.
Deval Ganguly, Whole Time Director Over 40 years of experience in areas of manufacturing, project and plant
management in various reputed organisations, Joined Company in 2011 as President, Manufacturing and was elevated to Board
w.e.f 5.11.2012. He is B.Tech from IIT Kanpur
Deepa Verma, Independent Director Over 33 years of experience in academic administration. Associated with University of Petroleum & Energy Studies since inception and has
held various positions such as Director (NCR) region, VP (Academic Affairs) &presently in charge of Institutional Affairs & HR
B.Sc, LL.B, M.A (Psychology), Diploma in Educational Guidance & Counselling
20
Rajeev Bhadauria, Independent Director Over 34 years of experience in Human Resource and leadership Past association with JSPL, Reliance ADA group & NTPC at various positions in
Human Resource. B.A. & LLB from Allahabad University and management diploma from Power
Management Institute, New Delhi

Classification: Internal
And a strong management team
21
Mr. Gaurav Dua,Executive VP -Marketing
MBA having over 20 years of experience in Sales & Marketing.
Mr. Ritesh Dua,Executive VP - Finance
MBA having over 21 yearsof experience in Finance, HR& IT
Mr. Vinay Kumar Bajaj,VP - Sales
Graduate having over 30years of experience in Sales& Marketing
Mr. Sushil Batra,Chief Financial Officer
FCA having over 30 years ofexperience in Finance,Taxation and StrategicPlanning
Mr. Nitin Dua,Executive VP - Retail
MBA having over 17 years of experience in Retail Business.
Mr. HR Sapra,Senior VP - Materials
BE having over 48 years ofexperience in Materials &Procurement
Mr. Ashish Srivastava ,VP – Human Resources
MBA having over 23 yearsof experience in HR,Industrial Relations &Administration.
Mr. Rahul Dua,Assistant Executive VP -Manufacturing
Graduate having over 11years of experience inManufacturing
Classification: Internal
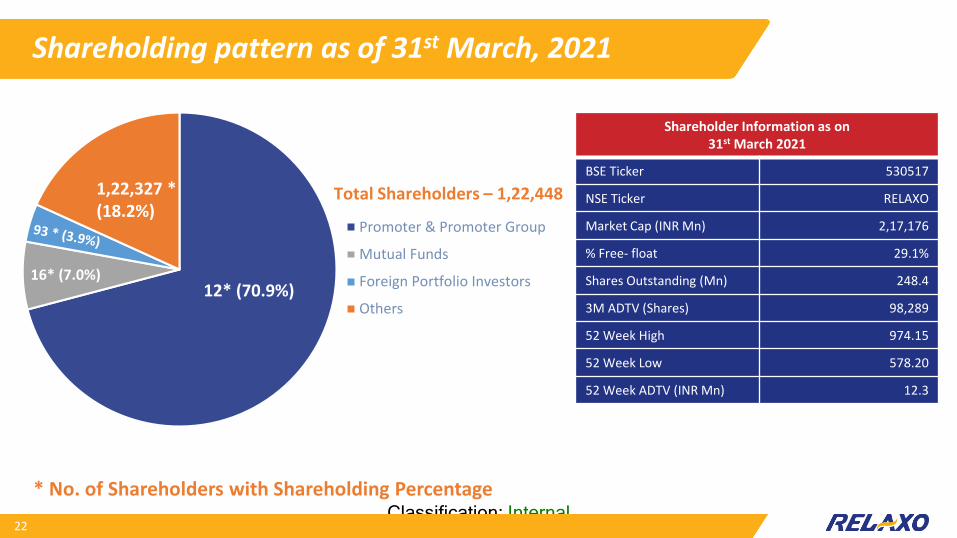
Shareholding pattern as of 31st March, 2021
Promoter & Promoter Group
Mutual Funds
Foreign Portfolio Investors
Others
1,22,327 * (18.2%)
12* (70.9%)16* (7.0%)
Total Shareholders – 1,22,448
22
* No. of Shareholders with Shareholding Percentage
Shareholder Information as on 31st March 2021
BSE Ticker 530517
NSE Ticker RELAXO
Market Cap (INR Mn) 2,17,176
% Free- float 29.1%
Shares Outstanding (Mn) 248.4
3M ADTV (Shares) 98,289
52 Week High 974.15
52 Week Low 578.20
52 Week ADTV (INR Mn) 12.3

Classification: Internal
Awards and Accolades
23
Classification: Internal
Thank You
24