Embed Size (px)
Citation preview
Public Accounts and Estimates Committee: 2012-13 Financial and Performance Outcomes General Questionnaire
1
PUBLIC ACCOUNTS AND ESTIMATES COMMITTEE
2012-13 FINANCIAL AND PERFORMANCE OUTCOMES GENERAL QUESTIONNAIRE
DEPARTMENT OF EDUCATION AND EARLY CHILDHOOD DEVELOPMENT
EMAIL RCVD PAEC 12/11/2013

Public Accounts and Estimates Committee: 2012-13 Financial and Performance Outcomes General Questionnaire
2
SECTION A: Output variations and performance measures
Question 1
Please provide copies of all of your department’s/agency’s annual plans, business plans, strategic plans, corporate plans or similar relating to 2012-13 (these
are requested in accordance with Section 28(1) of the Parliamentary Committees Act 2003) unless they are online. If they are online, please specify the
document name and web address:
Document Web address:
2012-13 Annual Reports, including:
Department of Education and Early Childhood Development
Adult, Community and Further Education Board
Victorian Registration and Qualifications Authority
http://www.education.vic.gov.au/about/department/Pages/annual20122013.aspx
DEECD 2013-17 Strategic Plan (note: Not officially published until August 2013). http://www.education.vic.gov.au/about/department/Pages/stratplan.aspx
Question 2
Regarding the use of the performance measures in the budget papers relating to your department/agency:
(a) How did the 2012-13 results influence planning for 2013-14?
The Department‟s long-term strategic directions are focused on meeting four key Outcomes – Achievement, Engagement, Wellbeing and Productivity. The Department monitors progress against these Outcomes using a range of tools, including performance measures in the 2012-13 Budget Papers. The Department‟s strategy is refreshed annually to direct effort to those areas where improved performance is required.
(b) Please detail all changes planned for 2013-14 as a consequence of actual results for any performance measures not meeting the targets in
2012-13.
The Department undertakes detailed assessments of all performance measures, including where actual results did not meet their respective targets. The Department will review and assess the suitability of all of the current performance measures for inclusion into next year‟s budget papers.
EMAIL RCVD PAEC 12/11/2013
Public Accounts and Estimates Committee: 2012-13 Financial and Performance Outcomes General Questionnaire
3
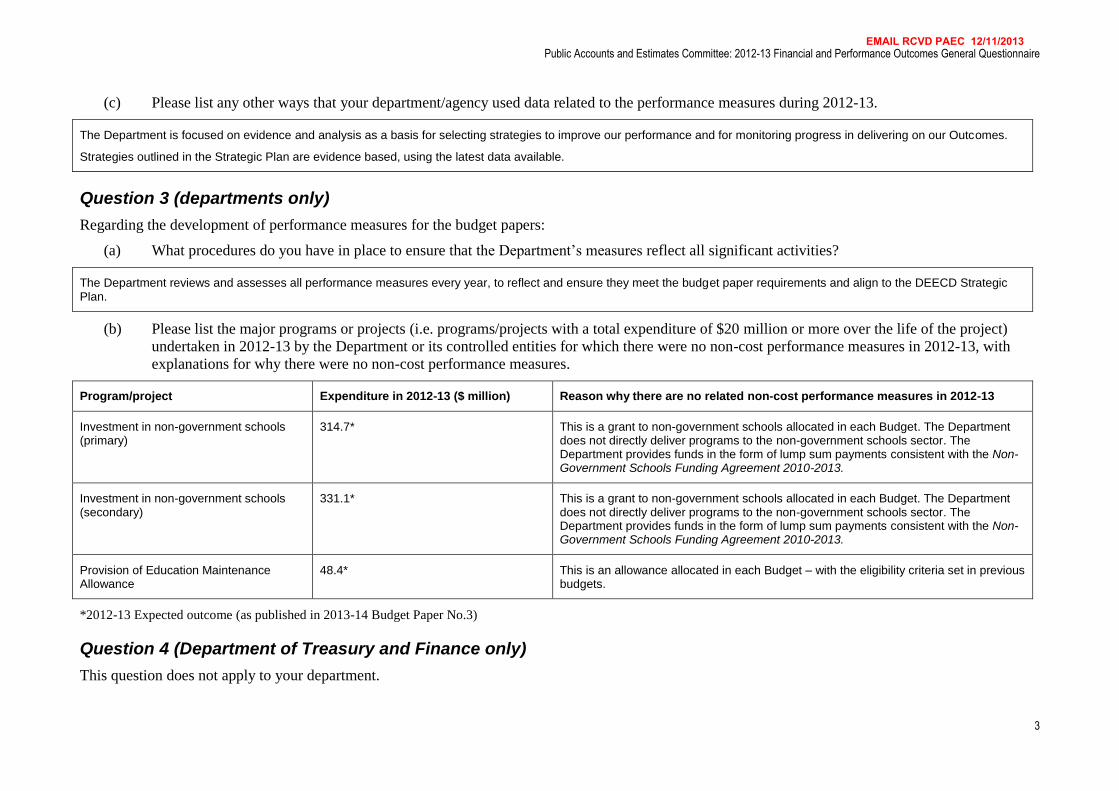
(c) Please list any other ways that your department/agency used data related to the performance measures during 2012-13.
The Department is focused on evidence and analysis as a basis for selecting strategies to improve our performance and for monitoring progress in delivering on our Outcomes.
Strategies outlined in the Strategic Plan are evidence based, using the latest data available.
Question 3 (departments only)
Regarding the development of performance measures for the budget papers:
(a) What procedures do you have in place to ensure that the Department’s measures reflect all significant activities?
The Department reviews and assesses all performance measures every year, to reflect and ensure they meet the budget paper requirements and align to the DEECD Strategic Plan.
(b) Please list the major programs or projects (i.e. programs/projects with a total expenditure of $20 million or more over the life of the project)
undertaken in 2012-13 by the Department or its controlled entities for which there were no non-cost performance measures in 2012-13, with
explanations for why there were no non-cost performance measures.
Program/project Expenditure in 2012-13 ($ million) Reason why there are no related non-cost performance measures in 2012-13
Investment in non-government schools (primary)
314.7* This is a grant to non-government schools allocated in each Budget. The Department does not directly deliver programs to the non-government schools sector. The Department provides funds in the form of lump sum payments consistent with the Non-Government Schools Funding Agreement 2010-2013.
Investment in non-government schools (secondary)
331.1* This is a grant to non-government schools allocated in each Budget. The Department does not directly deliver programs to the non-government schools sector. The Department provides funds in the form of lump sum payments consistent with the Non-Government Schools Funding Agreement 2010-2013.
Provision of Education Maintenance Allowance
48.4* This is an allowance allocated in each Budget – with the eligibility criteria set in previous budgets.
*2012-13 Expected outcome (as published in 2013-14 Budget Paper No.3)
Question 4 (Department of Treasury and Finance only)
This question does not apply to your department.
EMAIL RCVD PAEC 12/11/2013

Public Accounts and Estimates Committee: 2012-13 Financial and Performance Outcomes General Questionnaire
4
SECTION B: Asset investment (departments only)
Question 5
For each of the following asset investment projects, please provide:
(a) the total expenditure to 30 June 2013 (using actual figures, rather than the estimate in the budget papers);
(b) the actual expenditure in 2012-13;
(c) explanations for any variations greater than ±10 per cent or $100 million between the actual expenditure and what was estimated in the budget
papers at the start of the year;
(d) the financial completion date (see definition in the explanatory memorandum) as estimated at 30 June 2012;
(e) the financial completion date as estimated at 30 June 2013; and
(f) an explanation for any changes to the estimated financial completion date between 2012 and 2013.
Project Actual expenditure to 30/06/2013
Estimated expenditure in 2012-13 (2012-13 budget papers)
Actual expenditure in 2012-13
Explanation for any variations greater than ±10 per cent or $100 million between estimated and actual expenditure
Estimated financial completion date as at 30/6/2012
Estimated financial completion date as at 30/6/2013
Explanation for any changes to the estimated financial completion date
($ million) ($ million) ($ million)
Ashwood Secondary College – Modernisation – Construction of administration, new learning areas and gymnasium (Ashwood)
3.642 2.391 3.336
Higher actual expenditure due to construction of Performing Arts and Gym buildings ahead of the original forecasted timeframe
Jul-14 Jul-14 n/a
Bairnsdale Secondary College – Modernisation – Construction of administration and new learning areas (Bairnsdale)
1.265 2.729 1.064
Lower actual expenditure due to delay in finalising tender documents, tendering and contract award of the project
Jul-14 Jul-14 n/a
EMAIL RCVD PAEC 12/11/2013

Public Accounts and Estimates Committee: 2012-13 Financial and Performance Outcomes General Questionnaire
5
Project Actual expenditure to 30/06/2013
Estimated expenditure in 2012-13 (2012-13 budget papers)
Actual expenditure in 2012-13
Explanation for any variations greater than ±10 per cent or $100 million between estimated and actual expenditure
Estimated financial completion date as at 30/6/2012
Estimated financial completion date as at 30/6/2013
Explanation for any changes to the estimated financial completion date
($ million) ($ million) ($ million)
Bendigo Education Plan – Regeneration – Weeroona College –Stage 2 (Bendigo)
13.614 0.843 0.963
Higher actual expenditure due to the project being completed in phases, which increased costs
Oct-12 Dec-12 Project was completed in phases, which delayed construction
Boronia K–12 College – Regeneration – Construction of new classrooms, specialist teaching spaces, administration and amenities. Refurbishment of primary classrooms and library – Stage 2 (Boronia)
3.997 2.729 3.823
Higher actual expenditure due to construction period being accelerated by two months
Jul-12 Jul-12 n/a
Box Hill Institute of TAFE – Integrated and Technical Centre – Elgar Road Campus – Commonwealth supported project (Box Hill)
22.734 12.862 18.669
Commonwealth funded Education Investment Fund project. Construction on site has progressed ahead of the master program resulting in higher actual expenditure
Sep-13 Sep-13 n/a
Chisholm Institute of TAFE – New facility – Berwick Trade Careers Centre (Berwick)
6.096 8.5 1.980
Lower actual expenditure due to the builder being appointed later than originally anticipated
Nov-14 Nov-14 n/a
Colac Secondary College – Regeneration – Colac Regeneration Project including major redevelopment of facilities – Stage 3 (Colac)
9.810 8.245 7.054
Construction was delayed due to completion of Stage 2 resulting in lower actual expenditure
Mar-13 Jul-13 Delay was due to completion of Stage 2.
EMAIL RCVD PAEC 12/11/2013

Public Accounts and Estimates Committee: 2012-13 Financial and Performance Outcomes General Questionnaire
6
Project Actual expenditure to 30/06/2013
Estimated expenditure in 2012-13 (2012-13 budget papers)
Actual expenditure in 2012-13
Explanation for any variations greater than ±10 per cent or $100 million between estimated and actual expenditure
Estimated financial completion date as at 30/6/2012
Estimated financial completion date as at 30/6/2013
Explanation for any changes to the estimated financial completion date
($ million) ($ million) ($ million)
Dandenong High School – Regeneration – Major redevelopment and provision of new school facilities – Stage 3 (Dandenong)
3.852 9.438 3.649
Construction was delayed due to re-scoping of the project to be within the approved budget allocation resulting in the lower actual expenditure
Oct-13 May-14 Delay is due to re-scoping of the project.
Doreen South Primary School – New school – Construct new primary school including classrooms, music, art, gymnasium, administration and amenities (Doreen)
2.761 0.595 2.759
Higher actual expenditure due to project construction commencing ahead of the forecast, in accordance with the commitment to open the school for 2014
Feb-14 Feb-14 n/a
Galvin Park Secondary College – Modernisation – Refurbishment and enhancement of school facilities (Werribee)
3.244 0.832 3.242
Higher actual expenditure due to early commencement of works compared to the original forecast
Jun-14 Jun-14 n/a
Glenroy Specialist School – Replacement schools – Replacement school (Glenroy)
13.815 1.248 3.172
Higher actual expenditure in 2012-13 due to initial delays in 2011-12 relating to site access issues
Nov-12 Nov-12 n/a
Healesville High School – Modernisation – New classrooms, administration, library and specialist facilities (Healesville)
11.490 0.44 1.787
Higher actual expenditure in 2012-13 due to initial delays in 2011-12 relating to contractor issues
Oct-12 Mar-13 Delay was due to contractor issues.
EMAIL RCVD PAEC 12/11/2013
Public Accounts and Estimates Committee: 2012-13 Financial and Performance Outcomes General Questionnaire
7
Project Actual expenditure to 30/06/2013
Estimated expenditure in 2012-13 (2012-13 budget papers)
Actual expenditure in 2012-13
Explanation for any variations greater than ±10 per cent or $100 million between estimated and actual expenditure
Estimated financial completion date as at 30/6/2012
Estimated financial completion date as at 30/6/2013
Explanation for any changes to the estimated financial completion date
($ million) ($ million) ($ million)
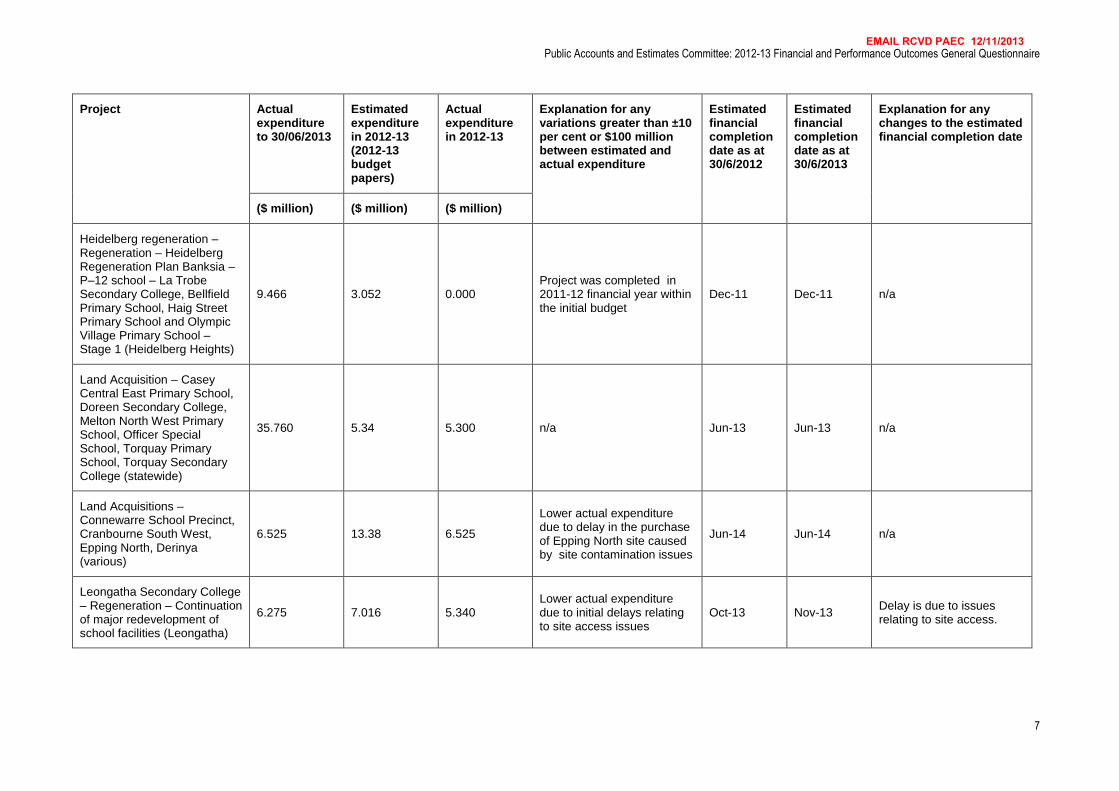
Heidelberg regeneration – Regeneration – Heidelberg Regeneration Plan Banksia – P–12 school – La Trobe Secondary College, Bellfield Primary School, Haig Street Primary School and Olympic Village Primary School – Stage 1 (Heidelberg Heights)
9.466 3.052 0.000 Project was completed in 2011-12 financial year within the initial budget
Dec-11 Dec-11 n/a
Land Acquisition – Casey Central East Primary School, Doreen Secondary College, Melton North West Primary School, Officer Special School, Torquay Primary School, Torquay Secondary College (statewide)
35.760 5.34 5.300 n/a Jun-13 Jun-13 n/a
Land Acquisitions – Connewarre School Precinct, Cranbourne South West, Epping North, Derinya (various)
6.525 13.38 6.525
Lower actual expenditure due to delay in the purchase of Epping North site caused by site contamination issues
Jun-14 Jun-14 n/a
Leongatha Secondary College – Regeneration – Continuation of major redevelopment of school facilities (Leongatha)
6.275 7.016 5.340 Lower actual expenditure due to initial delays relating to site access issues
Oct-13 Nov-13 Delay is due to issues relating to site access.
EMAIL RCVD PAEC 12/11/2013

Public Accounts and Estimates Committee: 2012-13 Financial and Performance Outcomes General Questionnaire
8
Project Actual expenditure to 30/06/2013
Estimated expenditure in 2012-13 (2012-13 budget papers)
Actual expenditure in 2012-13
Explanation for any variations greater than ±10 per cent or $100 million between estimated and actual expenditure
Estimated financial completion date as at 30/6/2012
Estimated financial completion date as at 30/6/2013
Explanation for any changes to the estimated financial completion date
($ million) ($ million) ($ million)
Noble Park Special Developmental School – Modernisation – Relocation of school (Noble Park)
11.343 2.586 2.596 n/a Dec-12 Feb-13 Delay is due to issues regarding site conditions
Northern Melbourne Institute of TAFE – Campus redevelopment – Teaching and Learning Centre (Preston)
17.001 12.0 10.173
Initial works and expenditure in 2011-12 progressed ahead of schedule resulting in lower actual expenditure in 2012-13. The state funding is capped at $17million with the Institute contributing $7million
Aug-13 Jun-13 Construction progressed ahead of schedule.
Officer Special School – New School – New special school construction (Officer)
7.976 13.009 7.121
Lower actual expenditure due to initial delays in construction relating to site conditions
Dec-13 Dec-13 n/a
Phoenix P–12 Community College – Modernisation – Construction of three learning precincts and specialist teaching facilities (Sebastopol)
2.541 3.979 2.165
Lower actual expenditure due to delay in design development as a result of re-scoping of project to be within funding levels
Mar-14 Mar-14 n/a
Point Cook South-East P–9 – New School – Construction of new P–9 school – Stage 1 (Point Cook)
7.153 9.405 6.353 Lower actual expenditure due to initial delays caused by extended project planning
Oct-13 Oct-13 n/a
EMAIL RCVD PAEC 12/11/2013

Public Accounts and Estimates Committee: 2012-13 Financial and Performance Outcomes General Questionnaire
9
Project Actual expenditure to 30/06/2013
Estimated expenditure in 2012-13 (2012-13 budget papers)
Actual expenditure in 2012-13
Explanation for any variations greater than ±10 per cent or $100 million between estimated and actual expenditure
Estimated financial completion date as at 30/6/2012
Estimated financial completion date as at 30/6/2013
Explanation for any changes to the estimated financial completion date
($ million) ($ million) ($ million)
School Improvement Fund – Refurbishment and minor capital works (statewide)
0.000 20.000 0.000
These funds were allocated to projects identified by the Condition Assessment Audit as part of the $51.5m commitment to address the most critical needs at schools. The implementation of the projects to undergo capital works has been deferred to 2013-14, resulting in no expenditure in 2012-13
Jun-14 Jun-14 n/a
TAFE Student Management System (statewide)
93.750 0.1 24.714
Additional system changes were necessary to ensure compliance with sector functionality requirements, including developing capacity to respond to changes in Commonwealth reporting requirements.
Feb-14 Feb-14 n/a
Tarneit Central P–9 – New School – Construction of new P–9 school – Stage 1 (Tarneit)
10.069 9.406 7.742
Initial works and expenditure in 2011-12 progressed ahead of schedule resulting in lower actual expenditure in 2012-13
Mar-13 Mar-13 n/a
Technical Education Centres (statewide)
27.642 7.855 1.167
Project is being completed at a lower cost than originally budgeted due to favourable tender negotiations
Sep-13 Sep-13 n/a
EMAIL RCVD PAEC 12/11/2013

Public Accounts and Estimates Committee: 2012-13 Financial and Performance Outcomes General Questionnaire
10
Project Actual expenditure to 30/06/2013
Estimated expenditure in 2012-13 (2012-13 budget papers)
Actual expenditure in 2012-13
Explanation for any variations greater than ±10 per cent or $100 million between estimated and actual expenditure
Estimated financial completion date as at 30/6/2012
Estimated financial completion date as at 30/6/2013
Explanation for any changes to the estimated financial completion date
($ million) ($ million) ($ million)
Torquay Secondary College – New School – New full size secondary college construction (Torquay)
12.471 24.466 10.930 Lower actual expenditure due to initial delays in site acquisition
Oct-13 Mar-14 Delay is due to initial site acquisition issues
Trade Training Centres – Government Schools (statewide) (Commonwealth funding)
167.757 105.253 36.326
Lower actual expenditure due to delays in formal agreements with DEEWR, closure of Victoria University Melton campus and impact on Western Edge Cluster TTC project
Dec-13 Dec-14 Delays impacting on cash flow have also impacted on completion timeframe
University of Ballarat TAFE – Manufacturing Technology Training Centre (Ballarat)
12.767 17.381 8.307
This is a Commonwealth funded Education Investment Fund project. Lower actual expenditure is caused by initial delays due to site contamination and town planning
Sep-13 Sep-13 n/a
Victoria University Technical Trade centres – Sunshine Campus – Commonwealth supported project (Sunshine)
40.286 20.096 11.921
This is a Commonwealth funded Education Investment Fund project. Initial works and expenditure in 2011-12 progressed ahead of schedule resulting in lower actual expenditure in 2012-13
Jun-13 NA
Construction of Sunshine Technical Trade centre is finalised. However, the project has not reached financial completion due to ongoing negotiations regarding an existing lease at a Childcare Centre on the site.
EMAIL RCVD PAEC 12/11/2013

Public Accounts and Estimates Committee: 2012-13 Financial and Performance Outcomes General Questionnaire
11
Project Actual expenditure to 30/06/2013
Estimated expenditure in 2012-13 (2012-13 budget papers)
Actual expenditure in 2012-13
Explanation for any variations greater than ±10 per cent or $100 million between estimated and actual expenditure
Estimated financial completion date as at 30/6/2012
Estimated financial completion date as at 30/6/2013
Explanation for any changes to the estimated financial completion date
($ million) ($ million) ($ million)
Wangaratta regeneration – Regeneration – Wangaratta High School – Stage 2 (Wangaratta)
7.936 2.954 0.000 Project was completed in February 2011 under budget
Feb-11 Feb-11 n/a
Western Heights regeneration – Regeneration – Western Heights Secondary College – Stage 2 (Hamlyn Heights)
1.165 9.143 0.388
Lower actual expenditure due to initial delays associated with the overland flooding to facilities
Nov-13 Jun-14
Delay is due to initial issues associated with overland flooding to facilities
Wodonga Institute of TAFE – National Logistics and Driver Skills Training Centre (Wodonga)
15.180 1.032 0.505
Initial works and expenditure in 2011-12 progressed ahead of schedule resulting in lower actual expenditure in 2012-13
Aug-12 May-14
The project has been completed and is occupied. Finalisation to works that are unrelated but still requiring this funding will continue through 2013/2014.i.e. project is not financially complete
Wodonga Senior Secondary College – Regeneration – Construction of new administration and learning areas (Wodonga)
1.136 3.006 1.136
Lower actual expenditure is due to delay in finalisation of tender documentation and further delays in tendering process
Mar-14 Mar-14 n/a
EMAIL RCVD PAEC 12/11/2013

Public Accounts and Estimates Committee: 2012-13 Financial and Performance Outcomes General Questionnaire
12
Question 6
Please provide the following details for each of the asset projects listed below which were expected to be completed in 2012-13:
(a) total actual investment;
(b) an explanation for any case where the total actual investment varied from the TEI in the 2012-13 budget papers by more than ±10 per cent or
$100 million;
(c) the impact of any variations;
(d) the financial completion date (see definition in the explanatory memorandum) estimated at 30 June 2012;
(e) the actual financial completion date; and
(f) an explanation for any variances between the financial completion date estimated at 30 June 2012 and the actual financial completion date.
Project TEI in the 2012-13 budget papers
Total actual investment
Explanation for any variations greater than ±10 per cent or $100 million
Impact of any variations
Estimated financial completion date as at 30/6/2012
Actual financial completion date
Explanation for any variation in completion date
($ million) ($ million)
Victoria University Technical Trade centres - Sunshine campus - Commonwealth supported project (Sunshine)
44.2
Associated works are not completed and total final actual expenditure is not known at this time.
n/a No impact Jun-13 n/a
The Technical Trade Centre Building is completed. However, the project has not reached financial completion due to ongoing negotiations regarding an existing lease at a Childcare Centre on the site.
EMAIL RCVD PAEC 12/11/2013

Public Accounts and Estimates Committee: 2012-13 Financial and Performance Outcomes General Questionnaire
13
Project TEI in the 2012-13 budget papers
Total actual investment
Explanation for any variations greater than ±10 per cent or $100 million
Impact of any variations
Estimated financial completion date as at 30/6/2012
Actual financial completion date
Explanation for any variation in completion date
($ million) ($ million)
Land Acquisition - Casey Central East Primary School, Doreen Secondary College, Melton North West Primary School, Officer Special School, Torquay Primary School, Torquay Secondary College (statewide)
35.8 35.8 n/a No impact Jun-13 Jun-13 n/a
Wodonga Institute of TAFE - National Logistics and Driver Skills Training Centre (Wodonga)
16.0
Associated works are not completed and total final actual expenditure is not known at this time.
n/a No impact Aug-12 n/a
The centre is occupied, but not reached financial completion. Finalisation works that are unrelated but still requiring this funding will continue through 2013/2014
Glenroy Specialist School - replacement schools - replacement school (Glenroy)
13.6 13.8 n/a No impact Nov-12 Nov-12 n/a
Bendigo Education Plan - regeneration - Weeroona College -Stage 2 (Bendigo)
13.5 13.6 n/a No impact Oct-12 Dec-12 Project was completed in phases, which delayed construction
EMAIL RCVD PAEC 12/11/2013

Public Accounts and Estimates Committee: 2012-13 Financial and Performance Outcomes General Questionnaire
14
Project TEI in the 2012-13 budget papers
Total actual investment
Explanation for any variations greater than ±10 per cent or $100 million
Impact of any variations
Estimated financial completion date as at 30/6/2012
Actual financial completion date
Explanation for any variation in completion date
($ million) ($ million)
Noble Park Special Developmental School - modernisation - relocation of school (Noble Park)
11.34 11.34 n/a No impact Dec-12 Feb-13 Delay was due to issues regarding site conditions
Heidelberg - regeneration - Heidelberg Regeneration Plan Banksia - P-12 school - La Trobe Secondary College, Bellfield Primary School, Haig Street Primary School and Olympic Village Primary School - stage 1 (Heidelberg Heights)
10.89 9.47 Project received subsequent further funding and also had access to other funding sources
No impact Dec-11 Dec-11 n/a
Wangaratta regeneration - regeneration - Wangaratta High School - Stage 2 (Wangaratta)
10.8 7.94 Project had access to other funding sources and also had a favourable tender process
No impact Feb-11 Feb-11 n/a
Healesville High School - modernisation - new classrooms, administration, library and specialist facilities (Healesville)
10.7 11.5 n/a No impact Oct-12 Mar-13 Delay was due to contractor issues
EMAIL RCVD PAEC 12/11/2013

Public Accounts and Estimates Committee: 2012-13 Financial and Performance Outcomes General Questionnaire
15
Project TEI in the 2012-13 budget papers
Total actual investment
Explanation for any variations greater than ±10 per cent or $100 million
Impact of any variations
Estimated financial completion date as at 30/6/2012
Actual financial completion date
Explanation for any variation in completion date
($ million) ($ million)
Colac Secondary College - regeneration - Colac Regeneration Project Including Major Redevelopment Of Facilities - stage 3 (Colac)
10.16 9.8 n/a No impact Mar-13 Jul-13 Delay was due to completion of Stage 2
Tarneit Central P-9 - new school - construction of new P-9 school - stage 1 (Tarneit)
10 10.1 n/a No impact Mar-13 Mar-13 n/a
Question 7
For each of your entity’s public private partnership projects in 2012-13, please detail the entity’s expenditure in 2012-13 in the following categories:
(a) the amount paid that was classified as ‘finance charges on finance leases’ and a description of what that money was for;
(b) the amount paid as principal payments and a description of what that money was for; and
(c) any other expenses and a description of what that money was for.
Project Finance charges on finance leases in 2012-13
Principal payments in 2012-13 Any other expenses in 2012-13
($ million) What that money covered ($ million) What that money covered ($ million) What that money covered
The Partnerships in Victoria in Schools Project
17.4 Principal
Interest
Contingent Rental
3.6 Principal Payment 6.4
0.6
Service Payments
Modification costs including Relocatable Buildings.
EMAIL RCVD PAEC 12/11/2013

Public Accounts and Estimates Committee: 2012-13 Financial and Performance Outcomes General Questionnaire
16
Question 8
Please list each project funded by the Department (including controlled entities)1 for which the funding is included in the ‘net cash flows from investments
in financial assets for policy purposes’ in the general government sector cash flow statement (using the same project names as are used in Budget Paper
No.4 for 2012-13), detailing for each:
(a) the estimated expenditure in 2012-13; and
(b) the actual expenditure in 2012-13.
Project Estimated expenditure in 2012-13 ($ million)
Actual expenditure in 2012-13 ($ million)
Repayment of Section 37 Temporary Public Account advance to Kangan Institute of TAFE
0.0 11.6
Question 9
This question does not apply to your department.
Question 10 (Department of Treasury and Finance only)
This question does not apply to your department.
Question 11 (Department of Treasury and Finance only)
This question does not apply to your department.
1 i.e. please provide this information on the same basis of consolidation as the budget papers
EMAIL RCVD PAEC 12/11/2013

Public Accounts and Estimates Committee: 2012-13 Financial and Performance Outcomes General Questionnaire
17
SECTION B: Asset investment (non-departments only)
Question 12
Please provide the following details for any asset investment project where actual expenditure in 2012-13 varied by $±10 million or more from the budget
estimate:
(a) the total expenditure to 30 June 2013 (using actual figures, rather than the estimate in the budget papers);
(b) the estimated expenditure in 2012-13 according to the 2012-13 budget papers;
(c) the actual expenditure in 2012-13;
(d) explanations for any variations greater than ±10 per cent or $100 million between the actual expenditure and what was estimated in the budget
papers at the start of the year;
(e) the financial completion date (see definition in the explanatory memorandum) as estimated at 30 June 2012;
(f) the financial completion date as estimated at 30 June 2013; and
(g) an explanation for any changes to the estimated financial completion date between 2012 and 2013.
If there were no asset investment projects for your agency where the actual expenditure varied by $±10 million or more from the budget estimate, you do
not need to answer this question.
Project Actual expenditure to 30/06/2013
Estimated expenditure in 2012-13 (2012-13 budget papers)
Actual expenditure in 2012-13
Explanation for variation Estimated financial completion date as at 30/6/2012
Estimated financial completion date as at 30/6/2013
Explanation for any changes to the estimated financial completion date
($ million) ($ million) ($ million)
EMAIL RCVD PAEC 12/11/2013

Public Accounts and Estimates Committee: 2012-13 Financial and Performance Outcomes General Questionnaire
18
Question 13
Please detail the original budget estimate for ‘purchases of non-financial assets’ for 2012-13 (or an equivalent line item in the cash flow statement) for your
entity, the actual amount of that line item in your annual report and an explanation for any variation greater than ±10 per cent or $100 million.
Original budget estimate for 2012-13
Actual for 2012-13 Explanation for any variation greater than ±10 per cent or $100 million
($ million) ($ million)
EMAIL RCVD PAEC 12/11/2013

Public Accounts and Estimates Committee: 2012-13 Financial and Performance Outcomes General Questionnaire
19
SECTION C: Revenue and revenue foregone
Question 14
Please explain and detail the impact of any variances greater than ±10 per cent or $100 million between the prior year’s actual result and the actual result for
2012-13 for each revenue/income category detailed in your operating statement.
For departments, please provide data consolidated on the same basis as the budget portfolios outcomes statement in your annual reports.
If there were no revenue/income categories for your department/agency for which the 2012-13 expenditure varied from the 2011-12 expenditure by more
than ±10 per cent or $100 million, you do not need to answer this question.
Revenue category
2011-12 actual
2012-13 actual
Explanations for variances greater than ±10 per cent or $100 million
Impact of variances
($ million) ($ million)
Output appropriations
10,185.9 10,375.8 The variance is a result of increased funding for output initiatives. However, the application of savings to back-office functions has contributed to this increase being less than indexation.
No impact on service delivery.
Special appropriations
31.0 6.5 The net decrease of $24.5 million (79%) mainly reflects funding of $28.1 million provided in 2011-12 by the Commonwealth for the Digital Education Revolution program. This is offset by $3.2 million funding received in 2012-13 from the Commonwealth for the National Partnership Joint Group Training Program.
No impact on service delivery.
Interest 61.2 45.6 The decrease of $15.6 million (25%) is mainly due to a reduction of term deposits held by the former Victorian Skills Commission with TCV, and reduced interest earned from Schools bank accounts due to reducing interest rates.
No impact on service delivery.
Sale of goods and services
707.4 737.4 n/a n/a
Grants 94.7 125.5 The increase of $30.8 million (33%) is mainly related to grants to TAFE provided directly from the Commonwealth.
No impact on service delivery.
EMAIL RCVD PAEC 12/11/2013

Public Accounts and Estimates Committee: 2012-13 Financial and Performance Outcomes General Questionnaire
20
Other income 503.6 551.1 n/a n/a
Total income from transactions
11,583.8 11,841.9 See explanation above
Question 15
Please explain and detail the impact of any variances greater than ±10 per cent or $100 million between the initial budget estimate (not the revised estimate)
and the actual result for 2012-13 for each revenue/income category detailed in your operating statement.
For departments, please provide data consolidated on the same basis as the budget portfolios outcomes statement in your annual reports.
If there were no revenue/income categories for your department/agency for which the 2012-13 expenditure varied from the initial budget estimate by more
than ±10 per cent or $100 million, you do not need to answer this question.
Revenue category
2012-13 budget estimate
2012-13 actual
Explanations for variances greater than ±10 per cent or $100 million
Impact of variances
($ million) ($ million)
Grants 80.9 125.5 This variance is primarily driven by a misclassification by the Kangan Institute of TAFE between Commonwealth and State Government operating grants (approximately $35 million), which was reported in its audited financial statements.
The Department is monitoring this issue with Kangan and is working with the Institute to ensure that it appropriately allocates revenue between State and Commonwealth.
No impact on service delivery
Special appropriations
0.3 6.5 The National Partnership payment for the Investing in Focus Schools Projects, Joint Group Training Program and Industry and Indigenous Skills Centre Program was provided in late 2011-12, post the 2012-13 State Budget. In 2012-13, the Department accessed the fund via the special appropriation authority under the Financial Management Act 1994.
No impact on service delivery
EMAIL RCVD PAEC 12/11/2013

Public Accounts and Estimates Committee: 2012-13 Financial and Performance Outcomes General Questionnaire
21
Question 16
Please provide an itemised schedule of any concessions and subsidies (revenue foregone) (see the Explanatory Memorandum for a definition of concessions
and subsidies) provided by your organisation in 2012-13. For each item, please:
(a) describe the purpose of the concession/subsidy;
(b) explain any variations greater than ±10 per cent or $100 million between the actual expenditure and the initial budget estimate for the year;
(c) indicate the number of concessions/subsidies granted in each category; and
(d) explain whether the outcomes in the community2 expected to be achieved by granting these concessions or providing these subsidies have been
achieved.
Concession/ subsidy
Purpose 2012-13 budget estimate
2012-13 actual
Explanations for variances greater than ±10 per cent or $100 million
Number of concessions/subsidies granted in 2012-13
Outcomes achieved
($ million) ($ million)
Education Maintenance Allowance
To assist eligible low income families with the cost of their children‟s education.
48.8 45.8
n/a 201,900 Yes
Kindergarten Fee Subsidy
To make kindergarten services more affordable and accessible for eligible low income families.
16.2 19.2 While actual enrolments were less than expected, the increase is due to a rate increase for increased enrolment hours from January 2013. These were not factored into the published budget as the rate change occurred after the budget was published.
17,814 Yes
2 ‘outcomes’ are the impact of service delivery on the community rather than a description of the services delivered
EMAIL RCVD PAEC 12/11/2013
Public Accounts and Estimates Committee: 2012-13 Financial and Performance Outcomes General Questionnaire
22
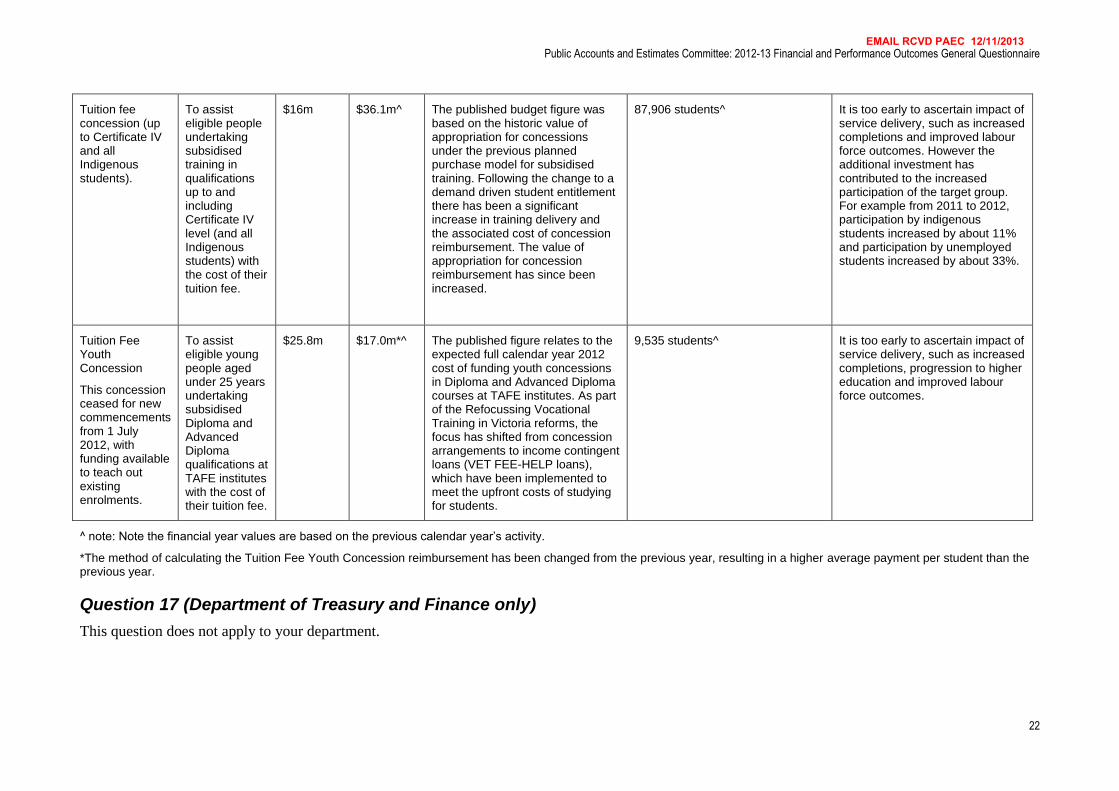
Tuition fee concession (up to Certificate IV and all Indigenous students).
To assist eligible people undertaking subsidised training in qualifications up to and including Certificate IV level (and all Indigenous students) with the cost of their tuition fee.
$16m $36.1m^ The published budget figure was based on the historic value of appropriation for concessions under the previous planned purchase model for subsidised training. Following the change to a demand driven student entitlement there has been a significant increase in training delivery and the associated cost of concession reimbursement. The value of appropriation for concession reimbursement has since been increased.
87,906 students^ It is too early to ascertain impact of service delivery, such as increased completions and improved labour force outcomes. However the additional investment has contributed to the increased participation of the target group. For example from 2011 to 2012, participation by indigenous students increased by about 11% and participation by unemployed students increased by about 33%.
Tuition Fee Youth Concession
This concession ceased for new commencements from 1 July 2012, with funding available to teach out existing enrolments.
To assist eligible young people aged under 25 years undertaking subsidised Diploma and Advanced Diploma qualifications at TAFE institutes with the cost of their tuition fee.
$25.8m $17.0m*^
The published figure relates to the expected full calendar year 2012 cost of funding youth concessions in Diploma and Advanced Diploma courses at TAFE institutes. As part of the Refocussing Vocational Training in Victoria reforms, the focus has shifted from concession arrangements to income contingent loans (VET FEE-HELP loans), which have been implemented to meet the upfront costs of studying for students.
9,535 students^ It is too early to ascertain impact of service delivery, such as increased completions, progression to higher education and improved labour force outcomes.
^ note: Note the financial year values are based on the previous calendar year‟s activity.
*The method of calculating the Tuition Fee Youth Concession reimbursement has been changed from the previous year, resulting in a higher average payment per student than the previous year.
Question 17 (Department of Treasury and Finance only)
This question does not apply to your department.
EMAIL RCVD PAEC 12/11/2013

Public Accounts and Estimates Committee: 2012-13 Financial and Performance Outcomes General Questionnaire
23
SECTION D: Expenditure
Question 18
Please explain and detail the impact of any variances greater than ±10 per cent or $100 million between the prior year’s actual result and the actual result for
2012-13 for each expenditure category detailed in your operating statement.
For departments, please provide data consolidated on the same basis as the budget portfolios outcomes statement in your annual reports.
If there were no expenditure categories for your department/agency for which the 2012-13 expenditure varied from the 2011-12 expenditure by more than
±10 per cent or $100 million, you do not need to answer this question.
Expenditure category
2011-12 actual
2012-13 actual
Explanations for variances greater than ±10 per cent or $100 million
Impact of variances
($ million) ($ million)
Employee benefits
6,009.9 6,207.7 The increase of $197.8 million (3%) reflects increased payroll expenditure due to wage inflation, industrial agreements and enrolment linked growth in employment levels.
No impact on service delivery.
Depreciation and amortisation
349.8 386.2 The increase of $36.4 million (10%) reflects the increase in the capitalisation of assets for programs like Building the Education Revolution (BER) and Victorian Schools Plan, resulting in increased depreciation charges.
No impact on service delivery.
Interest expense 16.0 16.6 n/a n/a
Grants and other transfers
792.9 867.0 n/a n/a
Capital asset charge
1,219.6 1,258.1 n/a n/a
Other operating expenses
3,204.1 3,047.5 The net reduction of $156.6 million (5%) mainly reflects:
decrease in maintenance expenditure by Schools due to newer BER buildings requiring less maintenance; and
decrease in supplies and consumables in TAFEs
No impact on service delivery.
EMAIL RCVD PAEC 12/11/2013

Public Accounts and Estimates Committee: 2012-13 Financial and Performance Outcomes General Questionnaire
24
and head office.
The above is partly offset by the increase in payments to private organisations with a majority related to demand driven activities delivered, and the increase in service payments for various Early Childhood Development programs.
Total expenses from transactions
11,592.3 11,783.2 The increase of $190.9 million (2%) is mainly due to the reasons given above.
EMAIL RCVD PAEC 12/11/2013

Public Accounts and Estimates Committee: 2012-13 Financial and Performance Outcomes General Questionnaire
25
Question 19
Please explain and detail the impact of any variances greater than ±10 per cent or $100 million between the initial budget estimate (not the revised budget)
and the actual result for 2012-13 for each expenditure category detailed in your operating statement.
For departments, please provide data consolidated on the same basis as the budget portfolios outcomes statement in your annual reports.
If there were no expenditure categories for your department/agency for which the 2012-13 expenditure varied from the initial budget estimate by more than
±10 per cent or $100 million, you do not need to answer this question.
Expenditure category
2012-13 budget estimate
2012-13 actual
Explanations for variances greater than ±10 per cent or $100 million
Impact of variances
($ million) ($ million)
Grants and other transfers
1,193.7 867.0 This variance primarily reflects the reclassification of grants paid to Registered Training Organisations (RTOs) from grants to services purchased from external suppliers.
No impact on service delivery
Other operating expenses
2,580.6 3,047.5 This variance is primarily driven by the reclassification of grants paid to RTOs from grants to services purchased from external suppliers and the additional demand driven funding for training delivery provided throughout the year.
No impact on service delivery
EMAIL RCVD PAEC 12/11/2013

Public Accounts and Estimates Committee: 2012-13 Financial and Performance Outcomes General Questionnaire
26
Question 20 (departments only)
Please provide the following details about the realisation of efficiency and savings targets in 2012-13. In providing savings targets, please provide the
cumulative target rather than the change in savings from one year to the next (i.e. provide the target on the same basis as in the budget papers). Please
provide figures for the Department including its controlled entities.3
Initiative Total value of efficiencies/savings expected to be realised in 2012-13 from that initiative
($ million)
Actual value of efficiencies/savings achieved from that initiative
($ million)
Explanation for any variations greater than ±10 per cent
How the efficiencies/savings have been achieved (i.e. what measures or changes have been introduced)
General efficiencies (2009-10 Budget)
63.7 63.7 n/a A range of strategies were implemented commencing in 2009-10 which delivered efficiencies. There has been no impact on service delivery as a result.
Government election commitment savings (2011-12 Budget)
69.7 69.7 n/a
A range of strategies were implemented commencing in 2011-12 which delivered efficiencies. Areas identified where further efficiencies will be achievable include procurement, research, professional development and energy costs. Non-critical support programs will continue to be reviewed and streamlined.
There has been no impact on service delivery as a result.
Measures to offset the GST reduction (2011-12 Budget)
46.6 46.6 n/a
Capping departmental expenditure growth (2011-12 Budget Update)
4.9 4.9 n/a
Maintain a sustainable public service (2011-12 Budget Update)
24.4 24.4 n/a These efficiencies have been achieved through critical management of attrition and the downsizing of non-front line staff.
3 i.e. please provide this information for the Department on the same basis of consolidation as is used in the budget papers
EMAIL RCVD PAEC 12/11/2013

Public Accounts and Estimates Committee: 2012-13 Financial and Performance Outcomes General Questionnaire
27
„Total savings‟ line item in 2012-13 Budget
19.1 19.1 n/a Savings have been achieved through better targeted concessions, with the ceasing of the School Start Bonus from 2013 and removing the school funding portion of the Education Maintenance Allowance.
A refocused Education Maintenance Allowance sees increased funding directed to eligible parents, while the most needy schools will also receive additional support through their Student Resource Package.
Efficiency measures (2012-13 Budget Update)
0 n/a n/a Savings commence in 2013-14 financial year
Other n/a n/a n/a n/a
Question 21
Please detail any changes to your department’s/agency’s service delivery as a result of savings initiatives released since the change of government, e.g.
changes to the timing and scope of specific programs or discontinued programs.
Savings requirements have been met by delivering efficiencies in corporate processes through reductions in back office and corporate expenditure.
In 2012-13, Government endorsed the ceasing of the School Start Bonus from 2013 and removing the school funding portion of the Education Maintenance Allowance. A refocused Education Maintenance Allowance sees increased funding directed to eligible parents, while the most needy schools will also receive additional support through their Student Resource Package.
EMAIL RCVD PAEC 12/11/2013

Public Accounts and Estimates Committee: 2012-13 Financial and Performance Outcomes General Questionnaire
28
Question 22
Please detail the initial budget estimate (not the revised estimate) for net debt for 2012-13 for your entity, the actual value of that line item and an
explanation for any variation greater than ±10 per cent or $100 million.
Original budget estimate for 2012-13
Actual for 2012-13 Explanation for any variation greater than ±10 per cent or $100 million
($ million) ($ million)
N/A N/A The Department does not have the authority to borrow in the money market to meet its financial obligations. The Department did not budget for nor incurred net debt in 2012-13.
Note: Net debt is a measure generally used within and across governments to assess the level of jurisdictional indebtedness and capacity to service such indebtedness. Given that government financing/borrowing arrangements in Victoria and other jurisdictions generally operate and are managed at a central/sectorial level, net debt is not a meaningful measure at an entity level.
In this context, the Committee's attention is drawn to the 2012-13 Annual Financial Report for the State of Victoria which outlines net debt at the General Government level and also provides commentary regarding variances from previous estimates, and the previous year.
Question 23 (Department of Treasury and Finance only)
This question does not apply to your department.
Question 24 (PNFC and PFC entities only)
Please detail the value of dividends paid by your agency to the general government sector during 2011-12 and 2012-13, explaining the reasons for any
significant change and the impact of changed dividends on the agency.
Total dividends paid in 2011-12
Total dividends paid in 2012-13
Explanation for any variation greater than ±10 per cent or $100 million
Impact of changes to dividends on the agency
($ million) ($ million)
EMAIL RCVD PAEC 12/11/2013

Public Accounts and Estimates Committee: 2012-13 Financial and Performance Outcomes General Questionnaire
29
SECTION E: Public sector workforce
Question 25
Please detail the total full-time equivalent number of staff in your department/agency as at 30 June 2012 and 30 June 2013 in each of the following bands of
levels, and explain the changes from one year to the next:
Level Total FTE (30 June 2012) Total FTE (30 June 2013) Explanation for changes
VPS Grades 1–3 534.4 345.0 Sustainable Government Initiative
VPS Grade 4 365.2 313.7 Sustainable Government Initiative
VPS Grades 5–6 and STS 1,061.5 879.7 Sustainable Government Initiative
EO 75.9 82.7 The increase in EO numbers from 2011 and 2012 levels was due to the delay in making substantive appointments pending appointment of the Deputy Secretaries and implementation of the new departmental structure. Throughout this period, several executive roles were filled on an acting basis (and were not included in previous reporting of executive numbers). This resulted in substantial number of executive roles being advertised and appointed in the period January-June 2013.
Other 54,471.3 55,070.8 N/A
Total of all staff (including non-VPS grades)
56,508.3 56,691.9 See explanations above
Note: Other includes Executive class, Principal class, Teacher class, Education Support class, Allied Health, Nurses, Ministerial Drivers, Senior Medical Advisors, LOTE Advisor and
VPS Casuals
Question 26
In the table below, please detail the salary costs for 2011-12 and 2012-13, broken down by ongoing, fixed-term and casual, and explain any variations
greater than ±10 per cent or $100 million between the years for each category.
Employment category Gross salary 2011-12 Gross salary 2012-13 Explanation for any variations greater than ±10 per cent or $100 million
($ million) ($ million)
EMAIL RCVD PAEC 12/11/2013

Public Accounts and Estimates Committee: 2012-13 Financial and Performance Outcomes General Questionnaire
30
Ongoing 3,756.0 3,893.7 Increase of $137.7 million (4%) is mainly due to wage inflation, industrial agreements and enrolment linked growth in employment levels.
Fixed-term 1,122.7 1,147.0 n/a
Casual 2.3 2.4 n/a
Total 4,881.0 5,043.1 n/a
Note: The total salary costs exclude salary costs incurred by TAFEs and statutory authorities. The apportionment of salary costs between ongoing, fixed-term and casual is approximate, and derived from using total employee expenses as published in the Department‟s annual reports and the average number of staff in these categories in each financial year.
Question 27
Please provide the following details about staff number changes in 2012-13.
(Please include VPS, non-VPS and fixed-term staff, and provide all data as FTE):
Target for 2012-13
Actual for 2012-13
Reason for any variation between target and actual Impact of reduction or increase in staff numbers on services delivery
Total change in staff numbers (please indicate + for increase and – for decrease)
N/A +183.6 DEECD does not have targets for front line staff to ensure efficient service delivery. Please see below response for head office targets.
N/A.
Change in the number of head office staff* (please indicate + for increase and – for decrease)
-300 -289.1 Reductions to head office staff are the result of the implementation of the Sustainable Government Initiative.
Difference from target to actuals is due to timing of departures.
The Department implemented a strategic redesign to minimise service delivery impacts.
The reduction was targeted to back office functions to minimise impacts on service delivery functions.
Change in the number of front-line staff* (please indicate + for increase and – for decrease)
N/A +472.7 DEECD does not have targets for front line staff to ensure efficient service delivery.
N/A
Number of new staff hired N/A N/A There have been no new positions created in 2012-13. New positions are subject to Secretary approval and the Sustainable Government Initiative rules.
N/A
EMAIL RCVD PAEC 12/11/2013

Public Accounts and Estimates Committee: 2012-13 Financial and Performance Outcomes General Questionnaire
31
Number of staff reduced through resignation and retirement
N/A N/A Targets are not set for the number of staff reduced through resignation and retirement.
N/A
Number of staff reduced through non-renewal of contracts
N/A N/A Targets are not set for the number of staff reduced through non-renewal of contracts.
N/A
Number of staff reduced through VDPs
-360 to -370 360.4 Reductions to head office staff are the result of the implementation of the Sustainable Government Initiative.
The Department‟s approach to achieving the target was through a strategic redesign and downsizing of Department FTE levels. The reduction was targeted to back office functions to minimise impacts on service delivery functions.
Number of staff reduced through TSPs
N/A N/A Targets are not set for the number of staff reduced through targeted separation packages.
N/A
Number of staff reduced through other means
N/A N/A Targets are not set for the number of staff reduced through other means.
N/A
Costs associated with staff reductions (e.g. VDP and redundancies pay-outs) ($ million)
N/A $28.263 million
The Department did not forecast a budget for the total costs associated with staff reductions as separation package costs were largely managed by DTF.
* Please indicate how you have defined ‘head office staff’ and ‘front-line staff’.
Head Office Staff: VPS Classified, EO, Other (Ministerial Driver, Senior Medical Officer & LOTE Consultant) and Casual VPS staff not generally active in schools.
Front-line Staff: All Government Teaching Service, Allied Health, Nursing staff plus VPS classified staff generally active (National Skills Standards Council definition) in schools.
Question 28
Please itemise the services delivered by contractors or contract staff in 2012-13 (refer to Explanatory Memorandum for definition of contractors):
Role/services provided Number of contractors/contract staff Value of services ($)
Contract Staff (Whole of Government State Purchase Contract) 7 $24,303,976
EMAIL RCVD PAEC 12/11/2013

Public Accounts and Estimates Committee: 2012-13 Financial and Performance Outcomes General Questionnaire
32
Curriculum Development Services 1 $240,337
Early Childhood services 1 $321,543
Education and Community Development Services 4 $1,789,292
Education Assessment Services 1 $4,865,919
Education Services 5 $2,250,742
Financial, accounting, audit, taxation, risk management, insurance services and training
5 $4,050,075
HR Services 1 $421,458
IT Services 12 $6,122,497
IT, IT Project Management Services 13 $10,912,912
Professional Services 6 $1,559,896
Professional Services (Research, leadership, and professional development)
35 $19,315,508
Project Management Services 1 $208,328
Publishing, printing, promotions and communication or marketing services
3 $617,179
Recruitment Services 1 $173,150
Strategic services and advice ( audit, fraud and procurement) 1 $280,009
Training Services 4 $881,987
Utilities, infrastructure/sustainability, transport and project management services
3 $3,324,119
Note: Consistent with the requirements of the Financial Management Act 1994, the above list includes contractors engaged by the Department with a value over $100,000.
EMAIL RCVD PAEC 12/11/2013
Public Accounts and Estimates Committee: 2012-13 Financial and Performance Outcomes General Questionnaire
33
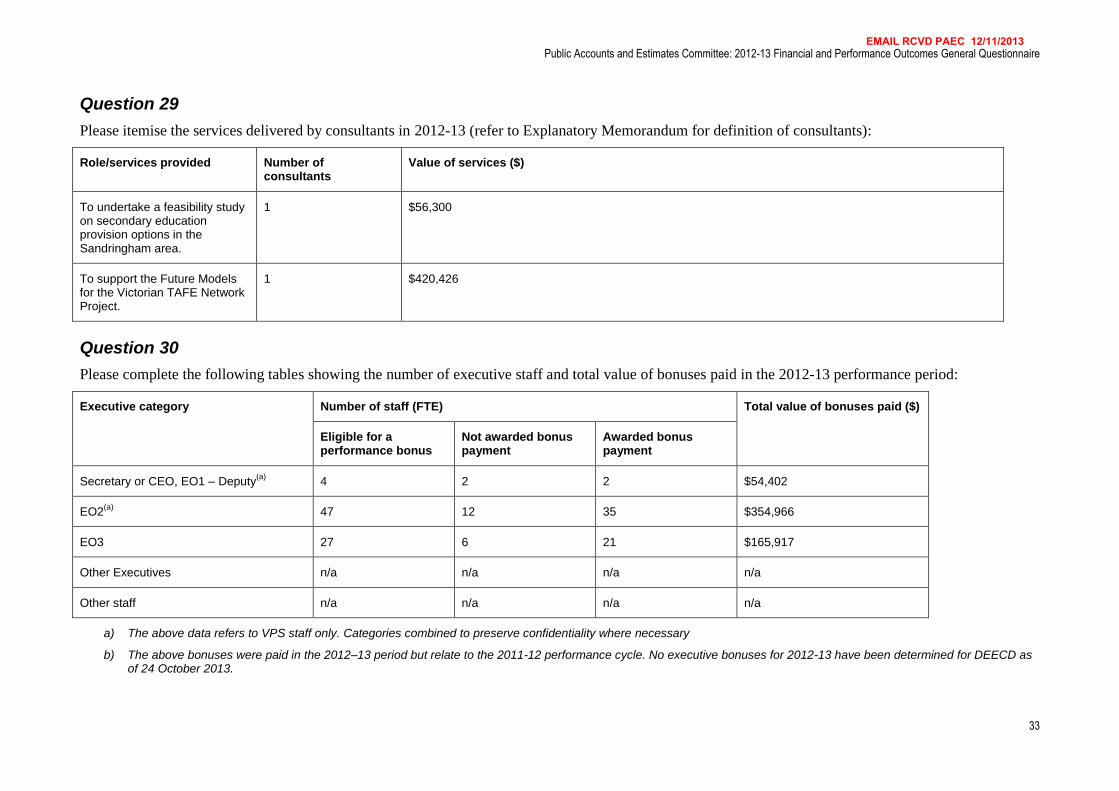
Question 29
Please itemise the services delivered by consultants in 2012-13 (refer to Explanatory Memorandum for definition of consultants):
Role/services provided Number of consultants
Value of services ($)
To undertake a feasibility study on secondary education provision options in the Sandringham area.
1 $56,300
To support the Future Models for the Victorian TAFE Network Project.
1 $420,426
Question 30
Please complete the following tables showing the number of executive staff and total value of bonuses paid in the 2012-13 performance period:
Executive category Number of staff (FTE) Total value of bonuses paid ($)
Eligible for a performance bonus
Not awarded bonus payment
Awarded bonus payment
Secretary or CEO, EO1 – Deputy(a)
4 2 2 $54,402
EO2(a)
47 12 35 $354,966
EO3 27 6 21 $165,917
Other Executives n/a n/a n/a n/a
Other staff n/a n/a n/a n/a
a) The above data refers to VPS staff only. Categories combined to preserve confidentiality where necessary
b) The above bonuses were paid in the 2012–13 period but relate to the 2011-12 performance cycle. No executive bonuses for 2012-13 have been determined for DEECD as of 24 October 2013.
EMAIL RCVD PAEC 12/11/2013

Public Accounts and Estimates Committee: 2012-13 Financial and Performance Outcomes General Questionnaire
34
Question 31
Please detail the number of executives who received increases in their base remuneration in 2012-13, breaking that information down according to what
proportion of their salary the increase was, and explaining the reasons for executives’ salaries increasing in each bracket.
Increase in base remuneration Number of executives receiving increases in their base rate of remuneration of this amount
Reasons for these increases
0-3 per cent _ _
3-5 per cent 4 Contract renewal / work value increases x 2
Work Value increases x 2
5-10 per cent 7 Promotion x 1
Contract renewal / work value increase x 1
Work Value increases x 5
10-15 per cent 5 Promotion x 1
Contract renewal / work value increase x 1
Work Value increases x 3
Greater than 15 per cent 2 Promotion x 2
Note: The work value increases above were mostly a one-off alignment to correct relativity / work value gaps which were identified in the review of executive remuneration that was done to address the implications of the new structure. Executive positions that were identified as having a lower work value resulting from the restructure are expected to move to lower remuneration when the incumbent is replaced.
SECTION F: Program outcomes (departments only)
Outcomes and objectives reflect the impact on the community of the goods and services provided by a department. The questions in this section all relate to
the outcomes and objectives that your department contributed to in 2012-13.
EMAIL RCVD PAEC 12/11/2013
Public Accounts and Estimates Committee: 2012-13 Financial and Performance Outcomes General Questionnaire
35
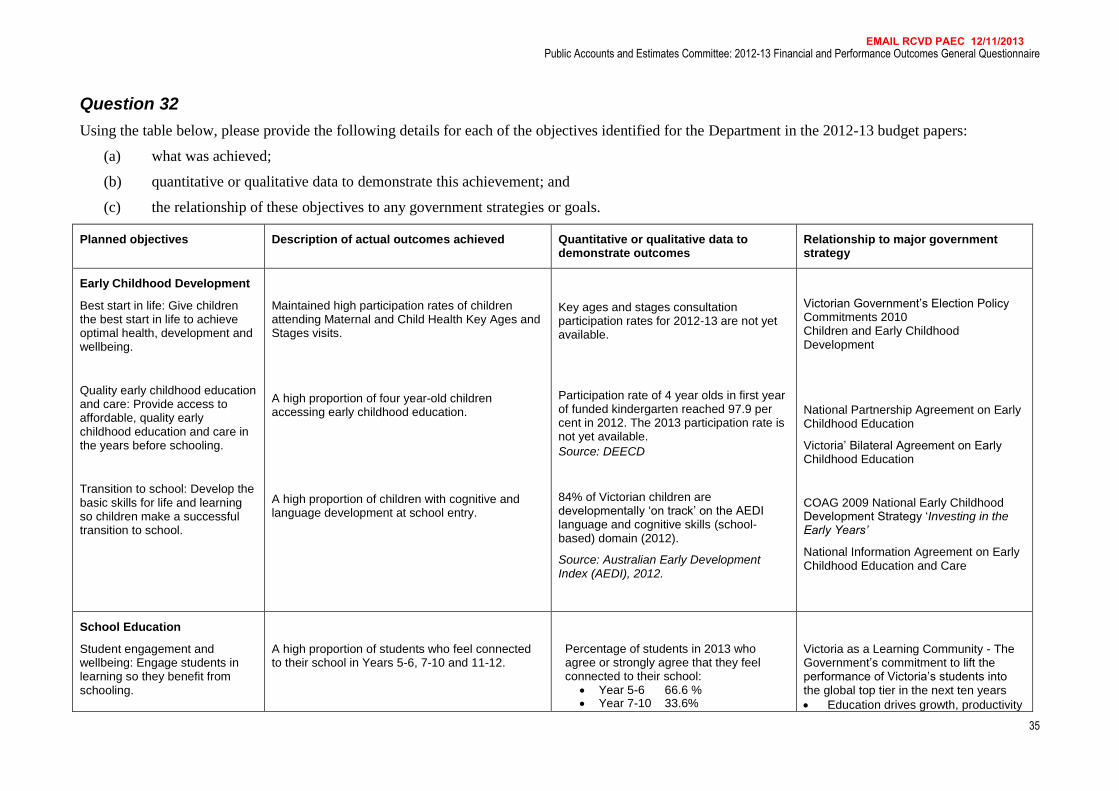
Question 32
Using the table below, please provide the following details for each of the objectives identified for the Department in the 2012-13 budget papers:
(a) what was achieved;
(b) quantitative or qualitative data to demonstrate this achievement; and
(c) the relationship of these objectives to any government strategies or goals.
Planned objectives Description of actual outcomes achieved Quantitative or qualitative data to demonstrate outcomes
Relationship to major government strategy
Early Childhood Development
Best start in life: Give children the best start in life to achieve optimal health, development and wellbeing.
Quality early childhood education and care: Provide access to affordable, quality early childhood education and care in the years before schooling.
Transition to school: Develop the basic skills for life and learning so children make a successful transition to school.
Maintained high participation rates of children attending Maternal and Child Health Key Ages and Stages visits.
A high proportion of four year-old children accessing early childhood education.
A high proportion of children with cognitive and language development at school entry.
Key ages and stages consultation participation rates for 2012-13 are not yet available.
Participation rate of 4 year olds in first year of funded kindergarten reached 97.9 per cent in 2012. The 2013 participation rate is not yet available.
Source: DEECD
84% of Victorian children are developmentally „on track‟ on the AEDI language and cognitive skills (school-based) domain (2012).
Source: Australian Early Development Index (AEDI), 2012.
Victorian Government‟s Election Policy Commitments 2010 Children and Early Childhood Development
National Partnership Agreement on Early Childhood Education
Victoria‟ Bilateral Agreement on Early Childhood Education
COAG 2009 National Early Childhood Development Strategy „Investing in the Early Years‟
National Information Agreement on Early Childhood Education and Care
School Education
Student engagement and wellbeing: Engage students in learning so they benefit from schooling.
A high proportion of students who feel connected to their school in Years 5-6, 7-10 and 11-12.
Percentage of students in 2013 who agree or strongly agree that they feel connected to their school:
Year 5-6 66.6 % Year 7-10 33.6%
Victoria as a Learning Community - The Government‟s commitment to lift the performance of Victoria‟s students into the global top tier in the next ten years
Education drives growth, productivity
EMAIL RCVD PAEC 12/11/2013

Public Accounts and Estimates Committee: 2012-13 Financial and Performance Outcomes General Questionnaire
36
Planned objectives Description of actual outcomes achieved Quantitative or qualitative data to demonstrate outcomes
Relationship to major government strategy
Student achievement and improvement: Improve student achievement in literacy and numeracy so Victorian students excel by national and international standards.
Youth transitions: Assist young people to transition from school to further education and/or work that provides further training opportunities.
A high proportion of students meeting the expected standards for literacy and numeracy in Years 3, 5, 7 and 9.
A high proportion of young people having attained at least a Year 12 or equivalent (AQF Cert II+).
A high proportion of school leavers completing post-school education or training six months after school.
Year 11-12 27.8%
Source: DEECD Attitudes to School Survey, 2013.
Percentage of students in 2013 (preliminary results) at or above the National Minimum Standard in Year 5, 7 and 9 NAPLAN Literacy and Numeracy: Year 3
Reading 96.0% Numeracy 96.3%
Year 5 Reading 96.4% Numeracy 94.8%
Year 7 Reading 95.5% Numeracy 95.7%
Year 9 Reading 94.5% Numeracy 92.4%
Note: Victorian government and non-government schools. NAPLAN results include a level of statistical error and can sometimes be reported with confidence intervals which are used to ascertain “real” changes between years or differences between jurisdictions.
Source: NAPLAN Summary Report 2013 (preliminary results)
The attainment rate of 20 to 24 year olds reached 88 per cent in 2012. Source: ABS Survey of Education and Work (cat.no. 6227.0.55.003) 95.0% of school leavers completing a VCE VET certificate program in a school progressing to further education, training or work in 2012. Source: DEECD
and global competitive advantage
High levels of education have a direct impact on individuals‟ success in life
Education is the basis of a good
society.
EMAIL RCVD PAEC 12/11/2013

Public Accounts and Estimates Committee: 2012-13 Financial and Performance Outcomes General Questionnaire
37
Planned objectives Description of actual outcomes achieved Quantitative or qualitative data to demonstrate outcomes
Relationship to major government strategy
Higher Education and Skills
Responsiveness to labour market demand: Supply the skills needed for a changing labour market to improve labour market outcomes.
Effective educational, labour market and social participation: Equip Victorians of all ages with the skills and capabilities to enable educational, labour market and social participation.
Responsiveness to labour market needs
There has been significant growth in government subsidised enrolments between 2008 and 2012. This growth was not necessarily in areas of industry and economic need. In response the Government in May 2012 announced Refocusing Vocational Training in Victoria (RVT), to ensure investment better targets areas of greatest public benefit and future jobs growth, such as training in “in shortage” and specialised occupations. Since the introduction of the RVT reforms there has been a shift to a greater number of enrolments in courses contributing to improving Victoria‟s economic prosperity. This change has been effected through differential subsidises for training from June 2012 onwards. Subsidies have been determined on a number of factors, including where there is direct vocational benefit from the training and the extent where government investment may be required to stimulate delivery of, and participation in, this training to meet industry needs. Effective educational, labour market and social participation
Participation in training is a key way of improving the life opportunities of disadvantaged people. With the implementation of RVT, subsidy arrangements, including fee concessions, retained incentives to ensure participation by disadvantage populations.
For quarter 2 of 2013, delivery for specialised occupations and occupations „in shortage‟ has increased in real terms. Occupations „in shortage‟:
Since quarter 2 of 2012, government subsidised enrolments for occupations „in shortage‟ increased by 2%.
Since quarter 2 of 2011, government subsidised enrolments increased by 21%.
Specialised occupations:
Since quarter 2 of 2012, government subsidised enrolments for specialised occupations increased by 1%.
Since quarter 2 of 2011, government subsidised enrolments increased by 15%.
The number of unemployed students undertaking government subsidised training has also increased over time.
Since quarter 2 of 2012, the number of unemployed students undertaking government subsidised vocational training has increased by 2%.
Since quarter 2 of 2011, delivery in this area increased by 48%.
Refocusing Vocational Training in Victoria, May 2012
Refocusing Vocational Training in Victoria, May 2012
EMAIL RCVD PAEC 12/11/2013
Public Accounts and Estimates Committee: 2012-13 Financial and Performance Outcomes General Questionnaire
38
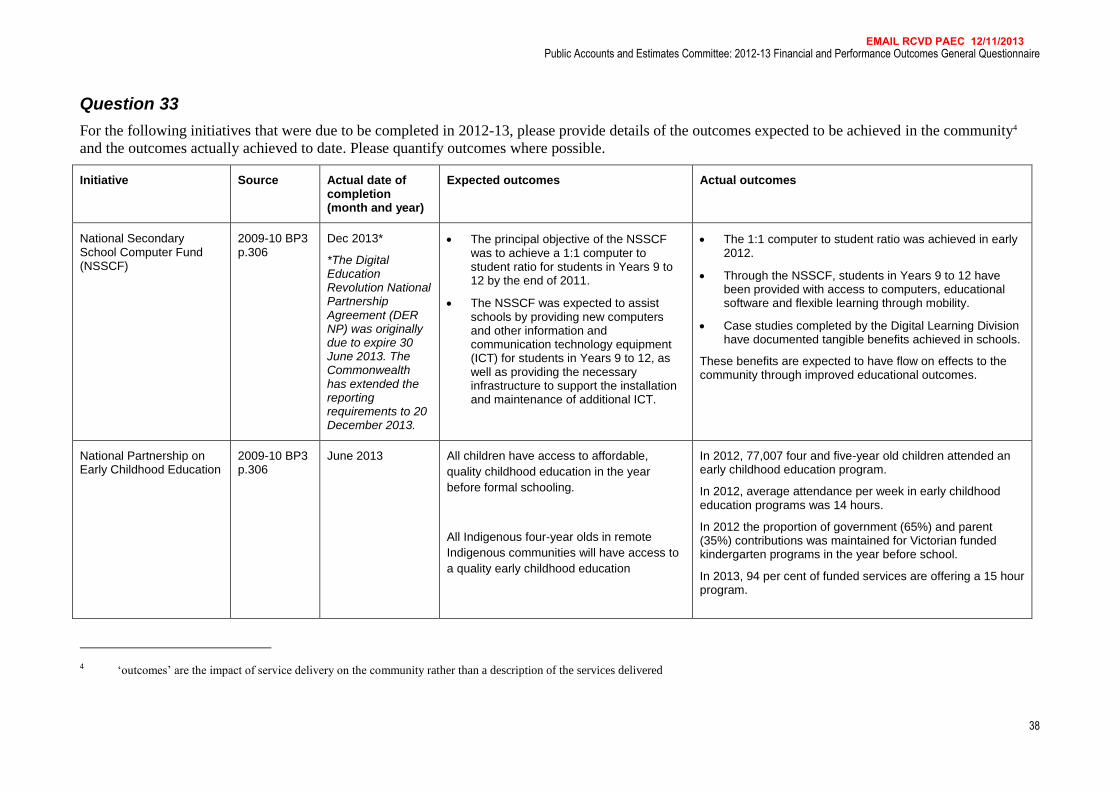
Question 33
For the following initiatives that were due to be completed in 2012-13, please provide details of the outcomes expected to be achieved in the community4
and the outcomes actually achieved to date. Please quantify outcomes where possible.
Initiative Source Actual date of completion (month and year)
Expected outcomes Actual outcomes
National Secondary School Computer Fund (NSSCF)
2009-10 BP3 p.306
Dec 2013*
*The Digital Education Revolution National Partnership Agreement (DER NP) was originally due to expire 30 June 2013. The Commonwealth has extended the reporting requirements to 20 December 2013.
The principal objective of the NSSCF was to achieve a 1:1 computer to student ratio for students in Years 9 to 12 by the end of 2011.
The NSSCF was expected to assist schools by providing new computers and other information and communication technology equipment (ICT) for students in Years 9 to 12, as well as providing the necessary infrastructure to support the installation and maintenance of additional ICT.
The 1:1 computer to student ratio was achieved in early 2012.
Through the NSSCF, students in Years 9 to 12 have been provided with access to computers, educational software and flexible learning through mobility.
Case studies completed by the Digital Learning Division have documented tangible benefits achieved in schools.
These benefits are expected to have flow on effects to the community through improved educational outcomes.
National Partnership on Early Childhood Education
2009-10 BP3 p.306
June 2013 All children have access to affordable,
quality childhood education in the year
before formal schooling.
All Indigenous four-year olds in remote
Indigenous communities will have access to
a quality early childhood education
In 2012, 77,007 four and five-year old children attended an early childhood education program.
In 2012, average attendance per week in early childhood education programs was 14 hours.
In 2012 the proportion of government (65%) and parent (35%) contributions was maintained for Victorian funded kindergarten programs in the year before school.
In 2013, 94 per cent of funded services are offering a 15 hour program.
4 ‘outcomes’ are the impact of service delivery on the community rather than a description of the services delivered
EMAIL RCVD PAEC 12/11/2013

Public Accounts and Estimates Committee: 2012-13 Financial and Performance Outcomes General Questionnaire
39
Initiative Source Actual date of completion (month and year)
Expected outcomes Actual outcomes
Between 2011 and 2012, there was a 10 per cent increase in the proportion of disadvantaged children enrolled in early childhood education programs. Between 2011 and 2012, there was a 20 per cent increase in the proportion of indigenous children enrolled in and attending an early childhood program (where it was possible to record).
National Partnership on
Low Socio‑Economic
Status (SES) School Communities
2009-10 BP3 p.306
June 2015 The Low SES NP was established to support a range of school level and broader reforms that address educational disadvantage associated with low socio-economic status school communities.
The aim of this NP was for schools implementing reforms to become better equipped to address the complex and interconnected challenges facing students in disadvantaged communities.
Under the Low SES NP, targeted outcomes include:
All children are engaged in and benefiting from schooling.
Young people are meeting basic literacy and numeracy standards, and overall levels of literacy and numeracy achievement are improving.
Schooling promotes the social inclusion and reduces the education disadvantage of children, especially Indigenous children.
Australian students excel by international standards.
Young people make a successful transition from school to work and further study.
Preliminary results indicate positive impacts of the Low SES NP on schools and students, including a small but statistically significant impact of the Low SES NP on growth in student achievement between 2009 and 2011.
Impacts of the Low SES NP include:
Estimates suggest that participating in the Low SES NP, holding all else equal, contributed an additional 5.5 points to average Numeracy growth on the NAPLAN scale from Year 3 in 2009 to Year 5 in 2011.
NAPLAN data for all Australian students shows the average Numeracy achievement growth across the country was found to be approximately 94 points from Year 3 in 2009 to Year 5 in 2011. Estimates suggest that the Low SES NP contributed an additional 6% to treated schools compared to schools with similar student composition and starting points. Where the analysis was possible at the secondary level, the Low SES NP was estimated to lead to a larger improvement of 19% above average growth in that period.
When achievement at the primary school level was analysed using NAPLAN bands, a general increase in the proportion of students at or below national minimum standards (NMS) was observed across all Victorian schools. Among Low SES NP schools, however, this figure was found to have relatively decreased by 7% in Numeracy for all students. At the secondary school level, the general increase in the proportion of students in the lower two bands was also a trend in Victoria. Despite this, there was a relative decrease of 18.3% in the proportion of Low SES NP Indigenous students in the lower two Reading bands.
EMAIL RCVD PAEC 12/11/2013

Public Accounts and Estimates Committee: 2012-13 Financial and Performance Outcomes General Questionnaire
40
Initiative Source Actual date of completion (month and year)
Expected outcomes Actual outcomes
The above results are particularly significant given that schools selected for the Low SES NP were often comprised of students facing multiple sources of disadvantage over an extended period of time
Victoria University Technical Trade centres - Sunshine campus - Commonwealth supported project (Sunshine)
Completed list in BP4 2013-14
23rd Nov 2012 Construction of a new building for the „engineering, manufacturing, construction and building industry‟ training centre co-located with other closely related Victoria University (VU) infrastructure at VU‟s Sunshine Campus.
Also to Decommission VU‟s obsolete Newport Campus facility.
Actual outcomes regarding the new building are in line with expected outcomes.
Newport campus has still not been demolished as planned due to an existing childcare centre lease on the site.
Targeted Investment to Achieve National Partnership Objectives
2009-10 BP3 p.306
June 2013 The excepted outcomes were to deliver projects that support:
workforce capacity and improved student results in literacy and numeracy
reforms which target critical points in the teacher „lifecycle‟ to attract, train, place, develop and retain quality teachers and leaders in schools and classrooms.
Funding was allocated across eight projects that targeted teacher quality and literacy and numeracy. Outcomes of these projects were:
assisting in improving teacher quality by enabling suitably qualified professionals with current industry knowledge and expertise to undertake teacher education while employed as trainee teachers and who would make excellent teachers in targeted subject areas of mathematics, science or technology.
improvements in teaching practices through refinements in the performance and development processes within schools. The changes resulted in teachers working in conjunction with their school leaders to utilise evidence to identify areas of teaching practice needing further development.
that the Victorian Essential Learning Standards 'Number' scores indicated that the impact of having Primary Mathematics Specialists at schools to support other classroom teachers has a significant positive effect growing student learning outcomes approximately three or more terms every two terms.
schools were able to accelerate their student‟s learning by 18 months within a 12 month period and meet the performance target under the Language Support
EMAIL RCVD PAEC 12/11/2013

Public Accounts and Estimates Committee: 2012-13 Financial and Performance Outcomes General Questionnaire
41
Initiative Source Actual date of completion (month and year)
Expected outcomes Actual outcomes
Coordinators Program.
identified opportunities to promote student learning by uniting the most important influences in students‟ lives – school, family and community – to create a web of support that nurtures their development towards productive adulthood. These models share a focus on tackling the intermediary factors that shape short and long term learning outcomes, and improving literacy and numeracy skills.
increased regional capacity for the provision of initial and ongoing training to improve teacher quality in the provision of an early literacy intervention program.
Land Acquisition - Casey Central East Primary School, Doreen Secondary College, Melton North West Primary School, Officer Special School, Torquay Primary School, Torquay Secondary College (statewide)
Completed list in BP4 2013-14
April 2013 The purchase of land is intended to be used for providing education in growth areas of the State.
Land has been secured to construct new schools in those areas identified by the Department as having high future education demand.
SECTION G: Fiscal and economic strategy (Department of Treasury and Finance only)
Question 34
This question does not apply to your department.
Question 35
This question does not apply to your department.
EMAIL RCVD PAEC 12/11/2013

Public Accounts and Estimates Committee: 2012-13 Financial and Performance Outcomes General Questionnaire
42
SECTION H: Previous recommendations
Question 36 (departments only)
For each of the following recommendations from the Committee’s Report on the 2009-10 and 2010-11 Financial and Performance Outcomes (report
number 109) or Report on the 2011-12 Financial and Performance Outcomes (report number 115) that relates to an area relevant to your department or one
of its portfolio agencies, please indicate:
(a) whether or not the action specified in the recommendation has been implemented;
(b) if so, how it has been implemented and what publicly available information (if any) demonstrates the implementation of the recommendation;
and
(c) if not, why not.
Report No.
Rec. No.
Recommendation Has the action specified in the recommendation been implemented?
If yes: If no:
How has it been implemented?
What publicly available information, if any, shows the implementation?
Why not?
109 21 All departments which transition to shared services ensure that they set up appropriate mechanisms to capture and report the savings that result from the transition.
No
Savings resulting from shared services are not captured centrally as business units manage their budgets and realise any savings at this level.
109 30
Where departments have performance measures that are based on project milestones, they calculate results based on the original milestones for the project, and not milestones that have been subsequently altered to reflect changes.
n/a
DEECD does not have any performance measures based on project milestones
EMAIL RCVD PAEC 12/11/2013

Public Accounts and Estimates Committee: 2012-13 Financial and Performance Outcomes General Questionnaire
43
Report No.
Rec. No.
Recommendation Has the action specified in the recommendation been implemented?
If yes: If no:
How has it been implemented?
What publicly available information, if any, shows the implementation?
Why not?
109 31 Departments review quality performance measures that are solely based on compliance with legislation, to identify whether more challenging service levels might be set as targets.
Yes The Department reviews its measures every year and sets targets for each measure.
The targets are published in Budget Paper 3.
109 33 Departments review their performance measures to determine whether providing results at the 50th and 90th percentiles would convey a more comprehensive understanding of departmental performance to stakeholders.
No DEECD is conducting an overall review of BP3 measures for the 2014-15 budget year This review will include, but not be limited to, recommendations from the Report on the 2009-10 and 2010-11 Financial and Performance Outcomes
109 34 Departments review those performance measures which solely indicate whether or not a task was performed and, where meaningful, replace them with measures of the timeliness or quality of the task‟s performance.
No
EMAIL RCVD PAEC 12/11/2013