Embed Size (px)
Citation preview
Answer to PTP_Final_Syllabus 2012_June2016_Set 1
Academics Department, The Institute of Cost Accountants of India (Statutory Body under an Act of Parliament) Page 1
PAPER – 17 – STRATEGIC PERFORMANCE MANAGEMENT (SPM)
Answer to PTP_Final_Syllabus 2012_June2016_Set 1
Academics Department, The Institute of Cost Accountants of India (Statutory Body under an Act of Parliament) Page 2
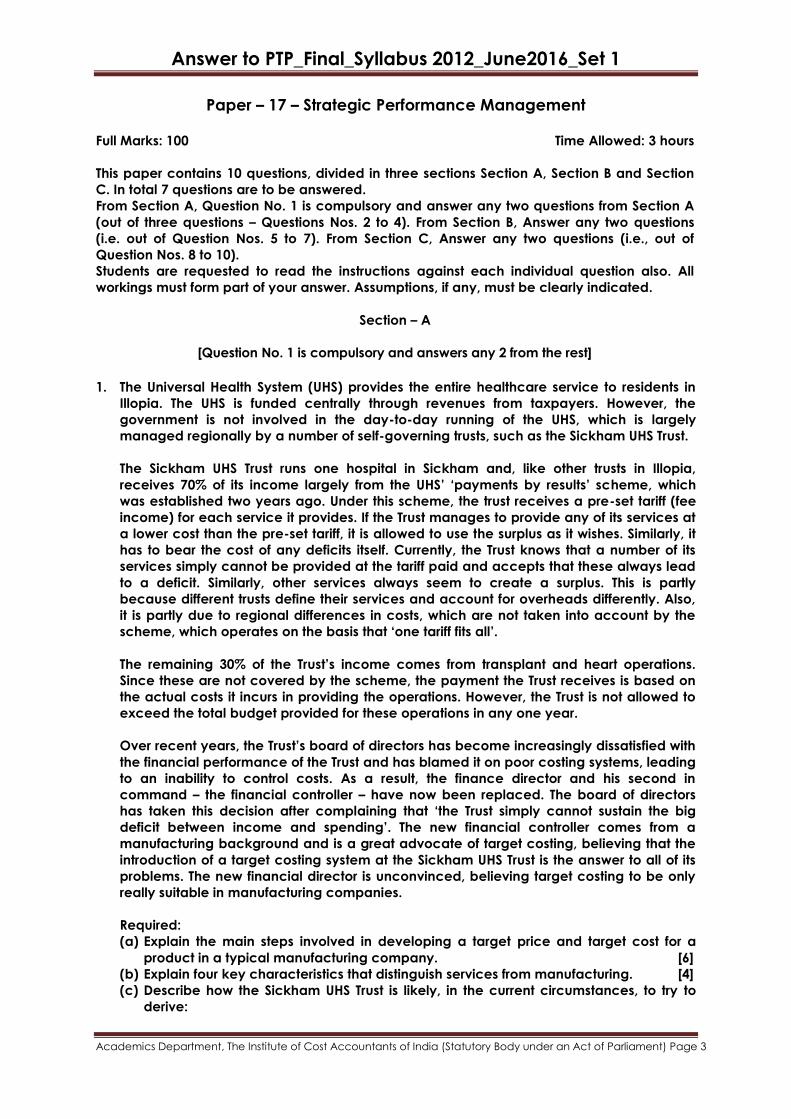
The following table lists the learning objectives and the verbs that appear in the syllabus
learning aims and examination questions:
Learning objectives Verbs used Definition
LEV
EL
C
KNOWLEDGE
What you are expected to
know
List Make a list of
State Express, fully or clearly, the
details/facts
Define Give the exact meaning of
COMPREHENSION
What you are expected to
understand
Describe Communicate the key features of
Distinguish Highlight the differences between
Explain Make clear or intelligible/ state the
meaning or purpose of
Identity Recognize, establish or select after
consideration
Illustrate Use an example to describe or
explain something
APPLICATION
How you are expected to
apply
your knowledge
Apply Put to practical use
Calculate Ascertain or reckon
mathematically
Demonstrate Prove with certainty or exhibit by
practical means
Prepare Make or get ready for use
Reconcile Make or prove consistent/
compatible
Solve Find an answer to
Tabulate Arrange in a table
ANALYSIS
How you are expected to
analyse the detail of what you
have learned
Analyse Examine in detail the structure of
Categorise Place into a defined class or
division
Compare
and contrast
Show the similarities and/or
differences between
Construct Build up or compile
Priorities Place in order of priority or
sequence for action
Produce Create or bring into existence
SYNTHESIS
How you are expected to
utilize the information
gathered to reach an
optimum
conclusion by a process of
reasoning
Discuss Examine in detail by argument
Interpret Translate into intelligible or familiar
terms
Decide To solve or conclude
EVALUATION
How you are expected to use
your learning to evaluate,
make decisions or
recommendations
Advise Counsel, inform or notify
Evaluate Appraise or asses the value of
Recommend Propose a course of action
Answer to PTP_Final_Syllabus 2012_June2016_Set 1
Academics Department, The Institute of Cost Accountants of India (Statutory Body under an Act of Parliament) Page 3
Paper – 17 – Strategic Performance Management
Full Marks: 100 Time Allowed: 3 hours
This paper contains 10 questions, divided in three sections Section A, Section B and Section
C. In total 7 questions are to be answered.
From Section A, Question No. 1 is compulsory and answer any two questions from Section A
(out of three questions – Questions Nos. 2 to 4). From Section B, Answer any two questions
(i.e. out of Question Nos. 5 to 7). From Section C, Answer any two questions (i.e., out of
Question Nos. 8 to 10).
Students are requested to read the instructions against each individual question also. All
workings must form part of your answer. Assumptions, if any, must be clearly indicated.
Section – A
[Question No. 1 is compulsory and answers any 2 from the rest]
1. The Universal Health System (UHS) provides the entire healthcare service to residents in
Illopia. The UHS is funded centrally through revenues from taxpayers. However, the
government is not involved in the day-to-day running of the UHS, which is largely
managed regionally by a number of self-governing trusts, such as the Sickham UHS Trust.
The Sickham UHS Trust runs one hospital in Sickham and, like other trusts in Illopia,
receives 70% of its income largely from the UHS‟ „payments by results‟ scheme, which
was established two years ago. Under this scheme, the trust receives a pre-set tariff (fee
income) for each service it provides. If the Trust manages to provide any of its services at
a lower cost than the pre-set tariff, it is allowed to use the surplus as it wishes. Similarly, it
has to bear the cost of any deficits itself. Currently, the Trust knows that a number of its
services simply cannot be provided at the tariff paid and accepts that these always lead
to a deficit. Similarly, other services always seem to create a surplus. This is partly
because different trusts define their services and account for overheads differently. Also,
it is partly due to regional differences in costs, which are not taken into account by the
scheme, which operates on the basis that „one tariff fits all‟.
The remaining 30% of the Trust‟s income comes from transplant and heart operations.
Since these are not covered by the scheme, the payment the Trust receives is based on
the actual costs it incurs in providing the operations. However, the Trust is not allowed to
exceed the total budget provided for these operations in any one year.
Over recent years, the Trust‟s board of directors has become increasingly dissatisfied with
the financial performance of the Trust and has blamed it on poor costing systems, leading
to an inability to control costs. As a result, the finance director and his second in
command – the financial controller – have now been replaced. The board of directors
has taken this decision after complaining that „the Trust simply cannot sustain the big
deficit between income and spending‟. The new financial controller comes from a
manufacturing background and is a great advocate of target costing, believing that the
introduction of a target costing system at the Sickham UHS Trust is the answer to all of its
problems. The new financial director is unconvinced, believing target costing to be only
really suitable in manufacturing companies.
Required:
(a) Explain the main steps involved in developing a target price and target cost for a
product in a typical manufacturing company. [6]
(b) Explain four key characteristics that distinguish services from manufacturing. [4]
(c) Describe how the Sickham UHS Trust is likely, in the current circumstances, to try to
derive:
Answer to PTP_Final_Syllabus 2012_June2016_Set 1
Academics Department, The Institute of Cost Accountants of India (Statutory Body under an Act of Parliament) Page 4
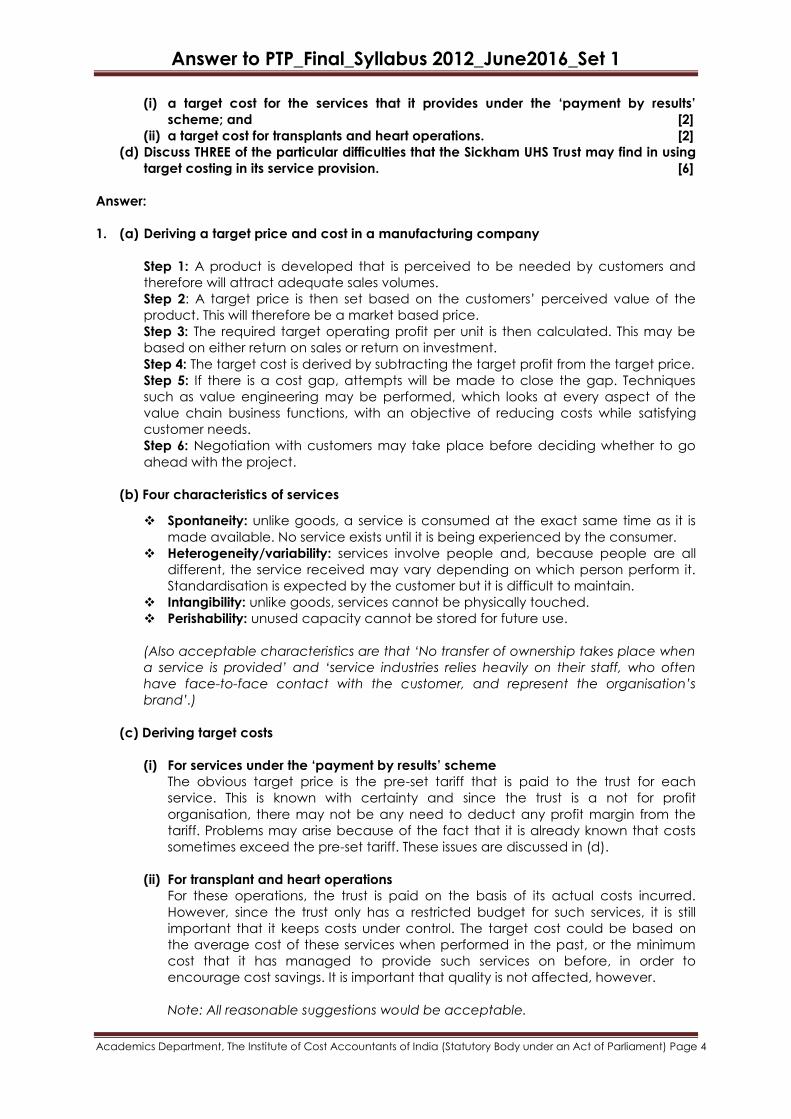
(i) a target cost for the services that it provides under the „payment by results‟
scheme; and [2]
(ii) a target cost for transplants and heart operations. [2]
(d) Discuss THREE of the particular difficulties that the Sickham UHS Trust may find in using
target costing in its service provision. [6]
Answer:
1. (a) Deriving a target price and cost in a manufacturing company
Step 1: A product is developed that is perceived to be needed by customers and
therefore will attract adequate sales volumes.
Step 2: A target price is then set based on the customers‟ perceived value of the
product. This will therefore be a market based price.
Step 3: The required target operating profit per unit is then calculated. This may be
based on either return on sales or return on investment.
Step 4: The target cost is derived by subtracting the target profit from the target price.
Step 5: If there is a cost gap, attempts will be made to close the gap. Techniques
such as value engineering may be performed, which looks at every aspect of the
value chain business functions, with an objective of reducing costs while satisfying
customer needs.
Step 6: Negotiation with customers may take place before deciding whether to go
ahead with the project.
(b) Four characteristics of services
Spontaneity: unlike goods, a service is consumed at the exact same time as it is
made available. No service exists until it is being experienced by the consumer.
Heterogeneity/variability: services involve people and, because people are all
different, the service received may vary depending on which person perform it.
Standardisation is expected by the customer but it is difficult to maintain.
Intangibility: unlike goods, services cannot be physically touched.
Perishability: unused capacity cannot be stored for future use.
(Also acceptable characteristics are that ‘No transfer of ownership takes place when
a service is provided’ and ‘service industries relies heavily on their staff, who often
have face-to-face contact with the customer, and represent the organisation’s
brand’.)
(c) Deriving target costs
(i) For services under the „payment by results‟ scheme
The obvious target price is the pre-set tariff that is paid to the trust for each
service. This is known with certainty and since the trust is a not for profit
organisation, there may not be any need to deduct any profit margin from the
tariff. Problems may arise because of the fact that it is already known that costs
sometimes exceed the pre-set tariff. These issues are discussed in (d).
(ii) For transplant and heart operations
For these operations, the trust is paid on the basis of its actual costs incurred.
However, since the trust only has a restricted budget for such services, it is still
important that it keeps costs under control. The target cost could be based on
the average cost of these services when performed in the past, or the minimum
cost that it has managed to provide such services on before, in order to
encourage cost savings. It is important that quality is not affected, however.
Note: All reasonable suggestions would be acceptable.
Answer to PTP_Final_Syllabus 2012_June2016_Set 1
Academics Department, The Institute of Cost Accountants of India (Statutory Body under an Act of Parliament) Page 5
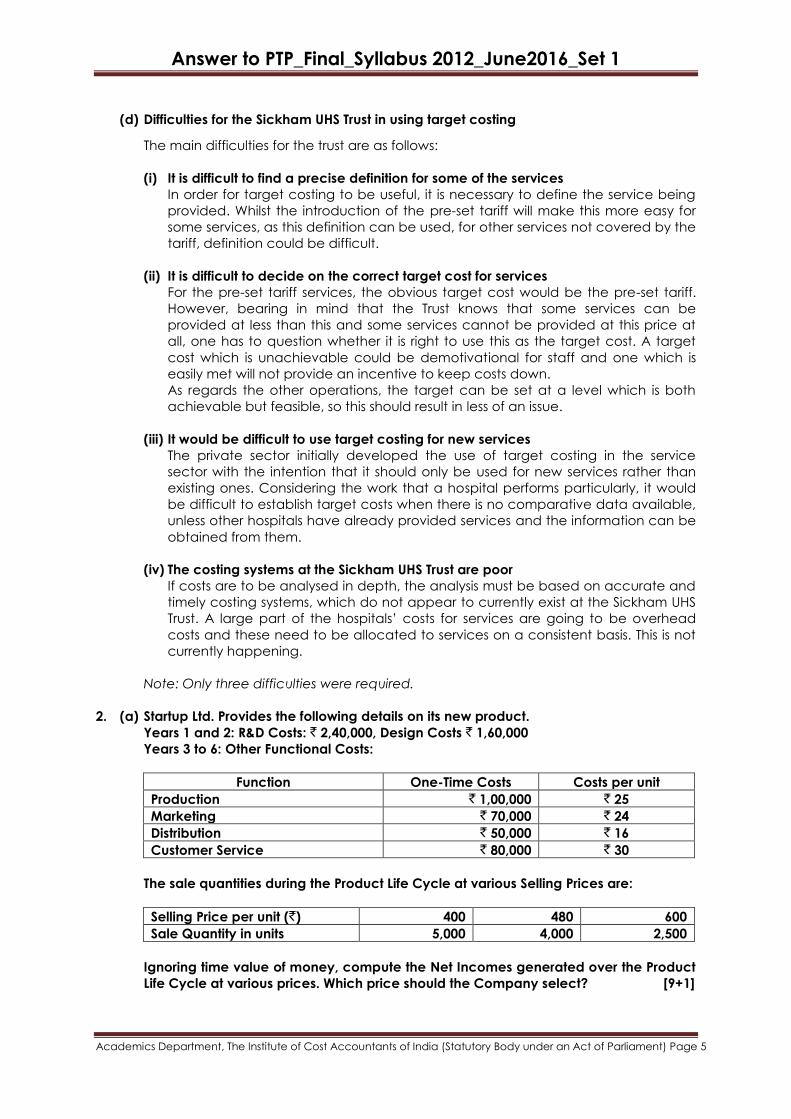
(d) Difficulties for the Sickham UHS Trust in using target costing
The main difficulties for the trust are as follows:
(i) It is difficult to find a precise definition for some of the services
In order for target costing to be useful, it is necessary to define the service being
provided. Whilst the introduction of the pre-set tariff will make this more easy for
some services, as this definition can be used, for other services not covered by the
tariff, definition could be difficult.
(ii) It is difficult to decide on the correct target cost for services
For the pre-set tariff services, the obvious target cost would be the pre-set tariff.
However, bearing in mind that the Trust knows that some services can be
provided at less than this and some services cannot be provided at this price at
all, one has to question whether it is right to use this as the target cost. A target
cost which is unachievable could be demotivational for staff and one which is
easily met will not provide an incentive to keep costs down.
As regards the other operations, the target can be set at a level which is both
achievable but feasible, so this should result in less of an issue.
(iii) It would be difficult to use target costing for new services
The private sector initially developed the use of target costing in the service
sector with the intention that it should only be used for new services rather than
existing ones. Considering the work that a hospital performs particularly, it would
be difficult to establish target costs when there is no comparative data available,
unless other hospitals have already provided services and the information can be
obtained from them.
(iv) The costing systems at the Sickham UHS Trust are poor
If costs are to be analysed in depth, the analysis must be based on accurate and
timely costing systems, which do not appear to currently exist at the Sickham UHS
Trust. A large part of the hospitals‟ costs for services are going to be overhead
costs and these need to be allocated to services on a consistent basis. This is not
currently happening.
Note: Only three difficulties were required.
2. (a) Startup Ltd. Provides the following details on its new product.
Years 1 and 2: R&D Costs: ` 2,40,000, Design Costs ` 1,60,000
Years 3 to 6: Other Functional Costs:
Function One-Time Costs Costs per unit
Production ` 1,00,000 ` 25
Marketing ` 70,000 ` 24
Distribution ` 50,000 ` 16
Customer Service ` 80,000 ` 30
The sale quantities during the Product Life Cycle at various Selling Prices are:
Selling Price per unit (`) 400 480 600
Sale Quantity in units 5,000 4,000 2,500
Ignoring time value of money, compute the Net Incomes generated over the Product
Life Cycle at various prices. Which price should the Company select? [9+1]
Answer to PTP_Final_Syllabus 2012_June2016_Set 1
Academics Department, The Institute of Cost Accountants of India (Statutory Body under an Act of Parliament) Page 6
Answer:
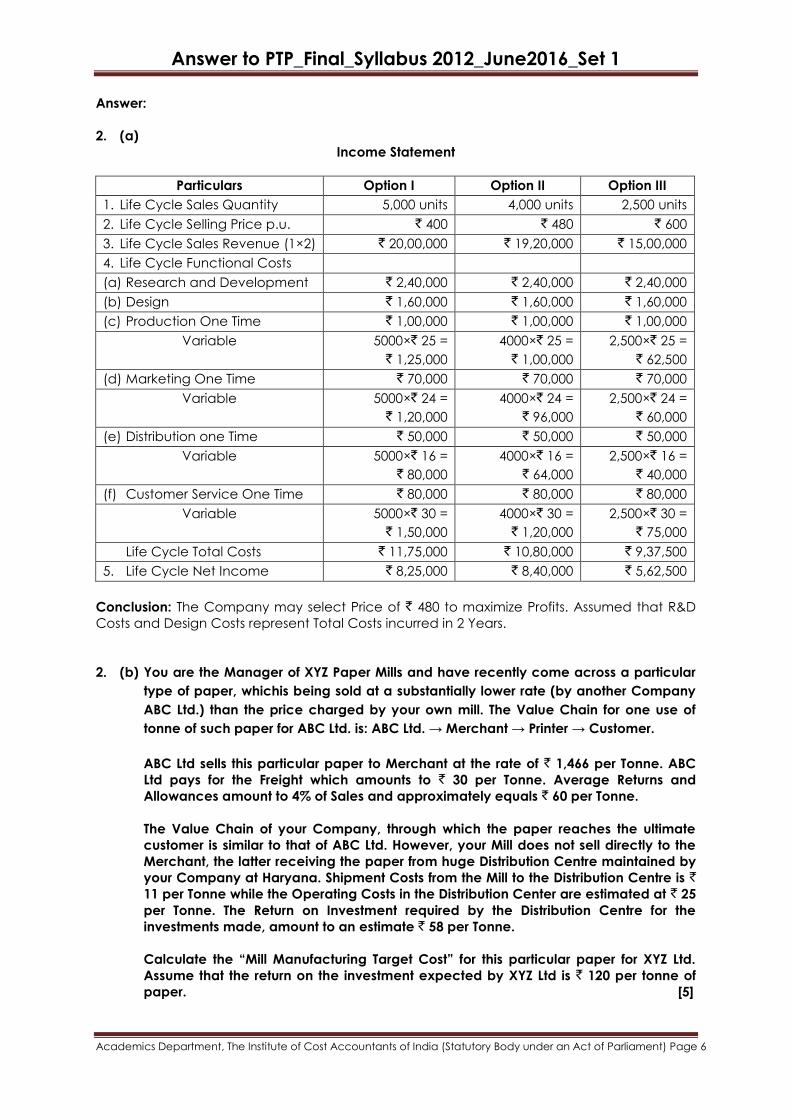
2. (a)
Income Statement
Particulars Option I Option II Option III
1. Life Cycle Sales Quantity 5,000 units 4,000 units 2,500 units
2. Life Cycle Selling Price p.u. ` 400 ` 480 ` 600
3. Life Cycle Sales Revenue (1×2) ` 20,00,000 ` 19,20,000 ` 15,00,000
4. Life Cycle Functional Costs
(a) Research and Development ` 2,40,000 ` 2,40,000 ` 2,40,000
(b) Design ` 1,60,000 ` 1,60,000 ` 1,60,000
(c) Production One Time ` 1,00,000 ` 1,00,000 ` 1,00,000
Variable 5000×` 25 =
` 1,25,000
4000×` 25 =
` 1,00,000
2,500×` 25 =
` 62,500
(d) Marketing One Time ` 70,000 ` 70,000 ` 70,000
Variable 5000×` 24 =
` 1,20,000
4000×` 24 =
` 96,000
2,500×` 24 =
` 60,000
(e) Distribution one Time ` 50,000 ` 50,000 ` 50,000
Variable 5000×` 16 =
` 80,000
4000×` 16 =
` 64,000
2,500×` 16 =
` 40,000
(f) Customer Service One Time ` 80,000 ` 80,000 ` 80,000
Variable 5000×` 30 =
` 1,50,000
4000×` 30 =
` 1,20,000
2,500×` 30 =
` 75,000
Life Cycle Total Costs ` 11,75,000 ` 10,80,000 ` 9,37,500
5. Life Cycle Net Income ` 8,25,000 ` 8,40,000 ` 5,62,500
Conclusion: The Company may select Price of ` 480 to maximize Profits. Assumed that R&D
Costs and Design Costs represent Total Costs incurred in 2 Years.
2. (b) You are the Manager of XYZ Paper Mills and have recently come across a particular
type of paper, whichis being sold at a substantially lower rate (by another Company
ABC Ltd.) than the price charged by your own mill. The Value Chain for one use of
tonne of such paper for ABC Ltd. is: ABC Ltd. → Merchant → Printer → Customer.
ABC Ltd sells this particular paper to Merchant at the rate of ` 1,466 per Tonne. ABC
Ltd pays for the Freight which amounts to ` 30 per Tonne. Average Returns and
Allowances amount to 4% of Sales and approximately equals ` 60 per Tonne.
The Value Chain of your Company, through which the paper reaches the ultimate
customer is similar to that of ABC Ltd. However, your Mill does not sell directly to the
Merchant, the latter receiving the paper from huge Distribution Centre maintained by
your Company at Haryana. Shipment Costs from the Mill to the Distribution Centre is `
11 per Tonne while the Operating Costs in the Distribution Center are estimated at ` 25
per Tonne. The Return on Investment required by the Distribution Centre for the
investments made, amount to an estimate ` 58 per Tonne.
Calculate the “Mill Manufacturing Target Cost” for this particular paper for XYZ Ltd.
Assume that the return on the investment expected by XYZ Ltd is ` 120 per tonne of
paper. [5]
Answer to PTP_Final_Syllabus 2012_June2016_Set 1
Academics Department, The Institute of Cost Accountants of India (Statutory Body under an Act of Parliament) Page 7
Answer:
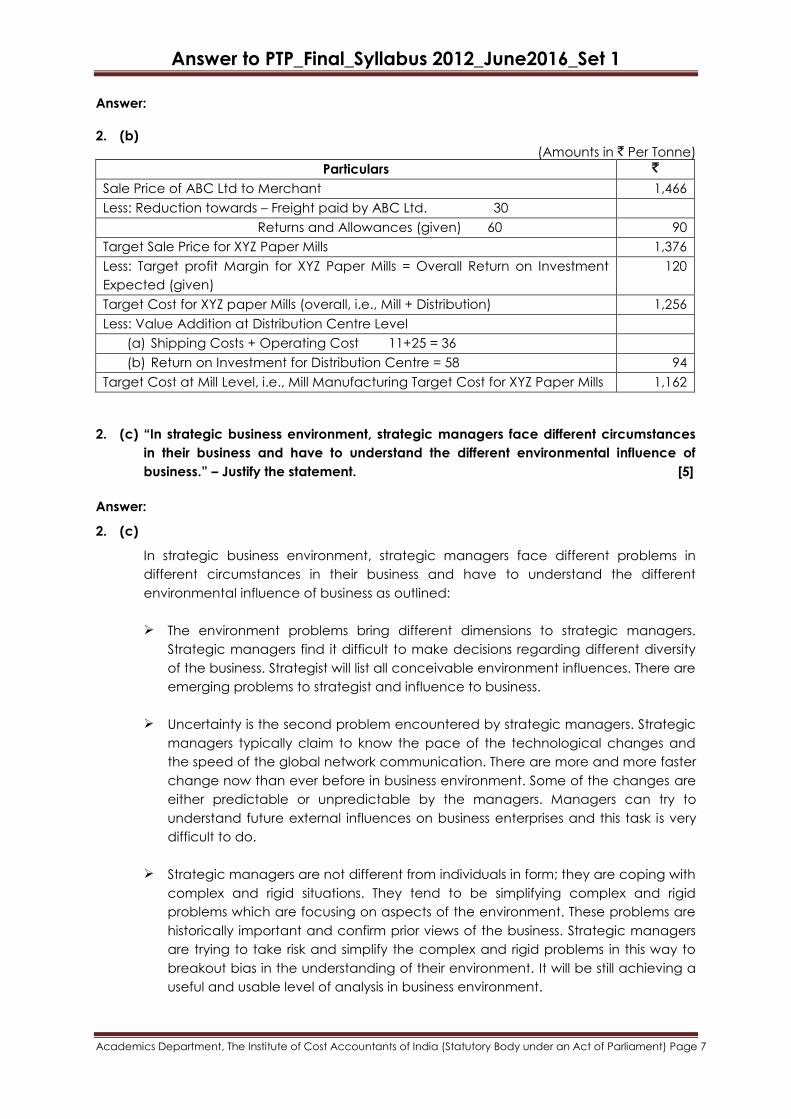
2. (b)
(Amounts in ` Per Tonne)
Particulars `
Sale Price of ABC Ltd to Merchant 1,466
Less: Reduction towards – Freight paid by ABC Ltd. 30
Returns and Allowances (given) 60 90
Target Sale Price for XYZ Paper Mills 1,376
Less: Target profit Margin for XYZ Paper Mills = Overall Return on Investment
Expected (given)
120
Target Cost for XYZ paper Mills (overall, i.e., Mill + Distribution) 1,256
Less: Value Addition at Distribution Centre Level
(a) Shipping Costs + Operating Cost 11+25 = 36
(b) Return on Investment for Distribution Centre = 58 94
Target Cost at Mill Level, i.e., Mill Manufacturing Target Cost for XYZ Paper Mills 1,162
2. (c) “In strategic business environment, strategic managers face different circumstances
in their business and have to understand the different environmental influence of
business.” – Justify the statement. [5]
Answer:
2. (c)
In strategic business environment, strategic managers face different problems in
different circumstances in their business and have to understand the different
environmental influence of business as outlined:
The environment problems bring different dimensions to strategic managers.
Strategic managers find it difficult to make decisions regarding different diversity
of the business. Strategist will list all conceivable environment influences. There are
emerging problems to strategist and influence to business.
Uncertainty is the second problem encountered by strategic managers. Strategic
managers typically claim to know the pace of the technological changes and
the speed of the global network communication. There are more and more faster
change now than ever before in business environment. Some of the changes are
either predictable or unpredictable by the managers. Managers can try to
understand future external influences on business enterprises and this task is very
difficult to do.
Strategic managers are not different from individuals in form; they are coping with
complex and rigid situations. They tend to be simplifying complex and rigid
problems which are focusing on aspects of the environment. These problems are
historically important and confirm prior views of the business. Strategic managers
are trying to take risk and simplify the complex and rigid problems in this way to
breakout bias in the understanding of their environment. It will be still achieving a
useful and usable level of analysis in business environment.
Answer to PTP_Final_Syllabus 2012_June2016_Set 1
Academics Department, The Institute of Cost Accountants of India (Statutory Body under an Act of Parliament) Page 8
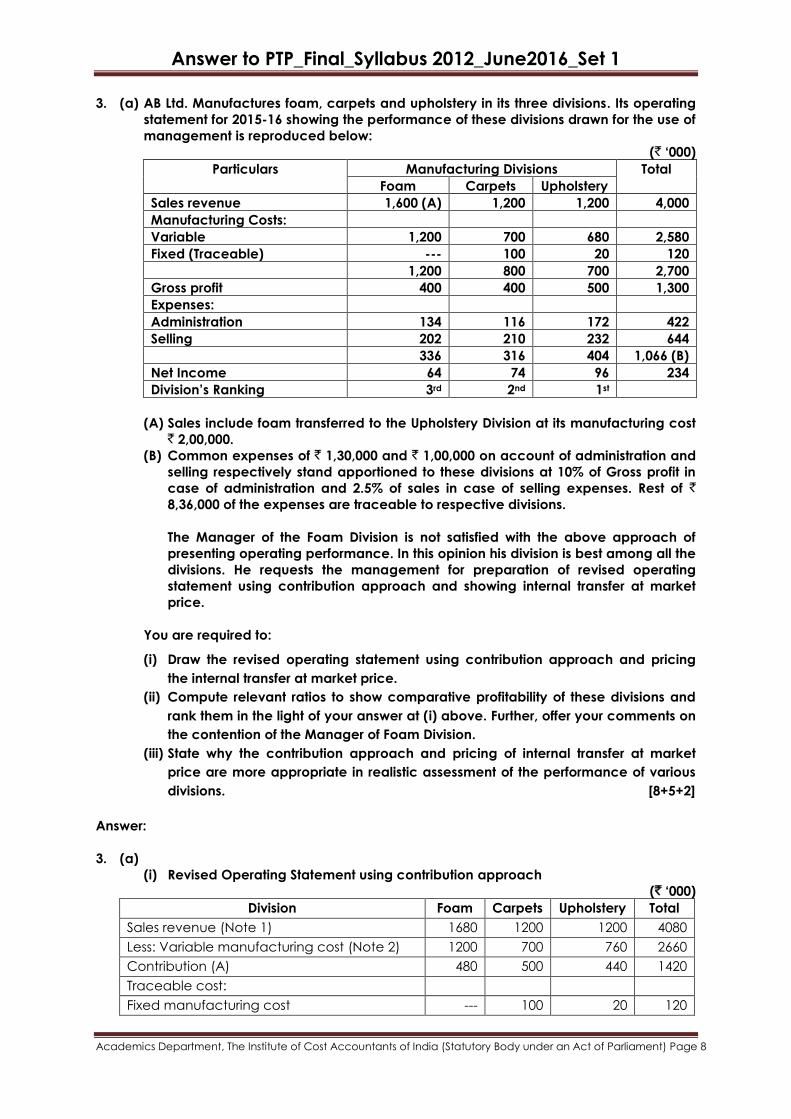
3. (a) AB Ltd. Manufactures foam, carpets and upholstery in its three divisions. Its operating
statement for 2015-16 showing the performance of these divisions drawn for the use of
management is reproduced below:
(` „000)
Particulars Manufacturing Divisions Total
Foam Carpets Upholstery
Sales revenue 1,600 (A) 1,200 1,200 4,000
Manufacturing Costs:
Variable 1,200 700 680 2,580
Fixed (Traceable) --- 100 20 120
1,200 800 700 2,700
Gross profit 400 400 500 1,300
Expenses:
Administration 134 116 172 422
Selling 202 210 232 644
336 316 404 1,066 (B)
Net Income 64 74 96 234
Division‟s Ranking 3rd 2nd 1st
(A) Sales include foam transferred to the Upholstery Division at its manufacturing cost ` 2,00,000.
(B) Common expenses of ` 1,30,000 and ` 1,00,000 on account of administration and
selling respectively stand apportioned to these divisions at 10% of Gross profit in
case of administration and 2.5% of sales in case of selling expenses. Rest of `
8,36,000 of the expenses are traceable to respective divisions.
The Manager of the Foam Division is not satisfied with the above approach of
presenting operating performance. In this opinion his division is best among all the
divisions. He requests the management for preparation of revised operating
statement using contribution approach and showing internal transfer at market
price.
You are required to:
(i) Draw the revised operating statement using contribution approach and pricing
the internal transfer at market price.
(ii) Compute relevant ratios to show comparative profitability of these divisions and
rank them in the light of your answer at (i) above. Further, offer your comments on
the contention of the Manager of Foam Division.
(iii) State why the contribution approach and pricing of internal transfer at market
price are more appropriate in realistic assessment of the performance of various
divisions. [8+5+2]
Answer:
3. (a)
(i) Revised Operating Statement using contribution approach
(` „000)
Division Foam Carpets Upholstery Total
Sales revenue (Note 1) 1680 1200 1200 4080
Less: Variable manufacturing cost (Note 2) 1200 700 760 2660
Contribution (A) 480 500 440 1420
Traceable cost:
Fixed manufacturing cost --- 100 20 120
Answer to PTP_Final_Syllabus 2012_June2016_Set 1
Academics Department, The Institute of Cost Accountants of India (Statutory Body under an Act of Parliament) Page 9
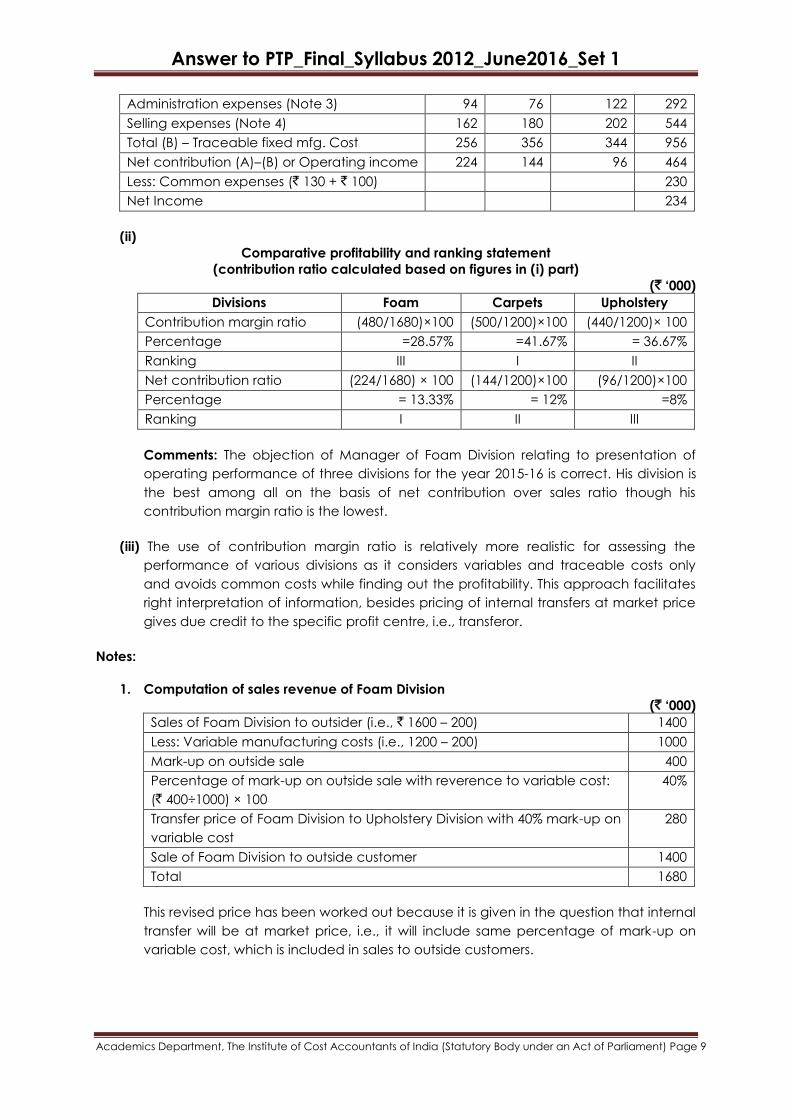
Administration expenses (Note 3) 94 76 122 292
Selling expenses (Note 4) 162 180 202 544
Total (B) – Traceable fixed mfg. Cost 256 356 344 956
Net contribution (A)–(B) or Operating income 224 144 96 464
Less: Common expenses (` 130 + ` 100) 230
Net Income 234
(ii)
Comparative profitability and ranking statement
(contribution ratio calculated based on figures in (i) part)
(` „000)
Divisions Foam Carpets Upholstery
Contribution margin ratio (480/1680)×100 (500/1200)×100 (440/1200)× 100
Percentage =28.57% =41.67% = 36.67%
Ranking III I II
Net contribution ratio (224/1680) × 100 (144/1200)×100 (96/1200)×100
Percentage = 13.33% = 12% =8%
Ranking I II III
Comments: The objection of Manager of Foam Division relating to presentation of
operating performance of three divisions for the year 2015-16 is correct. His division is
the best among all on the basis of net contribution over sales ratio though his
contribution margin ratio is the lowest.
(iii) The use of contribution margin ratio is relatively more realistic for assessing the
performance of various divisions as it considers variables and traceable costs only
and avoids common costs while finding out the profitability. This approach facilitates
right interpretation of information, besides pricing of internal transfers at market price
gives due credit to the specific profit centre, i.e., transferor.
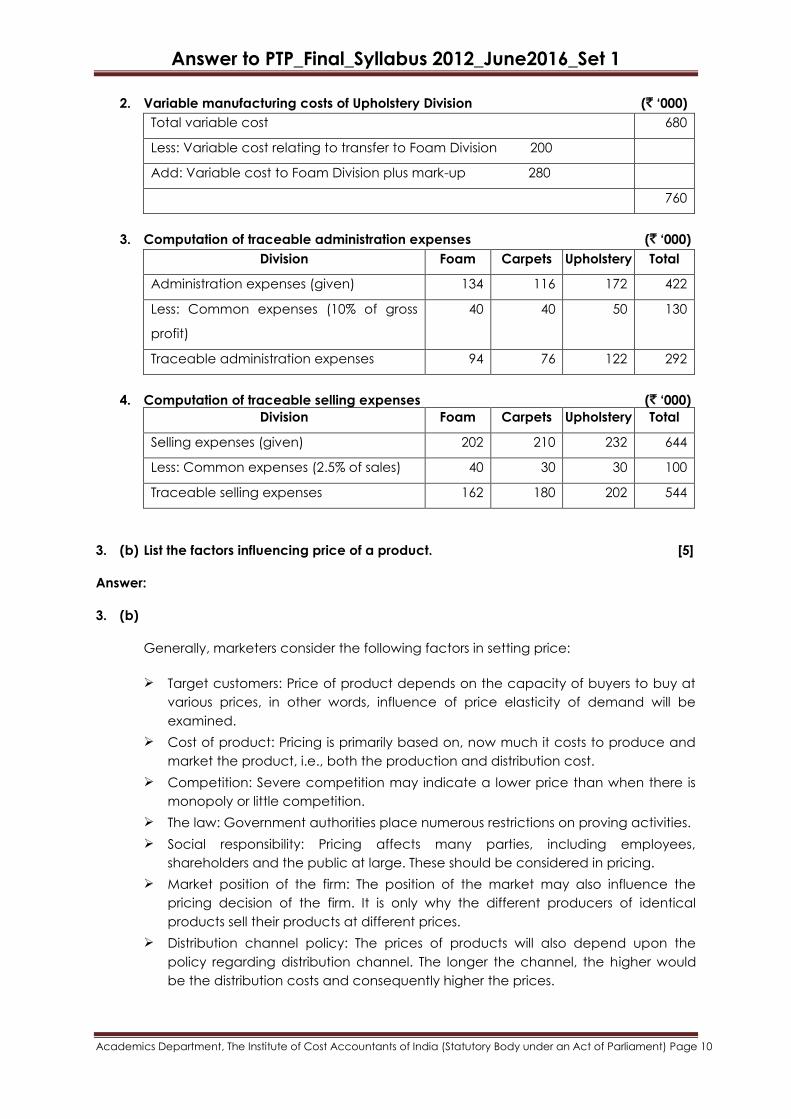
Notes:
1. Computation of sales revenue of Foam Division
(` „000)
Sales of Foam Division to outsider (i.e., ` 1600 – 200) 1400
Less: Variable manufacturing costs (i.e., 1200 – 200) 1000
Mark-up on outside sale 400
Percentage of mark-up on outside sale with reverence to variable cost:
(` 400÷1000) × 100
40%
Transfer price of Foam Division to Upholstery Division with 40% mark-up on
variable cost
280
Sale of Foam Division to outside customer 1400
Total 1680
This revised price has been worked out because it is given in the question that internal
transfer will be at market price, i.e., it will include same percentage of mark-up on
variable cost, which is included in sales to outside customers.
Answer to PTP_Final_Syllabus 2012_June2016_Set 1
Academics Department, The Institute of Cost Accountants of India (Statutory Body under an Act of Parliament) Page 10
2. Variable manufacturing costs of Upholstery Division (` „000)
Total variable cost 680
Less: Variable cost relating to transfer to Foam Division 200
Add: Variable cost to Foam Division plus mark-up 280
760
3. Computation of traceable administration expenses (` „000)
Division Foam Carpets Upholstery Total
Administration expenses (given) 134 116 172 422
Less: Common expenses (10% of gross
profit)
40 40 50 130
Traceable administration expenses 94 76 122 292
4. Computation of traceable selling expenses (` „000)
Division Foam Carpets Upholstery Total
Selling expenses (given) 202 210 232 644
Less: Common expenses (2.5% of sales) 40 30 30 100
Traceable selling expenses 162 180 202 544
3. (b) List the factors influencing price of a product. [5]
Answer:
3. (b)
Generally, marketers consider the following factors in setting price:
Target customers: Price of product depends on the capacity of buyers to buy at
various prices, in other words, influence of price elasticity of demand will be
examined.
Cost of product: Pricing is primarily based on, now much it costs to produce and
market the product, i.e., both the production and distribution cost.
Competition: Severe competition may indicate a lower price than when there is
monopoly or little competition.
The law: Government authorities place numerous restrictions on proving activities.
Social responsibility: Pricing affects many parties, including employees,
shareholders and the public at large. These should be considered in pricing.
Market position of the firm: The position of the market may also influence the
pricing decision of the firm. It is only why the different producers of identical
products sell their products at different prices.
Distribution channel policy: The prices of products will also depend upon the
policy regarding distribution channel. The longer the channel, the higher would
be the distribution costs and consequently higher the prices.
Answer to PTP_Final_Syllabus 2012_June2016_Set 1
Academics Department, The Institute of Cost Accountants of India (Statutory Body under an Act of Parliament) Page 11
Price elasticity of Demand: Price elasticity refers to consequential change in
demand due to change in price of the commodity. It is the relative
responsiveness to the changes in price. As there an inverse relationship between
price and demand for product, the demand will increase with fall in price.
Economic environment: In recession, prices are reduced to a sizeable extent to
maintain the level of turnover. On the other hand, prices are charged higher in
boom period to cover the increasing cost of production and distribution.
4. (a) In the HiChem Company, the Research and Development decisions are considered
to be at par with investment decisions. The company is faced with the problem of
deciding on a project that would place it better in relation to its competitors. Looking
to its technical ability, the company is not sure whether the project would ultimately
be successful.
The R and D manager feels that there is a sixty per cent chance that the project shall
be completed in the next two years. If the period of two years is exceeded, the firm
shall have to incur extra costs and it shall lose market opportunities. It is estimated
that a total of ` 1 lac will be spent in the two-yearly period on this research project
and the chances of its successful completion in this period are reckoned to be even.
If developed successfully, the likely pay-offs are : a 0.5 chance of ` 2,40,000, a 0.3
chance of ` 1,40,000, and a 0.2 chance of ` 40,000.
If, on the other hand, the project cannot be completed successfully in the span of two
years, an additional 25,000 rupees would be spent in the third year in the expectation
that it would be successfully completed in this year. The chances of a successful
completion in the third year are taken to be forty per cent and this would imply the
following returns: ` 2,00,000 with a 0.2 chance, ` 1,00,000 with a 0.4 chance, and `
40,000 with a 0.4 chance. In case the project is unsuccessful after 3 years as well, it is
thought proper to abandon it rather than carry it further on. Assume that in case the
project is to be abandoned at any stage, the success, if any, of the company's
competitors, in successfully developing such a project shall not be taken as a loss to
this company. Further assume that the time value of money is nil.
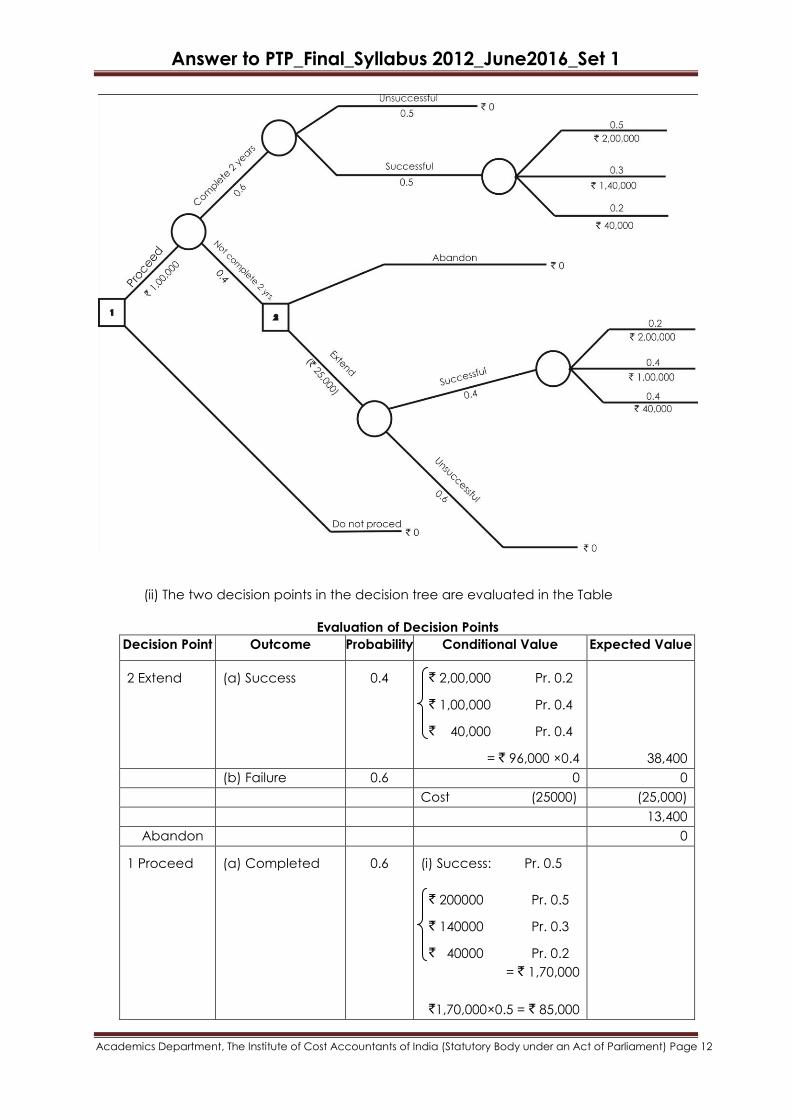
(i) Construct the decision tree facing the company.
(ii) Analyse the tree and determine the optimal decision. [4+6]
Answer:
4. (a)
(i) The decision tree corresponding to the given information is depicted in Figure
Answer to PTP_Final_Syllabus 2012_June2016_Set 1
Academics Department, The Institute of Cost Accountants of India (Statutory Body under an Act of Parliament) Page 12
(ii) The two decision points in the decision tree are evaluated in the Table
Evaluation of Decision Points
Decision Point Outcome Probability Conditional Value Expected Value
2 Extend (a) Success 0.4 ` 2,00,000 Pr. 0.2
` 1,00,000 Pr. 0.4
` 40,000 Pr. 0.4
= ` 96,000 ×0.4
38,400
(b) Failure 0.6 0 0
Cost (25000) (25,000)
13,400
Abandon 0
1 Proceed (a) Completed 0.6 (i) Success: Pr. 0.5
` 200000 Pr. 0.5
` 140000 Pr. 0.3
` 40000 Pr. 0.2
= ` 1,70,000
`1,70,000×0.5 = ` 85,000
Answer to PTP_Final_Syllabus 2012_June2016_Set 1
Academics Department, The Institute of Cost Accountants of India (Statutory Body under an Act of Parliament) Page 13
(ii) Failure: Pr. 0.5
` 0
` 0 × 0.5 = ` 0
` 85000 ×0.6 51,000
(b)Not Completed 0.4 ` 13400 5,360
Cost (100000) (1,00,000)
(43,640)
Do not proceed 0
Since the expected pay-off of the alternative „do not proceed‟ is greater than that of the
alternative „proceed‟, it is suggested that the company should not undertake the
project.
4. (b) Discuss the role of the Management Accountant competitive intelligence. [5]
Answer:
4. (b)
Competitive intelligence is a process of gathering data, creating information and
making decisions. Management Accountants are trained to gather data, assimilate
data into information and make decisions based upon information, frequently with
their management counterparts.
Competitive intelligence may also be viewed as a competitiveness audit, a concept
that Management Accountants are familiar with. Management Accountants' training
and experience make them well-suited to the requirements of the competitive
intelligence process.
Management Accountants may be actively involved in introducing a competitive
intelligence process in several ways:
identifying the need for a new or improved competitive intelligence process;
educating top management and other senior managers about that need;
developing a plan along with cross-functional team members for designing,
developing and implementing the new, improved competitive intelligence
practice, including its underlying architectures;
identifying the appropriate tools and techniques for conducting competitor
analysis;
providing financial input, analysis and expertise to the competitive intelligence
effort;
contributing to and using competitive intelligence in target costing;
ensuring that the competitive intelligence efforts are tied to the firm's goals,
strategies, objectives and internal processes, as appropriate; and,
Continually assessing the new, improved competitive intelligence process and its
implications for the organization and continually improving the process.
4. (c) Describe the difficulties in using and interpreting qualitative information. [5]
Answer:
4. (c)
Answer to PTP_Final_Syllabus 2012_June2016_Set 1
Academics Department, The Institute of Cost Accountants of India (Statutory Body under an Act of Parliament) Page 14
Particularly at higher levels of management, non-financial information is often not in
numerical terms, but qualitative, or soft, rather than quantitative. Qualitative
information often represents opinions of individuals and user groups. However there
are issues related to its use.
Decisions often appear to have been made on the basis of quantitative
information; however qualitative considerations often influence the final choice,
even if this is not explicit.
Conventional information systems are usually designed to carry quantitative
information and are sometimes less able to convey qualitative issues. However
the impact of a decreased output requirement on staff morale is something that
may be critical but it is not something that an information system would
automatically report.
In both decision making and control, managers should be aware that an
information system may provide a limited or distorted picture of what is actually
happening. In many situations, sensitivity has to be used in interpreting the output
of an information system.
Information in the form of opinions is difficult to measure and interpret. It also
requires more analysis.
Qualitative information may be incomplete.
Qualitative aspects are often interdependent and it can be difficult to separate
the impact of different factors.
Evaluating qualitative information is subjective, as it is not in terms of numbers -
there are no objective formulae as there are with financial measures.
The cost of collecting and improving qualitative information may be very high.
Difficulties in measurement and interpretation mean that qualitative factors are
often ignored.
Section – B
[Answers any 2 questions from this section]
5. Define the following terms in the context of Supply chain Management:
(a) Capacity Strategy,
(b) Lead Time / Cycle Time,
(c) Preventative Maintenance,
(d) Specifications. [2.5 x4]
Answer:
5. (a) Capacity Strategy:
This is one of the strategic choices that a firm must make as part of its manufacturing
strategy. There are three commonly recognized capacity strategies: lead, lag, and
tracking. A lead capacity strategy adds capacity in anticipation of increasing
demand. A lag strategy does not add capacity until the firm is operating at or
beyond full capacity. A tracking strategy adds capacity in small amounts to attempt
to respond to changing demand in the marketplace.
(b) Lead Time/Cycle Time:
Answer to PTP_Final_Syllabus 2012_June2016_Set 1
Academics Department, The Institute of Cost Accountants of India (Statutory Body under an Act of Parliament) Page 15
(1) A span of time required to perform a process (or series of operations).
(2) In a logistics context, the time between recognition of the need for an order and
the receipt of goods. Individual components of lead time can include order
preparation time, queue time, processing time, move or transportation time, and
receiving and inspection time.
(c) Preventive Maintenance
The activities, including adjustments, replacements, and basic cleanliness, that
forestall machine breakdowns. The purpose is to ensure that production quality is
maintained and that delivery schedules are met. In addition, a machine that is well
cared for will last longer and cause fewer problems.
(d) Specifications
Specifications are the most detailed method of describing requirements. Various
types of design specifications are the detailed descriptions of the materials, parts,
and components to be used in making a product. Hence, they are the descriptions
that tell the seller exactly what the buyer wants to purchase.
6. (a) State the Technological and Operational factors of E-commerce. [6]
Answer:
6. (a) Technical and Operational Factors of E-commerce
(i) Protocol (Standards) Making Process
A well-established telecommunications and Internet infrastructure provides many
of the necessary building blocks for development of a successful and vibrant e-
commerce marketplace.
(ii) Delivery Infrastructure
Successful e-commerce requires a reliable system to deliver goods to the business
or private customer.
(iii) Availability of Payment Mechanisms
Secure forms of payment in e-commerce transactions include credit cards,
checks, debit cards, wire transfer and cash on delivery.
(iv) General Business Laws
The application of general business laws to the Internet will serve to promote
consumer protection by insuring the average consumer that the Internet is not a
place where the consumer is a helpless victim.
(v) Public Attitude to E-commerce
The public attitude toward using e-commerce in daily life is a significant factor in
the success of ecommerce.
(vi) Business Attitude to E-commerce
The willingness of companies to move away from traditional ways of doing
business and develop methods and models that include e-commerce is essential.
6. (b) Discuss about the Data Availability. [4]
Answer:
6. (b) Data availability is a term used by some computer storage manufacturers and
storage service providers (SSPs) to describe products and services that ensure that
data continues to be available at a required level of performance in situations
ranging from normal through ―disastrous.‖ In general, data availability is achieved
Answer to PTP_Final_Syllabus 2012_June2016_Set 1
Academics Department, The Institute of Cost Accountants of India (Statutory Body under an Act of Parliament) Page 16
through redundancy involving where the data is stored and how it can be reached.
Some vendors describe the need to have a data center and a storage-centric rather
than a server-centric philosophy and environment.
In large enterprise computer systems, computers typically access data over high-
speed optical fiber connection to storage devices. Among the best-known systems
for access are ESCON and Fibre Channel. Storage devices often are controlled as a
Redundant Array of Independent Disks (RAID). Flexibility for adding and reconfiguring
a storage system as well as automatically switching to a backup or failover
environment is provided by a programmable or manually-controlled switch generally
known as a director.
Two increasingly popular approaches to providing data availability are the Storage
Area Network (SAN) and Network-Attached Storage (NAS). Data availability can be
measured in terms of how often the data is available (one vendor promises 99.999
per cent availability) and how much data can flow at a time (the same vendor
promises 3200 megabytes per second).
7. (a) Describe about the different types of On-Line Analytical Processing. [5]
Answer:
7. (a) Types
OLAP systems have been traditionally categorized using the following taxonomy.
Multidimensional
MOLAP is a ―multi-dimensional online analytical processing‖.„MOLAP„ is the „classic„
form of OLAP and is sometimes referred to as just OLAP. MOLAP stores this data in
optimized multidimensional array storage, rather than in a relational database.
Therefore it requires the pre-computation and storage of information in the cube - the
operation known as processing. MOLAP tools generally utilize a pre-calculated data
set referred to as a data cube. The data cube contains all the possible answers to a
given range of questions. MOLAP tools have a very fast response time and the ability
to quickly write back data into the data set.
Relational
ROLAP works directly with relational databases. The base data and the dimension
tables are stored as relational tables and new tables are created to hold the
aggregated information. Depends on a specialized schema design. This
methodology relies on manipulating the data stored in the relational database to
give the appearance of traditional OLAP„s slicing and dicing functionality. In essence,
each action of slicing and dicing is equivalent to adding a “WHERE” clause in the SQL
statement. ROLAP tools do not use pre-calculated data cubes but instead pose the
query to the standard relational database and its tables in order to bring back the
data required to answer the question. ROLAP tools feature the ability to ask any
question because the methodology does not limit to the contents of a cube. ROLAP
also has the ability to drill down to the lowest level of detail in the database.
Hybrid
There is no clear agreement across the industry as to what constitutes “Hybrid OLAP”,
except that a database will divide data between relational and specialized storage.
For example, for some vendors, a HOLAP database will use relational tables to hold
the larger quantities of detailed data, and use specialized storage for at least some
aspects of the smaller quantities of more-aggregate or less-detailed data. HOLAP
addresses the shortcomings of MOLAP and ROLAP by combining the capabilities of
Answer to PTP_Final_Syllabus 2012_June2016_Set 1
Academics Department, The Institute of Cost Accountants of India (Statutory Body under an Act of Parliament) Page 17
both approaches. HOLAP tools can utilize both pre-calculated cubes and relational
data sources.
Other types
The following acronyms are also sometimes used, although they are not as
widespread as the ones above:
WOLAP - Web-based OLAP
DOLAP - Desktop OLAP
RTOLAP - Real-Time OLAP
7. (b) Describe about the Long Short Term Memory of Recurrent Artificial Neural Networks
Topologies. [5]
Answer:
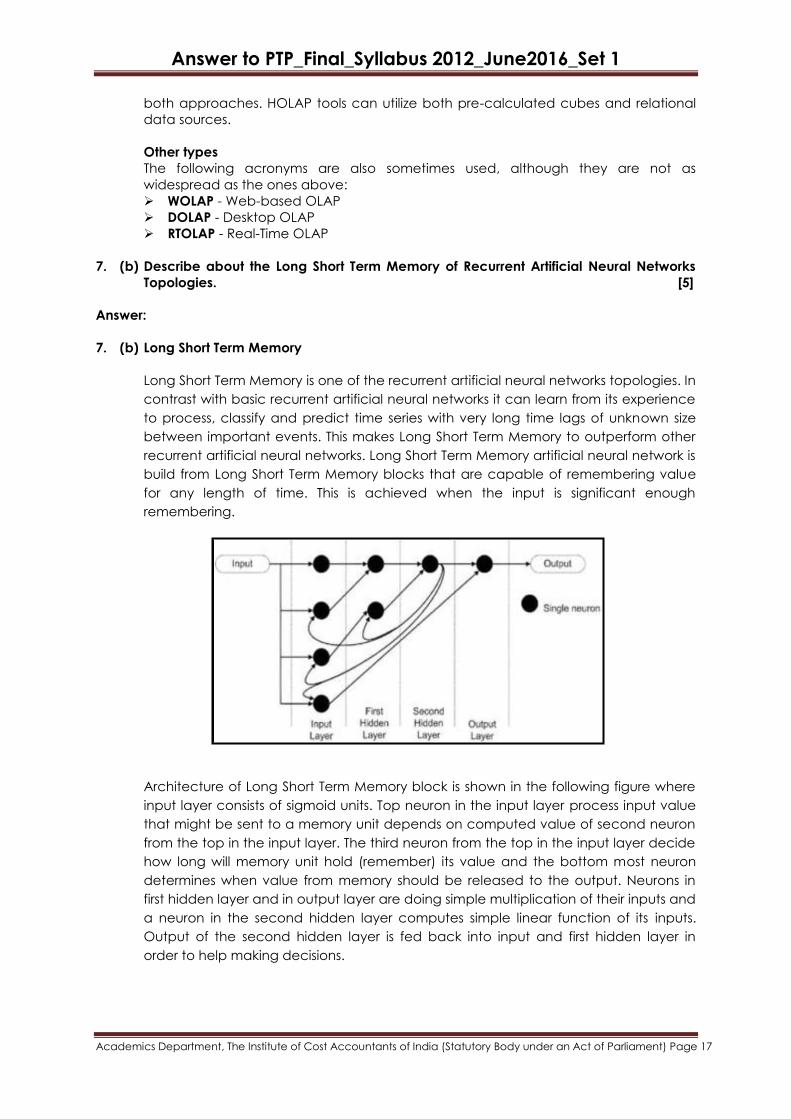
7. (b) Long Short Term Memory
Long Short Term Memory is one of the recurrent artificial neural networks topologies. In
contrast with basic recurrent artificial neural networks it can learn from its experience
to process, classify and predict time series with very long time lags of unknown size
between important events. This makes Long Short Term Memory to outperform other
recurrent artificial neural networks. Long Short Term Memory artificial neural network is
build from Long Short Term Memory blocks that are capable of remembering value
for any length of time. This is achieved when the input is significant enough
remembering.
Architecture of Long Short Term Memory block is shown in the following figure where
input layer consists of sigmoid units. Top neuron in the input layer process input value
that might be sent to a memory unit depends on computed value of second neuron
from the top in the input layer. The third neuron from the top in the input layer decide
how long will memory unit hold (remember) its value and the bottom most neuron
determines when value from memory should be released to the output. Neurons in
first hidden layer and in output layer are doing simple multiplication of their inputs and
a neuron in the second hidden layer computes simple linear function of its inputs.
Output of the second hidden layer is fed back into input and first hidden layer in
order to help making decisions.
Answer to PTP_Final_Syllabus 2012_June2016_Set 1
Academics Department, The Institute of Cost Accountants of India (Statutory Body under an Act of Parliament) Page 18
Section C
[Answer any 2 questions from this section]
8. Discuss about the Probability of Ruin and Risk Pooling. [6+4]
Answer:
8. Probability of Ruin:
Ruin theory also known as collective risk theory, was actually developed by the insurance
industry for studying the insurers vulnerability to insolvency using mathematical modelling.
It is based on the derivation of many ruin-related measures and quantities and
specifically includes the probability of ultimate ruin. This can be also related to the sphere
of applied probability as the techniques used in the ruin theory as fundamentally arising
out of stochastic processes. Many problems in ruin theory relate to real-life actuarial
studies but the mathematical aspects of ruin theory have really been of interest to
actuarial scientists and other business research people.
Normally an insurers‟ surplus has been computed as the net of two opposing cash flows,
namely, cash inflow of premium income collected continuously at the rate of c and the
cash outflow due to a series of insurance claims that are mutually independent and
identically distributed with a common distribution function P(y). The path of the series of
claims is assumed to respond to a Poisson process with intensity rate λ which would mean
that the number of claims received N(t) at a time frame of t is controlled by a Poisson
distribution with a mean λt. Therefore, the insurer‟s surplus at any time t is represented by
the following-formula:
N(t)
X(t) = X + Ct - Yii=0
Where, the business of the insurer starts with an initial level of surplus capital.
X(0) = x under probability measure as explained in the previous paragraph.
In short, this theory of the probability of ruin is applied in the case of risk of insolvency of a
company with diversified business activity. For the purpose of study, resources between
diversified activities are allowed to be transferred and are limited by costs of transaction.
Terminal insolvency happens when capital transfers between the business lines are not
able to compensate the negative positions. Actuarial calculations are involved in the
determination of ultimate ruin as discussed.
Risk Pooling
The concept of pooling risk is the process of identification of separate risks and put them
all together in a single basket, so that the monitoring, combining, integrating or
diversifying risk can be implemented.
Monitoring becomes easier when the specific agency put in charge knows that all the
risks have been identified and they are being monitored according to the system drawn
up to quantify the total risk through pooling and with a control figure i.e., plan the way to
monitor, actually monitor and then check whether there are variations from the
monitoring exercise and then act to correct the deviation. This correction act can be
combining risks or integrating risks or diversifying risks.
For example, whenever a project is put up. Transit Insurance is taken for transporting the
various plant and machinery from the manufacturers to the project site. The materials are
then received at the site and stored until erection. Storage Insurance will cover the risk
Answer to PTP_Final_Syllabus 2012_June2016_Set 1
Academics Department, The Institute of Cost Accountants of India (Statutory Body under an Act of Parliament) Page 19
during the storage. During erection of different plant & machinery, risks due to
mechanical, electrical etc., are covered through erection Insurance. The erected plant
& machinery is then tested and trial runs are taken for guarantee purposes on continuous
run. All these risks put together is called pooling. This single pooled policy has a risk value
and premium payable and the conditions attached thereto by both the insurer and the
insured to carry out those obligations are clearly spelled out in the policy documents.
9. (a) Describe the Performance-Related measures in the context of Corporate Risk
Management. [6]
Answer:
9. (a) Performance - Related measures in the context of Corporate Risk Management are
those which concentrate on the mid-region of the probability distribution, i.e., the
region near the 'mean' and are relevant for determination of the volatility around
expected results.
The following are some of the Performance - related measures in the context of
Corporate Risk Management.
Return on Equity - Net Income divided by Net Worth. Operating Earnings - Net Income from continuing operations, excluding realized
investment gains. Earnings before Interest - Dividends, Taxes, Depreciation and Amortization
(EBITDA). A form of cash flow measure for evaluating the operating performance
of companies with high levels of debt. Cash Flow Return on Investment (CFROI) - EBITDA divided by tangible assets. Weighted Average Cost of Capital (WACC) - The sum of the required market
returns of each component of corporate capitalization, weighted by that
component's share of the total capitalization. Economic Value Added (EVA) - A corporate performance measure that stresses
the ability to achieve above the firm's cost of capital.
9. (b) Explain about the Exchange Rate Risk and Liquidity Risk. [2+2]
Answer:
9. (b) Exchange Rate Risk:
Exchange Rate Risk Management through asset-liability management: At a particular
exchange rate assets and liabilities of a financial institution match exactly. As the
exchange rate fluctuates this balance gets disturbed. A simple solution to correct this
risk is to match assets and liabilities of the same currency. Many financial institutions
do not have foreign exchange exposure as all their assets and liabilities are in rupee
currency. The risk of foreign exchange borrowings of these institutions are passed on
to the lenders through dollar denominator loans. The uncovered loans are hedged at
the time of contracting them through forward covers for the entire amount.
Liquidity Risk:
It is that portion of an asset‟s total variability of return which results from price
discounts given or sales commissions paid in order to sell the asset without delay. It is a
situation wherein it may not be possible to sell the asset. Assets are disposed off at
great inconvenience and cost in terms of money and time. Any asset that can be
bought or sold quickly is said to be liquid. Failure to realize with minimum discount to
its value of an asset is called liquidity risk.
Answer to PTP_Final_Syllabus 2012_June2016_Set 1
Academics Department, The Institute of Cost Accountants of India (Statutory Body under an Act of Parliament) Page 20
10. Discuss Altman‟s Model and Explain the Five Z – Score Constituent Ratios. [10]
Answer:
10. The Altman Model: Z-Score
The Z-Score model is a quantitative model developed by Edward Altman in 1968, to
predict bankruptcy or financial distress of a business. The Z-score is a multi variate formula
that measures the financial health of a company and predicts the probability of
bankruptcy within 2 years. This model involves the use of a specified set of financial ratios
and a statistical method known as a Multiple Discriminant Analysis (MDA). The real world
application of the Altman score successfully predicted 72% of bankruptcies two years
prior to their failure.
The model of Altman is based on a linear analysis in which five measures are objectively
weighted and summed to arrive at an overall score that then becomes the basis for
classification of companies into one of the two a priori groupings that is bankrupt or non-
bankrupt. These five indicators were then used to derive a Z-Score. These ratios can be
obtained from corporations‟ financial statements.
The Five Z-Score Constituent Ratios are:
Working Capital/Total Assets (WC/TA):- a firm with negative working capital is likely to
experience problems meeting its short-term obligations.
Retained Earnings/Total Assets: - Companies with this ratio high probably have a
history of profitability and the ability to stand up to a bad year of losses.
Earnings before Interest & Tax/ Total Assets: - An effective way of assessing a firm‟s
ability to profit from its assets before things like interest and tax are deducted.
Market Value of Equity/ Total Liabilities: - A ratio that shows, if a firm were to become
insolvent, how much the company market value would declines before liabilities
exceed assets.
Sales/Total Assets: - A measure of how management handles competition and how
efficiently the firm uses assets to generate sales.
Based on the Multiple Discriminant Analysis, the general model can be described in the
following form:
Z=1.2WC/TA + 1.4 RE/TE + 3.3 EBIT/TA + 0.6 MVE/TL + 1.0 SL/TA.