Embed Size (px)
Citation preview
Partnership Overview
AUGUST 2018

Forward-Looking Statements
This presentation contains forward-looking statements. All statements, other than statements of historical facts, included in this presentation that address
activities, events or developments that Antero Midstream Partners LP, and its subsidiaries (collectively, the ―Partnership‖) or Antero Midstream GP LP and
its subsidiaries other than the Partnership (collectively, ―AMGP‖) as applicable expect, believe or anticipate will or may occur in the future are forward-
looking statements. The words ―believe,‖ ―expect,‖ ―anticipate,‖ ―plan,‖ ―intend,‖ ―estimate,‖ ―project,‖ ―foresee,‖ ―should,‖ ―would,‖ ―could,‖ or other similar
expressions are intended to identify forward-looking statements. However, the absence of these words does not mean that the statements are not forward-
looking. Without limiting the generality of the foregoing, forward-looking statements contained in this presentation specifically include expectations of plans,
strategies, objectives, and anticipated financial and operating results, the Partnership and Antero Resources Corporation (―Antero Resources‖). These
statements are based on certain assumptions made, the Partnership and Antero Resources based on management’s experience and perception of
historical trends, current conditions, anticipated future developments and other factors believed to be appropriate.
The Partnership cautions you that these forward-looking statements are subject to risks and uncertainties that may cause these statements to be
inaccurate, and readers are cautioned not to place undue reliance on such statements. These risks include, but are not limited to, Antero Resources’
expected future growth, Antero Resources’ ability to meet its drilling and development plan, commodity price volatility, inflation, environmental risks, drilling
and completion and other operating risks, regulatory changes, the uncertainty inherent in projecting future rates of production, cash flow and access to
capital, the timing of development expenditures, and the other risks discussed or referenced under the heading ―Item 1A. Risk Factors‖ in the Partnership’s
Annual Report on Form 10-K for the year ended December 31, 2017 and in the Partnership’s subsequent filings with the SEC.
The Partnership’s ability to make future distributions is substantially dependent upon the development and drilling plan of Antero Resources, which itself is
substantially dependent upon the review and approval by the board of directors of Antero Resources of its capital budget on an annual basis. In connection
with the review and approval of the annual capital budget by the board of directors of Antero Resources, the board of directors will take into consideration
many factors, including expected commodity prices and the existing contractual obligations and capital resources and liquidity of Antero Resources at the
time.
Any forward-looking statement speaks only as of the date on which such statement is made, and neither AMGP or the Partnership undertakes no obligation
to correct or update any forward-looking statement, whether as a result of new information, future events or otherwise, except as required by applicable law.
This presentation includes certain financial measures that are not calculated in accordance with U.S. generally accepted accounting principles (―GAAP‖).
These measures include (i) Adjusted EBITDA, (ii) Distributable Cash Flow and (iii) Free Cash Flow. Please see the appendix for the definition of each of
these measures as well as certain additional information regarding these measures, including the most comparable financial measures calculated in
accordance with GAAP.
2
Antero Midstream Partners LP is denoted as ―AM‖, Antero Midstream GP LP is denoted as ―AMGP‖ and Antero Resources
Corporation is denoted as ―AR‖ in many places throughout the presentation, which are their respective New York Stock
Exchange ticker symbols.
ANTERO MIDSTREAM │AUGUST 2018 PRESENTATION
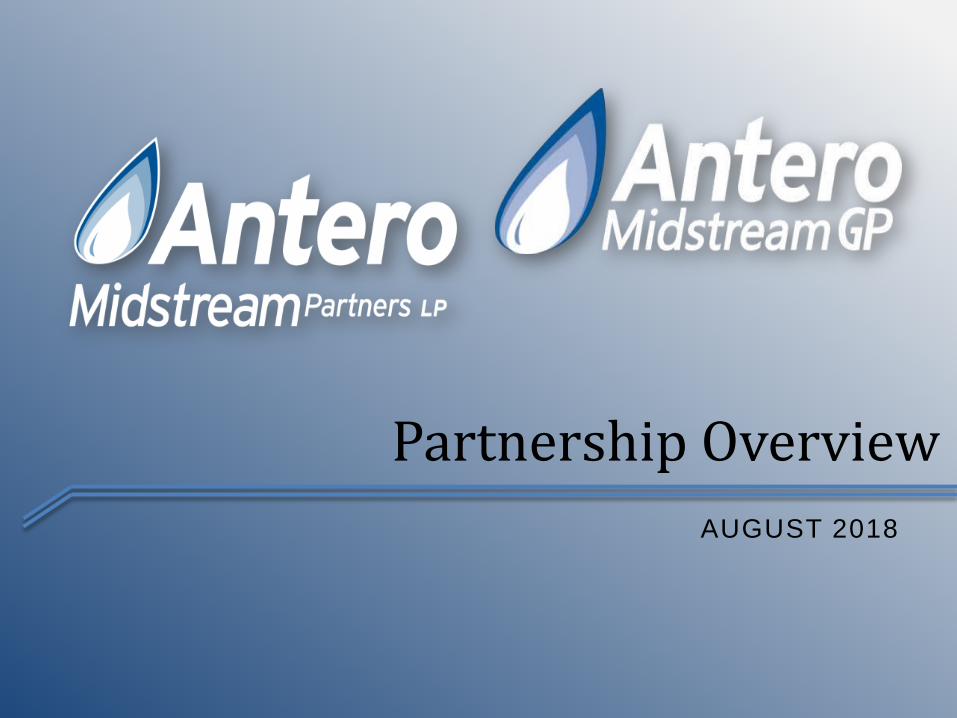
Antero Midstream At A Glance
3
Market Cap……………….......
Enterprise Value….........…….
LTM Adjusted EBITDA(1)……..
% Gathering/Compression…
% Water…..…..…..…..……..
Net Debt/LTM EBITDA……....
Corporate Debt Rating……….
$5.5B
$6.9B
$619 MM
65%
35%
2.3x
Ba2 / BB+ /BBB-
Note: Equity market data as of 6/30/2018. Balance sheet data as of 6/30/2018.
1. LTM Adjusted EBITDA as of 6/30/18. Adjusted EBITDA is a non-GAAP measure. For additional information regarding this measure, please see “Antero Midstream Non-GAAP Measures” in the Appendix.
ANTERO MIDSTREAM │ AUGUST 2018 PRESENTATION
AM Highlights Antero Midstream Marcellus Assets
Compressor Station: In Service
Antero Clearwater Facility
Processing Facility
Compressor Station: 2018
Gathering Pipeline Fresh Water Pipeline Stonewall Pipeline
Sherwood Processing
Facility – 1.8 Bcf/d
Existing Capacity
Antero Clearwater
Treatment Facility
60,000 Bbl/d Capacity Stonewall
JV Pipeline
AMGP Highlights
Market Cap……………….......
Net Debt/LTM EBITDA...…….
$3.5B
–
Antero Midstream Utica Assets
New Smithburg JV
Processing Facility –
Civil Work Under Way

$41 $66
$215
$404
$529
$705-755
$0
$100
$200
$300
$400
$500
$600
$700
$800
2013A 2014A 2015A 2016A 2017A 2018E
AM
Ad
jus
ted
EB
ITD
A (
$M
M)
2013 2014 2015 2016 2017 2018+
Antero Midstream Momentum/Value Chain Evolution
4
Gathering and Compression
AM IPO
AM commences gathering
and compression services
in the Marcellus and Utica
AM completes IPO for
gathering and
compression business
Fresh Water Delivery AM acquires water
business from AR for $1.15
Billion including the planned
Clearwater Facility
Regional Gathering AM acquires 15% interest
in Stonewall Regional
Gathering Pipeline
Processing and Fractionation AM/MPLX form 50/50
processing & fractionation JV
with $800MM net investment
by AM over 5 years
Long Haul Pipelines? NGL Pipelines & Storage?
Downstream Assets?
Advanced Wastewater Treatment Antero Clearwater Facility
operations commence
AMGP IPO AMGP completes IPO
(1) Bar represents midpoint of 2018 guidance of $705MM to $755MM.
(1)
ANTERO MIDSTREAM │AUGUST 2018 PRESENTATION

$3.36
$2.97
$2.07 $2.06
$1.61 $1.86
$-
$0.50
$1.00
$1.50
$2.00
$2.50
$3.00
$3.50
$4.00
2013 2014 2015 2016 2017 1H 2018
AR Peer 1 Peer 2 Peer 4 Peer 5 Peer 3
EBITDAX Margin
($/Mcfe)
5 ANTERO MIDSTREAM │AUGUST 2018 PRESENTATION
Driven by Resilient Sponsor Model
On a Stand-Alone EBITDAX Margin Basis, Antero has Consistently Outperformed its Appalachian Peers Through Up and Down Commodity Cycles
Antero’s integrated strategy has positioned Antero as a leader in EBITDAX margin for over five
years→ Long-term hedges and FT, liquids exposure and ownership in midstream buildout
Source: SEC filings and company press releases. AR 2017 margins exclude $0.10/Mcfe negative impact from WGL and SJR natural gas contract disputes. Peers include CNX, COG, EQT, RRC & SWN.
(1) AR and EQT EBITDAX include distributions from midstream ownership. Cash costs for AR and EQT represent stand-alone GPT, production taxes, LOE and cash G&A. Post-hedge and post
net marketing expense where applicable.
WTI Price
($/Bbl) WTI Oil Price ($/Bbl)
$0
$20
$40
$60
$80
$100
$120
EBITDAX Margin vs WTI Oil Price

High Growth Midstream Throughput
6
498
1,016
1,403
1,660
1,981
-
500
1,000
1,500
2,000
2,500
2014A 2015A 2016A 2017A 2Q 2018
Low Pressure Gathering (MMcf/d) Compression (MMcf/d)
Gas Processing (MMcf/d) Fresh Water Delivery (MBbl/d)
104
432
741
1,196
1,558
-
200
400
600
800
1,000
1,200
1,400
1,600
2014A 2015A 2016A 2017A 2Q 2018
216
368 425
571
0
100
200
300
400
500
600
1Q 2017 2Q 2017 3Q 2017 4Q 2017 2Q 2018
N/A
96 123
153
228
-
50
100
150
200
250
2014A 2015A 2016A 2017A 2Q 2018
AM high growth throughput driven by AR development plan and resource base
Note: CAGRs represent 2014-2017 growth period where applicable.
N/A
ANTERO MIDSTREAM │ AUGUST 2018 PRESENTATION
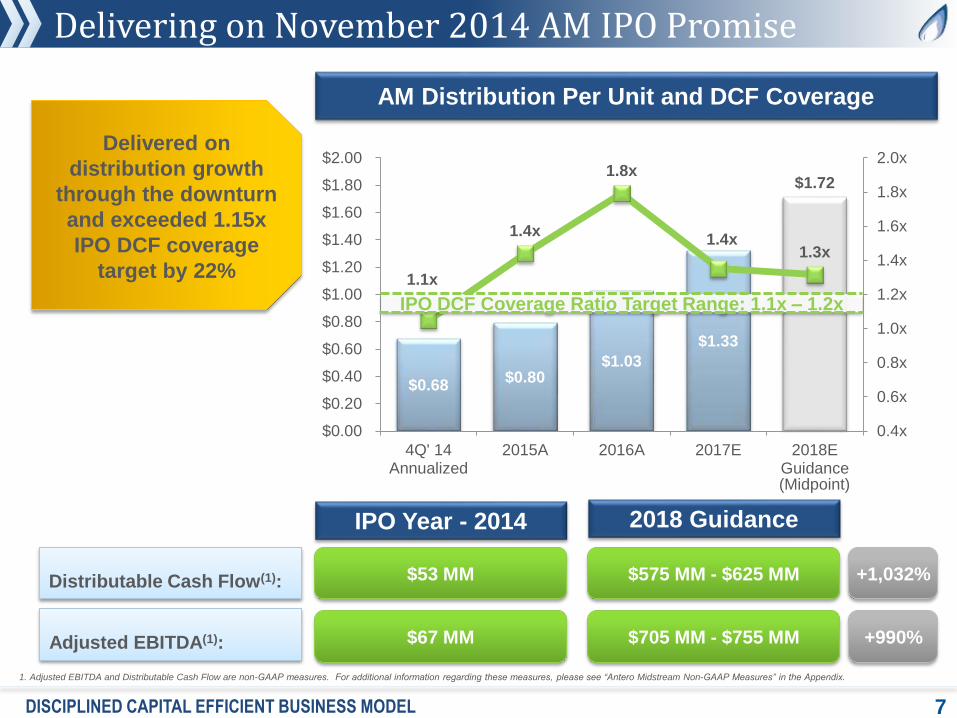
Delivering on November 2014 AM IPO Promise
7
Distributable Cash Flow(1): $53 MM $575 MM - $625 MM
$67 MM $705 MM - $755 MM Adjusted EBITDA(1):
+1,032%
+990%
$0.68 $0.80
$1.03
$1.33
$1.72
1.1x
1.4x
1.8x
1.4x 1.3x
0.4x
0.6x
0.8x
1.0x
1.2x
1.4x
1.6x
1.8x
2.0x
$0.00
$0.20
$0.40
$0.60
$0.80
$1.00
$1.20
$1.40
$1.60
$1.80
$2.00
4Q' 14Annualized
2015A 2016A 2017E 2018EGuidance
IPO DCF Coverage Ratio Target Range: 1.1x – 1.2x
AM Distribution Per Unit and DCF Coverage
Delivered on
distribution growth
through the downturn
and exceeded 1.15x
IPO DCF coverage
target by 22%
IPO Year - 2014 2018 Guidance
DISCIPLINED CAPITAL EFFICIENT BUSINESS MODEL
1. Adjusted EBITDA and Distributable Cash Flow are non-GAAP measures. For additional information regarding these measures, please see “Antero Midstream Non-GAAP Measures” in the Appendix.
(Midpoint)
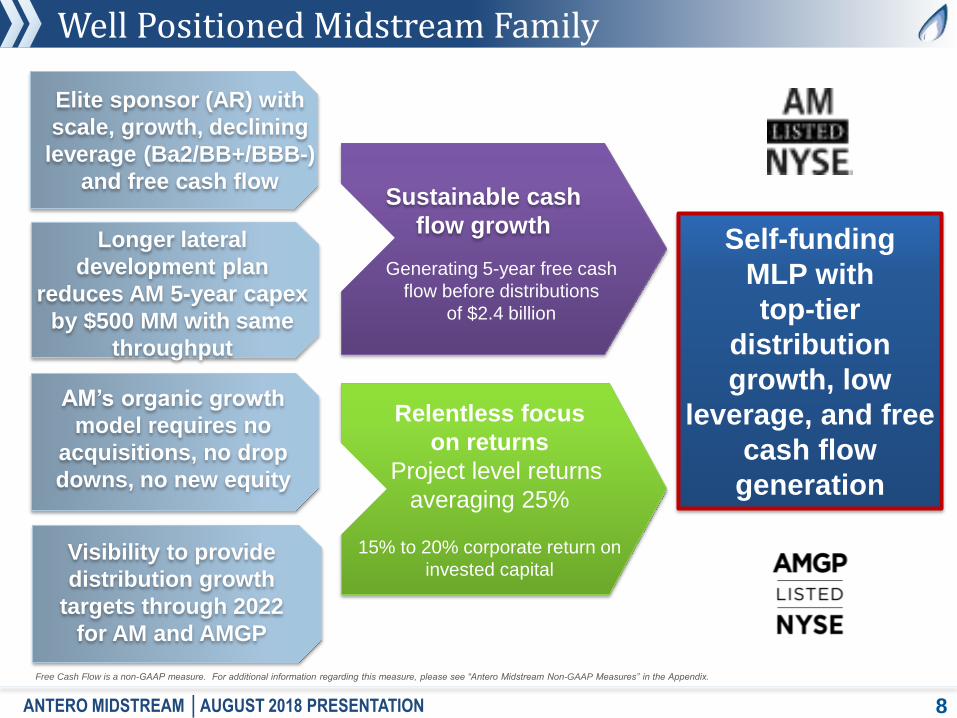
Well Positioned Midstream Family
8
Relentless focus
on returns
Project level returns
averaging 25%
15% to 20% corporate return on
invested capital
AM’s organic growth
model requires no
acquisitions, no drop
downs, no new equity
Visibility to provide
distribution growth
targets through 2022
for AM and AMGP
Sustainable cash
flow growth
Generating 5-year free cash
flow before distributions
of $2.4 billion
Self-funding
MLP with
top-tier
distribution
growth, low
leverage, and free
cash flow
generation
Free Cash Flow is a non-GAAP measure. For additional information regarding this measure, please see “Antero Midstream Non-GAAP Measures” in the Appendix.
ANTERO MIDSTREAM │AUGUST 2018 PRESENTATION
Longer lateral
development plan
reduces AM 5-year capex
by $500 MM with same
throughput
Elite sponsor (AR) with
scale, growth, declining
leverage (Ba2/BB+/BBB-)
and free cash flow

Strong, Growing & Supportive Sponsor
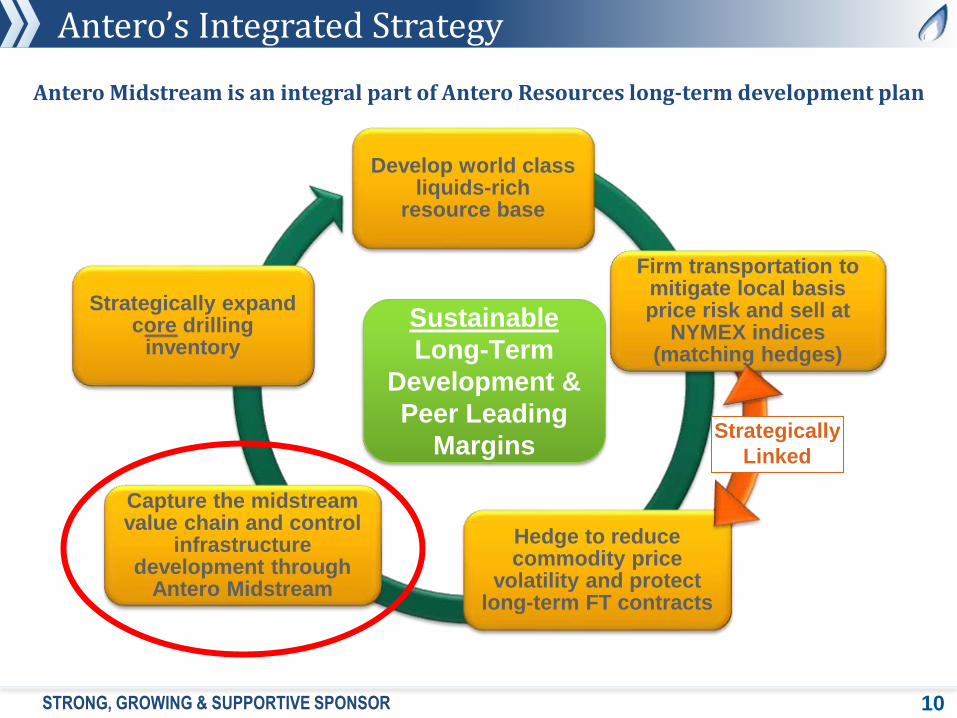
Antero’s Integrated Strategy
10
Develop world class liquids-rich
resource base
Hedge to reduce commodity price
volatility and protect long-term FT contracts
Firm transportation to mitigate local basis price risk and sell at
NYMEX indices (matching hedges)
Capture the midstream value chain and control
infrastructure development through
Antero Midstream
Strategically expand core drilling
inventory
Sustainable
Long-Term
Development &
Peer Leading
Margins Strategically
Linked
Antero Midstream is an integral part of Antero Resources long-term development plan
STRONG, GROWING & SUPPORTIVE SPONSOR

Largest Core Liquids-Rich Inventory in Appalachia
11
40% of Core Undrilled Liquids-Rich Locations are Held by Antero
Core Liquids-Rich Appalachia
Undrilled Locations(1)
AR 40%
A 13%
C 13%
K 7%
D 7%
I 7%
B 5%
H 3%
F 3%
J 2%
Note: Core outlines are based upon Antero geologic interpretation, well control, drilling activity, well economics and peer acreage positions; undrilled location count net of acreage allocated to publicly disclosed joint ventures.
Rig information per RigData as of 5/18/2018.
(1) Peers include Ascent, CHK, CNX, COG, CVX, EQT, GPOR, HG, RRC and SWN.
36 SW Marcellus Rigs
27 Utica
Rigs
13 NE Marcellus Rigs
76 Total Rigs
2,234
Locations
ANTERO MIDSTREAM │INTEGRATED STRATEGY, STRONG GROWING & SUPPORTIVE SPONSOR

Largest Undrilled Core Drilling Inventory
3,295
2,333
1,930
1,259
720 714 663 588 583 556 544
-
500
1,000
1,500
2,000
2,500
3,000
3,500
4,000
AR A B C D E F G H I J
Und
rille
d L
oca
tio
ns
Marcellus & Utica Liquids Rich Locations SW Marcellus & Utica Dry Locations NE Pennsylvania Dry Locations
10,848’ 9,563’ 6,775’ 7,723’ 6,040’ 9,583’ 8,905’ 9,398’ 8,396’ 7,731’ 8,639’
Antero Holds 40% of Core
Undrilled Liquids-Rich Locations
Largest Inventory in Appalachia
(1) Peers include Ascent, CHK, CNX, COG, CVX, EQT, GPOR, HG, RRC and SWN. Based on Antero analysis of undeveloped acreage in the core of the Marcellus and Utica plays.
Who Can Consistently Drill
Long Laterals?
Who Has the
Running Room?
Undrilled Core Marcellus & Utica Locations(1)
Lateral Length:
ANTERO MIDSTREAM │INTEGRATED STRATEGY, STRONG GROWING & SUPPORTIVE SPONSOR 12

Long Lateral Development Plan
59% of Inventory Now
≥ 10,000’ Lateral Length 5-Year Plan Averages 11,500’
Average Lateral Length
per Completed Well Core Inventory by Lateral Length
10,800’ Average Inventory
Lateral Length
12,700
0
2,000
4,000
6,000
8,000
10,000
12,000
14,000
2018 2019 2020 2021 2022
145 155 160 165 165 Wells
Completed(1)
498
1,450
0
200
400
600
800
1,000
1,200
1,400
1,600
<6,000' 6,000' -8,000'
8,000' -10,000'
10,000' -12,000'
≥12,000'
Fee
t
(Num
be
r o
f lo
ca
tio
ns)
(1) Wells completed reflects midpoint of targeted completions per year.
13 ANTERO MIDSTREAM │INTEGRATED STRATEGY, STRONG GROWING & SUPPORTIVE SPONSOR

AR is Currently The Top NGL Producer in the U.S.
14
Top U.S. NGL Producers – 2Q18 (MBbl/d)(1)
….Brings AM a
“seat at the table”
for downstream
liquids projects as
evidenced by the
processing &
fractionation JV
AR’s significant
production and
underlying liquids-
rich resource base
107
45
55
65
75
85
95
105
115
AR DVN RRC EOG APC COP PXD NBL OXY CHK
MB
bl/
d
2Q18 Daily NGL Production Including Recovered Ethane
ANTERO MIDSTREAM │INTEGRATED STRATEGY, STRONG GROWING & SUPPORTIVE SPONSOR
(1) EOG, NBL, OXY and PXD represent 1Q 2018 results.

Outstanding Corporate Level Well Economics
Well Economics
Support Investment
ROR Well in Excess of
Cost of Capital
Single Well Economics – Excluding Hedges
Note: Half cycle ROR burdened with 60% of AM fees to give credit for AM ownership/distributions and firm transportation variable fees. Full cycle ROR burdened with G&A, allocated land costs, 100% of AM fees and full FT
costs. See Appendix for detailed assumptions for full cycle and half cycle single well economics; WACC calculated using CAPM.
15 ANTERO MIDSTREAM │INTEGRATED STRATEGY, STRONG GROWING & SUPPORTIVE SPONSOR
33% - 37% Corporate
Level ROR
2018 & 2019 Full Cycle
Returns
Assumes 6/30/2018
Strip & Excludes
Hedging Impact 0%
20%
40%
60%
80%
100%
120%
2018 CompletionProgram
2019 CompletionProgram
Full Cycle ROR at $70/Bbl Half Cycle ROR at $70/Bbl
Full Cycle ROR Half Cycle ROR
AR WACC ≈ 8%
Strip
Pricing
AR Cash Cost Returns
93% to 102%
AR Corporate Level
Returns
33% to 37%
$70 Oil

($1,500)
($1,000)
($500)
$0
$500
$1,000
$1,500
2014A 2015A 2016A 2017A 2018Guidance
2019Target
2020Target
2021Target
2022Target
ARs Lower Capital & Higher Liquids → Free Cash Flow
$60 Oil / $2.85 Gas Case Stand-Alone E&P Free Cash Flow Outspend
Strip Pricing at 12/31/17 (Base Case)
D&C Capital Investment Fully Funded with Cash Flow
Note: See definitions for free cash flow and assumptions behind long-term targets in Appendix; free cash flow definition includes $200MM maintenance land spending, but excludes $300MM discretionary land spending.
Over $1.6B of Targeted Free Cash Flow from 2018 to 2022 at Strip Pricing
Including Maintenance Land Capital Expenditures
$50 Oil / $2.85 Gas Case
$2.8B
$1.0B
$1.6B
We Are
Here
5-Year
Cumulative
Free Cash
Flow
Stand-Alone Free Cash Flow:
16 ANTERO MIDSTREAM │INTEGRATED STRATEGY, STRONG GROWING & SUPPORTIVE SPONSOR

Click to edit Master title style Click to edit Master title style
3.9x
3.6x
2.8x 2.9x
0.0x
0.5x
1.0x
1.5x
2.0x
2.5x
3.0x
3.5x
4.0x
4.5x
5.0x
2014A 2015A 2016A 2017A 2018Guidance
2019Target
2020Target
2021Target
2022Target
Sta
nd
-Alo
ne
Fin
an
cia
l L
eve
rage
12/31/17 Strip Pricing (Base Case)
$60 Oil / $2.85 Gas
$50 Oil / $2.85 Gas
Cash Flow Growth → Deleveraging Profile
23% Debt-Adjusted
Production CAGR
Generates Free
Cash Flow
Balance Sheet
Deleveraging &
Optionality
Note: See Appendix for key definitions and assumptions. Stand-alone financial leverage is calculated by dividing year-end stand-alone debt by last twelve months stand-alone EBITDAX. Note all free cash flow after land
spending is assumed to be used for debt reduction.
Leverage targets inclusive of $500 MM of maintenance and discretionary land capex from 2018 - 2022
Deleveraging Supported By:
• 2.4 Tcfe Hedge Position
• 4.7 Bcf/d FT Portfolio
• $1.4B of Targeted AM
Distributions
2Q 2018
Leverage: 2.6x
17
S&P Upgrade to BB+
Moody’s Ba2 Outlook ―Positive‖
BBB- Rating Fitch Recently Initiated Ratings on
AR at Investment Grade
ANTERO MIDSTREAM │INTEGRATED STRATEGY, STRONG GROWING & SUPPORTIVE SPONSOR

Premier Integrated Appalachian Midstream Assets

Antero Midstream’s Organic Growth Strategy
ORGANIC PROJECT BACKLOG WITH PEER-LEADING RETURNS 19
Organically invest in midstream
infrastructure supporting AR
Generate attractive rates of return
protected by long-term fixed fee contracts
Non-speculative “just-in-time” capital
investment with high volumetric visibility
Generate free cash flow and maintain a strong and flexible balance
sheet
Expand and diversify operations across
midstream value chain
Organic Growth
Not Dependent on: Drop Downs Acquisitions Equity Markets
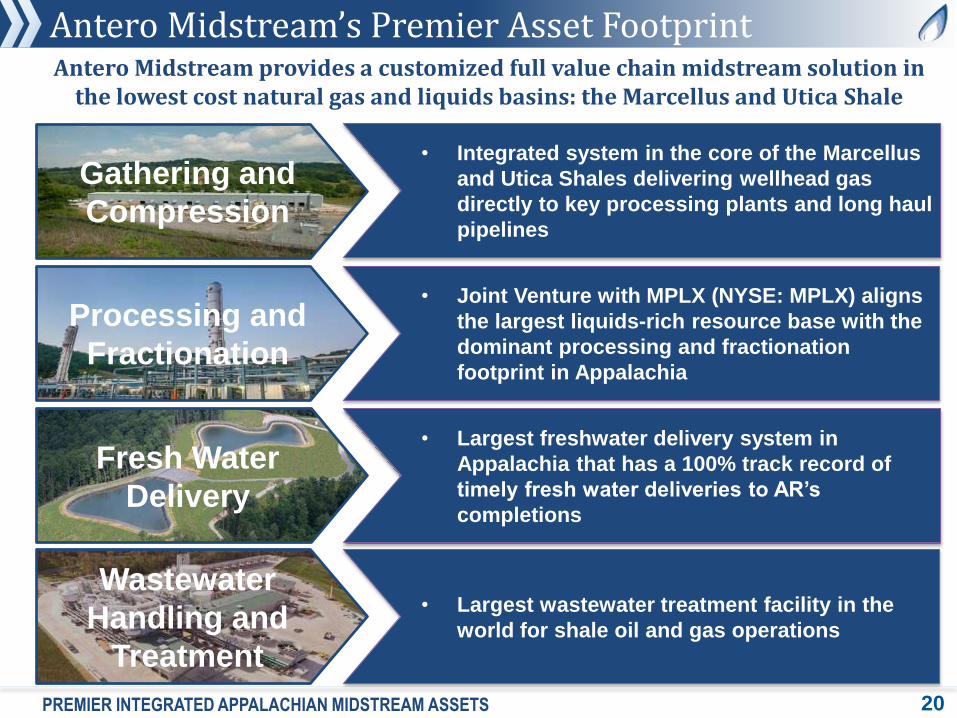
Antero Midstream’s Premier Asset Footprint
Gathering and
Compression
Fresh Water
Delivery
Wastewater
Handling and
Treatment
Processing and
Fractionation
Antero Midstream provides a customized full value chain midstream solution in the lowest cost natural gas and liquids basins: the Marcellus and Utica Shale
• Integrated system in the core of the Marcellus
and Utica Shales delivering wellhead gas
directly to key processing plants and long haul
pipelines
• Joint Venture with MPLX (NYSE: MPLX) aligns
the largest liquids-rich resource base with the
dominant processing and fractionation
footprint in Appalachia
• Largest freshwater delivery system in
Appalachia that has a 100% track record of
timely fresh water deliveries to AR’s
completions
• Largest wastewater treatment facility in the
world for shale oil and gas operations
PREMIER INTEGRATED APPALACHIAN MIDSTREAM ASSETS 20
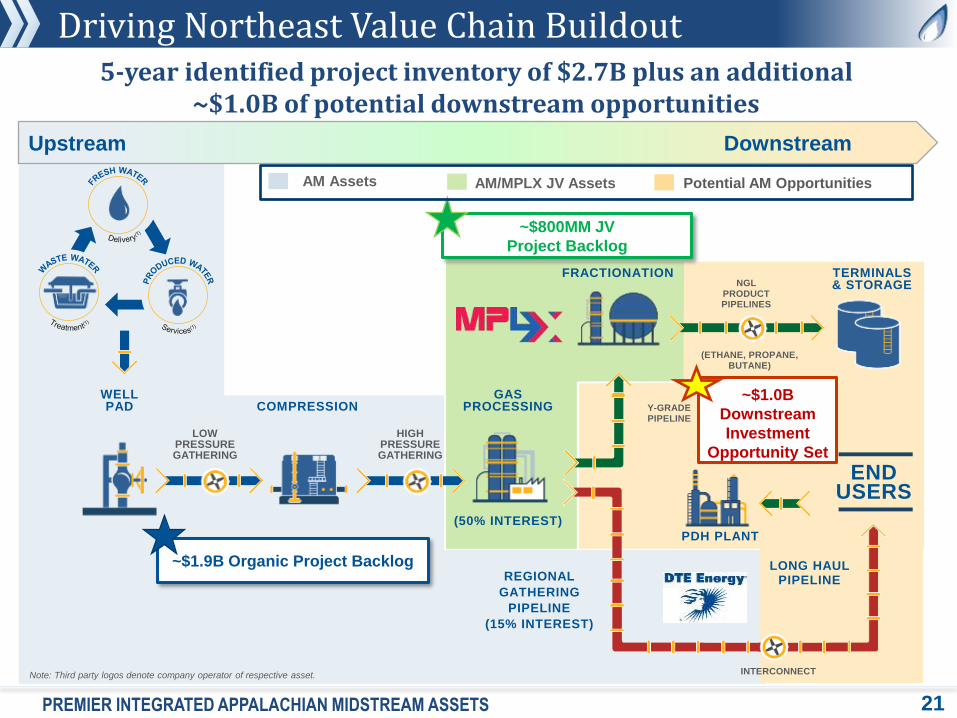
Driving Northeast Value Chain Buildout
21
~$1.9B Organic Project Backlog
~$800MM JV
Project Backlog
WELL PAD
LOW PRESSURE GATHERING
HIGH PRESSURE GATHERING
COMPRESSION
GAS PROCESSING
(50% INTEREST)
REGIONAL
GATHERING
PIPELINE
(15% INTEREST)
FRACTIONATION TERMINALS & STORAGE
Y-GRADE PIPELINE
(ETHANE, PROPANE, BUTANE)
NGL PRODUCT PIPELINES
LONG HAUL PIPELINE
INTERCONNECT
END USERS
PDH PLANT
~$1.0B
Downstream
Investment
Opportunity Set
Note: Third party logos denote company operator of respective asset.
AM Assets AM/MPLX JV Assets Potential AM Opportunities
Upstream Downstream
5-year identified project inventory of $2.7B plus an additional ~$1.0B of potential downstream opportunities
PREMIER INTEGRATED APPALACHIAN MIDSTREAM ASSETS

73%
92% 87%
0%10%20%30%40%50%60%70%80%90%100%
-
200
400
600
800
1,000
1,200
1,400
1,600
2015 2016 2017
Avg. Capacity Volumes % Utilization
Gathering and Compression Asset Overview
Asset Strategy
Historical Compression Utilization
• ―Just-in-time‖ capital investment philosophy
appropriately sizing infrastructure buildout
for visible production growth from AR
• Eliminate ―gas waiting on pipe‖
• Target high asset utilization rates and
continued focus on expense reduction
strategies
• 100% fixed fee revenues & MVC’s
Significant long-term volumetric visibility from AR supports efficient gathering and compression infrastructure buildout and attractive project returns
2018 & 2019 Gathering & Compression Projects
MMcf/d
Compressor Station Location
Capacity
(MMcf/d)
In-
Service
Madison Utica 200 1Q18
South Canton Marcellus 240 1Q18
Wick Expansion Marcellus 80 3Q18
East Mountain Marcellus 160 4Q18
Ferrell Marcellus 160 1Q19
E. Mountain Expansion Marcellus 80 3Q19
Ferrell Expansion Marcellus 80 3Q19
Morris Marcellus 160 4Q19
Total 1,160
PREMIER INTEGRATED APPALACHIAN MIDSTREAM ASSETS 22
Gathering Pipelines Miles
Size
(Inch)
In-
Service
Rich Gas ―West End Loop‖ 15 30 3Q18
East Mountain LP Trunkline 10 20 4Q18
Tyler/Wetzel Connector 15 30 3Q19
Tyler/Wetzel LP Gathering 15 20 Ongoing
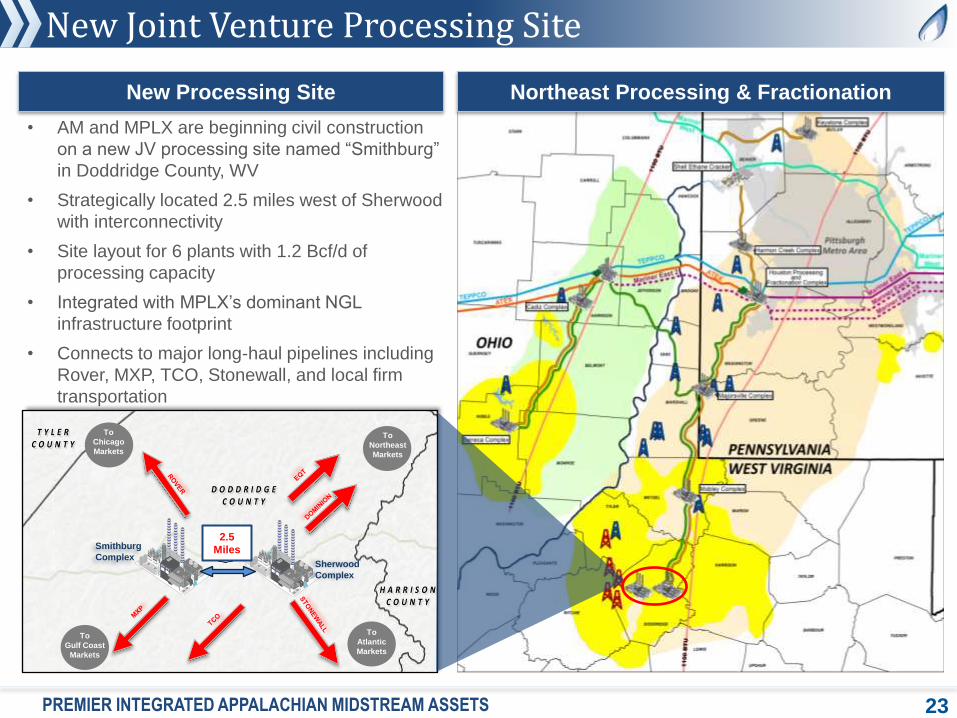
New Joint Venture Processing Site
23
D O D D R I D G ED O D D R I D G E
C O U N T YC O U N T Y
H A R R I S O NH A R R I S O N
C O U N T YC O U N T Y
T Y L E RT Y L E R
C O U N T YC O U N T Y
£¤50
To
Chicago
Markets
To
Northeast
Markets
To
Atlantic
Markets
To
Gulf Coast
Markets
Smithburg
Complex Sherwood
Complex
Northeast Processing & Fractionation New Processing Site
• AM and MPLX are beginning civil construction
on a new JV processing site named ―Smithburg‖
in Doddridge County, WV
• Strategically located 2.5 miles west of Sherwood
with interconnectivity
• Site layout for 6 plants with 1.2 Bcf/d of
processing capacity
• Integrated with MPLX’s dominant NGL
infrastructure footprint
• Connects to major long-haul pipelines including
Rover, MXP, TCO, Stonewall, and local firm
transportation
2.5
Miles
PREMIER INTEGRATED APPALACHIAN MIDSTREAM ASSETS
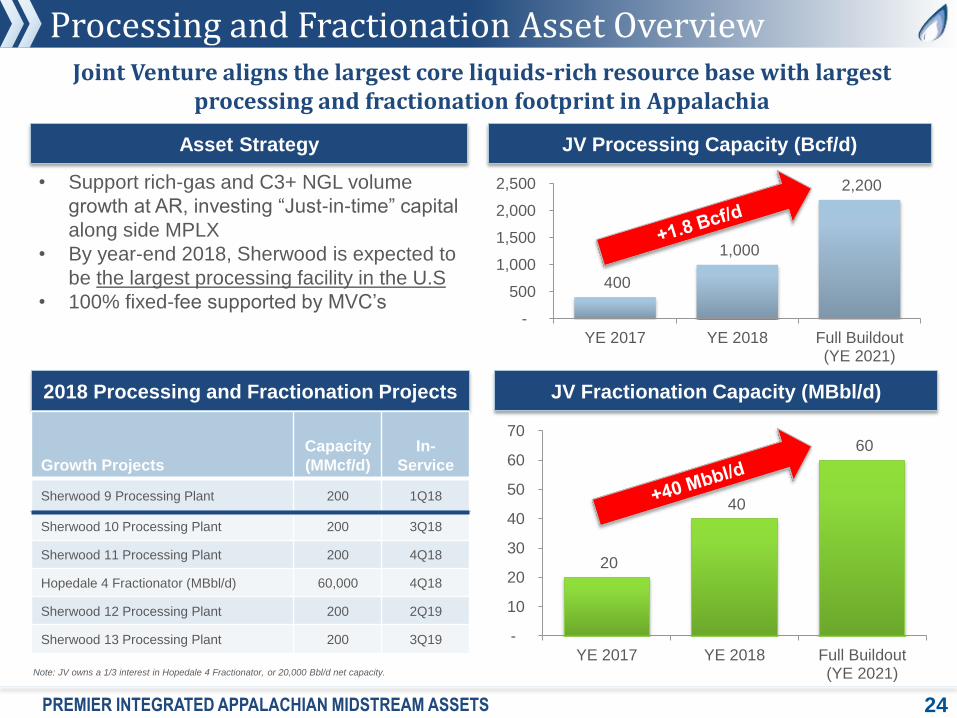
Processing and Fractionation Asset Overview
24
Asset Strategy
2018 Processing and Fractionation Projects
• Support rich-gas and C3+ NGL volume
growth at AR, investing ―Just-in-time‖ capital
along side MPLX
• By year-end 2018, Sherwood is expected to
be the largest processing facility in the U.S
• 100% fixed-fee supported by MVC’s
JV Processing Capacity (Bcf/d)
Joint Venture aligns the largest core liquids-rich resource base with largest processing and fractionation footprint in Appalachia
JV Fractionation Capacity (MBbl/d)
400
1,000
2,200
-
500
1,000
1,500
2,000
2,500
YE 2017 YE 2018 Full Buildout(YE 2021)
20
40
60
-
10
20
30
40
50
60
70
YE 2017 YE 2018 Full Buildout(YE 2021)
PREMIER INTEGRATED APPALACHIAN MIDSTREAM ASSETS
Growth Projects
Capacity
(MMcf/d)
In-
Service
Sherwood 9 Processing Plant 200 1Q18
Sherwood 10 Processing Plant 200 3Q18
Sherwood 11 Processing Plant 200 4Q18
Hopedale 4 Fractionator (MBbl/d) 60,000 4Q18
Sherwood 12 Processing Plant 200 2Q19
Sherwood 13 Processing Plant 200 3Q19
Note: JV owns a 1/3 interest in Hopedale 4 Fractionator, or 20,000 Bbl/d net capacity.

Largest Natural Gas Processors in the U.S.
25
Antero Midstream is a top 10 natural gas processor, with significant growth expected over the next 5 years supporting AR’s liquids-rich development
PREMIER INTEGRATED APPALACHIAN MIDSTREAM ASSETS
Top Natural Gas Processors in the U.S. – 1Q18 (MMcf/d Processed)
519
-
1,000
2,000
3,000
4,000
5,000
6,000
7,000
MPLX DCP EPD WPZ TRGP WES ENLK OKE ENBL AM CEQP HESM OMP
Overall Rank: #10
Northeast Rank: #2(1)
Source: Company filings, press releases and website presentations.
(1) Northeast ranking based on Northeast volumes only for CEQP, CNXM, MPLX, RMP and WPZ.
Northeast Peers
JV Full Buildout:
2.2 Bcf/d
R

Freshwater Delivery Asset Overview
26
Asset Strategy
Water Per Foot Used in Completions
Due to the reliability of AM’s buried fresh water pipeline system, AM has a 100% track record of timely fresh water deliveries to AR’s completions
2018 & 2019 Fresh Water Projects
33
41
45
34 37
44
25
30
35
40
45
50
2015A 2016A 2017A
Barr
els
of
Wa
ter
per
Fo
ot Marcellus Utica
•Provide timely service to allow AR to maintain its
development pace and flexibility
•Reduce footprint (eliminated >620,000 truck trips
and 42,000 tons of CO2 emissions in 2017 alone)
•100% fixed fee with MVC’s
•AM’s firm water service at the pad saves AR an
estimated $0.50 per barrel for fresh water
Growth Projects
Miles/
Capacity
In-
Service
Heaster to Pioneer Buried Line 4 miles 3Q18
Pioneer to Lancaster Buried Line 6 miles 3Q19
Ohio River to Pioneer Buried Line 10 miles 4Q19
Lancaster Fresh Water Impoundment 316,000
Bbls 3Q19
Ohio River Withdrawal Facility 80 Bbl/Min 4Q19
Tyler/Wetzel Surface Line Connects - Ongoing
PREMIER INTEGRATED APPALACHIAN MIDSTREAM ASSETS
Wells Serviced by Fresh Water System
124 131 142
150 160
150 160
170
160 170
160 170
180
0
50
100
150
200
250
2015A 2016A 2017A 2018E 2019E 2020E 2021E 2022E
Wells S
erv
iced
by
Fre
sh
wate
r S
yste
m
12,600 12,800 12,200 10,400 10,000
Average Lateral Length (Feet)
Wells Serviced by Freshwater System (Low End)
Wells Serviced by Freshwater System (High End)

Antero Clearwater Facility Asset Overview
27
Asset Strategy
Clearwater Facility Details
Midstream Services Provided
The Antero Clearwater Facility is the largest advanced wastewater treatment facility in the world for shale oil and gas operations
• Currently treating ~20-25 MBbl/d
• 60,000 Bbl/d of capacity
• $55 - $65MM of Adjusted EBITDA at 100%
utilization
• Marketable by-products used in oil and gas
operations
“Wastewater” (Produced &
Flowback)
Wastewater Treatment at
Clearwater
Pipeline to Fresh Water
System
•Veolia will build and operate, and Antero will
fund and own the Clearwater facility
•Treat and recycle AR produced and flowback
water and deliver it into fresh water system,
creating additional year-round water source for
completions
•Target third party business until AR volumes
utilize 100% of capacity
Treatment Capacity & Volumes
-
20,000
40,000
60,000
80,000
100,000
120,000Antero Clearwater Advanced Wastewater TreatmentCapacity (Bbl/d)
Produced/Flowback Volumes (Bbl/d)
Capacity for 3rd Party
Business
PREMIER INTEGRATED APPALACHIAN MIDSTREAM ASSETS
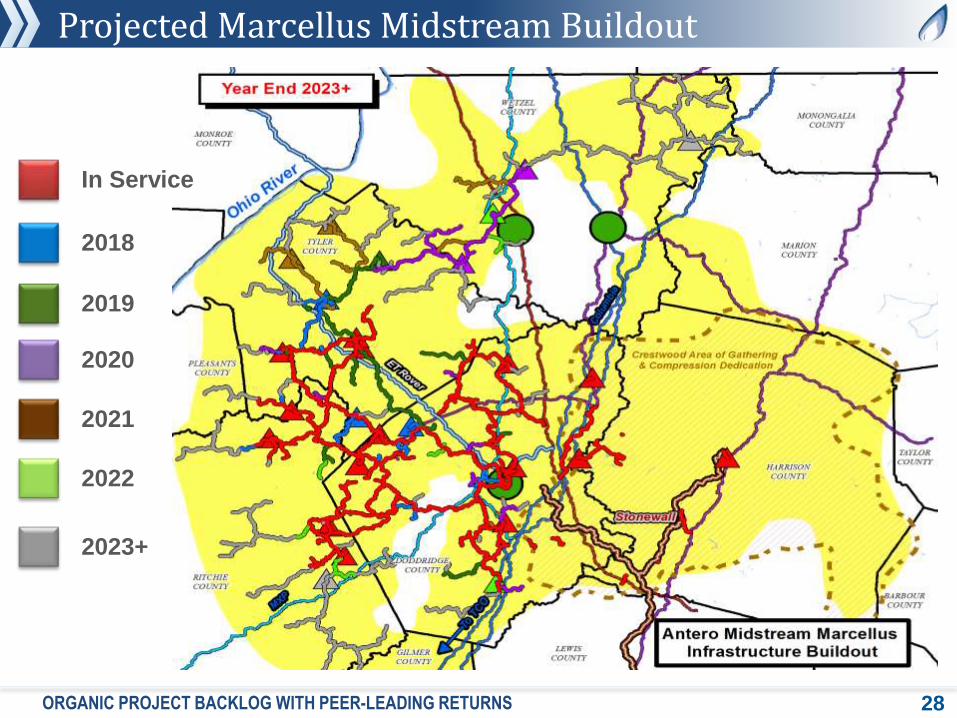
Projected Marcellus Midstream Buildout
28
2018
2019
2020
2021
2022
2023+
ORGANIC PROJECT BACKLOG WITH PEER-LEADING RETURNS
In Service
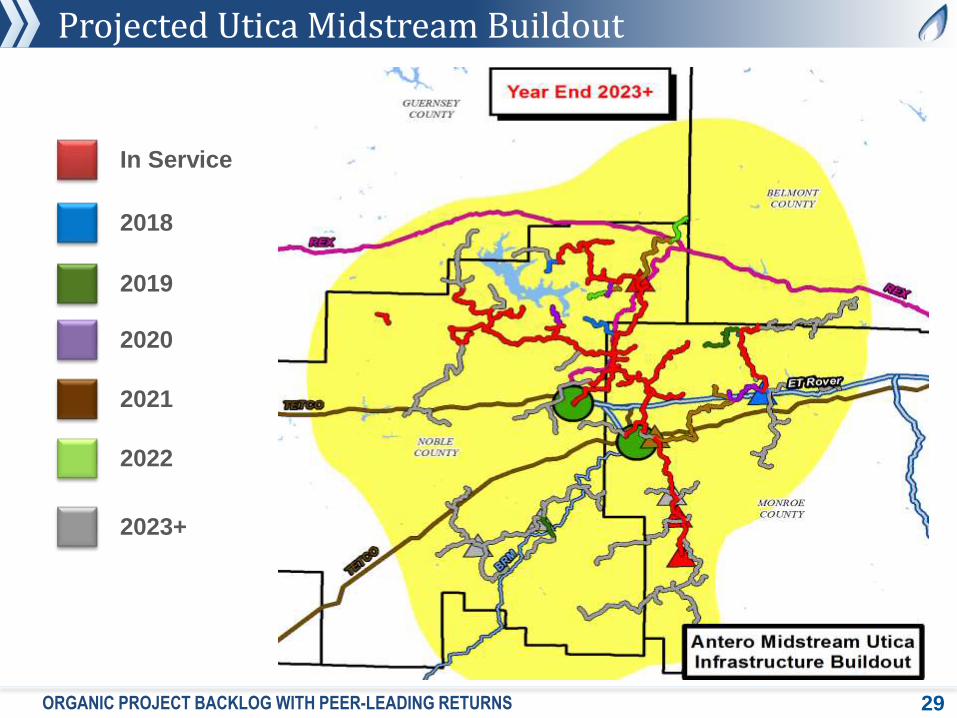
Projected Utica Midstream Buildout
29
In Service
2018
2019
2020
2021
2022
2023+
ORGANIC PROJECT BACKLOG WITH PEER-LEADING RETURNS

5-year Organic Project Backlog: 2018 - 2022
30
$2,250 83%
$450 17%
Marcellus
Ohio Utica
$475 17%
$775 29%
$325 12%
$325 12%
$800 30%
Compression
Processing &
Fractionation JV Low Pressure
Gathering
High Pressure
Gathering
Fresh Water
$2.7B Project Backlog – By Area $2.7B Project Backlog – By Function
5-year identified project inventory of $2.7B
“High-graded” organic
project backlog of $2.7B
from 2018 - 2022
Primary focus on rich
gas Marcellus
infrastructure
ORGANIC PROJECT BACKLOG WITH PEER-LEADING RETURNS
Note: Processing and fractionation JV includes $200MM of capital incremental to original $800MM investment for additional processing facilities constructed in the 5-year plan.

Organic Growth Drives Attractive Rates of Return
31
AM Organic EBITDA Buildout Multiples
6.9x
6.1x
4.5x 4.4x 4.3x
8.8x
0.0x
2.0x
4.0x
6.0x
8.0x
10.0x
12.0x
2014A 2015A 2016A 2017A 2018E DropDown
Drop Down
Median: 8.8x
AM Organic Investment
to EBITDA Multiple $3.1B invested
through 9/30/17 on
midstream
infrastructure
AM Builds at 3x
to 6x EBITDA vs.
Other MLPs that
Drop Down/Buy
at 8x to 12x+
EBITDA
See appendix for organic EBITDA buildout multiple calculation. Dropdown multiple based
on drop-down transactions from 2012 – 2017. per Wall Street research.
ORGANIC PROJECT BACKLOG WITH PEER-LEADING RETURNS
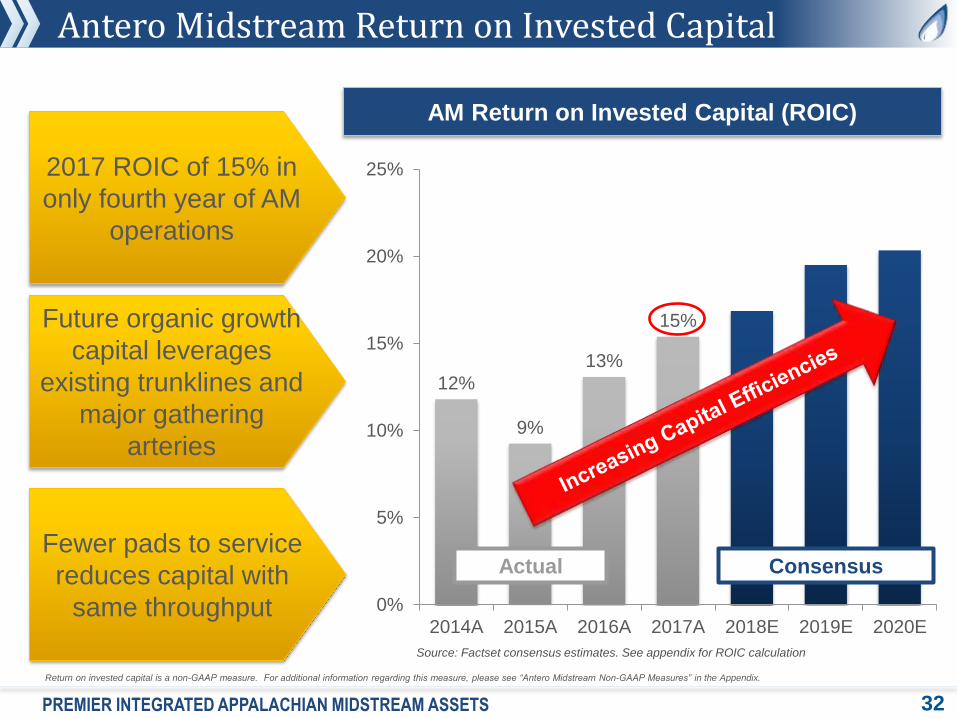
Antero Midstream Return on Invested Capital
32
AM Return on Invested Capital (ROIC)
2017 ROIC of 15% in
only fourth year of AM
operations
Future organic growth
capital leverages
existing trunklines and
major gathering
arteries
12%
9%
13%
15%
0%
5%
10%
15%
20%
25%
2014A 2015A 2016A 2017A 2018E 2019E 2020E
Actual Consensus
Source: Factset consensus estimates. See appendix for ROIC calculation
Fewer pads to service
reduces capital with
same throughput
Return on invested capital is a non-GAAP measure. For additional information regarding this measure, please see “Antero Midstream Non-GAAP Measures” in the Appendix.
PREMIER INTEGRATED APPALACHIAN MIDSTREAM ASSETS

Long-Term Distribution and Coverage Targets
33
$1.03 $1.33
$1.72
$2.21
$2.85
$3.42
$4.10 1.8x
1.4x 1.3x
0.0x
0.2x
0.4x
0.6x
0.8x
1.0x
1.2x
1.4x
1.6x
1.8x
2.0x
$0.00
$0.50
$1.00
$1.50
$2.00
$2.50
$3.00
$3.50
$4.00
$4.50
2016A 2017A 2018Guidance
2019Target
2020Target
2021Target
2022Target
DC
F C
ove
rag
e R
ati
o
Dis
trib
uti
on
Pe
r U
nit
Distribution Guidance
(Mid-point)
Long-Term Distribution Targets and DCF Coverage
Unchanged capital investment philosophy with disciplined financial policies result in ability to target peer-leading distribution growth through 2022
Distribution Target
(Mid-point) DCF Coverage Targets
Note: Implied yield based on AM unit price as of 6/30/18.
Implied Yield
9.7%
5.8%
AM: PEER LEADING DISTRIBUTION GROWTH AND COVERAGE

Financial Policy Overview
5-YEAR OUTLOOK: LEVERAGING EXISTING CORE ASSET BASE 34
Maintain conservative leverage profile between 2.0x – 2.5x
net debt to LTM Adjusted EBITDA
‒ With ability to flex up to 3.0x on a short-term basis for
accretive transactions
Target distribution coverage average of 1.25x through 2020
and >1.1x thereafter to preserve financial flexibility
‒ Organic growth will be the primary focus and 3rd party
business / acquisitions will be opportunistic and dependent
on Antero Midstream’s visibility of throughput volumes
Fund organic growth plan with cash flow and credit facility
borrowings
‒ Availability to utilize at-the-market equity issuance program
to fund accretive acquisitions and growth opportunities
Maintain sufficient liquidity position to fund organic growth
opportunities
Prudent
Leverage
Strong DCF
Coverage
Fund with
Cash Flow
Liquidity
AMGP Overview: Unmatched Yield Growth

AMGP Leads the Pack
36
AMGP is in it’s early
stage IDR growth
phase
AR’s visible and
de-risked
development plan
AM’s organic growth
strategy results in
peer-leading LP
distribution growth
Debt-free
unlevered
balance sheet
General Partner
with
unmatched
yield growth
100%
“Pure Play”
IDR Vehicle
AMGP: UNMATCHED YIELD GROWTH

Long-Term Distribution Targets
37
AMGP Long-Term Distribution Targets (Midpoint)
As a result of AM targeting 20% distribution growth in 2021 and 2022, AMGP is targeting distribution growth of 29% and 27% in 2021 and 2022
$0.54
$0.88
$1.34
$1.73
$2.20 64%
53%
29% 27%
0%
10%
20%
30%
40%
50%
60%
70%
$0.00
$0.50
$1.00
$1.50
$2.00
$2.50
2018Guidance
2019Target
2020Target
2021Target
2022Target
AMGP Distributions Per Share Year-over-Year Distribution Growth
163%
Note: Represents midpoint of target range. 2018 growth based on full year 2017 distribution of $0.205/share. Based on AMGP Share price of $18.86 as of 6/30/18.
2.8%
7.1%
AMGP: UNMATCHED YIELD GROWTH

Most Integrated Natural Gas and NGL Story in the U.S.
38
Multi-decade resource base and largest core drilling inventory in Appalachia
Long-term development plan anchored by firm transportation, hedge portfolio,
liquids exposure and midstream ownership
Attractive well and corporate level returns driven by low F&D costs and liquids uplift
Strong and improving balance sheet with free cash flow generation
World Class Operator in Appalachia
A Leading Northeast Infrastructure Provider
1
2
3
4
1
2
3
4
Organic ―just-in-time‖ investment strategy with
high visibility
Expanding operations across the midstream
value chain
Strong balance sheet & unmatched visibility
Best in class distribution growth and coverage
1
2
3
Unmatched yield growth
―Pure play‖ IDR vehicle
Debt-free balance sheet
Most Integrated Natural Gas And NGL Story in the U.S.
Appendix

Guidance Summary - 2018
40
Guidance
2018
Guidance
Net Income ($MM) $435 - $480
Adjusted EBITDA ($MM) $705 - $755
DCF ($MM) $575 - $625
Distribution Growth 28 – 30%
DCF Coverage 1.25x - 1.35x
Maintenance Capex ($MM) $65
Growth Capex ($MM) $585
Total Capex ($MM) $650
APPENDIX | 5-YEAR OUTLOOK: LEVERAGING EXISTING CORE ASSET BASE
Adjusted EBITDA and Distributable Cash Flow are non-GAAP measures. For additional information regarding these measures, please see “Antero Midstream Non-GAAP Measures” in the Appendix.

Capital and EBITDA Contribution - 2018
41
Capital Expenditures ($MM) Adjusted EBITDA ($MM)
$385 59% $50
8%
$215 33%
60% 33%
5% 2%
Processing &
Fractionation JV
Gathering &
Compression
Water
Gathering &
Compression Water
Processing &
Fractionation JV
Capital Budget: $650MM Adjusted EBITDA Guidance:
$705- 755MM
2018 organic capital budget fully funded with retained cash flow and credit facility borrowings, no need for equity financing
Stonewall Pipeline
APPENDIX | 5-YEAR OUTLOOK: LEVERAGING EXISTING CORE ASSET BASE

Pad Efficiency Results in Capital Efficiency
42
Average Lateral Length Per Completed Well Pads Completed Per Year
DISCIPLINED CAPITAL EFFICIENT BUSINESS MODEL
9,100 9,000 8,600
9,200 8,500
9,700
10,500
11,600
12,400 12,700
0
2,000
4,000
6,000
8,000
10,000
12,000
14,000
2018 2019 2020 2021 2022
Avera
ge L
ate
ral
Len
gth
(in
feet)
2017 Plan 2018 Plan
AR’s Marcellus-focused development plan with longer laterals results in fewer pad connections and a $500 million reduction in AM gathering and fresh water capex over five years
0 0
4
26
33
0
5
10
15
20
25
30
35
40
45
50
2018 2019 2020 2021 2022
2017 Plan2018 PlanCumulative Pads Removed

6/30/2018 Debt Maturity Profile
$650
$770
$0
$100
$200
$300
$400
$500
$600
$700
$800
$900
2017 2018 2019 2020 2021 2022 2023 2024 2025
Liquidity & Debt Term Structure
AM Credit Facility AM Senior Notes
New credit facilities for AM
have extended its average
debt maturity out to 2023
43 ANTERO MIDSTREAM: LIQUIDITY AND BALANCE SHEET
No maturities
until 2022
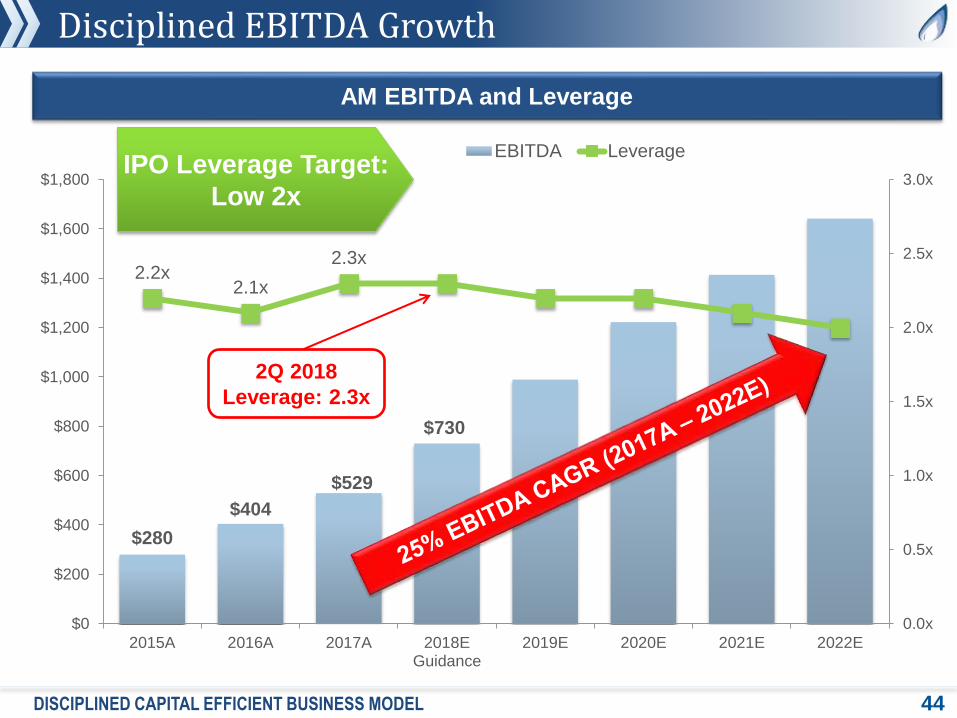
$280
$404
$529
$730
2.2x 2.1x
2.3x
0.0x
0.5x
1.0x
1.5x
2.0x
2.5x
3.0x
$0
$200
$400
$600
$800
$1,000
$1,200
$1,400
$1,600
$1,800
2015A 2016A 2017A 2018EGuidance
2019E 2020E 2021E 2022E
EBITDA Leverage
Disciplined EBITDA Growth
44
AM EBITDA and Leverage
IPO Leverage Target:
Low 2x
DISCIPLINED CAPITAL EFFICIENT BUSINESS MODEL
2Q 2018
Leverage: 2.3x

5-year Organic Project Backlog Reduction
45
~$500MM Capital Efficiencies
Captured From New AR
Development Plan and
AM infrastructure plan
~$25MM from Lateral Lengths
~$425MM
Optimized Capital
Allocation
~$50MM
from Higher EURs
Midstream Capex Savings
Optimized Capital Higher EURs Longer Laterals
Continued shift to
Marcellus with higher
recoveries
Fewer pads with
unchanged throughput
Shorter pipeline
mileage
ORGANIC PROJECT BACKLOG WITH PEER-LEADING RETURNS
$500MM in Capital Efficiencies Reduce 5-Year Backlog to $2.7B with No Change in Throughput Targets

Capital Efficiency Drives Free Cash Flow Generation
DISCIPLINED CAPITAL EFFICIENT BUSINESS MODEL 46
AM Throughput Growth
Over $2.4B of Free Cash Flow from 2018 – 2022 Before Distributions
($800)
($600)
($400)
($200)
$0
$200
$400
$600
$800
$1,000
$1,200
$1,400
2014A 2015A 2016A 2017A 2018Guidance
2019Target
2020Target
2021Target
2022Target
AM Cash Flow Outspend Before Distributions
Significant
Investment in
Processing,
Fractionation,
Wastewater
Significant
Investment in
Gathering,
Compression, Fresh
Water
Earn-out Payments from Water Drop Down
Leverage existing asset base
and realization of ―full build-out
EBITDA multiples‖
Note: Includes water earnings and capital invested on a recast basis prior to drop down and excludes drop down purchase price
We Are
Here
AM Free Cash Flow Before Distributions
Free Cash Flow is a non-GAAP measure. For additional information regarding this measure, please see “Antero Midstream Non-GAAP Measures” in the Appendix.
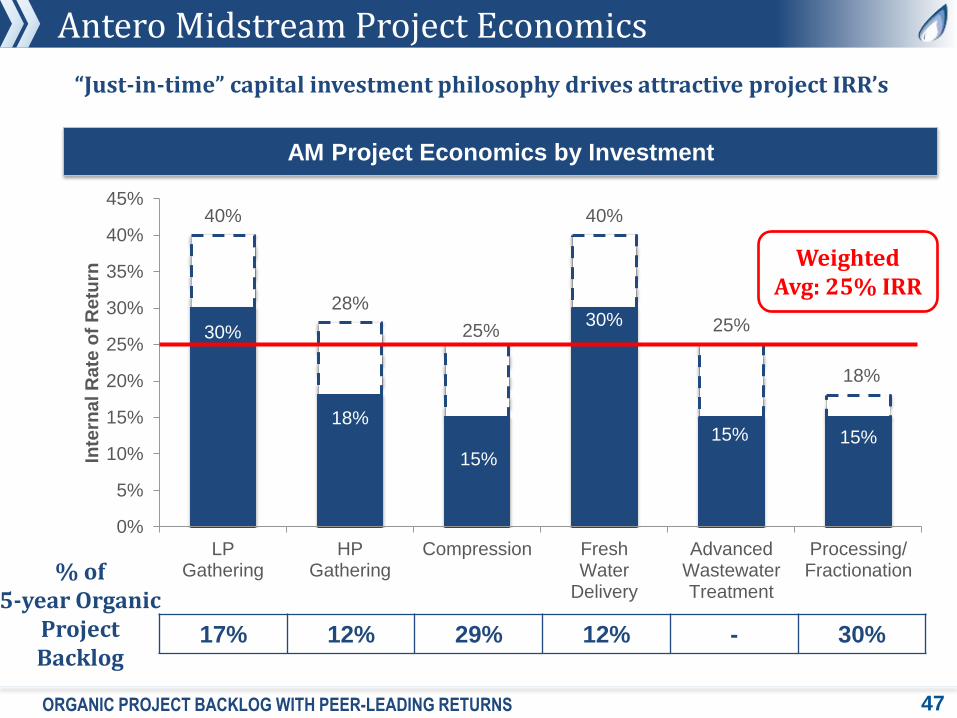
Antero Midstream Project Economics
47
AM Project Economics by Investment
30%
18%
15%
30%
15% 15%
40%
28%
25%
40%
25%
18%
0%
5%
10%
15%
20%
25%
30%
35%
40%
45%
LPGathering
HPGathering
Compression FreshWater
Delivery
AdvancedWastewaterTreatment
Processing/Fractionation
Inte
rna
l R
ate
of
Re
turn
“Just-in-time” capital investment philosophy drives attractive project IRR’s
17% 12% 29% 12% - 30%
% of 5-year Organic
Project Backlog
Weighted Avg: 25% IRR
ORGANIC PROJECT BACKLOG WITH PEER-LEADING RETURNS
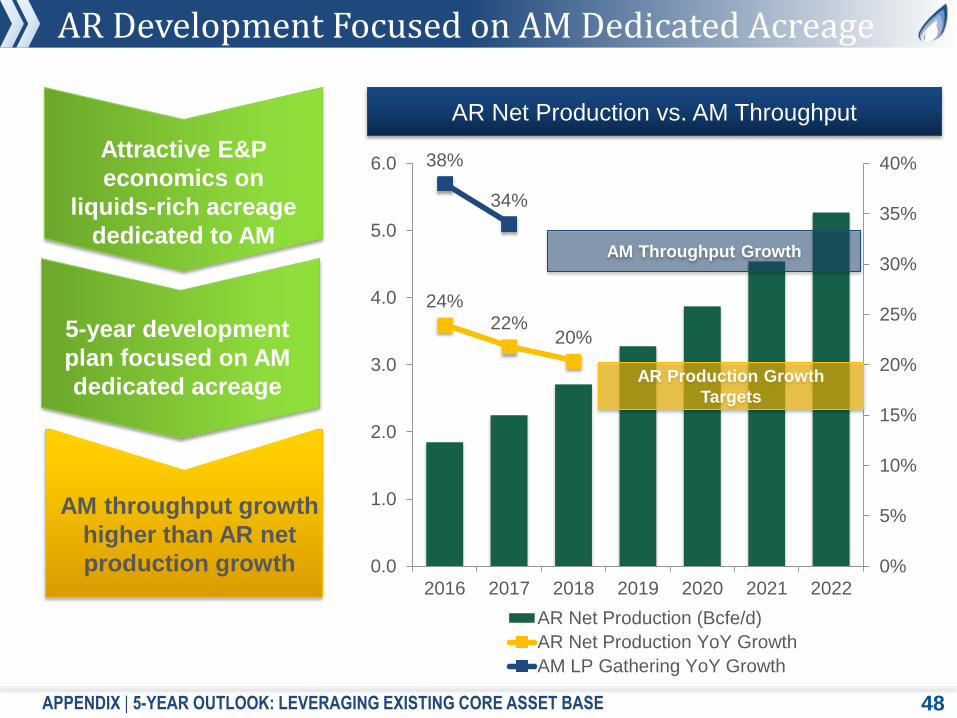
24%
22% 20%
38%
34%
0%
5%
10%
15%
20%
25%
30%
35%
40%
0.0
1.0
2.0
3.0
4.0
5.0
6.0
2016 2017 2018 2019 2020 2021 2022
AR Net Production (Bcfe/d)
AR Net Production YoY Growth
AM LP Gathering YoY Growth
AR Development Focused on AM Dedicated Acreage
48
AR Net Production vs. AM Throughput
AR Production Growth
Targets
Attractive E&P
economics on
liquids-rich acreage
dedicated to AM
AM throughput growth
higher than AR net
production growth
5-year development
plan focused on AM
dedicated acreage
AM Throughput Growth
APPENDIX | 5-YEAR OUTLOOK: LEVERAGING EXISTING CORE ASSET BASE
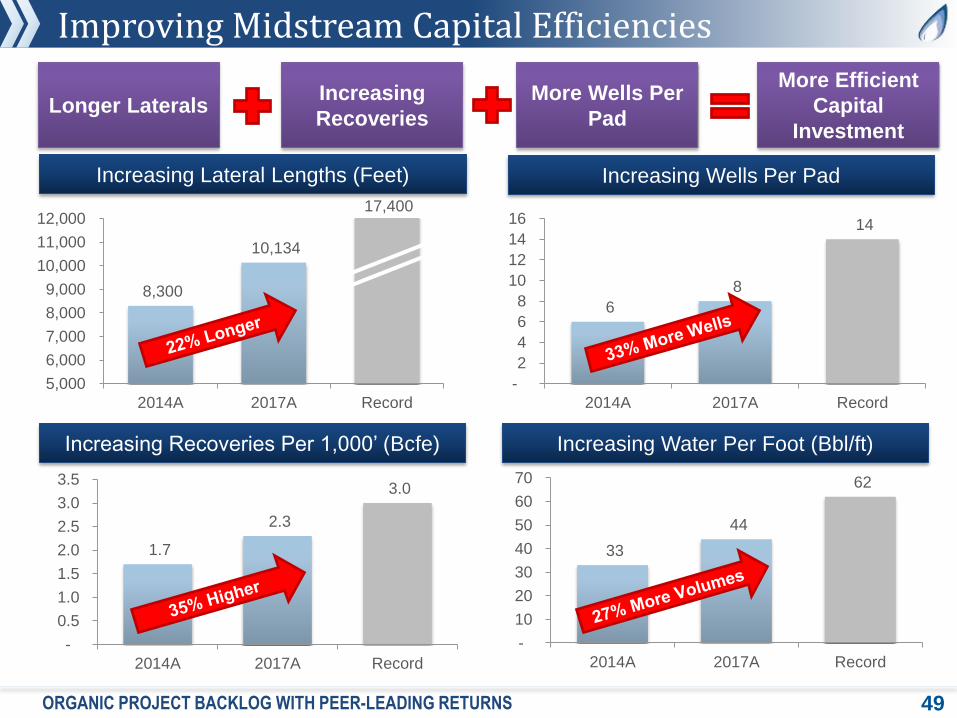
Improving Midstream Capital Efficiencies
49
8,300
10,134
5,000
6,000
7,000
8,000
9,000
10,000
11,000
12,000
2014A 2017A Record
Increasing Lateral Lengths (Feet) Increasing Wells Per Pad
Increasing Recoveries Per 1,000’ (Bcfe) Increasing Water Per Foot (Bbl/ft)
6
8
14
-
2
4
6
8
10
12
14
16
2014A 2017A Record
1.7
2.3
3.0
-
0.5
1.0
1.5
2.0
2.5
3.0
3.5
2014A 2017A Record
33
44
62
-
10
20
30
40
50
60
70
2014A 2017A Record
17,400
Longer Laterals Increasing
Recoveries
More Wells Per
Pad
More Efficient
Capital
Investment
ORGANIC PROJECT BACKLOG WITH PEER-LEADING RETURNS
QUESTIONS/CONCERNS ABOUT
HOW THE 2017 ACTUALS HAVE
DEVELOPED VERSUS THE 2017
ESTIMATES WE USED FOR THE
ANALYST DAY (I’D ASSUME THAT
GIVEN THAT IT WAS ALREADY
JANUARY, THESE NUMBERS
SHOULDN’T CHANGE TOO MUCH):
1) RECOVERIES: BCFE PER FOOT
DROPPED FROM 2.4E TO 2.1A
2) LATERAL LENGTHS ARE 9,198A
VS THE 10,300E WE HAD IN THE
PRESENTATION
3) NOT SURE IF WELLS/PAD
SHOULD INCLUDE ONLY THOSE
ENTIRELY COMPLETED DURING
2018, ETC.

Antero Midstream Capex Reduction
50
AM Capex (Excluding Earn-outs)
$500MM cumulative
capital reduction vs.
December 2016
budget
$0
$250
$500
$750
$1,000
2018 2019 2020 2021 2022
As of December 2017 As of December 2016
Infrastructure plan
focused in the
Marcellus leverages
existing AM assets
10-year identified
project backlog of
~$4.5B
ORGANIC PROJECT BACKLOG WITH PEER-LEADING RETURNS

33
41
45 44
34
37
44
38
25
30
35
40
45
50
2015A 2016A 2017A 2018 - 2022 Target
Ba
rre
ls o
f W
ate
r p
er
Fo
ot
Marcellus Utica
Advanced Completions Utilize More Water
51
Water Per Foot Used in Completions (Bbl/ft)
Budget Plan:
2,000 lb/ft
completions
Vintage 1,000 – 1,500 lb/ft
proppant completions use
33-34 Bbl/ft of water
AR applies 2,000-2,500
lb/ft completions in
2017 utilizing 25%
more water vs. vintage
Budget plan
assumes
2,000 lb/ft
completions
APPENDIX | 5-YEAR OUTLOOK: LEVERAGING EXISTING CORE ASSET BASE

124 131
145 150 160
150 160
170 155 160
170 160
170 180
0
50
100
150
200
250
2015A 2016A 2017E 2018E 2019E 2020E 2021E 2022E
We
lls
Se
rvic
ed
by F
res
hw
ate
r S
ys
tem
Fresh Water Delivery Volume Growth
52
Wells Serviced by Fresh Water Delivery System and Lateral Length
10,000 10,400 12,200 12,800 12,600
Average Lateral Length Wells Serviced by Freshwater System (Low End)
Water
Volume
Growth:
Barrels of
Water Per
Foot
Average
Lateral Length
Wells
Serviced by
Water System
9,300 9,100 8,600
Wells Serviced by Freshwater System (High End)
Note: Lateral lengths based on wells serviced by freshwater system and vary slightly vs. AR completions due to timing lag of wells serviced by system vs. tied-in line
APPENDIX | 5-YEAR OUTLOOK: LEVERAGING EXISTING CORE ASSET BASE

Focus on Operating Expense Reduction Since IPO
53
Compression Opex ($/Mcf)
Fresh Water Delivery ($/Bbl)
$0.13
$0.07
$0.00
$0.02
$0.04
$0.06
$0.08
$0.10
$0.12
$0.14
2014 2017 2018 - 2022
$0.70
$0.45
$0.00
$0.20
$0.40
$0.60
$0.80
2014 2017 2018 - 2022
Gathering Opex ($/Mcf)
$0.02
$0.01
$0.00
$0.01
$0.02
$0.03
2014 2017 2018 - 2022
Waste Water ($/Bbl)
$0.00
$0.50
$1.00
$1.50
$2.00
2014 2017 2018 - 2022
N/A N/A
Estimated Waste Water (High End )
Estimated Waste Water (Low End )
APPENDIX | 5-YEAR OUTLOOK: LEVERAGING EXISTING CORE ASSET BASE

Maintenance Capital Methodology
APPENDIX 54
LTM Production
NTM Production Forecast
Average LTM Production
• Maintenance Capital Calculation Methodology – Low Pressure Gathering
– Estimate the number of new well connections needed during the forecast period in order to offset the natural production
decline and maintain the average throughput volume on our system over the LTM period
– (1) Compare this number of well connections to the total number of well connections estimated to be made during such
period, and
– (2) Designate an equal percentage of our estimated low pressure gathering capital expenditures as maintenance capital
expenditures
Maintenance capital expenditures are cash expenditures (including expenditures for the
construction or development of new capital assets or the replacement, improvement or expansion
of existing capital assets) made to maintain, over the long term, our operating capacity or revenue
• Illustrative Example
LTM Forecast Period
Decline of LTM average throughput to be replaced with production volume
from new well connections
• Maintenance Capital Calculation Methodology – Fresh Water Distribution
− Estimate the number of wells to which we would need to distribute fresh water during the forecast period in order to maintain
the average fresh water throughput volume on our system over the LTM period
− (1) Compare this number of wells to the total number of new wells to which we expect to distribute fresh water during such
period, and
− (2) Designate an equal percentage of our estimated water line capital expenditures as maintenance capital expenditures

Deleveraging is Driving Ratings Momentum
55 ANTERO RESOURCES | TRENDING TOWARDS INVESTMENT GRADE
Moody's S&P Fitch
AR Corporate Credit Ratings History
Corporate Credit Rating
(Moody’s / S&P / Fitch)
Ba3 / BB-
B1 / B+
B2 / B
B3 / B-
Ba2 / BB
Ba1 / BB+
Caa1 / CCC+ / CCC
Baa3 / BBB-
2010
Investment Grade
Rating: BBB-
Fitch Jan. 2018
Stable through
commodity price crash
Credit Markets Have a Strong Appreciation for Antero Momentum
Investment Grade Rating from
Fitch (BBB-) & Recent
Upgrade from S&P (BB+)
Stable Credit Ratings with Consistent
Upgrades from the Beginning of the
Decade Through the Downturn
2011 2012 2013 2014 2015 2016 2017 2018
Upgrade to BB+
S&P Feb. 2018
Investment Grade
Outlook to Positive
Moody’s Feb. 2018

Antero Midstream Non-GAAP Measures
APPENDIX 56
Non-GAAP Financial Measures and Definitions
Antero Midstream views Adjusted EBITDA as an important indicator of the Partnership’s performance. Antero Midstream defines
Adjusted EBITDA as Net Income before interest expense, depreciation expense, impairment expense, accretion of contingent
acquisition consideration, equity-based compensation expense, excluding equity in earnings of unconsolidated affiliates and including
cash distributions from unconsolidated affiliates.
Antero Midstream uses Adjusted EBITDA to assess:
• the financial performance of the Partnership’s assets, without regard to financing methods in the case of Adjusted EBITDA, capital
structure or historical cost basis;
• its operating performance and return on capital as compared to other publicly traded partnerships in the midstream energy sector,
without regard to financing or capital structure; and
• the viability of acquisitions and other capital expenditure projects.
The Partnership defines Distributable Cash Flow as Adjusted EBITDA less interest paid, income tax withholding payments and cash
reserved for payments of income tax withholding upon vesting of equity-based compensation awards, cash reserved for bond interest
and ongoing maintenance capital expenditures paid. Antero Midstream uses Distributable Cash Flow as a performance metric to
compare the cash generating performance of the Partnership from period to period and to compare the cash generating performance for
specific periods to the cash distributions (if any) that are expected to be paid to unitholders. Distributable Cash Flow does not reflect
changes in working capital balances.
The Partnership defines Free Cash Flow as cash flow from operating activities before changes in working capital less capital
expenditures. Management believes that Free Cash Flow is a useful indicator of the Partnership’s ability to internally fund infrastructure
investments, service or incur additional debt, and assess the company’s financial performance and its ability to generate excess cash
from its operations. Management believes that changes in operating assets and liabilities relate to the timing of cash receipts and
disbursements and therefore may not relate to the period in which the operating activities occurred.
The Partnership defines Return on Invested Capital as net income plus interest expense divided by average total liabilities and partners’
capital, excluding current liabilities. Management believes that Return on Invested Capital is a useful indicator of the Partnership’s
return on its infrastructure investments.
The Partnership defines Adjusted Operating Cash Flow as net cash provided by operating activities before changes in current assets
and liabilities. See ―Non-GAAP Measures‖ for additional detail.

Antero Midstream Non-GAAP Measures
APPENDIX 57
The GAAP financial measure nearest to Adjusted Operating Cash Flow is cash flow from operating activities as reported in
Antero Midstream’s consolidated financial statements. Management believes that Adjusted Operating Cash Flow is a useful
indicator of the company’s ability to internally fund its activities and to service or incur additional debt. Management believes
that changes in current assets and liabilities, which are excluded from the calculation of these measures, relate to the timing of
cash receipts and disbursements and therefore may not relate to the period in which the operating activities occurred and
generally do not have a material impact on the ability of the company to fund its operations. Management believes that Free
Cash Flow is a useful measure for assessing the company’s financial performance and measuring its ability to generate
excess cash from its operations.
There are significant limitations to using Adjusted Operating Cash Flow and Free Cash Flow as measures of performance,
including the inability to analyze the effect of certain recurring and non-recurring items that materially affect the company’s net
income, the lack of comparability of results of operations of different companies and the different methods of calculating
Adjusted Operating Cash Flow reported by different companies. Adjusted Operating Cash Flow does not represent funds
available for discretionary use because those funds may be required for debt service, capital expenditures, working capital,
income taxes, and other commitments and obligations.
Antero Midstream has not included reconciliations of Adjusted Operating Cash Flow and Free Cash Flow to their nearest
GAAP financial measures for 2018 because it would be impractical to forecast changes in current assets and liabilities. Antero
Midstream is able to forecast capital expenditures, which is a reconciling item between Free Cash Flow and its most
comparable GAAP financial measure. For the 2018 to 2022 period, Antero forecasts cumulative capital expenditures of $2.7
billion.
Antero Resources non-GAAP measures and definitions are included in the Antero Resources analyst day presentation, which
can be found on www.anteroresources.com.
Antero Midstream Non-GAAP Measures
APPENDIX 58
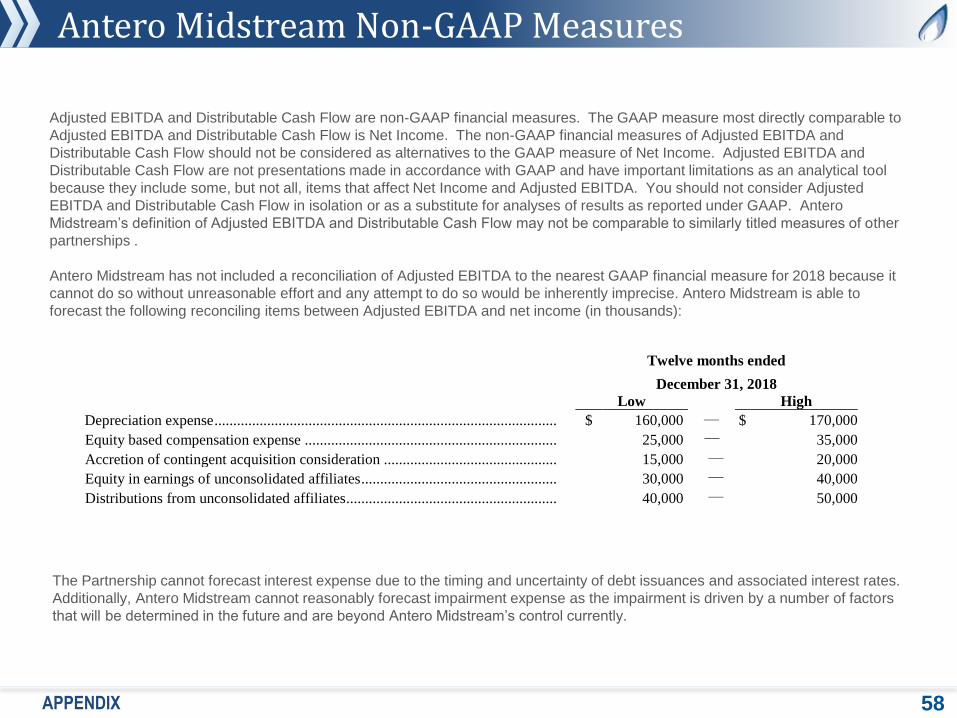
Adjusted EBITDA and Distributable Cash Flow are non-GAAP financial measures. The GAAP measure most directly comparable to
Adjusted EBITDA and Distributable Cash Flow is Net Income. The non-GAAP financial measures of Adjusted EBITDA and
Distributable Cash Flow should not be considered as alternatives to the GAAP measure of Net Income. Adjusted EBITDA and
Distributable Cash Flow are not presentations made in accordance with GAAP and have important limitations as an analytical tool
because they include some, but not all, items that affect Net Income and Adjusted EBITDA. You should not consider Adjusted
EBITDA and Distributable Cash Flow in isolation or as a substitute for analyses of results as reported under GAAP. Antero
Midstream’s definition of Adjusted EBITDA and Distributable Cash Flow may not be comparable to similarly titled measures of other
partnerships .
Antero Midstream has not included a reconciliation of Adjusted EBITDA to the nearest GAAP financial measure for 2018 because it
cannot do so without unreasonable effort and any attempt to do so would be inherently imprecise. Antero Midstream is able to
forecast the following reconciling items between Adjusted EBITDA and net income (in thousands):
The Partnership cannot forecast interest expense due to the timing and uncertainty of debt issuances and associated interest rates.
Additionally, Antero Midstream cannot reasonably forecast impairment expense as the impairment is driven by a number of factors
that will be determined in the future and are beyond Antero Midstream’s control currently.
Twelve months ended
December 31, 2018
Low High
Depreciation expense ........................................................................................... $ 160,000 — $ 170,000
Equity based compensation expense ................................................................... 25,000 — 35,000
Accretion of contingent acquisition consideration .............................................. 15,000 — 20,000
Equity in earnings of unconsolidated affiliates .................................................... 30,000 — 40,000
Distributions from unconsolidated affiliates........................................................ 40,000 — 50,000

Adjusted EBITDA and DCF Reconciliation
APPENDIX 59
Adjusted EBITDA and DCF Reconciliation ($ in thousands)
Three months ended
June 30,
2017 2018
Net income $ 87,175 $ 109,466
Interest expense 9,015 14,628
Impairment of property and equipment expense — 4,614
Depreciation expense 30,512 36,433
Accretion of contingent acquisition consideration 3,590 3,947
Accretion of asset retirement obligations — 34
Equity-based compensation 6,951 5,867
Equity in earnings of unconsolidated affiliates (3,623) (9,264)
Distributions from unconsolidated affiliates 5,820 10,810
Gain on sale of assets- Antero Resources — (583)
Adjusted EBITDA 139,440 175,952
Interest paid (2,308) 372
Decrease in cash reserved for bond interest (1) (8,734) (8,734)
Income tax withholding upon vesting of Antero Midstream Partners LP equity-based compensation awards(2) (2,431) (1,500)
Maintenance capital expenditures(3) (16,422) (16,000)
Distributable Cash Flow $ 109,545 $ 150,090
Distributions Declared to Antero Midstream Holders
Limited Partners 59,695 72,943
Incentive distribution rights 15,328 28,461
Total Aggregate Distributions $ 75,023 $ 101,404
DCF coverage ratio 1.5x 1.3x
1) Cash reserved for bond interest expense on Antero Midstream’s 5.375% senior notes outstanding during the period that is paid on a semi-annual basis on March 15th and September 15th of each year.
2) Estimate of current period portion of expected cash payment for income tax withholding attributable to vesting of Midstream LTIP equity-based compensation awards to be paid in the fourth quarter.
3) Maintenance capital expenditures represent the portion of our estimated capital expenditures associated with (i) the connection of new wells to our gathering and processing systems that we believe will be necessary to
offset the natural production declines Antero Resources will experience on all of its wells over time, and (ii) water delivery to new wells necessary to maintain the average throughput volume on our systems.

Antero Resources Cautionary Note
APPENDIX 60
Regarding Hydrocarbon Quantities
The SEC permits oil and gas companies, in their filings with the SEC, to disclose only proved, probable and possible reserve estimates (collectively, ―3P‖). Antero has provided internally generated estimates for proved, probable and possible reserves in this presentation in accordance with SEC guidelines and definitions. The estimates of proved, probable and possible reserves as of December 31, 2017 included in this presentation have been audited by Antero’s third-party engineers. Unless otherwise noted, reserve estimates as of December 31, 2017 assume ethane rejection and strip pricing.
Actual quantities that may be ultimately recovered from Antero’s interests may differ substantially from the estimates in this presentation. Factors affecting ultimate recovery include the scope of Antero’s ongoing drilling program, which will be directly affected by commodity prices, the availability of capital, drilling and production costs, availability of drilling services and equipment, drilling results, lease expirations, transportation constraints, regulatory approvals and other factors; and actual drilling results, including geological and mechanical factors affecting recovery rates.
In this presentation:
• ―3P reserves‖ refer to Antero’s estimated aggregate proved, probable and possible reserves as of December 31, 2016. The SEC prohibits companies from aggregating proved, probable and possible reserves in filings with the SEC due to the different levels of certainty associated with each reserve category.
• ―EUR,‖ or ―Estimated Ultimate Recovery,‖ refers to Antero’s internal estimates of per well hydrocarbon quantities that may be potentially recovered from a hypothetical future well completed as a producer in the area. These quantities do not necessarily constitute or represent reserves within the meaning of the Society of Petroleum Engineer’s Petroleum Resource Management System or the SEC’s oil and natural gas disclosure rules.
• ―Condensate‖ refers to gas having a heat content between 1250 BTU and 1300 BTU in the Utica Shale.
• ―Highly-Rich Gas/Condensate‖ refers to gas having a heat content between 1275 BTU and 1350 BTU in the Marcellus Shale and 1225 BTU and 1250 BTU in the Utica Shale.
• ―Highly-Rich Gas‖ refers to gas having a heat content between 1200 BTU and 1275 BTU in the Marcellus Shale and 1200 BTU and 1225 BTU in the Utica Shale.
• ―Rich Gas‖ refers to gas having a heat content of between 1100 BTU and 1200 BTU.
• ―Dry Gas‖ refers to gas containing insufficient quantities of hydrocarbons heavier than methane to allow their commercial extraction or to require their removal in order to render the gas suitable for fuel use.

Antero Resources Stand-Alone Adjusted EBITDAX Reconciliation
APPENDIX | DISCLOSURES & RECONCILIATIONS
AR Stand-Alone Adjusted EBITDAX Reconciliation
($ in millions) Three Months
Ended
LTM Ended
6/30/2018 6/30/2018
Net income (loss) including noncontrolling interest $(136,385) $230,254
Commodity derivative gains (55,336) (211,640)
Gains on settled commodity derivatives 95,884 335,252
Marketing derivative (gains) losses 110 (72,730)
Gains (losses) on settled marketing derivatives (15,884) 94,158
Interest expense 54,388 222,479
Loss on early extinguishment of debt — 1,205
Income tax expense (25,573) (461,669)
Depreciation, depletion, amortization, and accretion 202,283 759,260
Impairment of unproved properties 134,437 302,473
Impairment of gathering systems and facilities 4,470 4,470
Exploration expense 1,471 7,983
Gain on change in fair value of contingent acquisition consideration (3,947) (14,181)
Equity-based compensation expense 13,204 65,070
Equity in net income of Antero Midstream 26,926 74,056
Distributions from Antero Midstream 38,559 143,100
Total Adjusted EBITDAX $334,607 $1,479,540
61

Antero Resources Definitions
APPENDIX 62
Consolidated Adjusted EBITDAX: Represents net income or loss from continuing operations, including noncontrolling interests, before interest expense,
interest income, derivative fair value gains or losses (excluding net cash receipts or payments on derivative instruments included in derivative fair value gains
or losses), taxes, impairment, depletion, depreciation, amortization, and accretion, exploration expense, franchise taxes, equity-based compensation, gain or
loss on early extinguishment of debt, and gain or loss on sale of assets. Consolidated Adjusted EBITDAX also includes distributions from unconsolidated
affiliates and excludes equity in earnings or losses of unconsolidated affiliates. See ―Non-GAAP Measures‖ for additional detail.
Consolidated Adjusted Operating Cash Flow: Represents net cash provided by operating activities less changes in current assets and liabilities. See
―Non-GAAP Measures‖ for additional detail.
Consolidated Drilling & Completion Capital: Represents drilling and completion capital as reported in AR’s consolidated cash flow statements (i.e., fees
paid to AM for water handling and treatment are eliminated upon consolidation and only operating costs associated with water handling and treatment are
capitalized).
Debt-Adjusted Shares: Represents ending period debt divided by ending share price plus ending shares outstanding. Forecasted debt-adjusted shares
assumes AR share price of $19.87 per share as of January 12, 2018.
F&D Cost: Represents current D&C cost per 1,000’ lateral divided by net EUR per 1,000’ lateral assuming 85% NRI in Marcellus and 81% NRI in Utica.
There is no directly comparable financial measure presented in accordance with GAAP for F&D Cost and therefore, a reconciliation to GAAP is not
practicable.
Free Cash Flow: Represents Stand-alone E&P Adjusted operating cash flow, less Stand-alone E&P Drilling and Completion capital, less Land Maintenance
capital. See ―Non-GAAP Measures‖ for additional detail.
Land Maintenance Capital: Represents leasehold capital expenditures required to achieve targeted working interest percentage of 95% for 5-year
development plan (i.e. historical average working interest), plus renewals associated with 5-year development plan.
Leverage Ratio: Represents ending period net debt (debt adjusted for cash and cash equivalents) divided by LTM Adjusted EBITDAX. Leverage ratios for
future years reflect projected net debt divided by period Adjusted EBITDAX.
Maintenance Capital: Represents stand-alone E&P Drilling & Completion Capital expenditures that are estimated to be necessary to sustain production at
current (2017) production levels (2.3 Bcfe/d).
Stand-Alone E&P Adjusted EBITDAX: Represents income or loss from continuing operations as reported in the Parent column of AR’s guarantor footnote
to its financial statements before interest expense, interest income, derivative fair value gains or losses from exploration and production and marketing
(excluding net cash receipts or payments on derivative instruments included in derivative fair value gains or losses), impairment, depletion, depreciation,
amortization, and accretion, exploration expense, franchise taxes, equity-based compensation, gain or loss on early extinguishment of debt, gain or loss on
sale of assets, and gain or loss on changes in the fair value of contingent acquisition consideration. Stand-alone E&P Adjusted EBITDAX also includes
distributions received from limited partner interests in Antero Midstream common units. See ―Non-GAAP Measures‖ for additional detail.
Stand-Alone E&P Adjusted Operating Cash Flow: Represents net cash provided by operating activities as reported in the Parent column of AR’s
guarantor footnote to its financial statements less changes in current assets and liabilities, plus the AM cash distributions payable to AR, plus the earn out
payments expected from Antero Midstream associated with the water drop down transaction that occurred in 2015. See ―Non-GAAP Measures‖ on slide 18
for additional detail.
Stand-Alone Drilling & Completion Capital: Represents drilling and completion capital as reported in the Parent column of AR’s guarantor footnote to its
financial statements and includes 100% of fees paid to AM for water handling and treatment and excludes operating costs associated with AM’s Water
Handling and Treatment segment)