Embed Size (px)
Citation preview

PayPal Reports Second Quarter 2017 Results and Raises Financial Guidance for Full Year
Revenue increased 18% to $3.136 billion, 20% FX-neutral revenue growth
GAAP EPS increased 27% to $0.34, non-GAAP EPS increased 27% to $0.46
SAN JOSE, Calif.--(BUSINESS WIRE)-- Global technology platform and digital payments leader PayPal Holdings, Inc. (NASDAQ:PYPL) today announced second quarter results for the period ended June 30, 2017.
Financial highlights for the second quarter include:
� Revenue growth of 18% to $3.136 billion, or 20% on a foreign currency neutral (FX-neutral) basis
� GAAP operating margin of 13.7% and non-GAAP operating margin of 21.0%
� GAAP earnings per diluted share (EPS) growth of 27% to $0.34, non-GAAP EPS growth of 27% to $0.46
� Operating cash flow of $921 million, free cash flow of $747 million
Operating highlights for the second quarter include:
� 6.5 million active customer accounts added with net new additions up 80%
� Ended the quarter with 210 million active customer accounts, including 17 million merchant accounts
� 1.8 billion payment transactions, up 23%
� 32.3 payment transactions per active account on a trailing twelve months basis, up 10%
� $106 billion in total payment volume (TPV), up 23%, or 26% on an FX-neutral basis
“The accelerating and extensive scale of our two-sided global platform creates a strong foundation for PayPal’s growth, enabling consumers and merchants to transact in new contexts and across operating systems, technologies and platforms,” said Dan Schulman, President and CEO of PayPal. “Our strong results reflect PayPal’s transformation from a single product to a platform company, from a vendor to a strategic partner to both merchants and ecosystem players, and from a checkout option to an increasingly more central way for consumers to manage and move their money.”
Building Momentum with Strategic Partnerships
Important strategic partnerships are broadening the relevance of PayPal's platform and increasing PayPal'saddressable market. Recently, PayPal announced the following agreements:
� Baidu: Today, PayPal announced a partnership with Baidu to allow Chinese consumers to pay with Baidu Wallet and PayPal at PayPal’s millions of merchants outside of China.
� BofA: Enables Bank of America-issued cards to be easily added to PayPal accounts.
� Citi: Enables eligible Citi cardmembers to use their ThankYou Points to pay for all or part of their purchases when shopping online at millions of merchants that accept PayPal in the United States.
� JPMorgan Chase: Enables Chase-issued cards to be easily added to PayPal accounts and allows jointcustomers to use their Chase Ultimate Rewards points anywhere PayPal is accepted online and in app.
� Visa: Existing partnership agreement extended into Europe.
� Samsung Pay: Users of Samsung Pay in the U.S. will be able to use PayPal to make purchases in stores

where Samsung Pay is accepted.
� Apple: iTunes users can buy games, music, movies and in app purchases with PayPal in the Apple App Store, iBooks, Apple Music and iTunes stores in 12 countries, including the U.S., Australia and parts ofEurope.
� Google: Android Pay users on Google’s Chrome mobile web will be able to pay at millions of online merchants that accept PayPal, using their PayPal account and fingerprint authentication.
Expanding Value Proposition with Product Innovation
Mobile-first product development focus is driving performance across PayPal's business. PayPal processed $106 billion in TPV in the quarter. Approximately 34% of payment volume came through a mobile device and mobilepayment volume increased 50% over the same period last year to approximately $36 billion. In addition, Venmo, the company's social payments platform, processed $8.0 billion of TPV, growing 103% over the same period last year.
PayPal finished the quarter with more than 60 million consumer accounts opted in to One Touch. In addition, more than 5.5 million merchant accounts and 75% of the Internet Retailer 100 now accept One Touch on their mobile and desktop shopping experiences.
On July 18, 2017, PayPal announced the closing of the acquisition of TIO Networks for approximately $238 million. TIO is a leading cloud-based, multi-channel bill payment processor, serving leading telecom, wireless, cable, and utility bill issuers in North America. Through this acquisition, PayPal intends to expand its scale of operations, complement its product portfolio, and accelerate its entry into the bill pay market, enabling millions of customers to improve their financial health through access to TIO's valuable services.
Cash, Cash Equivalents and Investments - PayPal’s cash, cash equivalents and investments totaled $6.6 billion as of June 30, 2017.
2017 Financial Guidance
Second Quarter 2017 Financial and Operating Highlights
Second Quarter
(presented in millions, except per share data and percentages) 2017 2016 YoY Growth
FX-NeutralYoY Growth
Total Payment Volume (TPV) $106,444 $86,208 $20,236 23% 26%
GAAP
Net revenues $3,136 $2,650 $486 18% 20%
Operating margin 13.7% 14.0% ** (30)bps N/A
Effective tax rate 8.1% 15.0% ** (690)bps N/A
Net income $411 $323 $88 27% N/A
Earnings per diluted share $0.34 $0.27 $0.07 27% N/A
Net cash provided by operating activities $921 $696 $225 32% N/A
Non-GAAP
Net revenues $3,136 $2,650 $486 18% 20%
Operating margin 21.0% 19.9% ** 110bps N/A
Effective tax rate 18.0% 18.8% ** (80)bps N/A
Net income $554 $436 $118 27% N/A
Earnings per diluted share $0.46 $0.36 $0.10 27% N/A
Free cash flow $747 $495 $252 51% N/A
** Not meaningful.

Full Year 2017 Revenue and Earnings Guidance Raised
� PayPal expects revenue to grow 18 - 19% at current spot rates and 19 - 20% on an FX-neutral basis, to a range of $12.775 - $12.875 billion.
� PayPal expects GAAP earnings per diluted share in the range of $1.32 - $1.36 and non-GAAP earningsper diluted share in the range of $1.80 - $1.84.
� Estimated non-GAAP amounts above for the twelve months ending December 31, 2017, reflect adjustments of approximately $840 - $880 million, primarily representing estimated stock-based compensation expense and related employer payroll taxes in the range of $690 - $720 million.
Third Quarter 2017 Revenue and Earnings Guidance
� PayPal expects revenue to grow 18% - 20% at current spot rates and 18% - 20% on an FX-neutral basis, to a range of $3.140 - $3.190 billion.
� PayPal expects GAAP earnings per diluted share in the range of $0.30 - $0.32 and non-GAAP earnings per diluted share in the range of $0.42 - $0.44.
� Estimated non-GAAP amounts above for the three months ending September 30, 2017, reflect adjustments of approximately $200 - $215 million, primarily representing estimated stock-based compensation expense and related employer payroll taxes in the range of $180 - $190 million.
Please see "Non-GAAP Financial Measures" and "Non-GAAP Measures of Financial Performance" for importantadditional information.
Quarterly Conference Call and Webcast
PayPal Holdings, Inc. will host a conference call to discuss second quarter 2017 results at 2:00 p.m. Pacific Time today. A live webcast of the conference call, together with a slide presentation that includes supplementalfinancial information and reconciliations of certain non-GAAP and non-GAAP pro forma measures to their most directly comparable GAAP measures, can be accessed through the company's Investor Relations website at https://investor.paypal-corp.com. In addition, an archive of the webcast will be accessible for 90 days through thesame link.
PayPal Holdings, Inc. uses its Investor Relations website (https://investor.paypal-corp.com), its PayPal Stories Blog (https://www.paypal.com/stories/us), Twitter handle (@PayPal), LinkedIn page (https://www.linkedin.com/company/paypal), Facebook page (https://www.facebook.com/PayPalUSA/) and YouTube channel (https://www.youtube.com/paypal) as a means of disclosing information about the company and for complying with its disclosure obligations under Regulation FD. The information we post through these channels may be deemed material. Accordingly, investors should monitor these channels in addition to PayPal’s press releases, SEC filings, public conference calls and webcasts.
About PayPal
Fueled by a fundamental belief that having access to financial services creates opportunity, PayPal (Nasdaq: PYPL) is committed to democratizing financial services and empowering people and businesses to join and thrive in the global economy. Our open digital payments platform gives PayPal’s 210 million active account holders the confidence to connect and transact in new and powerful ways, whether they are online, on a mobile device, in an app, or in person. Through a combination of technological innovation and strategic partnerships, PayPal creates better ways to manage and move money, and offers choice and flexibility when sending payments, paying or getting paid. Available in more than 200 markets around the world, the PayPal platform, including Braintree, Venmo and Xoom, enables consumers and merchants to receive money in more than 100 currencies, withdraw funds in 56 currencies and hold balances in their PayPal accounts in 25 currencies. For more information on PayPal, visit https://www.paypal.com/about. For PayPal financial information, visit https://investor.paypal-corp.com.
Presentation

All growth rates represent year-over-year comparisons, except as otherwise noted. FX-neutral results are calculated by translating the current period local currency results by the prior period exchange rate. FX-neutral growth rates are calculated by comparing the current period FX-neutral results by the prior period results, excluding the impact from hedging activities. All amounts in tables are presented in U.S. dollars, rounded to the nearest millions, except as otherwise noted. As a result, certain amounts may not sum or recalculate using the rounded dollar amounts provided.
Non-GAAP Financial Measures
This press release includes the following financial measures defined as “non-GAAP financial measures” by the Securities and Exchange Commission (SEC): non-GAAP net income, non-GAAP earnings per diluted share, non-GAAP operating margin, non-GAAP effective tax rate and free cash flow. For an explanation of the foregoing non-GAAP measures, please see “Non-GAAP Measures of Financial Performance” included in this press release. These measures may be different from non-GAAP financial measures used by other companies. The presentation of this financial information, which is not prepared under any comprehensive set of accounting rules or principles, is not intended to be considered in isolation of, or as a substitute for, the financial information prepared and presented in accordance with generally accepted accounting principles (GAAP). In addition, the company has included certain pro forma adjustments in its presentation of certain historical revenue measures. The company believes that this presentation provides investors a consistent basis for assessing the company’s performanceand helps to facilitate comparisons across different periods. These pro forma adjustments reflect items that are factually supportable, directly attributable to the separation of the company from eBay Inc. on July 17, 2015, and expected to have a continuing impact on the company’s results of operations. For a reconciliation of these non-GAAP financial measures and non-GAAP pro forma comparisons to the most directly comparable GAAP measures, see “Non-GAAP Measures of Financial Performance,” “Reconciliation of GAAP Operating Margin to Non-GAAP Operating Margin,” “Reconciliation of GAAP Net Income to Non-GAAP Net Income, GAAP Diluted EPS to Non-GAAP Diluted EPS and GAAP Effective Tax Rate to Non-GAAP Effective Tax Rate,” “Reconciliation of Operating Cash Flow to Free Cash Flow”, “Reconciliation of GAAP Net Revenues by Type to Non-GAAP Pro Forma Net Revenues by Type” and GAAP Net Revenues by Geography to Non-GAAP Pro Forma Net Revenuesby Geography”.
Forward-Looking Statements
This press release contains forward-looking statements relating to, among other things, the future results of operations, financial condition, expectations and plans of PayPal Holdings, Inc. and its consolidated subsidiaries that reflect PayPal’s current projections and forecasts. Forward-looking statements can be identified by words such as “may,” “will,” “would,” “should,” “could,” “expect,” “anticipate,” “believe,” “estimate,” “intend,” “plan,” “project,” “forecast” and other similar expressions. Forward-looking statements include, but are not limited to, statements regarding projected financial results for third quarter and the full year 2017 and projected future growth of PayPal’s businesses. Forward-looking statements are based upon various estimates and assumptions, as well as information known to PayPal as of the date of this press release, and are inherently subject to numerous risks and uncertainties. Accordingly, actual results could differ materially from those predicted or implied by forward-looking statements. Factors that could cause or contribute to such differences include, but are not limited to: changes in political, business and economic conditions, including any regional or general economic downturn or crisis and any conditions that affect payments or e-commerce growth; fluctuations in foreign currency exchange rates; the competitive, regulatory, payment card association-related and other risks specific to the PayPal, PayPal Credit, Braintree, Venmo, Xoom and Paydiant products, especially as PayPal continues to expand geographically and introduce new products and as new laws and regulations related to payments and financial services come into effect; the impact of PayPal's customer choice initiatives, including on its funding mix and transaction expense; PayPal’s ability to successfully react to the increasing importance of mobile payments and mobile commerce; PayPal’s ability to deal with the increasingly competitive environment for its businesses, including competition for consumers and merchants; the outcome of legal and regulatory proceedings and PayPal's need and ability to manage other regulatory, tax and litigation risks as its products and services are offered in more jurisdictions and applicable laws become more restrictive; changes to PayPal's capital allocation or management of operating cash; uncertainty surrounding the implementation and impact of the United Kingdom's formal notification of its intent to withdraw from the European Union; PayPal's need to manage anincreasingly large enterprise with a broad range of businesses of varying degrees of maturity and in many different geographies; the effect of management changes and business initiatives; any changes PayPal may make to its product offerings; PayPal's ability to timely upgrade and develop its technology systems, infrastructure and customer service capabilities at reasonable cost; PayPal's ability to maintain the stability, security and performance of its Payment Platform while adding new products and features in a timely fashion; risks that

planned acquisitions will not be completed on contemplated terms, or at all, and that any businesses PayPal may acquire will not perform in accordance with its expectations, and PayPal's ability to profitably integrate, manage and grow businesses that have been acquired or may be acquired in the future. The forward-looking statements in this release do not include the potential impact of any acquisitions or divestitures that may be announcedand/or completed after the date hereof.
More information about factors that could adversely affect PayPal's results of operations, financial condition and prospects or that could cause actual results to differ from those expressed or implied in forward-looking statements is included under the captions “Risk Factors” and “Management's Discussion and Analysis of Financial Condition and Results of Operations” in PayPal’s most recent annual report on Form 10-K and its subsequent quarterly reports on Form 10-Q, copies of which may be obtained by visiting PayPal's Investor Relations website at https://investor.paypal-corp.com or the SEC's website at www.sec.gov. All information in this release is as of July 26, 2017. For the reasons discussed above, you should not place undue reliance on the forward-looking statements in this press release. PayPal assumes no obligation to update such forward-looking statements.
Copyright © 1999-2017 PayPal. All rights reserved. Other company and product names may be trademarks of their respective owners.
PayPal Holdings, Inc.
Unaudited Condensed Consolidated Balance Sheet
June 30, December 31,
2017 2016
(In millions, except par value)
ASSETS
Current assets:
Cash and cash equivalents $ 1,271 $ 1,590
Short-term investments 2,820 3,385
Accounts receivable, net 176 214
Loans and interest receivable, net 5,752 5,348
Funds receivable and customer accounts 16,178 14,363
Prepaid expenses and other current assets 838 833
Total current assets 27,035 25,733
Long-term investments 2,511 1,539
Property and equipment, net 1,479 1,482
Goodwill 4,062 4,059
Intangible assets, net 143 211
Other assets 60 79
Total assets $ 35,290 $ 33,103
LIABILITIES AND EQUITY
Current liabilities:
Accounts payable $ 171 $ 192
Funds payable and amounts due to customers 16,978 15,163
Accrued expenses and other current liabilities 1,407 1,459
Income taxes payable 85 64
Total current liabilities 18,641 16,878
Deferred tax liability and other long-term liabilities 1,651 1,513
Total liabilities 20,292 18,391
Equity:
Common stock, $0.0001 par value; 4,000 shares authorized; 1,202 and 1,207 outstanding — —
Treasury stock at cost, 41 and 27 shares (1,601) (995)
Additional paid-in-capital 13,873 13,579
Retained earnings 2,824 2,069
Accumulated other comprehensive income (98 ) 59
Total equity 14,998 14,712
Total liabilities and equity $ 35,290 $ 33,103
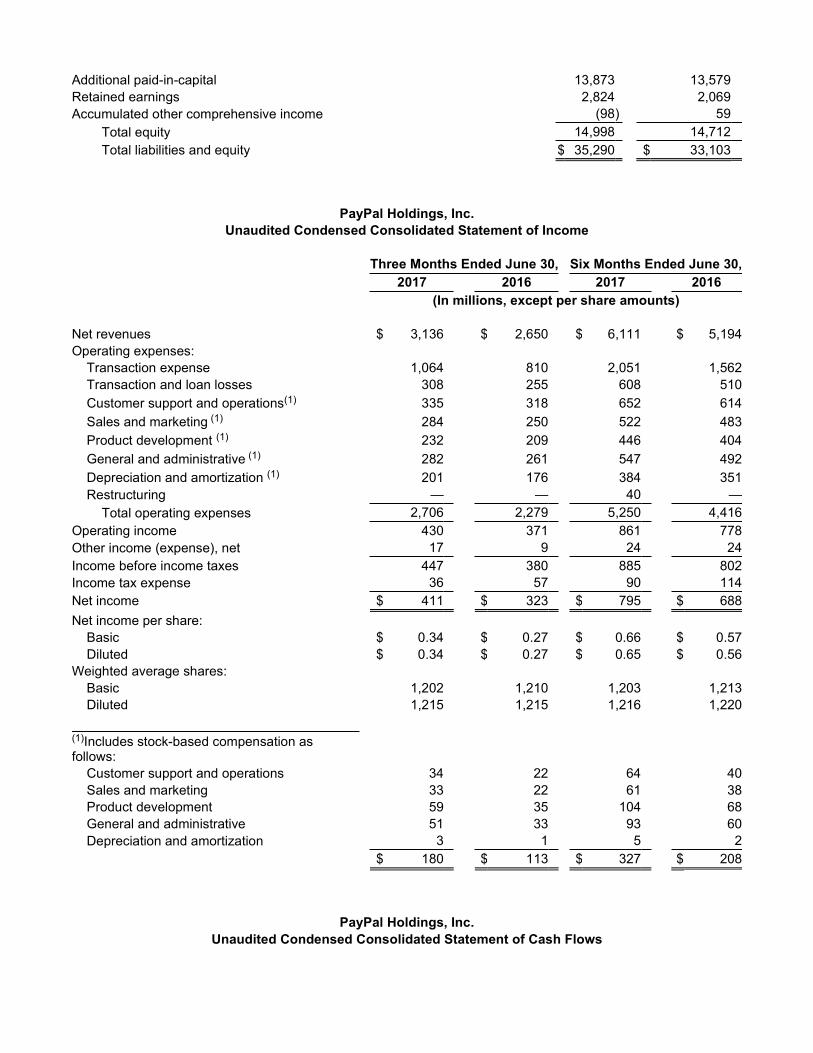
PayPal Holdings, Inc.
Unaudited Condensed Consolidated Statement of Income
Three Months Ended June 30, Six Months Ended June 30,
2017 2016 2017 2016
(In millions, except per share amounts)
Net revenues $ 3,136 $ 2,650 $ 6,111 $ 5,194
Operating expenses:
Transaction expense 1,064 810 2,051 1,562
Transaction and loan losses 308 255 608 510
Customer support and operations(1) 335 318 652 614
Sales and marketing (1) 284 250 522 483
Product development (1) 232 209 446 404
General and administrative (1) 282 261 547 492
Depreciation and amortization (1) 201 176 384 351
Restructuring — — 40 —
Total operating expenses 2,706 2,279 5,250 4,416
Operating income 430 371 861 778
Other income (expense), net 17 9 24 24
Income before income taxes 447 380 885 802
Income tax expense 36 57 90 114
Net income $ 411 $ 323 $ 795 $ 688
Net income per share:
Basic $ 0.34 $ 0.27 $ 0.66 $ 0.57
Diluted $ 0.34 $ 0.27 $ 0.65 $ 0.56
Weighted average shares:
Basic 1,202 1,210 1,203 1,213
Diluted 1,215 1,215 1,216 1,220
(1)Includes stock-based compensation asfollows:
Customer support and operations 34 22 64 40
Sales and marketing 33 22 61 38
Product development 59 35 104 68
General and administrative 51 33 93 60
Depreciation and amortization 3 1 5 2
$ 180 $ 113 $ 327 $ 208
PayPal Holdings, Inc.
Unaudited Condensed Consolidated Statement of Cash Flows

PayPal Holdings, Inc.
Three Months Ended June 30, Six Months Ended June 30,
2017 2016 2017 2016
(In millions)
Cash flows from operating activities:
Net income $ 411 $ 323 $ 795 $ 688
Adjustments:
Transaction and loan losses 308 255 608 510
Depreciation and amortization 201 176 384 350
Stock-based compensation 176 111 321 206
Deferred income taxes 49 66 102 88
Excess tax benefits from stock-basedcompensation — (31) — (32)
Gain on sale of principal loans receivable held for sale, net (6 ) (6 ) (12) (12)
Changes in assets and liabilities:
Accounts receivable 2 (8 ) 38 (30)
Principal loans receivable held for sale, net 6 6 12 12
Accounts payable 5 9 4 22
Income taxes payable 4 42 21 37
Other assets and liabilities (235 ) (247 ) (601 ) (405 )
Net cash provided by operating activities 921 696 1,672 1,434
Cash flows from investing activities:
Purchases of property and equipment (174) (201) (322) (334)
Changes in principal loans receivable, net (491) (356) (627) (476)
Purchases of investments (4,847) (6,118) (11,956) (10,209)
Maturities and sales of investments 3,955 5,139 9,536 9,335
Acquisitions, net of cash acquired — — — (19)
Funds receivable and customer accounts (387 ) (270 ) 367 222
Net cash (used in) investing activities (1,944 ) (1,806 ) (3,002 ) (1,481 )
Cash flows from financing activities:
Proceeds from issuance of common stock 74 51 86 57
Purchases of treasury stock (89) (300) (606) (896)
Excess tax benefits from stock-based compensation — 31 — 32
Tax withholdings related to net share settlements of equity awards (23) (79) (124) (94)
Borrowings (repayments) under financing arrangements (6 ) — (6 ) (21)
Funds payable and amounts due to customers 1,086 841 1,638 1,579
Net cash provided by financing activities 1,042 544 988 657
Effect of exchange rate changes on cash and cash equivalents 12 1 23 15
Net change in cash and cash equivalents 31 (565) (319) 625
Cash and cash equivalents at beginning of period 1,240 2,583 1,590 1,393
Cash and cash equivalents at end of period $ 1,271 $ 2,018 $ 1,271 $ 2,018
Supplemental cash flow disclosures:
Cash paid for interest $ 1 $ 1 $ 2 $ 2
Cash paid for income taxes $ 25 $ 12 $ 73 $ 36
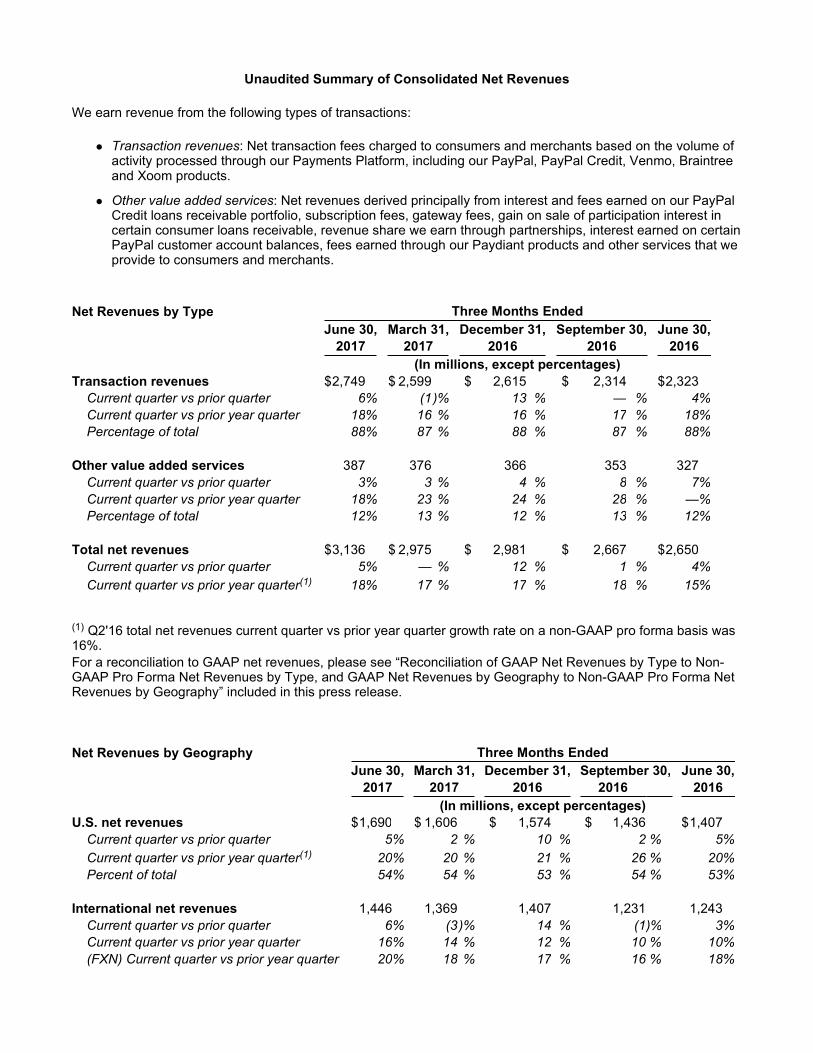
Unaudited Summary of Consolidated Net Revenues
We earn revenue from the following types of transactions:
� Transaction revenues: Net transaction fees charged to consumers and merchants based on the volume of activity processed through our Payments Platform, including our PayPal, PayPal Credit, Venmo, Braintree and Xoom products.
� Other value added services: Net revenues derived principally from interest and fees earned on our PayPal Credit loans receivable portfolio, subscription fees, gateway fees, gain on sale of participation interest in certain consumer loans receivable, revenue share we earn through partnerships, interest earned on certain PayPal customer account balances, fees earned through our Paydiant products and other services that we provide to consumers and merchants.
Net Revenues by Type Three Months Ended
June 30, March 31, December 31, September 30, June 30,
2017 2017 2016 2016 2016
(In millions, except percentages)
Transaction revenues $ 2,749 $ 2,599 $ 2,615 $ 2,314 $ 2,323
Current quarter vs prior quarter 6% (1)% 13 % — % 4%
Current quarter vs prior year quarter 18% 16 % 16 % 17 % 18%
Percentage of total 88% 87 % 88 % 87 % 88%
Other value added services 387 376 366 353 327
Current quarter vs prior quarter 3% 3 % 4 % 8 % 7%
Current quarter vs prior year quarter 18% 23 % 24 % 28 % —%
Percentage of total 12% 13 % 12 % 13 % 12%
Total net revenues $ 3,136 $ 2,975 $ 2,981 $ 2,667 $ 2,650
Current quarter vs prior quarter 5% — % 12 % 1 % 4%
Current quarter vs prior year quarter(1) 18% 17 % 17 % 18 % 15%
(1) Q2'16 total net revenues current quarter vs prior year quarter growth rate on a non-GAAP pro forma basis was 16%.
For a reconciliation to GAAP net revenues, please see “Reconciliation of GAAP Net Revenues by Type to Non-GAAP Pro Forma Net Revenues by Type, and GAAP Net Revenues by Geography to Non-GAAP Pro Forma Net Revenues by Geography” included in this press release.
Net Revenues by Geography Three Months Ended
June 30, March 31, December 31, September 30, June 30,
2017 2017 2016 2016 2016
(In millions, except percentages)
U.S. net revenues $ 1,690 $ 1,606 $ 1,574 $ 1,436 $ 1,407
Current quarter vs prior quarter 5% 2 % 10 % 2 % 5%
Current quarter vs prior year quarter(1) 20% 20 % 21 % 26 % 20%
Percent of total 54% 54 % 53 % 54 % 53%
International net revenues 1,446 1,369 1,407 1,231 1,243
Current quarter vs prior quarter 6% (3)% 14 % (1)% 3%
Current quarter vs prior year quarter 16% 14 % 12 % 10 % 10%
(FXN) Current quarter vs prior year quarter 20% 18 % 17 % 16 % 18%

Percent of total 46% 46 % 47 % 46 % 47%
Total net revenues $ 3,136 $ 2,975 $ 2,981 $ 2,667 $ 2,650
Current quarter vs prior quarter 5% — % 12 % 1 % 4%
Current quarter vs prior year quarter(2) 18% 17 % 17 % 18 % 15%
(FXN) Current quarter vs prior year quarter 20% 19 % 19 % 21 % 19%
(1) Q2'16 U.S. net revenues current quarter vs prior year quarter growth rate on a non-GAAP pro forma basis was 21%. (2) Q2'16 total net revenues current quarter vs prior year quarter growth rate on a non-GAAP pro forma basis was 16%.
For a reconciliation to GAAP net revenues, please see “Reconciliation of GAAP Net Revenues by Type to Non-GAAP Pro Forma Net Revenues by Type, and GAAP Net Revenues by Geography to Non-GAAP Pro Forma Net Revenues by Geography” included in this press release.
PayPal Holdings, Inc.
Unaudited Supplemental Operating Data
Three Months Ended,
June 30, March 31, December 31, September 30, June 30,
2017 2017 2016 2016 2016
(In millions, except percentages)
Active customer accounts(1) 210 203 197 192 188
Current quarter vs prior quarter 3% 3 % 3 % 2 % 2%
Current quarter vs prior year quarter 12% 11 % 10 % 11 % 11%
Number of payment transactions(2) 1,775 1,732 1,755 1,512 1,448
Current quarter vs prior quarter 2% (1)% 16 % 4 % 2%
Current quarter vs prior year quarter 23% 23 % 23 % 24 % 25%
Payment transactions per active
account(3) 32.3 31.7 31.1 30.2 29.4
Current quarter vs prior quarter 2% 2 % 3 % 3 % 3%
Current quarter vs prior year quarter 10% 12 % 13 % 13 % 13%
Total Payment Volume(4) $ 106,444 $ 99,327 $ 99,348 $ 87,403 $ 86,208
Current quarter vs prior quarter 7% — % 14 % 1 % 6%
Current quarter vs prior year quarter 23% 23 % 22 % 25 % 28%
(FXN) Current quarter vs prior year quarter 26% 25 % 25 % 28 % 29%
Transaction Expense Rate(5) 1.00% 0.99 % 0.96 % 0.95 % 0.94%
Transaction and Loan Loss Rate(6) 0.29% 0.30 % 0.31 % 0.31 % 0.30%
Transaction Margin(7) 56.3% 56.7 % 57.7 % 58.7 % 59.8%
(1) An active customer account is a registered account that successfully sent or received at least one payment or payment reversal through our Payments Platform, excluding transactions processed through our gateway and Paydiant products, in the past 12 months. (2) Payment transactions is the total number of payments, net of payment reversals, successfully completed through our Payments Platform, excluding transactions processed through our gateway and Paydiant products.

PayPal Holdings, Inc.
Non-GAAP Measures of Financial Performance
To supplement the company's condensed consolidated financial statements presented in accordance with generally accepted accounting principles, or GAAP, the company uses non-GAAP measures of certain components of financial performance. These non-GAAP measures include non-GAAP net income, non-GAAP earnings per diluted share, non-GAAP operating margin, non-GAAP effective tax rate and free cash flow.
These non-GAAP measures are not in accordance with, or an alternative to, measures prepared in accordance with GAAP and may be different from non-GAAP measures used by other companies. In addition, these non-GAAP measures are not based on any comprehensive set of accounting rules or principles. Non-GAAP measures have limitations in that they do not reflect all of the amounts associated with the company's results of operations as determined in accordance with GAAP. These measures should only be used to evaluate the company's results of operations in conjunction with the corresponding GAAP measures.
Reconciliation to the most directly comparable GAAP measure of all non-GAAP measures included in this press release can be found in the tables included in this press release.
These non-GAAP measures are provided to enhance investors' overall understanding of the company's current financial performance and its prospects for the future. Specifically, the company believes the non-GAAP measures provide useful information to both management and investors by excluding certain expenses, gains and losses, as the case may be, that may not be indicative of its core operating results and business outlook. In addition, because the company has historically reported certain non-GAAP results to investors, the companybelieves that the inclusion of non-GAAP measures provides consistency in the company's financial reporting.
For its internal budgeting process, and as discussed further below, the company's management uses financial measures that do not include stock-based compensation expense, employer payroll taxes on stock-based compensation, amortization or impairment of acquired intangible assets, impairment of goodwill, restructuring-related charges, other certain gains, losses or charges that are not indicative of the company's core operatingresults and the income taxes associated with the foregoing. In addition to the corresponding GAAP measures, the company's management also uses the foregoing non-GAAP measures in reviewing the financial results of the company.
The company excludes the following items from non-GAAP net income, non-GAAP earnings per diluted share, non-GAAP operating margin and non-GAAP effective tax rate:
Stock-based compensation expense and related employer payroll taxes. This consists of expenses for equity awards under our equity incentive plans. We exclude stock-based compensation expense from our non-GAAP measures primarily because they are non-cash expenses. The related employer payroll taxes are dependent on our stock price and the timing and size of exercises and vesting of equity awards, over which management has limited to no control, and as such management does not believe it correlates to the operation of our business.
Amortization or impairment of acquired intangible assets, impairment of goodwill, and transaction expensesfrom the acquisition or disposal of a business. We incur amortization or impairment of acquired intangible assets and goodwill in connection with acquisitions and may incur significant gains or losses from the
(3) Number of payment transactions per active account reflects the total number of payment transactions within the previous 12 month period, divided by active customer accounts at the end of the period. (4) Total Payment Volume or “TPV” is the value of payments, net of payment reversals, successfully completed through our Payments Platform, excluding transactions processed through our gateway and Paydiant products. (5) Transaction expense rate is calculated by dividing transaction expense by TPV. (6) Transaction and loan loss rate is calculated by dividing transaction and loan loss by TPV.(7) Transaction margin is total revenue less transaction expense and transaction and loan loss, divided by total revenue.
acquisition or disposal of a business and therefore exclude these amounts from our non-GAAP measures. We exclude these items because management does not believe they are reflective of our ongoing operating results.
Restructuring. These consist of significant expenses for employee severance and other exit and disposal costs. The company excludes significant restructuring charges primarily because management does not believe they are reflective of ongoing operating results.
Certain other significant gains, losses, or charges that are not indicative of the company’s core operating results. These expenses are significant gains, losses, or charges during a period that are the result ofisolated events or transactions which have not occurred frequently in the past and are not expected to occur regularly or be repeated in the future. The company excludes these amounts from its results primarily because management does not believe they are indicative of its current or ongoing operating results.
Tax effect of non-GAAP adjustments. This amount is used to present stock-based compensation and the other amounts described above on an after-tax basis consistent with the presentation of non-GAAP net income.
The company also uses free cash flow, a non-GAAP measure. Free cash flow represents operating cash flows less purchases of property and equipment. The company considers free cash flow to be a liquidity measure that provides useful information to management and investors about the amount of cash generated by the business after the purchases of property, buildings, and equipment, which can then be used to, among other things, investin the company's business, make strategic acquisitions, and repurchase stock. A limitation of the utility of free cash flow as a measure of financial performance is that it does not represent the total increase or decrease in thecompany's cash balance for the period.
In addition to the non-GAAP measures discussed above, the company also analyzes certain measures, includingnet revenues and operating expenses, on an FX-neutral basis to better measure the comparability of operating results between periods. The company believes that changes in foreign currency exchange rates are not indicative of the company’s operations and evaluating growth in net revenues and operating expenses on an FX-neutral basis provides an additional meaningful and comparable assessment of these measures to both management and investors. FX-neutral results are calculated by translating the current period’s local currencyresults by the prior period’s exchange rate. FX-neutral growth rates are calculated by comparing the current period's FX-neutral results by the prior period's results, excluding the impact from hedging activities.
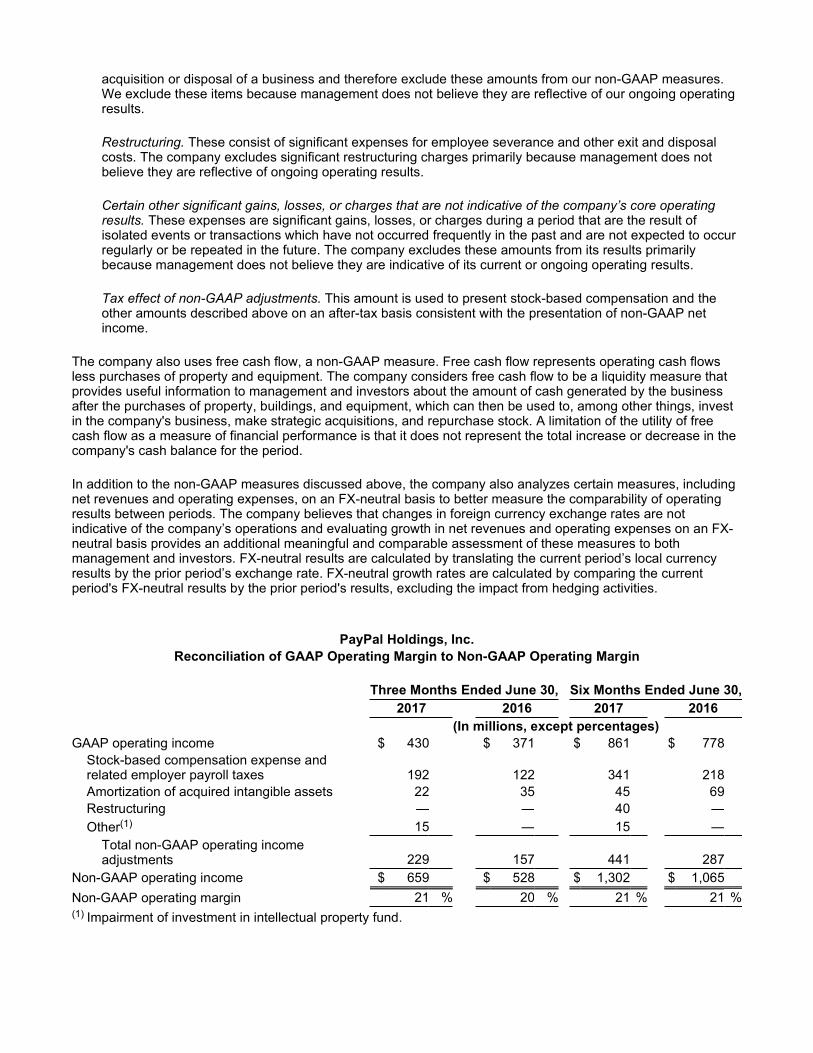
PayPal Holdings, Inc.
Reconciliation of GAAP Operating Margin to Non-GAAP Operating Margin
Three Months Ended June 30, Six Months Ended June 30,
2017 2016 2017 2016
(In millions, except percentages)
GAAP operating income $ 430 $ 371 $ 861 $ 778
Stock-based compensation expense andrelated employer payroll taxes 192 122 341 218
Amortization of acquired intangible assets 22 35 45 69
Restructuring — — 40 —
Other(1) 15 — 15 —
Total non-GAAP operating income adjustments 229 157 441 287
Non-GAAP operating income $ 659 $ 528 $ 1,302 $ 1,065
Non-GAAP operating margin 21 % 20 % 21 % 21 %(1) Impairment of investment in intellectual property fund.

Reconciliation of GAAP Net Income to Non-GAAP Net Income,
GAAP Diluted EPS to Non-GAAP Diluted EPS,
and GAAP Effective Tax Rate to Non-GAAP Effective Tax Rate
Three Months Ended June 30, Six Months Ended June 30,
2017 2016 2017 2016
(In millions, except percentages)
(unaudited)
GAAP income before income taxes $ 447 $ 380 $ 885 $ 802
GAAP income tax expense 36 57 90 114
GAAP net income 411 323 795 688
Non-GAAP adjustments to net income:
Non-GAAP operating income adjustments (see table above) 229 157 441 287
Tax effect of non-GAAP adjustments (86 ) (44 ) (148 ) (87 )
Non-GAAP net income $ 554 $ 436 $ 1,088 $ 888
Diluted net income per share:
GAAP $ 0.34 $ 0.27 $ 0.65 $ 0.57
Non-GAAP $ 0.46 $ 0.36 $ 0.89 $ 0.73
Shares used in GAAP diluted share calculation 1,215 1,215 1,216 1,220
Shares used in non-GAAP diluted share calculation 1,215 1,215 1,216 1,220
GAAP effective tax rate 8 % 15 % 10 % 14 %
Tax effect of non-GAAP adjustments to net income 10 % 4 % 8 % 4 %
Non-GAAP effective tax rate 18 % 19 % 18 % 18 %
PayPal Holdings, Inc.
Reconciliation of Operating Cash Flow to Free Cash Flow
Three Months Ended June 30, Six Months Ended June 30,
2017 2016 2017 2016
(In millions/unaudited)
Net cash provided by operating activities $ 921 $ 696 $ 1,672 $ 1,434
Less: Purchases of property and equipment (174 ) (201 ) (322 ) (334 )
Free cash flow $ 747 $ 495 $ 1,350 $ 1,100
Reconciliation of GAAP Net Revenues by Type to Non-GAAP Pro Forma Net Revenues by Type,
and GAAP Net Revenues by Geography to Non-GAAP Pro Forma Net Revenues by Geography
Year Ended
Net Revenues by Type Three Months Ended, December 31,
December 31, September 30, June 30, March 31,
2015 2015 2015 2015 2015
(In millions/unaudited)
Transaction revenues $ 2,262 $ 1,982 $ 1,970 $ 1,914 $ 8,128
Pro forma adjustment(1) — — (4 ) (3 ) (7 )

Non-GAAP pro forma transaction revenues 2,262 1,982 1,966 1,911 8,121
Other value added services $ 294 276 327 223 $ 1,120
Pro forma adjustment(1) — — — — —
Non-GAAP pro forma other value added services 294 276 327 223 1,120
Total net revenues $ 2,556 $ 2,258 $ 2,297 $ 2,137 $ 9,248
Pro forma adjustment(1) — — (4 ) (3 ) (7 )
Total non-GAAP pro forma net revenues 2,556 2,258 2,293 2,134 9,241
(1) Reflects the impact of lower transaction revenues from payment services provided by PayPal to eBay as the result of the terms of certain commercial agreements negotiated between the parties that stipulate lower transaction fees than those historically charged to eBay.
Year Ended
Net Revenues by Geography Three Months Ended, December 31,
December 31, September 30, June 30, March 31,
2015 2015 2015 2015 2015
(In millions/unaudited)
U.S. net revenues $ 1,302 $ 1,138 $ 1,170 $ 1,030 $ 4,640
Pro forma adjustment(1) — — (3 ) (2 ) (5 )
Non-GAAP pro forma U.S. net revenues 1,302 1,138 1,167 1,028 4,635
International net revenues $ 1,254 $ 1,120 $ 1,127 $ 1,107 $ 4,608
Pro forma adjustment(1) — — (1 ) (1 ) (2 )
Non-GAAP pro forma international net revenues 1,254 1,120 1,126 1,106 4,606
Total net revenues $ 2,556 $ 2,258 $ 2,297 $ 2,137 $ 9,248
Pro forma adjustment(1) — — (4 ) (3 ) (7 )
Non-GAAP pro forma net revenues 2,556 2,258 2,293 2,134 9,241
(1) Reflects the impact of lower transaction revenues from payment services provided by PayPal to eBay as the result of the terms of certain commercial agreements negotiated between the parties that stipulate lower transaction fees than those historically charged to eBay.
Contacts
PayPalInvestor Relations ContactGabrielle RabinovitchVice President, Investor [email protected] Relations ContactAmanda Miller, 408-219-0563Director, Corporate Communications