Embed Size (px)
Citation preview
PCU Standards for Sri Lanka Highway Design
Amal S. Kumarage, BSc(Eng.), PhD, MCIT, AMIE(SL)
Paper Presented at the Annual Sessions
Institute of Engineers Sri Lanka
October 1996

i
Abstract
The Passenger Car Unit (PCU) value is a extremely sensitive parameter in highway capacity design.
Each country has its unique. PCU values depending on vehicle mix by type, make and age, road
design and driving habits.
This study attempts to establish statistically acceptable values for different traffic movements, and
design of highways in Sri Lanka. Suitable vehicle groupings have been identified to determine, the
appropriate PCU values. Mean values have been calculated for use in highway design and feasibility
studies in Sri Lanka. A comparison with homegenity modelling has also been carried out, together
with values from other countries.

1
1. INTRODUCTION
Passenger Car Units (PCUs) have been consistently used in traffic and highway design and planning
exercises around the world. They are popular among planners due to their simplification nature
whereby they convert operational characteristics of different vehicles into equivalent passenger car
units. Highway design manuals such as the Highway Capacity Manual are all based on PCU factors
for different vehicle types. Therefore, the accuracy of the PCU factors is generally a very important
aspect of highway planning as capacities and levels of service computations are extremely sensitive to
the PCU values ascribed to the different types of vehicles.
This importance is even greater in developing countries such as Sri Lanka, which have a very high
proportion of non-car vehicles. In developed countries, cars constitute between 70-80% of the traffic
flow. In Sri Lanka, it is only around 20-30%. Thus the correctness of the factors given for the non-car
vehicles is much more important in Sri Lanka.
Unfortunately, estimating the correct PCU values is not as easy a task as using them. This difficulty
arises, because there are no universal PCU values that can be used across different countries. Each
country will have its unique PCU values depending on vehicle mix by type, make and age, road
designs, driving habits etc. While a general idea prevails regarding the range of PCU values for Sri
Lanka, an exhaustive study which examines the PCU and its variations for the Sri Lankan context
have not been documented.
2. METHODOLOGY
There are several methods available for the estimation of PCU's. Under broad headings, they will
either determine the PCU value based on the effect on speed of other vehicles (such as under free
flow) or based on the effect of road capacity (such as under saturated flow).
2.1 Speed-Flow Method
This is considered as an indirect method of determining the relative PCU values by using the speed-
flow relationship. In this method, the mean observed speed of one vehicle type is given as the
dependant variable and regressed against observed flow being the independent variable. This
relationship derived from the speed-flow relationship can be shown as follows:
Q-C=V jjj β
2
where
V j is the observed mean space-mean speed of the vehicles of type j,
Q is the observed flow rate in PCUs per hour,
C j is the theoretical mean free speed of vehicle type j under free flow conditions,
βj is the rate at which speed of vehicle type j will diminish for a unit increase in flow rate.
2.2 Simulation
Computer based simulation techniques can also be used to model the PCU of a given vehicle type
under different flow conditions. These approaches however need prolonged study and development
and should be supported by large data bases on which they can be calibrated. Such databases are not
available in Sri Lanka.
2.3 Headway Method
This method is based on the simple relationship between volume and headway that
The relationship between headway and time leads to the relationship between volume and time given
as
Where
t i - time taken by platoon i,
qij
- number of vehicles of type j in platoon i,
C - constant time loss per platoon,
α j - flow rate (secs/veh) for vehicle type j.
y(h)TimeHeadwa
1=Volume(Q)
q+c=t ijji ∑α
3
3. DATA COLLECTION
The data collection process comprised of several components. These were:
(a) Measurement of Saturated Flow at Signalised Intersections (3 locations).
(b) Measurement of Saturated Flow at Roundabouts (4 locations).
(c) Measurement of Speed-Flow Relationship on Highways (14 locations).
3.1 Measurement of Saturated
Flow at Signalised
Intersection
Three intersections in Colombo, Sri Lanka were subjected to these surveys. These are:
SI-1 Dickman's Road/Galle Road (at Bambalapitiya)
SI-2 DS Senanayake Rd/Castle St (at Borella)
SI-3 Armour Street/Jetawana Rd (at Armour St)
The number of vehicles moving as a platoon under saturated flow condition on each turning
movement were recorded together with the time taken for that platoon movement. The vehicles and
pedestrian activity was classified into 16 different types.
The turning movements have been classified as:
(i) Through Only (TO)
(ii) Shared Through & Left (STL)
(iii) Shared Through & Right (STR)
(iv) Shared Through, Left & Right) (STLR)
(v) Left Turn Only (LO)
(vi) Right Turn Only (RO)
(vii) Shared Left & Right (SLR)
The vehicles have been classified as:
1.
Mot
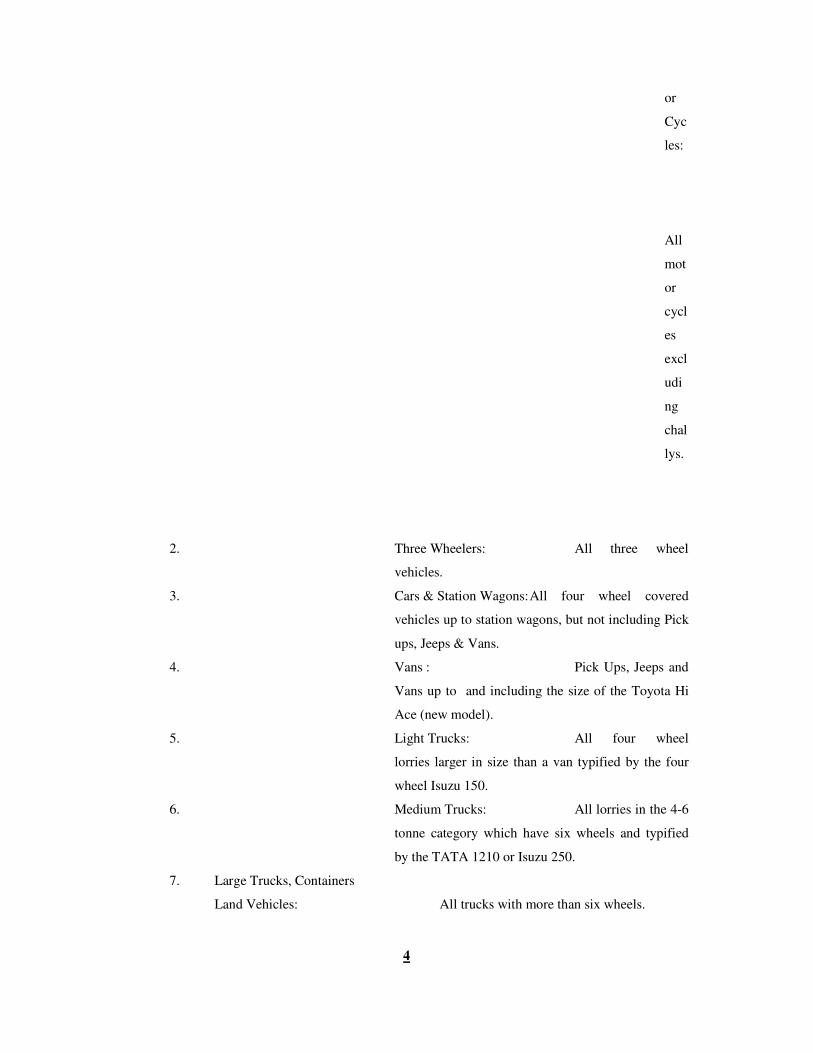
4
or
Cyc
les:
All
mot
or
cycl
es
excl
udi
ng
chal
lys.
2. Three Wheelers: All three wheel
vehicles.
3. Cars & Station Wagons: All four wheel covered
vehicles up to station wagons, but not including Pick
ups, Jeeps & Vans.
4. Vans : Pick Ups, Jeeps and
Vans up to and including the size of the Toyota Hi
Ace (new model).
5. Light Trucks: All four wheel
lorries larger in size than a van typified by the four
wheel Isuzu 150.
6. Medium Trucks: All lorries in the 4-6
tonne category which have six wheels and typified
by the TATA 1210 or Isuzu 250.
7. Large Trucks, Containers
Land Vehicles: All trucks with more than six wheels.
5
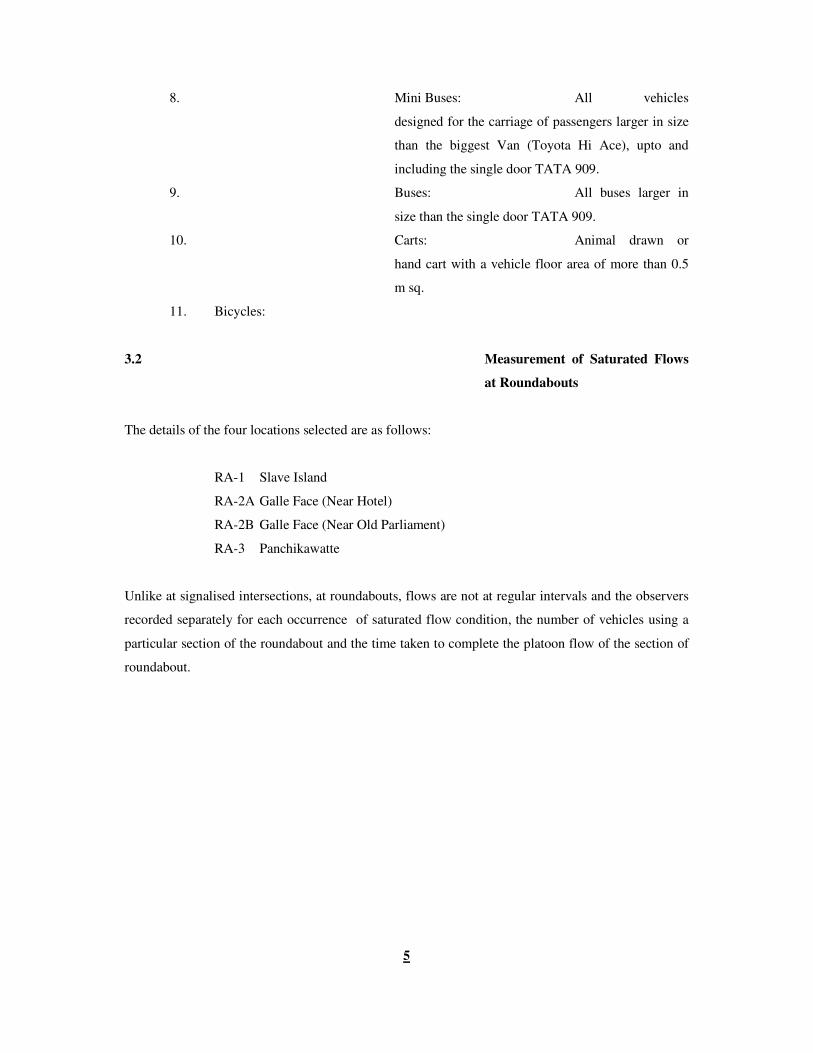
8. Mini Buses: All vehicles
designed for the carriage of passengers larger in size
than the biggest Van (Toyota Hi Ace), upto and
including the single door TATA 909.
9. Buses: All buses larger in
size than the single door TATA 909.
10. Carts: Animal drawn or
hand cart with a vehicle floor area of more than 0.5
m sq.
11. Bicycles:
3.2 Measurement of Saturated Flows
at Roundabouts
The details of the four locations selected are as follows:
RA-1 Slave Island
RA-2A Galle Face (Near Hotel)
RA-2B Galle Face (Near Old Parliament)
RA-3 Panchikawatte
Unlike at signalised intersections, at roundabouts, flows are not at regular intervals and the observers
recorded separately for each occurrence of saturated flow condition, the number of vehicles using a
particular section of the roundabout and the time taken to complete the platoon flow of the section of
roundabout.
6
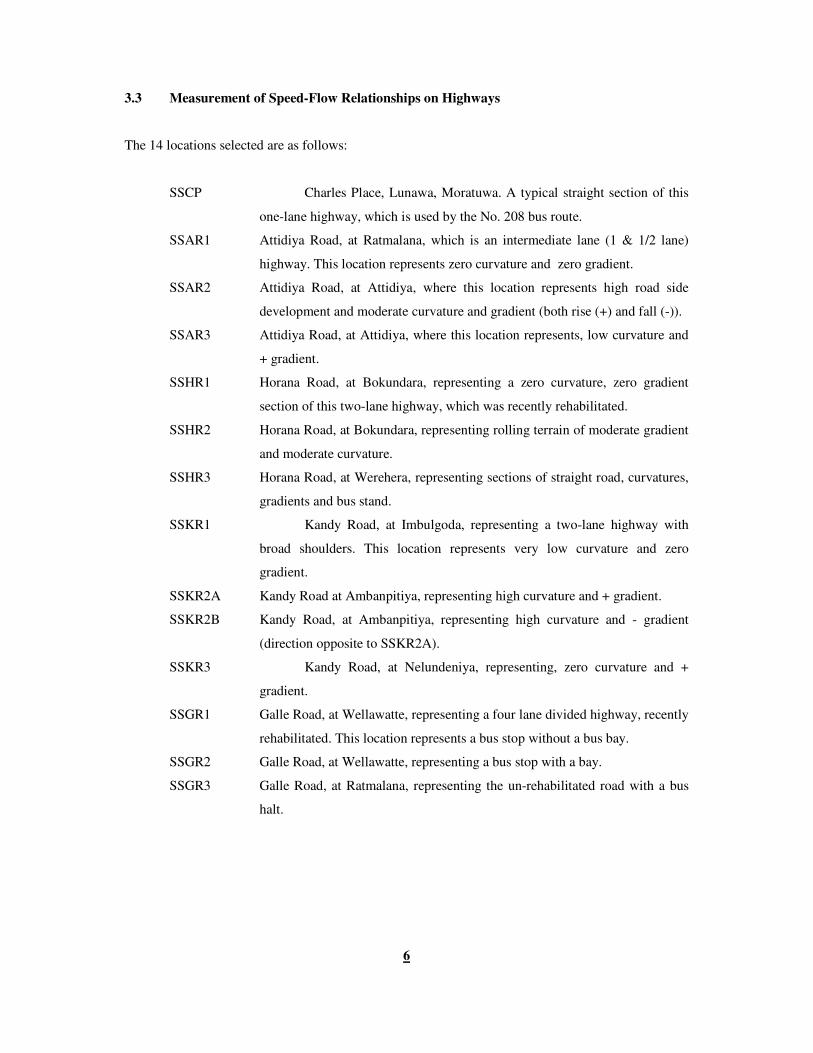
3.3 Measurement of Speed-Flow Relationships on Highways
The 14 locations selected are as follows:
SSCP Charles Place, Lunawa, Moratuwa. A typical straight section of this
one-lane highway, which is used by the No. 208 bus route.
SSAR1 Attidiya Road, at Ratmalana, which is an intermediate lane (1 & 1/2 lane)
highway. This location represents zero curvature and zero gradient.
SSAR2 Attidiya Road, at Attidiya, where this location represents high road side
development and moderate curvature and gradient (both rise (+) and fall (-)).
SSAR3 Attidiya Road, at Attidiya, where this location represents, low curvature and
+ gradient.
SSHR1 Horana Road, at Bokundara, representing a zero curvature, zero gradient
section of this two-lane highway, which was recently rehabilitated.
SSHR2 Horana Road, at Bokundara, representing rolling terrain of moderate gradient
and moderate curvature.
SSHR3 Horana Road, at Werehera, representing sections of straight road, curvatures,
gradients and bus stand.
SSKR1 Kandy Road, at Imbulgoda, representing a two-lane highway with
broad shoulders. This location represents very low curvature and zero
gradient.
SSKR2A Kandy Road at Ambanpitiya, representing high curvature and + gradient.
SSKR2B Kandy Road, at Ambanpitiya, representing high curvature and - gradient
(direction opposite to SSKR2A).
SSKR3 Kandy Road, at Nelundeniya, representing, zero curvature and +
gradient.
SSGR1 Galle Road, at Wellawatte, representing a four lane divided highway, recently
rehabilitated. This location represents a bus stop without a bus bay.
SSGR2 Galle Road, at Wellawatte, representing a bus stop with a bay.
SSGR3 Galle Road, at Ratmalana, representing the un-rehabilitated road with a bus
halt.
7
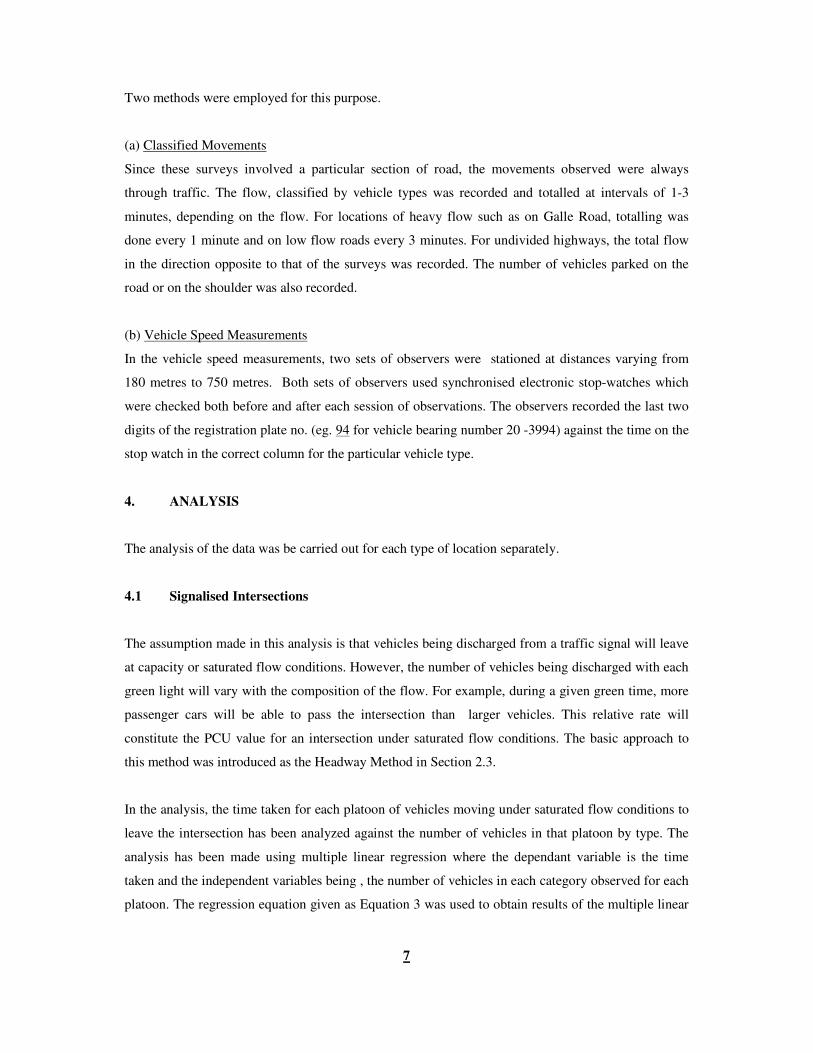
Two methods were employed for this purpose.
(a) Classified Movements
Since these surveys involved a particular section of road, the movements observed were always
through traffic. The flow, classified by vehicle types was recorded and totalled at intervals of 1-3
minutes, depending on the flow. For locations of heavy flow such as on Galle Road, totalling was
done every 1 minute and on low flow roads every 3 minutes. For undivided highways, the total flow
in the direction opposite to that of the surveys was recorded. The number of vehicles parked on the
road or on the shoulder was also recorded.
(b) Vehicle Speed Measurements
In the vehicle speed measurements, two sets of observers were stationed at distances varying from
180 metres to 750 metres. Both sets of observers used synchronised electronic stop-watches which
were checked both before and after each session of observations. The observers recorded the last two
digits of the registration plate no. (eg. 94 for vehicle bearing number 20 -3994) against the time on the
stop watch in the correct column for the particular vehicle type.
4. ANALYSIS
The analysis of the data was be carried out for each type of location separately.
4.1 Signalised Intersections
The assumption made in this analysis is that vehicles being discharged from a traffic signal will leave
at capacity or saturated flow conditions. However, the number of vehicles being discharged with each
green light will vary with the composition of the flow. For example, during a given green time, more
passenger cars will be able to pass the intersection than larger vehicles. This relative rate will
constitute the PCU value for an intersection under saturated flow conditions. The basic approach to
this method was introduced as the Headway Method in Section 2.3.
In the analysis, the time taken for each platoon of vehicles moving under saturated flow conditions to
leave the intersection has been analyzed against the number of vehicles in that platoon by type. The
analysis has been made using multiple linear regression where the dependant variable is the time
taken and the independent variables being , the number of vehicles in each category observed for each
platoon. The regression equation given as Equation 3 was used to obtain results of the multiple linear
8
regression for each turning movement at each of the three signalised intersections studied, amounting
to a total of 14 equations. The higher the R2ad and lower the F-statistic, the better is the fit of the data
to the equation. For the individual t-statistics, the closer it is to zero, the greater is the evidence that
the coefficient obtained is reliable. In general practice, coefficients of over 10% have not been
considered at all. Even then, only those with t-statistics of 5% and less can be considered for
prediction purposes. A total of 18,122 vehicle observations have been used in the PCU estimation of
signalised intersections.
The high level of variation of PCU estimates between different intersections indicates the non-
uniformity of conditions among intersections. For planning purposes, a more general PCU value
would be more desirable. Hence, the PCU values of similar turning movements but from different
intersections have been aggregated and the mean and coefficient of variation given in the Table 1.
The coefficient of variation is the percentage value of the ratio between the standard deviation and the
mean value of the different PCU values. Hence the smaller it is the more evidence there is to
consistency in values. As seen in Table 1, the coefficients of variations go upto 60%. This is not
unusual given the differing conditions at signalised intersections. In general, a high amount of
confidence can be placed for coefficients of variation of 20% and less. The last row on Table 1,
shows the mean of all types of turning movements, which is the best single PCU value we can arrive
at for signalised intersections in general. However, we can observe that such general values are not
very reliable and should be used only for very broad planning purposes and not for specific designs.

9
Table 1
10
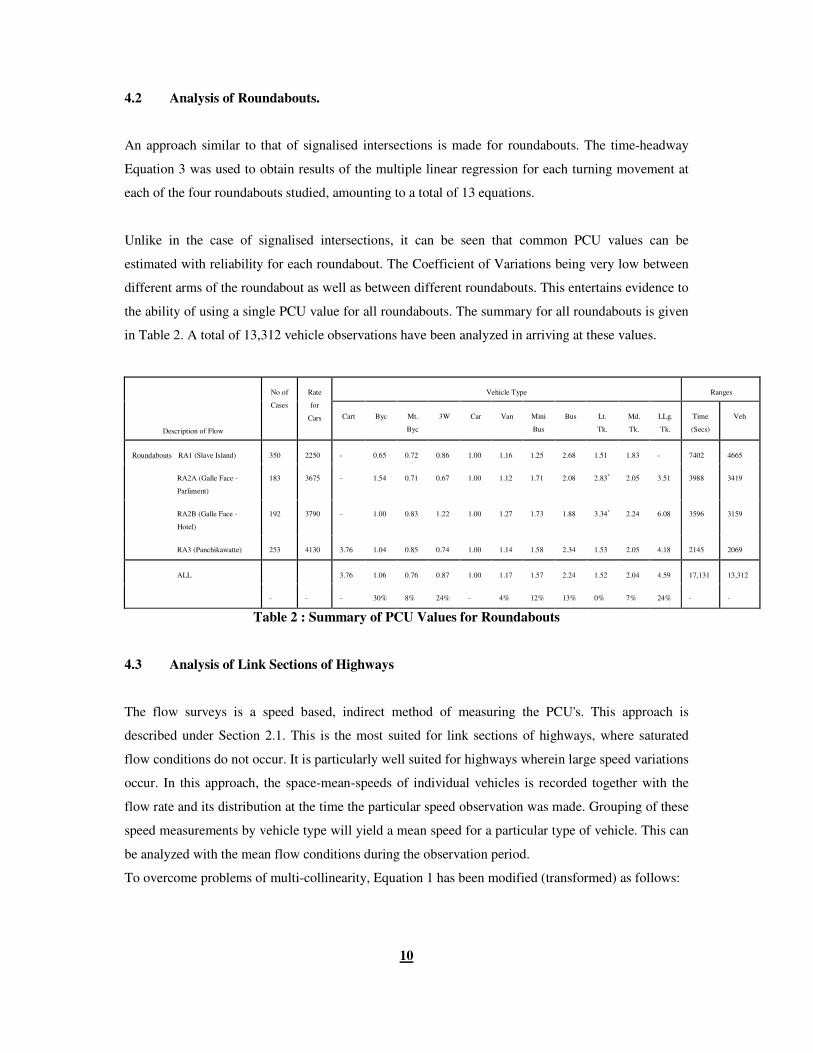
4.2 Analysis of Roundabouts.
An approach similar to that of signalised intersections is made for roundabouts. The time-headway
Equation 3 was used to obtain results of the multiple linear regression for each turning movement at
each of the four roundabouts studied, amounting to a total of 13 equations.
Unlike in the case of signalised intersections, it can be seen that common PCU values can be
estimated with reliability for each roundabout. The Coefficient of Variations being very low between
different arms of the roundabout as well as between different roundabouts. This entertains evidence to
the ability of using a single PCU value for all roundabouts. The summary for all roundabouts is given
in Table 2. A total of 13,312 vehicle observations have been analyzed in arriving at these values.
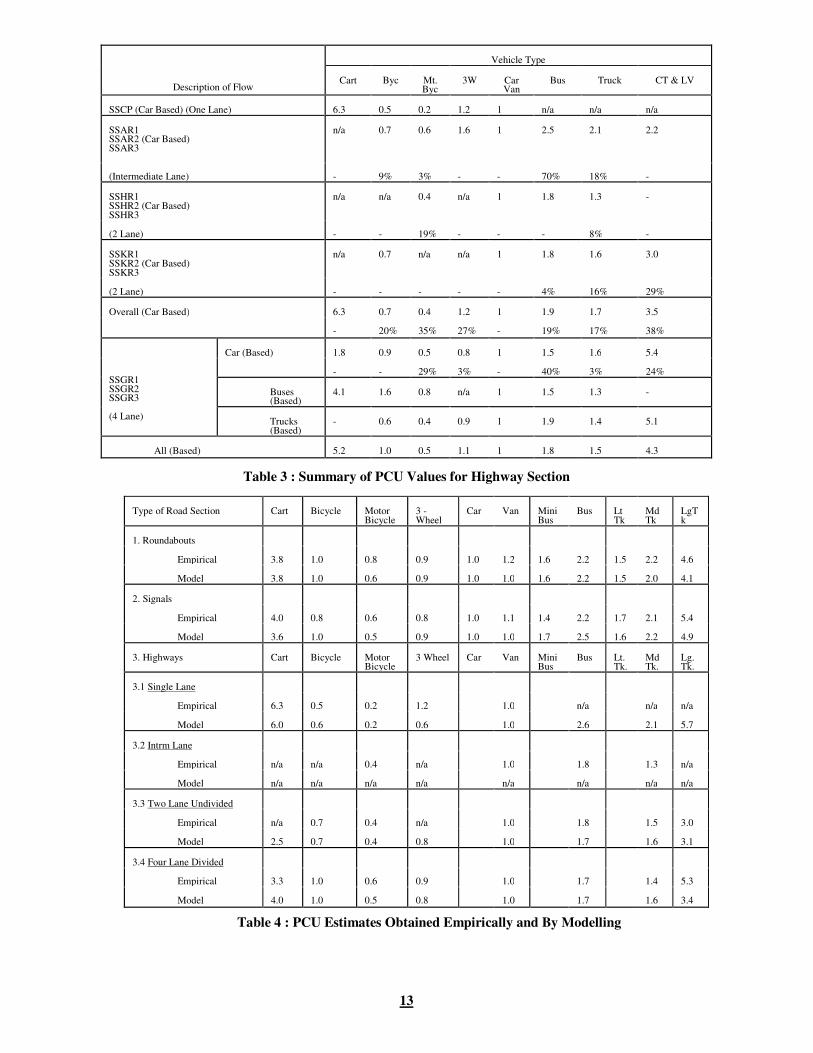
Description of Flow
No of
Cases
Rate
for
Cars
Vehicle Type
Ranges
Cart
Byc
Mt.
Byc
3W
Car
Van
Mini
Bus
Bus
Lt.
Tk.
Md.
Tk.
LLg.
Tk.
Time
(Secs)
Veh
Roundabouts RA1 (Slave Island)
350
2250
-
0.65
0.72
0.86
1.00
1.16
1.25
2.68
1.51
1.83
-
7402
4665
RA2A (Galle Face -
Parliment)
183
3675
-
1.54
0.71
0.67
1.00
1.12
1.71
2.08
2.83*
2.05
3.51
3988
3419
RA2B (Galle Face -
Hotel)
192
3790
-
1.00
0.83
1.22
1.00
1.27
1.73
1.88
3.34*
2.24
6.08
3596
3159
RA3 (Panchikawatte)
253
4130
3.76
1.04
0.85
0.74
1.00
1.14
1.58
2.34
1.53
2.05
4.18
2145
2069
ALL
3.76
1.06
0.76
0.87
1.00
1.17
1.57
2.24
1.52
2.04
4.59
17,131
13,312
-
-
-
30%
8%
24%
-
4%
12%
13%
0%
7%
24%
-
-
Table 2 : Summary of PCU Values for Roundabouts
4.3 Analysis of Link Sections of Highways
The flow surveys is a speed based, indirect method of measuring the PCU's. This approach is
described under Section 2.1. This is the most suited for link sections of highways, where saturated
flow conditions do not occur. It is particularly well suited for highways wherein large speed variations
occur. In this approach, the space-mean-speeds of individual vehicles is recorded together with the
flow rate and its distribution at the time the particular speed observation was made. Grouping of these
speed measurements by vehicle type will yield a mean speed for a particular type of vehicle. This can
be analyzed with the mean flow conditions during the observation period.
To overcome problems of multi-collinearity, Equation 1 has been modified (transformed) as follows:
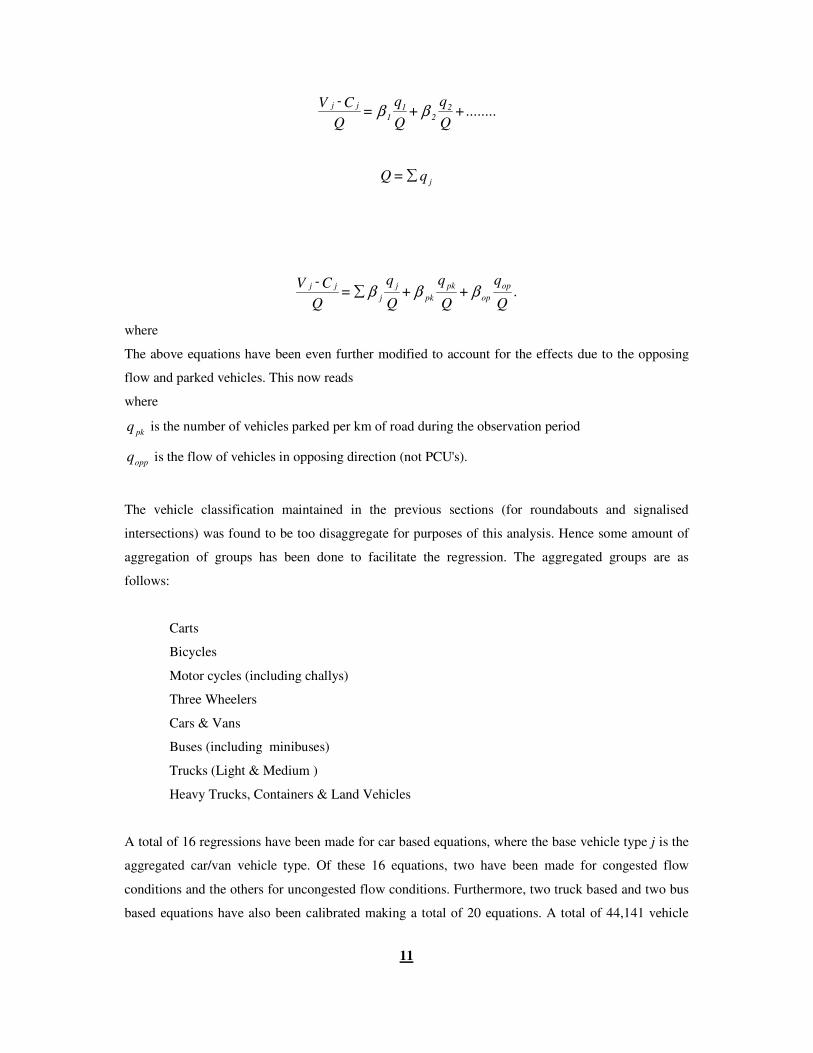
11
where
The above equations have been even further modified to account for the effects due to the opposing
flow and parked vehicles. This now reads
where
qpk
is the number of vehicles parked per km of road during the observation period
qopp
is the flow of vehicles in opposing direction (not PCU's).
The vehicle classification maintained in the previous sections (for roundabouts and signalised
intersections) was found to be too disaggregate for purposes of this analysis. Hence some amount of
aggregation of groups has been done to facilitate the regression. The aggregated groups are as
follows:
Carts
Bicycles
Motor cycles (including challys)
Three Wheelers
Cars & Vans
Buses (including minibuses)
Trucks (Light & Medium )
Heavy Trucks, Containers & Land Vehicles
A total of 16 regressions have been made for car based equations, where the base vehicle type j is the
aggregated car/van vehicle type. Of these 16 equations, two have been made for congested flow
conditions and the others for uncongested flow conditions. Furthermore, two truck based and two bus
based equations have also been calibrated making a total of 20 equations. A total of 44,141 vehicle
........+Q
q+
Q
q=
Q
C-V 2
2
1
1
jjββ
q=Qj
∑
.Q
q+
Q
q+
Q
q=
Q
C-V op
op
pk
pk
j
j
jjβββ∑
12
observations have been used in this analysis.
The large number of `un-estimatable' PCU's do not permit a comprehensive analysis of the PCU
change with road types, road geometry etc. However, mean PCU values can be estimated for general
planning purposes. These are given in Table 3, where the mean of the PCU estimates together with the
corresponding coefficient of variation are given. These also have been aggregated to a common car
base, truck base and bus based means, which in turn have been aggregated to arrive at a weighted
PCU mean for all roads.
4.4 Summary of Empirical PCU Computations
The summary of the PCU computations arrived by empirical means of the regression analysis of the
data described earlier are given in Table 4. This has been presented for roundabouts, signalised
intersections, and four different types of highways. It may be observed that there are several cells in
this table that are incomplete due to deficiencies in the data and/or analysis.
4.5 Comparison with PCU estimates by Homogenity Coefficient Modelling
A comparison is made of these empirically determined PCU values with those determined from the
modelling by homogenity coefficients (Kumarage, 1996).
From Table 4 we can see that except for the PCU values for three wheelers on one lane highways (0.6
vs. 1.2) and the PCU values for large vehicles on four lane highways (5.3 vs 3.4), the other values are
extremely well fitting. Since we can place confidence in both approaches, we can use an approach of
obtaining a mean value as the recommended PCU value. In the two cases where there were significant
discrepancies, the model value has been accepted, since it can be held that the empirical values can be
inaccurate especially given the fact that the number of observations in both three wheeler and large
vehicle category were quite small. The recommended PCU values for Sri Lanka are given in Table 5.
13
Description of Flow
Vehicle Type
Cart
Byc
Mt. Byc
3W
Car Van
Bus
Truck
CT & LV
SSCP (Car Based) (One Lane)
6.3
0.5
0.2
1.2
1
n/a
n/a
n/a
SSAR1 SSAR2 (Car Based) SSAR3
n/a
0.7
0.6
1.6
1
2.5
2.1
2.2
(Intermediate Lane)
-
9%
3%
-
-
70%
18%
-
SSHR1 SSHR2 (Car Based) SSHR3
n/a
n/a
0.4
n/a
1
1.8
1.3
-
(2 Lane)
-
-
19%
-
-
-
8%
-
SSKR1 SSKR2 (Car Based) SSKR3
n/a
0.7
n/a
n/a
1
1.8
1.6
3.0
(2 Lane)
-
-
-
-
-
4%
16%
29%
Overall (Car Based)
6.3
0.7
0.4
1.2
1
1.9
1.7
3.5
-
20%
35%
27%
-
19%
17%
38%
SSGR1 SSGR2 SSGR3 (4 Lane)
Car (Based)
1.8
0.9
0.5
0.8
1
1.5
1.6
5.4
-
-
29%
3%
-
40%
3%
24%
Buses (Based)
4.1
1.6
0.8
n/a
1
1.5
1.3
-
Trucks (Based)
-
0.6
0.4
0.9
1
1.9
1.4
5.1
All (Based)
5.2
1.0
0.5
1.1
1
1.8
1.5
4.3
Table 3 : Summary of PCU Values for Highway Section
Type of Road Section
Cart
Bicycle
Motor Bicycle
3 - Wheel
Car
Van
Mini Bus
Bus
Lt Tk
MdTk
LgTk
1. Roundabouts
Empirical
3.8
1.0
0.8
0.9
1.0
1.2
1.6
2.2
1.5
2.2
4.6
Model
3.8
1.0
0.6
0.9
1.0
1.0
1.6
2.2
1.5
2.0
4.1
2. Signals
Empirical
4.0
0.8
0.6
0.8
1.0
1.1
1.4
2.2
1.7
2.1
5.4
Model
3.6
1.0
0.5
0.9
1.0
1.0
1.7
2.5
1.6
2.2
4.9
3. Highways
Cart
Bicycle
Motor Bicycle
3 Wheel
Car
Van
Mini Bus
Bus
Lt. Tk.
MdTk.
Lg. Tk.
3.1 Single Lane
Empirical
6.3
0.5
0.2
1.2
1.0
n/a
n/a
n/a
Model
6.0
0.6
0.2
0.6
1.0
2.6
2.1
5.7
3.2 Intrm Lane
Empirical
n/a
n/a
0.4
n/a
1.0
1.8
1.3
n/a
Model
n/a
n/a
n/a
n/a
n/a
n/a
n/a
n/a
3.3 Two Lane Undivided
Empirical
n/a
0.7
0.4
n/a
1.0
1.8
1.5
3.0
Model
2.5
0.7
0.4
0.8
1.0
1.7
1.6
3.1
3.4 Four Lane Divided
Empirical
3.3
1.0
0.6
0.9
1.0
1.7
1.4
5.3
Model
4.0
1.0
0.5
0.8
1.0
1.7
1.6
3.4
Table 4 : PCU Estimates Obtained Empirically and By Modelling
14
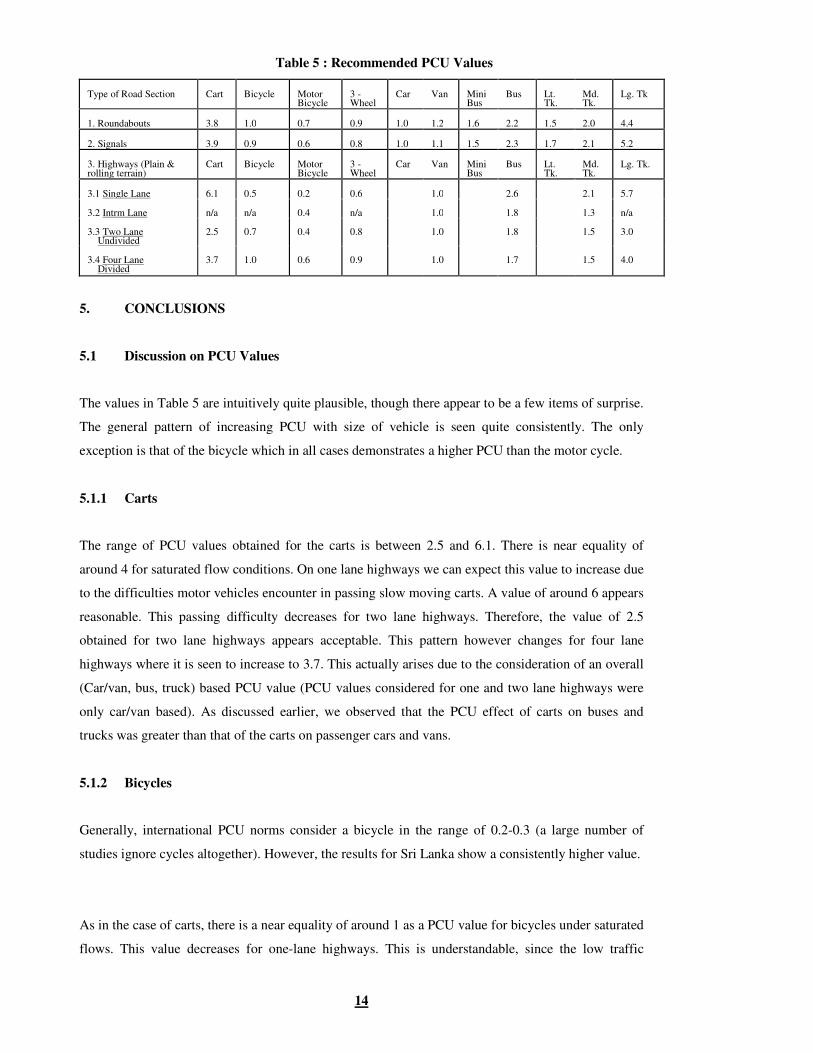
Table 5 : Recommended PCU Values
Type of Road Section
Cart
Bicycle
Motor Bicycle
3 - Wheel
Car
Van
Mini Bus
Bus
Lt. Tk.
Md. Tk.
Lg. Tk
1. Roundabouts
3.8
1.0
0.7
0.9
1.0
1.2
1.6
2.2
1.5
2.0
4.4
2. Signals
3.9
0.9
0.6
0.8
1.0
1.1
1.5
2.3
1.7
2.1
5.2
3. Highways (Plain & rolling terrain)
Cart
Bicycle
Motor Bicycle
3 - Wheel
Car
Van
Mini Bus
Bus
Lt. Tk.
Md. Tk.
Lg. Tk.
3.1 Single Lane
6.1
0.5
0.2
0.6
1.0
2.6
2.1
5.7
3.2 Intrm Lane
n/a
n/a
0.4
n/a
1.0
1.8
1.3
n/a
3.3 Two Lane Undivided
2.5
0.7
0.4
0.8
1.0
1.8
1.5
3.0
3.4 Four Lane Divided
3.7
1.0
0.6
0.9
1.0
1.7
1.5
4.0
5. CONCLUSIONS
5.1 Discussion on PCU Values
The values in Table 5 are intuitively quite plausible, though there appear to be a few items of surprise.
The general pattern of increasing PCU with size of vehicle is seen quite consistently. The only
exception is that of the bicycle which in all cases demonstrates a higher PCU than the motor cycle.
5.1.1 Carts
The range of PCU values obtained for the carts is between 2.5 and 6.1. There is near equality of
around 4 for saturated flow conditions. On one lane highways we can expect this value to increase due
to the difficulties motor vehicles encounter in passing slow moving carts. A value of around 6 appears
reasonable. This passing difficulty decreases for two lane highways. Therefore, the value of 2.5
obtained for two lane highways appears acceptable. This pattern however changes for four lane
highways where it is seen to increase to 3.7. This actually arises due to the consideration of an overall
(Car/van, bus, truck) based PCU value (PCU values considered for one and two lane highways were
only car/van based). As discussed earlier, we observed that the PCU effect of carts on buses and
trucks was greater than that of the carts on passenger cars and vans.
5.1.2 Bicycles
Generally, international PCU norms consider a bicycle in the range of 0.2-0.3 (a large number of
studies ignore cycles altogether). However, the results for Sri Lanka show a consistently higher value.
As in the case of carts, there is a near equality of around 1 as a PCU value for bicycles under saturated
flows. This value decreases for one-lane highways. This is understandable, since the low traffic
15
volumes on these roads enables larger vehicles to travel at the centre of the road thus reducing the
impact that bicycles have on their movement. For two lane highways this value increases. This
appears to be counter intuitive. However, if one were to forward the argument that on two lane
highways faster vehicles cannot find gaps in oncoming flows as easily as they do on one lane
highways, there could be a possibility that the PCU of a bicycle on a two lane highway could be
greater than that on a one lane highway. Another factor is that faster vehicles travel at much greater
speeds on two lane highways than they do on one lane highways, whereas any increase in the speed of
bicycles will be only marginal. Thus the reductions necessary in the speeds of faster moving vehicles
will be greater on two lane highways than on one lane highways. For four lane highways, we again
observe a pattern similar to that of the carts, where the PCU of bicycles on buses was found to be
higher than on cars. The observation that on divided highways some cyclist tend to keep to the right
hand side curb may also add to the increased PCU value. Moreover, even those who do use the left
hand side often keep a good 2-4 metres away from the curb to avoid uneven pavement conditions,
parked vehicles and bus stops.
However, even after considering all these arguments it is rather difficult to accept a PCU value of
around 0.7-0.8 for bicycles. This could be on the one hand, partly due to the fact that traffic and
transport planners have consistently ignored the bicycle or have given it token PCU values have
created to road geometry which is not designed for bicycles. On the other hand, we cannot ignore the
findings of this analysis and choose to reduce the PCU value obtained for bicycles while accepting the
others as they are. Therefore it is recommended that these values be accepted. If this were to be done,
the impact of bicycles in highway design will have to taken much more seriously than it is at present.
5.1.3 Motor Cycles
The values obtained for Motor Cycles are not surprising in anyway, except the relatively high values
seen at roundabouts and signalised intersections. A value of around 0.6-0.7 seems more appropriate
for intersections as compared to the value of around 0.4 for highways. In the case of highways, we see
that the PCU value increases from 0.2 for a one lane highway to 0.6 for the four lane highway. This
increase could be attributable to the same reasons cited for the bicycle, albeit at a much lesser degree.
5.1.4 Three Wheelers
The analysis of three wheelers has returned quite close PCU values of between 0.6 to 0.9 for all road
operations. The general idea that a three wheeler will yield a PCU value between a motor cycle and a
passenger car has been confirmed in these results. As in the case of bicycles and motor cycles, we
observe that three wheelers also show near equal PCU values at intersections, and reduced values on
one lane highways while increasing for wider roads.
16
5.1.5 Cars & Vans
As suggested earlier, there appears to be no problem in considering the car plus van category of
vehicles as the common base for PCU considerations. At intersections, the difference in PCU
estimates has been only a maximum of 20% for vans over cars. Though values for the highways are
not available, it is anticipated that this would be less; probably in the 5-10% range.
5.1.6 Minibus & Buses
In the section of analysis on the highways these two groups have been considered together. Overall
the bus to minibus observed flow ratio is around 1: 3. At intersections, we observe that a bus has a
PCU value about 50% more than a minibus. On highway sections we can expect this difference to be
less; probably in the range 20-40%. The overall PCU value for all buses obtained for one lane
highways which is 2.6 is quite high. This is not surprising given that a large number of bus stops on
the one lane highways do not allow overtaking space for vehicles following a bus. Therefore delays
can be large. For wider roads this value is seen to reduce to around 1.7.
5.1.7 Light Trucks & Medium Trucks
As in the case of buses, these two vehicle types also have been aggregated in the analysis for the
highway sections. At intersections we observe that the medium trucks have a PCU value
approximately 30% more than the light trucks. For the highway section we once again see a higher
value for one lane highways. As expected it is lower than that of buses. This PCU value decreases for
larger roads but always it is lower than that of the bus, keeping to what one would expect.
5.1.8 Large Trucks, Container Trucks & Land Vehicles
This is a mixed bag of vehicle types. It has been so aggregated mainly due to the fact that it is difficult
to get a sufficiently large number of observations of any one particular type to facilitate an accurate
PCU computation of each individual vehicle type. Secondly, their operating nature does lead to an
expectations of PCU values higher than other trucks.
Though there are variations in values between roundabouts and intersections, the fact that the values
obtained are closely correlated with that of carts is an indication of their impact on the traffic flow. As
in the case of carts and bicycles, these large vehicles have a higher effect on buses and trucks than on
passenger cars.
5.2 Determination of Single PCU Value
17
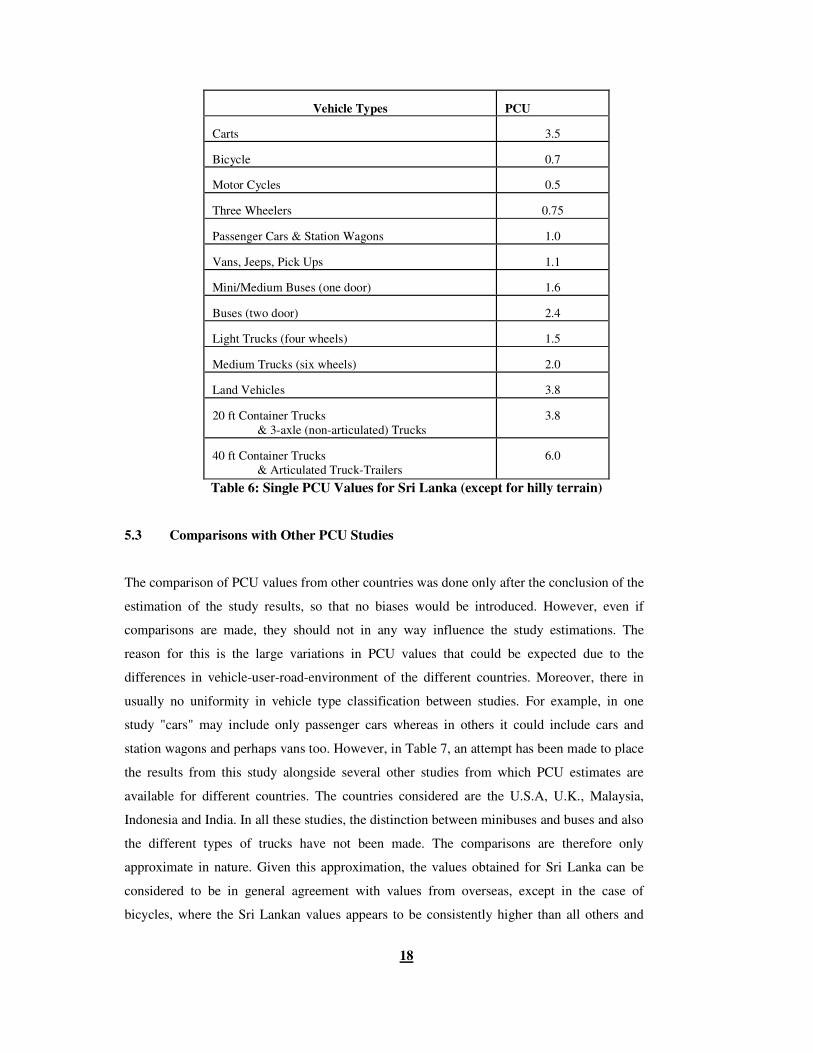
As discussed earlier, it is quite inappropriate to use universal PCU values for different types of
highway planning exercises in Sri Lanka. It is strongly recommended that the results shown in Section
4 be considered in determining the appropriate PCU value to be used for each particular design or
planning application. Moreover, there are a number of road usages, such as the movements at
uncontrolled intersections, reversing and parking of vehicles, the PCU values for which cannot be
calculated accurately. However, the need arises ever often for broad planning exercises where a single
PCU value is sought for the entire highway network. The values given in Table 6 can be used in such
instances. These values have been computed at by taking an approximate mean of all values in Table
5. The assumption therein is that there is near equal usage of the different types considered therein.
One deficiency here is the lack of values for hilly terrain. Even without the values for hilly terrain,
these PCU values maybe considered as adequately accurate while being simple to use.
18
Vehicle Types
PCU
Carts
3.5
Bicycle
0.7
Motor Cycles
0.5
Three Wheelers
0.75
Passenger Cars & Station Wagons
1.0
Vans, Jeeps, Pick Ups
1.1
Mini/Medium Buses (one door)
1.6
Buses (two door)
2.4
Light Trucks (four wheels)
1.5
Medium Trucks (six wheels)
2.0
Land Vehicles
3.8
20 ft Container Trucks
& 3-axle (non-articulated) Trucks
3.8
40 ft Container Trucks
& Articulated Truck-Trailers
6.0
Table 6: Single PCU Values for Sri Lanka (except for hilly terrain)
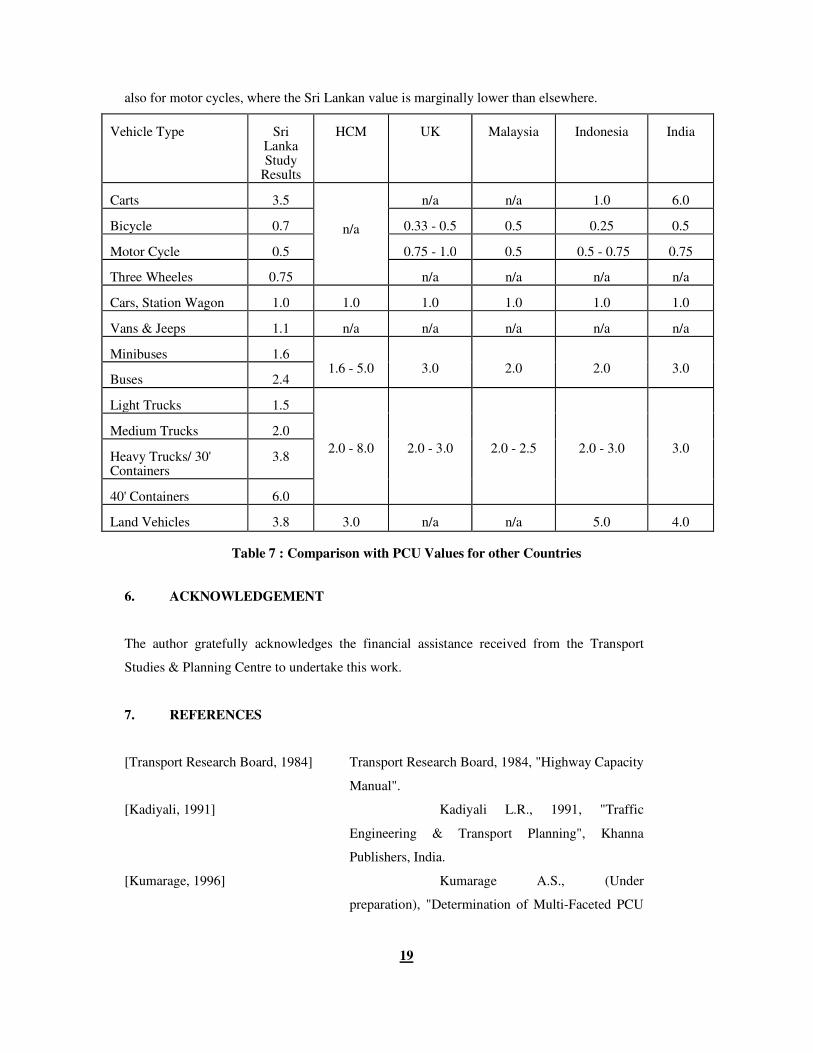
5.3 Comparisons with Other PCU Studies
The comparison of PCU values from other countries was done only after the conclusion of the
estimation of the study results, so that no biases would be introduced. However, even if
comparisons are made, they should not in any way influence the study estimations. The
reason for this is the large variations in PCU values that could be expected due to the
differences in vehicle-user-road-environment of the different countries. Moreover, there in
usually no uniformity in vehicle type classification between studies. For example, in one
study "cars" may include only passenger cars whereas in others it could include cars and
station wagons and perhaps vans too. However, in Table 7, an attempt has been made to place
the results from this study alongside several other studies from which PCU estimates are
available for different countries. The countries considered are the U.S.A, U.K., Malaysia,
Indonesia and India. In all these studies, the distinction between minibuses and buses and also
the different types of trucks have not been made. The comparisons are therefore only
approximate in nature. Given this approximation, the values obtained for Sri Lanka can be
considered to be in general agreement with values from overseas, except in the case of
bicycles, where the Sri Lankan values appears to be consistently higher than all others and
19
also for motor cycles, where the Sri Lankan value is marginally lower than elsewhere.
Vehicle Type
Sri
Lanka Study
Results
HCM
UK
Malaysia
Indonesia
India
Carts
3.5
n/a
n/a
n/a
1.0
6.0
Bicycle
0.7
0.33 - 0.5
0.5
0.25
0.5
Motor Cycle
0.5
0.75 - 1.0
0.5
0.5 - 0.75
0.75
Three Wheeles
0.75
n/a
n/a
n/a
n/a
Cars, Station Wagon
1.0
1.0
1.0
1.0
1.0
1.0
Vans & Jeeps
1.1
n/a
n/a
n/a
n/a
n/a
Minibuses
1.6
1.6 - 5.0
3.0
2.0
2.0
3.0 Buses
2.4
Light Trucks
1.5
2.0 - 8.0
2.0 - 3.0
2.0 - 2.5
2.0 - 3.0
3.0
Medium Trucks
2.0
Heavy Trucks/ 30' Containers
3.8
40' Containers
6.0
Land Vehicles
3.8
3.0
n/a
n/a
5.0
4.0
Table 7 : Comparison with PCU Values for other Countries
6. ACKNOWLEDGEMENT
The author gratefully acknowledges the financial assistance received from the Transport
Studies & Planning Centre to undertake this work.
7. REFERENCES
[Transport Research Board, 1984] Transport Research Board, 1984, "Highway Capacity
Manual".
[Kadiyali, 1991] Kadiyali L.R., 1991, "Traffic
Engineering & Transport Planning", Khanna
Publishers, India.
[Kumarage, 1996] Kumarage A.S., (Under
preparation), "Determination of Multi-Faceted PCU

20
factors based on Vehicle Characteristics".