Embed Size (px)
Citation preview
1WORKING DOCUMENT
National Strategic Planning Centre
Series: Working Paper / Number 1
Peru 2021: OECD Member Country Perú 2021: País OCDE

2 CENTRO NACIONAL DE PLANEAMIENTO ESTRATÉGICO
3WORKING DOCUMENT
National Strategic Planning Centre
Peru 2021: OECD Member Country Perú 2021: País OCDE
4 CENTRO NACIONAL DE PLANEAMIENTO ESTRATÉGICO
cA
Carlos A. AndersonPresident of the Managing Board Centro Nacional de Planeamiento Estratégico
Fredy Vargas LamaNational Director of Forecasting and Strategic Studies
Technical Team:Carmen Zeña Acosta, Miguel Sánchez Piscoya, Herbert Olivera Valentín.
Publications Coordinator:Claudia Rospigliosi Cáceda
© Centro Nacional de Planeamiento Estratégico480 Enrique Canaval y Moreyra Avenue, 11th floor San Isidro, Lima, Peru(51-1) [email protected]
Rights reservedFirst edition, February 2015Hecho el Depósito Legal en la Biblioteca Nacional del Perú Nº 2015-02180ISBN N° 978-612-4132-12-4Print run: 1000 copiesPrinted by: Bio Partners SACRUC: 20524448379Calle Mar Caribe 177 Of. 402, Santiago de Surco, Lima
5WORKING DOCUMENT
Peru 2021: OECD Member Country/Perú 2021: País OCDE
Introduction 9
1. History of the OECD 11
2. Organisation of the OECD 13
3. The work of the OECD with
Recently-Incorporated Countries 15
4. Peru and the OECD 17
5. Peru and the Challenge of the OECD: Situation 19
6. Country Programme 37
7. Gaps and Challenges 45
8. Final reflections 49
CONTENTS
cA

6 CENTRO NACIONAL DE PLANEAMIENTO ESTRATÉGICO
7WORKING DOCUMENT
Abstract
This discussion paper analyzes the possible admission of Peru as a full member of the Organisation for Economic Co-operation and Development (OECD), details the current characteristics of the Peruvian economy and the gaps that Peru needs to bridge in order to be admitted as a member. It also highlights the main benefits that Peru would over derive from being a full member of the OECD: Full membership would stamp a “seal of guarantee” for policies that will lead the country to become a developed economy in the medium term.
To that extent, the Peruvian Government has been conducting joint work with the OECD, entitled “Country Programme “, whose result will present policy recommenda-tions on key issues that will help to achieve the established goal. Our results show that it is perfectly feasible to aspire to become an OECD member before 2021, so long as the country meets the de minimum criteria as set out in this discussion paper.
Resumen Ejecutivo
El presente documento analiza la posible admisión del Perú como miembro pleno de la Organización para la Cooperación y el Desarrollo Económicos (OCDE), detalla las carac-terísticas actuales de la economía peruana y da cuenta de las brechas que se necesitan cubrir con el fin de ser admitido como país miembro. Resalta asimismo, el principal bene-ficio del Perú al obtener la membresía plena a la OCDE: un “sello de garantía” respecto a las políticas que llevarían al país a ser una economía desarrollada en el mediano plazo.
Para ello, el Gobierno Peruano viene realizando un trabajo conjunto con la OCDE, deno-minado “Programa País”, cuyo resultado presentará recomendaciones de política en temas claves que servirán para alcanzar la meta trazada. El resultado de nuestra investigación nos muestra que es perfectamente factible aspirar a ser un país miembro de la OCDE antes del año 2021, si es que se cumple con una serie de condiciones previas de carácter económi-co, social pero sobre todo institucional en el país.
PERU 2021: OECD MEMBER COUNTRY/PERÚ 2021: PAÍS OCDE

8 CENTRO NACIONAL DE PLANEAMIENTO ESTRATÉGICO
9WORKING DOCUMENT
INTRODUCTION / INTRODUCCIÓN
Peru has experienced over twenty years of uninterrupted economic growth. Among other important achievements, this growth has helped millions of people rise above poverty levels, creating opportunities for development and progress for large sectors of the population.
The country’s macroeconomic stability, which is the result of the work and effort of all Peruvians (workers, employers, public officials, private entrepreneurs), has enabled the progressive reduction of inequalities. The Gini coefficient—a measure of such inequality—has declined in recent years from 56.7 in 1999 to 44.9 in 2012, and is expected to continue its downward trend in the near future.
In recent years, Peru has become a member of the Investment Committee and of the Development Centre of The Organisation for Economic Co-operation and Development (OECD). The OECD is an organisation that brings together the largest number of developed countries but also in recent years, it has admitted some countries that are on track to become developed economies. The OECD countries produce two thirds of the goods and services in the world, and for this reason, among others, it is considered one of the most influential international organizations. The Peruvian government, in coordination with OECD, has initiated the “Country Programme “, a gap analysis and policy recommendations work on major issues to improve. This effort will allow sharing experiences on key development issues with the most developed economies in the world.
OECD Full Membership not only ensures the necessary assistance for the implementation of policies that promote prosperity and reduce poverty in the country; it also confers a sort of “seal of approval” to the policies and guidelines that will lead Peru to become a developed economy in the near future. But the path
El Perú lleva más de veinte años ininterrumpidos de crecimiento económico, que ha permitido, entre otros importantes logros, la salida de millones de personas de la situación de pobreza y la generación de oportunidades de desarrollo y progreso para grandes sectores de la población.
La estabilidad macroeconómica, fruto del trabajo y esfuerzo de todos los peruanos (trabajadores, empresarios, servidores públicos, emprendedores privados), ha hecho posible la reducción progresiva de las desigualdades en nuestro país. El coeficiente de GINI —una medida de esta desigualdad— se ha reducido durante los últimos años, de 56.7 en 1999 a 44,9 en 2012, y se prevé que la tendencia descendente continuará en el futuro próximo.
Desde hace unos años, el Perú es miembro del Comité de Inversiones y del Centro de Desarrollo en la Organización para la Cooperación Económica y el Desarrollo Económicos (OCDE). Como se sabe, la OCDE es el organismo que reúne al mayor número de países desarrollados, y que en años recientes, también ha admitido a algunos países en vías de convertirse en economías desarrolladas. Los países miembros de la OCDE producen las dos terceras partes de los bienes y servicios del mundo, y por esta razón, entre otras, es considerada como una de las organizaciones más influyentes del planeta. El Gobierno Peruano, en coordinación con la OCDE, ha iniciado el “Programa País”, que es un trabajo de análisis de brechas y recomendaciones de políticas en los principales temas a mejorar. Este esfuerzo permitirá intercambiar experiencias, sobre temas fundamentales para el desarrollo, con las economías más avanzadas del mundo.
Ser miembro de la OCDE no solo asegura la asistencia necesaria para la implementación de las políticas que fomenten la prosperidad y la reducción de la pobreza en el país, sino que además conferiría una suerte de “sello de garantía” a las políticas y lineamientos que llevarían al Perú a ser una economía desarrollada en un futuro próximo.
10 CENTRO NACIONAL DE PLANEAMIENTO ESTRATÉGICO
Pero el camino hacia el estadio de país desarrollado es muy arduo, pues hay todavía brechas por cerrar. Sobre todo, existe mucho trabajo pendiente en temas de institucionalidad, corrupción, infraestructura, servicios públicos, educación, salud, conflictos sociales, redistribución de la riqueza y desarrollo sostenible.
En esta dirección, y en el marco de la búsqueda de una visión concertada de país hacia 2021 (año de nuestro bicentenario como nación independiente), es de vital importancia establecer un objetivo-país que refleje la aspiración de llegar hacia esta meta y que guíe los esfuerzos y voluntades de todos los peruanos hacia ella: trabajar para que el Perú sea admitido como miembro pleno de la OCDE.
Si bien el desafío es grande, el Centro Nacional de Planeamiento Estratégico (Ceplan) plantea esta meta como un propósito factible para 2021, año de nuestro bicentenario de la Independencia. Con esta finalidad, presenta este documento con objetivos concretos que ayudarían a hacer tangible el anhelo.
Este documento inicia el planteamiento con una revisión acerca de la historia de la OCDE y de su estructura organizacional. A continuación, describe las relaciones que el Perú mantiene actualmente con este organismo. Luego, detalla la evolución en algunos temas que evidencian el crecimiento como país y que son fundamentales para la admisión como miembro. Después, realiza un análisis de brechas poniendo énfasis en las labores que tenemos que realizar para lograr el objetivo de ser miembros OCDE y alcanzar el desarrollo. Finalmente, presenta las principales conclusiones del documento.
to becoming a developed country is not easy, and there are still important gaps that need to be closed. There is much work to be done on institutional issues, corruption, infrastructure, public services, education, health, social conflicts, redistribution of wealth, and sustainable development.
To such effect, in order to implement a concerted vision of the country by 2021, it is vital to establish a “country goal” that reflects the aspiration to reach this objective, guiding the efforts and goodwill of all Peruvians toward it: to work for Peru’s admittance as a full member of the OECD.
Although the challenge is great, CEPLAN has set this goal as feasible for 2021, the year we celebrate the bicentennial anniversary of our independence. To such end, this paper presents concrete intermediate goals that will help achieve this objective.
This paper begins with a review of the history of the OECD and its organisational structure, followed by a description of Peru’s current relationship with the organisation. After that, the document analyzes the evolution of some important economic issues, which exhibit Peru’s growth in recent years and the set of conditions that are essential for its the admission as a full member. We then perform a gap analysis with emphasis on the work that must be done to achieve the goal of being an OECD member by 2021.
.
11WORKING DOCUMENT
1 HISTORY OF THE OECD
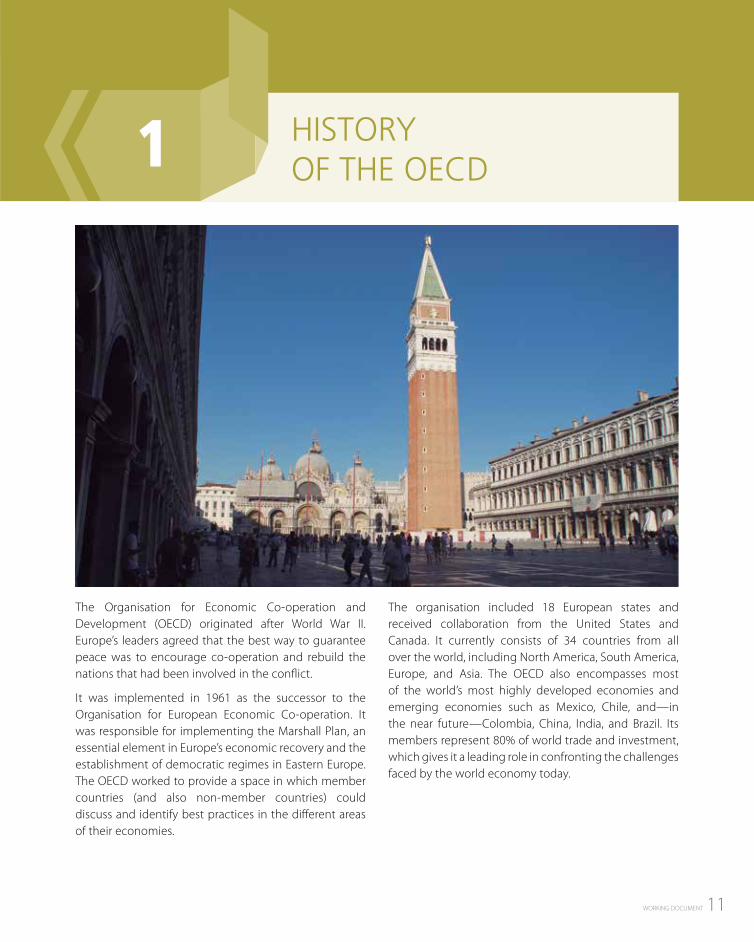
The Organisation for Economic Co-operation and Development (OECD) originated after World War II. Europe’s leaders agreed that the best way to guarantee peace was to encourage co-operation and rebuild the nations that had been involved in the conflict.
It was implemented in 1961 as the successor to the Organisation for European Economic Co-operation. It was responsible for implementing the Marshall Plan, an essential element in Europe’s economic recovery and the establishment of democratic regimes in Eastern Europe. The OECD worked to provide a space in which member countries (and also non-member countries) could discuss and identify best practices in the different areas of their economies.
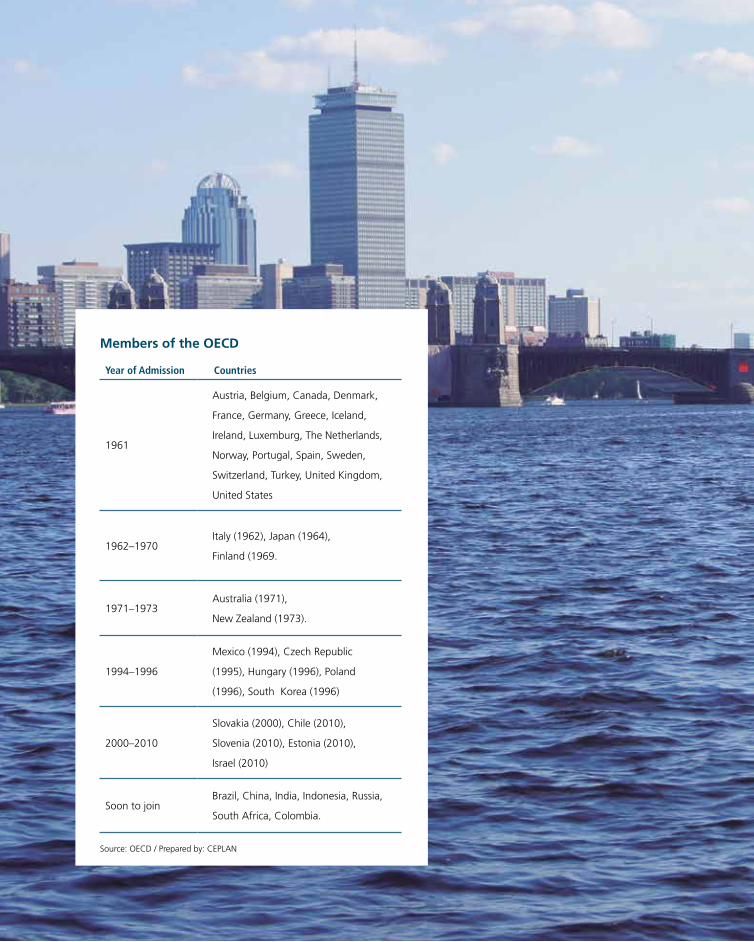
The organisation included 18 European states and received collaboration from the United States and Canada. It currently consists of 34 countries from all over the world, including North America, South America, Europe, and Asia. The OECD also encompasses most of the world’s most highly developed economies and emerging economies such as Mexico, Chile, and—in the near future—Colombia, China, India, and Brazil. Its members represent 80% of world trade and investment, which gives it a leading role in confronting the challenges faced by the world economy today.
12 CENTRO NACIONAL DE PLANEAMIENTO ESTRATÉGICO
Members of the OECD
Year of Admission Countries
1961
Austria, Belgium, Canada, Denmark,
France, Germany, Greece, Iceland,
Ireland, Luxemburg, The Netherlands,
Norway, Portugal, Spain, Sweden,
Switzerland, Turkey, United Kingdom,
United States
1962–1970Italy (1962), Japan (1964),
Finland (1969.
1971–1973Australia (1971),
New Zealand (1973).
1994–1996
Mexico (1994), Czech Republic
(1995), Hungary (1996), Poland
(1996), South Korea (1996)
2000–2010
Slovakia (2000), Chile (2010),
Slovenia (2010), Estonia (2010),
Israel (2010)
Soon to joinBrazil, China, India, Indonesia, Russia,
South Africa, Colombia.
Source: OECD / Prepared by: CEPLAN
13WORKING DOCUMENT
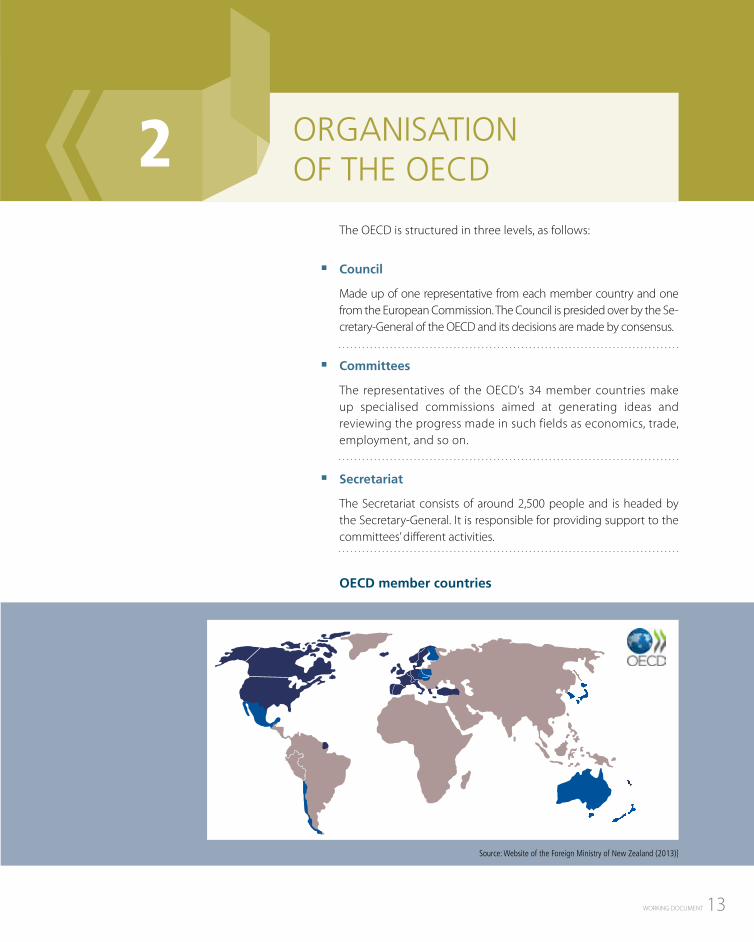
2 ORGANISATION OF THE OECD
The OECD is structured in three levels, as follows:
� Council
Made up of one representative from each member country and one from the European Commission. The Council is presided over by the Se-cretary-General of the OECD and its decisions are made by consensus.
� Committees
The representatives of the OECD’s 34 member countries make up specialised commissions aimed at generating ideas and reviewing the progress made in such fields as economics, trade, employment, and so on.
� Secretariat
The Secretariat consists of around 2,500 people and is headed by the Secretary-General. It is responsible for providing support to the committees’ different activities.
OECD member countries
Source: Website of the Foreign Ministry of New Zealand (2013)]
14 CENTRO NACIONAL DE PLANEAMIENTO ESTRATÉGICO
Its internal organisation is structured as follows:
� Office of the Secretary-General:
Includes the Secretary-General’s and the Deputy Secretaries-Generals’ offices.
� Advisors to the General Secretariat:
These include, among others: the International Futures Programme; the Council and Executive Committee Secretariat; the Directorate for Legal Affairs; and the Global Relations Secretariat.
� Executive Directorate and Public Affairs Directorate:
These are both responsible for the organisation’s management and relations with the media and governments.
� Thematic Departments:
There are 12 departments within the OECD. The principle ones are as follows: Development Co-operation Directorate; Economics Department; Directorate for Education and Skills; Directorate for Employment; Labour and Social Affairs; Centre for Entrepreneurship and SMEs; Environment Directorate; and the Directorate for Financial and Enterprise Affairs.
� Special Bodies:
This group includes special projects, such as: the Africa Partnership Forum; the OECD Development Centre; the Financial Action Task Force; the International Energy Agency; the International Transport Forum; and the Nuclear Energy Agency, among others.34 OECD
member countries
15WORKING DOCUMENT
3 WORK OF THE OECD WITH RECENTLY-INCORPORATED COUNTRIES
As has been mentioned, the incorporation of a new economy as a full member of the OECD indicates that the country has a coherent vision of itself and possesses a set of serious policies that will lead it to become a developed economy in the medium term. However, this does not ensure per se that the country has achieved standards of efficiency in all the services it provides.
One of the OECD’s basic tasks is to provide advice to new members on the most important matters pending in each developing nation, in order to bring the quality and coverage levels of public services and governance up to the standards of the most developed countries in the organisation.
The following are summaries of some of the studies and other work being carried out by the OECD in recent months in the four countries admitted in 2010 (Slovenia, Estonia, Chile, and Israel).
In Slovenia:
� Fiscal sustainability and pension system
Given that fiscal sustainability and the pension system are the weakest parts of its economy, strengthening them is essential for the long-term sustainable development of Slovenia.
� Efficiencies in health system
Reviewing processes and detecting problems in health systems can help reduce unnecessary state spending, which will result in improving the quality of patient care.
� Financial system reform
Another weak point, according to OECD studies, is inadequate banking supervision resulting in a poor-quality loan portfolio.
16 CENTRO NACIONAL DE PLANEAMIENTO ESTRATÉGICO
In Estonia:
� Health system reforms
Despite enjoying a healthier fiscal position than the majority of OECD countries, Estonia has seen its fiscal accounts deteriorate in recent years. The OECD is carrying out studies aimed at reforming the health service to achieve efficiencies.
� Reform of the structures and skills of regional governments
The OECD finds that there is much progress still to be made in generating skills at the level of regional governments, the structures of which are varied and not always optimal for their own interests.
In Chile:
� Frontal attack on poverty
The OECD is currently working hard to give Chile the tools required to accelerate the reduction in poverty to that of the most advanced member countries. The idea is to review the efficiency of Chile’s social programmes and the so-called Ethical Family Income. This has also helped to determine the importance of opening employment promotion offices where they can efficiently match supply with demand.
� Decent Housing for low-income people
Another important job being carried out by the OECD in Chile involves housing programmes for low-income families. In Chile, it is estimated that 10% of people live in substandard housing and one of the OECD’s aims is to help improve public services, protect public health, and reduce air pollution in the country’s large cities.
In Israel:
� Sustainable energy development
The OECD is taking part in joint studies on Israel’s energy matrix and the changes occurring in the country since the discovery of gas off its coast. It is also taking part in a plan to reduce greenhouse gases.
One of the fundamental tasks of
the OECD is to provide advice to new members on the
most important matters that should be addressed
in each nation.
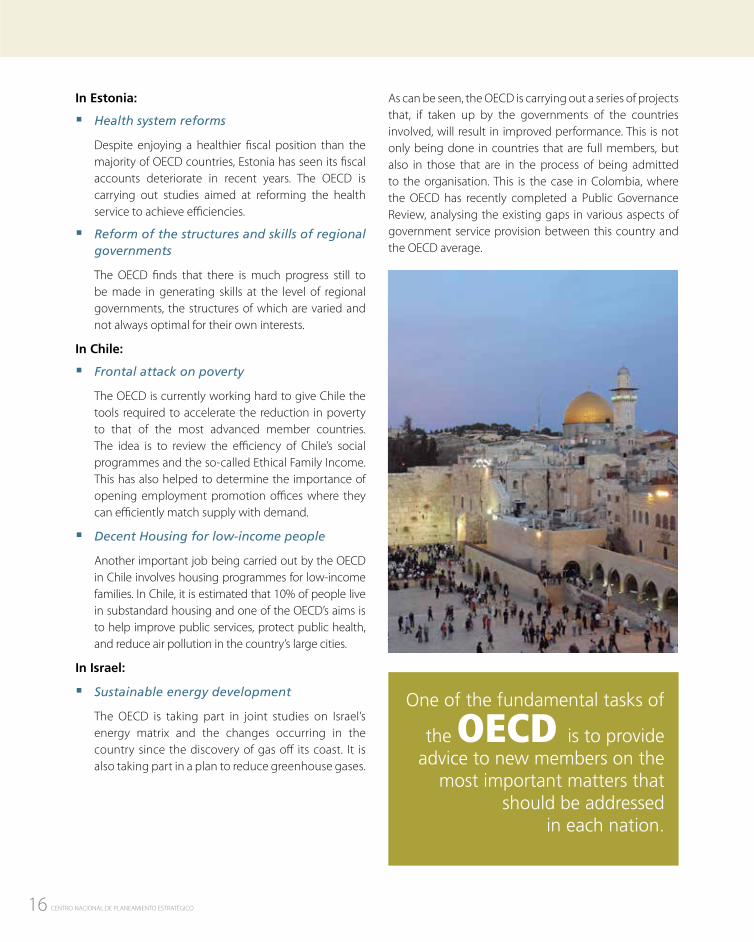
As can be seen, the OECD is carrying out a series of projects that, if taken up by the governments of the countries involved, will result in improved performance. This is not only being done in countries that are full members, but also in those that are in the process of being admitted to the organisation. This is the case in Colombia, where the OECD has recently completed a Public Governance Review, analysing the existing gaps in various aspects of government service provision between this country and the OECD average.
17WORKING DOCUMENT
� Collaboration between countries for development and compliance with public policies
The OECD is a highly specialised space where governments can compare and exchange experiences in the application of economic and social policies, where dialogue and consensus are at the core of OECD’s work.
� Exchange of experiences in strategies for encouraging prosperity and other economic matters
The study and exchange of ideas cover areas as diverse as economics, trade, investment, social development, education, territorial development, the environment, public administration, agriculture, employment, science, and technology policy, among others.
� Primary source of information and knowledge of economic development
The OECD is a worldwide source of reliable data in the field of statistics, as well as economic and social information.
� Support for increased competitiveness and ethical behaviour in the private sector
OECD guidelines for multinational companies contain principles and standards that encourage
4a. Why should we join the OECD?
Becoming a full member of the OECD is important for our economic and social development for a number of reasons. The principal reason is symbolic in nature: it would be a momentous achievement for a country that, until a short time ago, was incapable of overcoming the middle income trap.
responsible corporate conduct aimed at guaranteeing that the activities of these companies are in line with the public policies of member countries, strengthening mutual confidence between companies and the societies in which they operate, helping to improve the climate for foreign investment, and increasing the contribution of multinational companies to sustainable development.
As stated before, admission as a full member confers a guarantee, a form of “ISO certification” for the suitability and compliance of public policies and other socioeconomic development indicators, which will lead to our country to become a developed economy in the medium term. This fact constitutes an extremely valuable intangible asset for OECD member countries—an asset that Peru aspires to achieve in the near future.
PERU AND THE OECD
Admission as a member of the OECD ensures the suitability
and compliance of publicpolicies, which will lead to
our country becoming
a developedeconomy
18 CENTRO NACIONAL DE PLANEAMIENTO ESTRATÉGICO
b. The process of obtaining OECD membership in Peru
The process of convergence with the OECD has been a gradual one. Peru’s incorporation as an observer to the Investment Committee was approved in 2008. This admission formed part of the process of strengthening OECD co-operation with our economy, and is a signal of confidence that bolsters the favourable climate for investment in our country.
In 2009, Peru adhered to the OECD Development Centre, which is a space for analysis and the interchange of experiences on economic and social policies between developed and developing countries. The principal purpose of the Centre is to provide support for the adoption of policies that stimulate growth and improve living conditions for the population, particularly in developing countries.
In his message to the nation on July 28, 2014, the President proposed as a national objective to be an eligible country as a member of this organization by 2021. Consequently, Peru has started its participation in the “Country Programme”, OECD instrument that will provide policy recommendations to achieve this objective. That is why; the various sectors of public administration have organized into working groups for each of the topics within the framework of this program. These working groups will be the counterpart of existing specialized committees in the OECD.
c. What do we need to become a full member of the OECD?
It is necessary to give clear signals that the country’s policies meet minimum quality standards and that development is proceeding in a clear direction. In this aspect, we need to:
� Design and implement adequate policies and reforms in order to strengthen and, above all, ensure the sustainability of economic growth and financial stability.
� Maintain and extend the liberalisation of capital movement.
� Guarantee the expansion of export markets.
� Encourage research and professional training.
� Design and implement research and development programmes that stimulate innovation-oriented scientific and technological research.
� Provide incentives for better education to ensure that people realise their potential as human beings with the skills and abilities to meet the demand for labour.
In summary, we need clear government policies in economic and social aspects, and indicators that guarantee stability and economic growth in the search for better levels of development.
We need clear government policies in
economic and social aspects,that guarantee stability and
economicgrowth.
19WORKING DOCUMENT
5
a. Demography
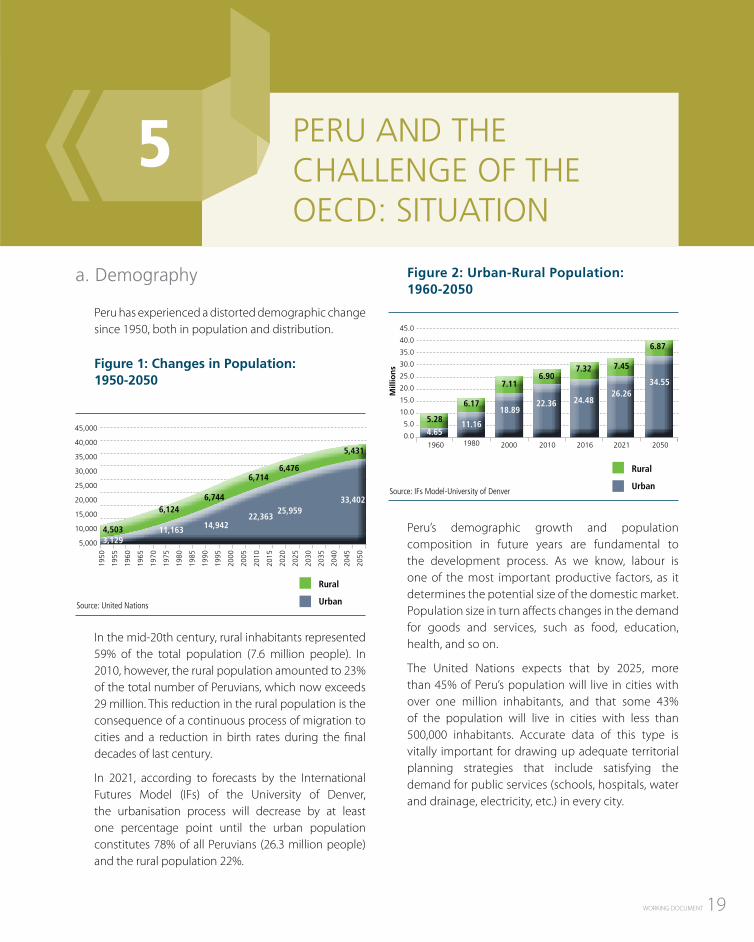
Peru has experienced a distorted demographic change since 1950, both in population and distribution.
Figure 1: Changes in Population: 1950-2050
45,000
40,000
35,000
30,000
25,000
20,000
15,000
10,000
5,000
1950
1955
1960
1965
1970
1975
1980
1985
1990
1995
2000
2005
2010
2015
2020
2025
2030
2035
2040
2045
2050
4,5033,129
6,124
11,163
6,744
14,942
6,714
22,363
6,476
25,959
5,431
33,402
Source: United Nations
In the mid-20th century, rural inhabitants represented 59% of the total population (7.6 million people). In 2010, however, the rural population amounted to 23% of the total number of Peruvians, which now exceeds 29 million. This reduction in the rural population is the consequence of a continuous process of migration to cities and a reduction in birth rates during the final decades of last century.
In 2021, according to forecasts by the International Futures Model (IFs) of the University of Denver, the urbanisation process will decrease by at least one percentage point until the urban population constitutes 78% of all Peruvians (26.3 million people) and the rural population 22%.
Rural
Urban
Figure 2: Urban-Rural Population: 1960-2050
Peru’s demographic growth and population composition in future years are fundamental to the development process. As we know, labour is one of the most important productive factors, as it determines the potential size of the domestic market. Population size in turn affects changes in the demand for goods and services, such as food, education, health, and so on.
The United Nations expects that by 2025, more than 45% of Peru’s population will live in cities with over one million inhabitants, and that some 43% of the population will live in cities with less than 500,000 inhabitants. Accurate data of this type is vitally important for drawing up adequate territorial planning strategies that include satisfying the demand for public services (schools, hospitals, water and drainage, electricity, etc.) in every city.
45.0
40.0
35.0
30.0
25.0
20.0
15.0
10.0
5.0
0.0
Mill
ion
s
5.284.65
6.17
11.16
7.11
18.89
6.90
22.36
7.32
24.48
7.45
26.26
6.87
34.55
1960 1980 2000 2010 2016 2021 2050
Source: IFs Model-University of Denver
Rural
Urban
PERU AND THE CHALLENGE OF THE OECD: SITUATION
20 CENTRO NACIONAL DE PLANEAMIENTO ESTRATÉGICO
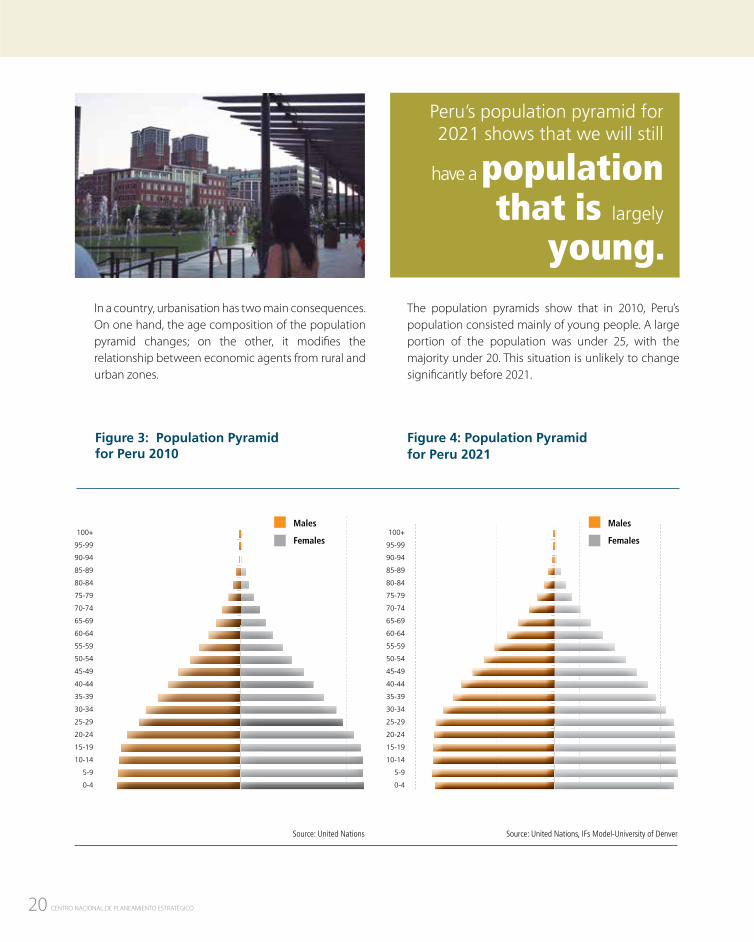
In a country, urbanisation has two main consequences. On one hand, the age composition of the population pyramid changes; on the other, it modifies the relationship between economic agents from rural and urban zones.
The population pyramids show that in 2010, Peru’s population consisted mainly of young people. A large portion of the population was under 25, with the majority under 20. This situation is unlikely to change significantly before 2021.
Figure 3: Population Pyramid for Peru 2010
100+
95-99
90-94
85-89
80-84
75-79
70-74
65-69
60-64
55-59
50-54
45-49
40-44
35-39
30-34
25-29
20-24
15-19
10-14
5-9
0-4
Source: United Nations Source: United Nations, IFs Model-University of Denver
100+
95-99
90-94
85-89
80-84
75-79
70-74
65-69
60-64
55-59
50-54
45-49
40-44
35-39
30-34
25-29
20-24
15-19
10-14
5-9
0-4
Males
Females
Males
Females
Figure 4: Population Pyramid for Peru 2021
Peru’s population pyramid for 2021 shows that we will still
have a population that is largely
young.
21WORKING DOCUMENT
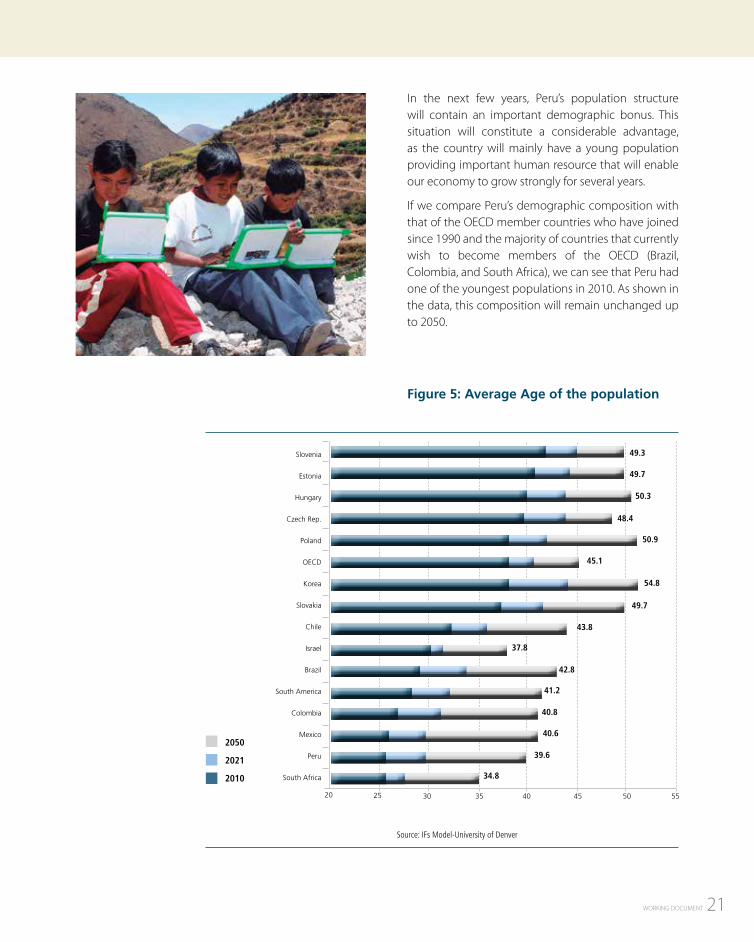
In the next few years, Peru’s population structure will contain an important demographic bonus. This situation will constitute a considerable advantage, as the country will mainly have a young population providing important human resource that will enable our economy to grow strongly for several years.
If we compare Peru’s demographic composition with that of the OECD member countries who have joined since 1990 and the majority of countries that currently wish to become members of the OECD (Brazil, Colombia, and South Africa), we can see that Peru had one of the youngest populations in 2010. As shown in the data, this composition will remain unchanged up to 2050.
Figure 5: Average Age of the population
Source: IFs Model-University of Denver
2050
2021
2010
20 25 30 35 40 45 50 55
49.3
49.7
50.3
48.4
50.9
45.1
54.8
49.7
43.8
37.8
42.8
41.2
40.8
40.6
39.6
34.8
Slovenia
Estonia
Hungary
Czech Rep.
Poland
OECD
Korea
Slovakia
Chile
Israel
Brazil
South America
Colombia
Mexico
Peru
South Africa
22 CENTRO NACIONAL DE PLANEAMIENTO ESTRATÉGICO
b. Economy
> Economic Growth and Product Compared with the OECD
Figure 6: Changes in the Peruvian Economy
35.0
30.0
25.0
20.0
15.0
10.0
5.0
0.0
Per
cap
ita
GD
P, P
PP, t
ho
usa
nd
s o
f 20
05 U
S$
GDP-OECD
Growth rate in Peru
Per capita GDP-Peru
OECD growth rate%
ch
ang
e in
rea
l GD
P
14
12
10
8
6
4
2
0
-2
-4
-6
-8
1990
1991
1992
1993
1994
1995
1996
1997
1998
1999
2000
2001
2002
2003
2004
2005
2006
2007
2008
2009
2010
2011
2012
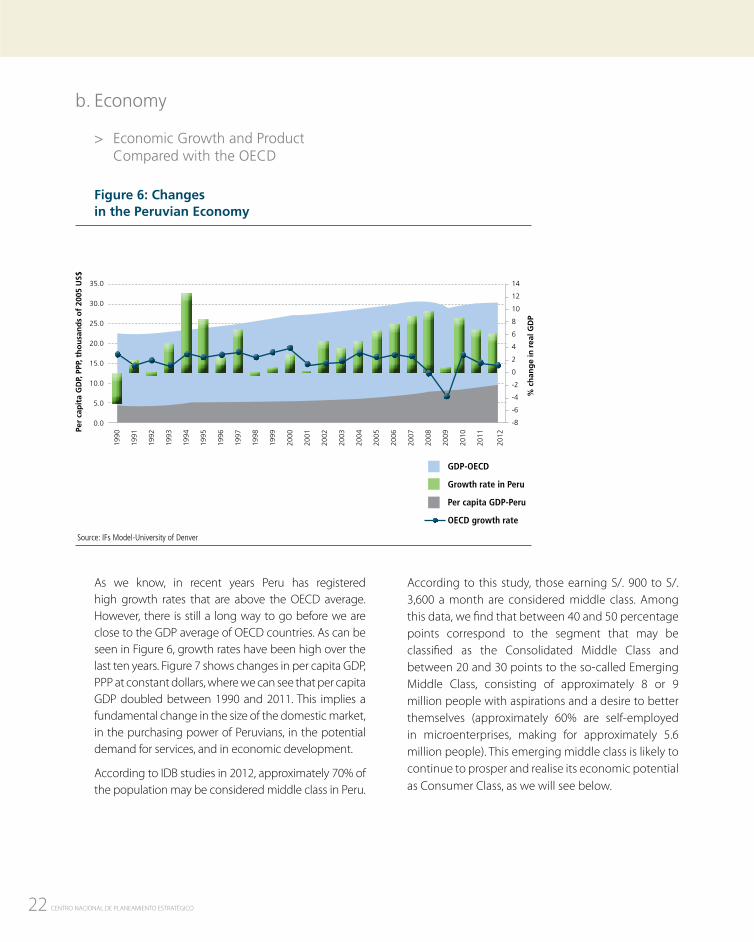
As we know, in recent years Peru has registered high growth rates that are above the OECD average. However, there is still a long way to go before we are close to the GDP average of OECD countries. As can be seen in Figure 6, growth rates have been high over the last ten years. Figure 7 shows changes in per capita GDP, PPP at constant dollars, where we can see that per capita GDP doubled between 1990 and 2011. This implies a fundamental change in the size of the domestic market, in the purchasing power of Peruvians, in the potential demand for services, and in economic development.
According to IDB studies in 2012, approximately 70% of the population may be considered middle class in Peru.
According to this study, those earning S/. 900 to S/. 3,600 a month are considered middle class. Among this data, we find that between 40 and 50 percentage points correspond to the segment that may be classified as the Consolidated Middle Class and between 20 and 30 points to the so-called Emerging Middle Class, consisting of approximately 8 or 9 million people with aspirations and a desire to better themselves (approximately 60% are self-employed in microenterprises, making for approximately 5.6 million people). This emerging middle class is likely to continue to prosper and realise its economic potential as Consumer Class, as we will see below.
Source: IFs Model-University of Denver
23WORKING DOCUMENT
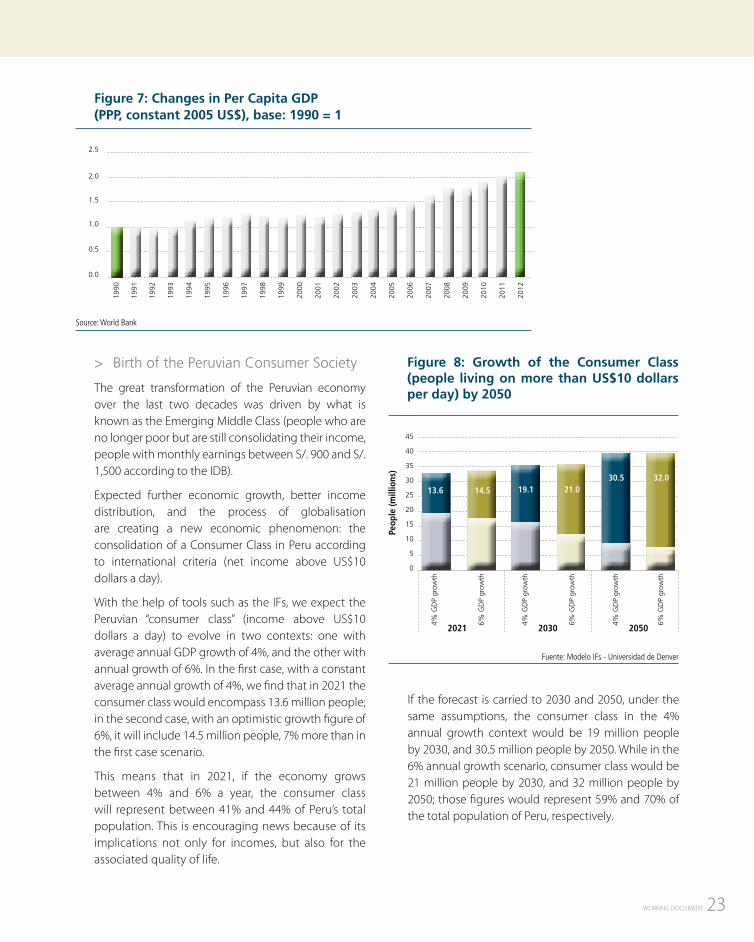
> Birth of the Peruvian Consumer Society
The great transformation of the Peruvian economy over the last two decades was driven by what is known as the Emerging Middle Class (people who are no longer poor but are still consolidating their income, people with monthly earnings between S/. 900 and S/. 1,500 according to the IDB).
Expected further economic growth, better income distribution, and the process of globalisation are creating a new economic phenomenon: the consolidation of a Consumer Class in Peru according to international criteria (net income above US$10 dollars a day).
With the help of tools such as the IFs, we expect the Peruvian “consumer class” (income above US$10 dollars a day) to evolve in two contexts: one with average annual GDP growth of 4%, and the other with annual growth of 6%. In the first case, with a constant average annual growth of 4%, we find that in 2021 the consumer class would encompass 13.6 million people; in the second case, with an optimistic growth figure of 6%, it will include 14.5 million people, 7% more than in the first case scenario.
This means that in 2021, if the economy grows between 4% and 6% a year, the consumer class will represent between 41% and 44% of Peru’s total population. This is encouraging news because of its implications not only for incomes, but also for the associated quality of life.
Figure 7: Changes in Per Capita GDP (PPP, constant 2005 US$), base: 1990 = 1
1990
1991
1992
1993
1994
1995
1996
1997
1998
1999
2000
2001
2002
2003
2004
2005
2006
2007
2008
2009
2010
2011
2012
2.5
2.0
1.5
1.0
0.5
0.0
Source: World Bank
Figure 8: Growth of the Consumer Class (people living on more than US$10 dollars per day) by 2050
If the forecast is carried to 2030 and 2050, under the same assumptions, the consumer class in the 4% annual growth context would be 19 million people by 2030, and 30.5 million people by 2050. While in the 6% annual growth scenario, consumer class would be 21 million people by 2030, and 32 million people by 2050; those figures would represent 59% and 70% of the total population of Peru, respectively.
4% G
DP
grow
th
6% G
DP
grow
th
4% G
DP
grow
th
6% G
DP
grow
th
4% G
DP
grow
th
6% G
DP
grow
th
45
40
35
30
25
20
15
10
5
0
Peop
le (m
illio
ns)
2021 2030 2050
13.6 14.5 19.1 21.030.5 32.0
Fuente: Modelo IFs - Universidad de Denver
24 CENTRO NACIONAL DE PLANEAMIENTO ESTRATÉGICO
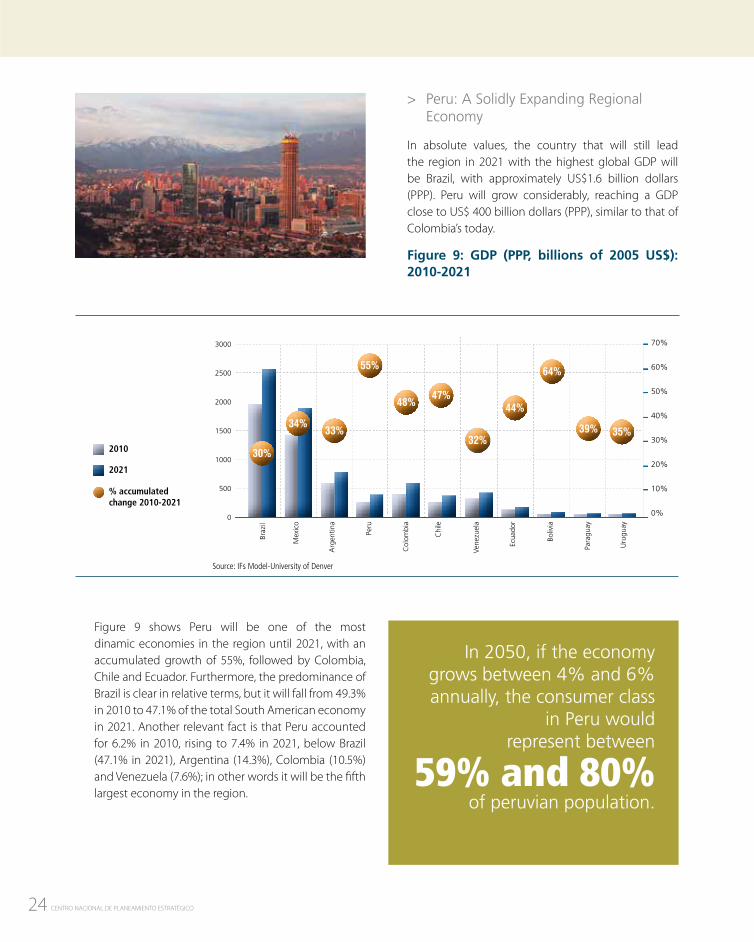
> Peru: A Solidly Expanding Regional Economy
In absolute values, the country that will still lead the region in 2021 with the highest global GDP will be Brazil, with approximately US$1.6 billion dollars (PPP). Peru will grow considerably, reaching a GDP close to US$ 400 billion dollars (PPP), similar to that of Colombia’s today.
Figure 9: GDP (PPP, billions of 2005 US$): 2010-2021
Figure 9 shows Peru will be one of the most dinamic economies in the region until 2021, with an accumulated growth of 55%, followed by Colombia, Chile and Ecuador. Furthermore, the predominance of Brazil is clear in relative terms, but it will fall from 49.3% in 2010 to 47.1% of the total South American economy in 2021. Another relevant fact is that Peru accounted for 6.2% in 2010, rising to 7.4% in 2021, below Brazil (47.1% in 2021), Argentina (14.3%), Colombia (10.5%) and Venezuela (7.6%); in other words it will be the fifth largest economy in the region.
Source: IFs Model-University of Denver
In 2050, if the economy grows between 4% and 6% annually, the consumer class
in Peru wouldrepresent between
59% and 80%of peruvian population.
2010
2021
% accumulated change 2010-2021
3000
2500
2000
1500
1000
500
0
Braz
il
Mex
ico
Arg
entin
a
Col
ombi
a
Vene
zuel
a
Peru
Chi
le
Boliv
ia
Uru
guay
Para
guay
Ecua
dor
70%
60%
50%
40%
30%
20%
10%
0%
30%
34%33%
55%
48%47%
32%
44%
64%
39% 35%
25WORKING DOCUMENT
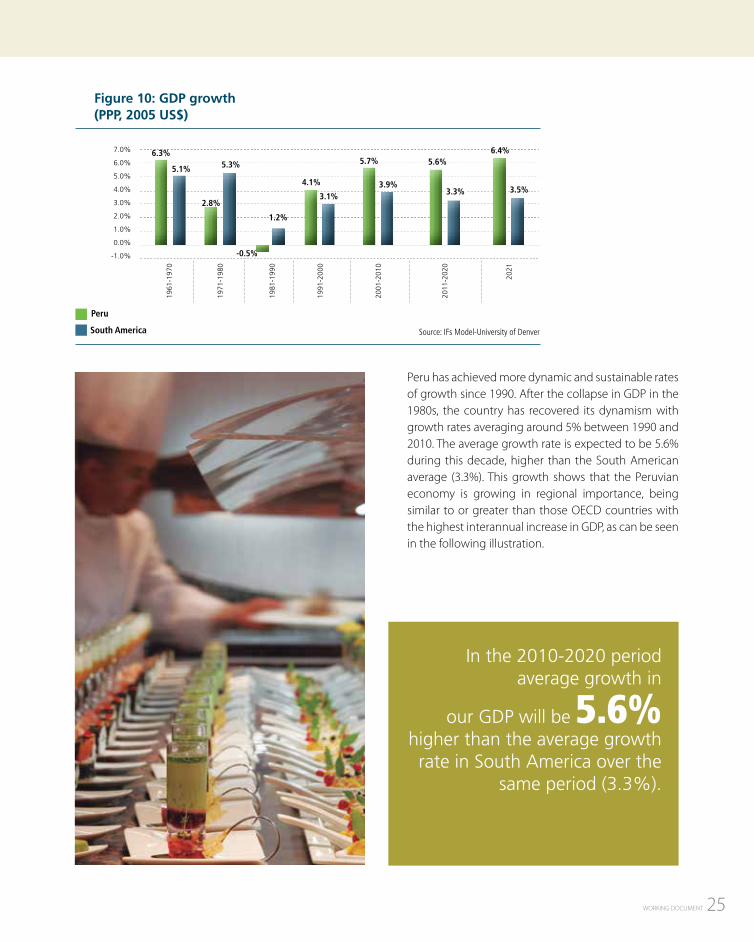
Figure 10: GDP growth (PPP, 2005 US$)
Peru has achieved more dynamic and sustainable rates of growth since 1990. After the collapse in GDP in the 1980s, the country has recovered its dynamism with growth rates averaging around 5% between 1990 and 2010. The average growth rate is expected to be 5.6% during this decade, higher than the South American average (3.3%). This growth shows that the Peruvian economy is growing in regional importance, being similar to or greater than those OECD countries with the highest interannual increase in GDP, as can be seen in the following illustration.
Peru
South America
In the 2010-2020 periodaverage growth in
our GDP will be 5.6% higher than the average growth rate in South America over the
same period (3.3%).
Source: IFs Model-University of Denver
7.0%
6.0%
5.0%
4.0%
3.0%
2.0%
1.0%
0.0%
-1.0%
6.3%
5.1%
2.8%
5.3%
1.2%
4.1%
3.1%
5.7%
3.9%
5.6%
3.3%
6.4%
3.5%
-0.5%
1961
-197
0
1971
-198
0
1981
-199
0
1991
-200
0
2001
-201
0
2011
-202
0
2021
26 CENTRO NACIONAL DE PLANEAMIENTO ESTRATÉGICO
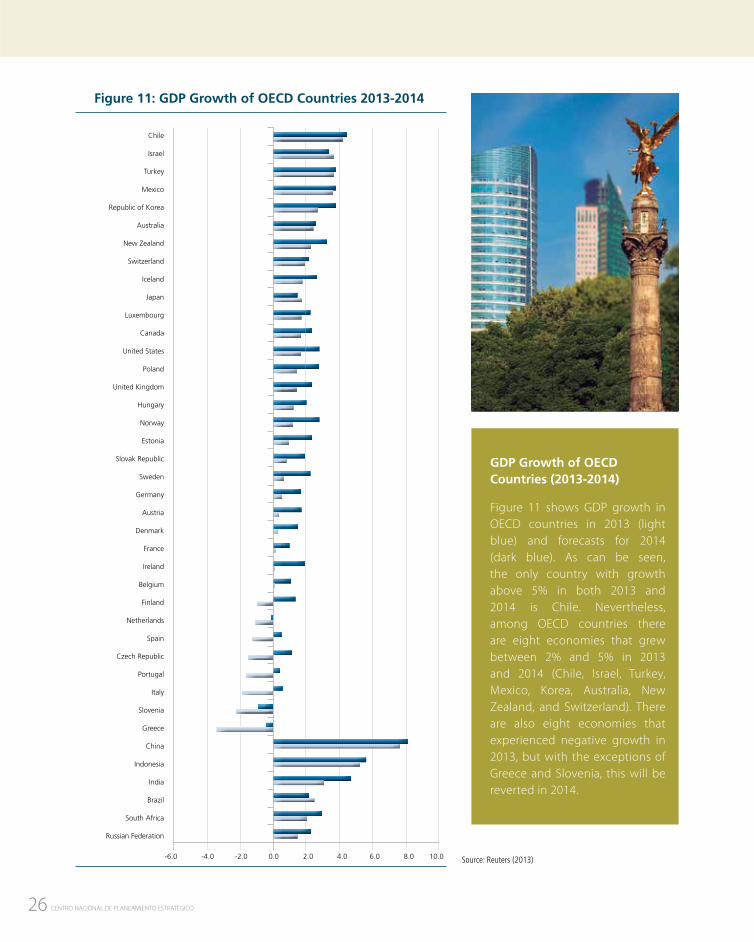
Figure 11: GDP Growth of OECD Countries 2013-2014
Chile
Israel
Turkey
Mexico
Republic of Korea
Australia
New Zealand
Switzerland
Iceland
Japan
Luxembourg
Canada
United States
Poland
United Kingdom
Hungary
Norway
Estonia
Slovak Republic
Sweden
Germany
Austria
Denmark
France
Ireland
Belgium
Finland
Netherlands
Spain
Czech Republic
Portugal
Italy
Slovenia
Greece
China
Indonesia
India
Brazil
South Africa
Russian Federation
-6.0 -4.0 -2.0 0.0 2.0 4.0 6.0 8.0 10.0 Source: Reuters (2013)
GDP Growth of OECD Countries (2013-2014)
Figure 11 shows GDP growth in OECD countries in 2013 (light blue) and forecasts for 2014 (dark blue). As can be seen, the only country with growth above 5% in both 2013 and 2014 is Chile. Nevertheless, among OECD countries there are eight economies that grew between 2% and 5% in 2013 and 2014 (Chile, Israel, Turkey, Mexico, Korea, Australia, New Zealand, and Switzerland). There are also eight economies that experienced negative growth in 2013, but with the exceptions of Greece and Slovenia, this will be reverted in 2014.
27WORKING DOCUMENT
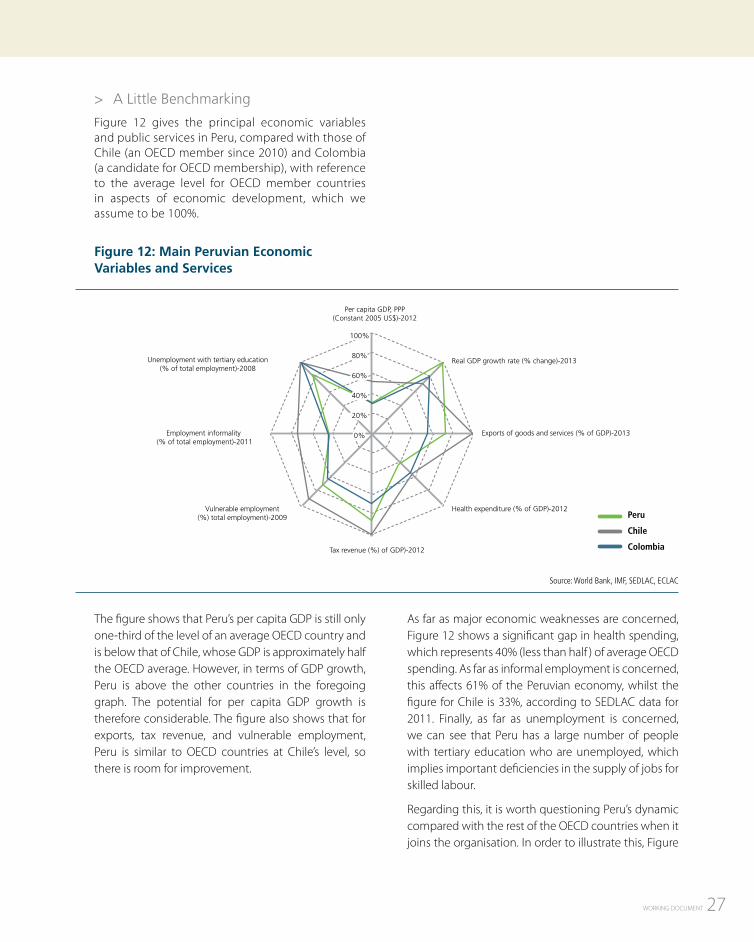
> A Little Benchmarking
Figure 12 gives the principal economic variables and public services in Peru, compared with those of Chile (an OECD member since 2010) and Colombia (a candidate for OECD membership), with reference to the average level for OECD member countries in aspects of economic development, which we assume to be 100%.
Figure 12: Main Peruvian Economic Variables and Services
The figure shows that Peru’s per capita GDP is still only one-third of the level of an average OECD country and is below that of Chile, whose GDP is approximately half the OECD average. However, in terms of GDP growth, Peru is above the other countries in the foregoing graph. The potential for per capita GDP growth is therefore considerable. The figure also shows that for exports, tax revenue, and vulnerable employment, Peru is similar to OECD countries at Chile’s level, so there is room for improvement.
As far as major economic weaknesses are concerned, Figure 12 shows a significant gap in health spending, which represents 40% (less than half ) of average OECD spending. As far as informal employment is concerned, this affects 61% of the Peruvian economy, whilst the figure for Chile is 33%, according to SEDLAC data for 2011. Finally, as far as unemployment is concerned, we can see that Peru has a large number of people with tertiary education who are unemployed, which implies important deficiencies in the supply of jobs for skilled labour.
Regarding this, it is worth questioning Peru’s dynamic compared with the rest of the OECD countries when it joins the organisation. In order to illustrate this, Figure
Unemployment with tertiary education (% of total employment)-2008
Employment informality (% of total employment)-2011
Vulnerable employment (%) total employment)-2009
Source: World Bank, IMF, SEDLAC, ECLAC
Tax revenue (%) of GDP)-2012
Per capita GDP, PPP(Constant 2005 US$)-2012
Real GDP growth rate (% change)-2013
Exports of goods and services (% of GDP)-2013
Health expenditure (% of GDP)-2012Peru
Chile
Colombia
100%
80%
60%
40%
20%
0%
28 CENTRO NACIONAL DE PLANEAMIENTO ESTRATÉGICO
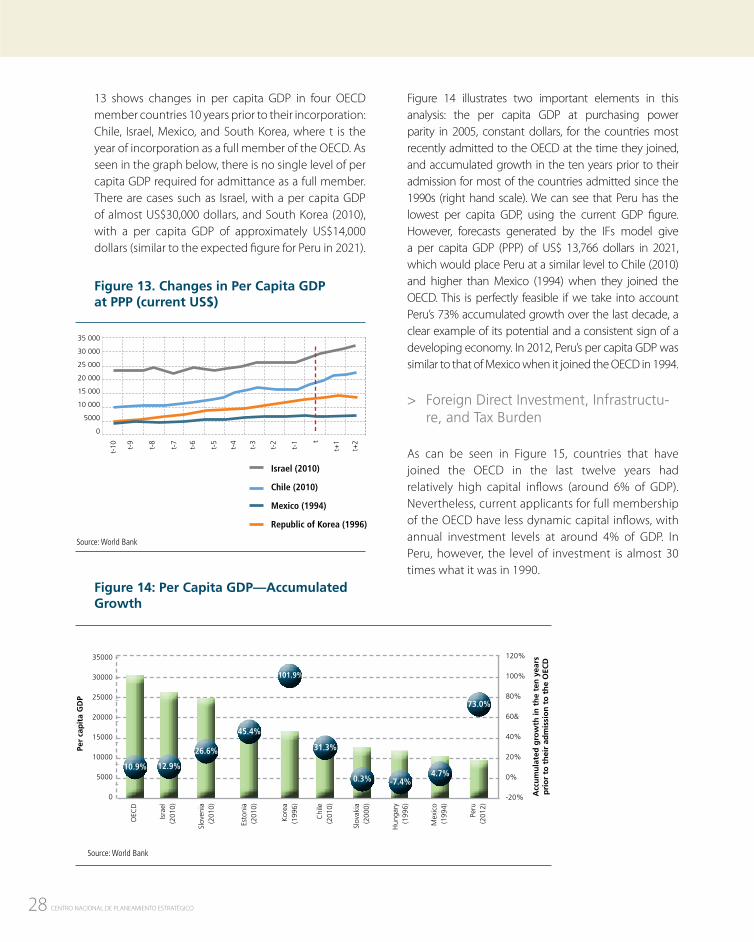
13 shows changes in per capita GDP in four OECD member countries 10 years prior to their incorporation: Chile, Israel, Mexico, and South Korea, where t is the year of incorporation as a full member of the OECD. As seen in the graph below, there is no single level of per capita GDP required for admittance as a full member. There are cases such as Israel, with a per capita GDP of almost US$30,000 dollars, and South Korea (2010), with a per capita GDP of approximately US$14,000 dollars (similar to the expected figure for Peru in 2021).
Figure 13. Changes in Per Capita GDP at PPP (current US$)
Figure 14: Per Capita GDP—Accumulated Growth
Figure 14 illustrates two important elements in this analysis: the per capita GDP at purchasing power parity in 2005, constant dollars, for the countries most recently admitted to the OECD at the time they joined, and accumulated growth in the ten years prior to their admission for most of the countries admitted since the 1990s (right hand scale). We can see that Peru has the lowest per capita GDP, using the current GDP figure. However, forecasts generated by the IFs model give a per capita GDP (PPP) of US$ 13,766 dollars in 2021, which would place Peru at a similar level to Chile (2010) and higher than Mexico (1994) when they joined the OECD. This is perfectly feasible if we take into account Peru’s 73% accumulated growth over the last decade, a clear example of its potential and a consistent sign of a developing economy. In 2012, Peru’s per capita GDP was similar to that of Mexico when it joined the OECD in 1994.
> Foreign Direct Investment, Infrastructu-re, and Tax Burden
As can be seen in Figure 15, countries that have joined the OECD in the last twelve years had relatively high capital inflows (around 6% of GDP). Nevertheless, current applicants for full membership of the OECD have less dynamic capital inflows, with annual investment levels at around 4% of GDP. In Peru, however, the level of investment is almost 30 times what it was in 1990.
Source: World Bank
35 000
30 000
25 000
20 000
15 000
10 000
5000
0
t-10 t-
9
t-8
t-7
t-6
t-5
t-4
t-3
t-2
t-1 t
t+1
t+2
Israel (2010)
Chile (2010)
Mexico (1994)
Republic of Korea (1996)
Source: World Bank
Acc
um
ula
ted
gro
wth
in t
he
ten
yea
rs
pri
or
to t
hei
r ad
mis
sio
n t
o t
he
OEC
D35000
30000
25000
20000
15000
10000
5000
0
OEC
D
Isra
el
(201
0)
Slov
enia
(2
010)
Esto
nia
(201
0)
Kor
ea
(199
6)
Chi
le
(201
0)
Slov
akia
(2
000)
Hun
gary
(1
996)
Mex
ico
(199
4)
Peru
(2
012)
Per
cap
ita
GD
P
120%
100%
80%
60&
40%
20%
0%
-20%
26.6%
12.9%10.9%
73.0%
4.7%-7.4%0.3%
31.3%
45.4%
101.9%
29WORKING DOCUMENT
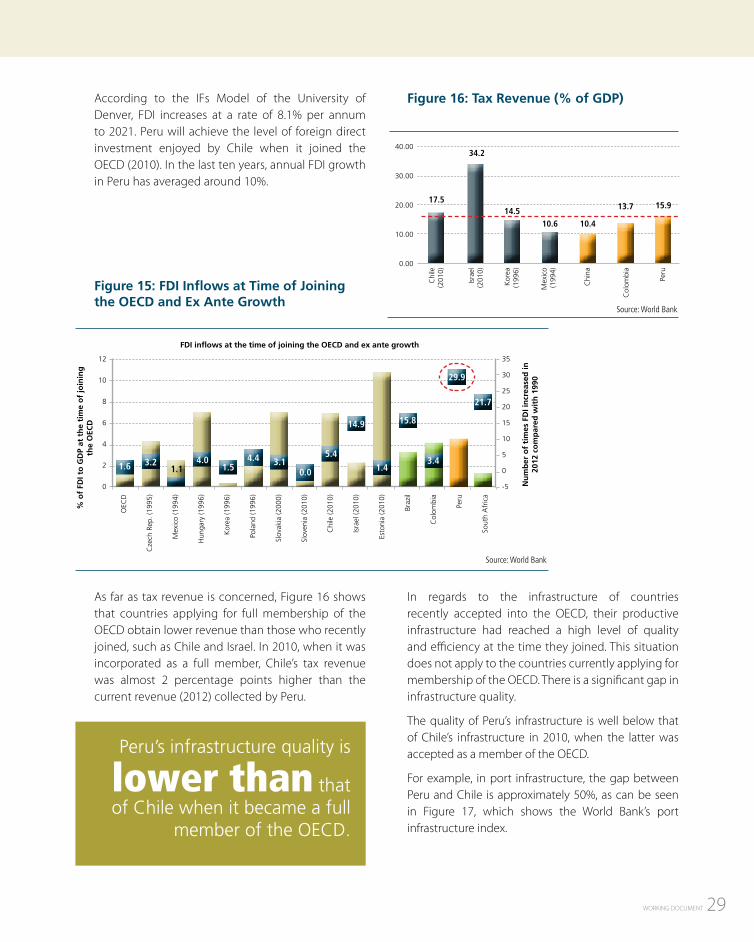
According to the IFs Model of the University of Denver, FDI increases at a rate of 8.1% per annum to 2021. Peru will achieve the level of foreign direct investment enjoyed by Chile when it joined the OECD (2010). In the last ten years, annual FDI growth in Peru has averaged around 10%.
In regards to the infrastructure of countries recently accepted into the OECD, their productive infrastructure had reached a high level of quality and efficiency at the time they joined. This situation does not apply to the countries currently applying for membership of the OECD. There is a significant gap in infrastructure quality.
The quality of Peru’s infrastructure is well below that of Chile’s infrastructure in 2010, when the latter was accepted as a member of the OECD.
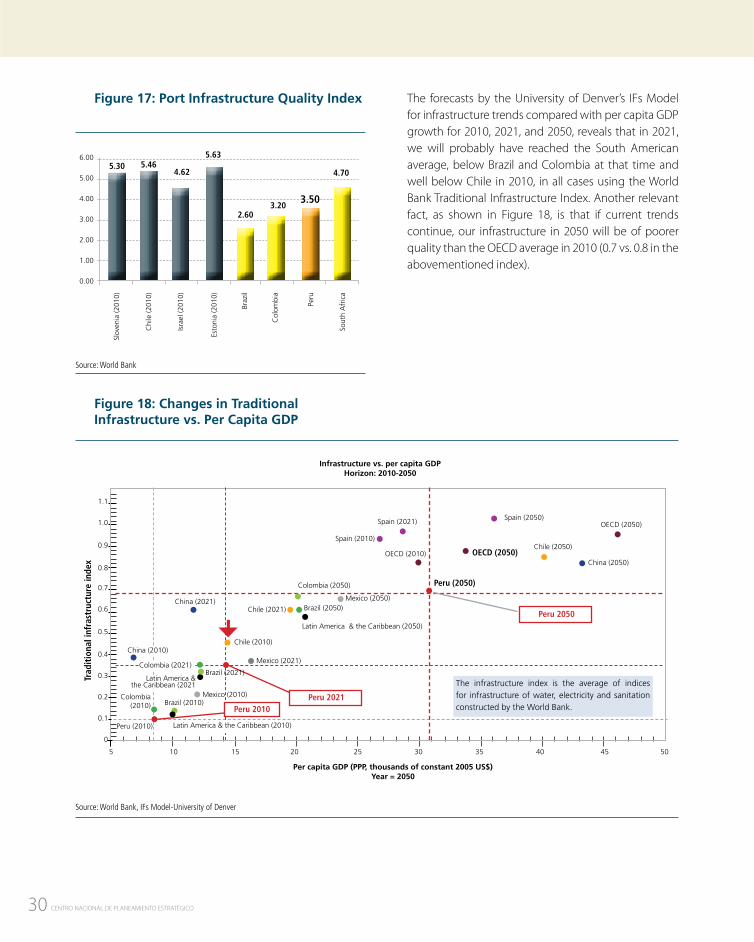
For example, in port infrastructure, the gap between Peru and Chile is approximately 50%, as can be seen in Figure 17, which shows the World Bank’s port infrastructure index.
Figure 16: Tax Revenue (% of GDP)
40.00
30.00
20.00
10.00
0.00
17.5
34.2
14.510.6 10.4
13.7 15.9
Chi
le
(201
0)
Isra
el
(201
0)
Kor
ea
(199
6)
Mex
ico
(199
4)
Chi
na
Col
ombi
a
Peru
Peru’s infrastructure quality is
lower than that of Chile when it became a full
member of the OECD.
1.6 3.21.1
4.01.5
4.4 3.10.0
5.4
14.9
1.4
15.8
3.4
29.9
21.7
FDI inflows at the time of joining the OECD and ex ante growth
12
10
8
6
4
2
0
OEC
D
Cze
ch R
ep. (
1995
)
Mex
ico
(199
4)
Hun
gary
(199
6)
Kor
ea (1
996)
Pola
nd (1
996)
Slov
akia
(200
0)
Slov
enia
(201
0)
Chi
le (2
010)
Isra
el (2
010)
Esto
nia
(201
0)
Braz
il
Col
ombi
a
Peru
Sout
h A
fric
a
% o
f FD
I to
GD
P at
th
e ti
me
of
join
ing
th
e O
ECD
Nu
mb
er o
f ti
mes
FD
I in
crea
sed
in
2012
co
mp
ared
wit
h 1
990
35
30
25
20
15
10
5
0
-5
Source: World Bank
Source: World Bank
As far as tax revenue is concerned, Figure 16 shows that countries applying for full membership of the OECD obtain lower revenue than those who recently joined, such as Chile and Israel. In 2010, when it was incorporated as a full member, Chile’s tax revenue was almost 2 percentage points higher than the current revenue (2012) collected by Peru.
Figure 15: FDI Inflows at Time of Joining the OECD and Ex Ante Growth
30 CENTRO NACIONAL DE PLANEAMIENTO ESTRATÉGICO
The forecasts by the University of Denver’s IFs Model for infrastructure trends compared with per capita GDP growth for 2010, 2021, and 2050, reveals that in 2021, we will probably have reached the South American average, below Brazil and Colombia at that time and well below Chile in 2010, in all cases using the World Bank Traditional Infrastructure Index. Another relevant fact, as shown in Figure 18, is that if current trends continue, our infrastructure in 2050 will be of poorer quality than the OECD average in 2010 (0.7 vs. 0.8 in the abovementioned index).
6.00
5.00
4.00
3.00
2.00
1.00
0.00
5.30 5.465.63
2.603.20
4.70
Chi
le (2
010)
Isra
el (2
010)
Esto
nia
(201
0)
Braz
il
Sout
h A
fric
a
Col
ombi
a
Peru
Slov
enia
(201
0)
4.62
3.50
Figure 17: Port Infrastructure Quality Index
Figure 18: Changes in Traditional Infrastructure vs. Per Capita GDP
Infrastructure vs. per capita GDPHorizon: 2010-2050
Source: World Bank, IFs Model-University of Denver
Latin America & the Caribbean (2010)
Brazil (2010)
Mexico (2021)
Chile (2010)
Chile (2021)China (2021)
China (2010)
Colombia (2021)
Peru (2010)
Colombia (2010)
Colombia (2050)
Mexico (2050)
Latin America & the Caribbean (2050)
Brazil (2050)
Spain (2021) Spain (2050)
OECD (2050)OECD (2010)
Peru (2050)
Chile (2050)
China (2050)
OECD (2050)
Peru 2050
The infrastructure index is the average of indices for infrastructure of water, electricity and sanitation constructed by the World Bank.
Trad
itio
nal i
nfra
stru
ctur
e in
dex
1.1
1.0
0.9
0.8
0.7
0.6
0.5
0.4
0.3
0.2
0.1
0
Per capita GDP (PPP, thousands of constant 2005 US$)Year = 2050
5 10 15 20 25 30 35 40 45 50
Peru 2021
Latin America & the Caribbean (2021
Mexico (2010)
Peru 2010
Spain (2010)
Source: World Bank
Brazil (2021)
31WORKING DOCUMENT
c. State, Institutionality, and Governance
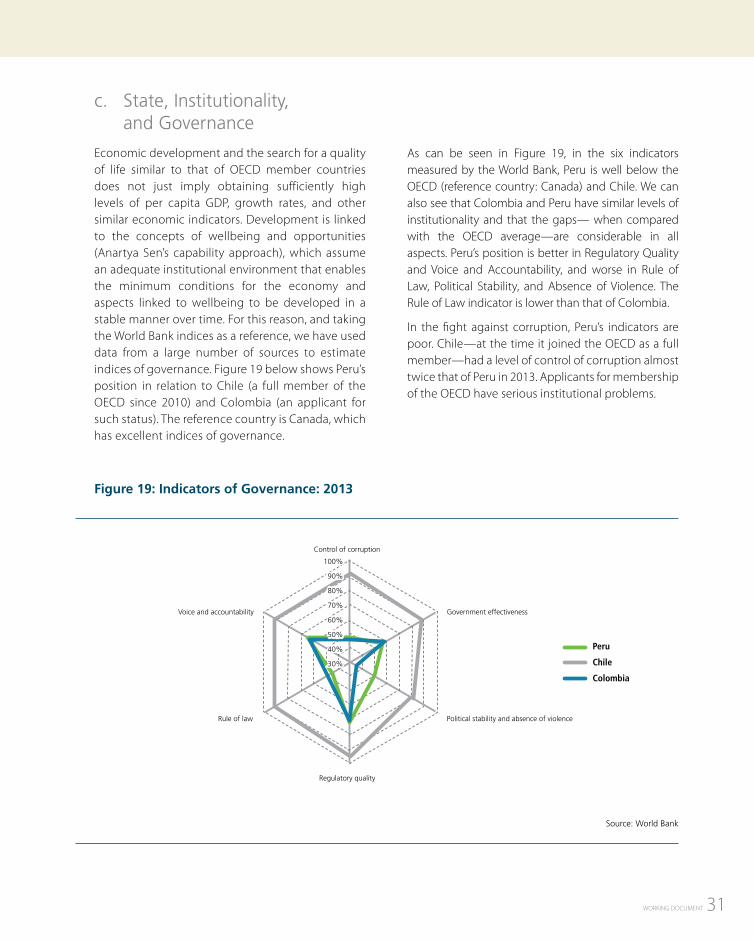
Economic development and the search for a quality of life similar to that of OECD member countries does not just imply obtaining sufficiently high levels of per capita GDP, growth rates, and other similar economic indicators. Development is linked to the concepts of wellbeing and opportunities (Anartya Sen’s capability approach), which assume an adequate institutional environment that enables the minimum conditions for the economy and aspects linked to wellbeing to be developed in a stable manner over time. For this reason, and taking the World Bank indices as a reference, we have used data from a large number of sources to estimate indices of governance. Figure 19 below shows Peru’s position in relation to Chile (a full member of the OECD since 2010) and Colombia (an applicant for such status). The reference country is Canada, which has excellent indices of governance.
Figure 19: Indicators of Governance: 2013
As can be seen in Figure 19, in the six indicators measured by the World Bank, Peru is well below the OECD (reference country: Canada) and Chile. We can also see that Colombia and Peru have similar levels of institutionality and that the gaps— when compared with the OECD average—are considerable in all aspects. Peru’s position is better in Regulatory Quality and Voice and Accountability, and worse in Rule of Law, Political Stability, and Absence of Violence. The Rule of Law indicator is lower than that of Colombia.
In the fight against corruption, Peru’s indicators are poor. Chile—at the time it joined the OECD as a full member—had a level of control of corruption almost twice that of Peru in 2013. Applicants for membership of the OECD have serious institutional problems.
Source: World Bank
Peru
Chile
Colombia
Voice and accountability
Rule of law
Regulatory quality
Government effectiveness
Political stability and absence of violence
Control of corruption
100%
90%
80%
70%
60%
50%
40%
30%
32 CENTRO NACIONAL DE PLANEAMIENTO ESTRATÉGICO
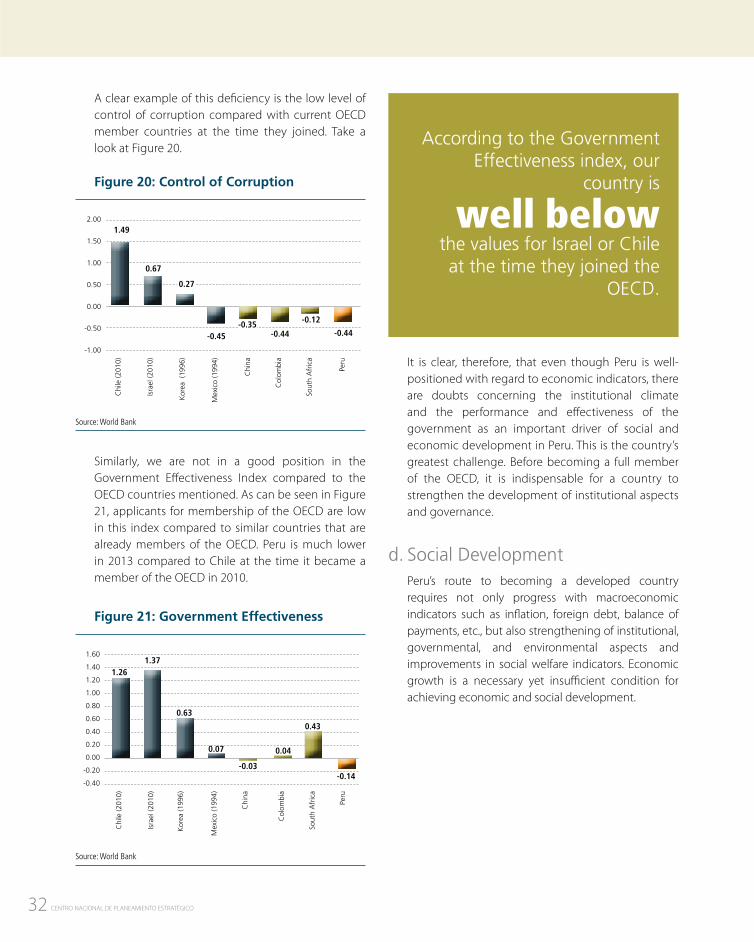
A clear example of this deficiency is the low level of control of corruption compared with current OECD member countries at the time they joined. Take a look at Figure 20.
Figure 20: Control of Corruption
Similarly, we are not in a good position in the Government Effectiveness Index compared to the OECD countries mentioned. As can be seen in Figure 21, applicants for membership of the OECD are low in this index compared to similar countries that are already members of the OECD. Peru is much lower in 2013 compared to Chile at the time it became a member of the OECD in 2010.
Figure 21: Government Effectiveness
It is clear, therefore, that even though Peru is well-positioned with regard to economic indicators, there are doubts concerning the institutional climate and the performance and effectiveness of the government as an important driver of social and economic development in Peru. This is the country’s greatest challenge. Before becoming a full member of the OECD, it is indispensable for a country to strengthen the development of institutional aspects and governance.
d. Social DevelopmentPeru’s route to becoming a developed country requires not only progress with macroeconomic indicators such as inflation, foreign debt, balance of payments, etc., but also strengthening of institutional, governmental, and environmental aspects and improvements in social welfare indicators. Economic growth is a necessary yet insufficient condition for achieving economic and social development.
Chi
le (2
010)
Isra
el (2
010)
Kor
ea (
1996
)
Chi
na
Sout
h A
fric
a
Col
ombi
a
Peru
Mex
ico
(199
4)
Chi
le (2
010)
Isra
el (2
010)
Kor
ea (1
996)
Chi
na
Sout
h A
fric
a
Col
ombi
a
Peru
Mex
ico
(199
4)
According to the Government Effectiveness index, our
country is
well below the values for Israel or Chile at the time they joined the
OECD.
Source: World Bank
Source: World Bank
2.00
1.50
1.00
0.50
0.00
-0.50
-1.00
1.49
0.67
0.27
-0.45-0.35
-0.44
-0.12
-0.44
1.60
1.40
1.20
1.00
0.80
0.60
0.40
0.20
0.00
-0.20
-0.40-0.14
1.261.37
0.63
0.07
-0.03
0.04
0.43
33WORKING DOCUMENT
Figure 22: GDP-Poverty Ratio 2001-2012
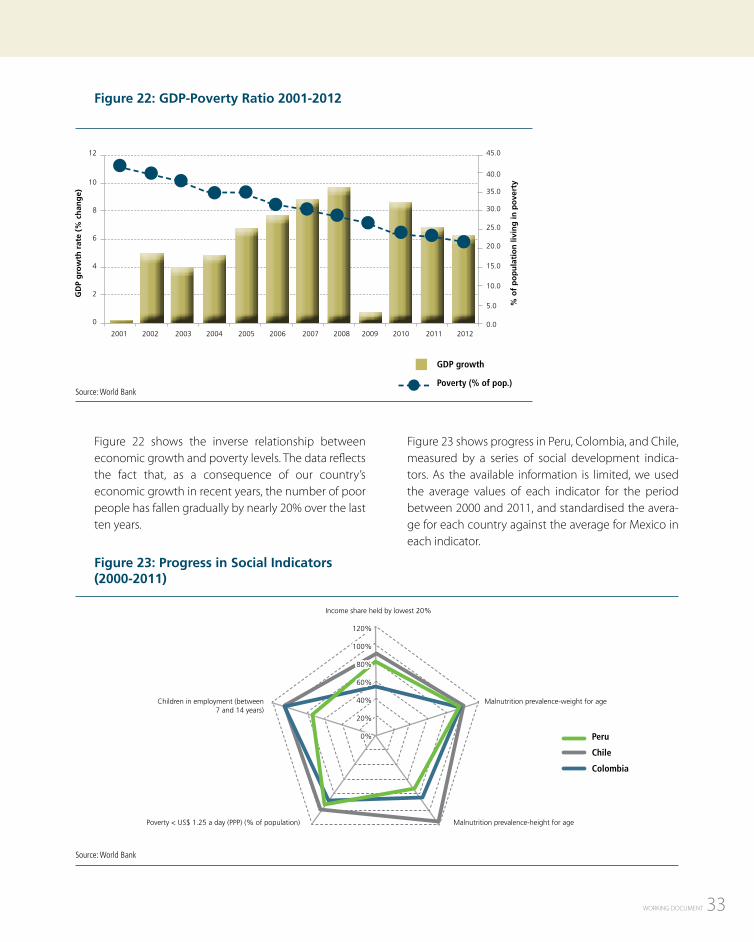
Figure 22 shows the inverse relationship between economic growth and poverty levels. The data reflects the fact that, as a consequence of our country’s economic growth in recent years, the number of poor people has fallen gradually by nearly 20% over the last ten years.
Figure 23: Progress in Social Indicators (2000-2011)
Figure 23 shows progress in Peru, Colombia, and Chile, measured by a series of social development indica-tors. As the available information is limited, we used the average values of each indicator for the period between 2000 and 2011, and standardised the avera-ge for each country against the average for Mexico in each indicator.
12
10
8
6
4
2
0
2001
GD
P g
row
th r
ate
(% c
han
ge)
2002 2003 2004 2005 2006 2007 2008 2009 2010 2011 2012
45.0
40.0
35.0
30.0
25.0
20.0
15.0
10.0
5.0
0.0
% o
f p
op
ula
tio
n li
vin
g in
po
vert
y
GDP growth
Poverty (% of pop.)
Income share held by lowest 20%
Poverty < US$ 1.25 a day (PPP) (% of population) Malnutrition prevalence-height for age
Malnutrition prevalence-weight for ageChildren in employment (between 7 and 14 years)
120%
100%
80%
60%
40%
20%
0% Peru
Chile
Colombia
Source: World Bank
Source: World Bank
34 CENTRO NACIONAL DE PLANEAMIENTO ESTRATÉGICO
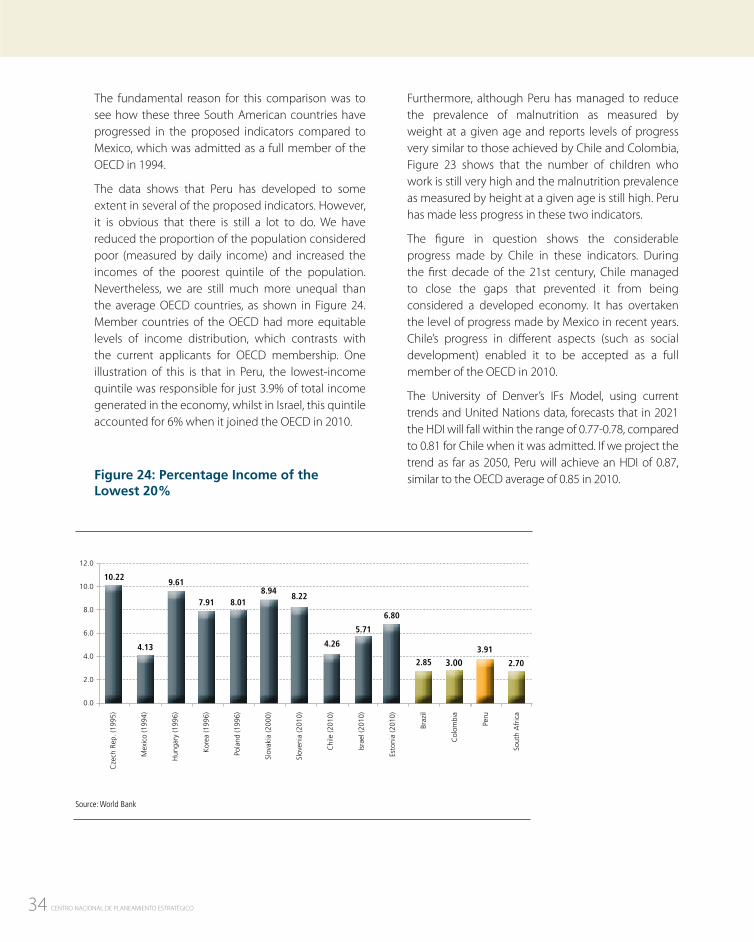
The fundamental reason for this comparison was to see how these three South American countries have progressed in the proposed indicators compared to Mexico, which was admitted as a full member of the OECD in 1994.
The data shows that Peru has developed to some extent in several of the proposed indicators. However, it is obvious that there is still a lot to do. We have reduced the proportion of the population considered poor (measured by daily income) and increased the incomes of the poorest quintile of the population. Nevertheless, we are still much more unequal than the average OECD countries, as shown in Figure 24. Member countries of the OECD had more equitable levels of income distribution, which contrasts with the current applicants for OECD membership. One illustration of this is that in Peru, the lowest-income quintile was responsible for just 3.9% of total income generated in the economy, whilst in Israel, this quintile accounted for 6% when it joined the OECD in 2010.
Figure 24: Percentage Income of the Lowest 20%
12.0
10.0
8.0
6.0
4.0
2.0
0.0
Cze
ch R
ep. (
1995
)
Mex
ico
(199
4)
Hun
gary
(199
6)
Kor
ea (1
996)
Pola
nd (1
996)
Slov
akia
(200
0)
Slov
enia
(201
0)
Chi
le (2
010)
Isra
el (2
010)
Esto
nia
(201
0)
Braz
il
Col
ombi
a
Peru
Sout
h A
fric
a
10.22
4.13
9.61
7.91 8.018.94
8.22
4.26
5.71
6.80
2.85 3.003.91
2.70
Furthermore, although Peru has managed to reduce the prevalence of malnutrition as measured by weight at a given age and reports levels of progress very similar to those achieved by Chile and Colombia, Figure 23 shows that the number of children who work is still very high and the malnutrition prevalence as measured by height at a given age is still high. Peru has made less progress in these two indicators.
The figure in question shows the considerable progress made by Chile in these indicators. During the first decade of the 21st century, Chile managed to close the gaps that prevented it from being considered a developed economy. It has overtaken the level of progress made by Mexico in recent years. Chile’s progress in different aspects (such as social development) enabled it to be accepted as a full member of the OECD in 2010.
The University of Denver’s IFs Model, using current trends and United Nations data, forecasts that in 2021 the HDI will fall within the range of 0.77-0.78, compared to 0.81 for Chile when it was admitted. If we project the trend as far as 2050, Peru will achieve an HDI of 0.87, similar to the OECD average of 0.85 in 2010.
Source: World Bank
35WORKING DOCUMENT
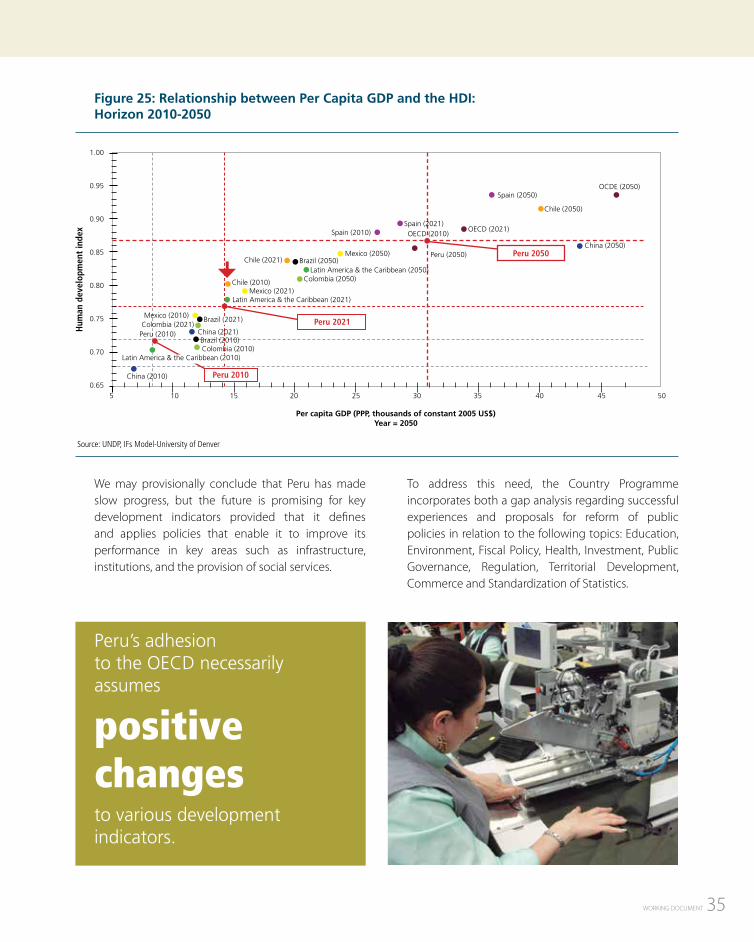
Figure 25: Relationship between Per Capita GDP and the HDI: Horizon 2010-2050
We may provisionally conclude that Peru has made slow progress, but the future is promising for key development indicators provided that it defines and applies policies that enable it to improve its performance in key areas such as infrastructure, institutions, and the provision of social services.
Source: UNDP, IFs Model-University of Denver
Hum
an d
evel
opm
ent
inde
x
Peru 2010
Chile (2010)
Chile (2021)
China (2010)
Mexico (2050)
Latin America & the Caribbean (2050)Brazil (2050)
Spain (2010)
Spain (2050)
OECD (2021)
Chile (2050)
China (2050)
OCDE (2050)
Peru 2050
5 10 15 20 25 30 35 40 45 50
1.00
0.95
0.90
0.85
0.80
0.75
0.70
0.65
Per capita GDP (PPP, thousands of constant 2005 US$)Year = 2050
Spain (2021)
Latin America & the Caribbean (2021)
Peru (2010)Colombia (2021)
China (2021)Brazil (2010)
Colombia (2050)
Brazil (2021)Mexico (2010)
Colombia (2010)Latin America & the Caribbean (2010)
Peru (2050)
OECD (2010)
Peru 2021
Peru’s adhesion to the OECD necessarily assumes
positive changes to various developmentindicators.
Mexico (2021)
To address this need, the Country Programme incorporates both a gap analysis regarding successful experiences and proposals for reform of public policies in relation to the following topics: Education, Environment, Fiscal Policy, Health, Investment, Public Governance, Regulation, Territorial Development, Commerce and Standardization of Statistics.

36 CENTRO NACIONAL DE PLANEAMIENTO ESTRATÉGICO
37WORKING DOCUMENT
Introduction
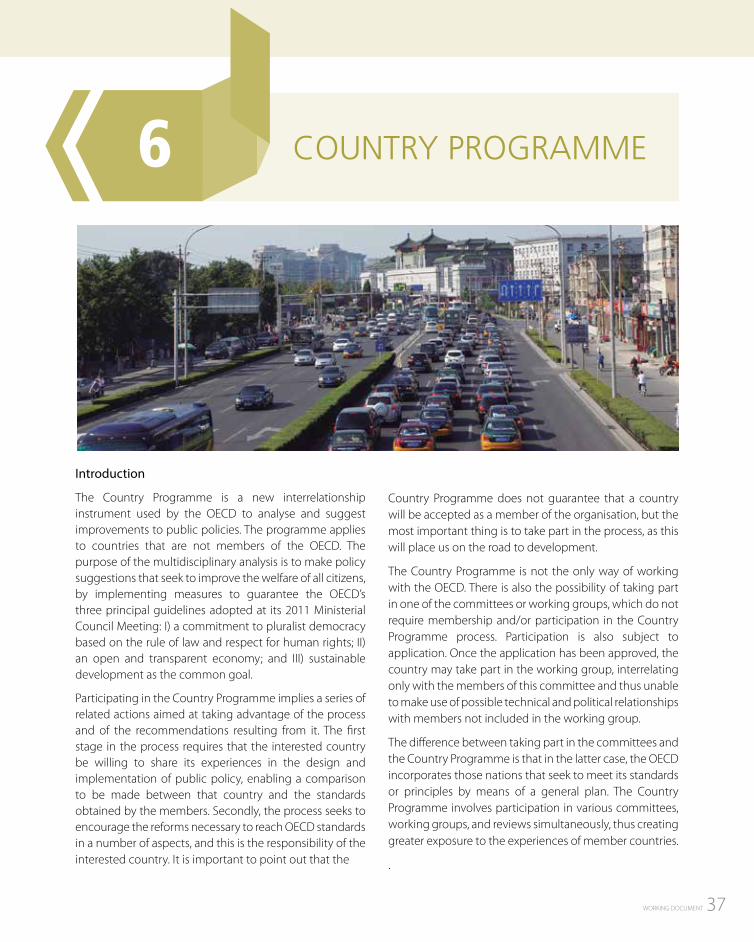
The Country Programme is a new interrelationship instrument used by the OECD to analyse and suggest improvements to public policies. The programme applies to countries that are not members of the OECD. The purpose of the multidisciplinary analysis is to make policy suggestions that seek to improve the welfare of all citizens, by implementing measures to guarantee the OECD’s three principal guidelines adopted at its 2011 Ministerial Council Meeting: I) a commitment to pluralist democracy based on the rule of law and respect for human rights; II) an open and transparent economy; and III) sustainable development as the common goal.
Participating in the Country Programme implies a series of related actions aimed at taking advantage of the process and of the recommendations resulting from it. The first stage in the process requires that the interested country be willing to share its experiences in the design and implementation of public policy, enabling a comparison to be made between that country and the standards obtained by the members. Secondly, the process seeks to encourage the reforms necessary to reach OECD standards in a number of aspects, and this is the responsibility of the interested country. It is important to point out that the
6 COUNTRY PROGRAMME
Country Programme does not guarantee that a country will be accepted as a member of the organisation, but the most important thing is to take part in the process, as this will place us on the road to development.
The Country Programme is not the only way of working with the OECD. There is also the possibility of taking part in one of the committees or working groups, which do not require membership and/or participation in the Country Programme process. Participation is also subject to application. Once the application has been approved, the country may take part in the working group, interrelating only with the members of this committee and thus unable to make use of possible technical and political relationships with members not included in the working group.
The difference between taking part in the committees and the Country Programme is that in the latter case, the OECD incorporates those nations that seek to meet its standards or principles by means of a general plan. The Country Programme involves participation in various committees, working groups, and reviews simultaneously, thus creating greater exposure to the experiences of member countries.
.
38 CENTRO NACIONAL DE PLANEAMIENTO ESTRATÉGICO
How Did Country Programme Arise?
The OECD saw that some non-member countries were willing to work towards the organisation’s standards and best practices. As such, the Country Programmes are mechanisms designed to achieve levels similar to the member countries’ average in different aspects, as well as to help with political reforms in participating countries.
These programmes are designed not only to help non-member countries, but to disseminate good practices throughout their regions, thus generating a greater impact.
Advantages of the Country ProgrammesParticipation in a Country Programme generates many benefits for a nation, including:
� Learning from the experiences of other countries that are members of the OECD in a number of public policy areas.
� Revitalising intergovernmental relations as a result of participation in the organisation’s activities and working groups (committees, thematic groups, etc.)
� Organisation and compilation of data using OECD statistical standards, which also involves new analysis concepts, required to incorporate the country into the databases relevant to the organisation.
The Country Programme is a new form of membership through which the OECD gains new members in order to
improve thewell-being of citizens.
� The implementation of studies leading to an analysis of public policy and/or recommendations regarding key instruments successfully used by member countries.
� Changes in the collection and organisation of data, as well as the implementation of the policy instruments used by developed countries, establish the starting point for working under improved international standards, thus guaranteeing medium- and long-term development.
The terms and methods of each Country Programme are discussed and agreed to between the OECD and the authorities of the country in question. This enables these programmes to take into account the priorities and circumstances of both parties, so that they reflect the opinions and experiences of the partner countries. The Country Programme is implemented gradually so that the country can become familiar with OECD standards and working methods.
39WORKING DOCUMENT
Conditions for Participation in the Country Programme
� Mutual interests and benefits for the OECD and the non-member country.
� Willingness on the part of the country to commit to a programme of long-term reforms based on the OECD’s standards and best practices, and to implement these commitments.
� The possibility that the country may act as a pioneer for similar reforms to be implemented in other countries, particularly in the same region.
� Financing of the programme should be assured through multi-year agreements that include a financial commitment by the Partner Country.
Implementation The OECD Council is the one that makes the decision to invite a state to join the Country Programme. Thereafter, responsibility for the relationship with the country is assumed by the External Relations Committee (ERC). The ERC will design the programme (duration, content, supervision, etc.), which requires the consent of all the members of the OECD.
The final decision on the start of the Country Programme is made in a report from the OECD Secretariat, after consultation with the relevant entities of the organisation. This report evaluates the proposed design and financing, as well as compliance with the three key principles of the organisation.
Peru and the OECD
The first contact between Peru and the OECD occurred in 2004, when the country submitted its competition policies and legislation for review (Lampadia, 2014). Then, in July 2008, the Peruvian government took the first step by signing the OECD’s Declaration on International Investment and Multinational Enterprises. This was followed by adhesion and participation in a series of committees and working groups:
Committee or working group Institution Year
Investment Committee and Adherence to the OECD Declaration on International Investment and Multinational Enterprises
Proinversión-MEF
2008
Development Centre MRE 2009
Working Group on Bribery in International Business Transactions
CAN, PCM 2010
Competition CommitteeIndecopi,
PCM2011
Committee on Consumer Policy
Indecopi, PCM
2013
At the end of 2012, the President of Peru and the country’s Ministers of Finance and Foreign Affairs visited the headquarters of the OECD in Paris to strengthen relations and express their interest in joining the organization. Thus, after taking part as a guest in these committees, the Peruvian Government’s political decision to implement
40 CENTRO NACIONAL DE PLANEAMIENTO ESTRATÉGICO
OECD standards and practices, and acceptance by the member countries, in May 2014 the OECD Council decided to create a “made to measure” cooperation framework between the OECD and Peru: Peru Country Programme in order to help Peru in its reform agenda through:
� More active participation in the OECD’s committees, working groups, global forums, and regional networks
� Adhesion to the OECD’s key instruments
� Studies and analyses of public policies
� Incorporation into the relevant OECD databases
As part of the working plan, on July 3 and 4, 2014, the first round of preparatory meetings for the Country Programme between the OECD and Peru was held in Lima. OECD delegates and representatives from the main institutions and instances of the Peruvian government took part in these meetings. Even though the Country Programme is not part of the mechanisms for joining the OECD, it is an essential requirement for those aspiring to do so.
As a result of meetings among the Peruvian institutions involved, as well as recommendations made by the OECD, the following list of proposals for economic and structural reforms are:
The decision to establisha Country Programme is
based on aproposalfrom the Secretariat, which evaluates the Country in the above criteria to establish long term objectives.
41WORKING DOCUMENT
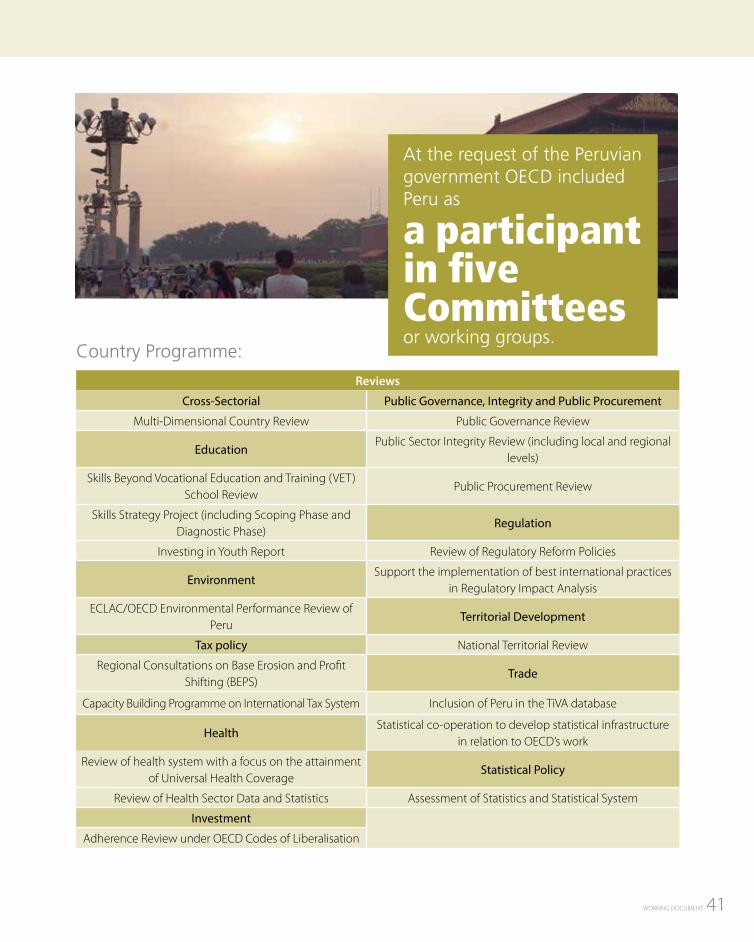
Country Programme:
Reviews
Cross-Sectorial Public Governance, Integrity and Public Procurement
Multi-Dimensional Country Review Public Governance Review
EducationPublic Sector Integrity Review (including local and regional
levels)
Skills Beyond Vocational Education and Training (VET) School Review
Public Procurement Review
Skills Strategy Project (including Scoping Phase and Diagnostic Phase)
Regulation
Investing in Youth Report Review of Regulatory Reform Policies
EnvironmentSupport the implementation of best international practices
in Regulatory Impact Analysis
ECLAC/OECD Environmental Performance Review of Peru
Territorial Development
Tax policy National Territorial Review
Regional Consultations on Base Erosion and Profit Shifting (BEPS)
Trade
Capacity Building Programme on International Tax System Inclusion of Peru in the TiVA database
HealthStatistical co-operation to develop statistical infrastructure
in relation to OECD’s work
Review of health system with a focus on the attainment of Universal Health Coverage
Statistical Policy
Review of Health Sector Data and Statistics Assessment of Statistics and Statistical System
Investment
Adherence Review under OECD Codes of Liberalisation
At the request of the Peruviangovernment OECD included Peru as
a participantin fiveCommittees or working groups.
42 CENTRO NACIONAL DE PLANEAMIENTO ESTRATÉGICO
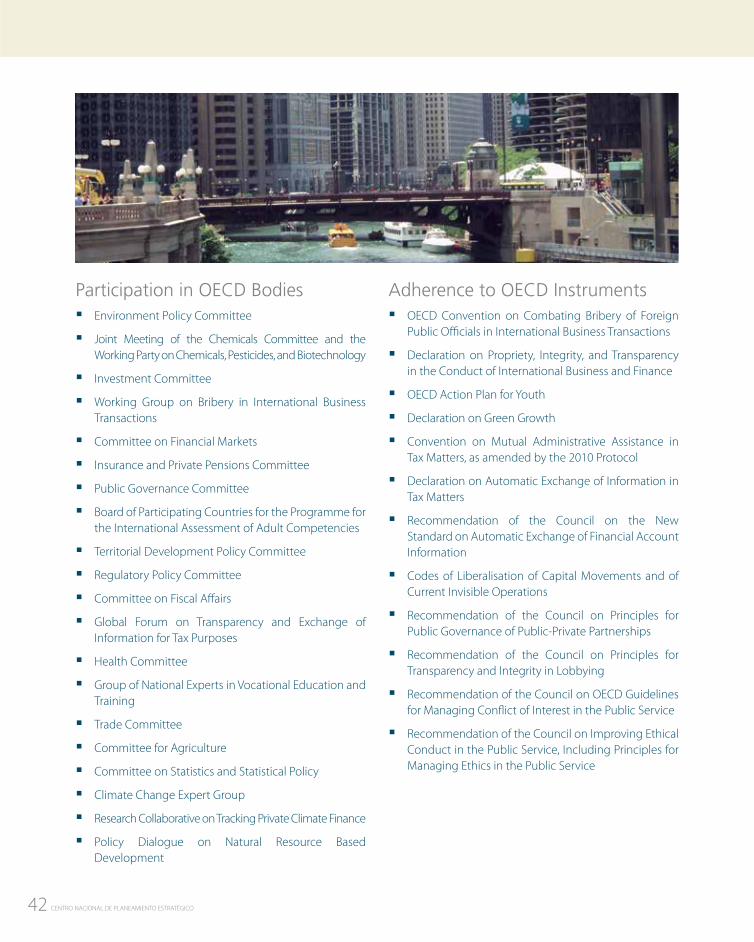
Participation in OECD Bodies � Environment Policy Committee
� Joint Meeting of the Chemicals Committee and the Working Party on Chemicals, Pesticides, and Biotechnology
� Investment Committee
� Working Group on Bribery in International Business Transactions
� Committee on Financial Markets
� Insurance and Private Pensions Committee
� Public Governance Committee
� Board of Participating Countries for the Programme for the International Assessment of Adult Competencies
� Territorial Development Policy Committee
� Regulatory Policy Committee
� Committee on Fiscal Affairs
� Global Forum on Transparency and Exchange of Information for Tax Purposes
� Health Committee
� Group of National Experts in Vocational Education and Training
� Trade Committee
� Committee for Agriculture
� Committee on Statistics and Statistical Policy
� Climate Change Expert Group
� Research Collaborative on Tracking Private Climate Finance
� Policy Dialogue on Natural Resource Based Development
Adherence to OECD Instruments � OECD Convention on Combating Bribery of Foreign
Public Officials in International Business Transactions
� Declaration on Propriety, Integrity, and Transparency in the Conduct of International Business and Finance
� OECD Action Plan for Youth
� Declaration on Green Growth
� Convention on Mutual Administrative Assistance in Tax Matters, as amended by the 2010 Protocol
� Declaration on Automatic Exchange of Information in Tax Matters
� Recommendation of the Council on the New Standard on Automatic Exchange of Financial Account Information
� Codes of Liberalisation of Capital Movements and of Current Invisible Operations
� Recommendation of the Council on Principles for Public Governance of Public-Private Partnerships
� Recommendation of the Council on Principles for Transparency and Integrity in Lobbying
� Recommendation of the Council on OECD Guidelines for Managing Conflict of Interest in the Public Service
� Recommendation of the Council on Improving Ethical Conduct in the Public Service, Including Principles for Managing Ethics in the Public Service
43WORKING DOCUMENT
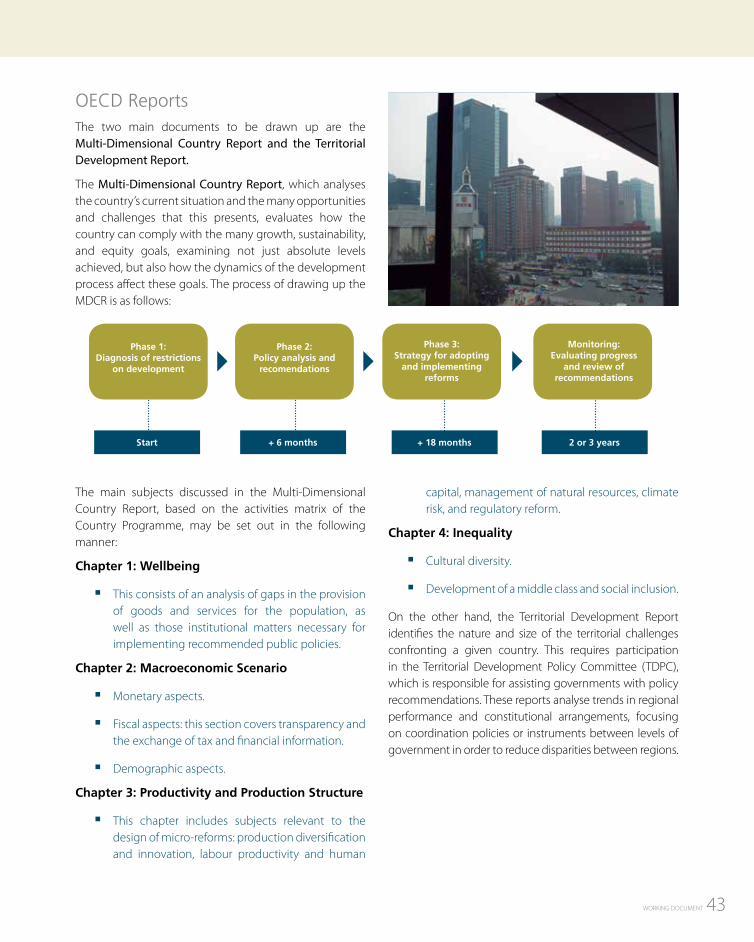
OECD ReportsThe two main documents to be drawn up are the Multi-Dimensional Country Report and the Territorial Development Report.
The Multi-Dimensional Country Report, which analyses the country’s current situation and the many opportunities and challenges that this presents, evaluates how the country can comply with the many growth, sustainability, and equity goals, examining not just absolute levels achieved, but also how the dynamics of the development process affect these goals. The process of drawing up the MDCR is as follows:
Phase 1: Diagnosis of restrictions
on development
Phase 2: Policy analysis and
recomendations
Phase 3: Strategy for adopting
and implementing reforms
Monitoring: Evaluating progress
and review of recommendations
Start + 6 months + 18 months 2 or 3 years
The main subjects discussed in the Multi-Dimensional Country Report, based on the activities matrix of the Country Programme, may be set out in the following manner:
Chapter 1: Wellbeing
� This consists of an analysis of gaps in the provision of goods and services for the population, as well as those institutional matters necessary for implementing recommended public policies.
Chapter 2: Macroeconomic Scenario
� Monetary aspects.
� Fiscal aspects: this section covers transparency and the exchange of tax and financial information.
� Demographic aspects.
Chapter 3: Productivity and Production Structure
� This chapter includes subjects relevant to the design of micro-reforms: production diversification and innovation, labour productivity and human
capital, management of natural resources, climate risk, and regulatory reform.
Chapter 4: Inequality
� Cultural diversity.
� Development of a middle class and social inclusion.
On the other hand, the Territorial Development Report identifies the nature and size of the territorial challenges confronting a given country. This requires participation in the Territorial Development Policy Committee (TDPC), which is responsible for assisting governments with policy recommendations. These reports analyse trends in regional performance and constitutional arrangements, focusing on coordination policies or instruments between levels of government in order to reduce disparities between regions.
44 CENTRO NACIONAL DE PLANEAMIENTO ESTRATÉGICO
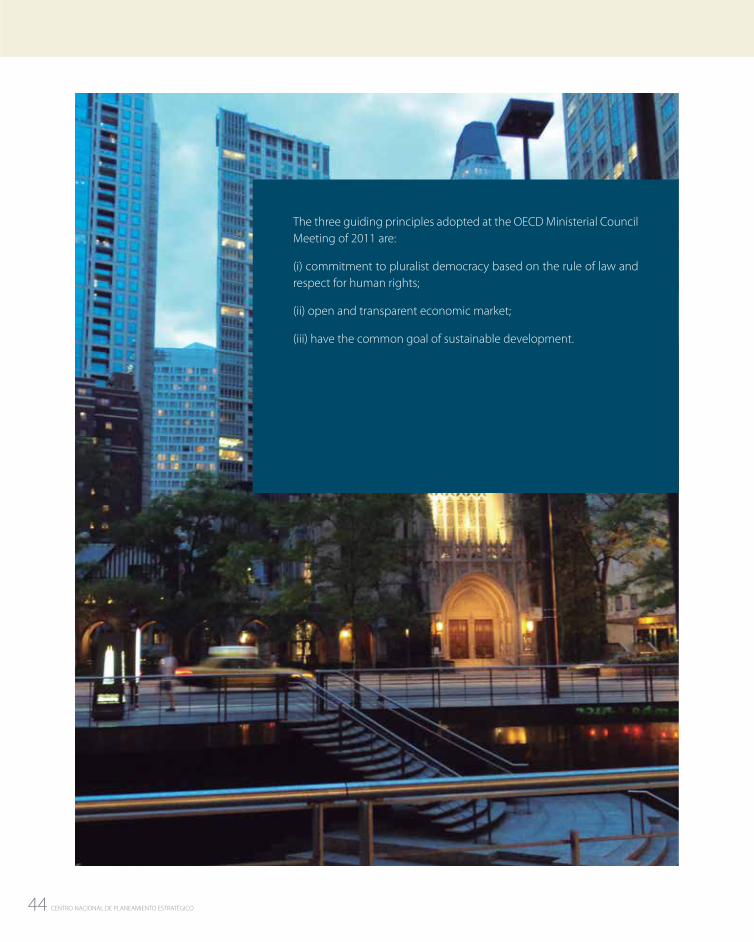
The three guiding principles adopted at the OECD Ministerial Council Meeting of 2011 are:
(i) commitment to pluralist democracy based on the rule of law and respect for human rights;
(ii) open and transparent economic market;
(iii) have the common goal of sustainable development.
45WORKING DOCUMENT
7 GAPS AND CHALLENGES
Chile was the first South American country to achieve full membership to the OECD. The adhesion of Peru to the OECD necessarily assumes positive changes to various development indicators. Achievement of this goal would mean international recognition of two decades of continuous effort to reform the country’s economic policies and democratic system.
With an annual GDP growth rate of around 5% over the last 20 years, Chile has taken significant steps to reduce poverty and improve its institutions, implementing
Source: World Bank, IMF, WEF, IFs Model, Ceplan
New
bus
ines
ses
regi
ster
ed
Agr
icul
ture
, val
ue a
dded
Con
sum
er p
rice
inde
x
Dep
ende
ncy
ratio
GD
P, P
PP
Man
ufac
turin
g, v
alue
add
ed
Impr
oved
wat
er s
ourc
e
Inte
rnet
use
rs
Indu
stry
, val
ue a
dded
Regu
lato
ry q
ualit
y
Impr
oved
san
itatio
n fa
cilit
ies
Voic
e an
d ac
coun
tabi
lity
Per
capi
ta G
DP,
PPP
Elec
tric
ity p
rodu
ctio
n
ISO
-cer
tified
firm
s (%
)
Port
infr
astr
uctu
re
Gov
ernm
ent
effe
ctiv
enes
s
Fore
ign
dire
ct in
vest
men
t, in
flow
Con
trol
of
corr
uptio
n
Polit
ical
sta
bilit
y an
d ab
senc
e of
vio
lenc
e
Expo
rts
of g
oods
and
ser
vice
s
legislation to improve regulation of free competition and guarantee the transparency of its financial markets.
Below are the levels of development achieved by Chile when it joined the OECD (2010) and Peru’s current levels. Figure 26 shows indicators that help to determine a country’s level of development. The data indicates that, in various aspects, Peru has more weaknesses than strengths.
Figure 26: Gaps between Peru (2013)and Chile (2010)
100.0%
80.0%
60.0%
40.0%
20.0%
0.0%
-20.0%
-40.0%
-60.0%
-80.0%
46 CENTRO NACIONAL DE PLANEAMIENTO ESTRATÉGICO
We can see that Peru has principally managed to strengthen certain economic development indicators. However, the evolution of institutional and service provision indicators is worrying. The data reveals large gaps in development compared with the progress made by Chile at the time it was admitted as a full member of the OECD. Nevertheless, good macroeconomic performance provides a solid foundation for the reform of other aspects necessary for the country to achieve developed status.
Figure 26 illustrates three types of gaps.
a. Those that can be closed quickly (those of less than 20%). For example, added value of manufacturing and improved water sources.
b. Those that need specific policies and could be closed in the medium term (those between 20% and 40%). For example, per capita GDP and the provision of utilities (electricity, water, etc.)
c. Those arising from structural problems in the country, which can only be closed in the long term through extensive reforms (those exceeding 40%). For example, political stability and absence of violence, export levels, government effectiveness, and the control of corruption.
Can the Gaps Be Closed Before 2021?Figure 27 shows the likelihood that our country will close its development gaps, using as a reference Chile at the time it became a full member of the OECD in 2010.
Figure 27: Likelihood of Closing Gaps between Chile (2010) and Peru (2013)
Man
ufac
turin
g, v
alue
add
ed
Impr
oved
wat
er s
ourc
e
Inte
rnet
use
rs
Indu
stry
, val
ue a
dded
Regu
lato
ry q
ualit
y
Impr
oved
san
itatio
n fa
cilit
ies
Voic
e an
d ac
coun
tabi
lity
Per
capi
ta G
DP,
PPP
Elec
tric
ity p
rodu
ctio
n
ISO
- ce
rtifi
ed fi
rms
(%)
Port
infr
astr
uctu
re
Gov
ernm
ent
effe
ctiv
enes
s
Fore
ign
dire
ct in
vest
men
t, in
flow
Con
trol
of
corr
uptio
n
Polit
ical
sta
bilit
y an
d ab
senc
e of
vio
lenc
e
Expo
rts
of g
oods
and
ser
vice
s
Gaps between Chile (2010) and Peru (2013)
Average growth rate over the last years
Peru is capable ofclosing the gaps by 2021, as it has in its favour the
economic growthrecorded in recent years.
Source: World Bank, Ceplan
250%
200%
150%
100%
50%
0%
-50%
50%9%2%15%
200%200%
49%71%57%
9%10%9%
68%
4%
67%
171%
47WORKING DOCUMENT
This figure includes the existing gaps in the indicators shown in figure 26 and the average growth rates of each of them over the past eight years. As noted, there are indicators that Peru registers significant progress, generating a high expectation to close the gaps that are presented. However, those in which Peru has little improvement (highlighted in red) remains as a concern, as their evolution seems stuck and need urgent implementation of policies that promote drastic changes. Thus, the focus should be placed on the following variables: violence control and political stability, corruption control, government effectiveness, level of exports of goods and services, provision of drinking water and regulatory quality.
Despite the stagnation in some of the key indicators, we are convinced that Peru has the ability to close the gaps around the year 2021, as it has in its favor the economic growth recorded over the past 20 years. With the timely implementation of reforms and public policy, Peru could have by the year of the Bicentennial the profile Chile had when entering to the OECD Organisation.
If Peru is committed to work and learn from the experiences of OECD countries, the government should have a strategy or plan which considers as its starting point the Country Programme, and set as a desirable goal to implement the resulting policy recommendations. The Country Programme does not guarantee access to the OECD, but it does establish a working process in which the guidelines to follow to reach the standards of the member countries are provided. Therefore, in the best case scenario, Peru could be invited to join the OECD.

48 CENTRO NACIONAL DE PLANEAMIENTO ESTRATÉGICO
49WORKING DOCUMENT
8 FINAL REFLECTIONS
Peru is on the road to development. But development requires concrete references for progress. Membership in the OECD may serve as a reference, since its member countries are those that have the best quality of life indicators, the most robust and consolidated democracies, modern infrastructure and technology, and the highest levels of social mobility. After decades of relative backwardness, Peru has begun to converge with the developed economies. The gaps between us and average indicators —of all types— exhibited by OECD countries are still considerable. But as we have shown in this document, they can be closed if we make an effort. By 2021, we will not have closed the gaps between us and the OECD average, but by then we should be ready to be admitted as a member country.
� Peru has made initial solid contact with the OECD, enabling us to exchange development experiences and receive assistance through co-operation and dialogue from the organisation and its member countries. It is vitally important that Peru’s admittance as a full member of the OECD be seen as a country-wide goal.
� For that reason, CEPLAN believes that Peru’s admission as a full member of the OECD is feasible for 2021, the bicentennial of our independence.
� Entry to the OECD will enable us to work with the world’s most developed economies in the search for solutions to development challenges. Above all, it will be a powerful signal that Peru is a stable and reliable country (which will translate into more foreign investment and better financing conditions for future projects), and that it is on the road to development, to the benefit of all Peruvians.
50 CENTRO NACIONAL DE PLANEAMIENTO ESTRATÉGICO
� WORLD BANK. World Development Indicators. Query: Nov. 2013. Also available at: <http://data.worldbank.org/data-catalog/world-development-indicators>
� INTER-AMERICAN DEVELOPMENT BANK. Query: Nov. 2013. Also available at: <http://www.iadb.org/es/investigacion-y-datos/estadisticas-y-bases-de-datos,3161.html>
� OECD (2011). Better Policies for Better Lives (The OECD at 50 and Beyond), Paris.
� OECD (2011). OECD 50th Anniversary Vision Statement. OECD, Paris.
� OECD (2013). Secretary-General’s Report to Ministers. OECD, Paris.
� ALTIMIR, OSCAR (2013). Indicadores de desigualdad de mediano plazo en América Latina, CEPAL.
� NATIONAL INTELLIGENCE COUNCIL (2012). Global Trends 2030, Alternative Worlds. NIC.
� INTERNATIONAL MONETARY FUND. Query: Nov. 2013. Also available at: <www.imf.org/external/data.htm>
BIBLIOGRAPHY
51WORKING DOCUMENT
Centro Nacional de Planeamiento Estratégico480 Enrique Canaval y Moreyra Avenue, 11th floor
San Isidro, Lima, Peru(51-1) 211-7800

52 CENTRO NACIONAL DE PLANEAMIENTO ESTRATÉGICO
National Strategic Planning Centre
National Strategic Planning Centre
Ceplan Perú
Ceplan2050
Canal Ceplan
Ceplan
(51-1) 211-7800www.ceplan.gob.pe
480 Enrique Canaval y Moreyra Avenue, 11th floor San Isidro, Lima, Peru