Embed Size (px)
Citation preview
California Environmental Protection Agency Department of Pesticide Regulation
PESTICIDE AIR MONITORING IN PARLIER, CA
December 2009
By
Pamela Wofford, Environmental Monitoring Branch Randy Segawa, Environmental Monitoring Branch Jay Schreider, Ph.D., Medical Toxicology Branch
Department of Pesticide Regulation 1001 I Street
Sacramento, CA 95814
Acknowledgments
We would like to thank all of the members of the Parlier project technical advisory group (TAG): Lynn Baker, Ian Reeve, Pat Matteson, Jeff Wright, Bob Schlag, Helene Margolis, Charlie Goodman, Karen Francone, Lauren Dawson, Kent Pinkerton, Tim Tyner, David Grantz, Gary Van Sickle, and Lori Berger. We also would like to thank members of the Parlier local advisory group (LAG): Jena Ambacher, Ben Benavidez, Rosa Betancourt, Teresa DeAnda, Juana Espino, Dr. Rogelio Fernandez, Karen Francone, Raul Goana, Rey Leon, Lou Martinez, Harold McClarty, Richard Milton, Vernon Peterson, Vidal Reyna, Carolina Simunovic, Daniela Simunovic, and Tom Vitali for their guidance. We also would like to thank California Department of Food and Agriculture’s analytical laboratory personnel—Jean Hsu, Paul Lee, Suzanne Matsumoto, Stephen Siegel, Jane White, Elaine Wong, and Teresa Woroncieka—for their hard work. We also would like to thank the Air Resources Board’s monitoring and laboratory staff and the Quality Assurance team members. In addition, thanks to the field sampling crew—Braulia Sapien, Vanessa Perez, Roger Sava, Clarice Ando, Cindy Garrettson—and DPR’s West Sacramento crew for sample handling and equipment assistance: Carissa Gana, Heidi Dietrich, Brian Orlando, and Jesse Ybarra. Special thanks to the Parlier City School District personnel and all of the principals at the school sampling sites, especially Lydia Martinez who made it fun. Without DPR’s Veda Federighi this project would have been almost impossible. Finally, we would like to thank Rosemary Neal of DPR for her Geographic Information System expertise and Madeline Brattesani for her editing skills.
This report may be downloaded from DPR’s website, www.cdpr.ca.gov
DISCLAIMER
The mention of commercial products, their source, or use in connection with material reported herein is not to be construed as an actual or implied endorsement of such products.
P a r l i e r A i r M o n i t o r i n g R e p o r t
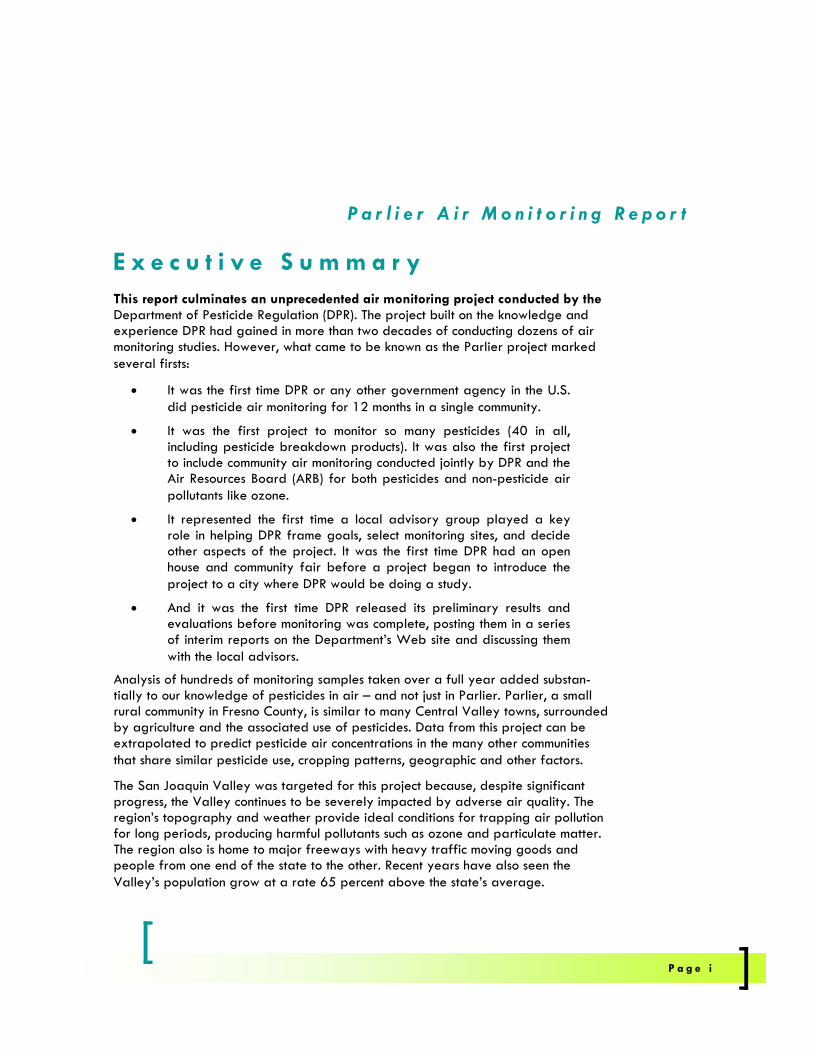
E x e c u t i v e S u m m a r y This report culminates an unprecedented air monitoring project conducted by the Department of Pesticide Regulation (DPR). The project built on the knowledge and experience DPR had gained in more than two decades of conducting dozens of air monitoring studies. However, what came to be known as the Parlier project marked several firsts:
• It was the first time DPR or any other government agency in the U.S.did pesticide air monitoring for 12 months in a single community.
• It was the first project to monitor so many pesticides (40 in all,including pesticide breakdown products). It was also the first project to include community air monitoring conducted jointly by DPR and the Air Resources Board (ARB) for both pesticides and non-pesticide air pollutants like ozone.
• It represented the first time a local advisory group played a key role in helping DPR frame goals, select monitoring sites, and decide other aspects of the project. It was the first time DPR had an open house and community fair before a project began to introduce the project to a city where DPR would be doing a study.
• And it was the first time DPR released its preliminary results andevaluations before monitoring was complete, posting them in a series of interim reports on the Department’s Web site and discussing them with the local advisors.
Analysis of hundreds of monitoring samples taken over a full year added substan-tially to our knowledge of pesticides in air – and not just in Parlier. Parlier, a small rural community in Fresno County, is similar to many Central Valley towns, surrounded by agriculture and the associated use of pesticides. Data from this project can be extrapolated to predict pesticide air concentrations in the many other communities that share similar pesticide use, cropping patterns, geographic and other factors.
The San Joaquin Valley was targeted for this project because, despite significant progress, the Valley continues to be severely impacted by adverse air quality. The region’s topography and weather provide ideal conditions for trapping air pollution for long periods, producing harmful pollutants such as ozone and particulate matter. The region also is home to major freeways with heavy traffic moving goods and people from one end of the state to the other. Recent years have also seen the Valley’s population grow at a rate 65 percent above the state’s average.
P a g e i
Execut ive Summary - Par l ier Air Moni tor ing Repor t
Ozone and particulate matter are the two pollutants responsible for most of the Valley’s air quality problems and associated health risks. Not surprisingly, however, pesticides also are found in ambient air in communities surrounded by agriculture. In Parlier, DPR monitoring detected many pesticides, the majority at levels well below those expected to cause health effects. None were unique to Parlier, but were consistent with what would be expected in other areas of the San Joaquin Valley. No findings warranted immediate regulatory action. Nonetheless, some detections did trigger regulatory concern and further evaluation. DPR is expediting its risk assessments on two chemically related insecticides (diazinon and chlorpyrifos), which were found often and, in one sample, above the health screening level. Detections of the fumigant 1,3-dichloropropene prompted further evaluation as lifetime exposure at the levels detected may pose a potential cancer risk. This prompted DPR to reopen its risk assessment and to examine the adequacy of existing limits on use designed to keep concentrations below levels of health concern.
Air monitoring results in brief: • DPR and the ARB monitored over 12 months at Parlier schools. (See Figure 2,
page 10, for map of sampling locations.) DPR took samples three days a week, the ARB at least once every six days. The San Joaquin Valley Air Pollution Control District conducted its regular air monitoring one mile from Parlier.
• Among chemicals monitored, the greatest potential health risk in Parlier was not from substances used as pesticides but from two pollutants found commonly throughout California: acrolein and formaldehyde. Their concentrations were similar to those found in ambient air elsewhere in the state. The most likely source is motor vehicle and industrial emissions.
• Of the 35 pesticides the two agencies monitored (plus 5 pesticide breakdown products), 16 were detected (plus 3 breakdown products.) Measured amounts varied, depending on the pesticide. For the most part, levels were comparable to those found in single-pesticide monitoring previously done by DPR and ARB in other agricultural communities.
• Another four chemicals were detected that are sometimes used as pesticides. How-ever, there was no reported pesticide use of these compounds in the Parlier area. Levels were comparable to those found statewide and their presence in Parlier – like elsewhere in the state – is most likely the result of auto or industrial emissions.
• The pesticide detected most often was MITC, found in 84 percent of the samples. Although levels were well below screening levels, pesticide use records show little use in the surrounding areas, suggesting that the residues may have been from fumigant applications outside the five-mile study boundary area.
• The insecticides chlorpyrifos and diazinon were among the pesticides found most often. Amounts found were below health screening levels, with one exception. Detections of these chemically related pesticides posed the highest non-cancer risk among pesticides detected, prompting DPR to focus added resources on ongoing risk assessments for these compounds.
P a g e i i
Execut ive Summary - Par l ier Air Moni tor ing Repor t
• Detections of 1,3-dichloropropene warranted further evaluation. This fumigant is a carcinogen and lifetime exposure at the levels detected may be of health concern.
• Of the 15 pesticides monitored but not detected, 10 had no or low use and the remaining 5 had moderate to high use.
• A detailed discussion of the air monitoring results, including tables and figures, begins on page 21 of the report. A detailed discussion on the health evaluation of measured air concentrations begins on page 47.
Why DPR Did This Study In 2004, the California Environmental Protection Agency (Cal/EPA) released its Environmental Justice Action Plan. (The Action Plan is posted on Cal/EPA Web site, www.calepa.ca.gov.) Under the plan, Cal/EPA charged its six boards, departments and offices (BDOs) with developing and conducting pilot projects that “focus on envi-ronmental risk factors (including emissions/discharge, exposure, and health risk) that impact children’s health.” Because rural, agricultural communities may have higher concentrations of pesticides in ambient air compared with their urban counterparts, Cal/EPA asked DPR to postpone its air monitoring network project and instead conduct focused air monitoring for one year in a Central Valley farming community.
The Parlier project was designed to provide more systematic air monitoring for a suite of pesticides over several months, with the resulting data serving as a more robust foundation for assessing exposure, particularly for children.
For these EJ projects, each BDO was asked to collect environmental data beyond their typical regulatory scope. For example, the Parlier project collected not only pesticide data but also data on criteria air pollutants (such as ozone and particulate matter) as a result of DPR collaboration with the ARB and the San Joaquin Valley Air Pollution Control District. (For the results of the ARB and District air monitoring, see page 36 of the report.)
With their environmental justice (EJ) orientation, the Action Plan projects also emphasized public participation. A key element was inclusion of local advisory groups (LAGs) to provide recommendations and input on how each project should be carried out. The BDOs were also strongly encouraged to use the Internet to widen opportunities for public participation.
Each EJ project included elements to support Cal/EPA efforts to develop definitions of and guidance for cumulative impacts assessment and precautionary approaches. (Note: Those elements are only tangentially addressed in this report, which focuses on the collection, analysis, and scientific evaluation of air monitoring data.)
The Parlier study also met DPR’s mandate for “continuous evaluation.” Under California law, DPR is required to “eliminate from use” any pesticide that “endangers the agricultural or nonagricultural environment….” To perform this function, the law requires DPR to conduct “continuous evaluation” of currently registered pesticides. Several DPR programs evaluate use practices to detect possible problems and to determine if further regulatory measures are necessary.
P a g e i i i
Execut ive Summary - Par l ier Air Moni tor ing Repor t
For example, DPR conducts field studies to monitor exposure to workers, and to measure how pesticides move and break down in air, soil and water.
To develop effective measures to reduce potentially unsafe pesticide levels in air, regulators must first find out what those levels are and how they relate to possible health effects. Past air monitoring by DPR and ARB provided limited data to estimate human exposure as these earlier studies focused on short-term monitoring for a single chemical in each study. (For information on other air studies, see Appendix 14.) To generate better data on long-term exposures, in the early part of this decade DPR began planning a network to sample ambient air for multiple pesticides in several communities over several years. The data would help DPR scientists evaluate exposure and resulting risk to health (risk assessment), develop measures to reduce risk (risk management), and determine the effectiveness of existing use restrictions.
Objectives, Scope and Methodology The Parlier project differed from previous air monitoring projects in that before work began, DPR sought extensive public comment on project priorities and in selecting a community for monitoring. DPR evaluated 83 Central Valley communities on several demographic factors (for example, number of children and nonwhite population), and for the relative use of pesticides the project was to monitor. DPR also considered air sampling feasibility, weather patterns, monitoring stations for other air pollutants,
P a g e i v
Inform the community of the project. DPR sponsored a community forum in Parlier in Janu-ary 2006 to tell residents about the air monitoring pilot project. To encourage greater attendance, DPR invited representatives of more than two dozen local and regional government agencies to staff booths focused on jobs, education, public safety, and community health. The event was held on a Saturday to make it easier for working people to attend, and more than 300 people did so.
DPR also held eight public meetings with the LAG from 2005 through 2007. Agendas and minutes were translated into Spanish, as were report summaries issued on monitoring results. Agendas, minutes and project reports were posted
on DPR’s Web site. DPR staff also made presentations at Parlier monitored schools, discussing the study and other monitoring the Department conducts.
Reduce pesticide risk. As part of its Parlier pro-ject, DPR scientists conducted a pest management assessment in the area to help develop, evaluate and promote lower-risk alternatives for Parlier’s major crops–grapes, stone fruit and citrus. The assessment is posted on DPR’s Web site. Among other things, DPR is using the information to help develop new pest management initiatives. DPR has also funded the use is innovative application equipment that reduces pesticide use and has funded research on alternatives to highly toxic
P r o j e c t o b j e c t i v e s a d d e d b y t h e P a r l i e r L o c a l A d v i s o r y G r o u p
In the draft project protocol, DPR scientists proposed three project objectives, the focus of this report: to find out if residents were exposed to pesticides in air and, if so, which pesticides, what amounts, and did those levels pose a health threat. At its first meeting June 9, 2005, the Parlier Local Advisory Group (LAG) added these four objectives:
(continued on next page)
Execut ive Summary - Par l ier Air Moni tor ing Repor t
availability of data on pesticides in groundwater, and the potential for collaboration with organizations planning complementary or related studies. (See Appendix B of the report for more information on development of the project protocol.)
After three rounds of public comment (including an October 2004 workshop in Fresno), DPR completed its draft project protocol in early 2005, subject to further revisions from technical and community advisory groups to be formed when the project began.
In the draft protocol, DPR outlined its project objectives: to find out if residents were exposed to pesticides in air and, if so, which pesticides, what amounts, and did those levels pose a health threat. This report focuses on these scientific issues. The project’s local advisory group later added four objectives. See sidebar below for how DPR met those goals.
As the project location, DPR chose Parlier because it ranked high in EJ and other factors and in collaborative opportunities. Parlier, about one-square-mile in area, is about 20 miles southeast of Fresno. Of the 11,088 people living in Parlier in the year 2000, about 38 percent were younger than 18 years old and 97 percent were Hispanic. Like scores of other Central Valley farm towns, Parlier is surrounded by agriculture. Major crops in the area are grapes and tree fruit. More than 200 chemicals are used for agricultural production in the study area, that is, within five
P a g e v
pesticides. The idea is to help participating pest managers improve their operations while reducing human and environmental exposure to pesticides. Pest management initiatives carried out by DPR include projects in walnuts, wine grapes, almonds, stone fruit, citrus, and the containerized nursery industry, and for IPM in schools.
Conduct follow-up actions (for example regula-tory actions or education). The Parlier air monitor-ing data prompted DPR to expedite risk assess-ments on chlorpyrifos and diazinon, and to reopen its risk assessment on the fumigant, 1,3-dichlo-ropropene. DPR is also reexamining permitted uses and restrictions on this fumigant.
Put risk in perspective, that is, to the extent feasi-ble, put pesticide risk in perspective compared with other pollutants. The insecticides chlorpyrifos and diazinon accounted for most of the relative non-cancer health risk of pesticides detected.
However, the air concentrations of acrolein and formaldehyde were often well above screening levels, posing a health risk higher than any of the pesticides detected in Parlier.
DPR is collaborating with Cal/EPA’s Office of Environmental Health Hazard Assessment to con-sider various approaches for evaluating cumula-tive health impacts of environmental chemicals. When this guidance is developed, the Parlier and other monitoring data can be reevaluated. It is ex-pected that acrolein and formaldehyde would dominate any consideration of non-cancer chronic risk from multiple chemical exposures in Parlier. These two compounds are sometimes used as pesti-cides but their presence in Parlier is from vehicle and industrial emissions. Concentrations were similar to those found in ambient air throughout the San Joaquin Valley and elsewhere in the state.
Project objectives added by the Parlier Local Advisory Group (continued)
Execut ive Summary - Par l ier Air Moni tor ing Repor t
miles of Parlier, with more than two million pounds used yearly. Insecticides and fungicides are the most heavily used pesticides in the area. (See map of study area boundaries, Figure 1, page 9 of the report.)
DPR formed a technical advisory group (TAG) to provide informal peer review on technical and scientific elements of the project. It included representatives from gov-ernment agencies, universities, and commodity groups. The TAG evaluated the moni-toring plan to ensure that appropriate pesticides were included, that the monitoring sites represented locations of relatively high exposure in Parlier, and that the number and frequency of sampling were enough to determine exposures. They also reviewed the health screening levels and methods used to estimate risk from individual as well as multiple contaminants. The TAG held seven meetings between June 2005 and May 2007. In 2009, members reviewed and commented on a draft of this report. (Minutes of the TAG meetings are posted on DPR’s Web site, www.cdpr.ca.gov.)
To ensure public participation, DPR also set up a local advisory group (LAG). DPR invited applications for LAG membership from the Parlier community and regional environmental justice (EJ) organizations. In May 2005, DPR named 18 people to the group, including EJ and farmworker representatives, members of local government, and Parlier-area farmers and business owners.
The LAG met eight times between 2005 and 2007. (Members also reviewed and commented on a draft of this report). Although not a decision-making group, the LAG had significant impact on how DPR conducted the project. The LAG helped DPR select pesticides to monitor, sampling sites, and monitoring frequency. The LAG approved delaying the start of monitoring until January 2006 so DPR could spread the costs of the project over two fiscal years, allowing monitoring to be done more often and at more sites. (Agendas and minutes of the LAG meetings are posted on DPR’s Web site, www.cdpr.ca.gov.)
In consultation with the LAG, three Parlier elementary schools were chosen as sampling locations, with samples taken three days a week. The ARB monitored at a single Parlier school, at least once every six days. (See map of sampling locations, Figure 2, page 20.)
DPR initially proposed to monitor from 21 to 27 pesticides, selected based on state-wide use, volatility, and DPR risk assessment priority. Other considerations included their extent of use in the area, whether the compounds could be included in a multi-pesticide method, and resources for sample collection and analysis. In addition, DPR proposed to the LAG that either chloropicrin or MITC be monitored because neither could be detected on the multi-pesticide screen; the LAG chose MITC.
When the ARB became a full partner in the project and agreed to monitor for a full range of criteria air pollutants, this expanded the number of pesticides that could be monitored. Metals used as pesticides (copper and sulfur) were added to the project, and ARB’s volatile organic compound monitoring picked up the fumigants methyl bromide and 1,3-dichloropropene.
P a g e v i
Execut ive Summary - Par l ier Air Moni tor ing Repor t
As a result, the project sampled for 35 pesticides, plus 5 pesticide breakdown products. (See Table 1, page 4, for a list of pesticides monitored, and Table 3, page 6, for their chemical class, intended use, and trade names.) Twenty of the 35 pesticides that DPR and the ARB monitored were among the top 100 used within five miles of Parlier in 2003. The remaining pesticides were included in the multi-pesticide monitoring method because they could be added without extra cost. Many have high use in other areas of the state where DPR will use the method in its planned air monitoring network.
DPR took samples at three schools on 156 days over the 12-month project, collecting a total of 468 samples that were analyzed for 33 pesticides and breakdown products. Another 468 taken on the same days and sites were analyzed for the fumi-gant pesticide MITC. (Tables 12 and 13, page 34, show the pesticide detections by location, and the number of detections of each pesticide at each DPR monitoring site.)
Working from one Parlier school, the ARB analyzed 71 samples for VOCs and 64 samples for metals and elements. The SJVAPCD collected continuous samples for the criteria pollutants, nitrogen dioxide, and ozone at its monitoring station just southeast of Parlier.
In addition, DPR conducted limited groundwater monitoring in Parlier for currently registered pesticides which are known groundwater contaminants. (See page 42 for more information.)
DPR toxicologists evaluated the data on a continuing basis, as air monitoring samples were analyzed throughout 2006. To do this, scientists relied on “health screening levels” developed by DPR in collaboration with technical experts from other agencies. Screening levels were set for each pesticide, and for various lengths of exposure – short-term or acute exposure; intermediate-term (subchronic) exposure; and chronic exposures of a year or more. (Screening levels were not developed for carcinogens. DPR toxicologists evaluated community exposure to potential carcinogens after monitoring was complete.)
Health-protective screening levels were necessary because there are no federal or state standards for pesticides in air, that is, no enforceable health-based limits on pesticide emissions allowed in air. The screening levels were designed to point out potential concerns for non-cancer health effects. Although they are not regulatory standards, these screening levels are useful for preliminary evaluations of air monitoring data. Detections below the screening level for a given pesticide would not be considered to represent a significant health concern and generally would not undergo further evaluation, but neither should such detections automatically be considered “safe.” They could still undergo further evaluation. Detections above the screening level would not necessarily signal a significant health concern but would point out the need for a more refined evaluation. Detections that were significantly greater than the screening levels could be of health concern; such detections would suggest the need to explore use restrictions or other risk reduction measures. (See page 17 for discussion of how health evaluation methods were developed. Further discussion of health screening level development is in Appendix F; Table 6, page 20, lists the screening levels for each pesticide monitored.)
P a g e v i i
Execut ive Summary - Par l ier Air Moni tor ing Repor t
After monitoring was complete, DPR scientists conducted an in-depth assessment of the data to determine the exposure and health risk from both individual as well as multiple pesticides. Potential risks from short-, intermediate-, and long-term exposures (including potential cancer risk) were calculated. (An in-depth discussion of the results of the health evaluation of measured air concentrations begins on page 47.)
DPR also compared the data with its air monitoring results from other areas, and analyzed correlations with pesticide use and weather monitoring data. (Comparisons with air monitoring from other areas is in Appendix H. Table 11, page 32, presents the percent of samples with detectable pesticide concentrations and their reported use in the study area. A discussion of pesticide use in the area, including use of monitored pesticides, begins on page 58. Weather data is discussed beginning on page 43.)
Conclusions In mid-2005, in a presentation to a Cal/EPA advisory committee on environmental justice, DPR scientists outlined four deliverables the Department expected from the Parlier project:
• More robust exposure assessment data.
• Indicators for future air monitoring projects.
• Indicators for areas for future investigation.
• Data that can be used to develop risk reduction measures that may be needed.
The Department is pleased to report that the project achieved these scientific goals, along with those set by the advisory committee, and other objectives that were not imagined at the time. (Further discussion on conclusions begins on page 77 of the report.) Through this project, DPR gained valuable knowledge about, and experience in, conducting ambient air monitoring in a community.
Several years before the Parlier project, DPR began planning for a network of moni-toring stations that would sample for pesticides residues over several years. The Par-lier project now provides a foundation and springboard for this network, which DPR plans to set up in 2010. DPR’s work in Parlier served to test and perfect sampling protocols, develop health screening levels, improve and expand laboratory analyti-cal methodology, and fine-tune approaches to data analysis.
The Department also added to its knowledge of and experience in conducting pro-jects that depend on input and assistance from the community. As resources permit, DPR plans to use this knowledge and experience to create an ambient air monitoring network to monitor several types of communities to determine what pesticide expo-sures, if any, occur in different situations.
P a g e v i i i
TABLE OF CONTENTS
EXECUTIVE SUMMARY………………………………………………………………i
TABLE OF CONTENTS ................................................................................................ ix
LIST OF TABLES ............................................................................................................ x
LIST OF FIGURES ......................................................................................................... xi
LIST OF APPENDICES ................................................................................................ xii
GLOSSARY.................................................................................................................... xiii
INTRODUCTION............................................................................................................. 1
BACKGROUND.................................................................................................................. 1 SITE DESCRIPTION ........................................................................................................... 2
PESTICIDES AND AREA MONITORED .................................................................... 3
PESTICIDES MONITORED.................................................................................................. 3 STUDY AREA ................................................................................................................... 7
MATERIALS AND METHODS ..................................................................................... 7
AIR SAMPLING METHODS ................................................................................................ 7 Department of Pesticide Regulation ........................................................................... 7 Air Resource Board..................................................................................................... 8 San Joaquin Valley Air Pollution Control District. .................................................... 8
METHODS FOR COLLECTING WEATHER DATA ............................................................... 11 METHODS FOR COLLECTING PESTICIDE USE DATA........................................................ 11 ADDITIONAL SAMPLING BY DPR ................................................................................... 11 SAMPLING PROCEDURE.................................................................................................. 12 QUALITY CONTROL METHODS....................................................................................... 12 LABORATORY METHODS................................................................................................ 13
Method calibration .................................................................................................... 13 Holding times............................................................................................................ 13 Method detection limits and limits of quantitation ................................................... 13 Calculations of air concentrations............................................................................. 14
MULTIPLE PESTICIDE SAMPLES...................................................................................... 14 MITC SAMPLES ............................................................................................................. 14
DATA ANALYSIS METHODS .................................................................................... 17
HEALTH EVALUATION METHODS................................................................................... 17
RESULTS ........................................................................................................................ 22
AIR MONITORING RESULTS ........................................................................................... 22 Monitoring Results from DPR and ARB for Pesticides ........................................... 22 Results from Monitoring by ARB and SJVAPCD for VOCs, Metals, Hexavalent Chromium and Criteria Pollutants ............................................................................ 37
ADDITIONAL SAMPLING................................................................................................. 43 Ground Water Sampling ........................................................................................... 43 Particulate Sampling ................................................................................................. 43
ix
WEATHER DATA ............................................................................................................ 44 HEALTH EVALUATION OF MEASURED AIR CONCENTRATIONS....................................... 49
Acute Exposure......................................................................................................... 50 Subchronic Exposure ................................................................................................ 51 Chronic Exposure...................................................................................................... 52 Carcinogenicity ......................................................................................................... 53
REPORTED PESTICIDE USE IN THE PARLIER AREA.......................................................... 60
DATA VALIDATION/QUALITY ASSURANCE....................................................... 70
DATA VALIDATION/QUALITY ASSURANCE....................................................... 71
DATA REVIEW ............................................................................................................... 71 Sample Shipment Quality Assurance........................................................................ 71 Pesticide Use Report Validation ............................................................................... 71
AUDIT RESULTS ............................................................................................................. 71 Sampler Flow Audits ................................................................................................ 71 Laboratory Audits ..................................................................................................... 72
QUALITY CONTROL RESULTS ........................................................................................ 72 Problems with the Chlorothalonil Analysis .............................................................. 73 Validation and Control Limits .................................................................................. 73 Storage Stability........................................................................................................ 73 Trapping Efficiency .................................................................................................. 74
DISCUSSION .................................................................................................................. 78
CONCLUSIONS, ACTIONS AND RECOMMENDATIONS ................................... 80
REFERENCES................................................................................................................ 82
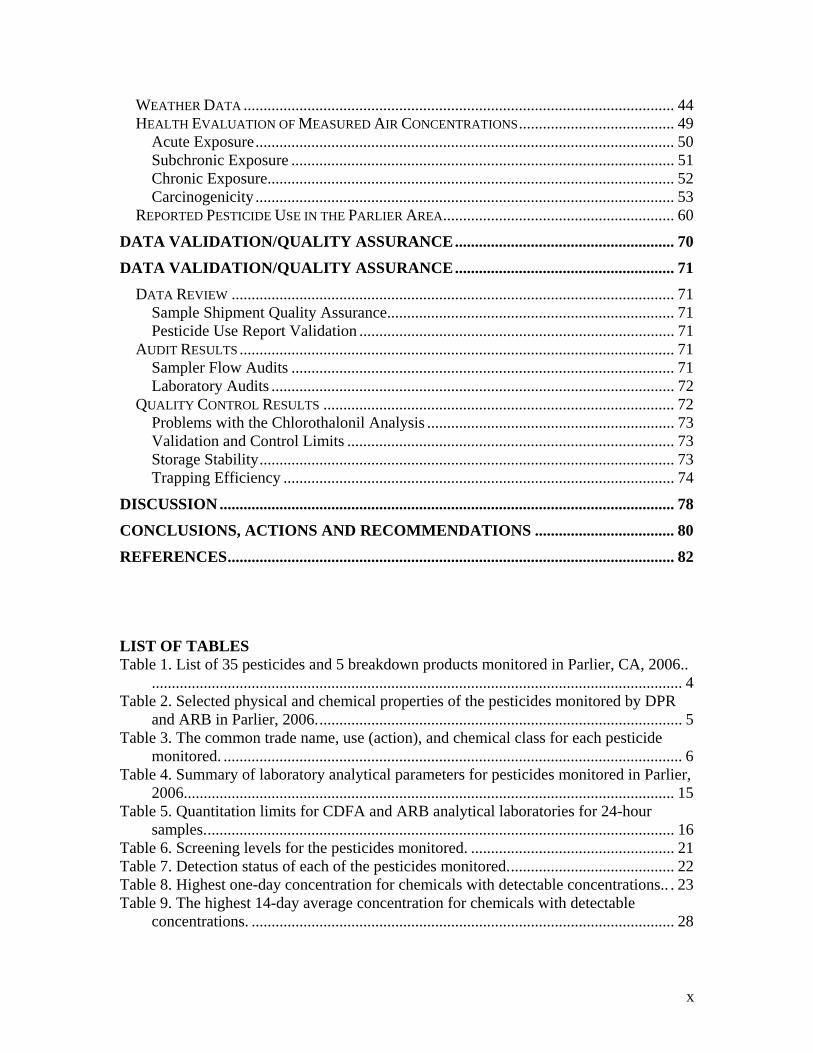
LIST OF TABLES Table 1. List of 35 pesticides and 5 breakdown products monitored in Parlier, CA, 2006..
..................................................................................................................................... 4 Table 2. Selected physical and chemical properties of the pesticides monitored by DPR
and ARB in Parlier, 2006............................................................................................ 5 Table 3. The common trade name, use (action), and chemical class for each pesticide
Table 4. Summary of laboratory analytical parameters for pesticides monitored in Parlier,
Table 5. Quantitation limits for CDFA and ARB analytical laboratories for 24-hour
Table 9. The highest 14-day average concentration for chemicals with detectable
monitored. ................................................................................................................... 6
2006........................................................................................................................... 15
samples...................................................................................................................... 16Table 6. Screening levels for the pesticides monitored. ................................................... 21 Table 7. Detection status of each of the pesticides monitored.......................................... 22 Table 8. Highest one-day concentration for chemicals with detectable concentrations.. . 23
concentrations. .......................................................................................................... 28
x
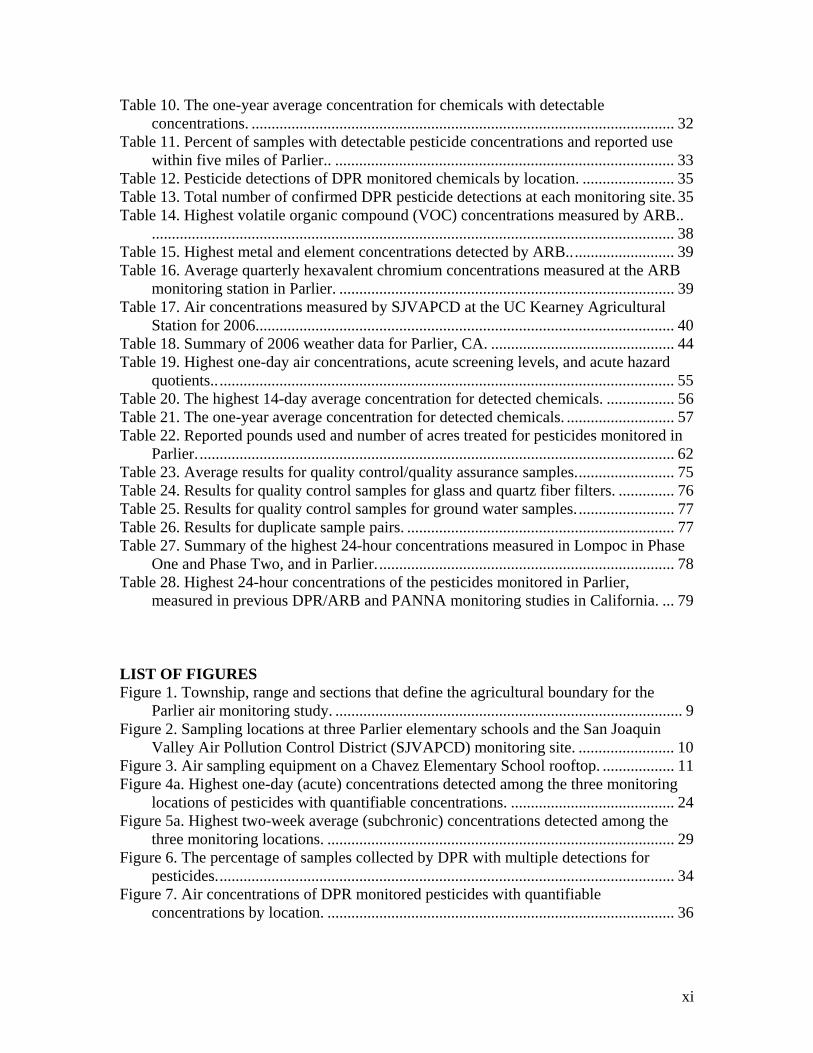
Table 10. The one-year average concentration for chemicals with detectable concentrations. .......................................................................................................... 32
Table 11. Percent of samples with detectable pesticide concentrations and reported use
Table 14. Highest volatile organic compound (VOC) concentrations measured by ARB..
Table 16. Average quarterly hexavalent chromium concentrations measured at the ARB
Table 17. Air concentrations measured by SJVAPCD at the UC Kearney Agricultural
Table 19. Highest one-day air concentrations, acute screening levels, and acute hazard
Table 22. Reported pounds used and number of acres treated for pesticides monitored in
Table 27. Summary of the highest 24-hour concentrations measured in Lompoc in Phase
Table 28. Highest 24-hour concentrations of the pesticides monitored in Parlier,
within five miles of Parlier.. ..................................................................................... 33 Table 12. Pesticide detections of DPR monitored chemicals by location. ....................... 35 Table 13. Total number of confirmed DPR pesticide detections at each monitoring site. 35
................................................................................................................................... 38 Table 15. Highest metal and element concentrations detected by ARB........................... 39
monitoring station in Parlier. .................................................................................... 39
Station for 2006......................................................................................................... 40 Table 18. Summary of 2006 weather data for Parlier, CA. .............................................. 44
quotients.. .................................................................................................................. 55Table 20. The highest 14-day average concentration for detected chemicals. ................. 56 Table 21. The one-year average concentration for detected chemicals. ........................... 57
Parlier........................................................................................................................ 62 Table 23. Average results for quality control/quality assurance samples......................... 75 Table 24. Results for quality control samples for glass and quartz fiber filters. .............. 76 Table 25. Results for quality control samples for ground water samples......................... 77 Table 26. Results for duplicate sample pairs. ................................................................... 77
One and Phase Two, and in Parlier........................................................................... 78
measured in previous DPR/ARB and PANNA monitoring studies in California. ... 79
LIST OF FIGURES Figure 1. Township, range and sections that define the agricultural boundary for the
Parlier air monitoring study. ....................................................................................... 9 Figure 2. Sampling locations at three Parlier elementary schools and the San Joaquin
Figure 4a. Highest one-day (acute) concentrations detected among the three monitoring
Figure 5a. Highest two-week average (subchronic) concentrations detected among the
Figure 6. The percentage of samples collected by DPR with multiple detections for
Figure 7. Air concentrations of DPR monitored pesticides with quantifiable
Valley Air Pollution Control District (SJVAPCD) monitoring site. ........................ 10 Figure 3. Air sampling equipment on a Chavez Elementary School rooftop. .................. 11
locations of pesticides with quantifiable concentrations. ......................................... 24
three monitoring locations. ....................................................................................... 29
pesticides................................................................................................................... 34
concentrations by location. ....................................................................................... 36
xi
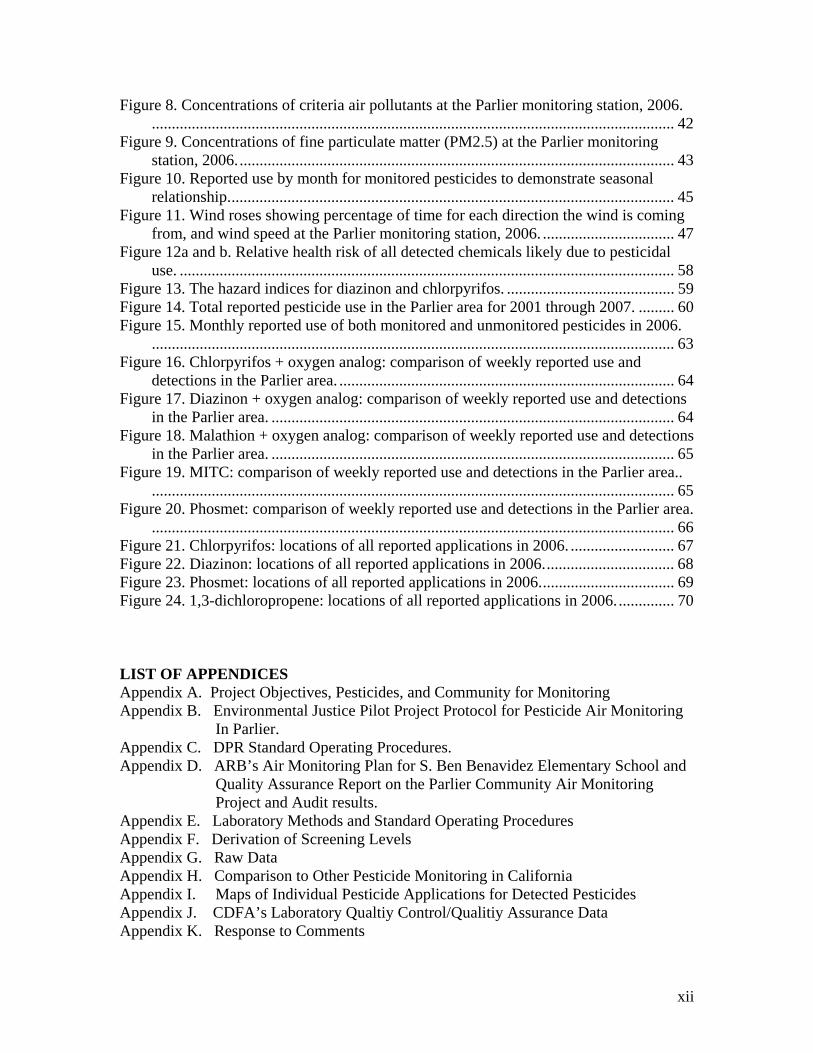
Figure 8. Concentrations of criteria air pollutants at the Parlier monitoring station, 2006.................................................................................................................................... 42
Figure 9. Concentrations of fine particulate matter (PM2.5) at the Parlier monitoring station, 2006.............................................................................................................. 43
Figure 10. Reported use by month for monitored pesticides to demonstrate seasonal
Figure 11. Wind roses showing percentage of time for each direction the wind is coming
Figure 12a and b. Relative health risk of all detected chemicals likely due to pesticidal
relationship................................................................................................................ 45
from, and wind speed at the Parlier monitoring station, 2006. ................................. 47
use. ............................................................................................................................ 58 Figure 13. The hazard indices for diazinon and chlorpyrifos. .......................................... 59 Figure 14. Total reported pesticide use in the Parlier area for 2001 through 2007. ......... 60 Figure 15. Monthly reported use of both monitored and unmonitored pesticides in 2006.
................................................................................................................................... 63 Figure 16. Chlorpyrifos + oxygen analog: comparison of weekly reported use and
detections in the Parlier area. .................................................................................... 64 Figure 17. Diazinon + oxygen analog: comparison of weekly reported use and detections
Figure 18. Malathion + oxygen analog: comparison of weekly reported use and detections
Figure 19. MITC: comparison of weekly reported use and detections in the Parlier area..
Figure 20. Phosmet: comparison of weekly reported use and detections in the Parlier area.
in the Parlier area. ..................................................................................................... 64
in the Parlier area. ..................................................................................................... 65
................................................................................................................................... 65
................................................................................................................................... 66 Figure 21. Chlorpyrifos: locations of all reported applications in 2006. .......................... 67 Figure 22. Diazinon: locations of all reported applications in 2006................................. 68 Figure 23. Phosmet: locations of all reported applications in 2006.................................. 69 Figure 24. 1,3-dichloropropene: locations of all reported applications in 2006............... 70
LIST OF APPENDICES Appendix A. Project Objectives, Pesticides, and Community for Monitoring Appendix B. Environmental Justice Pilot Project Protocol for Pesticide Air Monitoring
In Parlier. Appendix C. DPR Standard Operating Procedures. Appendix D. ARB’s Air Monitoring Plan for S. Ben Benavidez Elementary School and
Quality Assurance Report on the Parlier Community Air Monitoring Project and Audit results.
Appendix E. Laboratory Methods and Standard Operating Procedures Appendix F. Derivation of Screening Levels Appendix G. Raw Data Appendix H. Comparison to Other Pesticide Monitoring in California Appendix I. Maps of Individual Pesticide Applications for Detected Pesticides Appendix J. CDFA’s Laboratory Qualtiy Control/Qualitiy Assurance Data Appendix K. Response to Comments
xii
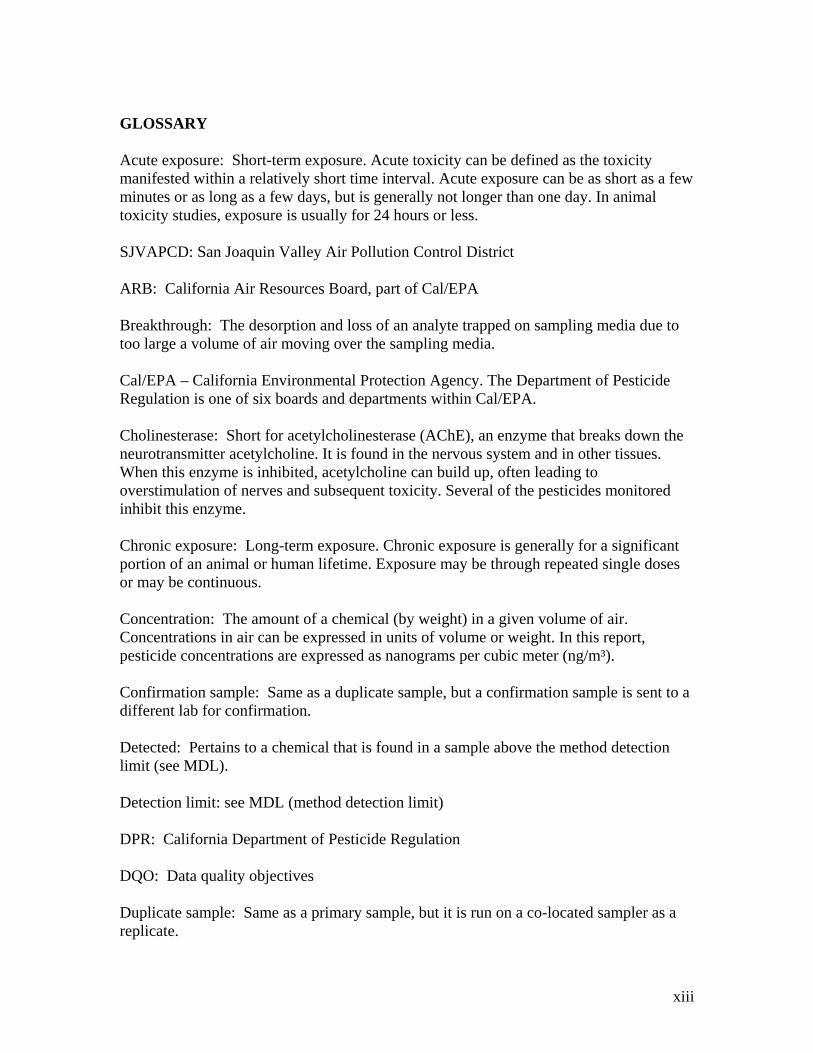
GLOSSARY
Acute exposure: Short-term exposure. Acute toxicity can be defined as the toxicity manifested within a relatively short time interval. Acute exposure can be as short as a few minutes or as long as a few days, but is generally not longer than one day. In animal toxicity studies, exposure is usually for 24 hours or less.
SJVAPCD: San Joaquin Valley Air Pollution Control District
ARB: California Air Resources Board, part of Cal/EPA
Breakthrough: The desorption and loss of an analyte trapped on sampling media due to too large a volume of air moving over the sampling media.
Cal/EPA – California Environmental Protection Agency. The Department of Pesticide Regulation is one of six boards and departments within Cal/EPA.
Cholinesterase: Short for acetylcholinesterase (AChE), an enzyme that breaks down the neurotransmitter acetylcholine. It is found in the nervous system and in other tissues. When this enzyme is inhibited, acetylcholine can build up, often leading to overstimulation of nerves and subsequent toxicity. Several of the pesticides monitored inhibit this enzyme.
Chronic exposure: Long-term exposure. Chronic exposure is generally for a significant portion of an animal or human lifetime. Exposure may be through repeated single doses or may be continuous.
Concentration: The amount of a chemical (by weight) in a given volume of air. Concentrations in air can be expressed in units of volume or weight. In this report, pesticide concentrations are expressed as nanograms per cubic meter (ng/m³).
Confirmation sample: Same as a duplicate sample, but a confirmation sample is sent to a different lab for confirmation.
Detected: Pertains to a chemical that is found in a sample above the method detection limit (see MDL).
Detection limit: see MDL (method detection limit)
DPR: California Department of Pesticide Regulation
DQO: Data quality objectives
Duplicate sample: Same as a primary sample, but it is run on a co-located sampler as a replicate.
xiii
Exposure: Contact with a chemical. Some common routes of exposure are dermal (skin), oral (by mouth) and inhalation (breathing).
Field blank: A sample cartridge that is capped and left beside sampler for a single sampling interval, and then stored on dry ice with the rest of the samples. The purpose is to determine if the procedures used in the field or in transporting samples may have contaminated the sample
FFDCA: Federal Food, Drug, and Cosmetic Act
FIFRA: Federal Insecticide, Fungicide, and Rodenticide Act
Fortified sample: A sample with a known amount of analyte spiked onto the sample media which is placed next to primary sample and treated to same flow and run time. The fortified spike, in comparison with trip spikes and the respective field sample, provides some information about any change in the ability to recover the analyte during air sampling.
FQPA: U.S. Food Quality Protection Act
Hazard index (HI): The sum of all hazard quotients (HQs). It is used to estimate the potential health risk for non-cancer effects from exposure to several chemicals for a given time period (acute, subchronic, chronic). That is,
HI = HQ1 + HQ2 + HQ3 + …
HQ: Hazard quotient. It is the ratio of an exposure level for a chemical (measured air concentration of a pesticide) to a reference concentration for the chemical (screening level for that pesticide) over the same time period. An HQ less than 1 is generally considered to be health protective.
Air Concentration Detected (ng/m3) Hazard Quotient = ----------------------------------------------
Screening Level (ng/m3)
LAG: Local advisory group
LOAEL: Lowest observed adverse effect level. In an animal toxicity study, the LOAEL is the lowest dose level used in that study that produces an observable adverse effect.
LOQ: Limit of Quantitation. Similar to method detection limit (MDL), the LOQ is the smallest amount of the chemical that can be reliably measured. Samples with concentrations above the minimum detection limit but below the LOQ can be identified as containing a trace amount but the concentration cannot be measured reliably. When calculating average concentrations or other statistics, DPR assumes that samples with a
xiv
trace concentration have a concentration at the midpoint between the MDL and the LOQ. As with the MDL, the LOQ is a characteristic of both the method and the chemical. Different methods can have different LOQs limits for the same chemical. The same method can have different LOQs for different chemicals.
MDL: Method detection limit. The MDL is the smallest amount of the chemical that can be identified (although not necessarily quantified) in a sample with the method employed. If nothing is detected, the sample may contain none of the chemical or may have a concentration less than the MDL. In either instance, the sample is designated as containing no detectable amount. When calculating average concentrations or other statistics, DPR assumes that samples with no detectable amount have a concentration of one-half the MDL. The MDL is a characteristic of both the method and the chemical. That is, different methods can have different MDLs for the same chemical. Similarly, one method can have different MDLs for different chemicals. (See also LOQ, limit of quantitation)
Monitored: Pertains to a chemical that was sampled and analyzed for to determine possible air concentrations.
NOAEL: No-observed-adverse-effect-level. In an animal toxicity study, the NOAEL is the highest dose level used in the study that did not produce an observable adverse effect.
ND: None detected. This is the concentration below the method detection limit (MDL).
OA: Oxygen analog, also known as oxon. This is the breakdown product from certain organophosphate pesticides. Oxygen analogs usually are more toxic than the parent compound.
OEHHA: Office of Environmental Health Hazard Assessment, part of Cal/EPA.
Primary sample: Sample collected in the field to measure pesticide air concentrations.
Public land survey system (PLSS): The PLSS is a method used in the United States to survey and identify land parcels, particularly for titles and deeds. Major elements are:
Section - Basic unit of the system, a square tract of land 1 mile by 1 mile, containing 640 acres.
Township – A parcel of land with 6-mile sides, containing 36 square-mile sections arranged 6 across and 6 down. Numbering begins in the northeast (NE) corner section (1) and ends in the southeast (SE) corner section (36). The numbers run in an s-shape, alternate lines east to west and then west to east.
Range - Assigned to a township by measuring east or west of a meridian. The range number identifies how many cells the property is to the east or west of a starting point.
xv
Range lines - A boundary of a township surveyed in a north-south direction.
Township Lines - East to west lines that mark township boundaries.
Meridian - Reference or beginning point for measuring east or west ranges. All townships in Parlier use the Mount Diablo Meridian.
Baseline - Reference or beginning point for measuring north or south townships. All townships in Parlier use the Mount Diablo Baseline.
A specific township and section are identified as being north or south of a particular baseline and east or west of a particular principal meridian. For example, township 14S22E is the fourteenth township south of the Mount Diablo baseline in the twenty-second range east of the Mount Diablo meridian. This particular 36 square-mile area is located north of Parlier. 14S22E23 is section 23 in this township, a 1-by-1 mile area in the SE corner of the township.
PUR: Pesticide use report. All agricultural pesticide use in California is required to be reported to the County Agricultural Commissioners. DPR collects these pesticide use reports; it evaluates and annually publishes the data.
Range: see Public land survey system.
RCD: Risk characterization document. DPR’s human health risk assessment for a pesticide is presented in the RCD. The RCD explains the results of the risk assessment and assembles, critiques and interprets all pertinent scientific data on a chemical’s toxicology, human experience, and exposure.
RED: Reregistration eligibility document. Reregistration is U.S. EPA’s reevaluation and relicensing of existing pesticides originally registered prior to current scientific and regulatory standards. U.S. EPA’s human health risk assessment for a pesticide is presented as part of its RED.
RfD: Reference dose. The RfD is an estimate of the daily exposure of the human population to a chemical, usually by the oral route, that is likely to be without adverse effects. Initially the term was used only to address chronic exposures but is now often used for other exposure durations. When it is used for other than chronic exposure, that exposure is specified (e.g., “subchronic RfD”).
RfC: Reference concentration. The RfC is an estimate of the daily air concentration of a chemical that is likely to be without adverse effects to the exposed human population. Initially the term was used only to address chronic exposures but is now often used for other exposure durations. When it is used for exposure durations other than chronic, that exposure is specified (e.g., “subchronic RfC”).
xvi
Risk: Risk is the probability that a toxic effect (adverse health effect) will result from a given exposure to a chemical. It is a function of both the inherent toxicity of the chemical as well as the exposure to the chemical.
Screening level: The calculated air concentration based on a chemical's toxicity that is used to evaluate the possible health effects of exposure to the chemical. Although not a regulatory standard, screening levels can be used in the process of evaluating the air monitoring results. A measured air concentration that is below the screening level for a given pesticide generally would not undergo further evaluation but should not automatically be considered “safe” and could undergo further evaluation. A measured concentration that is above the screening level would not necessarily indicate a health concern but would indicate the need for a further and more refined evaluation. Different screening levels are determined for different exposure periods, i.e., acute, subchronic, and chronic.
Section: see Public land survey system.
SOP: Standard operating procedure. It is a document describing the materials and methods used for various monitoring tasks.
Sorbent cartridge: A Teflon® cartridge filled with a measured amount of trapping media and sealed. The tube is attached to an air pump and ambient air is drawn through the trapping media in the tube.
Subchronic exposure: Exposure may be through repeated single doses or may be continuous.
TAG: Technical advisory group.
Township: see Public land survey system.
Trace: see Limit of Quantitation (LOQ)
Trip blank sample: A sample cartridge capped and stored on dry ice with the rest of the samples collected from the monitoring site. The purpose is to determine if the field, sample transporting, or storage procedures may have contaminated the sample.
Trip spike sample: A sample with a known amount of the target chemical spiked onto the sample media. It is sent with the field technician but is stored on dry ice for the duration of the monitoring period. The trip spikes provide information about any loss or change in the ability to recover the analyte during sample transport or storage.
UCD: University of California at Davis
xvii
Units of measurement: g: Gram. 1 g = 1,000 mgKg: Kilogram. 1 Kg = 1,000 grams L: Liter lbs: Pounds m: Meterm3: Cubic meter. 1 m3 = 1,000 L mg: Milligram. 1 mg = 1,000 ug ng: Nanogram. 1 ug = 1000 ng ppb: Parts per billion ppm: Parts per million ug: Microgram. 1 ug = 1,000 ng %: Percent
Units of measurement of air concentration: The amount of a chemical (by weight) in a given volume of air. Concentrations in air can be expressed in units of volume or weight. In this report, pesticide concentrations are expressed as nanograms per cubic meter (ng/m³).
U.S. EPA: U.S. Environmental Protection Agency
xviii
INTRODUCTION
Background
In 2004, the California Environmental Protection Agency (Cal/EPA) released its Environmental Justice Action Plan (CalEPA, 2004). Under the plan, Cal/EPA charged its six boards, departments and offices (BDOs) with developing and conducting pilot projects that “focus on environmental risk factors (including emissions/discharge, exposure, and health risk) that impact children’s health.” Because rural, agricultural communities may have higher concentrations of pesticides in ambient air compared with their urban counterparts, Cal/EPA asked DPR to postpone its air monitoring network project and instead conduct focused air monitoring for one year in a single Central Valley farming community.
The Parlier study also met DPR’s mandate for “continuous evaluation.” Under California law, DPR is required to “eliminate from use” any pesticide that “endangers the agricultural or nonagricultural environment….” To perform this function, the law requires DPR to conduct “continuous evaluation” of currently registered pesticides. Several DPR programs evaluate use practices to detect possible problems and to determine if further regulatory measures are necessary. For example, DPR conducts field studies to monitor exposure to workers, and to measure how pesticides move and break down in air, soil and water.
Past air monitoring by the Department of Pesticide Regulation (DPR) provided limited data to estimate human exposure as these earlier studies focused on short-term monitoring for a single chemical in each study. To generate better data on long-term exposures, in the early part of this decade DPR began planning a network to sample ambient air for multiple pesticides in several communities over several years.
Elements common to all of Cal/EPA pilot projects included reducing environmental risk to children, public participation, and addressing, to the degree possible, cumulative impacts and precautionary approaches.
The Department of Pesticide Regulation (DPR) conducted a project to assess human exposure to ambient air sources of pesticides in a rural community in California. In addition, drinking water sources were monitored for known ground-water contaminant pesticides to evaluate other potential routes of exposure for addressing cumulative risk. It is thought that rural communities may have higher concentrations of pesticides in air and water than urban communities because they are close to agricultural activities. In this project, air and water were identified as the major potential sources of pesticides. The department’s yearlong project measured pesticide air concentrations at multiple sites; it also collected data about pesticide concentrations in the water supply.
The project goals were to evaluate multiple pesticides in air and water and identify opportunities to reduce health risk, particularly to children. Initial project objectives were to answer the following questions:
1
• Are residents of the community exposed to pesticides in the air and in the water supply?
• Which pesticides are people exposed to and in what amounts? • Do measured pesticide air levels exceed levels of concern to human health,
particularly children?
DPR evaluated 83 communities in Fresno, Kern, Kings, Madera, Merced, Stanislaus, and Tulare Counties as candidates for this project. The communities were prioritized based on demographic data, availability of other exposure and health data, and pesticide use (both local and regional). DPR also considered other factors, including air sampling feasibility, weather patterns, and the potential for collaboration with other projects focused on environmental health. The evaluation process included public participation and comment on the selection parameters and final determination of the study site. Based on these factors, DPR selected Parlier in Fresno County (DPR, 2005). (See Appendix A for more information about the evaluation process.)
Once the decision was made to monitor in Parlier, DPR formed a local workgroup to assist in study design. At the suggestion of the city manager, DPR asked members of the Parlier Coordinating Responsibility Authority Committee to serve on a local advisory group (LAG), and sent out requests for participation and applications to other interested local community members. Priority for membership on the committee was given to persons living or working in or near Parlier. The LAG was key to ensuring meaningful public participation in this environmental justice project. The LAG included representatives of the California Rural Legal Assistance Foundation; Californians for Pesticide Reform; Fresno County Agricultural Commissioner’s office; Fresno Metro Ministry; Latino Issues Forum; Parlier City government; Parlier HEAL Asthma Project; and the Parlier Unified School District. The LAG also included the following: a local realtor, businessman, health care provider, vintner, and three farmers, including an organic farmer.
At the recommendation of the LAG, DPR added the following project objectives: --Inform the community on the project, including public forums. --Reduce pesticide risk. --Conduct follow-up actions, such as education or regulatory actions or both. --Put risk in perspective. To the extent feasible (considering resources and available data), put pesticide risk in perspective compared to other pollutants.
In addition, DPR formed a technical advisory group (TAG) to provide guidance on the scientific elements of the project. The TAG included staff from federal, state, and county agencies, and the University of California, as well as technical specialists from farmorganizations.
Site Description
Parlier is a small city (approximately 1.6 square miles in area) in the San Joaquin Valley, about 20 miles southeast of Fresno (Figure 1). Parlier has an elevation of approximately
2
340 feet, with about 13 inches of average annual precipitation. Summer temperatures typically range from 60 – 96 °F, and 35 – 50 °F in winter. Average prevailing winds are from the northwest at 5 – 8 miles an hour. During winter and spring, predominant winds are from the southeast; in summer and fall, the winds are predominantly from the northwest.
According to the 2000 U.S. Census, Parlier’s total population is 11,088. About 38 percent of the population is less than 18 years old, 97 percent are Hispanic, and the median family income is $24,275 per year.
Parlier is a rural community surrounded by agriculture. Major crops in the area are grapes and tree fruit. More than 200 chemicals are used for agricultural production within 5 miles of Parlier, with over 2 million pounds used per year. Insecticides and fungicides are the most heavily used pesticides in the area (DPR, 2007).
PESTICIDES AND AREA MONITORED
Pesticides Monitored
This project monitored ambient air concentrations of 40 pesticides and pesticide breakdown products. Working with the LAG and TAG, DPR selected the pesticides for monitoring based on: (1) toxicity, (2) vapor pressure (volatility), (3) use, (4) availability of sampling and laboratory methods, and ability to include a pesticide in a multiple analysis method. The LAG chose to add MITC to the list as a separate sample. (Details of the pesticide selection process are given in Appendix A.) DPR monitored 31 pesticides and pesticide breakdown products, and the California Air Resources Board (ARB) the remaining 9 pesticides. The ARB monitored air concentrations of 23 volatile organic compounds (VOCs), 6 of which have pesticidal uses; 28 metals, 3 of which have pesticidal uses; hexavalent chromium; and particulate matter (PM2.5). In addition, the San Joaquin Valley Air Pollution Control District (SJVAPCD) monitored ozone and nitrogen oxide.
A method to measure multiple chemicals in a single sample was developed by the University of California Davis (UCD) Trace Analytical Laboratory for a study that DPR conducted in Lompoc in 2000 (DPR, 2003). The method involved analysis for 22 pesticides and 5 breakdown products. The California Department of Food and Agriculture (CDFA), Center for Analytical Chemistry Laboratory, modified the method to analyze for the pesticides selected as chemicals of concern in Parlier.
Table 1 lists the 40 pesticides and pesticide breakdown products monitored in Parlier. Table 2 presents the physical and chemical properties of the pesticides monitored by DPR. Table 3 lists the use and chemical class of each of the pesticides monitored.
3
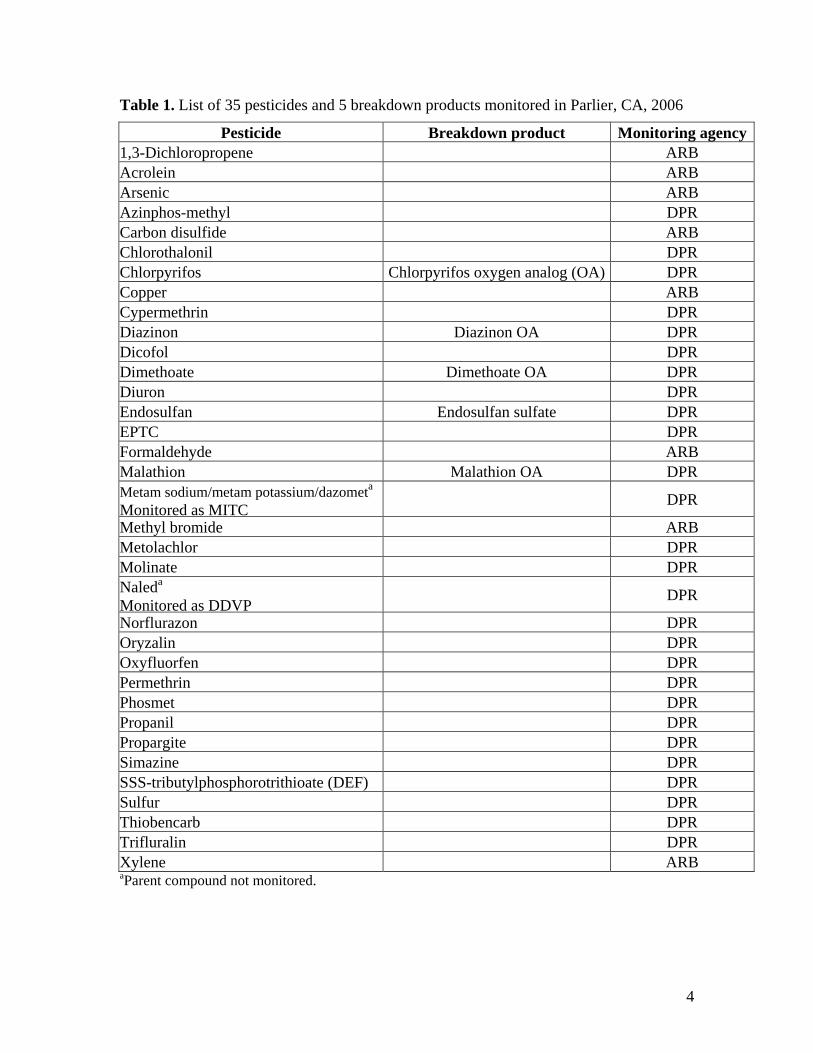
Table 1. List of 35 pesticides and 5 breakdown products monitored in Parlier, CA, 2006
Pesticide Breakdown product Monitoring agency 1,3-Dichloropropene ARB Acrolein ARB Arsenic ARB Azinphos-methyl DPR Carbon disulfide ARB Chlorothalonil DPR Chlorpyrifos Chlorpyrifos oxygen analog (OA) DPR Copper ARB Cypermethrin DPR Diazinon Diazinon OA DPR Dicofol DPR Dimethoate Dimethoate OA DPR Diuron DPR Endosulfan Endosulfan sulfate DPR EPTC DPR Formaldehyde ARB Malathion Malathion OA DPR Metam sodium/metam potassium/dazometa
Monitored as MITC DPR
Methyl bromide ARB Metolachlor DPR Molinate DPR Naleda
Monitored as DDVP DPR
Norflurazon DPR Oryzalin DPR Oxyfluorfen DPR Permethrin DPR Phosmet DPR Propanil DPR Propargite DPR Simazine DPR SSS-tributylphosphorotrithioate (DEF) DPR Sulfur DPR Thiobencarb DPR Trifluralin DPR Xylene ARB aParent compound not monitored.
4
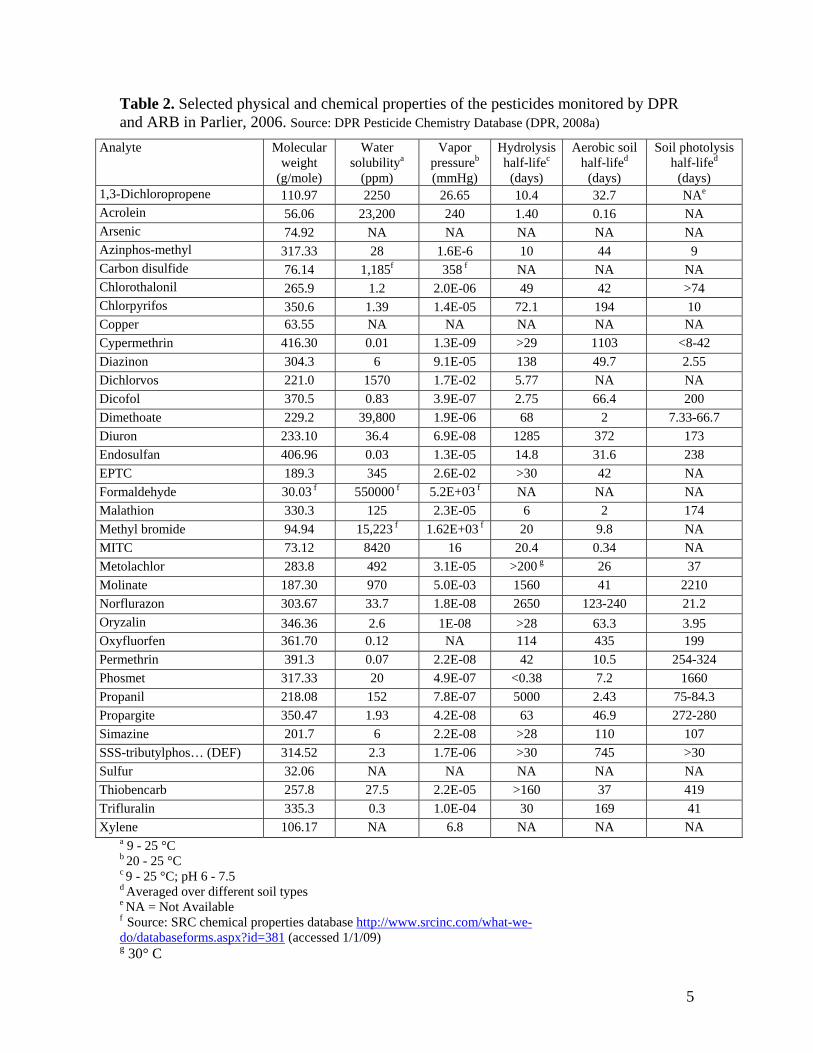
Table 2. Selected physical and chemical properties of the pesticides monitored by DPR and ARB in Parlier, 2006. Source: DPR Pesticide Chemistry Database (DPR, 2008a)
Analyte Molecular weight
(g/mole)
Water solubilitya
(ppm)
Vapor pressureb
(mmHg)
Hydrolysis half-lifec
(days)
Aerobic soil half-lifed
(days)
Soil photolysis half-lifed
(days) 1,3-Dichloropropene 110.97 2250 26.65 10.4 32.7 NAe
Acrolein 56.06 23,200 240 1.40 0.16 NA Arsenic 74.92 NA NA NA NA NA Azinphos-methyl 317.33 28 1.6E-6 10 44 9 Carbon disulfide 76.14 1,185f 358 f NA NA NA Chlorothalonil 265.9 1.2 2.0E-06 49 42 >74 Chlorpyrifos 350.6 1.39 1.4E-05 72.1 194 10 Copper 63.55 NA NA NA NA NA Cypermethrin 416.30 0.01 1.3E-09 >29 1103 <8-42 Diazinon 304.3 6 9.1E-05 138 49.7 2.55 Dichlorvos 221.0 1570 1.7E-02 5.77 NA NA Dicofol 370.5 0.83 3.9E-07 2.75 66.4 200 Dimethoate 229.2 39,800 1.9E-06 68 2 7.33-66.7 Diuron 233.10 36.4 6.9E-08 1285 372 173 Endosulfan 406.96 0.03 1.3E-05 14.8 31.6 238 EPTC 189.3 345 2.6E-02 >30 42 NA Formaldehyde 30.03 f 550000 f 5.2E+03 f NA NA NA Malathion 330.3 125 2.3E-05 6 2 174 Methyl bromide 94.94 15,223 f 1.62E+03 f 20 9.8 NA MITC 73.12 8420 16 20.4 0.34 NA Metolachlor 283.8 492 3.1E-05 >200 g 26 37 Molinate 187.30 970 5.0E-03 1560 41 2210 Norflurazon 303.67 33.7 1.8E-08 2650 123-240 21.2 Oryzalin 346.36 2.6 1E-08 >28 63.3 3.95 Oxyfluorfen 361.70 0.12 NA 114 435 199 Permethrin 391.3 0.07 2.2E-08 42 10.5 254-324 Phosmet 317.33 20 4.9E-07 <0.38 7.2 1660 Propanil 218.08 152 7.8E-07 5000 2.43 75-84.3 Propargite 350.47 1.93 4.2E-08 63 46.9 272-280 Simazine 201.7 6 2.2E-08 >28 110 107 SSS-tributylphos… (DEF) 314.52 2.3 1.7E-06 >30 745 >30 Sulfur 32.06 NA NA NA NA NA Thiobencarb 257.8 27.5 2.2E-05 >160 37 419 Trifluralin 335.3 0.3 1.0E-04 30 169 41 Xylene 106.17 NA 6.8 NA NA NA
a 9 - 25 °C b 20 - 25 °C c 9 - 25 °C; pH 6 - 7.5 d Averaged over different soil types e NA = Not Available f Source: SRC chemical properties database http://www.srcinc.com/what-wedo/databaseforms.aspx?id=381 (accessed 1/1/09) g 30° C
5
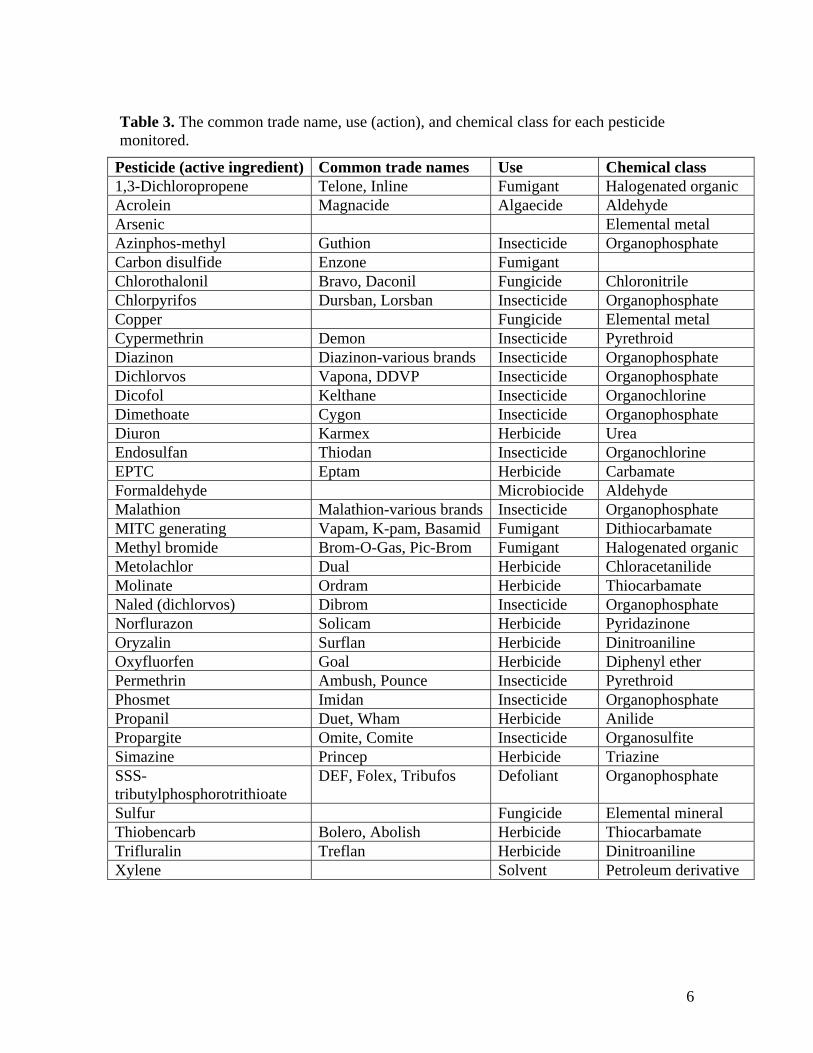
Table 3. The common trade name, use (action), and chemical class for each pesticide monitored.
Pesticide (active ingredient) Common trade names Use Chemical class 1,3-Dichloropropene Telone, Inline Fumigant Halogenated organic Acrolein Magnacide Algaecide Aldehyde Arsenic Elemental metal Azinphos-methyl Guthion Insecticide Organophosphate Carbon disulfide Enzone Fumigant Chlorothalonil Bravo, Daconil Fungicide Chloronitrile Chlorpyrifos Dursban, Lorsban Insecticide Organophosphate Copper Fungicide Elemental metal Cypermethrin Demon Insecticide Pyrethroid Diazinon Diazinon-various brands Insecticide Organophosphate Dichlorvos Vapona, DDVP Insecticide Organophosphate Dicofol Kelthane Insecticide Organochlorine Dimethoate Cygon Insecticide Organophosphate Diuron Karmex Herbicide Urea Endosulfan Thiodan Insecticide Organochlorine EPTC Eptam Herbicide Carbamate Formaldehyde Microbiocide Aldehyde Malathion Malathion-various brands Insecticide Organophosphate MITC generating Vapam, K-pam, Basamid Fumigant Dithiocarbamate Methyl bromide Brom-O-Gas, Pic-Brom Fumigant Halogenated organic Metolachlor Dual Herbicide Chloracetanilide Molinate Ordram Herbicide Thiocarbamate Naled (dichlorvos) Dibrom Insecticide Organophosphate Norflurazon Solicam Herbicide Pyridazinone Oryzalin Surflan Herbicide Dinitroaniline Oxyfluorfen Goal Herbicide Diphenyl ether Permethrin Ambush, Pounce Insecticide Pyrethroid Phosmet Imidan Insecticide Organophosphate Propanil Duet, Wham Herbicide Anilide Propargite Omite, Comite Insecticide Organosulfite Simazine Princep Herbicide Triazine SSStributylphosphorotrithioate
DEF, Folex, Tribufos Defoliant Organophosphate
Sulfur Fungicide Elemental mineral Thiobencarb Bolero, Abolish Herbicide Thiocarbamate Trifluralin Treflan Herbicide Dinitroaniline Xylene Solvent Petroleum derivative
6
Study Area
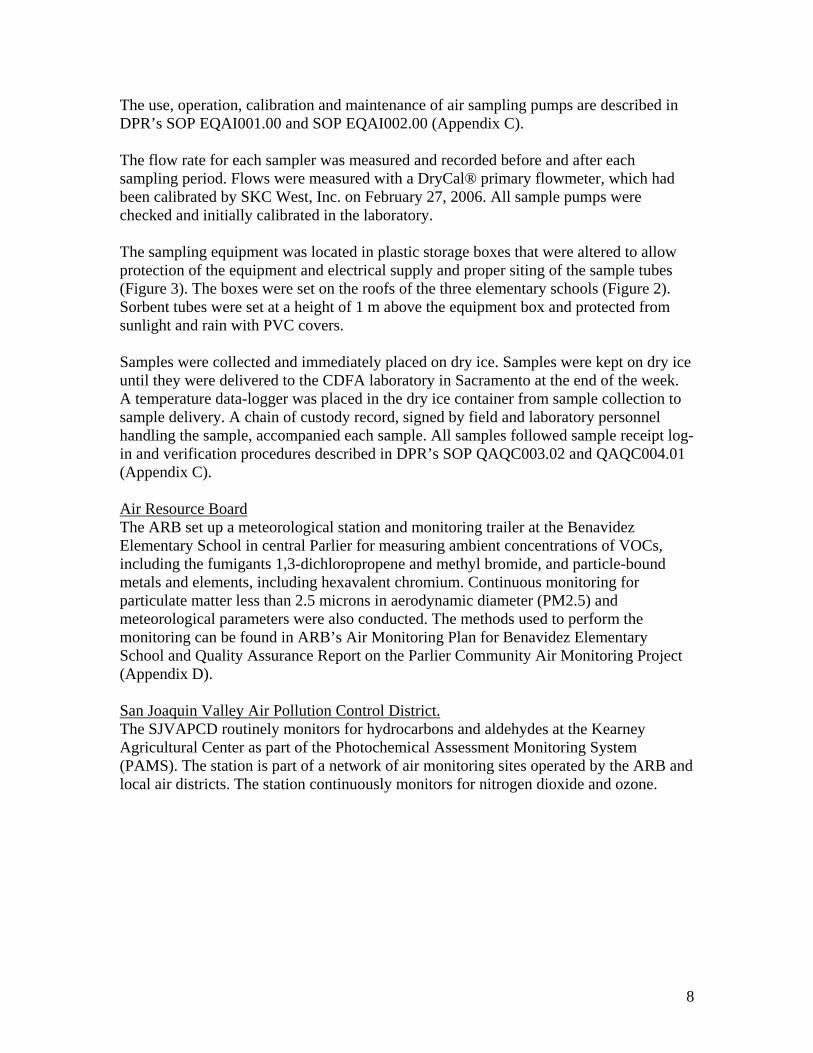
The study area for the Parlier project encompassed the City of Parlier and the surrounding agricultural areas. For the purposes of this study, the pesticide use report (PUR) data reflects applications made within five miles of the city boundary (Figure 1).
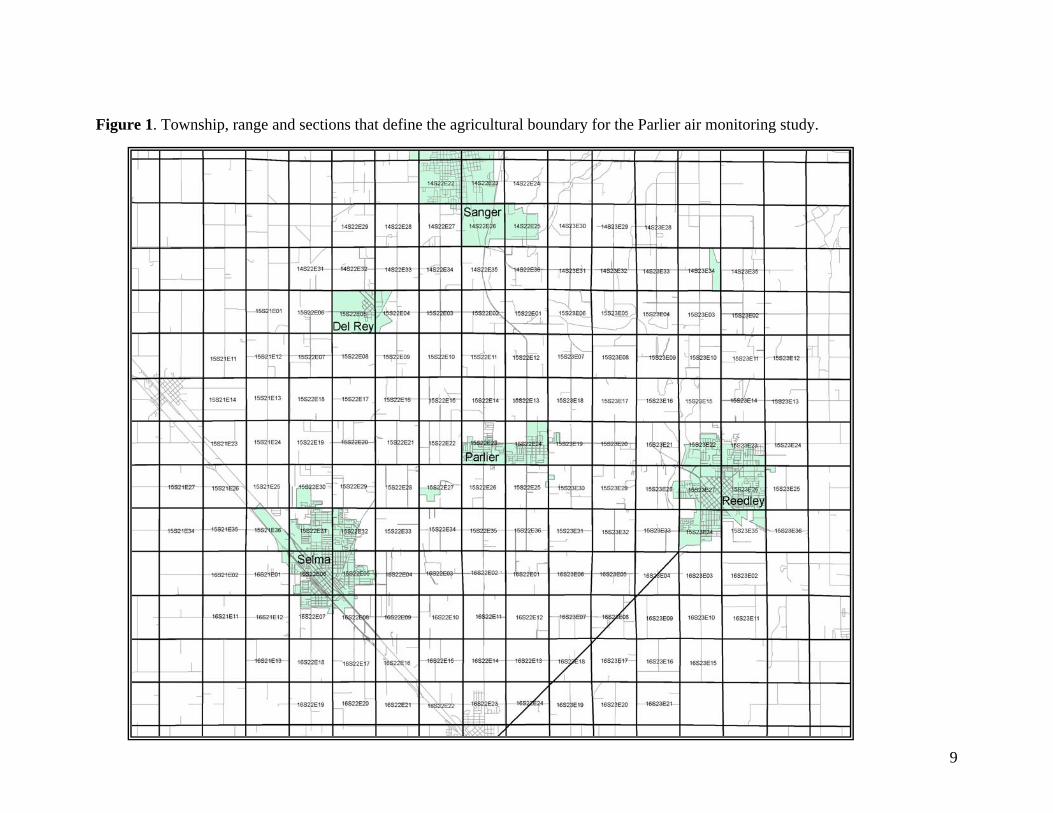
As a result of consultation with the LAG, air-sampling stations were set up at three elementary schools in Parlier (Figure 2): John C. Martinez (northwest part of town), S. Ben Benavidez (central), and Cesar E. Chavez (southeast). The ARB co-located a station at the Benavidez Elementary School to monitor volatile organic compounds (VOCs), criteria pollutants and metals. In addition, the SJVAPCD routinely monitors for other air pollutants at the University of California Kearney Agricultural Center, approximately one mile southeast of town.
MATERIALS AND METHODS
The design for sample collection is a product of the objectives of the project, the input of the community, and technical input from the LAG and TAG. This section describes the types of samples DPR collected, sample measurement, sampling materials used, and methods of sampling and analysis.
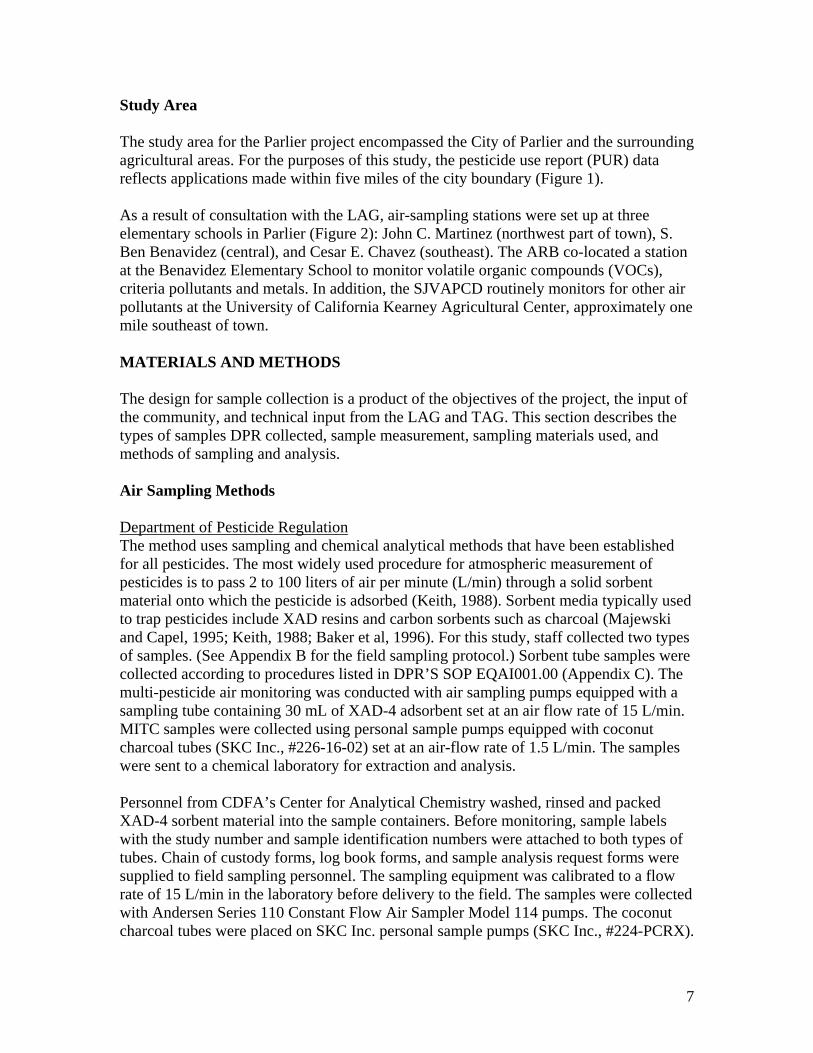
Air Sampling Methods
Department of Pesticide Regulation The method uses sampling and chemical analytical methods that have been established for all pesticides. The most widely used procedure for atmospheric measurement of pesticides is to pass 2 to 100 liters of air per minute (L/min) through a solid sorbent material onto which the pesticide is adsorbed (Keith, 1988). Sorbent media typically used to trap pesticides include XAD resins and carbon sorbents such as charcoal (Majewski and Capel, 1995; Keith, 1988; Baker et al, 1996). For this study, staff collected two types of samples. (See Appendix B for the field sampling protocol.) Sorbent tube samples were collected according to procedures listed in DPR’S SOP EQAI001.00 (Appendix C). The multi-pesticide air monitoring was conducted with air sampling pumps equipped with a sampling tube containing 30 mL of XAD-4 adsorbent set at an air flow rate of 15 L/min. MITC samples were collected using personal sample pumps equipped with coconut charcoal tubes (SKC Inc., #226-16-02) set at an air-flow rate of 1.5 L/min. The samples were sent to a chemical laboratory for extraction and analysis.
Personnel from CDFA’s Center for Analytical Chemistry washed, rinsed and packed XAD-4 sorbent material into the sample containers. Before monitoring, sample labels with the study number and sample identification numbers were attached to both types of tubes. Chain of custody forms, log book forms, and sample analysis request forms were supplied to field sampling personnel. The sampling equipment was calibrated to a flow rate of 15 L/min in the laboratory before delivery to the field. The samples were collected with Andersen Series 110 Constant Flow Air Sampler Model 114 pumps. The coconut charcoal tubes were placed on SKC Inc. personal sample pumps (SKC Inc., #224-PCRX).
7
The use, operation, calibration and maintenance of air sampling pumps are described in DPR’s SOP EQAI001.00 and SOP EQAI002.00 (Appendix C).
The flow rate for each sampler was measured and recorded before and after each sampling period. Flows were measured with a DryCal® primary flowmeter, which had been calibrated by SKC West, Inc. on February 27, 2006. All sample pumps were checked and initially calibrated in the laboratory.
The sampling equipment was located in plastic storage boxes that were altered to allow protection of the equipment and electrical supply and proper siting of the sample tubes (Figure 3). The boxes were set on the roofs of the three elementary schools (Figure 2). Sorbent tubes were set at a height of 1 m above the equipment box and protected from sunlight and rain with PVC covers.
Samples were collected and immediately placed on dry ice. Samples were kept on dry ice until they were delivered to the CDFA laboratory in Sacramento at the end of the week. A temperature data-logger was placed in the dry ice container from sample collection to sample delivery. A chain of custody record, signed by field and laboratory personnel handling the sample, accompanied each sample. All samples followed sample receipt login and verification procedures described in DPR’s SOP QAQC003.02 and QAQC004.01 (Appendix C).
Air Resource Board The ARB set up a meteorological station and monitoring trailer at the Benavidez Elementary School in central Parlier for measuring ambient concentrations of VOCs, including the fumigants 1,3-dichloropropene and methyl bromide, and particle-bound metals and elements, including hexavalent chromium. Continuous monitoring for particulate matter less than 2.5 microns in aerodynamic diameter (PM2.5) and meteorological parameters were also conducted. The methods used to perform the monitoring can be found in ARB’s Air Monitoring Plan for Benavidez Elementary School and Quality Assurance Report on the Parlier Community Air Monitoring Project (Appendix D).
San Joaquin Valley Air Pollution Control District. The SJVAPCD routinely monitors for hydrocarbons and aldehydes at the Kearney Agricultural Center as part of the Photochemical Assessment Monitoring System (PAMS). The station is part of a network of air monitoring sites operated by the ARB and local air districts. The station continuously monitors for nitrogen dioxide and ozone.
8
9
Figure 1. Township, range and sections that define the agricultural boundary for the Parlier air monitoring study.
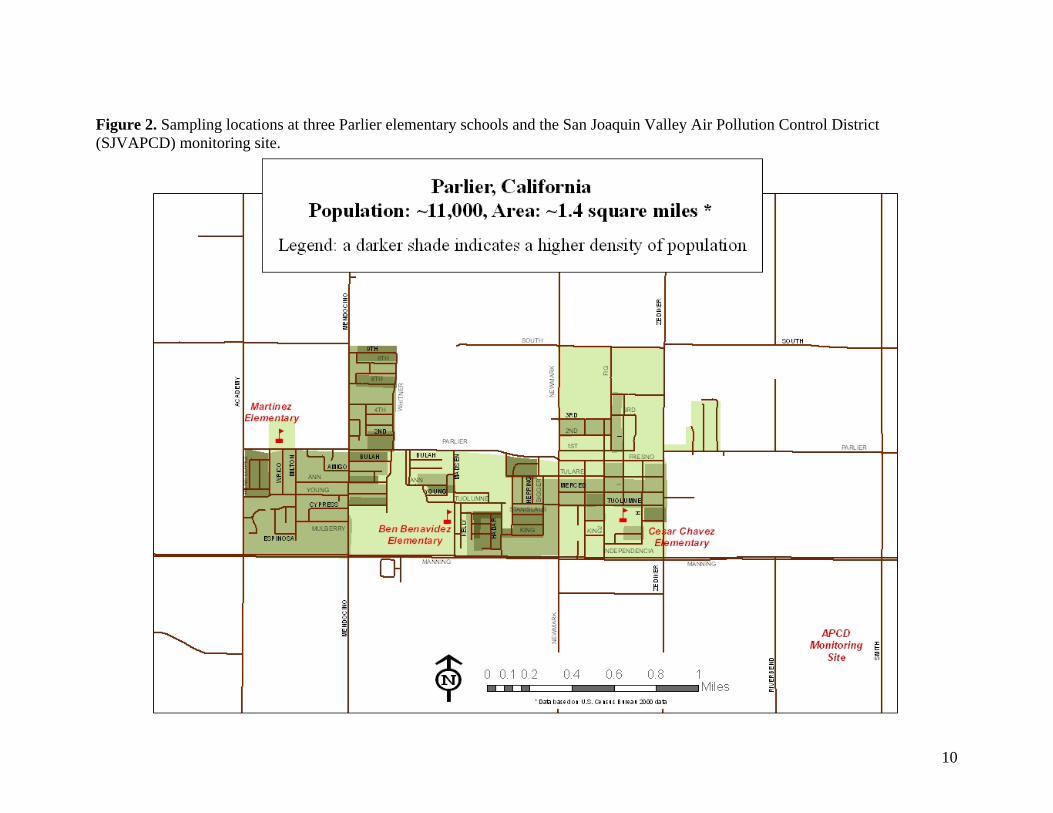
Figure 2. Sampling locations at three Parlier elementary schools and the San Joaquin Valley Air Pollution Control District (SJVAPCD) monitoring site.
10
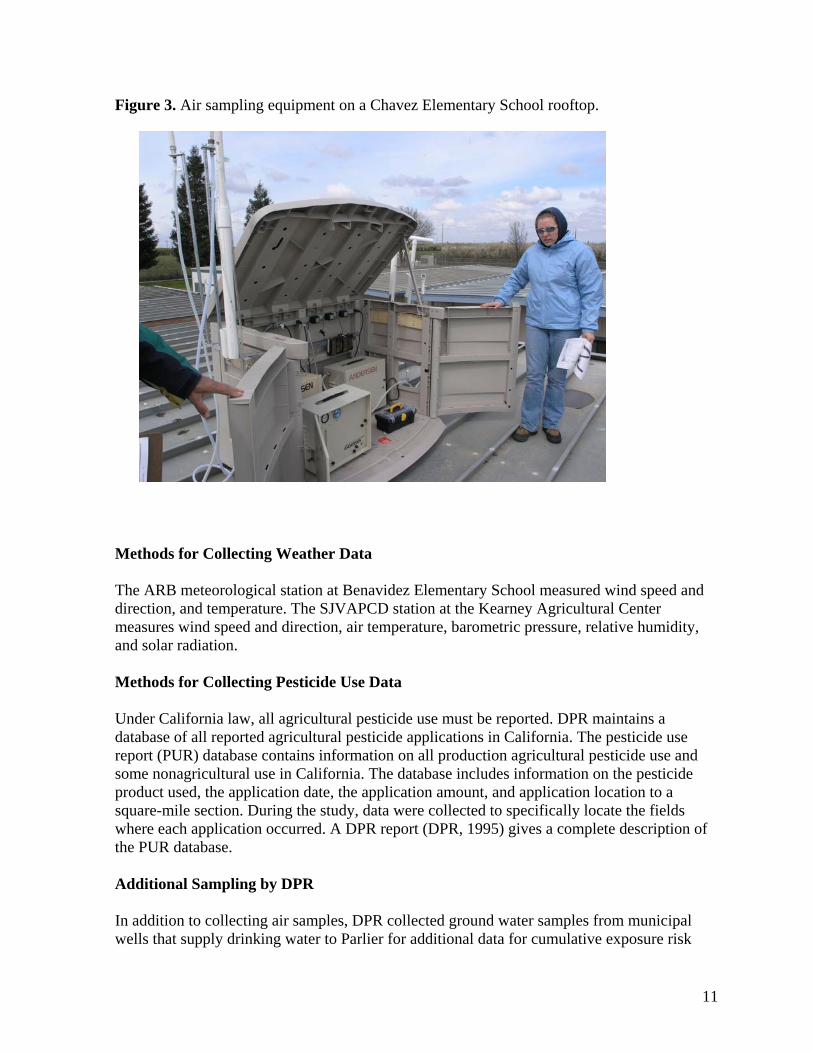
Figure 3. Air sampling equipment on a Chavez Elementary School rooftop.
Methods for Collecting Weather Data
The ARB meteorological station at Benavidez Elementary School measured wind speed and direction, and temperature. The SJVAPCD station at the Kearney Agricultural Center measures wind speed and direction, air temperature, barometric pressure, relative humidity, and solar radiation.
Methods for Collecting Pesticide Use Data
Under California law, all agricultural pesticide use must be reported. DPR maintains a database of all reported agricultural pesticide applications in California. The pesticide use report (PUR) database contains information on all production agricultural pesticide use and some nonagricultural use in California. The database includes information on the pesticide product used, the application date, the application amount, and application location to a square-mile section. During the study, data were collected to specifically locate the fields where each application occurred. A DPR report (DPR, 1995) gives a complete description of the PUR database.
Additional Sampling by DPR
In addition to collecting air samples, DPR collected ground water samples from municipal wells that supply drinking water to Parlier for additional data for cumulative exposure risk
11
assessment. Samples were collected from all wells in use in 2006. The well-water samples were analyzed for currently registered, known ground water contaminants: atrazine, bromacil, diuron, hexazinone, metribuzin, norflurazon, prometon, simazine, and the breakdown products desmethyl norflurazon, deethyl atrazine (DEA), deisopropyl atrazine (ACET), and diamino chlorotriazine (DACT). The CDFA Center for Analytical Chemistry analyzed the samples. Well monitoring followed the procedure described in DPR’s SOP FSWA001.00 (Appendix C).
Sampling Procedure
DPR’s sampling began January 3, 2006, and ended December 28, 2006. Samples were collected for 24 hours 3 consecutive days a week at each of the 3 schools. The starting day varied each week, with the criterion that 1 of DPR’s sample days each week would correspond with ARB’s scheduled 24-hour air toxics samples. Sampling usually started around 8:00 a.m.
The ARB sample collection and monitoring began in mid-January for PM2.5, VOCs, elements and metals. The ARB monitored PM2.5 and weather data on a continuous basis. The ARB’s air monitoring network for VOCs and metals throughout California usually collects one 24-hour sample every 12 days. For this study, however, the ARB collected 24hour VOC samples every 6 days at Benavidez School from January 17, 2006, through January 6, 2007. The sampling frequency increased to every three days during peak high-use periods for sulfur and 1,3-dichloropropene.
The SJVAPCD monitors ozone and nitrogen dioxide on a continuous hourly basis, and hydrocarbons seasonally at the Kearney Agricultural Center. The SJVAPCD collects 4 sequential 3-hour samples (12 consecutive hours during the day), every 3 days between July and September for hydrocarbons.
Quality Control Methods
In addition to collecting field samples during monitoring, DPR collected trip blank samples, fortified field spikes and co-located duplicate samples.
A trip blank sample provides information on possible contamination of samples. For the charcoal sample tubes, the ends were broken open, capped and placed on dry ice with the field samples. The multi-pesticide XAD tubes were left capped and also placed on dry ice to be stored and shipped with the field samples. A trip blank was collected for each sample type during one of every three weeks of sampling. Blank samples containing detectable amounts of any of the pesticides would mean a problem with contamination during field and laboratory procedures.
A fortified field spike is a laboratory spike sent to the field and placed on an air sampler with air flowing through the sorbent tube. Shipped on dry ice to the field, it is treated just like a field sample, including storage and shipping conditions. The fortified spike, in comparison with the respective field sample, gives information about any change in the ability to recover
12
the analyte during air sampling. DPR collected one fortified field spike for both the multi-pesticide XAD and charcoal sample tubes during one of every three weeks of sampling. The multi-pesticide XAD tube was spiked with three to four analytes that use reports for previous years indicated would be in use at the time. Spike samples outside the control limits established from the validation data for each pesticide would trigger a reassessment of the field and laboratory procedures.
A duplicate sample is a sample that is co-located with a field sample. These samples evaluate overall precision in sample measurement and analysis. DPR collected one duplicate sample for each sample type during one of every three weeks of sampling. Duplicate samples that are greater than 50 percent different would trigger a reassessment of the field and laboratory procedures.
A quality assurance team conducted a system audit of the CDFA and ARB laboratories in conjunction with the analysis of the samples in March. The team returned in September to conduct a follow-up audit of the laboratories. An equipment quality assurance team conducted a field audit of the sampler air-flow rates in January and a follow-up audit in September. (For audit results see Appendix D.)
Laboratory Methods
The CDFA’s Center for Analytical Chemistry analyzed all samples that DPR collected. The ARB’s Monitoring and Laboratory Division analyzed ARB’s samples.
Method calibration Each laboratory used certified analytical standards. The laboratory verified calibration by analyzing a series of standard samples (samples containing known amounts of analyte dissolved in a solvent). The linear range of calibration was determined by analyzing standards of increasing concentration. Within the linear range, the calibration was determined by regressing the standard concentration on the response of the instrument (peak height or peak area of the chromatogram) using at least five concentrations. The minimum acceptable correlation coefficient of the calibration was given in the SOP for each method, but in general was at least 0.95.
Holding timesSee Table 4 (and Appendix E) for storage stability data for the chemicals monitored.
Method detection limits and limits of quantitation Each laboratory determined the method detection limit (MDL) for each analyte by analyzing a standard at a concentration with a signal to noise ratio of 2.5 to 5. This standard is analyzed at least 7 times, and the MDL is determined by calculating the 99 percent confidence interval of the mean. This procedure is described in detail in U.S. EPA (1990). The MDL for each analyte and method is given in the SOPs (Appendix E).
The limit of quantitation (LOQ) is the level at which concentrations may be reliably measured and is set at a certain factor above the method detection limit. The level of interference
13
determines the magnitude of this factor; the more interference, the higher the factor. See Table 5 for the LOQ for each analyte along with a summary of chemical analytical and air sampling methods.
Calculations of air concentrations For the sorbent tube samples, air concentrations were calculated as an amount of pesticide captured from a volume of air moving through the sampling media. Analytical results are presented in micrograms per sample (ug/sample). The concentrations are converted from ug/sample to nanograms (ng) per cubic meter (m3) of sample air using the following calculations:
sample results (ug) ×1000 L / m3
x 1000 ng/ug = ng/m3
flowrateof sampler (L / min)× runtime (min)
The VOC concentrations were reported as ppb and converted to ng/m3 using the following calculations:
sample results ppb ( ) × molecular weight x 1000 = ng/m3
24.45 Assuming 1 atmosphere of pressure at 25 °C
When calculating average concentrations from multiple samples, samples with no detectable amount were assumed to contain one-half the MDL, and samples with trace amounts were assumed to contain the value halfway between the MDL and the LOQ.
Multiple Pesticide Samples
Table 4 references chemical extraction methods for multiple pesticides from sorbent tubes. Extraction of the multiple pesticides from sorbent tubes was performed in accordance with DPR’s SOP (see Appendix E).
MITC Samples
Table 4 references chemical extraction methods for MITC from sorbent tubes. Extraction of MITC from sorbent tubes was performed in accordance with DPR’s SOP (see Appendix E).
14
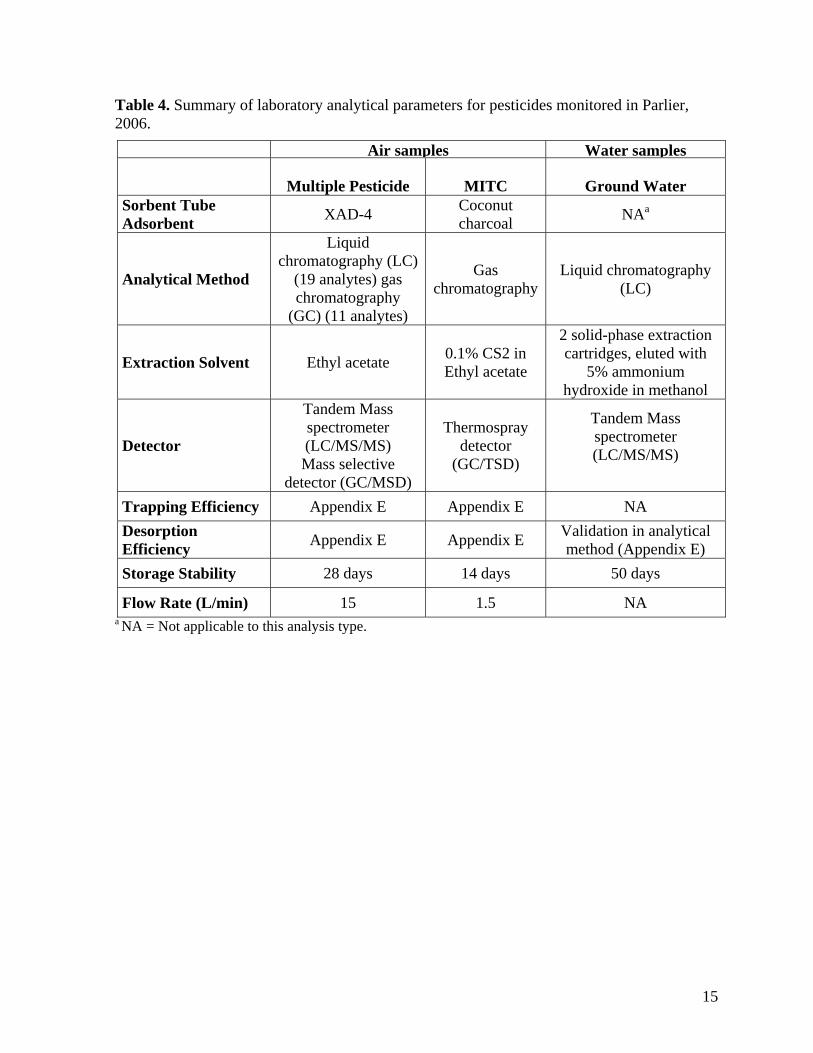
Table 4. Summary of laboratory analytical parameters for pesticides monitored in Parlier, 2006.
Air samples Water samples
Multiple Pesticide MITC Ground Water Sorbent Tube Adsorbent XAD-4 Coconut
charcoal NAa
Analytical Method
Liquid chromatography (LC)
(19 analytes) gas chromatography
(GC) (11 analytes)
Gas chromatography
Liquid chromatography (LC)
Extraction Solvent Ethyl acetate 0.1% CS2 in Ethyl acetate
2 solid-phase extraction cartridges, eluted with
5% ammonium hydroxide in methanol
Detector
Tandem Mass spectrometer (LC/MS/MS) Mass selective
detector (GC/MSD)
Thermospray detector
(GC/TSD)
Tandem Mass spectrometer (LC/MS/MS)
Trapping Efficiency Appendix E Appendix E NA Desorption Efficiency Appendix E Appendix E Validation in analytical
method (Appendix E) Storage Stability 28 days 14 days 50 days
Flow Rate (L/min) 15 1.5 NA a NA = Not applicable to this analysis type.
15
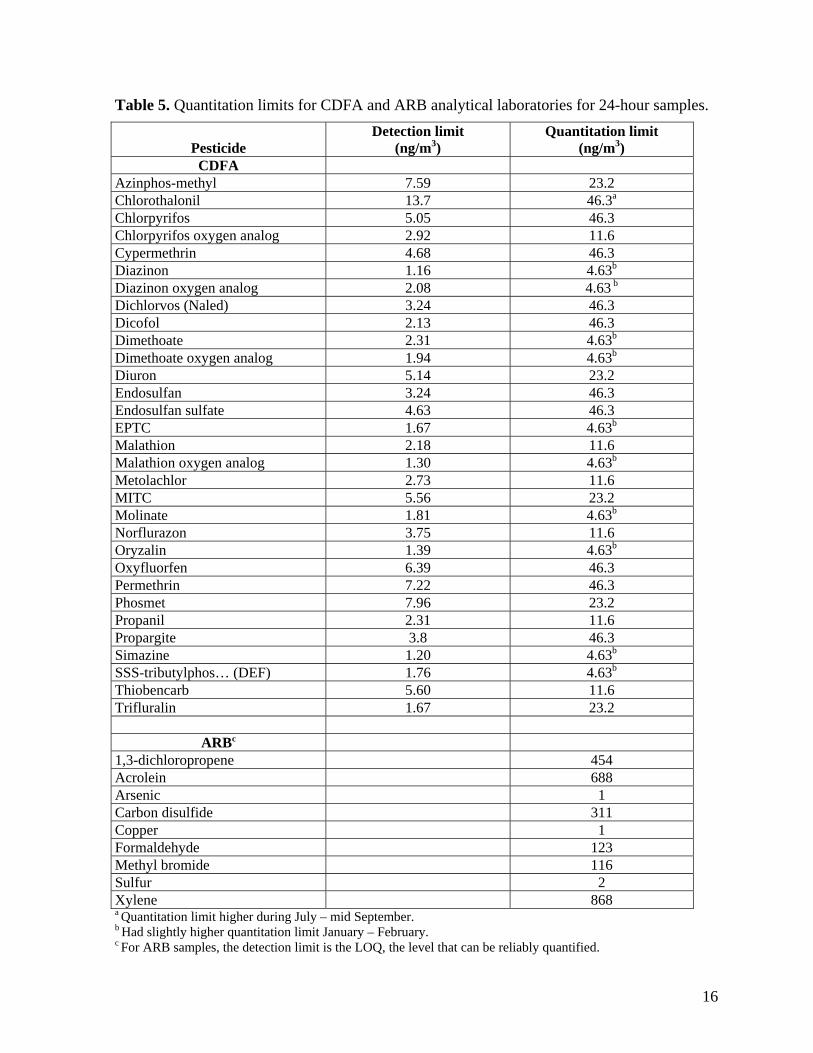
Table 5. Quantitation limits for CDFA and ARB analytical laboratories for 24-hour samples.
Pesticide Detection limit
(ng/m3) Quantitation limit
(ng/m3) CDFA
Azinphos-methyl 7.59 23.2 Chlorothalonil 13.7 46.3a
Chlorpyrifos 5.05 46.3 Chlorpyrifos oxygen analog 2.92 11.6 Cypermethrin 4.68 46.3 Diazinon 1.16 4.63b
Diazinon oxygen analog 2.08 4.63 b
Dichlorvos (Naled) 3.24 46.3 Dicofol 2.13 46.3 Dimethoate 2.31 4.63b
Dimethoate oxygen analog 1.94 4.63b
Diuron 5.14 23.2 Endosulfan 3.24 46.3 Endosulfan sulfate 4.63 46.3 EPTC 1.67 4.63b
Malathion 2.18 11.6 Malathion oxygen analog 1.30 4.63b
Metolachlor 2.73 11.6 MITC 5.56 23.2 Molinate 1.81 4.63b
Norflurazon 3.75 11.6 Oryzalin 1.39 4.63b
Oxyfluorfen 6.39 46.3 Permethrin 7.22 46.3 Phosmet 7.96 23.2 Propanil 2.31 11.6 Propargite 3.8 46.3 Simazine 1.20 4.63b
SSS-tributylphos… (DEF) 1.76 4.63b
Thiobencarb 5.60 11.6 Trifluralin 1.67 23.2
ARBc
1,3-dichloropropene 454 Acrolein 688 Arsenic 1 Carbon disulfide 311 Copper 1 Formaldehyde 123 Methyl bromide 116 Sulfur 2 Xylene 868 a Quantitation limit higher during July – mid September. b Had slightly higher quantitation limit January – February. c For ARB samples, the detection limit is the LOQ, the level that can be reliably quantified.
16
DATA ANALYSIS METHODS
Health Evaluation Methods
No state or federal agency has established health standards for pesticides in air. Therefore, DPR developed health screening levels for the monitored pesticides to place the results in a health-based context (Table 6, Appendix F). Although they are not regulatory standards, these screening levels can be used to evaluate air monitoring results. A measured air concentration below the screening level for a given pesticide would not be considered a significant health concern and would not generally undergo further evaluation, but also should not automatically be considered “safe” and could undergo further evaluation. A measured concentration that is above the screening level would not necessarily indicate a significant health concern, but would indicate the need for a further, more refined evaluation. Significant exceedances of the screening levels could be of health concern and would indicate the need to explore the imposition of mitigation measures.
To the extent possible, health screening levels are based on identified critical toxicology values or exposure levels taken from existing documents that have already been subject to peer review and, in some cases, public comment. The three primary sources are: risk assessments in the form of risk characterization documents (RCDs) conducted by DPR; reregistration eligibility documents (REDs) completed by U.S. EPA; and reference exposure levels (RELs) established by California’s Office of Environmental Health Hazards Assessment (OEHHA) and peer-reviewed by the California’s Toxic Air Contaminant (TAC) Scientific Review Panel. In some cases, information from the U.S. EPA Integrated Risk Information System (IRIS) is used for cancer potency values. (See Appendix F for the basis of deriving screening levels for each individual pesticide.)
In 1996, Congress passed major food safety legislation, the Food Quality Protection Act of 1996 (FQPA). It made significant changes to the Federal Insecticide, Fungicide, and Rodenticide Act (FIFRA) and the Federal Food, Drug, and Cosmetic Act (FFDCA). Among other provisions, the FQPA requires U.S. EPA to review existing pesticide food tolerances (legal limits for pesticide residues in food) and to include an additional “safety factor” of up to 10-fold to account for uncertainty in data relative to children and/or for increased sensitivity of children. U.S. EPA generally sets the factor at 1-fold, 3-fold, or 10-fold, depending on the completeness and reliability of the data available to assess pre- or post-natal toxicity and depending on the potential for pre- or post-natal effects of concern. This additional factor has become known as the “FQPA factor” or “FQPA safety factor.” In some cases, additional data may lead to a decrease in uncertainty and a concomitant decrease in the FQPA factor. On the other hand, if the FQPA factor is based on evidence of increased sensitivity of children, the safety factor may remain unchanged. Although U.S. EPA initially used this factor for evaluating pesticide food tolerances and dietary risk, the factor was applied to the aggregate exposure (all potential sources and routes of exposure) of children (food, skin contact, inhalation of ambient air, etc.). DPR evaluated the results of this project by considering the “FQPA factor” in addition to the screening levels following discussions with the LAG and TAG. The original charge to DPR (from Cal/EPA under the Environmental Justice Action Plan), to focus on environmental risk to children, supports consideration of the
17
FQPA factor. This consideration is further supported by the December 9, 2009, U.S. EPA announcement of a draft policy: “To provide comprehensive and consistent evaluation of potential risks of food use pesticides, non-food use pesticides, and related occupational exposures, EPA intends to apply risk assessment techniques developed in implementing the Food Quality Protection Act of 1996 to any pesticide risk assessment, whether it falls under FQPA or not, as long as applying the risk assessment technique is consistent with good scientific practice and is not otherwise prohibited by law. Specifically, this will include using an additional safety/uncertainty factor to protect children, considering aggregate exposure to pesticides from multiple sources. . .”
To avoid confusion in evaluating multiple pesticide/chemical exposure, the screening levels derived for this project (Table 6) did not incorporate the FQPA safety factor initially; however, the factors are presented and were considered when DPR later evaluated the measured air concentrations of the individual pesticides from the Parlier project. The measured air levels were compared to the screening levels with and without the FQPA factors and all values are clearly identified.
Acute toxicity can be defined as the toxicity manifested within a relatively short time interval, generally not longer than one day. In this document, unless specifically noted, acute screening levels are for 24 hours. Subchronic toxicity can be defined as the toxicity manifested within a more extended interval, but not one that constitutes a significant portion of the lifespan of the species in question. In subchronic toxicity testing using mammalian test species, the period of exposure is generally 30 to 90 days. Chronic toxicity is manifested over a long-term period, generally for a significant portion of a lifetime.
One quantitative descriptor of the results of a toxicity study is the no-observed-adverse-effect level (NOAEL). The NOAEL can be defined as the highest level of a chemical (in this case, a pesticide) that causes no observable adverse or toxic effect in the animal test species in the study. A related term, the lowest-observed-adverse-effect level (LOAEL), can be defined as the lowest dose of a chemical that still causes an observable adverse or toxic effect. In some cases, a study will demonstrate adverse effects at all dose levels and a NOAEL will not be readily apparent. In these situations, applying an uncertainty factor (generally 10-fold or less) to the LOAEL can generate an estimated no-adverse-effect level.
Two other terms that need to be defined are reference dose (RfD) and reference concentration (RfC). The RfD is an estimate of the daily exposure of the human population to a chemical, usually by the oral route, that is likely to be without adverse effects. The RfC is an estimate of the daily air concentration of a chemical that is likely to be without adverse effects to the exposed human population. The RfCs and RfDs are derived by applying the appropriate uncertainty factors to the appropriate NOAEL. In deriving an RfD or RfC from a NOAEL from an animal study, the standard practice is to apply a default uncertainty factor of 100 (to extrapolate from the results of an animal study to an estimated safe level for humans). This factor of 100 is derived from a factor of 10 to account for the uncertainty in extrapolating from animals to humans and an uncertainty factor of 10 to account for variability in the human population. The presence of additional data or information may support the use of alternate factors.
18
Children have the highest inhalation rate relative to body weight; therefore, they would inhale the highest amount of airborne material relative to their body weight. Since the screening levels are being used to evaluate ambient air concentrations, it is appropriate that health-protective values are used, and the screening levels were based on children less than one year of age. Unless otherwise stated, this document uses a default inhalation rate for a child less than 1 year of age of 4.5 m3/day and a default body weight of 7.6 kg.
The respiratory rate is then calculated as:
(4.5 m3/day)/(7.6kg) = 0.59 m3/kg/day
DPR’s toxicology database for a pesticide contains a series of toxicity studies. The particular study and corresponding NOAEL that are selected as the basis for the risk calculations or screening level derivations can be described as the “critical” study or NOAEL. Inhalation NOAELs are generally derived from studies using laboratory animals, frequently the rat, and are usually expressed in terms of an air concentration. Since the experimental animals have different respiratory rates than humans, it is DPR’s practice to convert an inhalation NOAEL from an animal study to a human equivalent level to account for the differences in respiratory rates. It should be noted that this adjustment does not factor in differences in toxicological sensitivity. This potential differential sensitivity is taken into account in the application of uncertainty factors.
To convert an inhalation NOAEL to the human equivalent NOAEL, DPR uses the equation:
Animal NOAEL x (animal resp. rate/human resp. rate) = human equivalent NOAEL
For the rat, DPR’s default respiratory rate is 0.96 m3/kg/day, and the above equation becomes:
Rat NOAEL x (0.96 m3/kg/day)/(0.59 m3/kg/day) = human equivalent NOAEL
Rat NOAEL x 1.6 = human equivalent NOAEL
For logistical reasons, if the period of exposure in the animal study is less than a full 24 hours, the resulting NOAEL is usually normalized to a 24-hour period. In general, rat inhalation NOAELs are derived from studies of either 4 or 6 hours out of 24 hours. In cases where an inhalation NOAEL is derived from such a study, it is the accepted practice to normalize the NOAEL to 24 hours by multiplying the experimental NOAEL by either (4/24) or (6/24) to calculate an equivalent 24-hour NOAEL. Subchronic or chronic inhalation studies are often conducted for five days per week, and the results are normalized to a seven-day week by multiplying the NOAEL by (5/7) to calculate an equivalent NOAEL for exposure throughout the seven-day week.
19
Often, inhalation studies are not available for a particular chemical. In these cases, the results from oral studies are used. However, the oral NOAEL (or the RfD) must be converted to an inhalation NOAEL (or RfC). This conversion calculates the air concentration that would result in the subject taking in the same amount of chemical as would be taken in orally. To convert an oral NOAEL or RfD to an inhalation NOAEL or RfC, DPR uses the equation:
RfC (or screening level) = RfD x body weight of subject/ inhalation rate
For the child less than one year of age, the RfC is calculated as:
RfC or screening level (mg/m3) = RfD (mg/kg/day) x (7.6kg)/(4.5 m3/day)= 1.7 RfD
Carcinogenic effects The uncertainty factor approach used in generating the screening levels implicitly assumes that there is a threshold below which the toxic effect will not occur. This approach is not appropriate for carcinogenic chemicals that have a non-threshold mechanism of action. For these chemicals, the chronic screening level does not include carcinogenic effects, and a cancer potency value is derived for that chemical (see Appendix F).
20
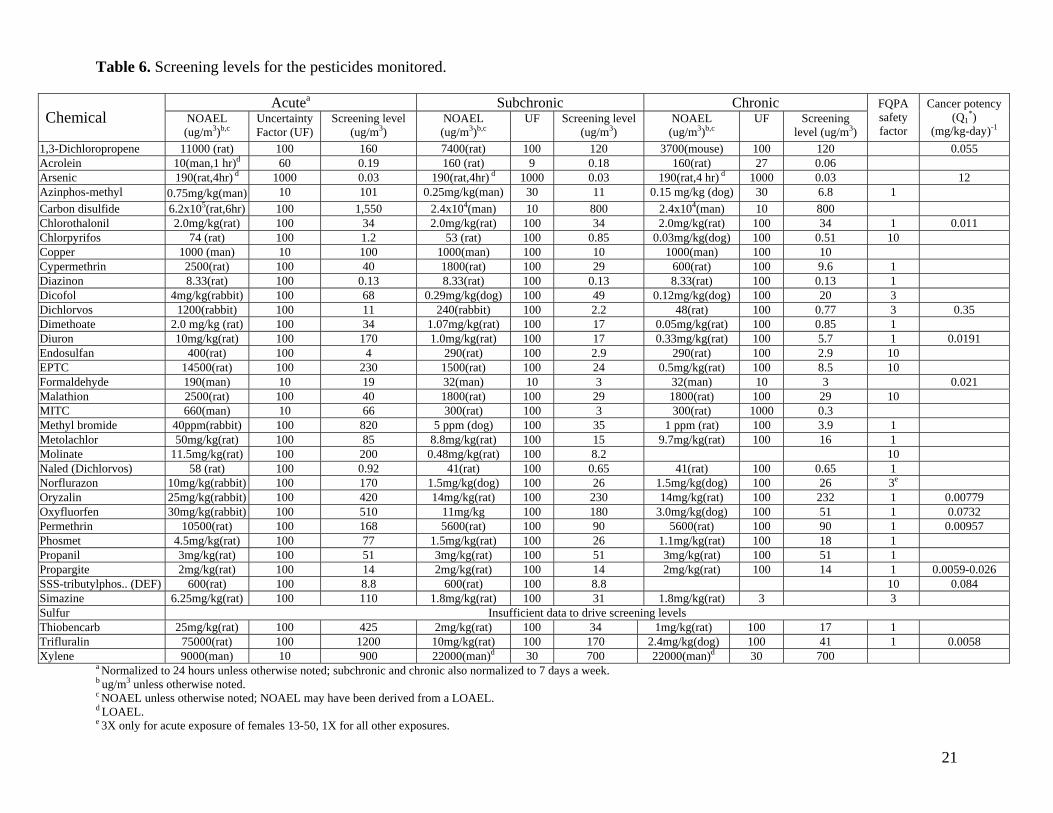
Table 6. Screening levels for the pesticides monitored.
Chemical Acutea Subchronic Chronic FQPA
safety factor
Cancer potency (Q1
*) (mg/kg-day)-1
NOAEL (ug/m3)b,c
Uncertainty Factor (UF)
Screening level (ug/m3)
NOAEL (ug/m3)b,c
UF Screening level (ug/m3)
NOAEL (ug/m3)b,c
UF Screening level (ug/m3)
1,3-Dichloropropene 11000 (rat) 100 160 7400(rat) 100 120 3700(mouse) 100 120 0.055 Acrolein 10(man,1 hr)d 60 0.19 160 (rat) 9 0.18 160(rat) 27 0.06 Arsenic 190(rat,4hr) d 1000 0.03 190(rat,4hr) d 1000 0.03 190(rat,4 hr) d 1000 0.03 12 Azinphos-methyl 0.75mg/kg(man) 10 101 0.25mg/kg(man) 30 11 0.15 mg/kg (dog) 30 6.8 1 Carbon disulfide 6.2x10⁵(rat,6hr) 100 1,550 2.4x10⁴(man) 10 800 2.4x10⁴(man) 10 800 Chlorothalonil 2.0mg/kg(rat) 100 34 2.0mg/kg(rat) 100 34 2.0mg/kg(rat) 100 34 1 0.011 Chlorpyrifos 74 (rat) 100 1.2 53 (rat) 100 0.85 0.03mg/kg(dog) 100 0.51 10 Copper 1000 (man) 10 100 1000(man) 100 10 1000(man) 100 10 Cypermethrin 2500(rat) 100 40 1800(rat) 100 29 600(rat) 100 9.6 1 Diazinon 8.33(rat) 100 0.13 8.33(rat) 100 0.13 8.33(rat) 100 0.13 1 Dicofol 4mg/kg(rabbit) 100 68 0.29mg/kg(dog) 100 49 0.12mg/kg(dog) 100 20 3 Dichlorvos 1200(rabbit) 100 11 240(rabbit) 100 2.2 48(rat) 100 0.77 3 0.35 Dimethoate 2.0 mg/kg (rat) 100 34 1.07mg/kg(rat) 100 17 0.05mg/kg(rat) 100 0.85 1 Diuron 10mg/kg(rat) 100 170 1.0mg/kg(rat) 100 17 0.33mg/kg(rat) 100 5.7 1 0.0191 Endosulfan 400(rat) 100 4 290(rat) 100 2.9 290(rat) 100 2.9 10 EPTC 14500(rat) 100 230 1500(rat) 100 24 0.5mg/kg(rat) 100 8.5 10 Formaldehyde 190(man) 10 19 32(man) 10 3 32(man) 10 3 0.021 Malathion 2500(rat) 100 40 1800(rat) 100 29 1800(rat) 100 29 10 MITC 660(man) 10 66 300(rat) 100 3 300(rat) 1000 0.3 Methyl bromide 40ppm(rabbit) 100 820 5 ppm (dog) 100 35 1 ppm (rat) 100 3.9 1 Metolachlor 50mg/kg(rat) 100 85 8.8mg/kg(rat) 100 15 9.7mg/kg(rat) 100 16 1 Molinate 11.5mg/kg(rat) 100 200 0.48mg/kg(rat) 100 8.2 10 Naled (Dichlorvos) 58 (rat) 100 0.92 41(rat) 100 0.65 41(rat) 100 0.65 1 Norflurazon 10mg/kg(rabbit) 100 170 1.5mg/kg(dog) 100 26 1.5mg/kg(dog) 100 26 3e
Oryzalin 25mg/kg(rabbit) 100 420 14mg/kg(rat) 100 230 14mg/kg(rat) 100 232 1 0.00779 Oxyfluorfen 30mg/kg(rabbit) 100 510 11mg/kg 100 180 3.0mg/kg(dog) 100 51 1 0.0732 Permethrin 10500(rat) 100 168 5600(rat) 100 90 5600(rat) 100 90 1 0.00957 Phosmet 4.5mg/kg(rat) 100 77 1.5mg/kg(rat) 100 26 1.1mg/kg(rat) 100 18 1 Propanil 3mg/kg(rat) 100 51 3mg/kg(rat) 100 51 3mg/kg(rat) 100 51 1 Propargite 2mg/kg(rat) 100 14 2mg/kg(rat) 100 14 2mg/kg(rat) 100 14 1 0.0059-0.026 SSS-tributylphos.. (DEF) 600(rat) 100 8.8 600(rat) 100 8.8 10 0.084 Simazine 6.25mg/kg(rat) 100 110 1.8mg/kg(rat) 100 31 1.8mg/kg(rat) 3 3 Sulfur Insufficient data to drive screening levels Thiobencarb 25mg/kg(rat) 100 425 2mg/kg(rat) 100 34 1mg/kg(rat) 100 17 1 Trifluralin 75000(rat) 100 1200 10mg/kg(rat) 100 170 2.4mg/kg(dog) 100 41 1 0.0058 Xylene 9000(man) 10 900 22000(man)d 30 700 22000(man)d 30 700
a Normalized to 24 hours unless otherwise noted; subchronic and chronic also normalized to 7 days a week. b ug/m3 unless otherwise noted. c NOAEL unless otherwise noted; NOAEL may have been derived from a LOAEL. d LOAEL. e 3X only for acute exposure of females 13-50, 1X for all other exposures.
21
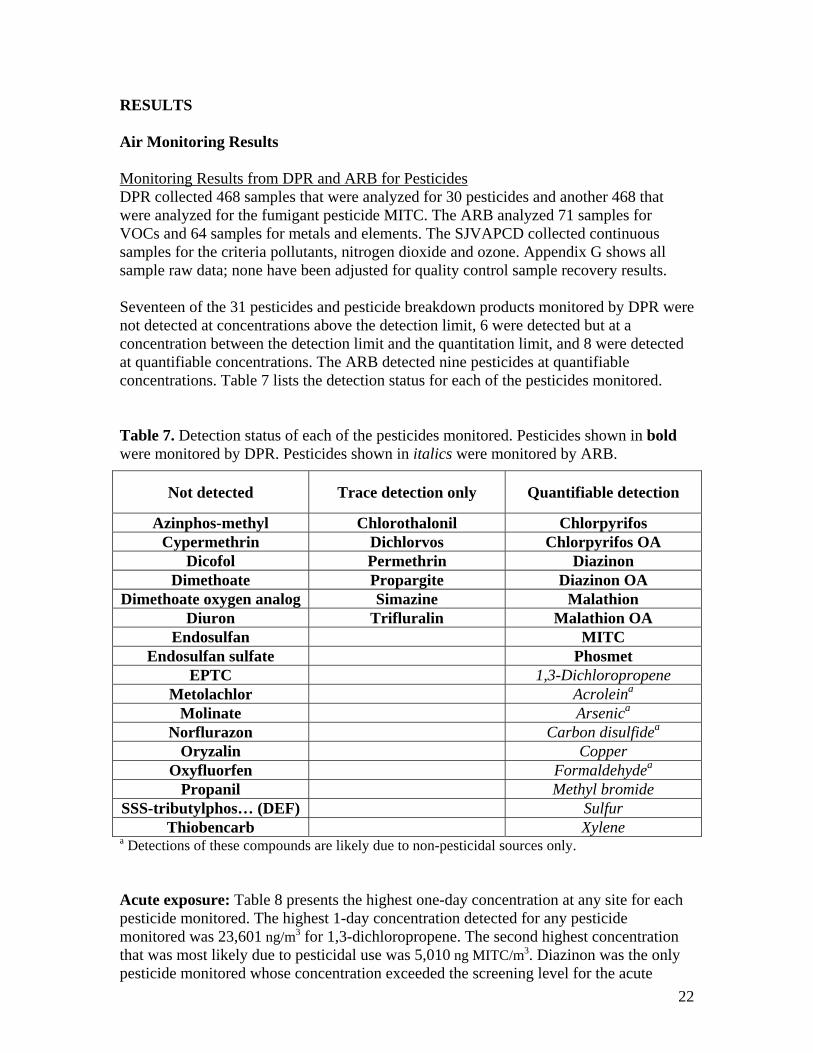
RESULTS
Air Monitoring Results
Monitoring Results from DPR and ARB for Pesticides DPR collected 468 samples that were analyzed for 30 pesticides and another 468 that were analyzed for the fumigant pesticide MITC. The ARB analyzed 71 samples for VOCs and 64 samples for metals and elements. The SJVAPCD collected continuous samples for the criteria pollutants, nitrogen dioxide and ozone. Appendix G shows all sample raw data; none have been adjusted for quality control sample recovery results.
Seventeen of the 31 pesticides and pesticide breakdown products monitored by DPR were not detected at concentrations above the detection limit, 6 were detected but at a concentration between the detection limit and the quantitation limit, and 8 were detected at quantifiable concentrations. The ARB detected nine pesticides at quantifiable concentrations. Table 7 lists the detection status for each of the pesticides monitored.
Table 7. Detection status of each of the pesticides monitored. Pesticides shown in bold were monitored by DPR. Pesticides shown in italics were monitored by ARB.
Not detected Trace detection only Quantifiable detection
Azinphos-methyl Chlorothalonil Chlorpyrifos Cypermethrin Dichlorvos Chlorpyrifos OA
Dicofol Permethrin Diazinon Dimethoate Propargite Diazinon OA
Dimethoate oxygen analog Simazine Malathion Diuron Trifluralin Malathion OA
Endosulfan MITC Endosulfan sulfate Phosmet
EPTC 1,3-Dichloropropene Metolachlor Acroleina
Molinate Arsenica
Norflurazon Carbon disulfidea
Oryzalin Copper Oxyfluorfen Formaldehydea
Propanil Methyl bromide SSS-tributylphos… (DEF) Sulfur
Thiobencarb Xylene a Detections of these compounds are likely due to non-pesticidal sources only.
Acute exposure: Table 8 presents the highest one-day concentration at any site for each pesticide monitored. The highest 1-day concentration detected for any pesticide monitored was 23,601 ng/m3 for 1,3-dichloropropene. The second highest concentration that was most likely due to pesticidal use was 5,010 ng MITC/m3. Diazinon was the only pesticide monitored whose concentration exceeded the screening level for the acute
22
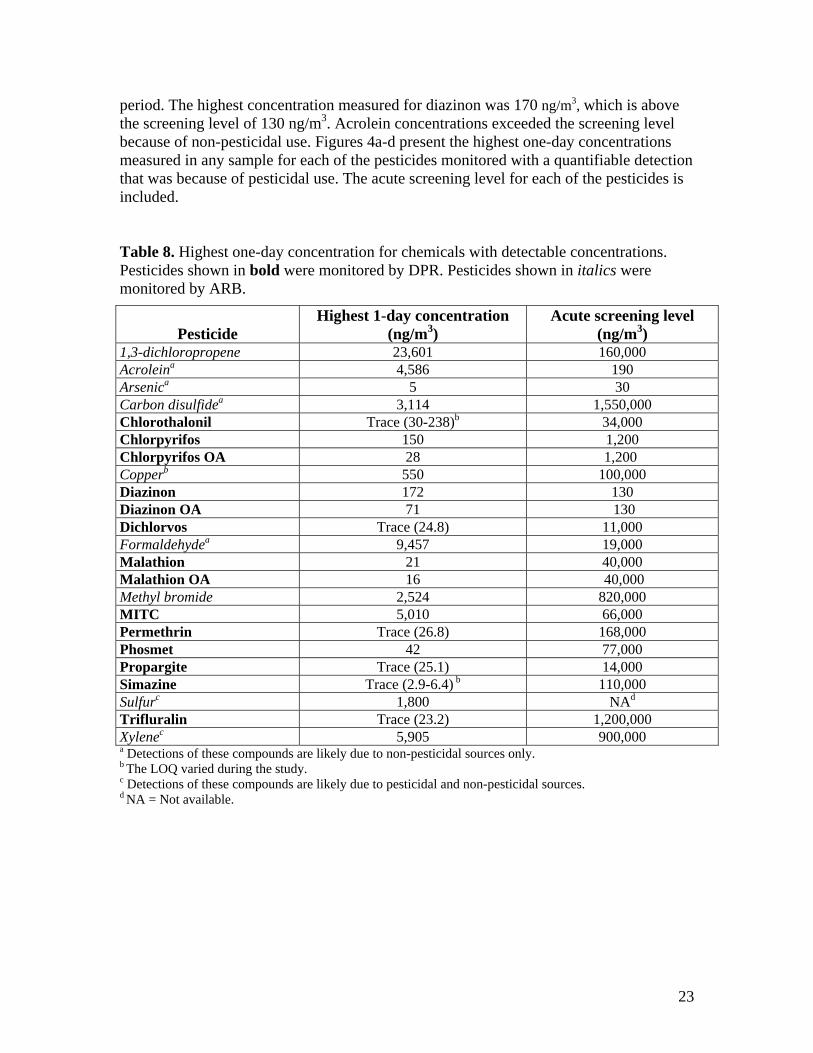
period. The highest concentration measured for diazinon was 170 ng/m3, which is above the screening level of 130 ng/m3. Acrolein concentrations exceeded the screening level because of non-pesticidal use. Figures 4a-d present the highest one-day concentrations measured in any sample for each of the pesticides monitored with a quantifiable detection that was because of pesticidal use. The acute screening level for each of the pesticides is included.
Table 8. Highest one-day concentration for chemicals with detectable concentrations. Pesticides shown in bold were monitored by DPR. Pesticides shown in italics were monitored by ARB.
Pesticide Highest 1-day concentration
(ng/m3) Acute screening level
(ng/m3) 1,3-dichloropropene 23,601 160,000 Acroleina 4,586 190 Arsenica 5 30 Carbon disulfidea 3,114 1,550,000 Chlorothalonil Trace (30-238)b 34,000 Chlorpyrifos 150 1,200 Chlorpyrifos OA 28 1,200 Copperb 550 100,000 Diazinon 172 130 Diazinon OA 71 130 Dichlorvos Trace (24.8) 11,000 Formaldehydea 9,457 19,000 Malathion 21 40,000 Malathion OA 16 40,000 Methyl bromide 2,524 820,000 MITC 5,010 66,000 Permethrin Trace (26.8) 168,000 Phosmet 42 77,000 Propargite Trace (25.1) 14,000 Simazine Trace (2.9-6.4) b 110,000 Sulfurc 1,800 NAd
Trifluralin Trace (23.2) 1,200,000 Xylenec 5,905 900,000 a Detections of these compounds are likely due to non-pesticidal sources only. b The LOQ varied during the study. c Detections of these compounds are likely due to pesticidal and non-pesticidal sources. d NA = Not available.
23
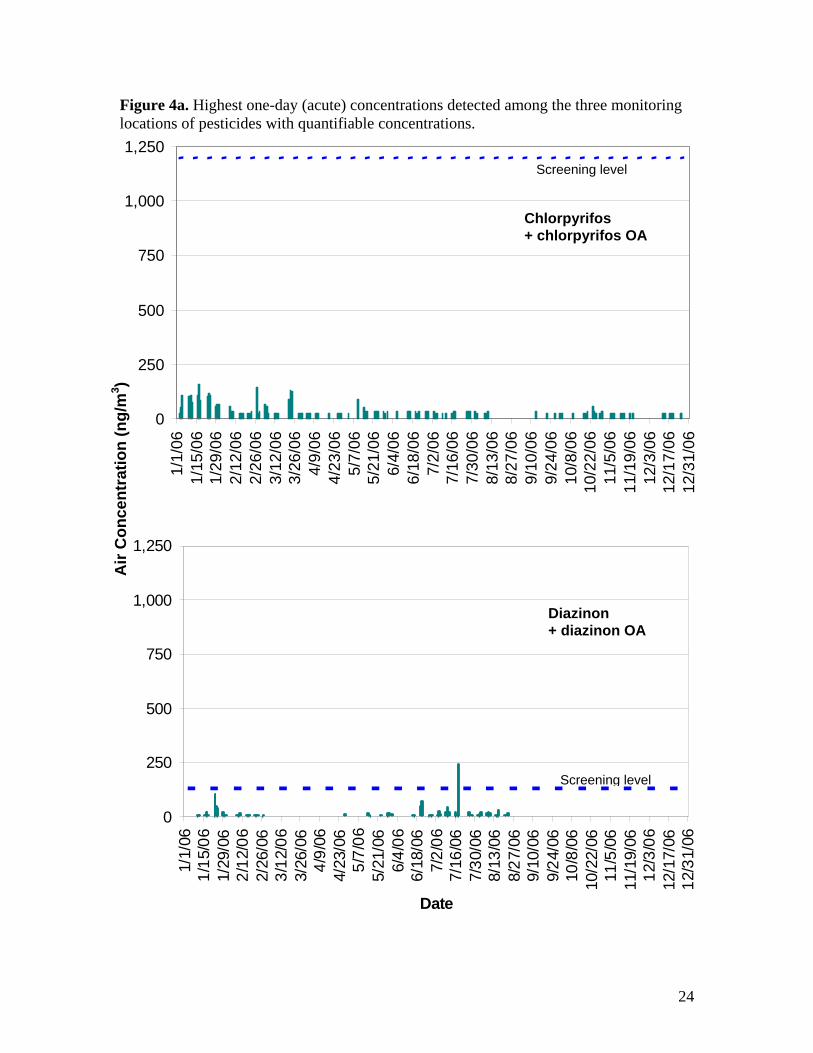
Air
Con
cent
ratio
n (n
g/m
3 )
1,000
750
500
250
1,250
1,000
750
500
250
0
Date
Diazinon + diazinon OA
Screening level
Figure 4a. Highest one-day (acute) concentrations detected among the three monitoring locations of pesticides with quantifiable concentrations.
Screening level
Chlorpyrifos + chlorpyrifos OA
1,250
0
1/1/
06
1/15
/06
1/29
/06
2/12
/06
2/26
/06
3/12
/06
3/26
/06
4/9/
06
4/23
/06
5/7/
06
5/21
/06
6/4/
06
6/18
/06
1/1/
06
1/15
/06
1/29
/06
2/12
/06
2/26
/06
3/12
/06
3/26
/06
4/9/
06
4/23
/06
5/7/
06
5/21
/06
6/4/
06
6/18
/06
7/2/
06
7/16
/06
7/2/
06
7/16
/06
7/30
/06
7/30
/06
8/13
/06
8/13
/06
8/27
/06
8/27
/06
9/10
/06
9/10
/06
9/24
/06
9/24
/06
10/8
/06
10/8
/06
10/2
2/06
10
/22/
06
11/5
/06
11/5
/06
11/1
9/06
12
/3/0
611
/19/
06
12/3
/06
12/1
7/06
12
/17/
06
12/3
1/06
12
/31/
06
24
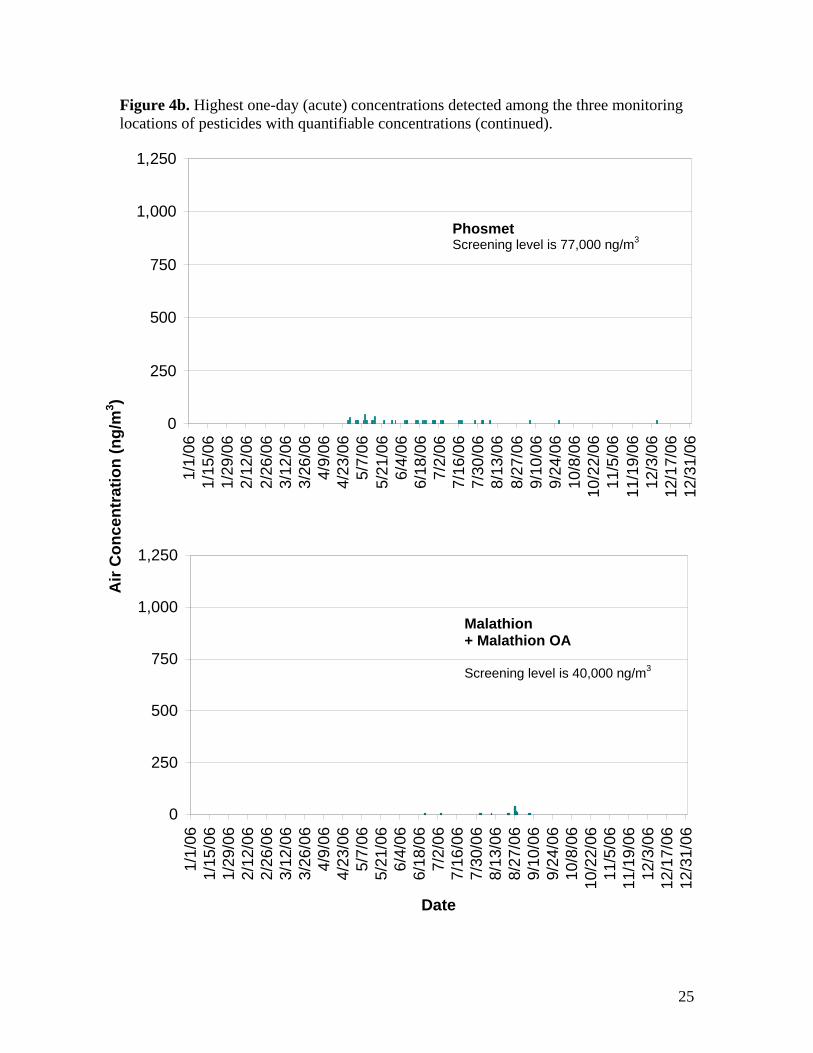
Air
Con
cent
ratio
n (n
g/m
3 )
1/1/
061/
15/0
61/
29/0
62/
12/0
62/
26/0
63/
12/0
63/
26/0
64/
9/06
4/23
/06
5/7/
065/
21/0
66/
4/06
6/18
/06
7/2/
067/
16/0
6
750
500
250
0
1,250
1,000
750
500
250
0
Date
Malathion + Malathion OA
Screening level is 40,000 ng/m3
1/1/
061/
15/0
61/
29/0
62/
12/0
62/
26/0
63/
12/0
63/
26/0
64/
9/06
4/23
/06
5/7/
065/
21/0
66/
4/06
6/18
/06
7/2/
067/
16/0
67/
30/0
67/
30/0
68/
13/0
68/
13/0
68/
27/0
69/
10/0
68/
27/0
6
9/24
/06
9/10
/06
10/8
/06
Figure 4b. Highest one-day (acute) concentrations detected among the three monitoring locations of pesticides with quantifiable concentrations (continued).
1,000
1,250
Phosmet Screening level is 77,000 ng/m3
9/24
/06
10/8
/06
10/2
2/06
10
/22/
06
11/5
/06
11/1
9/06
11
/5/0
6
12/3
/06
11/1
9/06
12
/3/0
612
/17/
06
12/3
1/06
12
/17/
06
12/3
1/06
25
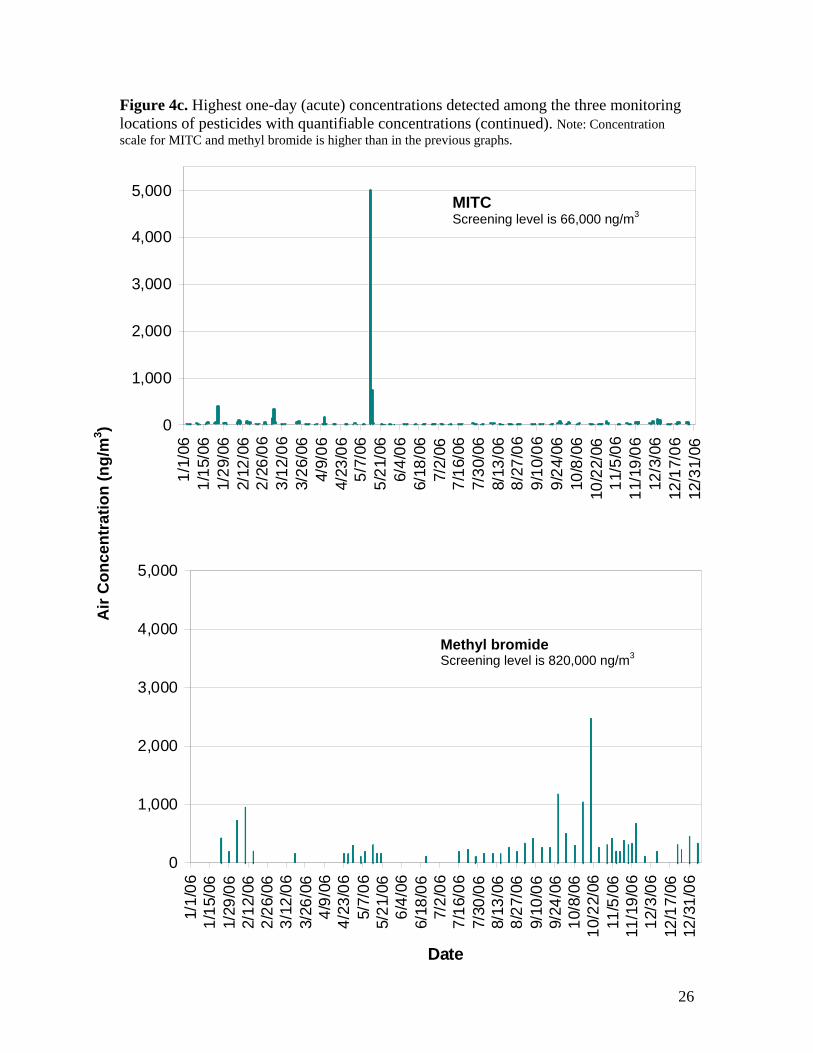
Air
Con
cent
ratio
n (n
g/m
3 )
5,000
4,000
3,000
2,000
1,000
0
1/1/
06
1/15
/06
1/29
/06
2/12
/06
2/26
/06
3/12
/06
3/26
/06
4/9/
06
4/23
/06
5/7/
06
5/21
/06
1/1/
06
Methyl bromide Screening level is 820,000 ng/m3
1/15
/06
1/29
/06
2/12
/06
2/26
/06
3/12
/06
3/26
/06
4/9/
06
4/23
/06
5/7/
06
5/21
/06
6/4/
066/
4/06
6/18
/06
6/18
/06
7/2/
06
7/16
/06
7/30
/06
8/13
/06
8/27
/06
9/10
/06
9/24
/06
10/8
/06
10/2
2/06
11
/5/0
611
/19/
06
12/3
/06
7/2/
06
7/16
/06
7/30
/06
8/13
/06
8/27
/06
9/10
/06
9/24
/06
10/8
/06
10/2
2/06
11
/5/0
611
/19/
06
12/3
/06
5,000
4,000
3,000
2,000
1,000
0
Date
Figure 4c. Highest one-day (acute) concentrations detected among the three monitoring locations of pesticides with quantifiable concentrations (continued). Note: Concentration scale for MITC and methyl bromide is higher than in the previous graphs.
MITC Screening level is 66,000 ng/m3
12/1
7/06
12
/31/
06
12/1
7/06
12
/31/
06
26
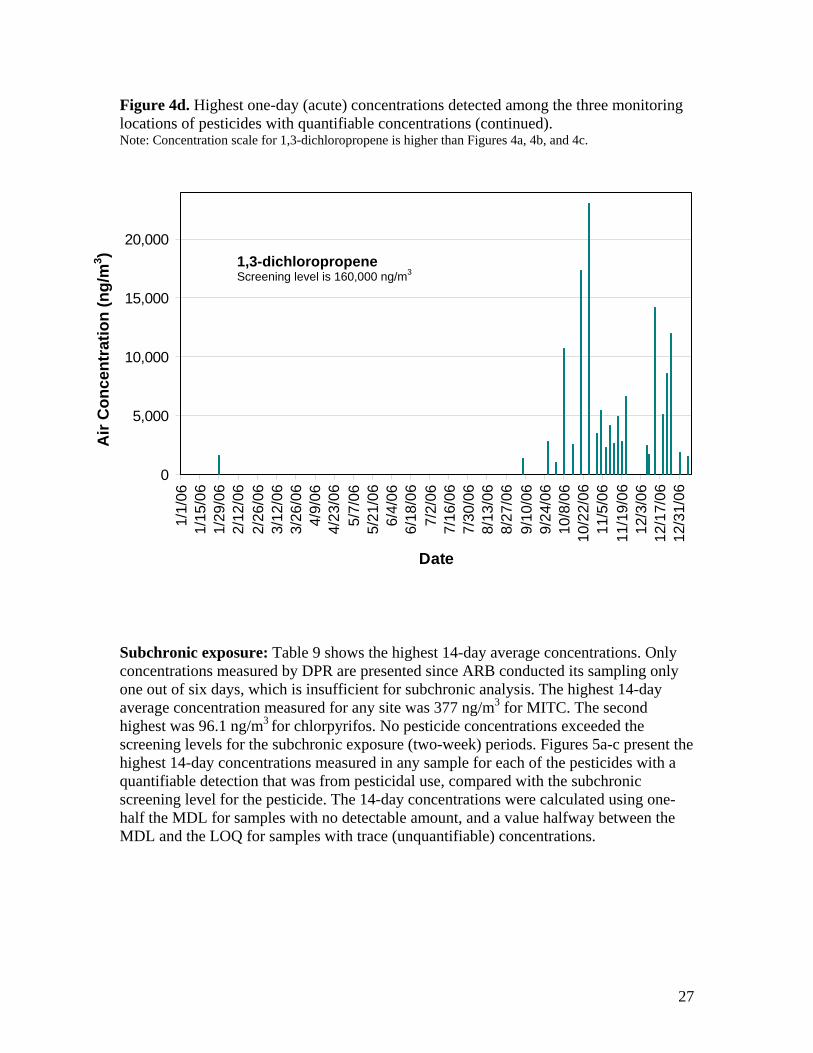
Air
Con
cent
ratio
n (n
g/m
3 ) Figure 4d. Highest one-day (acute) concentrations detected among the three monitoring locations of pesticides with quantifiable concentrations (continued). Note: Concentration scale for 1,3-dichloropropene is higher than Figures 4a, 4b, and 4c.
20,000
15,000
10,000
5,000
0
1,3-dichloropropeneScreening level is 160,000 ng/m3
1/1/
061/
15/0
61/
29/0
62/
12/0
62/
26/0
63/
12/0
63/
26/0
64/
9/06
4/23
/06
5/7/
065/
21/0
66/
4/06
6/18
/06
7/2/
067/
16/0
67/
30/0
68/
13/0
68/
27/0
69/
10/0
69/
24/0
610
/8/0
610
/22/
0611
/5/0
611
/19/
0612
/3/0
612
/17/
0612
/31/
06
Date
Subchronic exposure: Table 9 shows the highest 14-day average concentrations. Only concentrations measured by DPR are presented since ARB conducted its sampling only one out of six days, which is insufficient for subchronic analysis. The highest 14-day average concentration measured for any site was 377 ng/m3 for MITC. The second highest was 96.1 ng/m3 for chlorpyrifos. No pesticide concentrations exceeded the screening levels for the subchronic exposure (two-week) periods. Figures 5a-c present the highest 14-day concentrations measured in any sample for each of the pesticides with a quantifiable detection that was from pesticidal use, compared with the subchronic screening level for the pesticide. The 14-day concentrations were calculated using one-half the MDL for samples with no detectable amount, and a value halfway between the MDL and the LOQ for samples with trace (unquantifiable) concentrations.
27
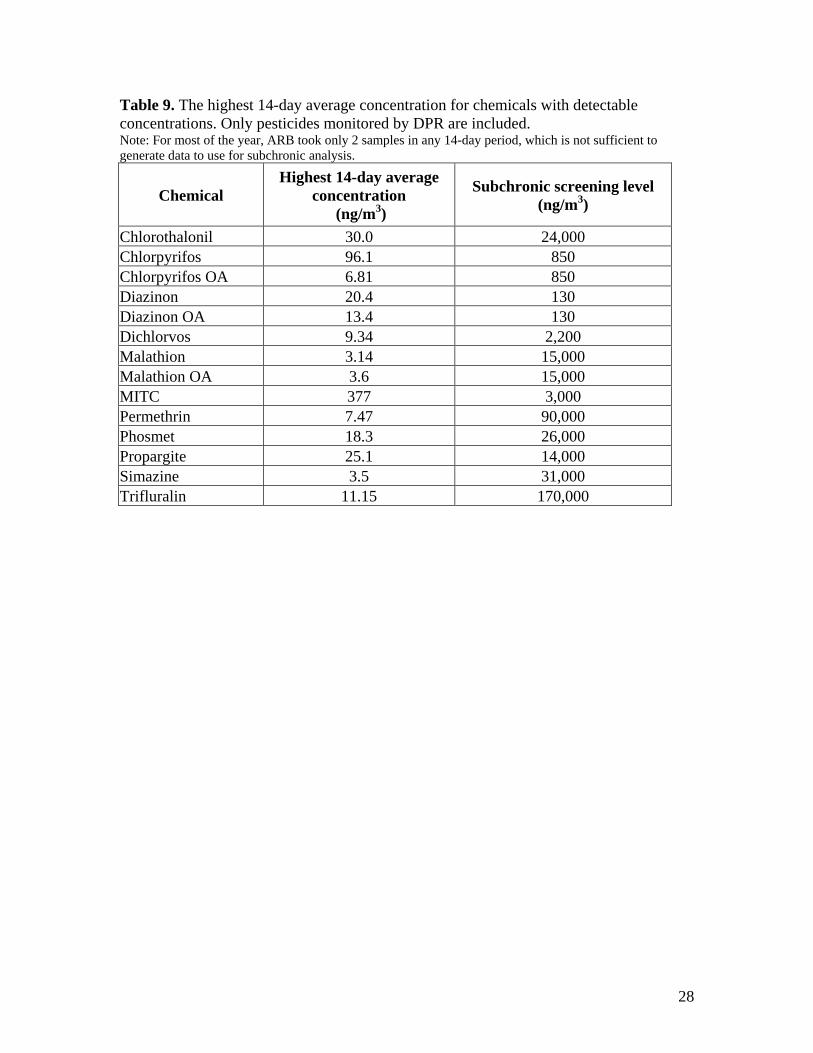
Table 9. The highest 14-day average concentration for chemicals with detectable concentrations. Only pesticides monitored by DPR are included. Note: For most of the year, ARB took only 2 samples in any 14-day period, which is not sufficient to generate data to use for subchronic analysis.
Chemical Highest 14-day average
concentration (ng/m3)
Subchronic screening level (ng/m3)
Chlorothalonil 30.0 24,000 Chlorpyrifos 96.1 850 Chlorpyrifos OA 6.81 850 Diazinon 20.4 130 Diazinon OA 13.4 130 Dichlorvos 9.34 2,200 Malathion 3.14 15,000 Malathion OA 3.6 15,000 MITC 377 3,000 Permethrin 7.47 90,000 Phosmet 18.3 26,000 Propargite 25.1 14,000 Simazine 3.5 31,000 Trifluralin 11.15 170,000
28
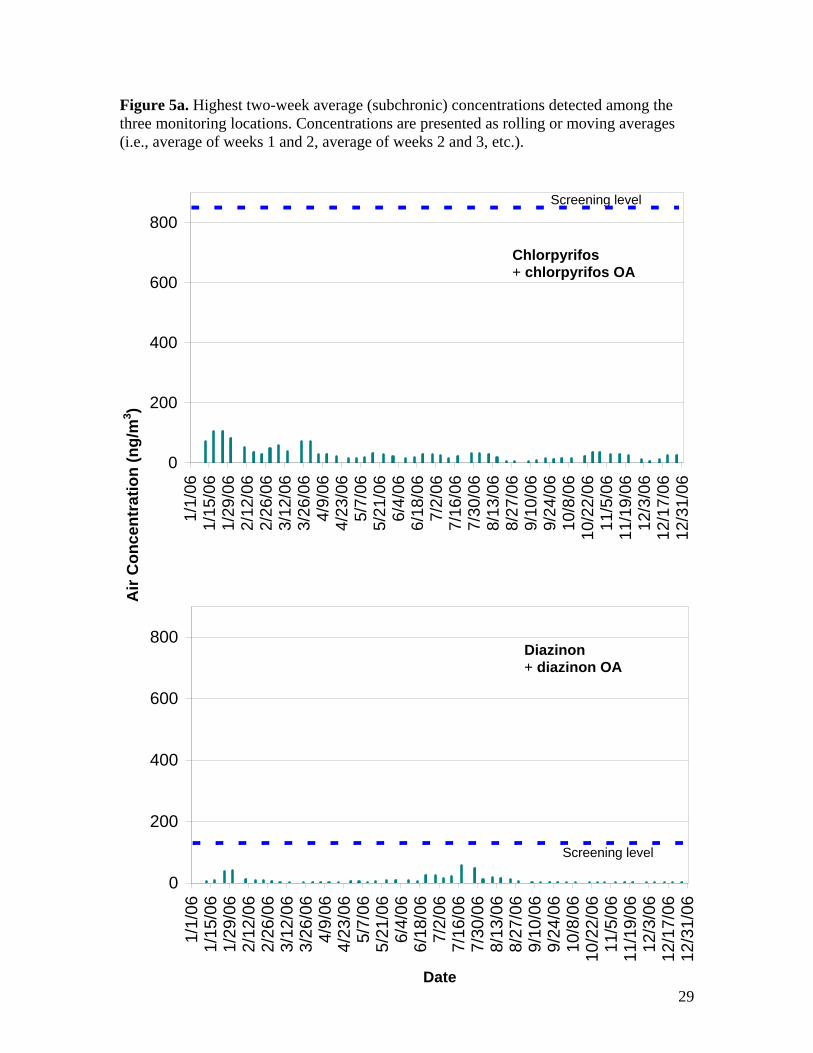
Air
Con
cent
ratio
n (n
g/m
3 )
1/1/
061/
15/0
61/
29/0
62/
12/0
62/
26/0
63/
12/0
63/
26/0
64/
9/06
4/23
/06
5/7/
065/
21/0
66/
4/06
6/18
/06
7/2/
067/
16/0
67/
30/0
68/
13/0
68/
27/0
69/
10/0
69/
24/0
610
/8/0
610
/22/
06
11/5
/06
11/1
9/06
12
/3/0
6Diazinon + diazinon OA
Screening level
1/1/
061/
15/0
61/
29/0
62/
12/0
62/
26/0
63/
12/0
63/
26/0
64/
9/06
4/23
/06
5/7/
065/
21/0
66/
4/06
6/18
/06
7/2/
067/
16/0
67/
30/0
68/
13/0
68/
27/0
69/
10/0
69/
24/0
610
/8/0
610
/22/
06
800
600
400
200
0
800
600
400
200
0
Chlorpyrifos + chlorpyrifos OA
Screening level
Figure 5a. Highest two-week average (subchronic) concentrations detected among the three monitoring locations. Concentrations are presented as rolling or moving averages (i.e., average of weeks 1 and 2, average of weeks 2 and 3, etc.).
Date
11/5
/06
11/1
9/06
12
/3/0
612
/17/
06
12/1
7/06
12
/31/
06
12/3
1/06
29
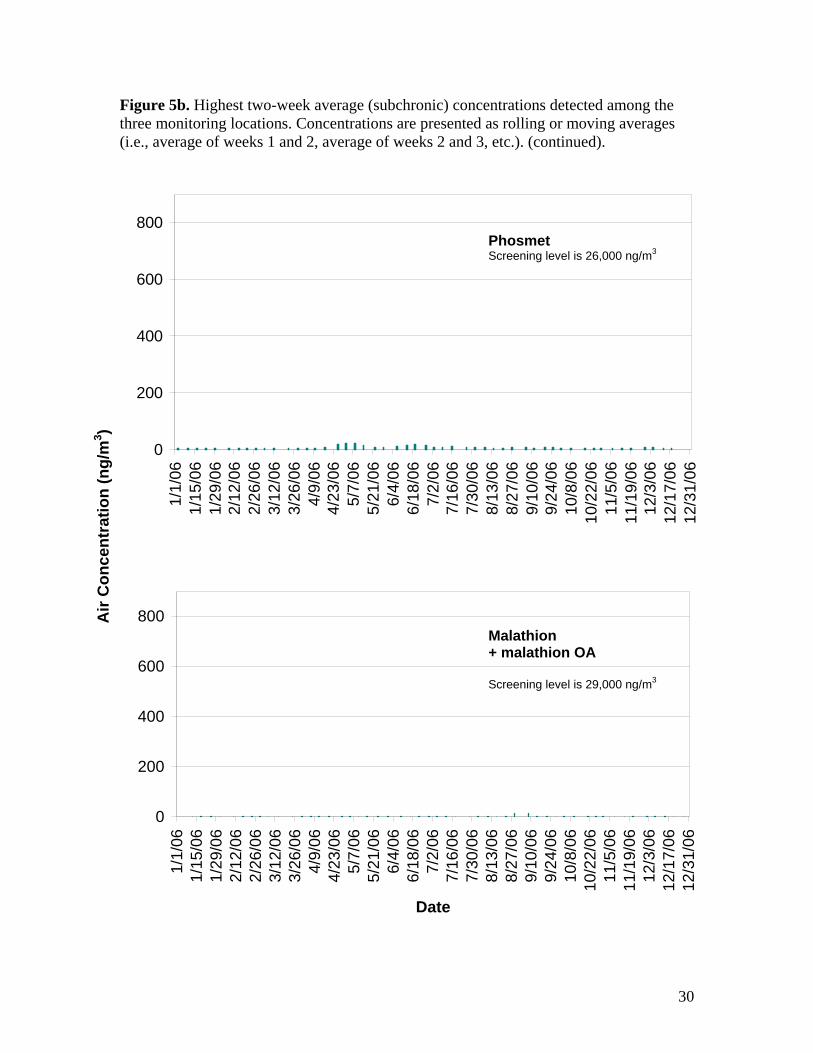
Air
Con
cent
ratio
n (n
g/m
3 )
1/1/
061/
15/0
61/
29/0
62/
12/0
62/
26/0
63/
12/0
63/
26/0
64/
9/06
4/23
/06
5/7/
065/
21/0
66/
4/06
6/18
/06
7/2/
067/
16/0
67/
30/0
68/
13/0
6
Malathion + malathion OA
Screening level is 29,000 ng/m3
1/1/
061/
15/0
61/
29/0
62/
12/0
62/
26/0
63/
12/0
63/
26/0
64/
9/06
4/23
/06
5/7/
065/
21/0
66/
4/06
6/18
/06
7/2/
067/
16/0
67/
30/0
68/
13/0
68/
27/0
68/
27/0
69/
10/0
69/
10/0
6
600
400
200
0
800
600
400
200
0
800
Figure 5b. Highest two-week average (subchronic) concentrations detected among the three monitoring locations. Concentrations are presented as rolling or moving averages (i.e., average of weeks 1 and 2, average of weeks 2 and 3, etc.). (continued).
Phosmet Screening level is 26,000 ng/m3
Date
9/24
/06
9/24
/06
10/8
/06
10/8
/06
10/2
2/06
10
/22/
06
11/5
/06
11/5
/06
11/1
9/06
11
/19/
06
12/3
/06
12/3
/06
12/1
7/06
12/1
7/06
12/3
1/06
12
/31/
06
30
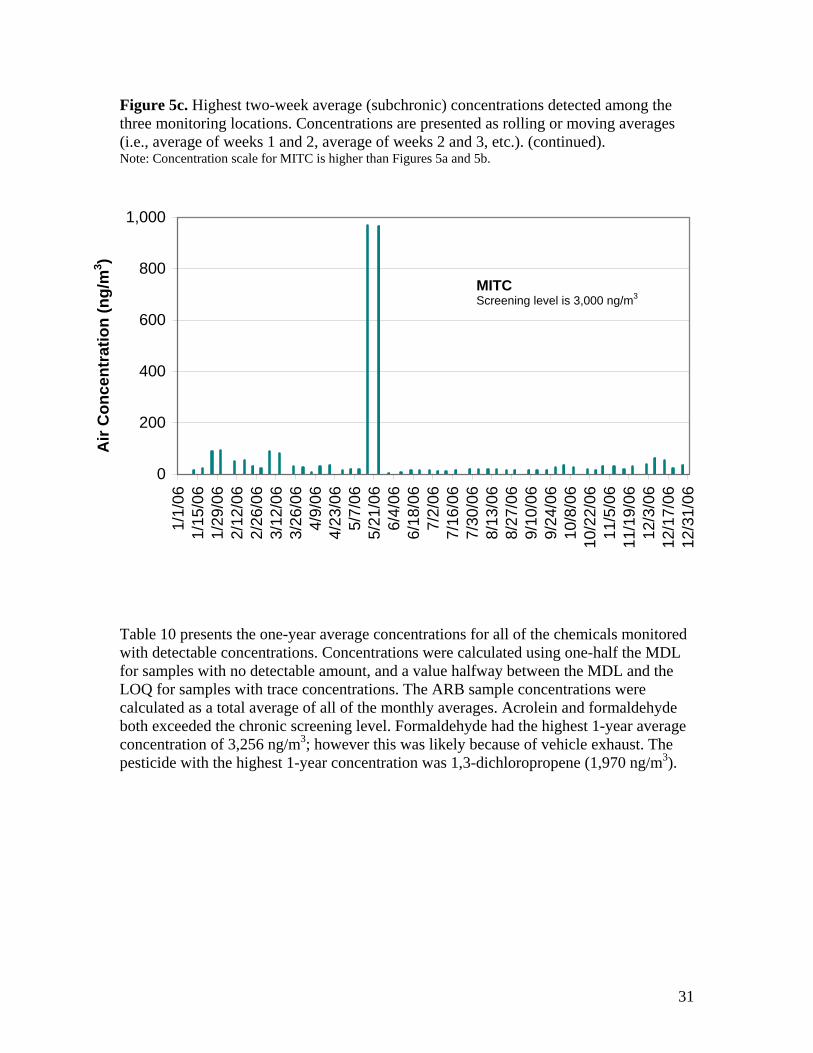
Air
Con
cent
ratio
n (n
g/m
3 ) 800
1,000
Figure 5c. Highest two-week average (subchronic) concentrations detected among the three monitoring locations. Concentrations are presented as rolling or moving averages (i.e., average of weeks 1 and 2, average of weeks 2 and 3, etc.). (continued). Note: Concentration scale for MITC is higher than Figures 5a and 5b.
MITC Screening level is 3,000 ng/m3
600
400
200
0
1/1/
061/
15/0
61/
29/0
62/
12/0
62/
26/0
63/
12/0
63/
26/0
64/
9/06
4/23
/06
5/7/
065/
21/0
66/
4/06
6/18
/06
7/2/
067/
16/0
67/
30/0
68/
13/0
68/
27/0
69/
10/0
69/
24/0
610
/8/0
610
/22/
0611
/5/0
611
/19/
0612
/3/0
612
/17/
0612
/31/
06
Table 10 presents the one-year average concentrations for all of the chemicals monitored with detectable concentrations. Concentrations were calculated using one-half the MDL for samples with no detectable amount, and a value halfway between the MDL and the LOQ for samples with trace concentrations. The ARB sample concentrations were calculated as a total average of all of the monthly averages. Acrolein and formaldehyde both exceeded the chronic screening level. Formaldehyde had the highest 1-year average concentration of 3,256 ng/m3; however this was likely because of vehicle exhaust. The pesticide with the highest 1-year concentration was 1,3-dichloropropene (1,970 ng/m3).
31
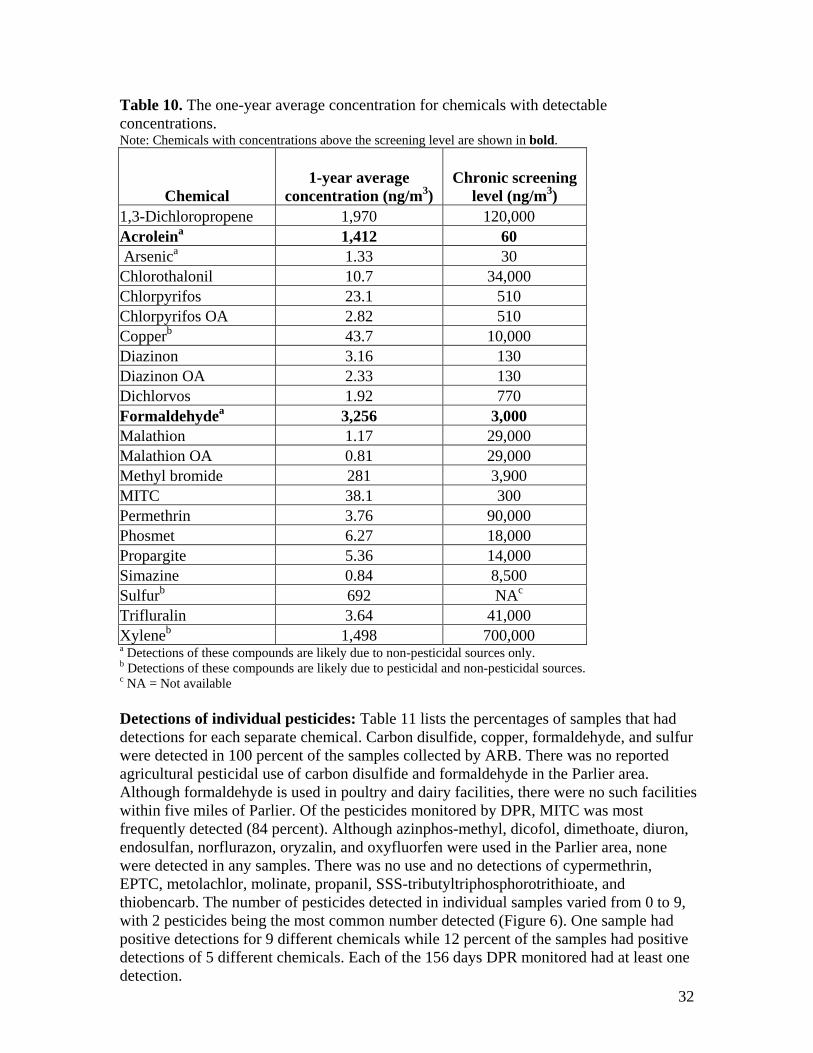
Table 10. The one-year average concentration for chemicals with detectable concentrations. Note: Chemicals with concentrations above the screening level are shown in bold.
Chemical 1-year average
concentration (ng/m3) Chronic screening
level (ng/m3) 1,3-Dichloropropene 1,970 120,000 Acroleina 1,412 60 Arsenica 1.33 30 Chlorothalonil 10.7 34,000 Chlorpyrifos 23.1 510 Chlorpyrifos OA 2.82 510 Copperb 43.7 10,000 Diazinon 3.16 130 Diazinon OA 2.33 130 Dichlorvos 1.92 770 Formaldehydea 3,256 3,000 Malathion 1.17 29,000 Malathion OA 0.81 29,000 Methyl bromide 281 3,900 MITC 38.1 300 Permethrin 3.76 90,000 Phosmet 6.27 18,000 Propargite 5.36 14,000 Simazine 0.84 8,500 Sulfurb 692 NAc
Trifluralin 3.64 41,000 Xyleneb 1,498 700,000 a Detections of these compounds are likely due to non-pesticidal sources only. b Detections of these compounds are likely due to pesticidal and non-pesticidal sources. c NA = Not available
Detections of individual pesticides: Table 11 lists the percentages of samples that had detections for each separate chemical. Carbon disulfide, copper, formaldehyde, and sulfur were detected in 100 percent of the samples collected by ARB. There was no reported agricultural pesticidal use of carbon disulfide and formaldehyde in the Parlier area. Although formaldehyde is used in poultry and dairy facilities, there were no such facilities within five miles of Parlier. Of the pesticides monitored by DPR, MITC was most frequently detected (84 percent). Although azinphos-methyl, dicofol, dimethoate, diuron, endosulfan, norflurazon, oryzalin, and oxyfluorfen were used in the Parlier area, none were detected in any samples. There was no use and no detections of cypermethrin, EPTC, metolachlor, molinate, propanil, SSS-tributyltriphosphorotrithioate, and thiobencarb. The number of pesticides detected in individual samples varied from 0 to 9, with 2 pesticides being the most common number detected (Figure 6). One sample had positive detections for 9 different chemicals while 12 percent of the samples had positive detections of 5 different chemicals. Each of the 156 days DPR monitored had at least one detection.
32
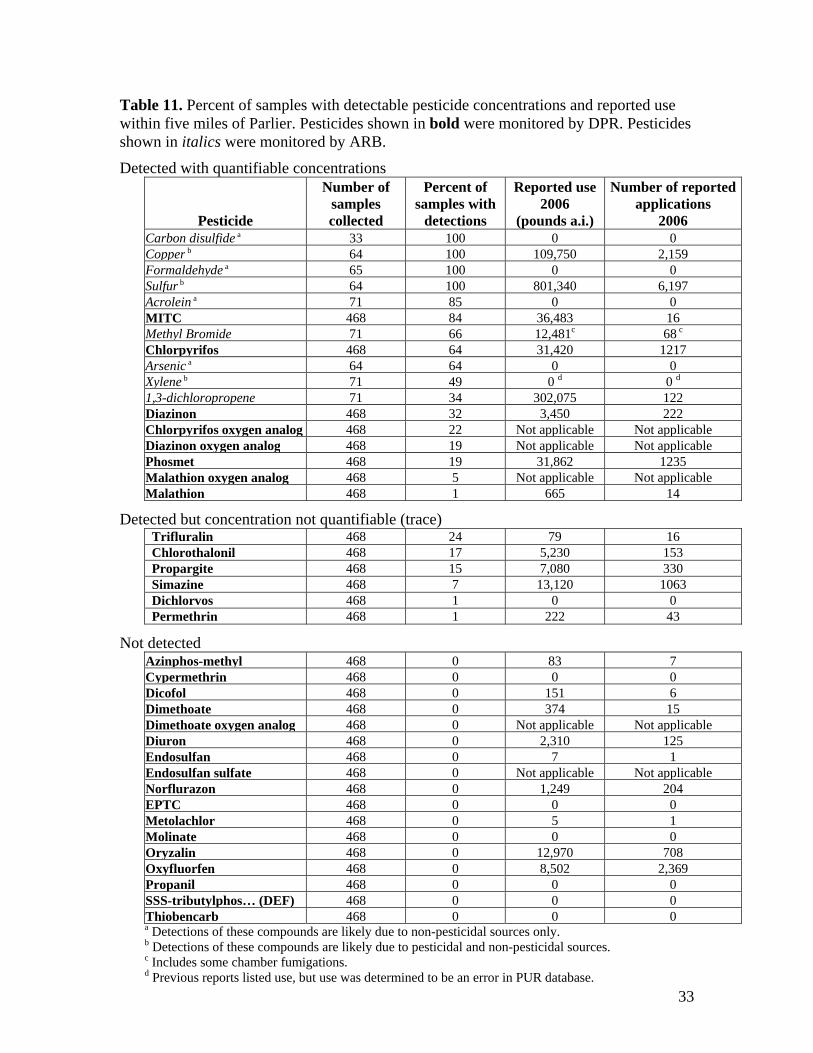
Table 11. Percent of samples with detectable pesticide concentrations and reported use within five miles of Parlier. Pesticides shown in bold were monitored by DPR. Pesticides shown in italics were monitored by ARB.
Detected with quantifiable concentrations
Pesticide
Number of samples collected
Percent of samples with
detections
Reported use 2006
(pounds a.i.)
Number of reported applications
2006 Carbon disulfide a 33 100 0 0 Copper b 64 100 109,750 2,159 Formaldehyde a 65 100 0 0 Sulfur b 64 100 801,340 6,197 Acrolein a 71 85 0 0 MITC 468 84 36,483 16 Methyl Bromide 71 66 12,481c 68 c
Chlorpyrifos 468 64 31,420 1217 Arsenic a 64 64 0 0 Xylene b 71 49 0 d 0 d
1,3-dichloropropene 71 34 302,075 122 Diazinon 468 32 3,450 222 Chlorpyrifos oxygen analog 468 22 Not applicable Not applicable Diazinon oxygen analog 468 19 Not applicable Not applicable Phosmet 468 19 31,862 1235 Malathion oxygen analog 468 5 Not applicable Not applicable Malathion 468 1 665 14
Detected but concentration not quantifiable (trace) Trifluralin 468 24 79 16 Chlorothalonil 468 17 5,230 153 Propargite 468 15 7,080 330 Simazine 468 7 13,120 1063 Dichlorvos 468 1 0 0 Permethrin 468 1 222 43
Not detected Azinphos-methyl 468 0 83 7 Cypermethrin 468 0 0 0 Dicofol 468 0 151 6 Dimethoate 468 0 374 15 Dimethoate oxygen analog 468 0 Not applicable Not applicable Diuron 468 0 2,310 125 Endosulfan 468 0 7 1 Endosulfan sulfate 468 0 Not applicable Not applicable Norflurazon 468 0 1,249 204 EPTC 468 0 0 0 Metolachlor 468 0 5 1 Molinate 468 0 0 0 Oryzalin 468 0 12,970 708 Oxyfluorfen 468 0 8,502 2,369 Propanil 468 0 0 0 SSS-tributylphos… (DEF) 468 0 0 0 Thiobencarb 468 0 0 0 a Detections of these compounds are likely due to non-pesticidal sources only. b Detections of these compounds are likely due to pesticidal and non-pesticidal sources. c Includes some chamber fumigations. d Previous reports listed use, but use was determined to be an error in PUR database.
33
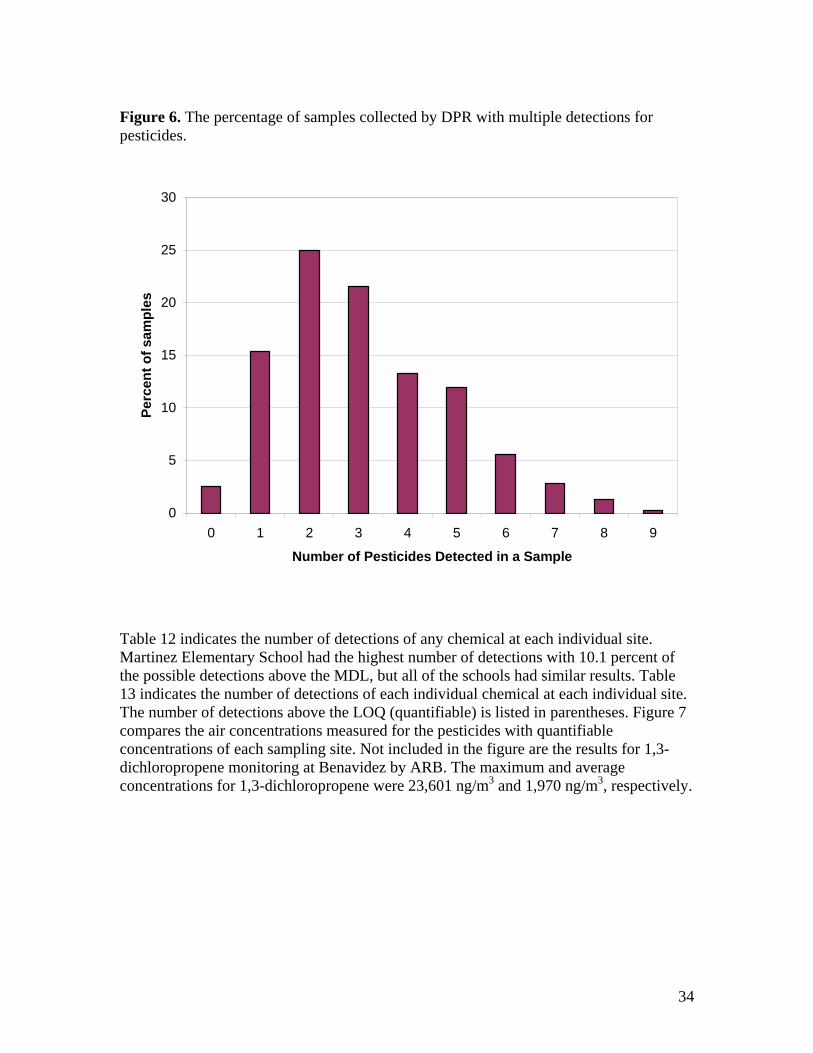
Figure 6. The percentage of samples collected by DPR with multiple detections for pesticides.
Perc
ent o
f sam
ples
30
25
20
15
10
5
0 0 1 2 3 4 5 6 7 8 9
Number of Pesticides Detected in a Sample
Table 12 indicates the number of detections of any chemical at each individual site. Martinez Elementary School had the highest number of detections with 10.1 percent of the possible detections above the MDL, but all of the schools had similar results. Table 13 indicates the number of detections of each individual chemical at each individual site. The number of detections above the LOQ (quantifiable) is listed in parentheses. Figure 7 compares the air concentrations measured for the pesticides with quantifiable concentrations of each sampling site. Not included in the figure are the results for 1,3dichloropropene monitoring at Benavidez by ARB. The maximum and average concentrations for 1,3-dichloropropene were 23,601 ng/m3 and 1,970 ng/m3, respectively.
34
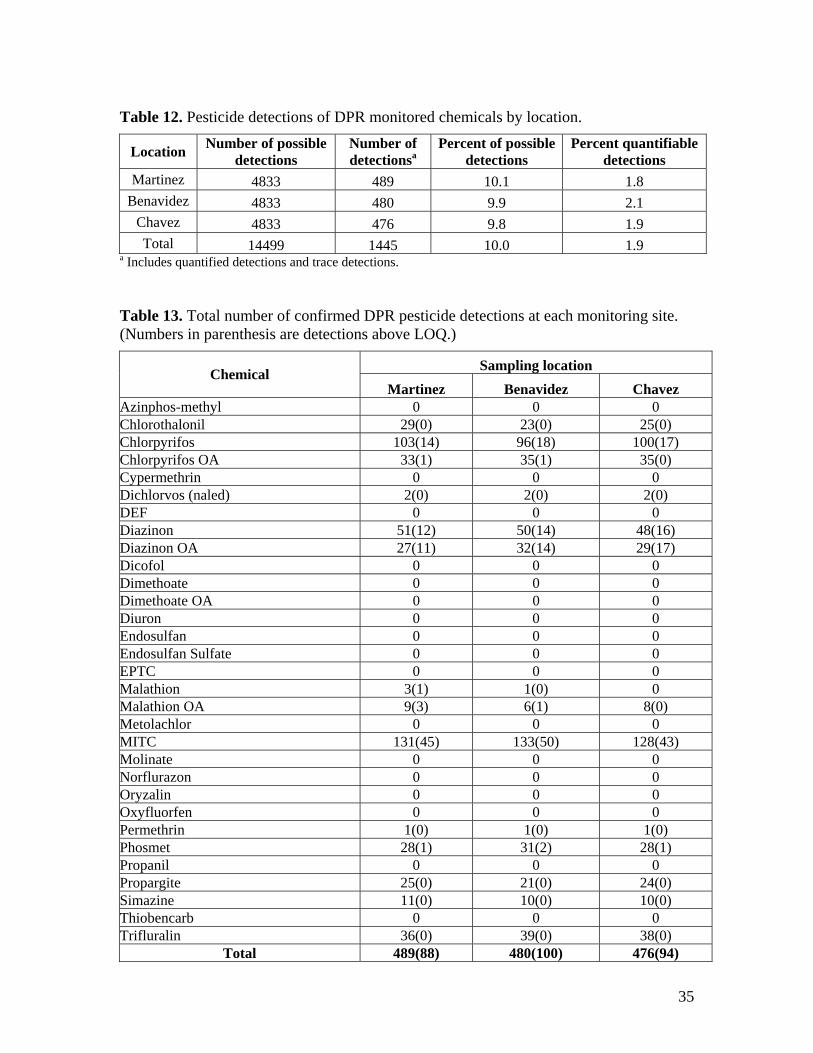
Table 12. Pesticide detections of DPR monitored chemicals by location.
Location Number of possible detections
Number of detectionsa
Percent of possible detections
Percent quantifiable detections
Martinez 4833 489 10.1 1.8 Benavidez 4833 480 9.9 2.1
Chavez 4833 476 9.8 1.9 Total 14499 1445 10.0 1.9
a Includes quantified detections and trace detections.
Table 13. Total number of confirmed DPR pesticide detections at each monitoring site. (Numbers in parenthesis are detections above LOQ.)
Chemical Sampling location Martinez Benavidez Chavez
Azinphos-methyl 0 0 0 Chlorothalonil 29(0) 23(0) 25(0) Chlorpyrifos 103(14) 96(18) 100(17) Chlorpyrifos OA 33(1) 35(1) 35(0) Cypermethrin 0 0 0 Dichlorvos (naled) 2(0) 2(0) 2(0) DEF 0 0 0 Diazinon 51(12) 50(14) 48(16) Diazinon OA 27(11) 32(14) 29(17) Dicofol 0 0 0 Dimethoate 0 0 0 Dimethoate OA 0 0 0 Diuron 0 0 0 Endosulfan 0 0 0 Endosulfan Sulfate 0 0 0 EPTC 0 0 0 Malathion 3(1) 1(0) 0 Malathion OA 9(3) 6(1) 8(0) Metolachlor 0 0 0 MITC 131(45) 133(50) 128(43) Molinate 0 0 0 Norflurazon 0 0 0 Oryzalin 0 0 0 Oxyfluorfen 0 0 0 Permethrin 1(0) 1(0) 1(0) Phosmet 28(1) 31(2) 28(1) Propanil 0 0 0 Propargite 25(0) 21(0) 24(0) Simazine 11(0) 10(0) 10(0) Thiobencarb 0 0 0 Trifluralin 36(0) 39(0) 38(0)
Total 489(88) 480(100) 476(94)
35
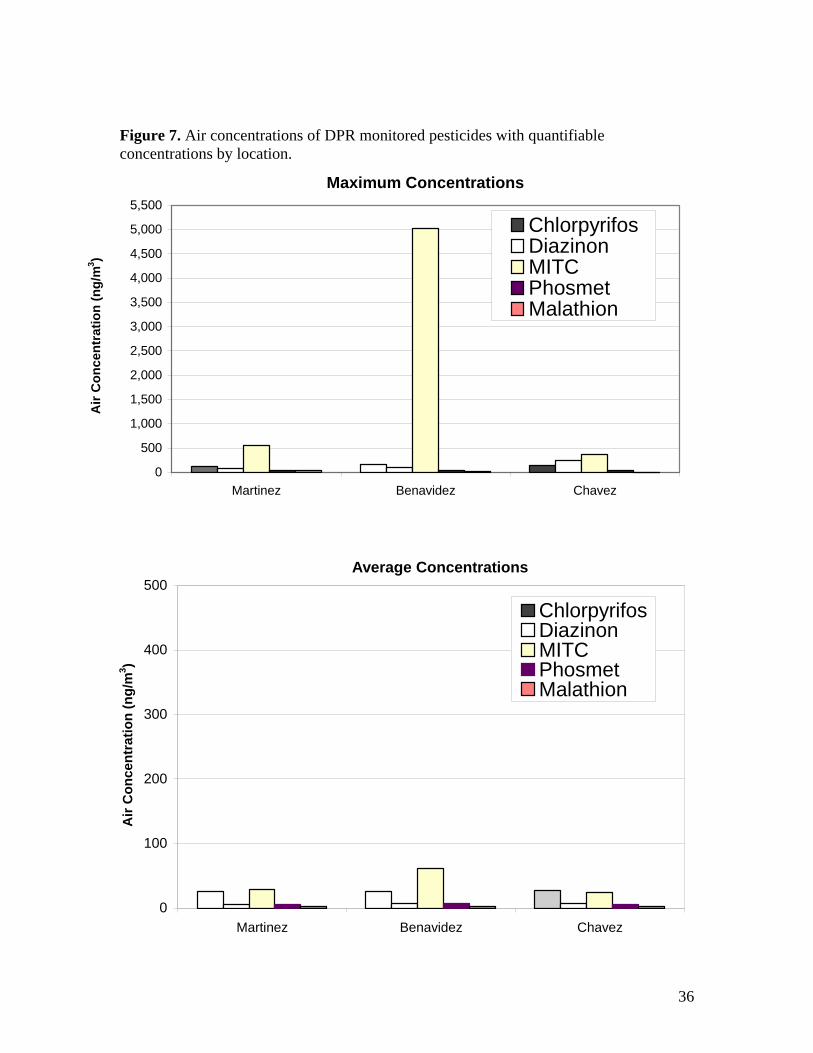
Air
Con
cent
ratio
n (n
g/m
3 )
Figure 7. Air concentrations of DPR monitored pesticides with quantifiable concentrations by location.
Maximum Concentrations 5,500
5,000
4,500
4,000
3,500
3,000
2,500
2,000
1,500
1,000
500
0
ChlorpyrifosDiazinon MITC Phosmet Malathion
Martinez Benavidez Chavez
0
100
200
300
400
500
Martinez Benavidez Chavez
Air
Con
cent
ratio
n (n
g/m
3 )
ChlorpyrifosDiazinon MITC Phosmet Malathion
Average Concentrations
36
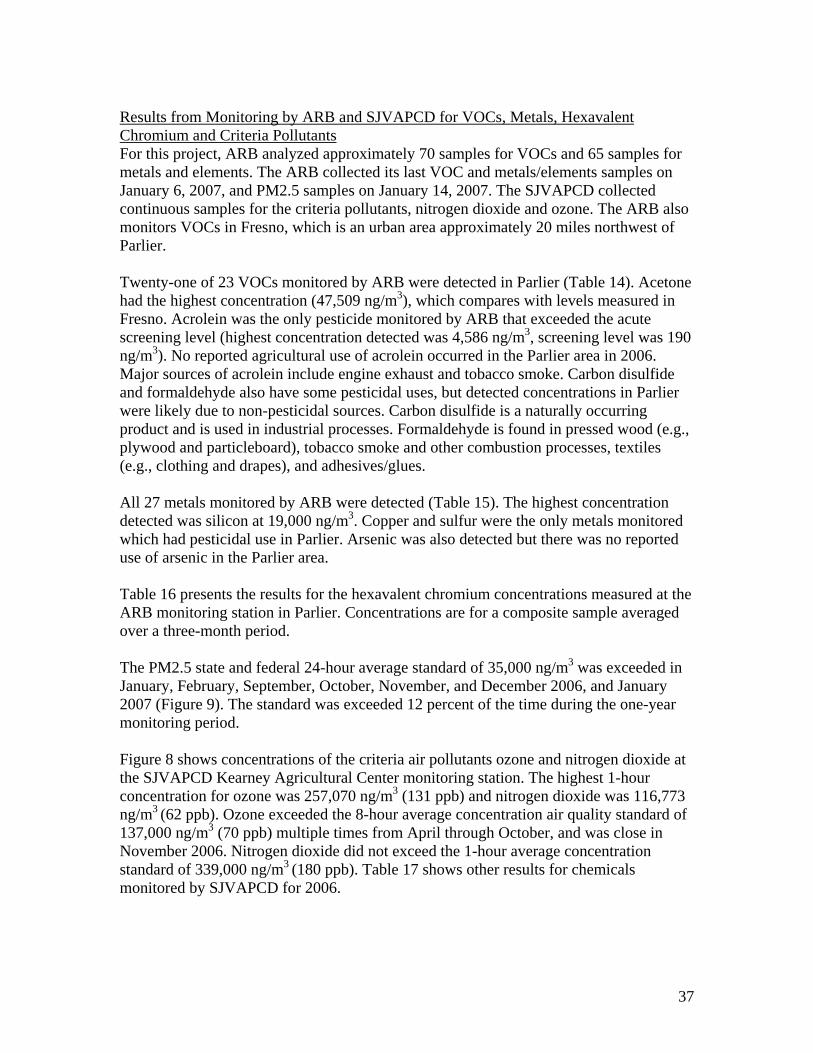
Results from Monitoring by ARB and SJVAPCD for VOCs, Metals, Hexavalent Chromium and Criteria Pollutants For this project, ARB analyzed approximately 70 samples for VOCs and 65 samples for metals and elements. The ARB collected its last VOC and metals/elements samples on January 6, 2007, and PM2.5 samples on January 14, 2007. The SJVAPCD collected continuous samples for the criteria pollutants, nitrogen dioxide and ozone. The ARB also monitors VOCs in Fresno, which is an urban area approximately 20 miles northwest of Parlier.
Twenty-one of 23 VOCs monitored by ARB were detected in Parlier (Table 14). Acetone had the highest concentration (47,509 ng/m3), which compares with levels measured in Fresno. Acrolein was the only pesticide monitored by ARB that exceeded the acute screening level (highest concentration detected was 4,586 ng/m3, screening level was 190 ng/m3). No reported agricultural use of acrolein occurred in the Parlier area in 2006. Major sources of acrolein include engine exhaust and tobacco smoke. Carbon disulfide and formaldehyde also have some pesticidal uses, but detected concentrations in Parlier were likely due to non-pesticidal sources. Carbon disulfide is a naturally occurring product and is used in industrial processes. Formaldehyde is found in pressed wood (e.g., plywood and particleboard), tobacco smoke and other combustion processes, textiles (e.g., clothing and drapes), and adhesives/glues.
All 27 metals monitored by ARB were detected (Table 15). The highest concentration detected was silicon at 19,000 ng/m3. Copper and sulfur were the only metals monitored which had pesticidal use in Parlier. Arsenic was also detected but there was no reported use of arsenic in the Parlier area.
Table 16 presents the results for the hexavalent chromium concentrations measured at the ARB monitoring station in Parlier. Concentrations are for a composite sample averaged over a three-month period.
The PM2.5 state and federal 24-hour average standard of 35,000 ng/m3 was exceeded in January, February, September, October, November, and December 2006, and January 2007 (Figure 9). The standard was exceeded 12 percent of the time during the one-year monitoring period.
Figure 8 shows concentrations of the criteria air pollutants ozone and nitrogen dioxide at the SJVAPCD Kearney Agricultural Center monitoring station. The highest 1-hour concentration for ozone was 257,070 ng/m3 (131 ppb) and nitrogen dioxide was 116,773 ng/m3 (62 ppb). Ozone exceeded the 8-hour average concentration air quality standard of 137,000 ng/m3 (70 ppb) multiple times from April through October, and was close in November 2006. Nitrogen dioxide did not exceed the 1-hour average concentration standard of 339,000 ng/m3 (180 ppb). Table 17 shows other results for chemicals monitored by SJVAPCD for 2006.
37
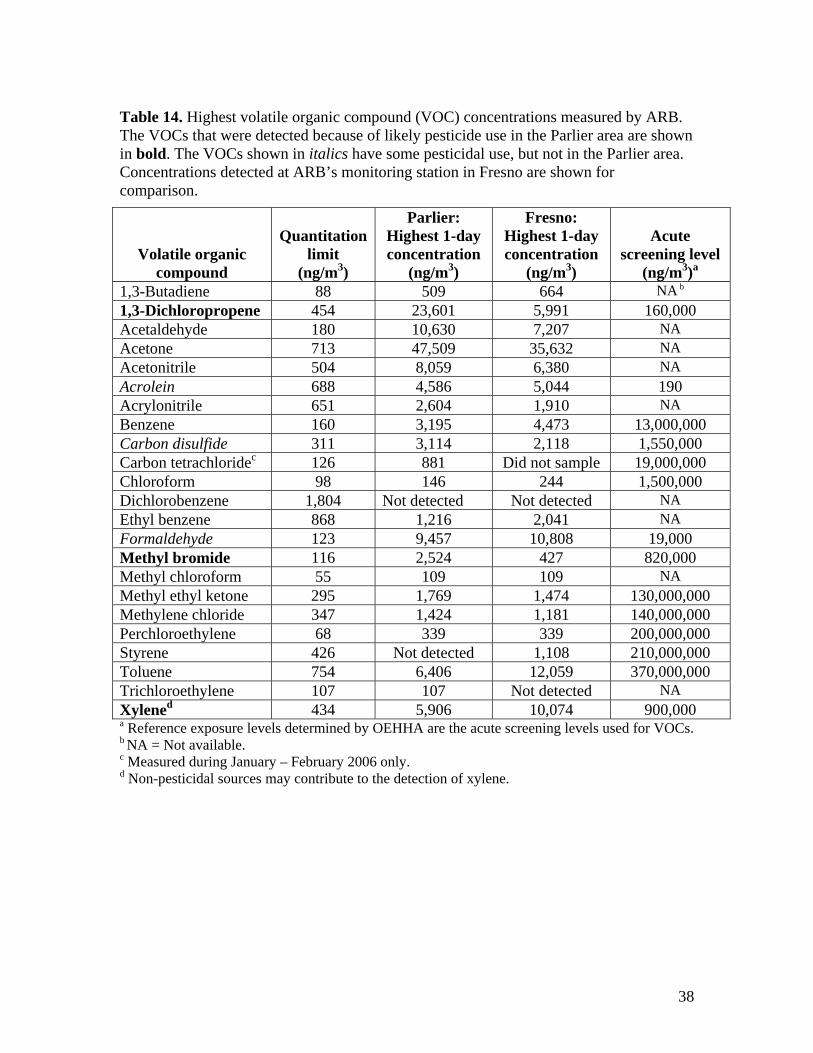
Table 14. Highest volatile organic compound (VOC) concentrations measured by ARB. The VOCs that were detected because of likely pesticide use in the Parlier area are shown in bold. The VOCs shown in italics have some pesticidal use, but not in the Parlier area. Concentrations detected at ARB’s monitoring station in Fresno are shown for comparison.
Volatile organic compound
Quantitation limit
(ng/m3)
Parlier: Highest 1-day concentration
(ng/m3)
Fresno: Highest 1-day concentration
(ng/m3)
Acute screening level
(ng/m3)a
1,3-Butadiene 88 509 664 NA b
1,3-Dichloropropene 454 23,601 5,991 160,000 Acetaldehyde 180 10,630 7,207 NA Acetone 713 47,509 35,632 NA Acetonitrile 504 8,059 6,380 NA Acrolein 688 4,586 5,044 190 Acrylonitrile 651 2,604 1,910 NA Benzene 160 3,195 4,473 13,000,000 Carbon disulfide 311 3,114 2,118 1,550,000 Carbon tetrachloridec 126 881 Did not sample 19,000,000 Chloroform 98 146 244 1,500,000 Dichlorobenzene 1,804 Not detected Not detected NA Ethyl benzene 868 1,216 2,041 NA Formaldehyde 123 9,457 10,808 19,000 Methyl bromide 116 2,524 427 820,000 Methyl chloroform 55 109 109 NA Methyl ethyl ketone 295 1,769 1,474 130,000,000 Methylene chloride 347 1,424 1,181 140,000,000 Perchloroethylene 68 339 339 200,000,000 Styrene 426 Not detected 1,108 210,000,000 Toluene 754 6,406 12,059 370,000,000 Trichloroethylene 107 107 Not detected NA Xylened 434 5,906 10,074 900,000 a Reference exposure levels determined by OEHHA are the acute screening levels used for VOCs. b NA = Not available. c Measured during January – February 2006 only.d Non-pesticidal sources may contribute to the detection of xylene.
38
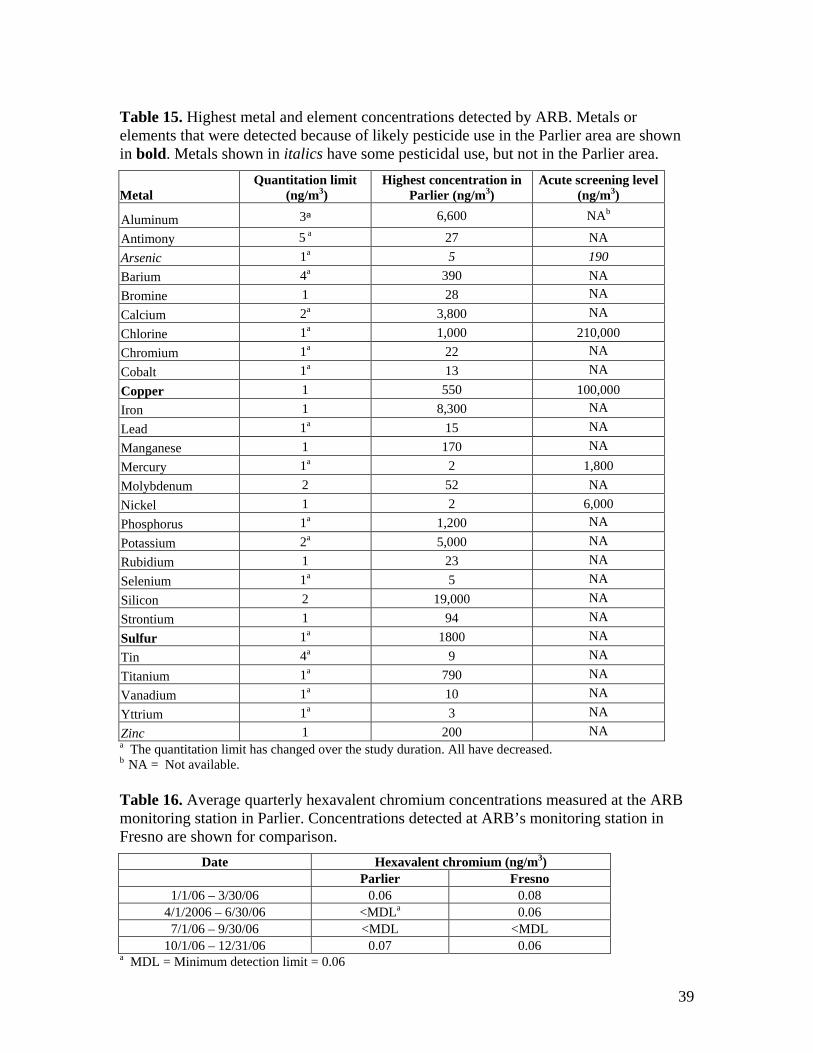
Table 15. Highest metal and element concentrations detected by ARB. Metals or elements that were detected because of likely pesticide use in the Parlier area are shown in bold. Metals shown in italics have some pesticidal use, but not in the Parlier area.
Metal Quantitation limit
(ng/m3) Highest concentration in
Parlier (ng/m3) Acute screening level
(ng/m3)
Aluminum 3a 6,600 NAb
Antimony 5 a 27 NA Arsenic 1a 5 190 Barium 4a 390 NA Bromine 1 28 NA Calcium 2a 3,800 NA Chlorine 1a 1,000 210,000 Chromium 1a 22 NA Cobalt 1a 13 NA Copper 1 550 100,000 Iron 1 8,300 NA Lead 1a 15 NA Manganese 1 170 NA Mercury 1a 2 1,800 Molybdenum 2 52 NA Nickel 1 2 6,000 Phosphorus 1a 1,200 NA Potassium 2a 5,000 NA Rubidium 1 23 NA Selenium 1a 5 NA Silicon 2 19,000 NA Strontium 1 94 NA Sulfur 1a 1800 NA Tin 4a 9 NA Titanium 1a 790 NA Vanadium 1a 10 NA Yttrium 1a 3 NA Zinc 1 200 NA a The quantitation limit has changed over the study duration. All have decreased. b NA = Not available.
Table 16. Average quarterly hexavalent chromium concentrations measured at the ARB monitoring station in Parlier. Concentrations detected at ARB’s monitoring station in Fresno are shown for comparison.
Date Hexavalent chromium (ng/m3) Parlier Fresno
1/1/06 – 3/30/06 0.06 0.08 4/1/2006 – 6/30/06 <MDLa 0.06 7/1/06 – 9/30/06 <MDL <MDL
10/1/06 – 12/31/06 0.07 0.06 a MDL = Minimum detection limit = 0.06
39
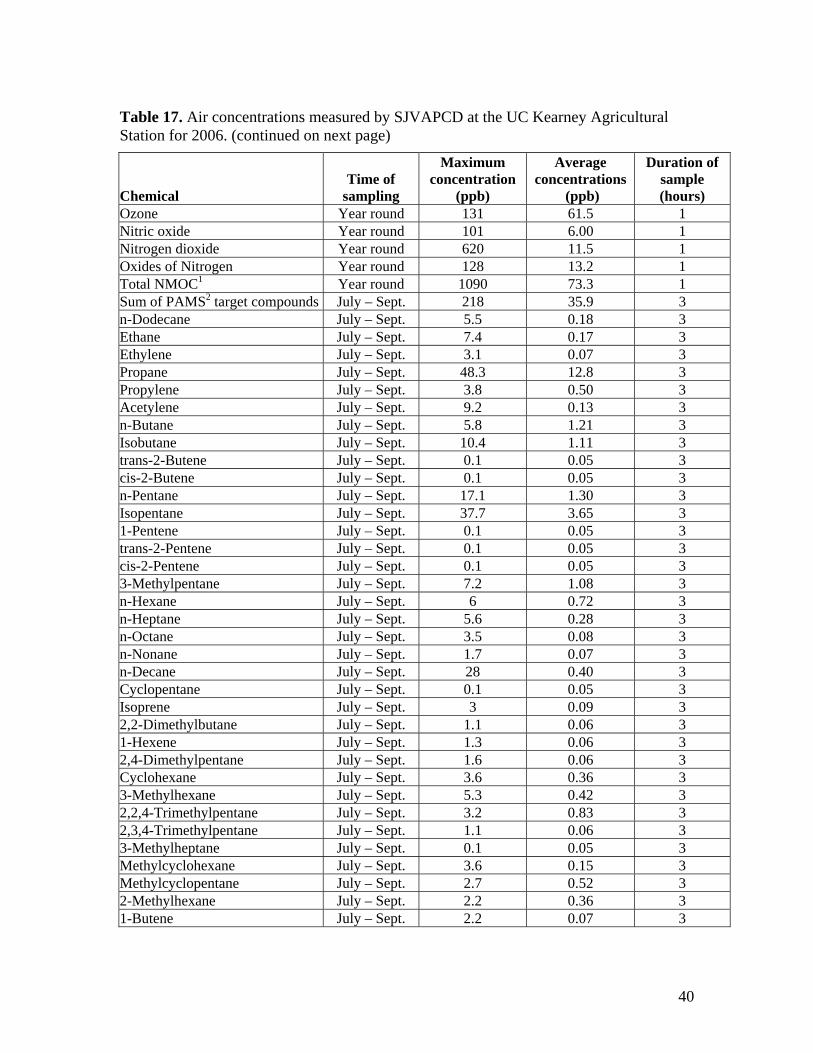
Table 17. Air concentrations measured by SJVAPCD at the UC Kearney Agricultural Station for 2006. (continued on next page)
Chemical Time of
sampling
Maximum concentration
(ppb)
Average concentrations
(ppb)
Duration of sample (hours)
Ozone Year round 131 61.5 1 Nitric oxide Year round 101 6.00 1 Nitrogen dioxide Year round 620 11.5 1 Oxides of Nitrogen Year round 128 13.2 1 Total NMOC1 Year round 1090 73.3 1 Sum of PAMS2 target compounds July – Sept. 218 35.9 3 n-Dodecane July – Sept. 5.5 0.18 3 Ethane July – Sept. 7.4 0.17 3 Ethylene July – Sept. 3.1 0.07 3 Propane July – Sept. 48.3 12.8 3 Propylene July – Sept. 3.8 0.50 3 Acetylene July – Sept. 9.2 0.13 3 n-Butane July – Sept. 5.8 1.21 3 Isobutane July – Sept. 10.4 1.11 3 trans-2-Butene July – Sept. 0.1 0.05 3 cis-2-Butene July – Sept. 0.1 0.05 3 n-Pentane July – Sept. 17.1 1.30 3 Isopentane July – Sept. 37.7 3.65 3 1-Pentene July – Sept. 0.1 0.05 3 trans-2-Pentene July – Sept. 0.1 0.05 3 cis-2-Pentene July – Sept. 0.1 0.05 3 3-Methylpentane July – Sept. 7.2 1.08 3 n-Hexane July – Sept. 6 0.72 3 n-Heptane July – Sept. 5.6 0.28 3 n-Octane July – Sept. 3.5 0.08 3 n-Nonane July – Sept. 1.7 0.07 3 n-Decane July – Sept. 28 0.40 3 Cyclopentane July – Sept. 0.1 0.05 3 Isoprene July – Sept. 3 0.09 3 2,2-Dimethylbutane July – Sept. 1.1 0.06 3 1-Hexene July – Sept. 1.3 0.06 3 2,4-Dimethylpentane July – Sept. 1.6 0.06 3 Cyclohexane July – Sept. 3.6 0.36 3 3-Methylhexane July – Sept. 5.3 0.42 3 2,2,4-Trimethylpentane July – Sept. 3.2 0.83 3 2,3,4-Trimethylpentane July – Sept. 1.1 0.06 3 3-Methylheptane July – Sept. 0.1 0.05 3 Methylcyclohexane July – Sept. 3.6 0.15 3 Methylcyclopentane July – Sept. 2.7 0.52 3 2-Methylhexane July – Sept. 2.2 0.36 3 1-Butene July – Sept. 2.2 0.07 3
40
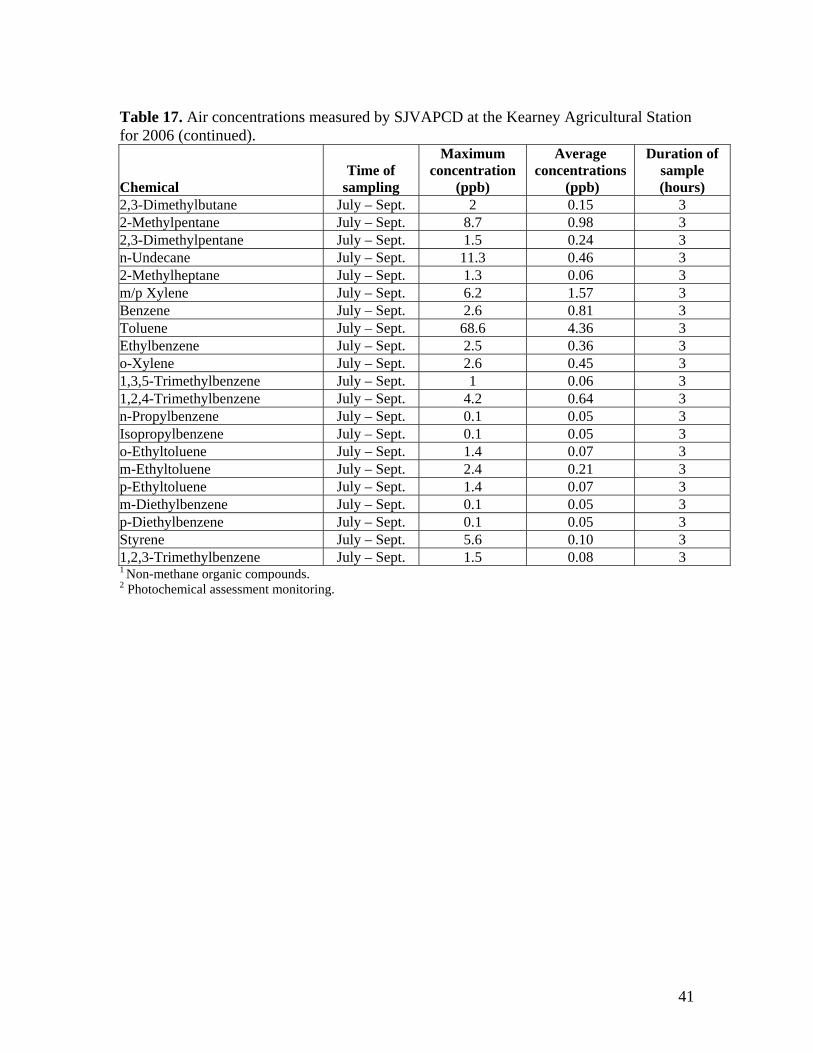
Table 17. Air concentrations measured by SJVAPCD at the Kearney Agricultural Station for 2006 (continued).
Chemical Time of
sampling
Maximum concentration
(ppb)
Average concentrations
(ppb)
Duration of sample (hours)
2,3-Dimethylbutane July – Sept. 2 0.15 3 2-Methylpentane July – Sept. 8.7 0.98 3 2,3-Dimethylpentane July – Sept. 1.5 0.24 3 n-Undecane July – Sept. 11.3 0.46 3 2-Methylheptane July – Sept. 1.3 0.06 3 m/p Xylene July – Sept. 6.2 1.57 3 Benzene July – Sept. 2.6 0.81 3 Toluene July – Sept. 68.6 4.36 3 Ethylbenzene July – Sept. 2.5 0.36 3 o-Xylene July – Sept. 2.6 0.45 3 1,3,5-Trimethylbenzene July – Sept. 1 0.06 3 1,2,4-Trimethylbenzene July – Sept. 4.2 0.64 3 n-Propylbenzene July – Sept. 0.1 0.05 3 Isopropylbenzene July – Sept. 0.1 0.05 3 o-Ethyltoluene July – Sept. 1.4 0.07 3 m-Ethyltoluene July – Sept. 2.4 0.21 3 p-Ethyltoluene July – Sept. 1.4 0.07 3 m-Diethylbenzene July – Sept. 0.1 0.05 3 p-Diethylbenzene July – Sept. 0.1 0.05 3 Styrene July – Sept. 5.6 0.10 3 1,2,3-Trimethylbenzene July – Sept. 1.5 0.08 3 1 Non-methane organic compounds. 2 Photochemical assessment monitoring.
41
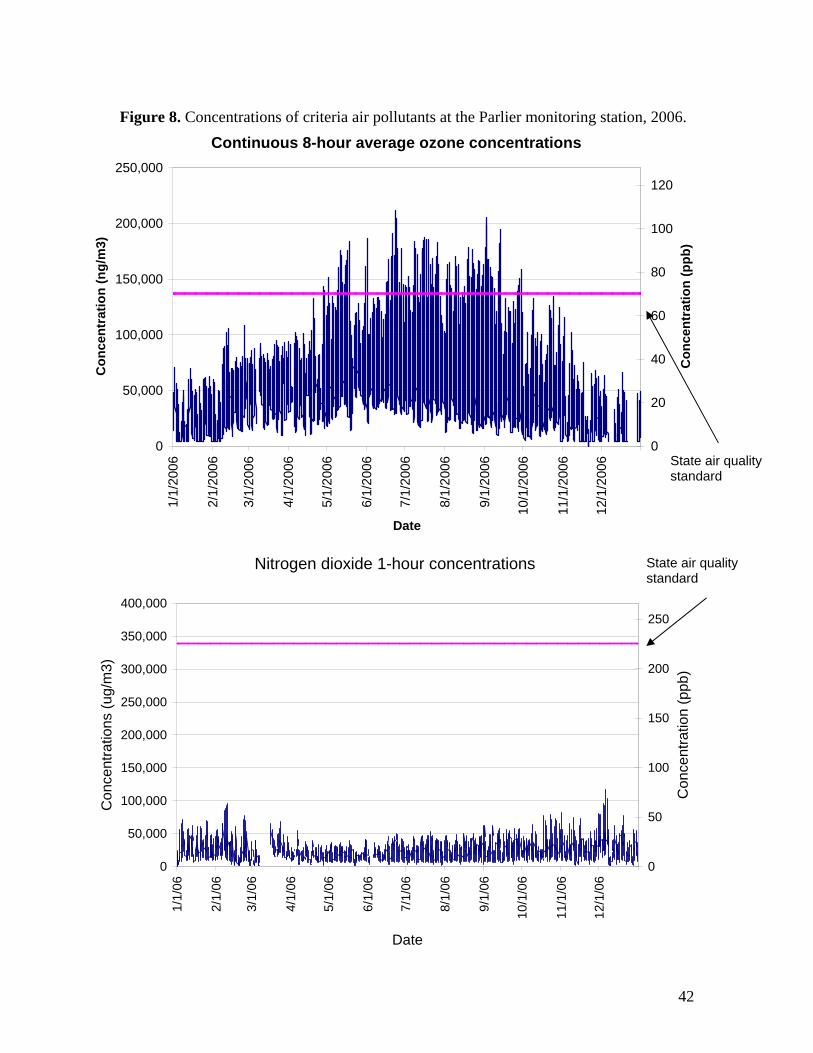
3/1/
2006
0
50,000
100,000
150,000
200,000
250,000
300,000
350,000
400,000
1/1/
06
2/1/
06
11/1
/06
12/1
/06
Con
cent
ratio
ns (u
g/m
3)
0
50
100
150
200
250
Con
cent
ratio
n (p
pb)
1/1/
2006
2/1/
2006
11/1
/200
6
12/1
/200
6
0
50,000
100,000
150,000
200,000
250,000
Con
cent
ratio
n (n
g/m
3)
0
20
40
60
80
100
120
Con
cent
ratio
n (p
pb)
3/1/
06
4/1/
2006
4/1/
06
5/1/
065/
1/20
06
6/1/
066/
1/20
06
7/1/
067/
1/20
06
8/1/
06
9/1/
06
10/1
/06
8/1/
2006
9/1/
2006
10/1
/200
6 State air quality standard
Figure 8. Concentrations of criteria air pollutants at the Parlier monitoring station, 2006. Continuous 8-hour average ozone concentrations
Date
Nitrogen dioxide 1-hour concentrations State air quality standard
Date
42
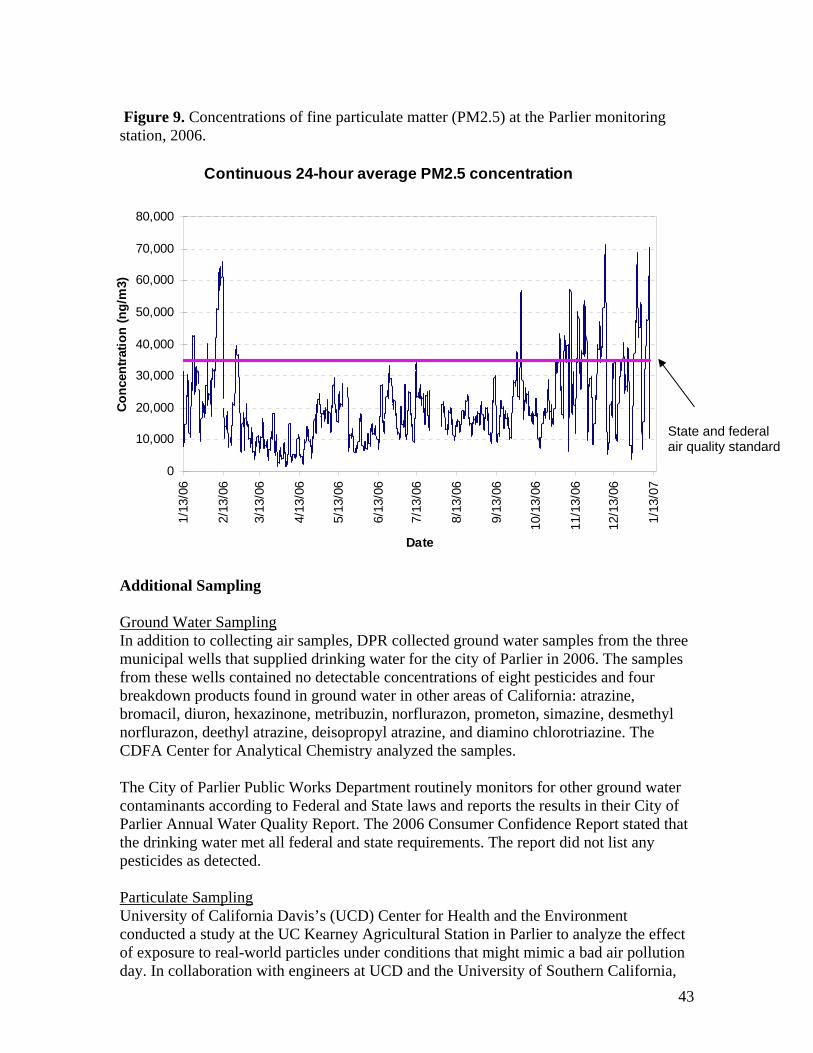
Figure 9. Concentrations of fine particulate matter (PM2.5) at the Parlier monitoring station, 2006.
Continuous 24-hour average PM2.5 concentration
0
10,000
20,000
30,000
40,000
50,000
60,000
70,000
80,000
Conc
entra
tion
(ng/
m3)
State and federal air quality standard
1/13
/06
2/13
/06
3/13
/06
4/13
/06
5/13
/06
6/13
/06
7/13
/06
8/13
/06
9/13
/06
10/1
3/06
11/1
3/06
12/1
3/06
1/13
/07
Date
Additional Sampling
Ground Water Sampling In addition to collecting air samples, DPR collected ground water samples from the three municipal wells that supplied drinking water for the city of Parlier in 2006. The samples from these wells contained no detectable concentrations of eight pesticides and four breakdown products found in ground water in other areas of California: atrazine, bromacil, diuron, hexazinone, metribuzin, norflurazon, prometon, simazine, desmethyl norflurazon, deethyl atrazine, deisopropyl atrazine, and diamino chlorotriazine. The CDFA Center for Analytical Chemistry analyzed the samples.
The City of Parlier Public Works Department routinely monitors for other ground water contaminants according to Federal and State laws and reports the results in their City of Parlier Annual Water Quality Report. The 2006 Consumer Confidence Report stated that the drinking water met all federal and state requirements. The report did not list any pesticides as detected.
Particulate Sampling University of California Davis’s (UCD) Center for Health and the Environment conducted a study at the UC Kearney Agricultural Station in Parlier to analyze the effect of exposure to real-world particles under conditions that might mimic a bad air pollution day. In collaboration with engineers at UCD and the University of Southern California,
43
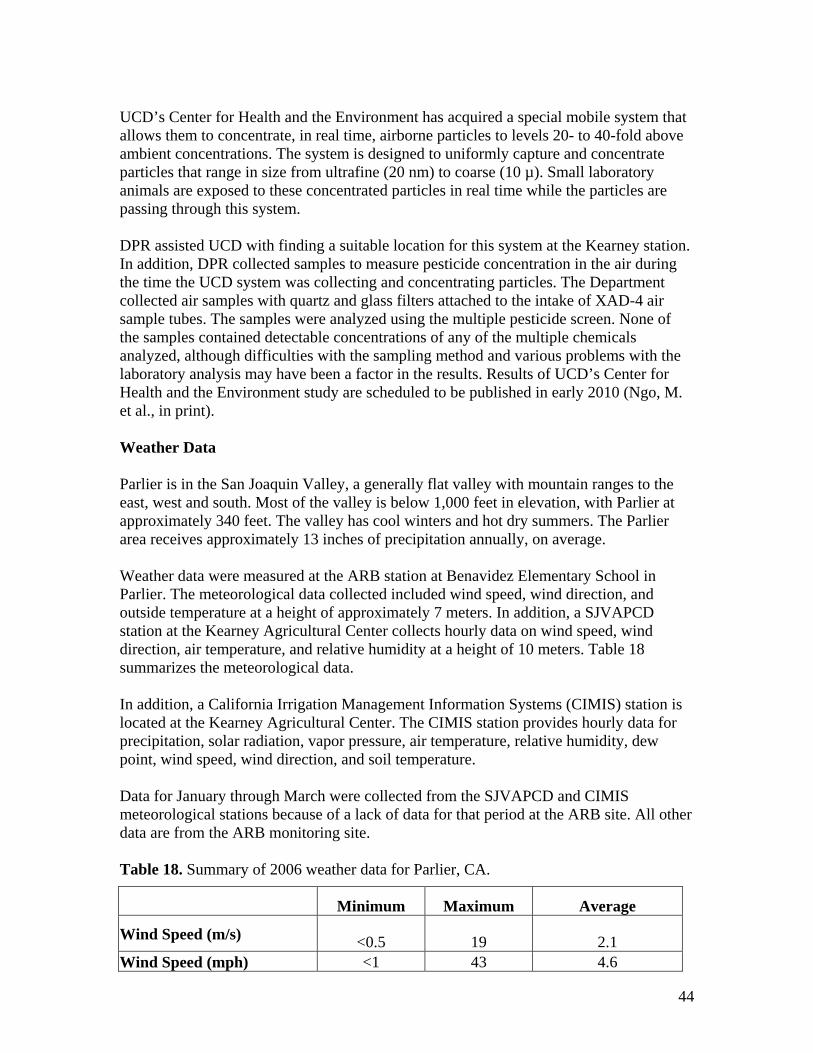
UCD’s Center for Health and the Environment has acquired a special mobile system that allows them to concentrate, in real time, airborne particles to levels 20- to 40-fold above ambient concentrations. The system is designed to uniformly capture and concentrate particles that range in size from ultrafine (20 nm) to coarse (10 µ). Small laboratory animals are exposed to these concentrated particles in real time while the particles are passing through this system.
DPR assisted UCD with finding a suitable location for this system at the Kearney station. In addition, DPR collected samples to measure pesticide concentration in the air during the time the UCD system was collecting and concentrating particles. The Department collected air samples with quartz and glass filters attached to the intake of XAD-4 air sample tubes. The samples were analyzed using the multiple pesticide screen. None of the samples contained detectable concentrations of any of the multiple chemicals analyzed, although difficulties with the sampling method and various problems with the laboratory analysis may have been a factor in the results. Results of UCD’s Center for Health and the Environment study are scheduled to be published in early 2010 (Ngo, M. et al., in print).
Weather Data
Parlier is in the San Joaquin Valley, a generally flat valley with mountain ranges to the east, west and south. Most of the valley is below 1,000 feet in elevation, with Parlier at approximately 340 feet. The valley has cool winters and hot dry summers. The Parlier area receives approximately 13 inches of precipitation annually, on average.
Weather data were measured at the ARB station at Benavidez Elementary School in Parlier. The meteorological data collected included wind speed, wind direction, and outside temperature at a height of approximately 7 meters. In addition, a SJVAPCD station at the Kearney Agricultural Center collects hourly data on wind speed, wind direction, air temperature, and relative humidity at a height of 10 meters. Table 18 summarizes the meteorological data.
In addition, a California Irrigation Management Information Systems (CIMIS) station is located at the Kearney Agricultural Center. The CIMIS station provides hourly data for precipitation, solar radiation, vapor pressure, air temperature, relative humidity, dew point, wind speed, wind direction, and soil temperature.
Data for January through March were collected from the SJVAPCD and CIMIS meteorological stations because of a lack of data for that period at the ARB site. All other data are from the ARB monitoring site.
Table 18. Summary of 2006 weather data for Parlier, CA.
Minimum Maximum Average
Wind Speed (m/s) <0.5 19 2.1 Wind Speed (mph) <1 43 4.6
44
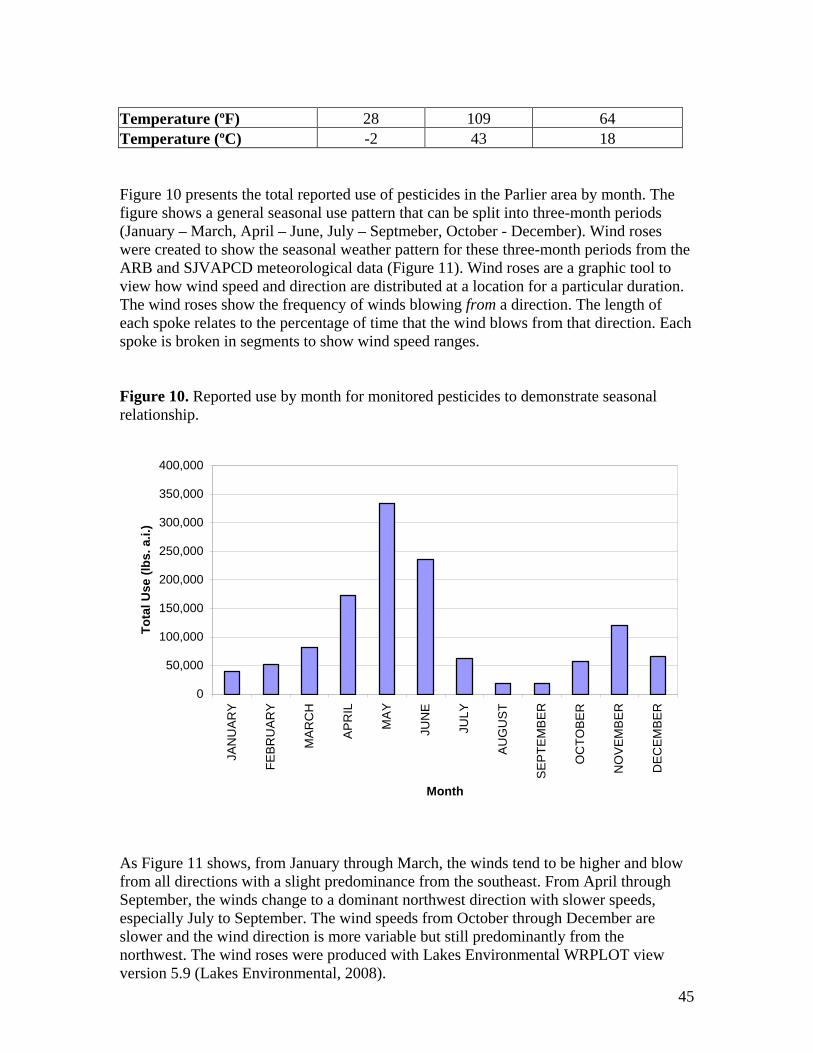
Temperature (ºF) 28 109 64 Temperature (ºC) -2 43 18
Figure 10 presents the total reported use of pesticides in the Parlier area by month. The figure shows a general seasonal use pattern that can be split into three-month periods (January – March, April – June, July – Septmeber, October - December). Wind roses were created to show the seasonal weather pattern for these three-month periods from the ARB and SJVAPCD meteorological data (Figure 11). Wind roses are a graphic tool to view how wind speed and direction are distributed at a location for a particular duration. The wind roses show the frequency of winds blowing from a direction. The length of each spoke relates to the percentage of time that the wind blows from that direction. Each spoke is broken in segments to show wind speed ranges.
Figure 10. Reported use by month for monitored pesticides to demonstrate seasonal relationship.
0
50,000
100,000
150,000
200,000
250,000
300,000
350,000
400,000
Tota
l Use
(lbs
. a.i.
)
JAN
UA
RY
FEB
RU
AR
Y
MA
RC
H
AP
RIL
MA
Y
JUN
E
JULY
AU
GU
ST
SE
PTE
MB
ER
OC
TOB
ER
NO
VE
MB
ER
DE
CE
MB
ER
Month
As Figure 11 shows, from January through March, the winds tend to be higher and blow from all directions with a slight predominance from the southeast. From April through September, the winds change to a dominant northwest direction with slower speeds, especially July to September. The wind speeds from October through December are slower and the wind direction is more variable but still predominantly from the northwest. The wind roses were produced with Lakes Environmental WRPLOT view version 5.9 (Lakes Environmental, 2008).
45

46
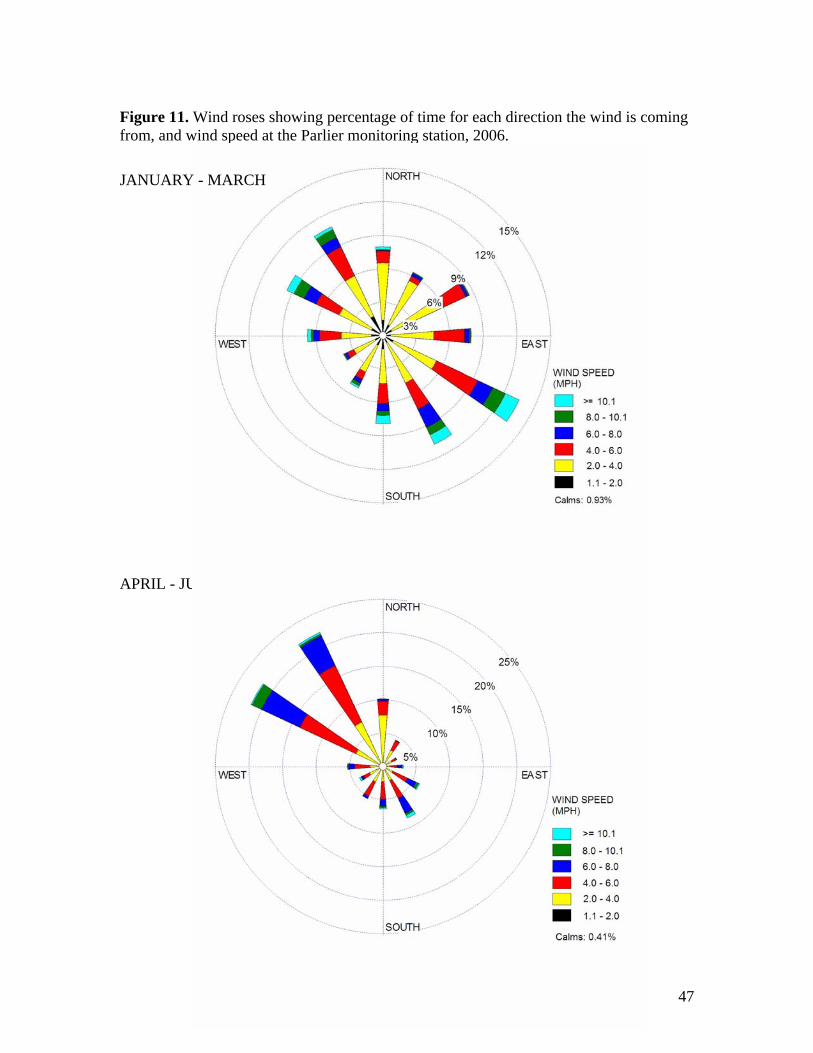
Figure 11. Wind roses showing percentage of time for each direction the wind is coming from, and wind speed at the Parlier monitoring station, 2006.
APRIL - JUNE
JANUARY - MARCH
47
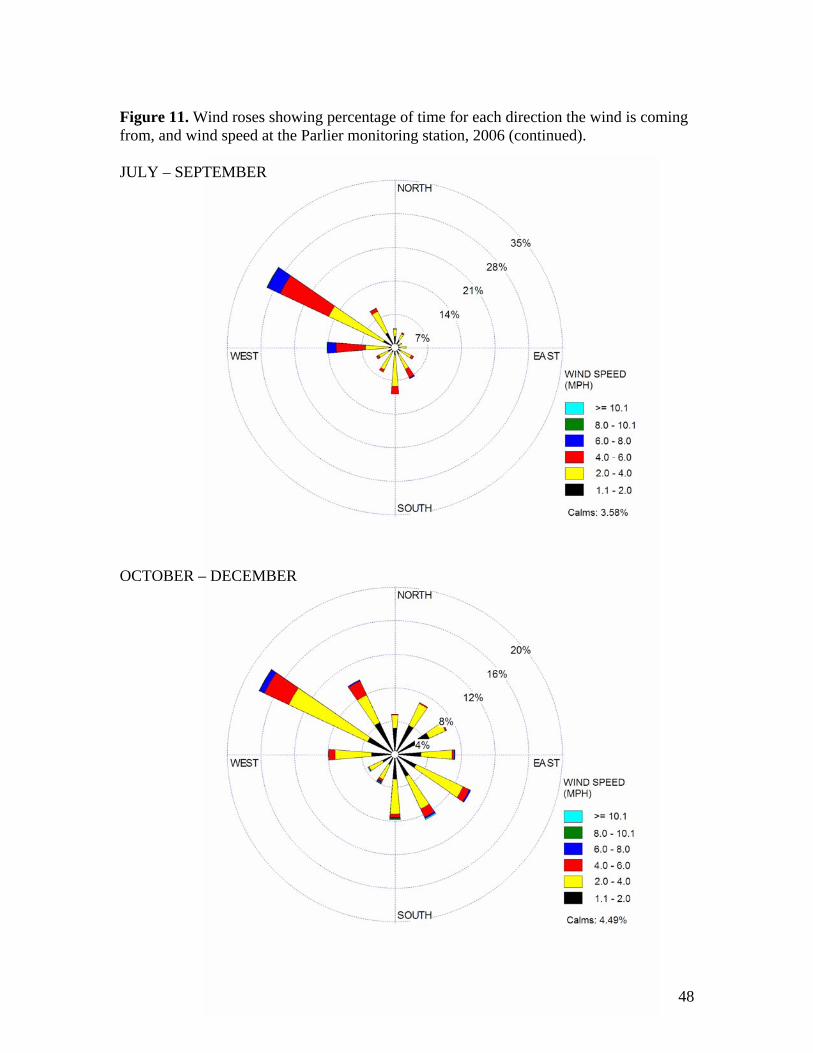
Figure 11. Wind roses showing percentage of time for each direction the wind is coming from, and wind speed at the Parlier monitoring station, 2006 (continued).
JULY – SEPTEMBER
OCTOBER – DECEMBER
48
Health Evaluation of Measured Air Concentrations
As discussed earlier in this report, the potential health risk of a chemical(s) in air is a function of both the inherent toxicity of the chemical(s) as well as the level of exposure to the chemical(s). The potential risk of the measured concentrations of pesticides in Parlier air can be evaluated by comparing the air concentration measured over a specified time (e.g., 24 hours, 14 days, 1 year) with the screening level derived for a similar exposure (i.e., acute, subchronic, chronic). The screening levels were previously set for the study (as described in the protocol and Appendices A and E), and underwent public discussion and comment. Those levels were used for this evaluation.
The ratio of measured air concentration of a pesticide to a reference concentration or screening level for that pesticide is called the hazard quotient (HQ). In this case,
Air Concentration Detected (ng/m3) Hazard Quotient = ----------------------------------------------
Screening Level (ng/m3)
If the HQ is greater than 1, then the air concentration exceeds the screening level. Again, these are screening levels, not action levels or regulatory standards. While a measured air concentration above a screening level does not necessarily indicate a significant health concern, it does indicate the need for further and more refined evaluation.
Chemicals may exhibit toxic effects independently, or they may interact in an additive, synergistic, or antagonistic manner. The risk from multiple pesticides (cumulative risk) was evaluated using the hazard index (HI) approach, by adding the HQs for the pesticides that can be appropriately grouped according to mechanism or site of toxicity.
HI = HQ1 (pesticide 1) + HQ2 (pesticide 2) + HQ3 (pesticide 3) + … (and so forth)
This approach assumes that toxicity and risk of monitored pesticides that are grouped according to similar mechanism or site of toxicity are additive, although only a subset of the monitored pesticides are known to act in an additive manner (including organophosphate insecticides and oxygen analog breakdown products toxic to the nervous system). As with the HQ, an HI greater than 1 indicates the need for further evaluation. If an HQ for one pesticide is greater than 1, the HI for the same period will be greater than 1, since the HQs are added together. The HI is most useful when individual HQs are less than 1. However, if the HI is greater than 1, this indicates that the cumulative toxicity of the multiple pesticides should be further evaluated and that potential health impacts may have been missed by only considering the pesticides individually. For some organophosphate pesticides monitored, both the parent pesticide as well as the oxon breakdown product were listed in tables and figures separately. In these cases, the parent and the breakdown product are considered together to evaluate risk.
49
DPR evaluated potential health effects for acute, subchronic and chronic exposure, and for carcinogenic potential. These evaluations are presented below.
Acute Exposure
To evaluate the potential health risk of exposure to the individual monitored pesticide, the highest 24-hour concentration at any site was used. The relative acute health risk of all the chemicals monitored likely to be present because of pesticidal use was dominated by chlorpyrifos and diazinon (Figure 12).
Chlorpyrifos: The insecticide chlorpyrifos or its breakdown product were detected in 64 percent of the samples. No sample was above the screening level. For comparison, if the federal Food Quality Protection Act (FQPA) 10-fold chlorpyrifos safety factor were applied to the acute screening level, it would have lowered it by a factor of 10 (see Health Evaluation Section). If that were done, as can be seen from the “FQPA-Adjusted HQ” column in Table 19, the acute HQ for chlorpyrifos and its oxon would be greater than 1. In this latter case, 6 samples out of 468 would be above the screening level. In addition to the measured concentrations, the frequency of chlorpyrifos detections is also of interest, since it was found in 64 percent of the samples.
Diazinon: As can be seen from the “Acute HQ” column in Table 19, the acute HQ for diazinon is greater than 1, making diazinon the only monitored pesticide that exceeded its acute screening level due to pesticidal use. One sample (out of 468) had a concentration of diazinon above the acute screening level. [Note: the screening level for diazinon is especially health-protective. The U.S. EPA recommended (in its diazinon RED) that the results of a 21-day animal inhalation study be used to assess human inhalation exposures for all time periods (i.e., for short-term, medium-term, and long-term exposures), since this was the only available inhalation study. Typically, acceptable exposure levels for one day are higher than acceptable exposure levels over longer periods.]
Chlorpyrifos and diazinon: These compounds are in the same chemical family (organophosphates) and have the same mechanism of toxicity in the nervous system— they both inhibit the enzyme acetylcholinesterase (an enzyme necessary for proper nerve function) and are appropriately added together to calculate cumulative risk. The FQPA 10-fold safety factor for chlorpyrifos is based on the potential for chlorpyrifos to cause abnormal nerve development. It has been postulated (U.S. EPA, 2007) that this effect is due to a mechanism that is not directly related to the inhibition of the acetylcholinesterase enzyme and therefore different than EPA’s proposed mechanism of action for diazinon. If this were the case, the HQ for chlorpyrifos incorporating the 10-fold factor would not be used in calculations of cumulative risk for effects resulting from the inhibition of acetylcholinesterase. In this evaluation, the HI is calculated both with and without the 10fold factor. Other cholinesterase pesticides were detected; however, they were found at levels so low as to be inconsequential when considered either singly or cumulatively, compared to chlorpyrifos and diazinon. Figure 13 illustrates the HIs. In one instance, the HI was greater than 1 due to the diazinon peak that was above the screening level. In addition, another HI was close to 1 because of a high diazinon concentration. When the 10-fold FQPA factor for chlorpyrifos was applied to the chlorpyrifos screening level, 13
50
HIs equal or are greater than 1. Again, one of these is because of the single diazinon level above the screening level. Six of the HIs were greater than 1 due to the chlorpyrifos concentrations exceeding the FQPA safety factor adjusted screening level. Six of the HIs were greater than 1 due to the combined impacts of the diazinon and chlorpyrifos concentrations. In addition, a number of HIs were less than 1, but still of some significance.
Acrolein: Acrolein was detected frequently; however, there were no reported pesticidal uses. Its presence was almost certainly due to non-pesticidal sources such as vehicle emissions, since acrolein is a byproduct of combustion. The acrolein concentrations measured were similar to those typically found in other areas of the state and country. Regardless, the acute acrolein concentrations were as much as 23-fold greater than the screening levels. These screening levels were set based on RELs (acute 1 hour – 190 ng/m3; subchronic - 180 ug/m3; chronic – 60 ng/m3) set by OEHHA as part of the Air Toxics Hotspots Program. Amended RELs (acute 8 hour – 700 ng/m3; chronic – 350 ng/m3) for acrolein were proposed by OEHHA in 2008. While these RELs result in higher screening levels, the acute acrolein air concentrations still significantly exceeded the screening levels by as much as 6.4-fold and are of concern. The acrolein air concentrations would dominate any cumulative risk calculation.
Formaldehyde: Formaldehyde was detected in all samples; however, like acrolein, it is a byproduct of combustion and natural processes and has a number of industrial uses and sources. Since there were no reported pesticidal uses and no nearby dairy or poultry farms, its presence in air was clearly because of non-pesticidal sources. While the measured formaldehyde concentrations did not exceed the acute screening level, they did approach one-half of the screening level (HQ = 0.49).
Fumigants: The fumigants MITC, methyl bromide, and 1,3-dichloropropene were frequently detected; however, all the detections were well below the acute screening levels and not of acute health concern. All three of the fumigants have different mechanisms of toxicity; therefore, grouping them together for the calculation of a cumulative risk value is not appropriate.
Subchronic Exposure
To calculate the subchronic HQ of exposure for individual pesticides, a rolling average concentration for every two-week period was calculated for all of the sampling sites and days. Table 20 lists the highest two-week average. As a result, only pesticides monitored by DPR (three times per week three sites) are included in these calculations. The relative subchronic health risk was dominated by chlorpyrifos (Figure 12).
Chlorpyrifos: No two-week average concentrations for chlorpyrifos and its oxon were above the subchronic screening levels (i.e., no HQs were greater than 1). However, if the FQPA 10-fold safety factor were applied to the subchronic screening level for chlorpyrifos, it would be lowered by a factor of 10 (see Health Evaluation Section). If that were done, as can be seen from the “FQPA-Adjusted HQ” column in Table 20, a subchronic HQ for chlorpyrifos and its oxon would be greater than 1 (measured
51
concentrations greater than the screening level). Hazard quotients would be greater than 1 for 2 overlapping 2-week periods in January. In addition, another 4 HQs would approach 1.
Diazinon: As can be seen from the “Subchronic HQ” column in Table 20, the subchronic HQs for diazinon and for diazinon plus its oxon are less than 1, in contrast to the acute HQs. However, the values are still of concern (highest HQ value is approximately 0.26), giving the largest HQ of all the measured pesticides, with the exception of the previously described FQPA-adjusted HQs for chlorpyrifos.
Chlorpyrifos and diazinon: As was done in the evaluation of acute exposure, the cumulative risk of chlorpyrifos and diazinon is evaluated using a HI approach. The HI is calculated both with and without the FQPA 10-fold factor for chlorpyrifos. While other cholinesterase pesticides were detected, they were found at concentrations so low as to be inconsequential when considered either singly or cumulatively, compared to chlorpyrifos and diazinon. Figure 13 illustrates the HIs. None of the HIs for diazinon plus chlorpyrifos are greater than 1. However, when the 10-fold FQPA factor for chlorpyrifos is applied to the chlorpyrifos screening level, 1 of the resulting HIs is above 1, and several others approach 1.
MITC: While the subchronic HQs for MITC are all well below 1 (Table 20), they are still worthy of note since its HQ is higher than many of the others and MITC was found in 84 percent of the samples.
Chronic Exposure
The one-year average of all the sampling sites and days was used to calculate the chronic air concentrations (and resulting HQs) for individual pesticides. The one-per-week samples collected by ARB result in sufficient data points for the calculation of chronic air concentrations and are included in this evaluation of chronic exposure. Figure 12 shows the relative chronic health risk of all the chemicals monitored that were likely because of pesticidal use.
Compounds present because of pesticidal uses: As can be seen from Table 21, all of the one-year average concentrations of pesticides were below the corresponding chronic screening levels. Thus, all of the chronic HQs for these pesticides were less than 1. In fact, almost all of the chronic HQs were substantially less than one—10 times less than 1. Exceptions were the HQ for MITC, which was 0.13 (slightly less than 10-fold below the screening level) and the HQ for chlorpyrifos plus chlorpyrifos oxon, calculated using the additional FQPA safety factor for chlorpyrifos. In this latter case, the chronic average air level for chlorpyrifos plus chlorpyrifos oxon is about one-half of the screening level (HQ = 0.51).
Acrolein and formaldehyde: As previously discussed, both of these compounds are byproducts of combustion and natural processes and have a number of industrial uses and sources. Their presence in the air is because of activities that do not involve pesticidal use; their concentrations are similar to those found in ambient air elsewhere in the state.
52
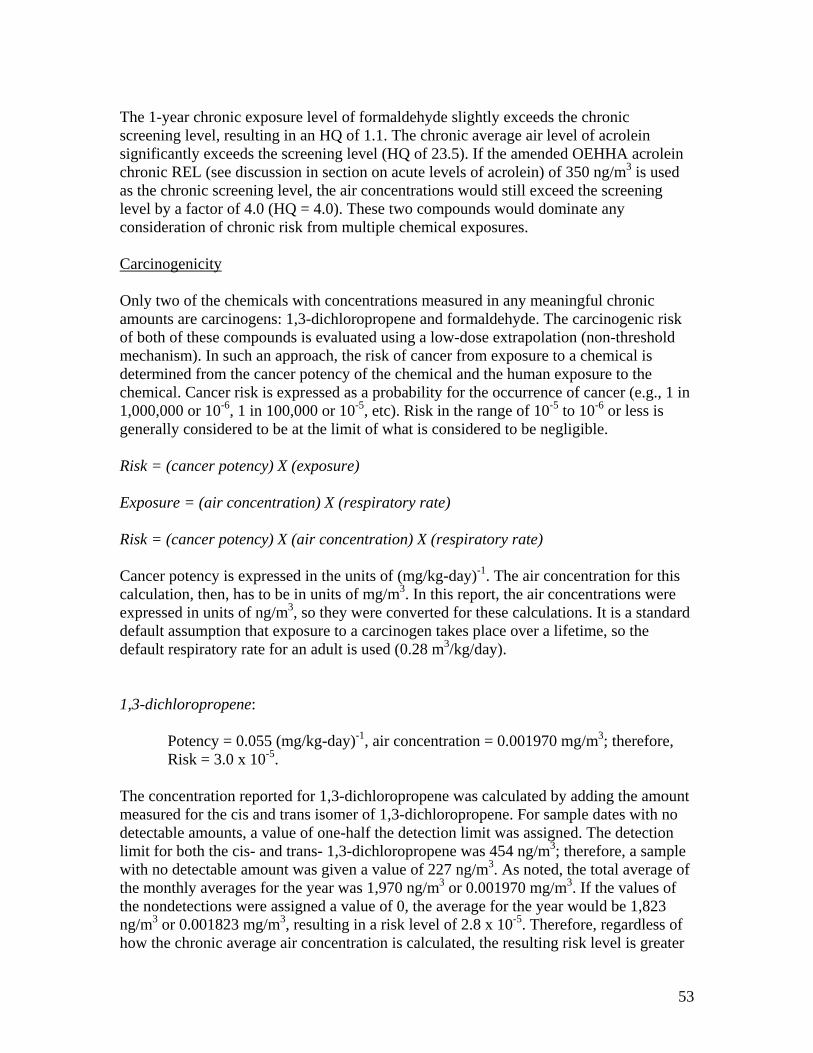
The 1-year chronic exposure level of formaldehyde slightly exceeds the chronic screening level, resulting in an HQ of 1.1. The chronic average air level of acrolein significantly exceeds the screening level (HQ of 23.5). If the amended OEHHA acrolein chronic REL (see discussion in section on acute levels of acrolein) of 350 ng/m3 is used as the chronic screening level, the air concentrations would still exceed the screening level by a factor of 4.0 (HQ = 4.0). These two compounds would dominate any consideration of chronic risk from multiple chemical exposures.
Carcinogenicity
Only two of the chemicals with concentrations measured in any meaningful chronic amounts are carcinogens: 1,3-dichloropropene and formaldehyde. The carcinogenic risk of both of these compounds is evaluated using a low-dose extrapolation (non-threshold mechanism). In such an approach, the risk of cancer from exposure to a chemical is determined from the cancer potency of the chemical and the human exposure to the chemical. Cancer risk is expressed as a probability for the occurrence of cancer (e.g., 1 in 1,000,000 or 10-6, 1 in 100,000 or 10-5, etc). Risk in the range of 10-5 to 10-6 or less is generally considered to be at the limit of what is considered to be negligible.
Risk = (cancer potency) X (exposure)
Exposure = (air concentration) X (respiratory rate)
Risk = (cancer potency) X (air concentration) X (respiratory rate)
Cancer potency is expressed in the units of (mg/kg-day)-1. The air concentration for this calculation, then, has to be in units of mg/m3. In this report, the air concentrations were expressed in units of ng/m3, so they were converted for these calculations. It is a standard default assumption that exposure to a carcinogen takes place over a lifetime, so the default respiratory rate for an adult is used (0.28 m3/kg/day).
1,3-dichloropropene:
Potency = 0.055 (mg/kg-day)-1, air concentration = 0.001970 mg/m3; therefore, Risk = 3.0 x 10⁻⁵.
The concentration reported for 1,3-dichloropropene was calculated by adding the amount measured for the cis and trans isomer of 1,3-dichloropropene. For sample dates with no detectable amounts, a value of one-half the detection limit was assigned. The detection limit for both the cis- and trans- 1,3-dichloropropene was 454 ng/m3; therefore, a sample with no detectable amount was given a value of 227 ng/m3. As noted, the total average of the monthly averages for the year was 1,970 ng/m3 or 0.001970 mg/m3. If the values of the nondetections were assigned a value of 0, the average for the year would be 1,823 ng/m3 or 0.001823 mg/m3, resulting in a risk level of 2.8 x 10⁻⁵. Therefore, regardless of how the chronic average air concentration is calculated, the resulting risk level is greater
53
than the range of what would normally be considered negligible and merits further evaluation.
Formaldehyde:
Potency = 0.021 (mg/kg-day)-1, air concentration = 0.003256 mg/m3; therefore, Risk = 1.9 x 10⁻⁵.
This risk level is also greater than the range of what normally would be considered negligible. One approach to evaluating the cumulative risk from exposure to non-threshold carcinogens is to add the respective cancer risks. If this were done for formaldehyde and 1,3-dichloropropropene, the resulting risk would be:
3.0 x 10⁻⁵ + 1.9 x 10-5 = 4.9 X 10⁻⁵.
54
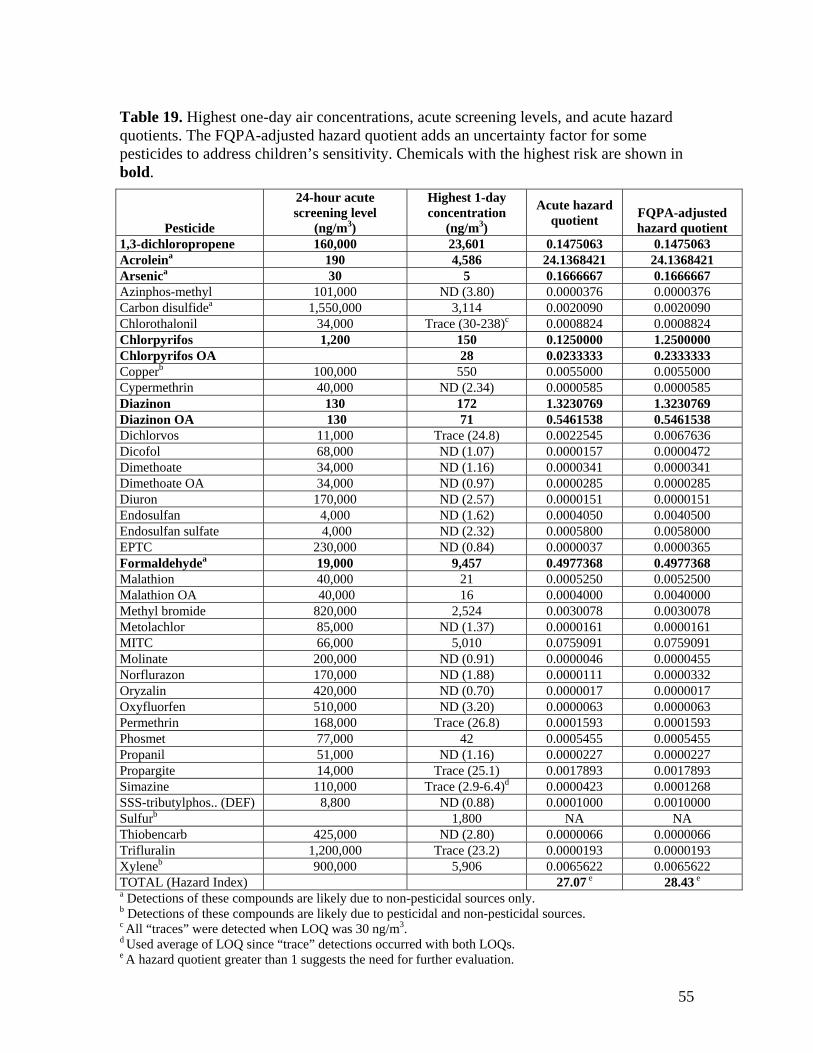
Table 19. Highest one-day air concentrations, acute screening levels, and acute hazard quotients. The FQPA-adjusted hazard quotient adds an uncertainty factor for some pesticides to address children’s sensitivity. Chemicals with the highest risk are shown in bold.
Pesticide
24-hour acute screening level
(ng/m3)
Highest 1-day concentration
(ng/m3)
Acute hazard quotient FQPA-adjusted
hazard quotient 1,3-dichloropropene 160,000 23,601 0.1475063 0.1475063 Acroleina 190 4,586 24.1368421 24.1368421 Arsenica 30 5 0.1666667 0.1666667 Azinphos-methyl 101,000 ND (3.80) 0.0000376 0.0000376 Carbon disulfidea 1,550,000 3,114 0.0020090 0.0020090 Chlorothalonil 34,000 Trace (30-238)c 0.0008824 0.0008824 Chlorpyrifos 1,200 150 0.1250000 1.2500000 Chlorpyrifos OA 28 0.0233333 0.2333333 Copperb 100,000 550 0.0055000 0.0055000 Cypermethrin 40,000 ND (2.34) 0.0000585 0.0000585 Diazinon 130 172 1.3230769 1.3230769 Diazinon OA 130 71 0.5461538 0.5461538 Dichlorvos 11,000 Trace (24.8) 0.0022545 0.0067636 Dicofol 68,000 ND (1.07) 0.0000157 0.0000472 Dimethoate 34,000 ND (1.16) 0.0000341 0.0000341 Dimethoate OA 34,000 ND (0.97) 0.0000285 0.0000285 Diuron 170,000 ND (2.57) 0.0000151 0.0000151 Endosulfan 4,000 ND (1.62) 0.0004050 0.0040500 Endosulfan sulfate 4,000 ND (2.32) 0.0005800 0.0058000 EPTC 230,000 ND (0.84) 0.0000037 0.0000365 Formaldehydea 19,000 9,457 0.4977368 0.4977368 Malathion 40,000 21 0.0005250 0.0052500 Malathion OA 40,000 16 0.0004000 0.0040000 Methyl bromide 820,000 2,524 0.0030078 0.0030078 Metolachlor 85,000 ND (1.37) 0.0000161 0.0000161 MITC 66,000 5,010 0.0759091 0.0759091 Molinate 200,000 ND (0.91) 0.0000046 0.0000455 Norflurazon 170,000 ND (1.88) 0.0000111 0.0000332 Oryzalin 420,000 ND (0.70) 0.0000017 0.0000017 Oxyfluorfen 510,000 ND (3.20) 0.0000063 0.0000063 Permethrin 168,000 Trace (26.8) 0.0001593 0.0001593 Phosmet 77,000 42 0.0005455 0.0005455 Propanil 51,000 ND (1.16) 0.0000227 0.0000227 Propargite 14,000 Trace (25.1) 0.0017893 0.0017893 Simazine 110,000 Trace (2.9-6.4)d 0.0000423 0.0001268 SSS-tributylphos.. (DEF) 8,800 ND (0.88) 0.0001000 0.0010000 Sulfurb 1,800 NA NA Thiobencarb 425,000 ND (2.80) 0.0000066 0.0000066 Trifluralin 1,200,000 Trace (23.2) 0.0000193 0.0000193 Xyleneb 900,000 5,906 0.0065622 0.0065622 TOTAL (Hazard Index) 27.07 e 28.43 e
a Detections of these compounds are likely due to non-pesticidal sources only. b Detections of these compounds are likely due to pesticidal and non-pesticidal sources. c All “traces” were detected when LOQ was 30 ng/m3. d Used average of LOQ since “trace” detections occurred with both LOQs. e A hazard quotient greater than 1 suggests the need for further evaluation.
55
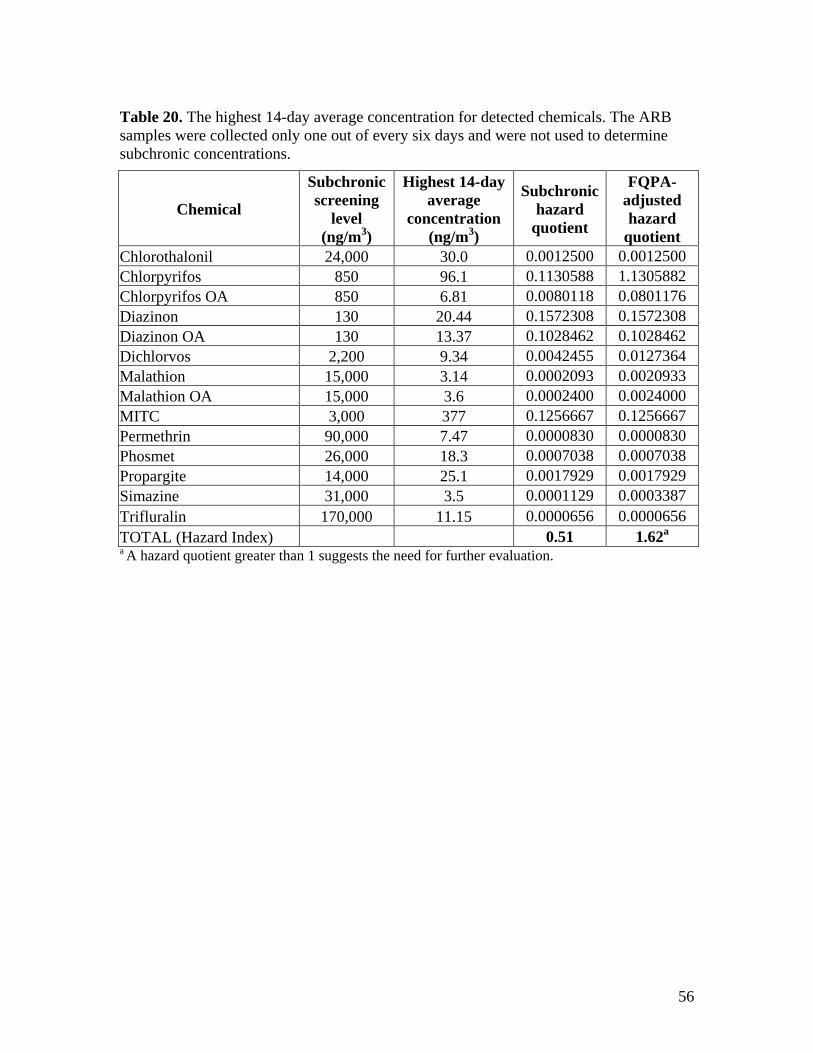
Table 20. The highest 14-day average concentration for detected chemicals. The ARB samples were collected only one out of every six days and were not used to determine subchronic concentrations.
Chemical
Subchronic screening
level (ng/m3)
Highest 14-day average
concentration (ng/m3)
Subchronic hazard
quotient
FQPA-adjusted hazard
quotient Chlorothalonil 24,000 30.0 0.0012500 0.0012500 Chlorpyrifos 850 96.1 0.1130588 1.1305882 Chlorpyrifos OA 850 6.81 0.0080118 0.0801176 Diazinon 130 20.44 0.1572308 0.1572308 Diazinon OA 130 13.37 0.1028462 0.1028462 Dichlorvos 2,200 9.34 0.0042455 0.0127364 Malathion 15,000 3.14 0.0002093 0.0020933 Malathion OA 15,000 3.6 0.0002400 0.0024000 MITC 3,000 377 0.1256667 0.1256667 Permethrin 90,000 7.47 0.0000830 0.0000830 Phosmet 26,000 18.3 0.0007038 0.0007038 Propargite 14,000 25.1 0.0017929 0.0017929 Simazine 31,000 3.5 0.0001129 0.0003387 Trifluralin 170,000 11.15 0.0000656 0.0000656 TOTAL (Hazard Index) 0.51 1.62a
a A hazard quotient greater than 1 suggests the need for further evaluation.
56
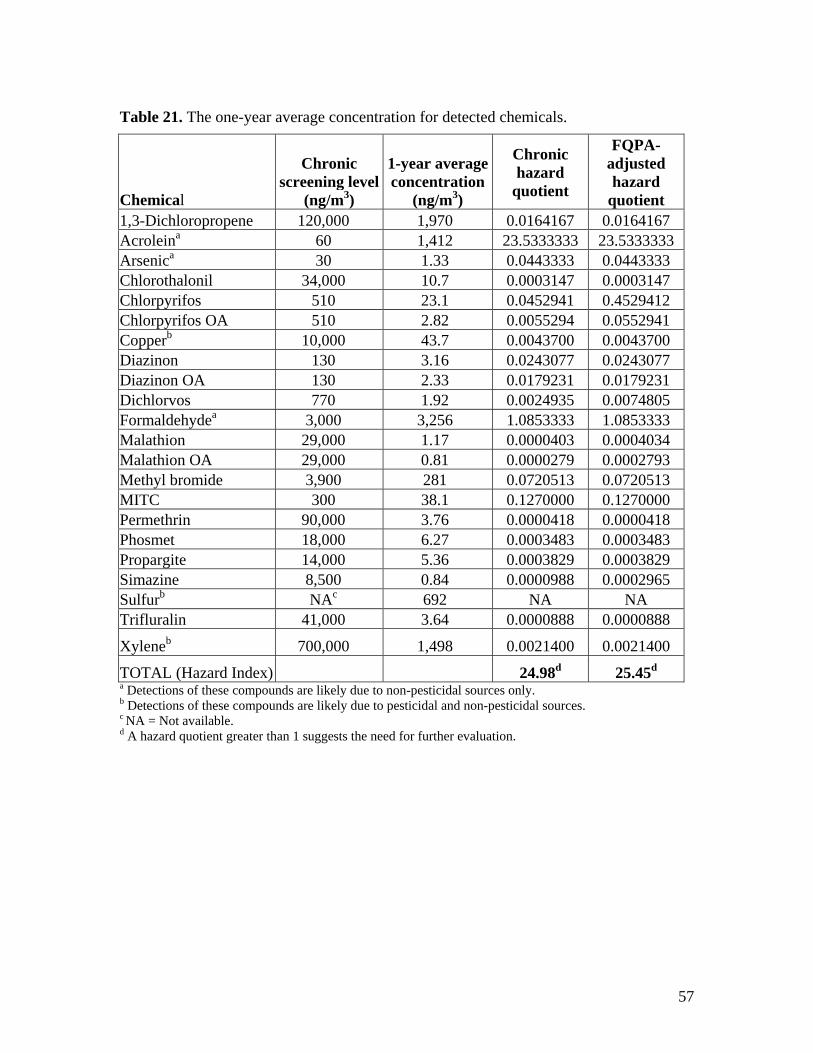
Table 21. The one-year average concentration for detected chemicals.
Chemical
Chronic screening level
(ng/m3)
1-year average concentration
(ng/m3)
Chronic hazard
quotient
FQPA-adjusted hazard
quotient 1,3-Dichloropropene 120,000 1,970 0.0164167 0.0164167 Acroleina 60 1,412 23.5333333 23.5333333 Arsenica 30 1.33 0.0443333 0.0443333 Chlorothalonil 34,000 10.7 0.0003147 0.0003147 Chlorpyrifos 510 23.1 0.0452941 0.4529412 Chlorpyrifos OA 510 2.82 0.0055294 0.0552941 Copperb 10,000 43.7 0.0043700 0.0043700 Diazinon 130 3.16 0.0243077 0.0243077 Diazinon OA 130 2.33 0.0179231 0.0179231 Dichlorvos 770 1.92 0.0024935 0.0074805 Formaldehydea 3,000 3,256 1.0853333 1.0853333 Malathion 29,000 1.17 0.0000403 0.0004034 Malathion OA 29,000 0.81 0.0000279 0.0002793 Methyl bromide 3,900 281 0.0720513 0.0720513 MITC 300 38.1 0.1270000 0.1270000 Permethrin 90,000 3.76 0.0000418 0.0000418 Phosmet 18,000 6.27 0.0003483 0.0003483 Propargite 14,000 5.36 0.0003829 0.0003829 Simazine 8,500 0.84 0.0000988 0.0002965 Sulfurb NAc 692 NA NA Trifluralin 41,000 3.64 0.0000888 0.0000888
Xyleneb 700,000 1,498 0.0021400 0.0021400
TOTAL (Hazard Index) 24.98d 25.45d
a Detections of these compounds are likely due to non-pesticidal sources only. b Detections of these compounds are likely due to pesticidal and non-pesticidal sources. c NA = Not available. d A hazard quotient greater than 1 suggests the need for further evaluation.
57
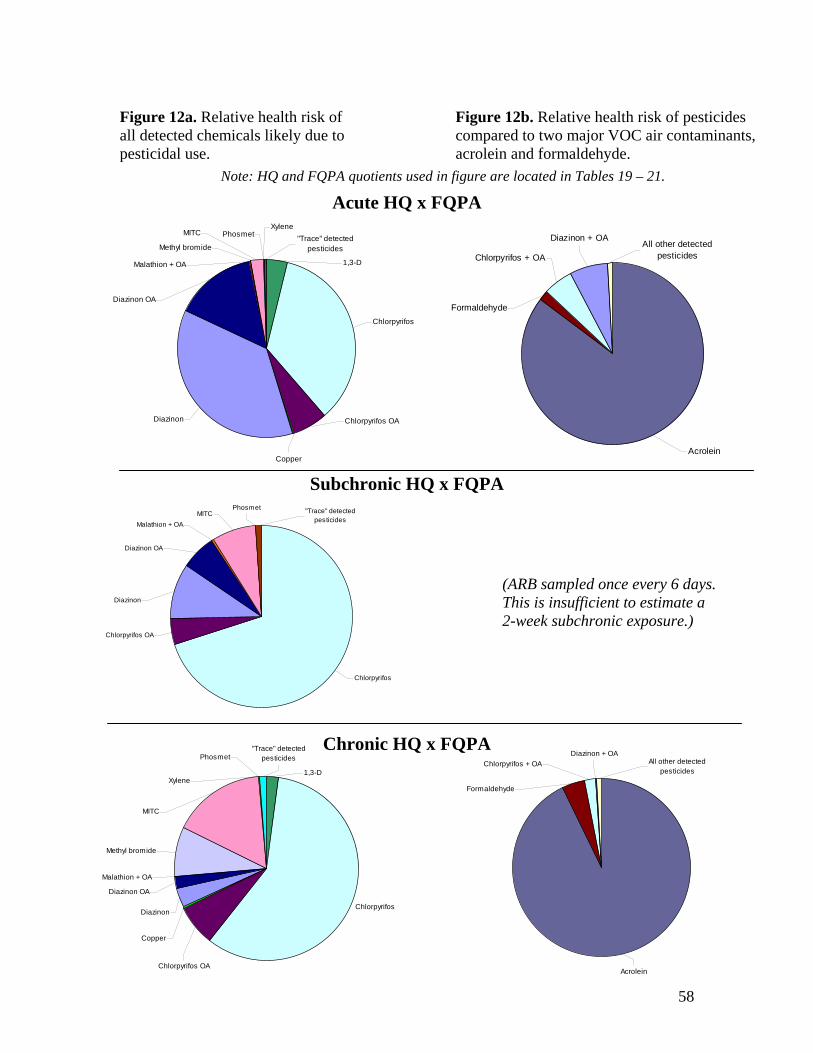
Figure 12a. Relative health risk of Figure 12b. Relative health risk of pesticides all detected chemicals likely due to compared to two major VOC air contaminants, pesticidal use. acrolein and formaldehyde.
Note: HQ and FQPA quotients used in figure are located in Tables 19 – 21.
Acute HQ x FQPA
Diazinon
Xylene Phosmet MITC
Methyl bromide "Trace" detected
pesticides
1,3-D Malathion + OA
Diazinon + OA All other detected
Chlorpyrifos + OA pesticides
Diazinon OA Formaldehyde
Chlorpyrifos
Chlorpyrifos OA
Acrolein Copper
Subchronic HQ x FQPA Phosmet
(ARB sampled once every 6 days. This is insufficient to estimate a 2-week subchronic exposure.)
Chlorpyrifos
Chlorpyrifos OA
Diazinon
Diazinon OA
MITC Malathion + OA
"Trace" detected pesticides
Chronic HQ x FQPA Diazinon + OA
"Trace" detected Phosmet
MITC
Copper
1,3-D
pesticides
Xylene
Diazinon
Chlorpyrifos + OA All other detected pesticides
Formaldehyde
Methyl bromide
Malathion + OA
Diazinon OA
Chlorpyrifos
Chlorpyrifos OA Acrolein
58
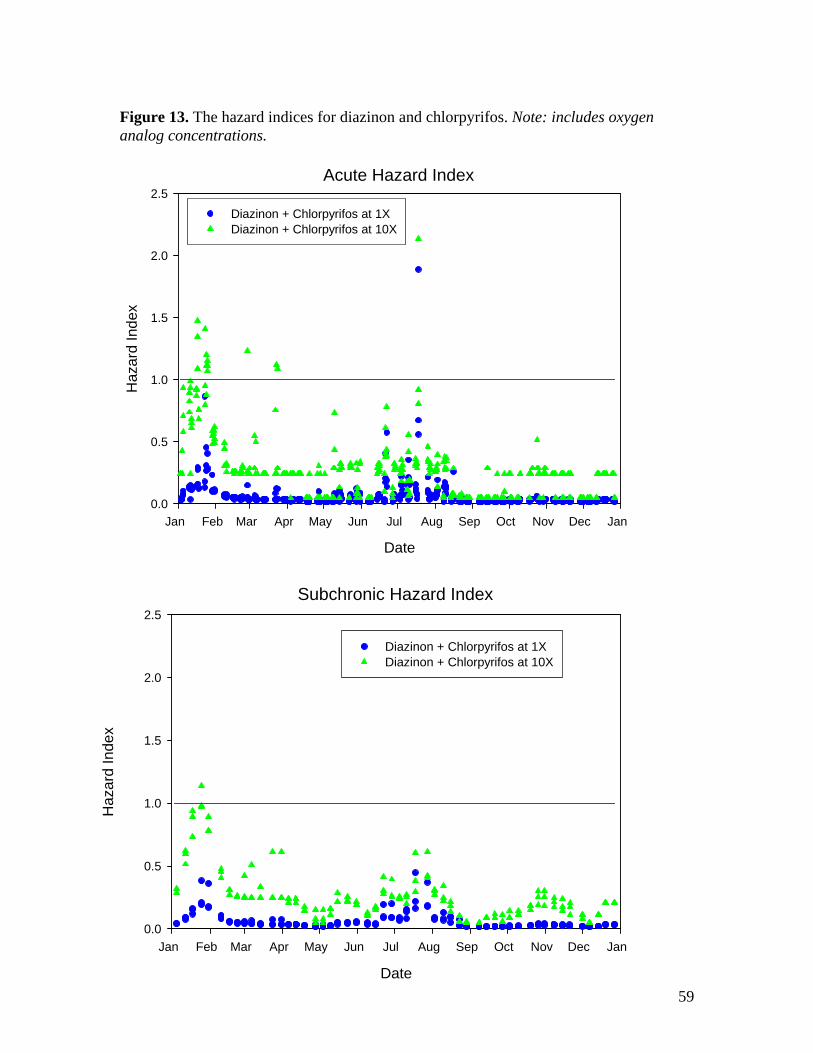
Haz
ard
Inde
x Figure 13. The hazard indices for diazinon and chlorpyrifos. Note: includes oxygen analog concentrations.
Acute Hazard Index 2.5
Diazinon + Chlorpyrifos at 1X Diazinon + Chlorpyrifos at 10X
2.0
Haz
ard
Inde
x
1.5
1.0
0.5
Jan 0.0
Feb Mar Apr May Jun
Date
Jul Aug Sep Oct Nov Dec Jan
2.0
2.5 Subchroni
Diazinon + Chlorpyrifos at 1X Diazinon + Chlorpyrifos at 10X
c Hazard Index
1.5
1.0
0.5
Jan 0.0
Feb Mar Apr May Jun
Date
Jul Aug Sep Oct Nov Dec Jan
59
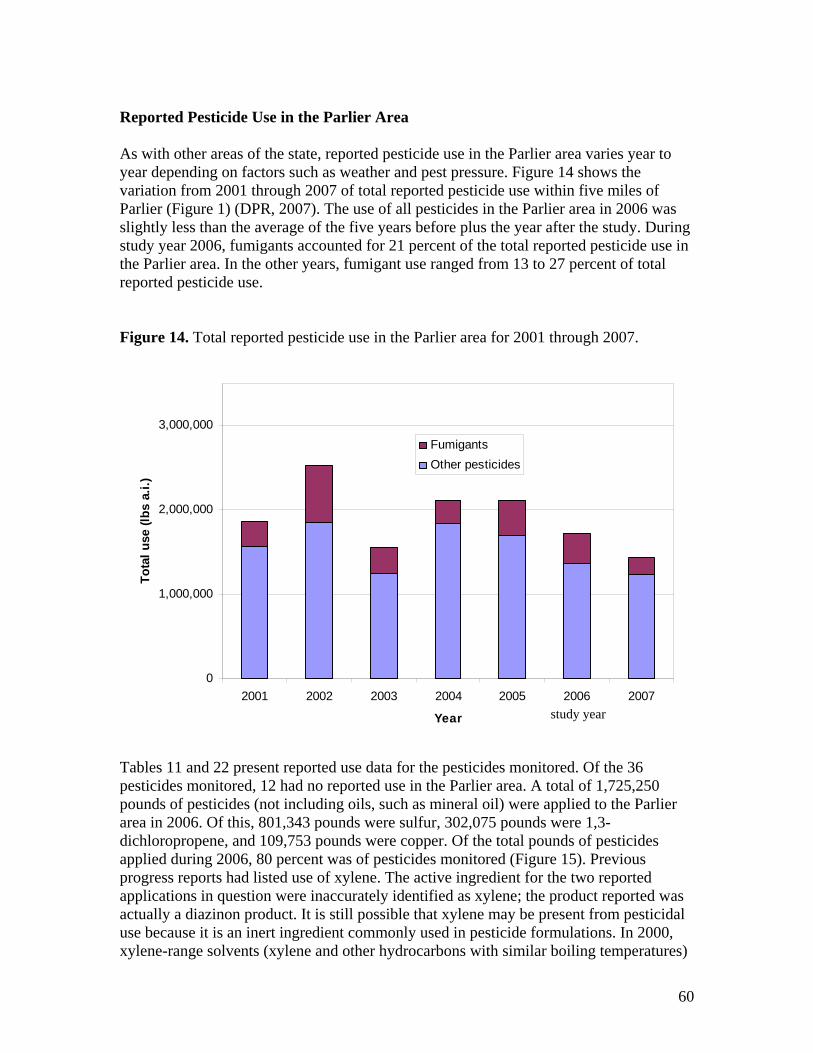
Reported Pesticide Use in the Parlier Area
As with other areas of the state, reported pesticide use in the Parlier area varies year to year depending on factors such as weather and pest pressure. Figure 14 shows the variation from 2001 through 2007 of total reported pesticide use within five miles of Parlier (Figure 1) (DPR, 2007). The use of all pesticides in the Parlier area in 2006 was slightly less than the average of the five years before plus the year after the study. During study year 2006, fumigants accounted for 21 percent of the total reported pesticide use in the Parlier area. In the other years, fumigant use ranged from 13 to 27 percent of total reported pesticide use.
Figure 14. Total reported pesticide use in the Parlier area for 2001 through 2007.
Tota
l use
(lbs
a.i.
)
3,000,000
2,000,000
1,000,000
0
study year
Tables 11 and 22 present reported use data for the pesticides monitored. Of the 36 pesticides monitored, 12 had no reported use in the Parlier area. A total of 1,725,250 pounds of pesticides (not including oils, such as mineral oil) were applied to the Parlier area in 2006. Of this, 801,343 pounds were sulfur, 302,075 pounds were 1,3dichloropropene, and 109,753 pounds were copper. Of the total pounds of pesticides applied during 2006, 80 percent was of pesticides monitored (Figure 15). Previous progress reports had listed use of xylene. The active ingredient for the two reported applications in question were inaccurately identified as xylene; the product reported was actually a diazinon product. It is still possible that xylene may be present from pesticidal use because it is an inert ingredient commonly used in pesticide formulations. In 2000, xylene-range solvents (xylene and other hydrocarbons with similar boiling temperatures)
2001 2002 2003 2004 2005 2006 2007
Year
Fumigants Other pesticides
60
made up 5 percent of the statewide VOC emissions from agricultural and structural pesticide products, the seventh highest active or inert ingredient in the state.
61
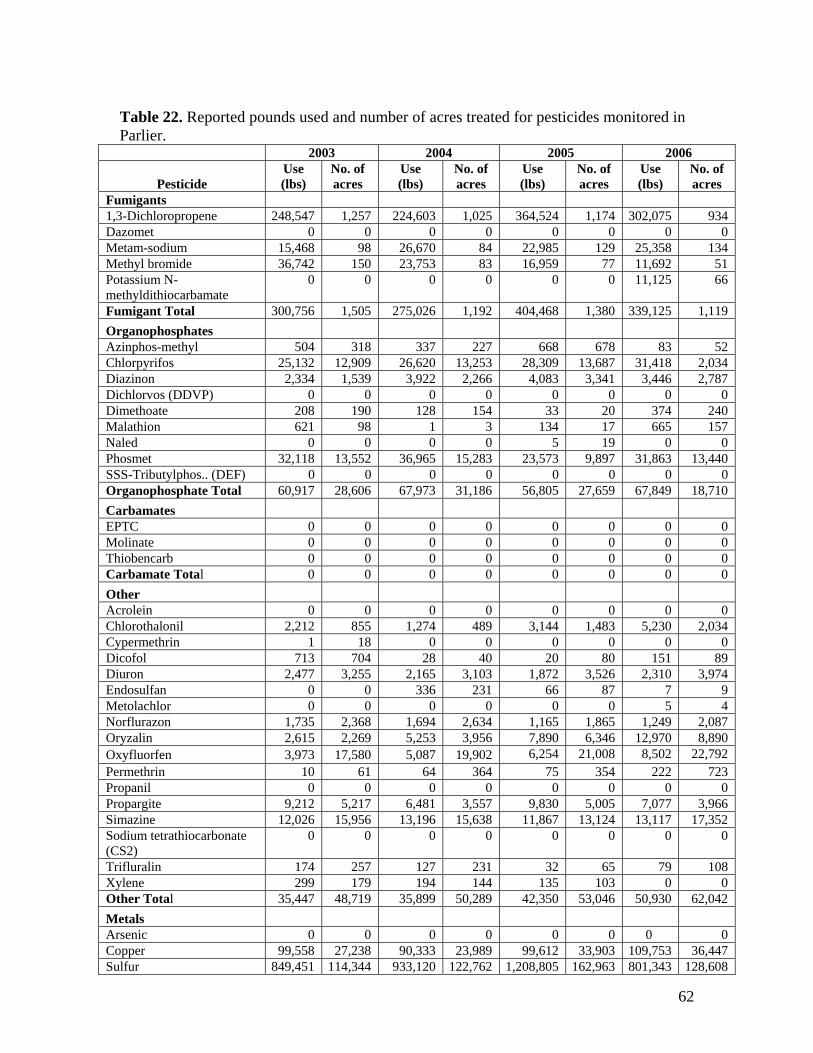
Table 22. Reported pounds used and number of acres treated for pesticides monitored in Parlier.
2003 2004 2005 2006
Pesticide Use (lbs)
No. of acres
Use (lbs)
No. of acres
Use (lbs)
No. of acres
Use (lbs)
No. of acres
Fumigants 1,3-Dichloropropene 248,547 1,257 224,603 1,025 364,524 1,174 302,075 934 Dazomet 0 0 0 0 0 0 0 0 Metam-sodium 15,468 98 26,670 84 22,985 129 25,358 134 Methyl bromide 36,742 150 23,753 83 16,959 77 11,692 51 Potassium Nmethyldithiocarbamate
0 0 0 0 0 0 11,125 66
Fumigant Total 300,756 1,505 275,026 1,192 404,468 1,380 339,125 1,119 Organophosphates Azinphos-methyl 504 318 337 227 668 678 83 52 Chlorpyrifos 25,132 12,909 26,620 13,253 28,309 13,687 31,418 2,034 Diazinon 2,334 1,539 3,922 2,266 4,083 3,341 3,446 2,787 Dichlorvos (DDVP) 0 0 0 0 0 0 0 0 Dimethoate 208 190 128 154 33 20 374 240 Malathion 621 98 1 3 134 17 665 157 Naled 0 0 0 0 5 19 0 0 Phosmet 32,118 13,552 36,965 15,283 23,573 9,897 31,863 13,440 SSS-Tributylphos.. (DEF) 0 0 0 0 0 0 0 0 Organophosphate Total 60,917 28,606 67,973 31,186 56,805 27,659 67,849 18,710 Carbamates EPTC 0 0 0 0 0 0 0 0 Molinate 0 0 0 0 0 0 0 0 Thiobencarb 0 0 0 0 0 0 0 0 Carbamate Total 0 0 0 0 0 0 0 0 Other Acrolein 0 0 0 0 0 0 0 0 Chlorothalonil 2,212 855 1,274 489 3,144 1,483 5,230 2,034 Cypermethrin 1 18 0 0 0 0 0 0 Dicofol 713 704 28 40 20 80 151 89 Diuron 2,477 3,255 2,165 3,103 1,872 3,526 2,310 3,974 Endosulfan 0 0 336 231 66 87 7 9 Metolachlor 0 0 0 0 0 0 5 4 Norflurazon 1,735 2,368 1,694 2,634 1,165 1,865 1,249 2,087 Oryzalin 2,615 2,269 5,253 3,956 7,890 6,346 12,970 8,890 Oxyfluorfen 3,973 17,580 5,087 19,902 6,254 21,008 8,502 22,792 Permethrin 10 61 64 364 75 354 222 723 Propanil 0 0 0 0 0 0 0 0 Propargite 9,212 5,217 6,481 3,557 9,830 5,005 7,077 3,966 Simazine 12,026 15,956 13,196 15,638 11,867 13,124 13,117 17,352 Sodium tetrathiocarbonate (CS2)
0 0 0 0 0 0 0 0
Trifluralin 174 257 127 231 32 65 79 108 Xylene 299 179 194 144 135 103 0 0 Other Total 35,447 48,719 35,899 50,289 42,350 53,046 50,930 62,042 Metals Arsenic 0 0 0 0 0 0 0 0 Copper 99,558 27,238 90,333 23,989 99,612 33,903 109,753 36,447 Sulfur 849,451 114,344 933,120 122,762 1,208,805 162,963 801,343 128,608
62
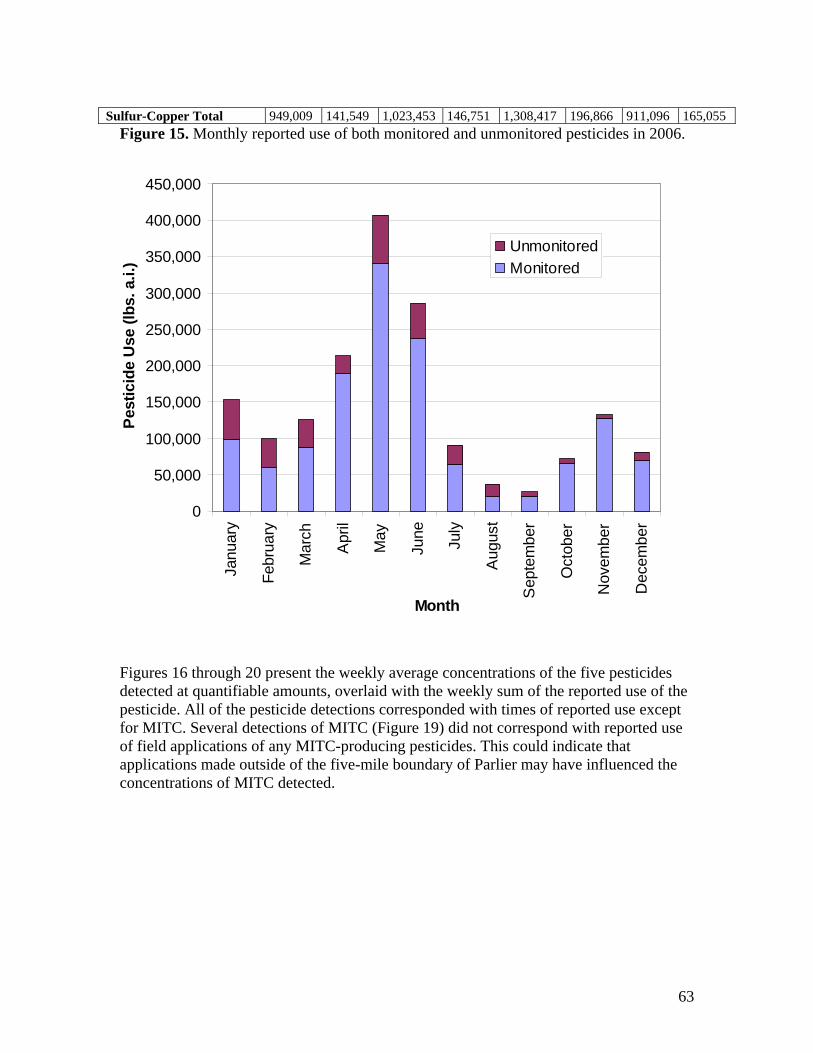
Sulfur-Copper Total 949,009 141,549 1,023,453 146,751 1,308,417 196,866 911,096 165,055 Figure 15. Monthly reported use of both monitored and unmonitored pesticides in 2006.
0
50,000
100,000
150,000
200,000
250,000
300,000
350,000
400,000
450,000
Pest
icid
e U
se (l
bs. a
.i.)
Unmonitored Monitored
Janu
ary
Febr
uary
Mar
ch
Apr
il
May
June
July
Aug
ust
Sep
tem
ber
Oct
ober
Nov
embe
r
Dec
embe
r
Month
Figures 16 through 20 present the weekly average concentrations of the five pesticides detected at quantifiable amounts, overlaid with the weekly sum of the reported use of the pesticide. All of the pesticide detections corresponded with times of reported use except for MITC. Several detections of MITC (Figure 19) did not correspond with reported use of field applications of any MITC-producing pesticides. This could indicate that applications made outside of the five-mile boundary of Parlier may have influenced the concentrations of MITC detected.
63
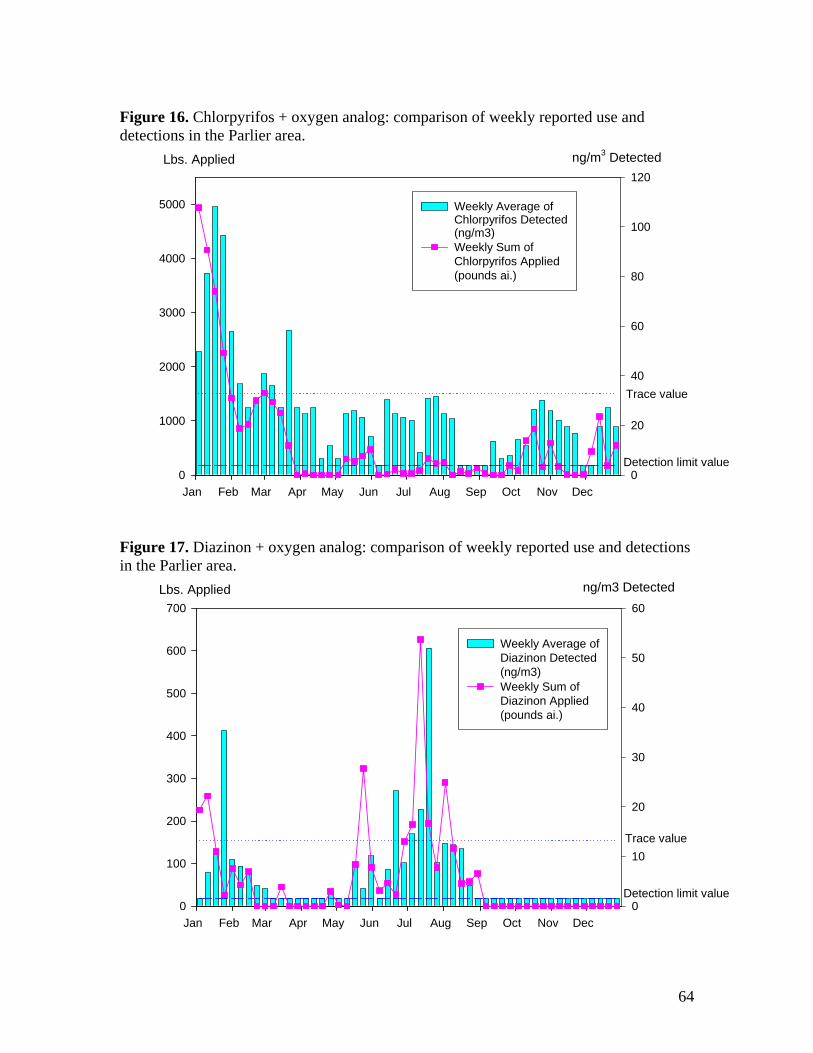
Figure 16. Chlorpyrifos + oxygen analog: comparison of weekly reported use and detections in the Parlier area.
Lbs. Applied ng/m3 Detected
Jan Feb Mar Apr May Jun Jul Aug Sep Oct Nov Dec
Figure 17. Diazinon + oxygen analog: comparison of weekly reported use and detections in the Parlier area.
Lbs. Applied ng/m3 Detected
Jan Feb Mar Apr May Jun Jul Aug Sep Oct Nov Dec
0
20
40
60
80
100
120
0
1000
2000
3000
4000
5000 Weekly Average of Chlorpyrifos Detected (ng/m3) Weekly Sum of Chlorpyrifos Applied (pounds ai.)
Trace value
Detection limit value
0
10
20
30
40
50
60
0
100
200
300
400
500
600
700
Weekly Average of Diazinon Detected (ng/m3) Weekly Sum of Diazinon Applied (pounds ai.)
Trace value
Detection limit value
64
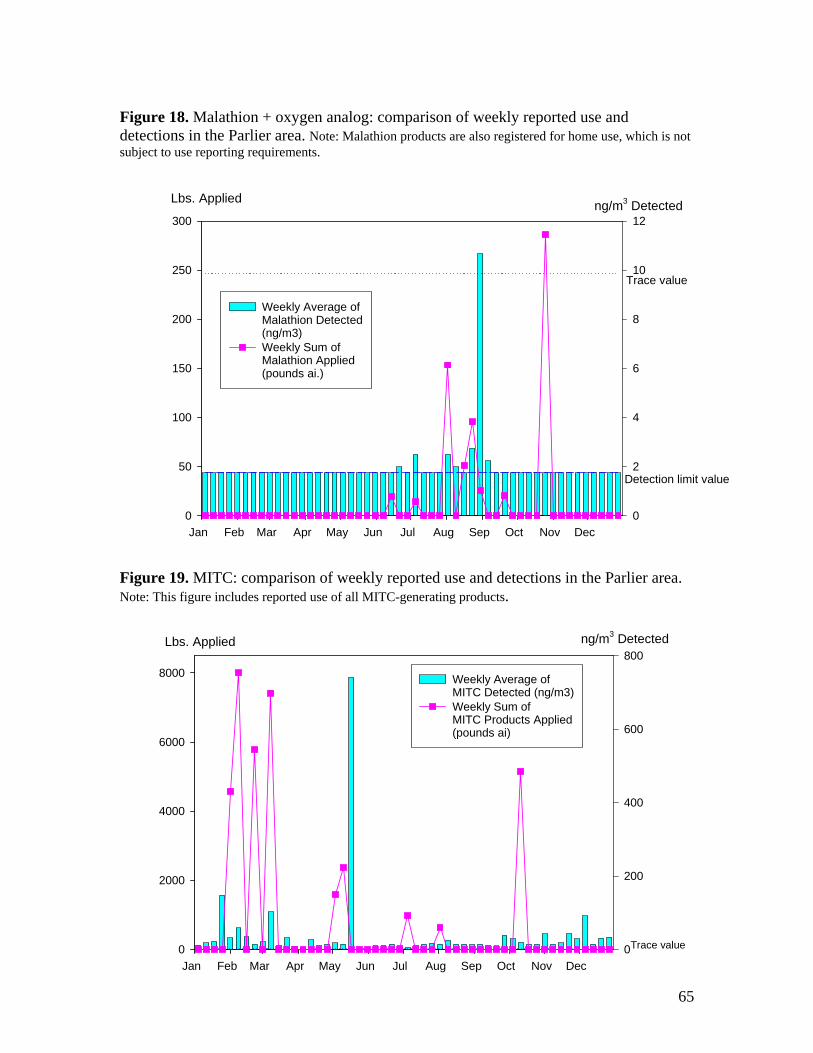
Figure 18. Malathion + oxygen analog: comparison of weekly reported use and detections in the Parlier area. Note: Malathion products are also registered for home use, which is not subject to use reporting requirements.
Lbs. Applied ng/m3 Detected 300
Weekly Average of Malathion Detected (ng/m3) Weekly Sum of Malathion Applied (pounds ai.)
12
250 10 Trace value
200 8
6150
100 4
50 2 Detection limit value
0 0 Jan Feb Mar Apr May Jun Jul Aug Sep Oct Nov Dec
Figure 19. MITC: comparison of weekly reported use and detections in the Parlier area. Note: This figure includes reported use of all MITC-generating products.
Lbs. Applied
8000
6000
4000
2000
0 Jan Feb Mar Apr May
ng/m3 Detected 800
Weekly Average of MITC Detected (ng/m3) Weekly Sum of MITC Products Applied
600 (pounds ai)
400
200
0Trace value
Jun Jul Aug Sep Oct Nov Dec
65
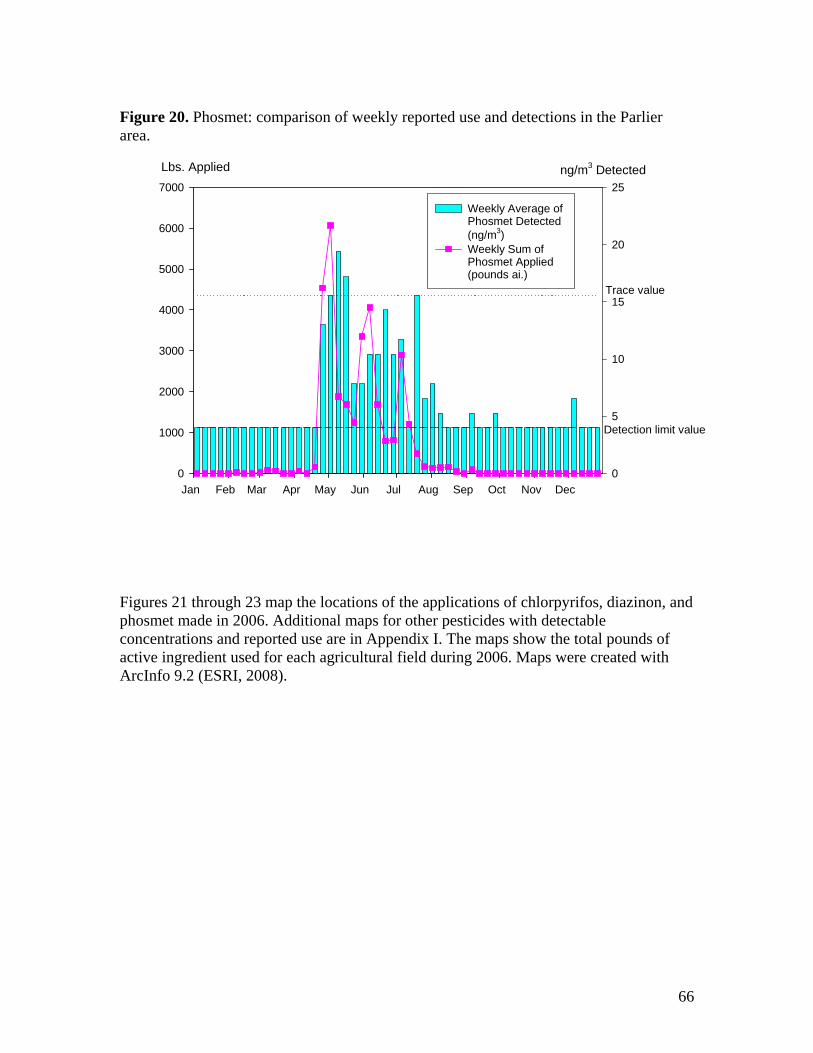
Figure 20. Phosmet: comparison of weekly reported use and detections in the Parlier area.
Lbs. Applied ng/m3 Detected 7000
6000
5000
4000
3000
2000
1000
0
Weekly Average of Phosmet Detected (ng/m3) Weekly Sum of Phosmet Applied (pounds ai.)
25
20
Trace value 15
10
5 Detection limit value
0 Jan Feb Mar Apr May Jun Jul Aug Sep Oct Nov Dec
Figures 21 through 23 map the locations of the applications of chlorpyrifos, diazinon, and phosmet made in 2006. Additional maps for other pesticides with detectable concentrations and reported use are in Appendix I. The maps show the total pounds of active ingredient used for each agricultural field during 2006. Maps were created with ArcInfo 9.2 (ESRI, 2008).
66
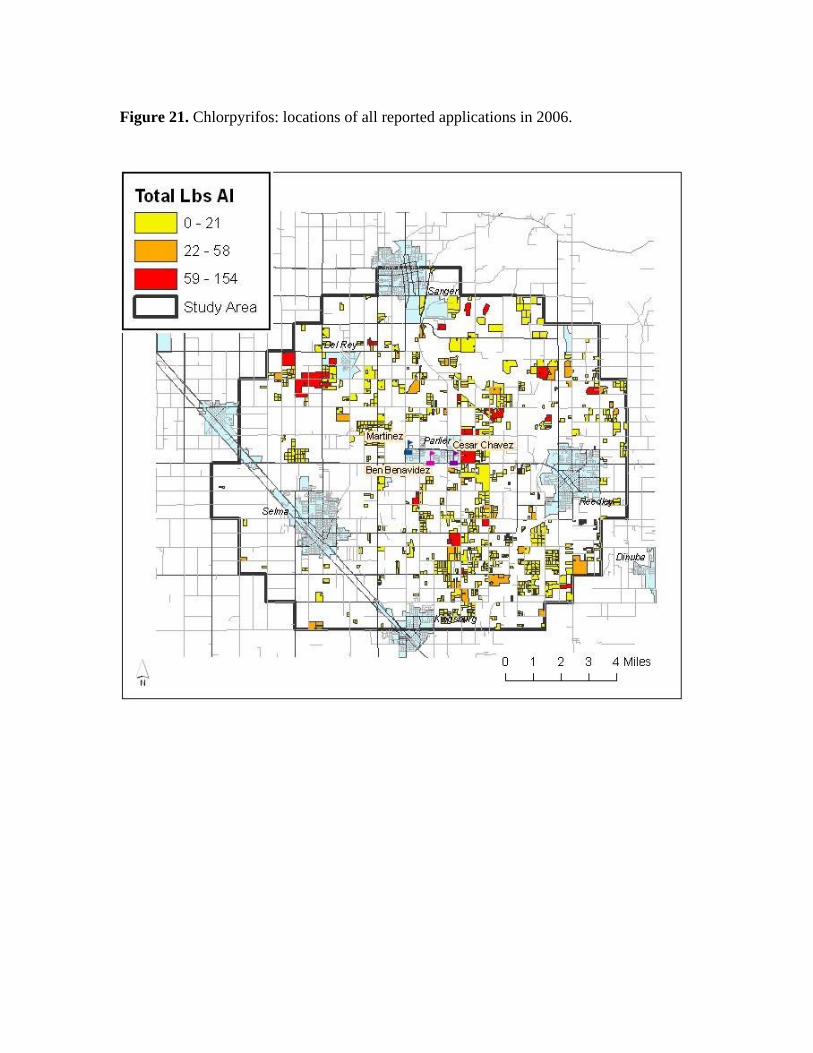
67
Figure 21. Chlorpyrifos: locations of all reported applications in 2006.
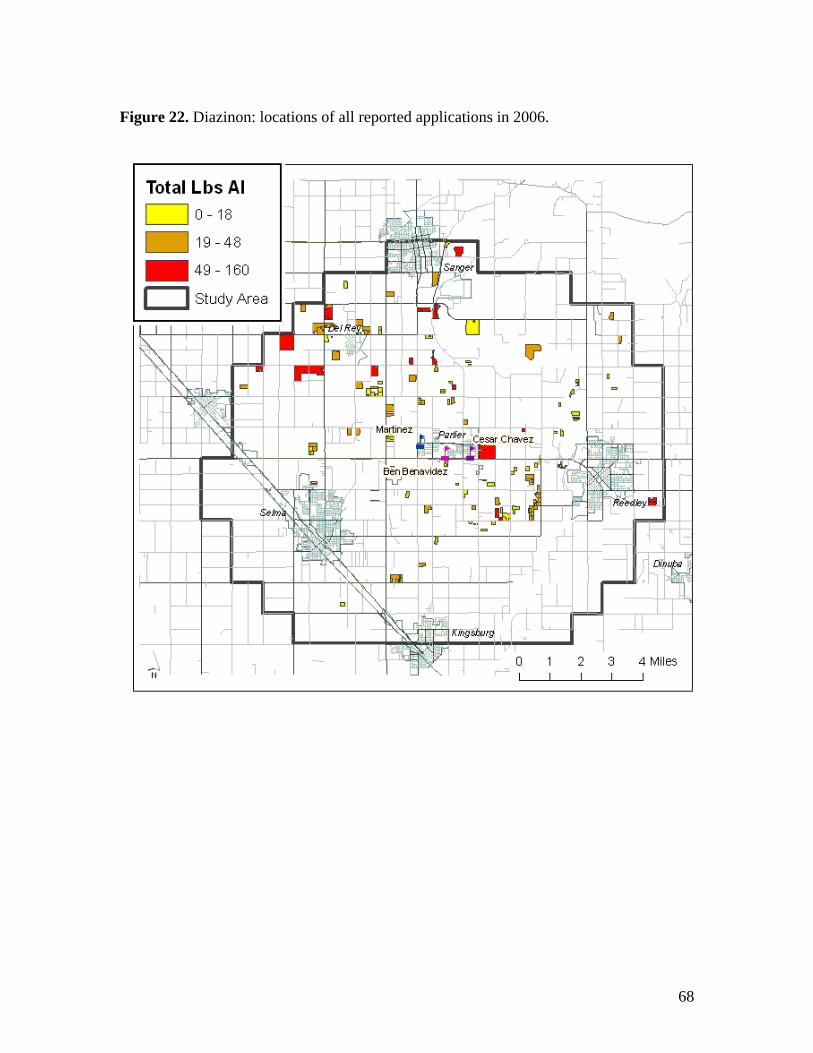
Figure 22. Diazinon: locations of all reported applications in 2006.
68
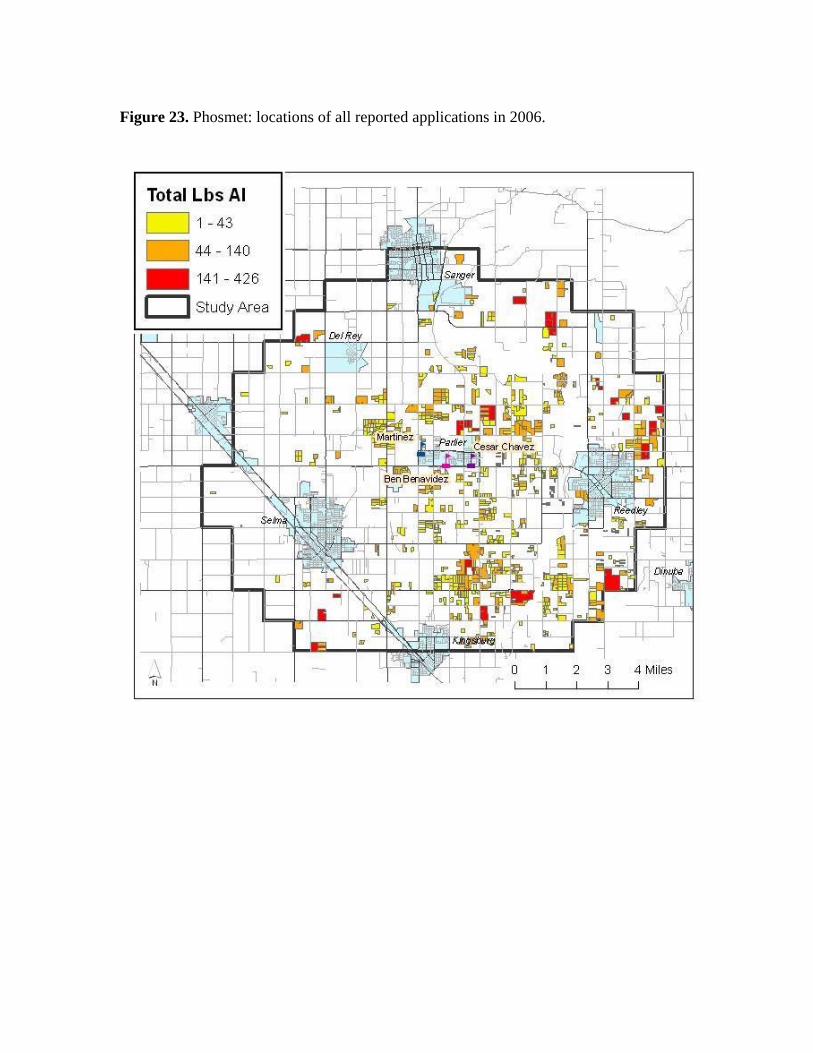
69
Figure 23. Phosmet: locations of all reported applications in 2006.
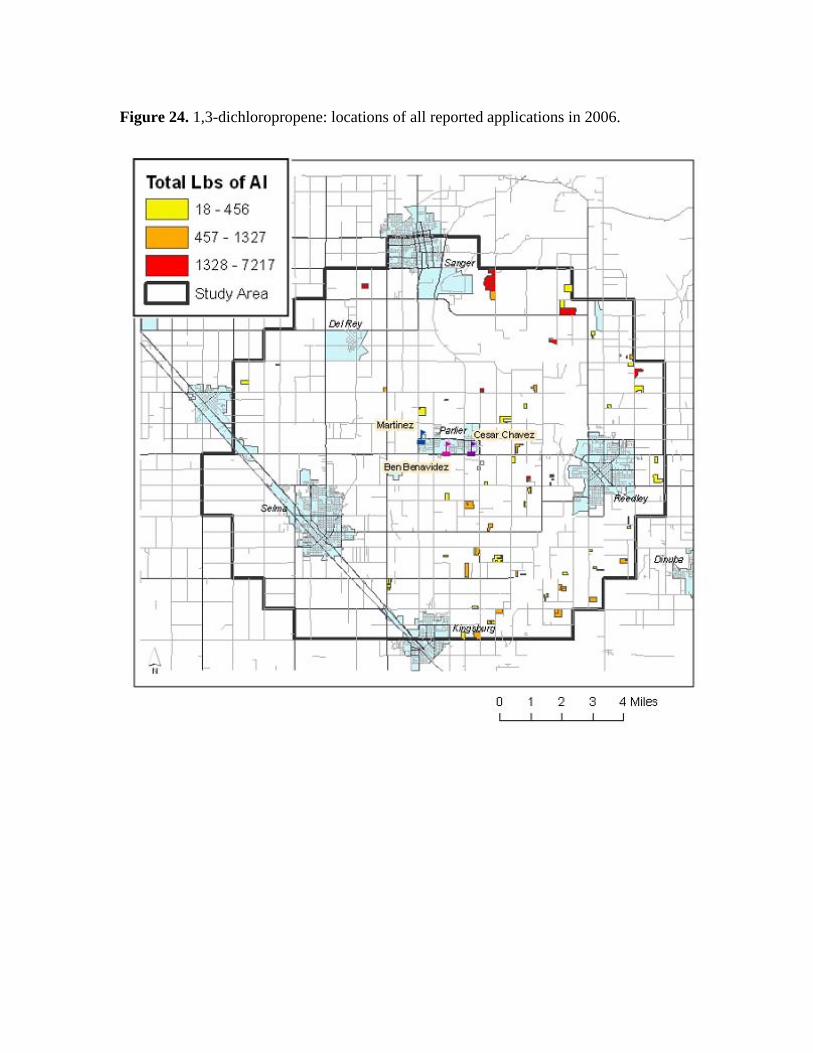
70
Figure 24. 1,3-dichloropropene: locations of all reported applications in 2006.
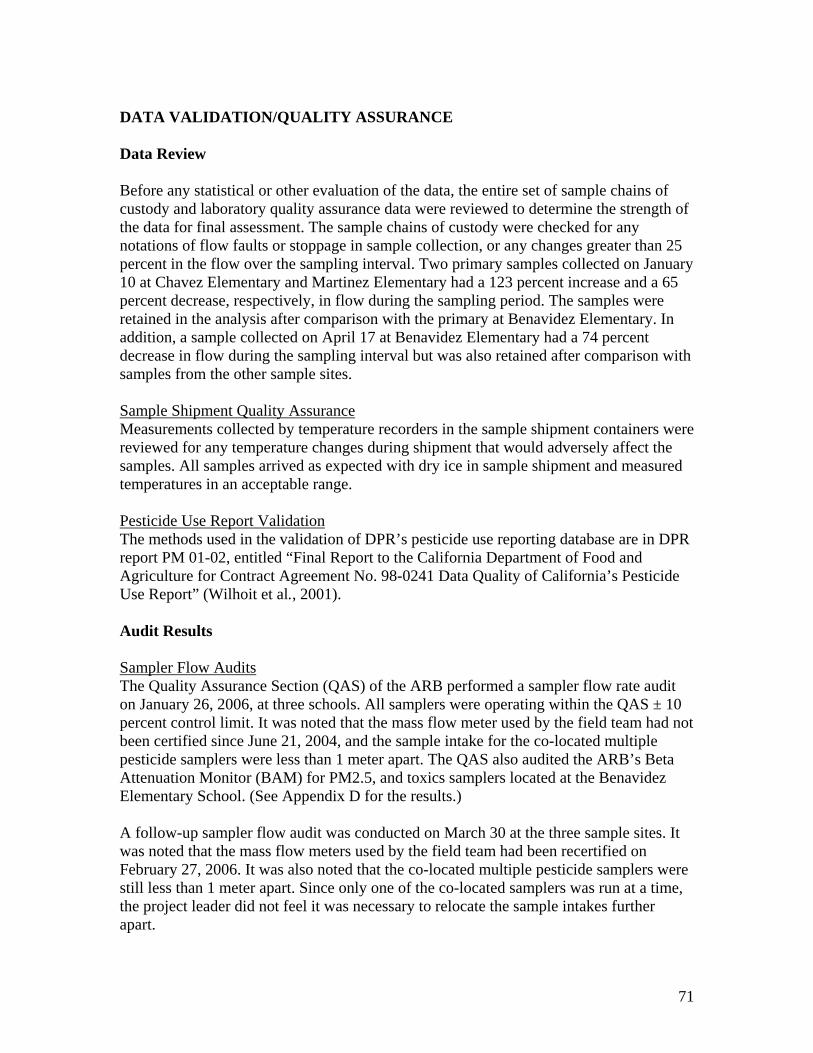
DATA VALIDATION/QUALITY ASSURANCE
Data Review
Before any statistical or other evaluation of the data, the entire set of sample chains of custody and laboratory quality assurance data were reviewed to determine the strength of the data for final assessment. The sample chains of custody were checked for any notations of flow faults or stoppage in sample collection, or any changes greater than 25 percent in the flow over the sampling interval. Two primary samples collected on January 10 at Chavez Elementary and Martinez Elementary had a 123 percent increase and a 65 percent decrease, respectively, in flow during the sampling period. The samples were retained in the analysis after comparison with the primary at Benavidez Elementary. In addition, a sample collected on April 17 at Benavidez Elementary had a 74 percent decrease in flow during the sampling interval but was also retained after comparison with samples from the other sample sites.
Sample Shipment Quality Assurance Measurements collected by temperature recorders in the sample shipment containers were reviewed for any temperature changes during shipment that would adversely affect the samples. All samples arrived as expected with dry ice in sample shipment and measured temperatures in an acceptable range.
Pesticide Use Report Validation The methods used in the validation of DPR’s pesticide use reporting database are in DPR report PM 01-02, entitled “Final Report to the California Department of Food and Agriculture for Contract Agreement No. 98-0241 Data Quality of California’s Pesticide Use Report” (Wilhoit et al., 2001).
Audit Results
Sampler Flow Audits The Quality Assurance Section (QAS) of the ARB performed a sampler flow rate audit on January 26, 2006, at three schools. All samplers were operating within the QAS ± 10 percent control limit. It was noted that the mass flow meter used by the field team had not been certified since June 21, 2004, and the sample intake for the co-located multiple pesticide samplers were less than 1 meter apart. The QAS also audited the ARB’s Beta Attenuation Monitor (BAM) for PM2.5, and toxics samplers located at the Benavidez Elementary School. (See Appendix D for the results.)
A follow-up sampler flow audit was conducted on March 30 at the three sample sites. It was noted that the mass flow meters used by the field team had been recertified on February 27, 2006. It was also noted that the co-located multiple pesticide samplers were still less than 1 meter apart. Since only one of the co-located samplers was run at a time, the project leader did not feel it was necessary to relocate the sample intakes further apart.
71
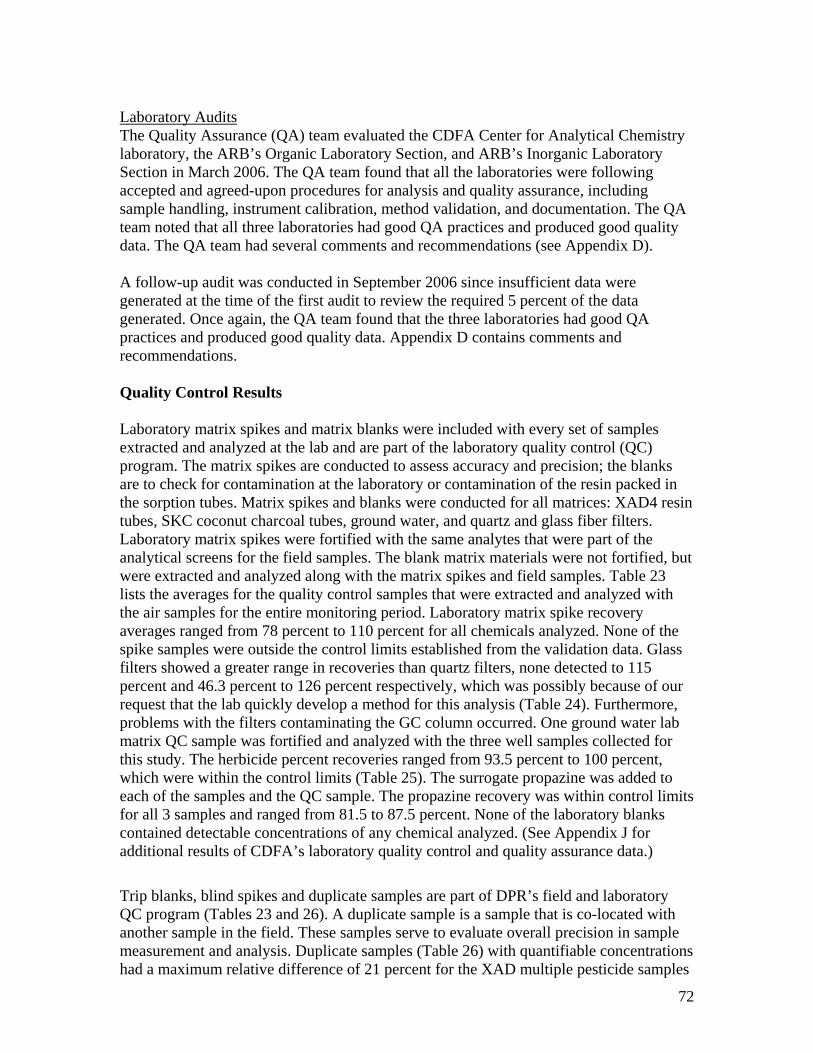
Laboratory Audits The Quality Assurance (QA) team evaluated the CDFA Center for Analytical Chemistry laboratory, the ARB’s Organic Laboratory Section, and ARB’s Inorganic Laboratory Section in March 2006. The QA team found that all the laboratories were following accepted and agreed-upon procedures for analysis and quality assurance, including sample handling, instrument calibration, method validation, and documentation. The QA team noted that all three laboratories had good QA practices and produced good quality data. The QA team had several comments and recommendations (see Appendix D).
A follow-up audit was conducted in September 2006 since insufficient data were generated at the time of the first audit to review the required 5 percent of the data generated. Once again, the QA team found that the three laboratories had good QA practices and produced good quality data. Appendix D contains comments and recommendations.
Quality Control Results
Laboratory matrix spikes and matrix blanks were included with every set of samples extracted and analyzed at the lab and are part of the laboratory quality control (QC) program. The matrix spikes are conducted to assess accuracy and precision; the blanks are to check for contamination at the laboratory or contamination of the resin packed in the sorption tubes. Matrix spikes and blanks were conducted for all matrices: XAD4 resin tubes, SKC coconut charcoal tubes, ground water, and quartz and glass fiber filters. Laboratory matrix spikes were fortified with the same analytes that were part of the analytical screens for the field samples. The blank matrix materials were not fortified, but were extracted and analyzed along with the matrix spikes and field samples. Table 23 lists the averages for the quality control samples that were extracted and analyzed with the air samples for the entire monitoring period. Laboratory matrix spike recovery averages ranged from 78 percent to 110 percent for all chemicals analyzed. None of the spike samples were outside the control limits established from the validation data. Glass filters showed a greater range in recoveries than quartz filters, none detected to 115 percent and 46.3 percent to 126 percent respectively, which was possibly because of our request that the lab quickly develop a method for this analysis (Table 24). Furthermore, problems with the filters contaminating the GC column occurred. One ground water lab matrix QC sample was fortified and analyzed with the three well samples collected for this study. The herbicide percent recoveries ranged from 93.5 percent to 100 percent, which were within the control limits (Table 25). The surrogate propazine was added to each of the samples and the QC sample. The propazine recovery was within control limits for all 3 samples and ranged from 81.5 to 87.5 percent. None of the laboratory blanks contained detectable concentrations of any chemical analyzed. (See Appendix J for additional results of CDFA’s laboratory quality control and quality assurance data.)
Trip blanks, blind spikes and duplicate samples are part of DPR’s field and laboratory QC program (Tables 23 and 26). A duplicate sample is a sample that is co-located with another sample in the field. These samples serve to evaluate overall precision in sample measurement and analysis. Duplicate samples (Table 26) with quantifiable concentrations had a maximum relative difference of 21 percent for the XAD multiple pesticide samples
72
and 9 percent for the MITC samples, indicating proper field and laboratory procedures. The matrix blind spikes were fortified by a CDFA chemist not associated with the analysis (Table 23). The blind spikes were given to DPR staff, relabeled, and then intermingled and delivered with field samples. Blind spikes were only submitted for the air sample analyses. The average percent recovery results of the blind spikes ranged from 65.2 to 112 percent. The trip blanks were blank matrix samples that were transported to and from the field locations, but were not placed on air pumps. These samples were a control to check for contamination during transportation. The trip blanks contained no detectable concentrations.
Problems with the Chlorothalonil Analysis Following the analysis of the quartz and glass fiber filters for the particulate sampling associated with UCD Center for Health and the Environment’s study, the LOQ for chlorothalonil was raised because of contamination of the GC column. The chlorothalonil LOQ varied for samples collected from June 26, 2006, to September 9, 2006, and the results should be considered questionable and may not be valid. The problem was corrected and all following samples had a LOQ of 1 ug/sample (46.3 ng/m3) for chlorothalonil. The contamination of the GC column also affected the recoveries from the glass filters for chlorothalonil, cypermethrin, and phosmet (Table 24).
Validation and Control Limits The MITC and the multi-pesticide analysis method in sorption tubes and the herbicide in ground water analysis method were validated according to the DPR SOP QAQC001.00 (Appendix C). The laboratory conducted validations by spiking three to five matrix blanks at three to five different spike levels, and then analyzing them. This procedure was repeated three to five times. From the validation data, DPR created control limits by multiplying the standard deviation of the data by ± 3 times and adding it to the mean. For the sorption tube validations, the validations give an idea of the desorption efficiency of the extraction method. Once the study began, DPR staff discovered that the validation of the MITC method was very precise and the spike levels were much higher than staff requested for QC spikes analyzed with the samples. Therefore, DPR staff chose to use the first seven QC spikes to develop the control limits (Appendix E). Validation was conducted for the ground water screen for DPR’s ground water program previous to this study. The data are part of the laboratory method SOP (Appendix E).
Storage Stability Storage stability studies were conducted for the sorption tube and ground water analyses. MITC was spiked on 3 separate coconut charcoal tubes and analyzed on days 0, 1, 7, 14, 29, 46, and 60. Each day had 3 replicates. MITC recovery at day 60 was 4.8 percent less than the QC sample; thus, the frozen samples were adequately stable. The field samples were analyzed on average within five days. The average included 4 back-up samples that were held up to 43 days before analysis. Likewise the multi-pesticide screen analytes were spiked on 3 replicates for each day, and then analyzed on days 0, 7, 14, and 28. Most of the analytes were stable, but 4 analytes had some recovery loss by day 28. The multi-pesticide XAD4 samples were stored an average of 5 days including a few back-up
73
samples that were analyzed at up to 22 days after sampling because of breakage or analysis problems with the initial samples.
Ground water storage stability for the herbicides followed the same procedure and was analyzed on multiple days to day 50. The ground water samples were sampled and extracted within five days.
Trapping Efficiency To determine the effectiveness of resin and charcoal trapping and retention of the analytes while air is drawn through the tubes, two trapping efficiency tests were conducted according to SOP FSAI003.00 (Appendix C). For the multi-pesticide analytes, 3 tubes were spiked with 10 μg, 3 more with 5 μg and 3 with 2 μg of all the analytes, and were placed on pumps for 24 hours at a rate of 15 L/min. After laboratory analysis, mean recoveries of the repetitions were calculated to determine the XAD4 resin trapping efficiency for each analyte. The trapping efficiency was good for most analytes except for oryzalin and oxyfluorfen, which had variable and low recoveries. For the organophosphates (OPs) dimethoate, malathion, diazinon and chlorpyrifos, the lab analyzed for the OA to determine the percent conversion of the parent compound to the OA. The OP parent analytes converted less than six percent to their OAs (Appendix E).
MITC was spiked at 1.0 and 100 μg and run with 2 reps of each spike amount at either 1.5 L/min or 1.0 L/min for 24 hours. The average recovery of the 2 1.0- and 100- μg spikes at 1.5 L/min was 82.3 percent and the same combination at 1L/min was 75.8 percent (Appendix E).
74
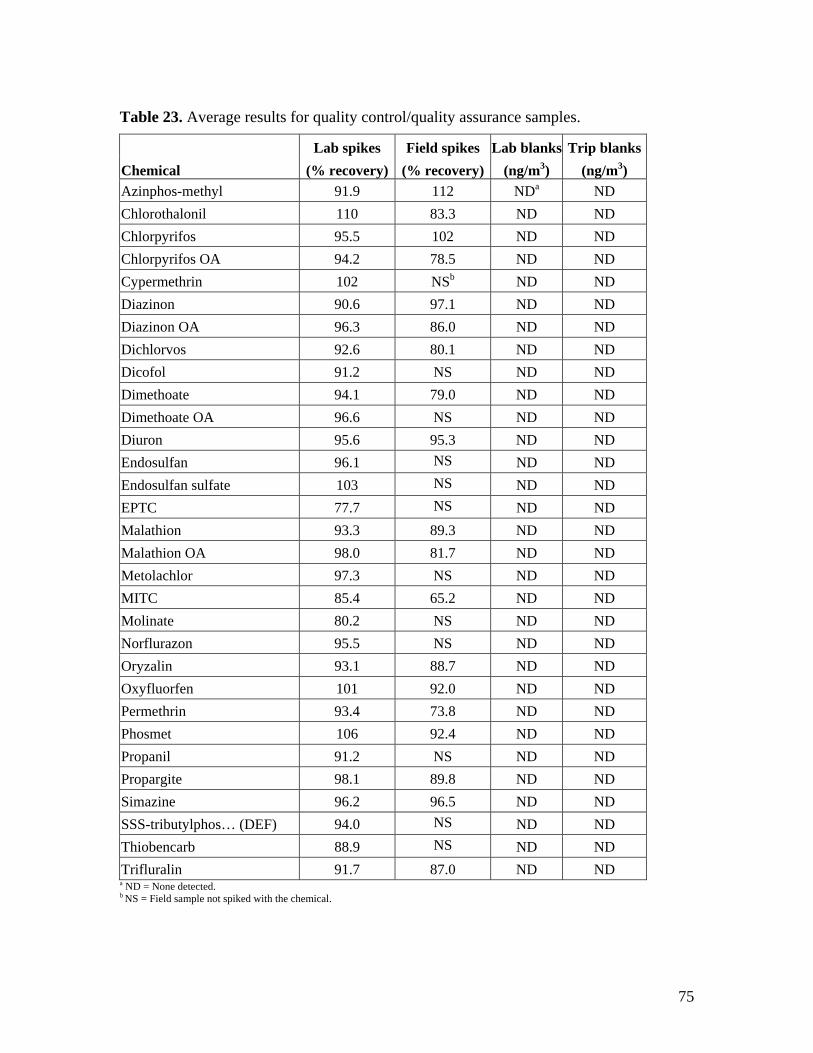
Table 23. Average results for quality control/quality assurance samples.
Chemical Lab spikes
(% recovery) Field spikes
(% recovery) Lab blanks
(ng/m3) Trip blanks
(ng/m3) Azinphos-methyl 91.9 112 NDa ND Chlorothalonil 110 83.3 ND ND Chlorpyrifos 95.5 102 ND ND Chlorpyrifos OA 94.2 78.5 ND ND Cypermethrin 102 NSb ND ND Diazinon 90.6 97.1 ND ND Diazinon OA 96.3 86.0 ND ND Dichlorvos 92.6 80.1 ND ND Dicofol 91.2 NS ND ND Dimethoate 94.1 79.0 ND ND Dimethoate OA 96.6 NS ND ND Diuron 95.6 95.3 ND ND Endosulfan 96.1 NS ND ND Endosulfan sulfate 103 NS ND ND EPTC 77.7 NS ND ND Malathion 93.3 89.3 ND ND Malathion OA 98.0 81.7 ND ND Metolachlor 97.3 NS ND ND MITC 85.4 65.2 ND ND Molinate 80.2 NS ND ND Norflurazon 95.5 NS ND ND Oryzalin 93.1 88.7 ND ND Oxyfluorfen 101 92.0 ND ND Permethrin 93.4 73.8 ND ND Phosmet 106 92.4 ND ND Propanil 91.2 NS ND ND Propargite 98.1 89.8 ND ND Simazine 96.2 96.5 ND ND SSS-tributylphos… (DEF) 94.0 NS ND ND Thiobencarb 88.9 NS ND ND Trifluralin 91.7 87.0 ND ND a ND = None detected.b NS = Field sample not spiked with the chemical.
75
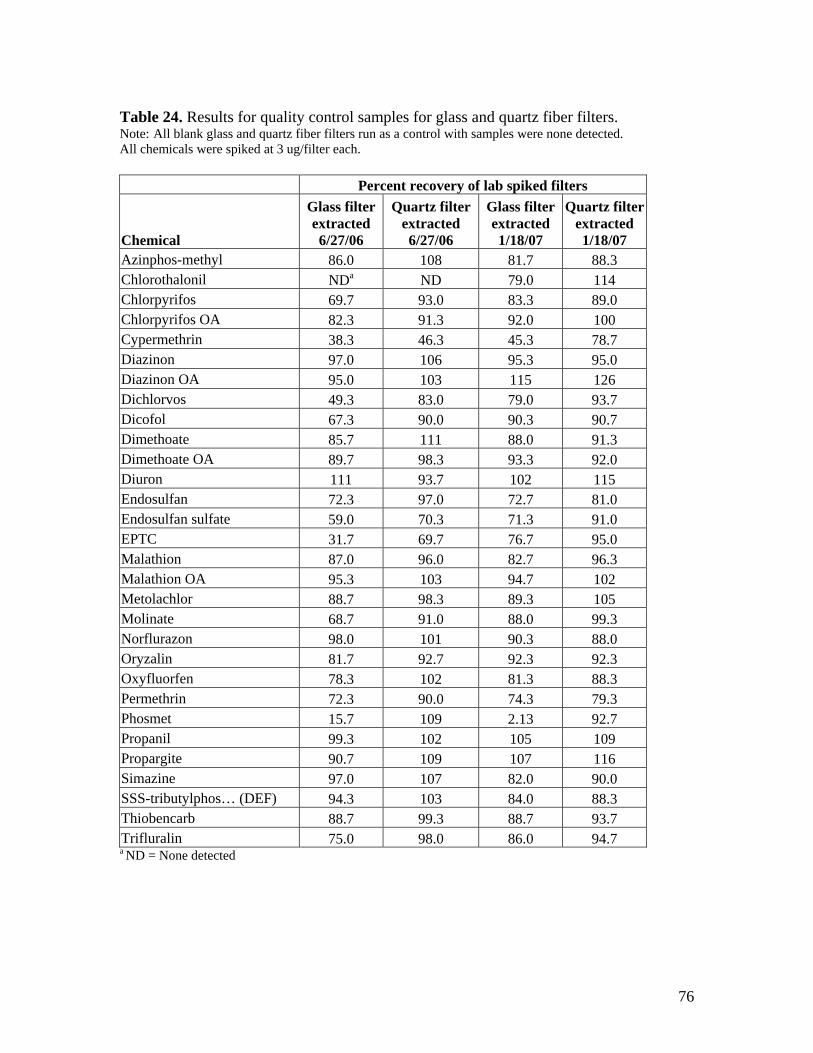
Table 24. Results for quality control samples for glass and quartz fiber filters. Note: All blank glass and quartz fiber filters run as a control with samples were none detected. All chemicals were spiked at 3 ug/filter each.
Percent recovery of lab spiked filters
Chemical
Glass filter extracted 6/27/06
Quartz filter extracted 6/27/06
Glass filter extracted 1/18/07
Quartz filter extracted 1/18/07
Azinphos-methyl 86.0 108 81.7 88.3 Chlorothalonil NDa ND 79.0 114 Chlorpyrifos 69.7 93.0 83.3 89.0 Chlorpyrifos OA 82.3 91.3 92.0 100 Cypermethrin 38.3 46.3 45.3 78.7 Diazinon 97.0 106 95.3 95.0 Diazinon OA 95.0 103 115 126 Dichlorvos 49.3 83.0 79.0 93.7 Dicofol 67.3 90.0 90.3 90.7 Dimethoate 85.7 111 88.0 91.3 Dimethoate OA 89.7 98.3 93.3 92.0 Diuron 111 93.7 102 115 Endosulfan 72.3 97.0 72.7 81.0 Endosulfan sulfate 59.0 70.3 71.3 91.0 EPTC 31.7 69.7 76.7 95.0 Malathion 87.0 96.0 82.7 96.3 Malathion OA 95.3 103 94.7 102 Metolachlor 88.7 98.3 89.3 105 Molinate 68.7 91.0 88.0 99.3 Norflurazon 98.0 101 90.3 88.0 Oryzalin 81.7 92.7 92.3 92.3 Oxyfluorfen 78.3 102 81.3 88.3 Permethrin 72.3 90.0 74.3 79.3 Phosmet 15.7 109 2.13 92.7 Propanil 99.3 102 105 109 Propargite 90.7 109 107 116 Simazine 97.0 107 82.0 90.0 SSS-tributylphos… (DEF) 94.3 103 84.0 88.3 Thiobencarb 88.7 99.3 88.7 93.7 Trifluralin 75.0 98.0 86.0 94.7 a ND = None detected
76
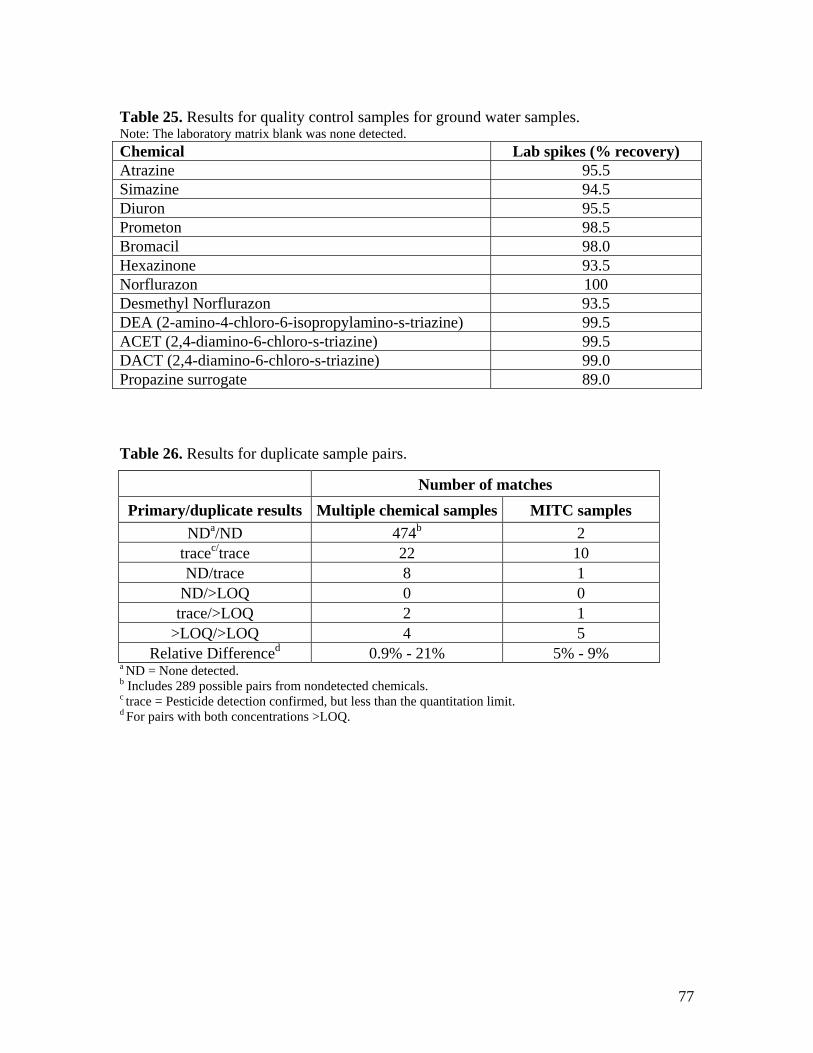
Table 25. Results for quality control samples for ground water samples. Note: The laboratory matrix blank was none detected. Chemical Lab spikes (% recovery) Atrazine 95.5 Simazine 94.5 Diuron 95.5 Prometon 98.5 Bromacil 98.0 Hexazinone 93.5 Norflurazon 100 Desmethyl Norflurazon 93.5 DEA (2-amino-4-chloro-6-isopropylamino-s-triazine) 99.5 ACET (2,4-diamino-6-chloro-s-triazine) 99.5 DACT (2,4-diamino-6-chloro-s-triazine) 99.0 Propazine surrogate 89.0
Table 26. Results for duplicate sample pairs.
Number of matches Primary/duplicate results Multiple chemical samples MITC samples
NDa/ND 474b 2 tracec/trace 22 10 ND/trace 8 1
ND/>LOQ 0 0 trace/>LOQ 2 1
>LOQ/>LOQ 4 5 Relative Differenced 0.9% - 21% 5% - 9%
a ND = None detected. b Includes 289 possible pairs from nondetected chemicals. c trace = Pesticide detection confirmed, but less than the quantitation limit. d For pairs with both concentrations >LOQ.
77
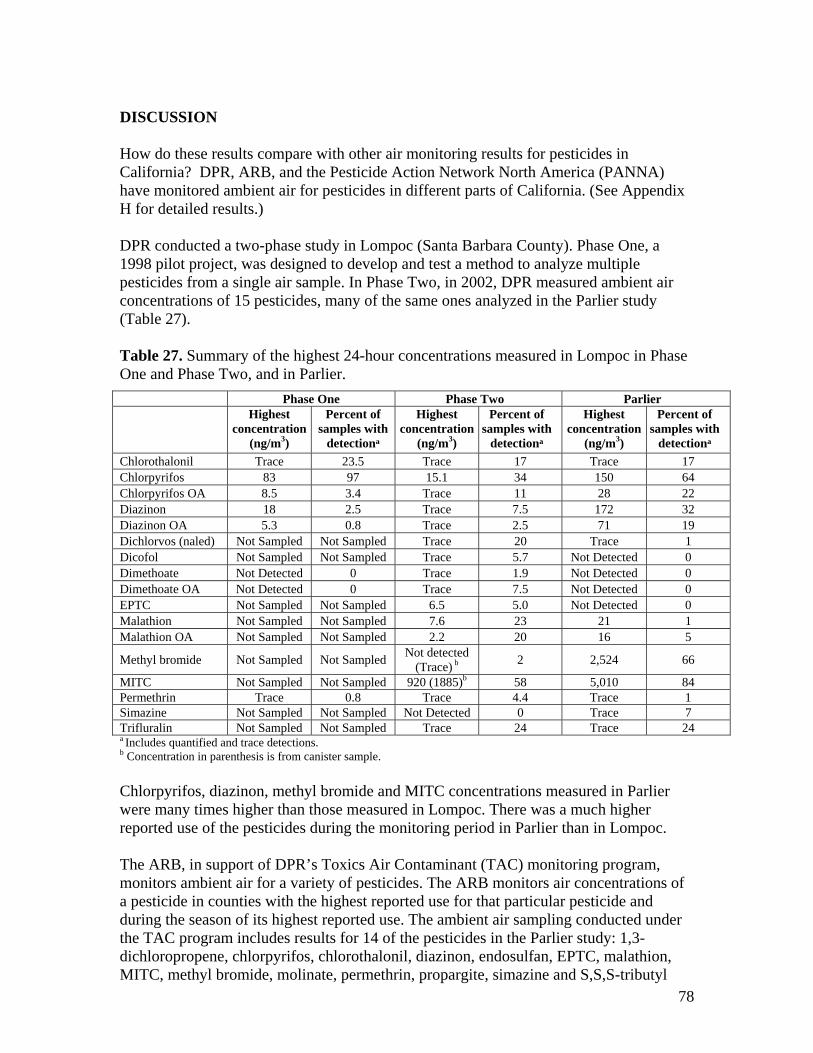
DISCUSSION
How do these results compare with other air monitoring results for pesticides in California? DPR, ARB, and the Pesticide Action Network North America (PANNA) have monitored ambient air for pesticides in different parts of California. (See Appendix H for detailed results.)
DPR conducted a two-phase study in Lompoc (Santa Barbara County). Phase One, a 1998 pilot project, was designed to develop and test a method to analyze multiple pesticides from a single air sample. In Phase Two, in 2002, DPR measured ambient air concentrations of 15 pesticides, many of the same ones analyzed in the Parlier study (Table 27).
Table 27. Summary of the highest 24-hour concentrations measured in Lompoc in Phase One and Phase Two, and in Parlier.
Phase One Phase Two Parlier Highest
concentration (ng/m3)
Percent of samples with
detectiona
Highest concentration
(ng/m3)
Percent of samples with
detectiona
Highest concentration
(ng/m3)
Percent of samples with
detectiona
Chlorothalonil Trace 23.5 Trace 17 Trace 17 Chlorpyrifos 83 97 15.1 34 150 64 Chlorpyrifos OA 8.5 3.4 Trace 11 28 22 Diazinon 18 2.5 Trace 7.5 172 32 Diazinon OA 5.3 0.8 Trace 2.5 71 19 Dichlorvos (naled) Not Sampled Not Sampled Trace 20 Trace 1 Dicofol Not Sampled Not Sampled Trace 5.7 Not Detected 0 Dimethoate Not Detected 0 Trace 1.9 Not Detected 0 Dimethoate OA Not Detected 0 Trace 7.5 Not Detected 0 EPTC Not Sampled Not Sampled 6.5 5.0 Not Detected 0 Malathion Not Sampled Not Sampled 7.6 23 21 1 Malathion OA Not Sampled Not Sampled 2.2 20 16 5
Methyl bromide Not Sampled Not Sampled Not detected (Trace) b 2 2,524 66
MITC Not Sampled Not Sampled 920 (1885)b 58 5,010 84 Permethrin Trace 0.8 Trace 4.4 Trace 1 Simazine Not Sampled Not Sampled Not Detected 0 Trace 7 Trifluralin Not Sampled Not Sampled Trace 24 Trace 24 a Includes quantified and trace detections. b Concentration in parenthesis is from canister sample.
Chlorpyrifos, diazinon, methyl bromide and MITC concentrations measured in Parlier were many times higher than those measured in Lompoc. There was a much higher reported use of the pesticides during the monitoring period in Parlier than in Lompoc.
The ARB, in support of DPR’s Toxics Air Contaminant (TAC) monitoring program, monitors ambient air for a variety of pesticides. The ARB monitors air concentrations of a pesticide in counties with the highest reported use for that particular pesticide and during the season of its highest reported use. The ambient air sampling conducted under the TAC program includes results for 14 of the pesticides in the Parlier study: 1,3dichloropropene, chlorpyrifos, chlorothalonil, diazinon, endosulfan, EPTC, malathion, MITC, methyl bromide, molinate, permethrin, propargite, simazine and S,S,S-tributyl
78
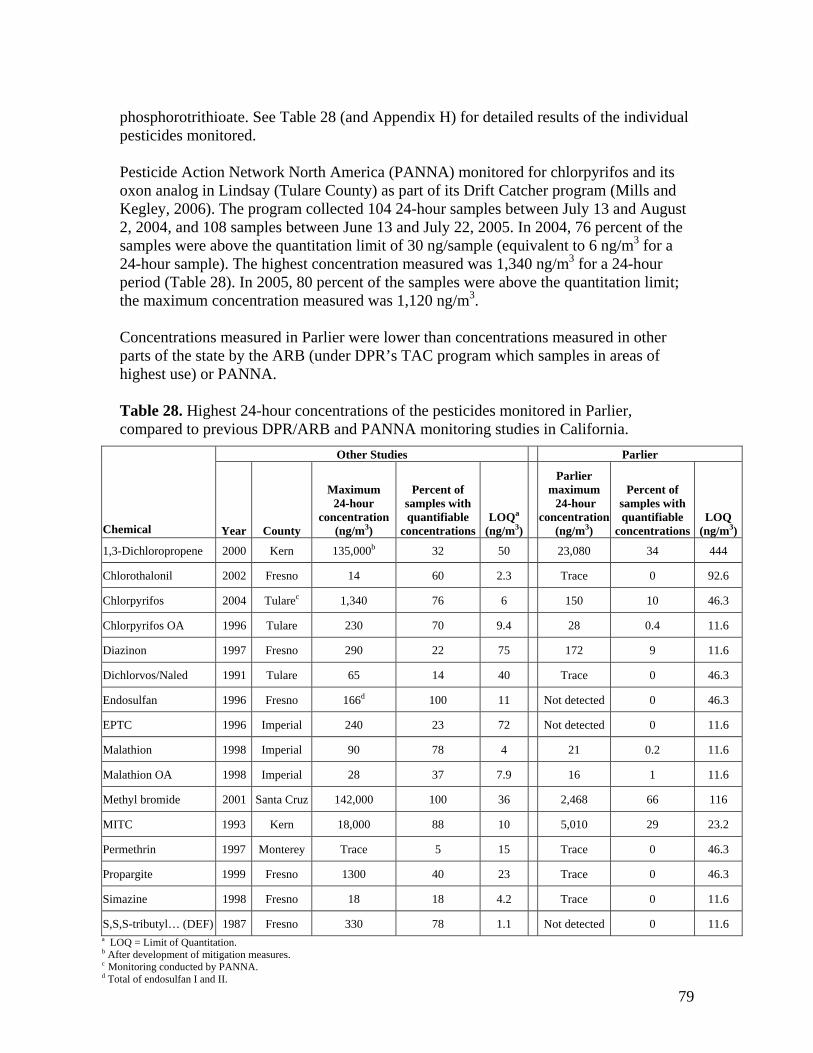
phosphorotrithioate. See Table 28 (and Appendix H) for detailed results of the individual pesticides monitored.
Pesticide Action Network North America (PANNA) monitored for chlorpyrifos and its oxon analog in Lindsay (Tulare County) as part of its Drift Catcher program (Mills and Kegley, 2006). The program collected 104 24-hour samples between July 13 and August 2, 2004, and 108 samples between June 13 and July 22, 2005. In 2004, 76 percent of the samples were above the quantitation limit of 30 ng/sample (equivalent to 6 ng/m3 for a 24-hour sample). The highest concentration measured was 1,340 ng/m3 for a 24-hour period (Table 28). In 2005, 80 percent of the samples were above the quantitation limit; the maximum concentration measured was 1,120 ng/m3.
Concentrations measured in Parlier were lower than concentrations measured in other parts of the state by the ARB (under DPR’s TAC program which samples in areas of highest use) or PANNA.
Table 28. Highest 24-hour concentrations of the pesticides monitored in Parlier, compared to previous DPR/ARB and PANNA monitoring studies in California.
Chemical
Other Studies Parlier
Year County
Maximum 24-hour
concentration (ng/m3)
Percent of samples with quantifiable
concentrations LOQa
(ng/m3)
Parlier maximum
24-hour concentration
(ng/m3)
Percent of samples with quantifiable
concentrations LOQ
(ng/m3)
1,3-Dichloropropene 2000 Kern 135,000b 32 50 23,080 34 444
Chlorothalonil 2002 Fresno 14 60 2.3 Trace 0 92.6
Chlorpyrifos 2004 Tularec 1,340 76 6 150 10 46.3
Chlorpyrifos OA 1996 Tulare 230 70 9.4 28 0.4 11.6
Diazinon 1997 Fresno 290 22 75 172 9 11.6
Dichlorvos/Naled 1991 Tulare 65 14 40 Trace 0 46.3
Endosulfan 1996 Fresno 166d 100 11 Not detected 0 46.3
EPTC 1996 Imperial 240 23 72 Not detected 0 11.6
Malathion 1998 Imperial 90 78 4 21 0.2 11.6
Malathion OA 1998 Imperial 28 37 7.9 16 1 11.6
Methyl bromide 2001 Santa Cruz 142,000 100 36 2,468 66 116
MITC 1993 Kern 18,000 88 10 5,010 29 23.2
Permethrin 1997 Monterey Trace 5 15 Trace 0 46.3
Propargite 1999 Fresno 1300 40 23 Trace 0 46.3
Simazine 1998 Fresno 18 18 4.2 Trace 0 11.6
S,S,S-tributyl… (DEF) 1987 Fresno 330 78 1.1 Not detected 0 11.6 a LOQ = Limit of Quantitation. b After development of mitigation measures. c Monitoring conducted by PANNA. d Total of endosulfan I and II.
79
CONCLUSIONS, ACTIONS AND RECOMMENDATIONS
The monitoring was designed to answer these questions: • Are residents exposed to pesticides in the air? Which pesticides are people
exposed to? In what amounts? Yes, of the 40 pesticides or breakdown products that were monitored for, 23 were detected (See Table 8). Measured amounts varied, depending on the pesticide and, for the most part, were comparable to levels measured in other Central Valley communities.
• Are the amounts of pesticides found in air of concern to human health, particularly for children? Diazinon was the only pesticide monitored that exceeded the acute screening levels. Chlorpyrifos air concentrations did not exceed the acute screening level but, if the federal FQPA 10-fold safety factor were applied, the measured air concentrations would have approached or exceeded the screening level in several instances. The 1,3-dichloropropene chronic average air level results in a calculated cancer risk that is above the range of what would normally be considered negligible (that is, above the acceptable risk level).
Chlorpyrifos and diazinon accounted for most of the relative health risk of the monitored chemicals that were likely because of pesticidal use. Because of these results, DPR moved diazinon to the top of the high priority list for risk assessment. DPR initiated a comprehensive diazinon risk assessment in 2008 to consider all routes of exposure, including inhalation of ambient air. In addition, U.S. EPA’s Reregistration Eligibility Decision for diazinon places additional restrictions on the agricultural uses of the pesticide. While DPR had already initiated a risk assessment on chlorpyrifos, it will complete the assessment sooner than originally planned, based on these findings. The air concentrations measured in Parlier are an integral part of the assessment.
The 1,3-dichloropropene chronic average air concentration results in a calculated cancer risk that is above the range of what would normally be considered negligible. These results indicate a need for further evaluation; the results will be considered along with the Department’s air modeling results as part of its continuing evaluation of management plans and permitted uses and application restrictions for 1,3-dichloropropene. Additionally, DPR has reopened the risk assessment of 1,3-dichloropropene and is evaluating current uses in various regions in the state.
Acrolein and formaldehyde were frequently detected, often at concentrations well above the acute and chronic screening levels. In addition, the air concentrations of formaldehyde indicated concern was warranted for carcinogenic effects. However, acrolein and formaldehyde concentrations were not because of activities involving pesticidal use (including dairy or poultry farms) and their concentrations were similar to those found in the ambient air elsewhere in the state. Since these air concentrations are not due to pesticidal uses, their mitigation and regulation fall outside DPR’s regulatory mandate and its ability to mitigate. Nonetheless, DPR had already initiated a risk assessment on the pesticidal uses of acrolein and will include these acrolein air
80
concentrations in the assessment. The Department will work with ARB and OEHHA to conduct the assessment.
The detection of pesticides corresponded with reported use during the study, except for MITC. MITC was frequently detected when use of its parent compounds metam sodium, potassium N-methyldithio-carbamate (K-Pam), or dazomet was not reported. Perhaps applications made outside of the five-mile boundary of the study area influenced the concentrations of MITC detected.
After discussion with the LAG, DPR added the following objectives unrelated to the monitoring:
• Inform the community of project, including public forums. DPR held eight public meetings with the LAG from 2005 through 2007. Several hundred people attended DPR’s community forum in January 2006 to “kick off” the monitoring. In addition to a discussion of the monitoring, the forum included more than a dozen other organizations that provided immunizations, as well as information on lead exposure prevention, crime prevention, vehicle safety, gardening, and jobs. DPR made a presentation at a public meeting of the joint powers authority that included elected officials from Parlier and surrounding communities. DPR also made presentations to the staff and students of the monitored schools, discussing the study and other monitoring the Department conducts.
• Reduce pesticide risk. This report focuses on the results of the monitoring conducted in Parlier; actions on the precautionary approach to reduce pesticide risk is beyond the scope of this report. For further information on actions to address the precautionary approach, please see DPR’s report on Soil Fumigant and Organophosphate Insecticide Use and Alternatives—Parlier, Fresno County, California (DPR, 2007). This document identified research needs and outreach priorities for reduced-risk pest management in the Parlier area. It includes significant changes that growers have made to pesticide practices that will reduce exposure and risk. Growers and others can use this document to apply the precautionary approach to protect public health and the environment by promoting and supporting the development and voluntary adoption of reduced-risk pest management systems.
• Conduct follow-up actions, such as education or regulatory actions or both. See the previous section describing actions taken in response to detections of chlorpyrifos, diazinon, and 1,3-dichlorpropene.
• Put risk in perspective. The risks from acrolein and formaldehyde were higher than any of the pesticides detected in Parlier. OEHHA is developing methods to comprehensively evaluate cumulative and relative risk.
81
REFERENCES
Baker, L.W., D.L. Fitzell, J.N. Seiber, T.R. Parker, T. Shibamoto, M.W. Poore, K.E. Longley, R.P. Tomlin, R. Propper, and D.W. Duncan. 1996. Ambient air concentrations of pesticides in California. Environ. Sci. Technol. 30:1365-1368.
California Air Resources Board. 1988. Pilot Analysis of DEF in Air. Memorandum to Jack Parnell, Department of Food and Agriculture from James D. Boyd, Air Resources Board. Dated December 30, 1988.
California Air Resources Board. 1991. Telone (1,3-dichloropropene) Monitoring in Merced County. Project No. C90-014. January 4, 1991. Sacramento, CA.
California Air Resources Board. 1993. Airborne concentrations of Naled and Dichlorvos in Central Tulare County from Sampling conducted in May and June 1991. Test Report No. A032-094. June 24, 1993. Sacramento, CA.
California Air Resources Board. 1994. Ambient air monitoring for MITC in Kern County during Summer 1993. Project No. C92-070. April 27, 1994. Sacramento, CA.
California Air Resources Board. 1995. Ambient Air Monitoring in Merced County for Telone (1,3-dichloropropene) During DowElanco’s Commercial Reintroduction, March-April, 1995. Project No. C94-071-M. November 9, 1995. Sacramento, CA.
California Air Resources Board. 1996. Ambient Air Monitoring in Kern County for Telone (1,3-dichloropropene) During DowElanco’s Commercial Reintroduction, May-December, 1995. Project No. C94-071-K. November 8, 1996. Sacramento, CA.
California Air Resources Board. 1997. Report for 1996 Ambient Monitoring of Telone in Kern County. Project No. C96-045. October 14, 1997. Sacramento, CA.
California Air Resources Board. 1998a. Ambient Air Monitoring of Diazinon in Fresno County During Winter, 1997. Project No. C96-036. April 6, 1998. Sacramento, CA.
California Air Resources Board. 1998b. Application and Ambient Air Monitoring of Chlorpyrifos (and the oxon analogue) in Tulare County During Spring/Summer, 1996. Project No. C96-041. April 7, 1998. Sacramento, CA.
California Air Resources Board. 1998c. Air Monitoring of Endosulfan in Fresno County (Ambient) and in San Joaquin County (Application). Project No. C96-034. April 17, 1998. Sacramento, CA.
California Air Resources Board. 1998d. Air Monitoring of EPTC in Merced County (Application) and in Imperial County (Ambient). Project No. C96-035. June 10, 1998. Sacramento, CA.
82
California Air Resources Board. 1998e. Application (Butte County) and Ambient (Monterey County) Air Monitoring of Permethrin. Project No. 97-041. November 17, 1998. Sacramento, CA.
California Air Resources Board. 1999a. Application and ambient air monitoring of Malathion in Imperial County. Project No. C98-002. January 28, 1999. Sacramento, CA.
California Air Resources Board. 1999b. Application (Tulare County) and Ambient (Fresno County) Air Monitoring of Simazine. Project No. C97-071. November 22, 1999. Sacramento, CA.
California Air Resources Board. 2000. Ambient Air Monitoring for Methyl Bromide and 1,3-dichloropropene in Kern County – Summer 2000. Project No. C00-028. December 27, 2000. Sacramento, CA.
California Air Resources Board. 2001a. Ambient Air Monitoring for Methyl Bromide and 1,3-dichloropropene in Monterey/Santa Cruz Counties – Fall 2000. Project No. C00028. January 31, 2001. Sacramento, CA.
California Air Resources Board. 2001b. Report for the Application and Ambient Air Monitoring for Propargite and Bifenthrin in Fresno and Kings Counties. Project Nos. C99-032, C99-032a, C99-033, and C99-033a. August 8, 2001. Sacramento, CA
California Air Resources Board. 2002a. Ambient Air Monitoring for Methyl Bromide and 1,3-dichloropropene in Monterey and Santa Cruz Counties – Fall 2001. Project No. P-01-004. March 29, 2002. Sacramento, CA.
California Air Resources Board. 2002b. Ambient Air Monitoring for Methyl Bromide and 1,3-dichloropropene in Kern County – Summer 2001. Project No. P01-004. June 20, 2002. Sacramento, CA.
California Air Resources Board. 2003a. Ambient Air Monitoring for Chloropicrin and Breakdown Products of Metam Sodium in Kern County – Summer 2001. Project No. P01-004. November 13, 2003. Sacramento, CA.
California Air Resources Board. 2003b. Ambient Air Monitoring for Chloropicrin and Breakdown Products of Metam Sodium in Monterey and Santa Cruz Counties – Fall 2001. Project No. P01-004. December 23, 2003. Sacramento, CA.
California Air Resources Board, 2003c. Ambient Air Monitoring for Chlorothalonil in Fresno County – Summer 2002. Project No. P-02-002. November 3, 2003.
California Air Resources Board. 2006. Report on Ambient Air Monitoring for Methyl Bromide and 1,3-Dichloropropene in Ventura County during August and September 2005. November 3, 2006.
83
California Environmental Protection Agency. 2004. October 2004 Environmental Justice Action Plan. California Environmental Protection Agency. Sacramento, CA.
DPR. 1995. Pesticide Use Reporting: An Overview of California’s Unique Full Reporting System. California Environmental Protection Agency. Department of Pesticide Regulation. Sacramento, CA.
DPR. 2003. Ambient Air Monitoring for Pesticides in Lompoc, California. Volumes 1 - 4. California Environmental Protection Agency. Department of Pesticide Regulation. March 2003. EH03-02.
DPR. 2005. Environmental Justice Pilot Project – Project Objectives, Pesticides, and Community for Monitoring. California Environmental Protection Agency. Department of Pesticide Regulation. June 2005.
DPR. 2007. Pesticide Use Database 1990-2007. California Environmental Protection Agency. Department of Pesticide Regulation. Sacramento, CA.
DPR. 2007b. Environmental Justice Pilot Project Pest Management Assessment: Soil Fumigant and Organophosphate Insecticide Use and Alternatives – Parlier, Fresno County, California. State of California. Department of Pesticide Regulation. October 2007.
DPR. 2008. Pesticide Chemistry Database. Department of Pesticide Regulation, California Environmental Protection Agency. Sacramento, California. ESRI. 2008. Environmental Systems Research Institute, Inc. ArcInfo version 9.2.
Keith, L.H. 1988. Principles of Environmental Sampling. American Chemical Society. 458 pp.
Lakes Environmental. 2008. WRPLOT View version 5.9.0. Lakes Environmental software.
Majewski, M.S. and P.D. Capel. 1995. Pesticides in the Atmosphere. Distribution, Trends, and Governing Factors. Ann Arbor Press, Inc. Chelsea, MI. 214 pp. Lakes Environmental, 2008. WRPLOT View. Version 5.9.0. http://www.weblakes.com.
Mills, K. and S. Kegley. 2006. Air Monitoring for Chlorpyrifos in Lindsay, California June-July 2004 and July-August 2005. Pesticide Action Network North America. July 14, 2006. http://www.panna.org/index.php?q=drift/catcher/results/DCLindsay04-05.
Ngo, M., Pinkerton, K. S. Freeland, M. Geller, W. Ham, S. Cliff, L. Hopkins, M. Kleeman, U. Kodavanti, E. Meharg, L. Plummer, J. Recendez, M. Schenker, C. Sioutas, S. Smily-Jewell, C. Hass, J. Gutstein and A. Wexler. Airborne Particles in the San Joaquin Valley May Affect Human Health. California Agriculture. Volume 64:1 In print.
84
U.S. EPA. 1990. Definition and Procedure for the Determination of the Method Detection Limit, Revision 1.11. Code of Federal Regulations, Title 40, Part 136, Appendix B.
U.S. EPA. 2007. Reregistration Eligibility Decision for Chlorpyrifos. US Environmental Protection Agency. Office of Pesticide Programs. Wilhoit, et al. 2001. Final report to the California Department of Food and Agriculture for contract agreement No. 98-0241. Data quality of California’s pesticide use report. State of California. Department of Pesticide Regulation. Report PM 01-02 .
85