Embed Size (px)
Citation preview
Physical Activity, Sport, and Health in the
City of Brimbank
A Report to the
Australian Health Policy Collaboration
RM Eime JT Harvey MJ Charity MM Casey
October 2014

Physical Activity, Sport, and Health in the
City of Brimbank
A Report to the
Australian Health Policy Collaboration
RM Eime JT Harvey MJ Charity MM Casey
October 2014
Enquiries: Associate Professor Rochelle Eime Victoria University and Federation University Australia [email protected](03) 53279687
Physical Activity, Sport and Health in the City of Brimbank
i
Copyright
Except as otherwise noted, this work is © Sport and Recreation Spatial (SRS) - Federation University Australia and Victoria Unversity, 2014, under a Creative Commons Attribution-NonCommercial-ShareAlike 3.0 Australia licence.
Excluded material owned by third parties may include, for example, design and layout, text or images obtained under licence from third parties and signatures. We have made all reasonable efforts to identify material owned by third parties. You may copy, distribute and build upon this work. However, you must attribute SRS as the copyright holder of the work.
The full terms and conditions of this licence are available at http://creativecommons.org/licenses/by-nc-sa/3.0/au/legalcode
This report was produced by Federation University, Australia - School of Health Sciences and Psychology, and Victoria University – Institute of Sport, Exercise and Active Living, for the Australian Health Policy Collaboration and the Brimbank City Council. The statistics in the report were compiled from sources believed to be accurate. The views expressed in this report are solely those of the authors and should not be attributed to the AHPC or the Brimbank City Council.
Suggested Citation
Eime, RM., Harvey, JT., Charity, MJ., Casey, MM. Physical activity, Sport and Health in the City of Brimbank – A report to the Australian Health Policy Collaboration. Federation University Australia, VictoriaUniversity, 2014.
Acknowledgements
The support of the Australian Health Policy Collaboration (AHPC) in funding the production of this report is acknowledged, as is the advice and contribution provided by AHPC staff, particularly Rosemary Calder, and other members of the Advisory Committee to the project.
The authors also wish to acknowledge the contributions provided by:
• Staff of the Public Health Information Development Unit (PHIDU), The University of Adelaide, especiallyJohn Glover and Diana Hetzel.
• Staff of the Brimbank City Council, especially Kath Brackett and Sonia Caruana.• People in a number of agencies that provided datasets published in this report, including:
- PHIDU - The Australian Sports Commission: Ceclia Hemana, and Paul Fairweather for provision of Exercise,
Recreation and Sport Survey data - The Department of Transport, Planning and Local Infrastructure, Victoria: Michael Cahill for the
provision of sport and recreation facility data - The following Victorian sports organisations: Australian Football League, Tennis, Netball, Basketball,
Cricket, Hockey, and Lawn Bowls, for sport participation data. • Colleagues who provided invaluable feedback on drafts of the report, especially Warren Payne, Max de
Courten and Jason Leung.
Physical Activity, Sport and Health in the City of Brimbank
ii
Table of Contents List of Abbreviations ........................................................................................................................ iv
Notes about Interpretation ............................................................................................................... iv
Executive Summary ........................................................................................................................ vi
The association between physical activity and sport, and health .................................................. vi Associations between education, health and physical activity, and sport .................................... vii Facilitating participation in physical activity and sport ................................................................. vii Options for physical activity, health and education development in Brimbank ............................ viii
Introduction ..................................................................................................................................... 1
Importance of physical activity and sport to health ....................................................................... 1 Importance of physical activity and sport to education ................................................................. 2 Conceptual model: Health through leisure-time physical activity .................................................. 3
City of Brimbank - Summary of indicators ....................................................................................... 5
Health .......................................................................................................................................... 5 Demographics ............................................................................................................................. 5 Physical activity and sport participation ........................................................................................ 5 Overweight and obesity ............................................................................................................... 6 Diabetes ...................................................................................................................................... 7 Child development vulnerability ................................................................................................... 8 Child development vulnerability: one or more domains ................................................................ 8 Child development vulnerability: physical health and wellbeing .................................................... 9 Child development vulnerability: social competence .................................................................. 10 Child development vulnerability: emotional maturity ................................................................... 11 Child development vulnerability: language and cognitive skills ................................................... 12 Child development vulnerability: communication skills and general knowledge .......................... 13 Psychological distress................................................................................................................ 14 New settler arrivals .................................................................................................................... 15 Overseas born ........................................................................................................................... 16 Low English proficiency ............................................................................................................. 17 Volunteering .............................................................................................................................. 18 Education participation at age 16 ............................................................................................... 19 Post-secondary education qualifications .................................................................................... 20 Relative socio-economic advantage and disadvantage .............................................................. 21 Meeting physical activity guidelines ........................................................................................... 22 Sitting time ................................................................................................................................. 23 Leisure-time physical activity ..................................................................................................... 24 Organised leisure-time physical activity ..................................................................................... 25 Club-based leisure-time physical activity ................................................................................... 26 Regular leisure-time physical activity (LTPA) during past 12 months ......................................... 27 Regular health-enhancing leisure-time physical activity - past 12 months .................................. 28 Recent health-enhancing leisure-time physical activity - past two weeks ................................... 28 Sport participation ...................................................................................................................... 30 Sport participation: all ages ........................................................................................................ 30 Sport participation: by age ranges ............................................................................................. 31 Sport participation: age range 4-9 years .................................................................................... 32
Physical Activity, Sport and Health in the City of Brimbank
iii
Sport participation: age range 10-14 years ................................................................................ 33 Sport participation: age range 15-19 years ................................................................................ 34 Sport participation: age range 20-29 years ................................................................................ 35 Sport participation: age range 30+ years ................................................................................... 36 Sport coaching ........................................................................................................................... 37 Sports facilities........................................................................................................................... 39 Sports playing fields and courts ................................................................................................. 39
Correlations .................................................................................................................................. 42
Correlations among health indicators ......................................................................................... 42 Correlations among demographic indicators .............................................................................. 42 Correlations among physical activity and sport indicators .......................................................... 43 Correlations between health indicators and demographic, physical activity and sport indicators 47 Correlations between demographic indicators and physical activity and sport indicators ........... 49
Discussion .................................................................................................................................... 51
Influences of participation in physical activity and sport ............................................................. 51 Intrapersonal influences on physical activity and sport participation ........................................... 51 Interpersonal influences on physical activity and sport participation ........................................... 53 Organisational and environmental influences on physical activity and sport participation ........... 53
Conclusion .................................................................................................................................... 55
Facilitating participation in physical activity and sport ................................................................ 56 Options for physical activity, health and education development in Brimbank ............................ 57
References ................................................................................................................................... 59
Appendices ................................................................................................................................... 63
Appendix 1: Technical notes ...................................................................................................... 65 Appendix 2: Summary of indicator definitions and sources ........................................................ 68 Appendix 3: Summary of indicators, Brimbank and comparators ............................................... 72
Physical Activity, Sport and Health in the City of Brimbank
iv
List of Abbreviations ABS Australian Bureau of Statistics AEDC Australian Early Development Census BMI Body mass index CALD Culturally and linguistically diverse ERASS Exercise Recreation and Sport Survey ERP Estimated resident population HELPA Health-enhancing leisure-time physical activity HRQoL Health-related quality of life IRSAD Index of Relative Socio-economic Advantage and Disadvantage LGA Local government area LTPA Leisure-time physical activity MET Metabolic equivalent of task MVPA Moderate and vigorous physical activity PA Physical activity PHA Population health area PHIDU Public Health Information Development Unit SEIFA Socio-economic Indexes for Areas SES Socio-economic status SSA State sporting association
Notes about Interpretation • In this report, measures of sport participation are based on the total number of registrations in
seven popular sports (Australian football, basketball, cricket, hockey, lawn bowls, netball and tennis); all ages from 4-100 years are included, but data for a wide range of other sports, including popular sports such as football (soccer), were not available for inclusion.
• More general measures of participation in leisure time physical activity, including organised and club-based activity as well as more casual activity, are based on sample data from the national Exercise Recreation and Sport Survey (ERASS), which covers all sports, but which is limited in age coverage to those aged 15+ years, for whom participation rates are generally much lower than for younger children.
• Data on sports facilities is based on the same seven sports as for the participation data.
• Definitions and sources of all indicators, and the basis of geographical comparisons, can be found in Appendices 1 and 2.

Physical Activity, Sport and Health in the City of Brimbank
v
(This page intentionally left blank)
Physical Activity, Sport and Health in the City of Brimbank
vi
Executive Summary This report provides a summary of key indicators of participation in physical activity (PA) and sport, together with potentially related key demographic characteristics and indicators of health and education, for the City of Brimbank, a local government area (LGA) in the city of Melbourne, Australia. The indicators for the City of Brimbank are benchmarked against other local government areas in Melbourne and aggregates for Western Melbourne, Melbourne and the state of Victoria. An analysis of relationships at the LGA level between the indicators is also included, along with a discussion of these relationships in light of research into the associations between PA and sport participation health, education and other demographic characteristics. In particular, the value of PA and sport for health and education is presented.
It must be noted that the findings reported concern ecological associations, i.e. associations between prevalence (rate) of behaviours or characteristics within the population of each LGA, not about associations at the individual level. This is particularly important when interpreting associations between indicators that relate to different subsets of the LGA population.
The association between physical activity and sport, and health
Key findings
• Participation in leisure-time PA is associated with lower prevalence of overweight and obesity.
• Participation in sport is not generally associated with lower prevalence of overweight and obesity.
• Participation in sport by children aged 5-9 years is associated with lower overall (all-age) prevalence of overweight and obesity.
• Participation in leisure-time PA and sport is associated with lower prevalence of diabetes. • Participation in leisure-time PA and sport is associated with lower prevalence of child
development vulnerability in the domains of physical health and wellbeing, social competence, emotional maturity, language and cognitive, and communication and general knowledge.
• Participation in leisure-time PA and sport is associated with lower prevalence of psychological distress.
• The association between participation in leisure-time PA and sport and better overall (all-age) health outcomes was stronger for participation among younger age groups (<20 years) than for participation among older age groups.
Overall, it seems that any form of participation in PA, whether it be general leisure-time PA or more specifically sport participation is associated with better all-age, across-community health outcomes, and specifically for diabetes, child vulnerability and psychological distress.
Major gaps
• While some survey data are available to support investigation at state or national level of the relationship between an individual’s participation in PA and sport and their health outcomes, current data sources are insufficient for individual-level investigations of this type within smaller regions such as Brimbank.
• The same limitation applies to investigation of the determinants of individuals’ participation in PA and sport.
Physical Activity, Sport and Health in the City of Brimbank
vii
• There is also a lack of data to support investigation of the effects of different levels (duration, frequency, intensity) and types of PA and sport on a range of health outcomes.
Associations between education, health and physical activity, and sport
Key findings
• Participation in education, whether at age 16 or at post-secondary education level, is associated with higher rates of leisure-time PA and sport participation, although there is a more significant association at age 16 than the later education period (post-secondary education).
• Both levels of education (participation at age 16, and post-secondary participation) are associated with better health outcomes.
• However, education participation at age 16, when compared with participation in post-secondary education, has a more significant association with child developmental vulnerability, whereas other health outcomes such as overweight and obesity, diabetes and psychological distress are more significantly associated with participation in post-secondary education.
• The prevalence of post-secondary education qualifications in an LGA is positively associated with the rate of leisure-time PA among adults, and with the rate of sport participation among children aged 4-14 years.
Major gaps
• While there is some evidence in the literature that PA and sport may play a role in academic outcomes for children and adolescents, no data were available to enable investigation of such associations in this report.
Facilitating participation in physical activity and sport The characteristics of the Brimbank community are such that participation rates in PA and sport are relatively low, both with regard to the specific traditional sporting activities examined in this report and also for sport and PA in general. Further, the community is not well provided with facilities for sport and physical activity participation.
The City of Brimbank has established a number of initiatives to address this issue. In order to support and expand these initiatives, a comprehensive strategy to promote increased participation in PA and sport might include one or more of the following:
1. Community information and engagement strategies:
• A community capacity development approach- Partnering key organisations and people, and empowering people within the community to be a part of the decision making process in developing opportunities for PA and sport.
• A community education and awareness campaign- (e.g. social media) promoting PA guidelines and associated health benefits.
2. Enhancement strategies for facilities use:
• Availability of facilities- An audit of sport and public recreational facilities and spaces, for both traditional structured sport and unstructured leisure-time PA.
Physical Activity, Sport and Health in the City of Brimbank
viii
• Use of facilities- A detailed investigation of the use of current sport facilities and public recreation spaces.
• Sport and recreation facility growth plan- Analysis and formulation of a plan for development of sport and recreation facilities taking into account future population growth
3. Participation support strategies:
• Cost of participation- An analysis of the cost of participation in a range of physical activities and sports including necessary equipment, membership etc.
• Cost amelioration strategies- E.g. sports equipment and uniform library/loan system, sport club participation voucher system.
• Participation, health and education- A survey of participation of children and adults in sport and other leisure-time PA, together with health and education measures. This would provide individual-level evidence to complement the community-level ecological evidence presented in this report.
• Individual competency- Skill development components/strategies/programs for individual competency.
4. School-community strategies:
• Collaborative review of school policies and practices around PA- Review curriculum policies, practices and school facility availability for the 40 primary and secondary schools within Brimbank, including.
• School-community linkages- Programs linking school pupils and those who have recently left school into sport and recreational opportunities.
Options for physical activity, health and education development in Brimbank Based on the findings of this report, and taking into consideration existing infrastructure and initiatives already established in the City of Brimbank, the following four options are supported for further development:
1) Survey of leisure-time physical activity
2) Survey of school policy and practice
3) Evaluation of existing In2Sport voucher program in the City of Brimbank
4) Analysis of participation data collected by the City of Brimbank
Physical Activity, Sport and Health in the City of Brimbank
ix
(This page intentionally left blank)
Physical Activity, Sport and Health in the City of Brimbank
1
Introduction Importance of physical activity and sport to health Health is defined as “a state of complete physical, mental and social well-being and not merely the absence of disease or infirmity” 1. Physical activity (PA) is consistently associated with health benefits and improved quality of life, aiding in the prevention or amelioration of many chronic conditions including heart disease, hypertension, diabetes, obesity, mental health disorders, and cancer 2, 3 . Regular PA can have substantial health benefits even in small doses 4. However one-third of adults and four-fifths of adolescents worldwide do not meet recommended levels of PA 5. Inactivity rises with age, is higher in women than men, and is increased in high income communities and countries 5.
Although there are many different ways in which people can be physically active, the focus of this report is on leisure-time (or recreational) physical activity (LTPA), and whether the frequency and intensity of participation in LTPA are at levels considered health enhancing. Given that participation in PA, and more specifically the different contexts and settings of participation vary across the lifespan 6, 7, participation within different age ranges have been reported.
Sport is an organised form of PA that is usually competitive, although less structured, social forms also exist 6. In Australia, sports clubs play a key role in community PA with participation in sport often facilitated through these organisations 8. Participation in sport tends to be very popular amongst children, however this declines in adolescence when there is a trend towards more unstructured PA 6. For adults, participation in LTPA is more likely to occur in non-club-based settings than in club-based sport, a tendency that has increased in the past decade 7.
There is evidence that sport participation can result in greater health benefits compared to other less organised or more individual forms of PA 9, 10. Specifically, sport participation has been associated with better psychological and social health outcomes, particularly due to the social nature of sport participation, for children and adolescents, as well as for adults9, 10. For instance, one study showed that women who participated in club-based sport (netball or tennis) had significantly higher scores on most health-related quality of life (HRQoL) measures than those who participated in individual physical activities (gym and walking) 11. Likewise, a study of longitudinal associations between sports participation and HRQoL in children found that children who maintain their participation in sport have better HRQoL than those who either do not participate in sports, drop out of sports, or who commence participation after the age of eight years 12. Furthermore, children who participate in team sport maintain higher HRQoL scores than children who only participate in individual sports 12. For adolescents, involvement in sport has been found to be a significant predictor of lower depression symptoms, lower perceived stress, and higher self-rated mental health in young adulthood 13.
Whereas studies associated with children and adolescents predominantly report the social health aspects associated with participation in sport - improved social interaction/integration and social skills and improved self-esteem, studies in adults mainly highlighted psychological health aspects of well-being and reduced stress and distress 9, 10. Researchers have therefore suggested that sport participation is advocated as a form of LTPA for children, adolescents and adults to help reduce the incidence of chronic conditions associated with low PA levels and to enhance other psychological and social health outcomes 9, 10. Developmentally appropriate team sport also appears to help protect HRQoL with researchers suggesting it should be encouraged from an early age and maintained for as long as possible 12.
Physical Activity, Sport and Health in the City of Brimbank
2
Furthermore, in terms of the ‘dose-response’ of PA or sport on health, evidence suggests the level of physical health is positively associated with the level of leisure-time PA, and that the context and setting is also important, with club sport participation contributing to greater benefits at low to moderate levels than participation in gymnasium or walking activities for adult women 14.
For adults, in respect of the ‘dose-response’ - the relationship between the amount of exercise performed in an activity and the health benefits resulting from that activity – of either leisure time physical activity (LTPA) or sport, evidence suggests the level of physical health is positively associated with the level of leisure-time PA, and that the context and setting is also important, with club sport participation contributing to greater benefits at low to moderate levels than participation in gymnasium or walking activities for adult women 14.
Importance of physical activity and sport to education Given that PA is positively associated with better cognitive functioning and improves concentration, memory and classroom behaviour 15, 16, it might be expected that PA would be positively associated with academic performance 17-19. However, studies directly investigating the relationship between PA and academic performance have been inconclusive, with many not including the complete range of physical activities in which children can participate, while others lacked methodological rigor, particularly in PA measurement 20. Similarly, systematic reviews report either mixed findings for school-based PA and academic performance 21, or report only short-term outcomes such as improved concentration and arousal, with long-term improvement of academic achievement unsubstantiated 22, 23.
More recently, a systematic review of the prospective relationship between PA and academic performance that accounted for methodological quality of studies reported that PA was positively related to academic performance in children 20. The authors included only high quality studies that use objective measures of PA in a range of contexts to understand the dose-response relationship between PA and academic performance 20. A recent longitudinal study in the UK with adolescents objectively measured PA using accelerometry at age 11 to test for associations between PA and academic attainment at ages 11, 13 and 16 24. A long-term positive impact of moderate-vigorous intensity PA (MVPA) on academic attainment was reported across academic subjects including English, Maths and Science. There was some evidence of a dose-response effect among males, with those doing the most MVPA having higher academic attainment at age 16 than those doing the least MVPA. A similar pattern was found for females; however, PA levels were low for females with even the highest MVPA quintile only averaging 37 minutes of MVPA 24, limiting the capacity of the study to conclusively detect a dose-response effect for females.
While evidence of a relationship between PA and academic performance needs to be further substantiated 20, 24, the promotion of PA would now appear to be important from both a public health and an education policy perspective 24.
Physical Activity, Sport and Health in the City of Brimbank
3
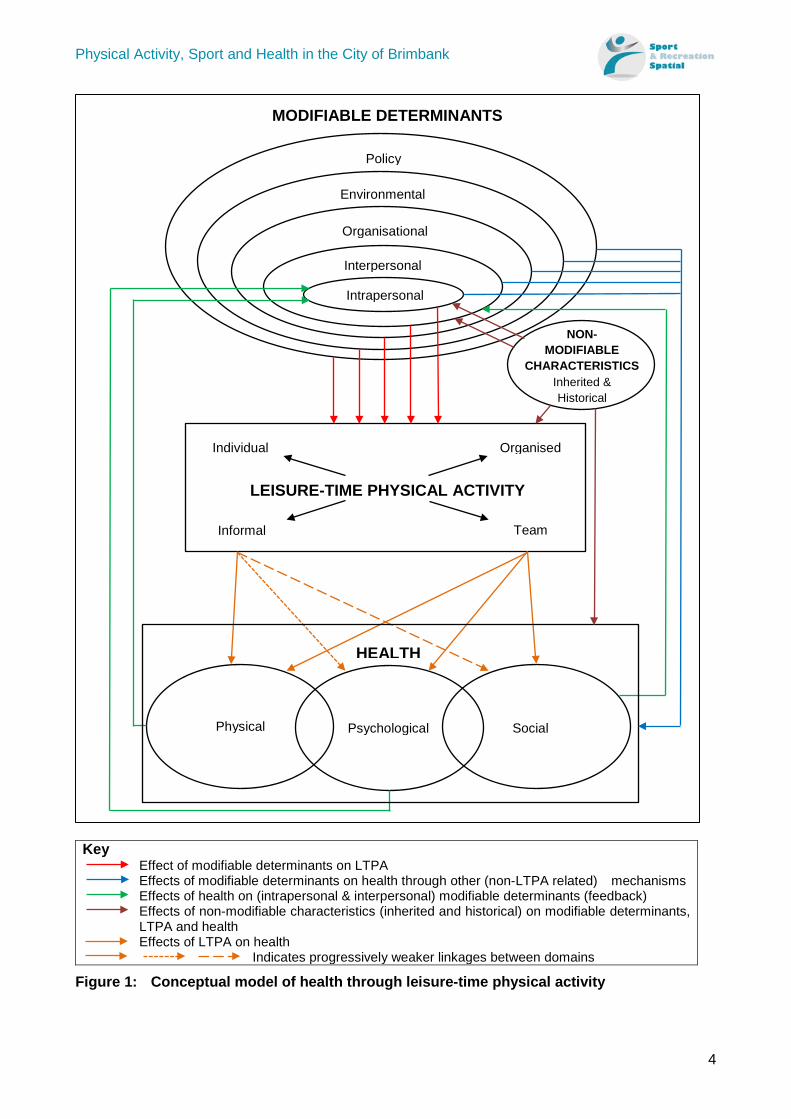
Conceptual model: Health through leisure-time physical activity The conceptual model: Health Through LTPA has been adapted from a model previously developed by the authors of this report - the Health Through Sport conceptual model 9, 10. This adapted model is broader in scope, incorporating participation determinants and outcomes associated with LTPA, rather than relating to sport alone. A further refinement is the distinction between modifiable and non-modifiable determinants.
The model depicts the relationship between the determinants driving LTPA participation, and the psychological and social health benefits of participation. The determinants are depicted in terms of the socio-ecological model.
It is important to view the model as describing the interplay between the determinants as well as their interplay with health outcomes. For example, a combination of policy, environment and intrapersonal determinants may collectively influence the likelihood of an individual engaging in a certain leisure-time PA.
Physical Activity, Sport and Health in the City of Brimbank
4
Key Effect of modifiable determinants on LTPA Effects of modifiable determinants on health through other (non-LTPA related) mechanisms Effects of health on (intrapersonal & interpersonal) modifiable determinants (feedback) Effects of non-modifiable characteristics (inherited and historical) on modifiable determinants,
LTPA and health Effects of LTPA on health Indicates progressively weaker linkages between domains
Figure 1: Conceptual model of health through leisure-time physical activity
NON- MODIFIABLE
CHARACTERISTICS Inherited & Historical
Organised Individual
Informal Team
LEISURE-TIME PHYSICAL ACTIVITY
Policy
Environmental
Organisational
Interpersonal
Physical Social Psychological
HEALTH
Intrapersonal
MODIFIABLE DETERMINANTS
Physical Activity, Sport and Health in the City of Brimbank
5
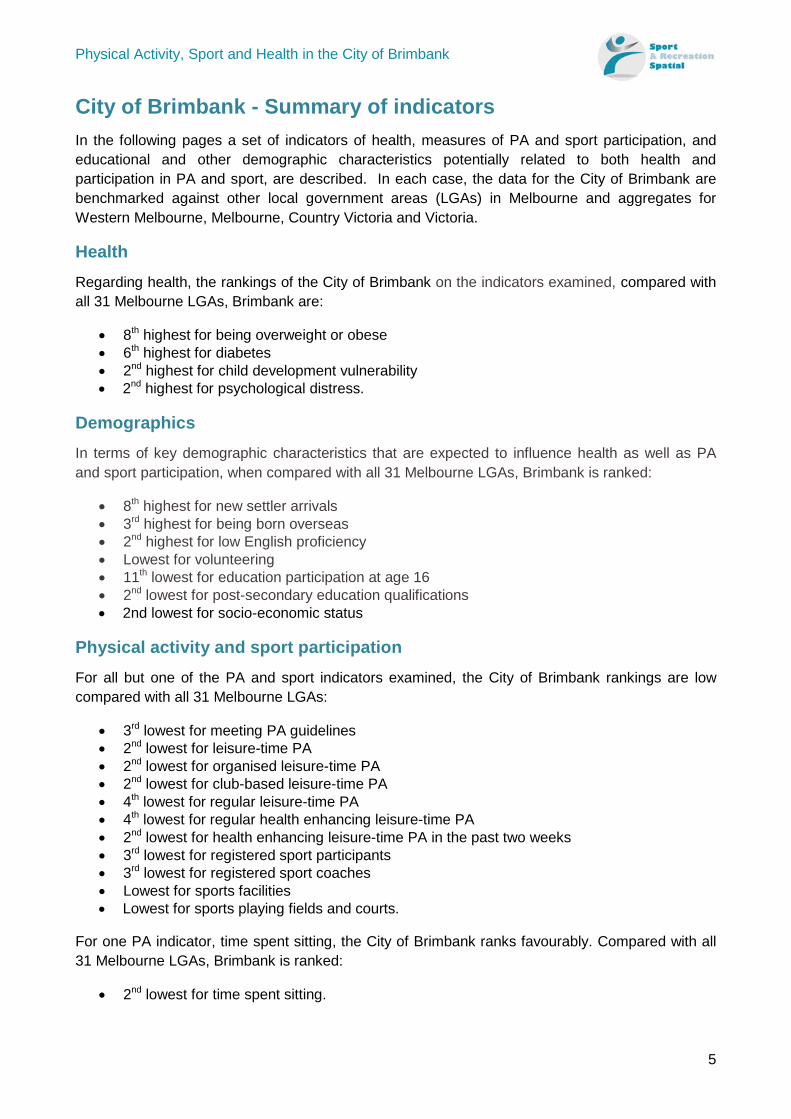
City of Brimbank - Summary of indicators In the following pages a set of indicators of health, measures of PA and sport participation, and educational and other demographic characteristics potentially related to both health and participation in PA and sport, are described. In each case, the data for the City of Brimbank are benchmarked against other local government areas (LGAs) in Melbourne and aggregates for Western Melbourne, Melbourne, Country Victoria and Victoria.
Health Regarding health, the rankings of the City of Brimbank on the indicators examined, compared with all 31 Melbourne LGAs, Brimbank are:
• 8th highest for being overweight or obese • 6th highest for diabetes • 2nd highest for child development vulnerability • 2nd highest for psychological distress.
Demographics In terms of key demographic characteristics that are expected to influence health as well as PA and sport participation, when compared with all 31 Melbourne LGAs, Brimbank is ranked:
• 8th highest for new settler arrivals • 3rd highest for being born overseas • 2nd highest for low English proficiency • Lowest for volunteering • 11th lowest for education participation at age 16 • 2nd lowest for post-secondary education qualifications • 2nd lowest for socio-economic status
Physical activity and sport participation For all but one of the PA and sport indicators examined, the City of Brimbank rankings are low compared with all 31 Melbourne LGAs:
• 3rd lowest for meeting PA guidelines • 2nd lowest for leisure-time PA • 2nd lowest for organised leisure-time PA • 2nd lowest for club-based leisure-time PA • 4th lowest for regular leisure-time PA • 4th lowest for regular health enhancing leisure-time PA • 2nd lowest for health enhancing leisure-time PA in the past two weeks • 3rd lowest for registered sport participants • 3rd lowest for registered sport coaches • Lowest for sports facilities • Lowest for sports playing fields and courts.
For one PA indicator, time spent sitting, the City of Brimbank ranks favourably. Compared with all 31 Melbourne LGAs, Brimbank is ranked:
• 2nd lowest for time spent sitting.
Physical Activity, Sport and Health in the City of Brimbank
6
Overweight and obesity
Being overweight or obese increases an individual’s risk of poor health from long-term conditions like cardiovascular disease, type 2 diabetes and high blood pressure 25.
Indicator definition: An individual has been defined as being overweight or obese by calculating their Body Mass Index (BMI), which is a measure used to estimate levels of unhealthy weight in a population. BMI is calculated as weight in kilograms divided by height in metres squared. A BMI score of 25.0-29.9 is classified as overweight and BMI scores above 30.0 are considered obese.
Key Points
• The proportion of people who were overweight or obese varied considerably across Melbourne and Victoria.
• The City of Brimbank had a high proportion of people who were overweight or obese, compared to Melbourne or Victoria as a whole.
Geographic variation
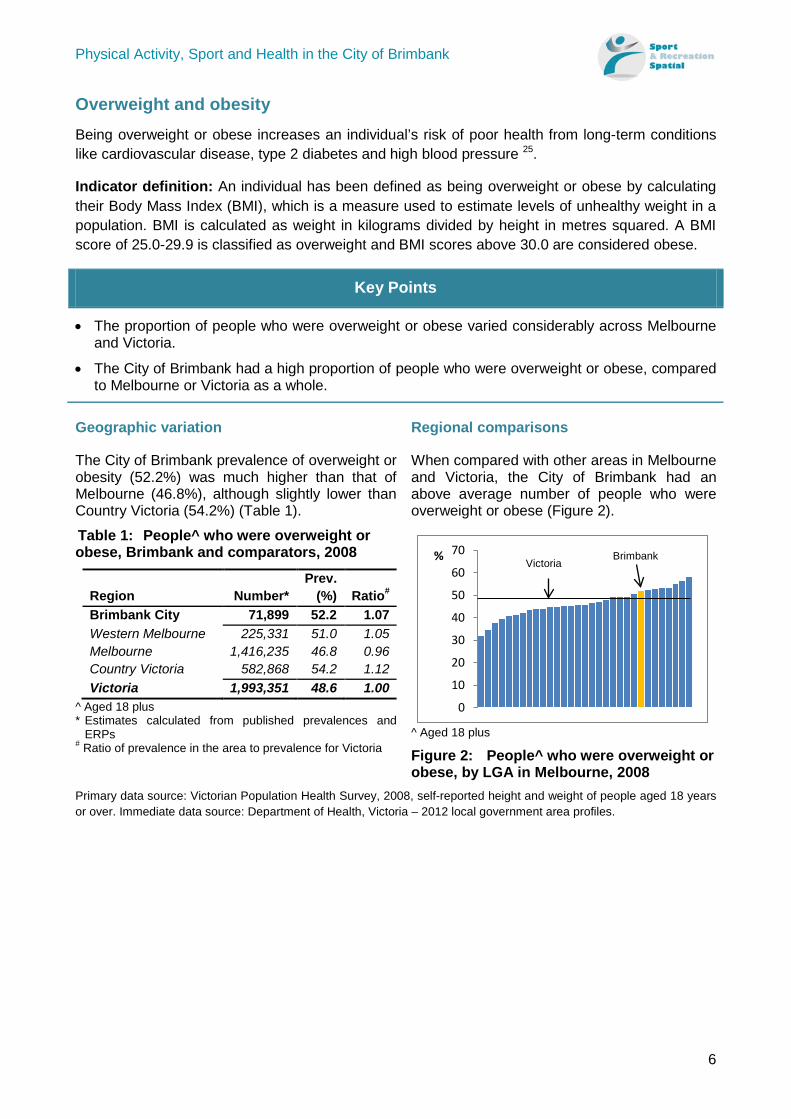
The City of Brimbank prevalence of overweight or obesity (52.2%) was much higher than that of Melbourne (46.8%), although slightly lower than Country Victoria (54.2%) (Table 1).
Table 1: People^ who were overweight or obese, Brimbank and comparators, 2008
Region Number* Prev.
(%) Ratio# Brimbank City 71,899 52.2 1.07 Western Melbourne 225,331 51.0 1.05 Melbourne 1,416,235 46.8 0.96 Country Victoria 582,868 54.2 1.12 Victoria 1,993,351 48.6 1.00
^ Aged 18 plus * Estimates calculated from published prevalences and
ERPs # Ratio of prevalence in the area to prevalence for Victoria
Regional comparisons
When compared with other areas in Melbourne and Victoria, the City of Brimbank had an above average number of people who were overweight or obese (Figure 2).
^ Aged 18 plus
Figure 2: People^ who were overweight or obese, by LGA in Melbourne, 2008
Primary data source: Victorian Population Health Survey, 2008, self-reported height and weight of people aged 18 years or over. Immediate data source: Department of Health, Victoria – 2012 local government area profiles.
0
10
20
30
40
50
60
70% Victoria Brimbank
Physical Activity, Sport and Health in the City of Brimbank
7
Diabetes
Type 2 diabetes is the most common form of diabetes and represents 85-90% of all cases of diabetes 26. Type 2 diabetes has historically affected mature adults, however more young people and children are now being diagnosed 26.
Indicator definition: The proportion of people aged 18 years or over who reported that they had been told by a doctor that they had type 2 diabetes.
Key Points
• The proportion of people with type 2 diabetes varied considerably across Melbourne and Victoria.
• The City of Brimbank had a high proportion of people with type 2 diabetes, compared to Melbourne or Victoria as a whole.
Geographic variation
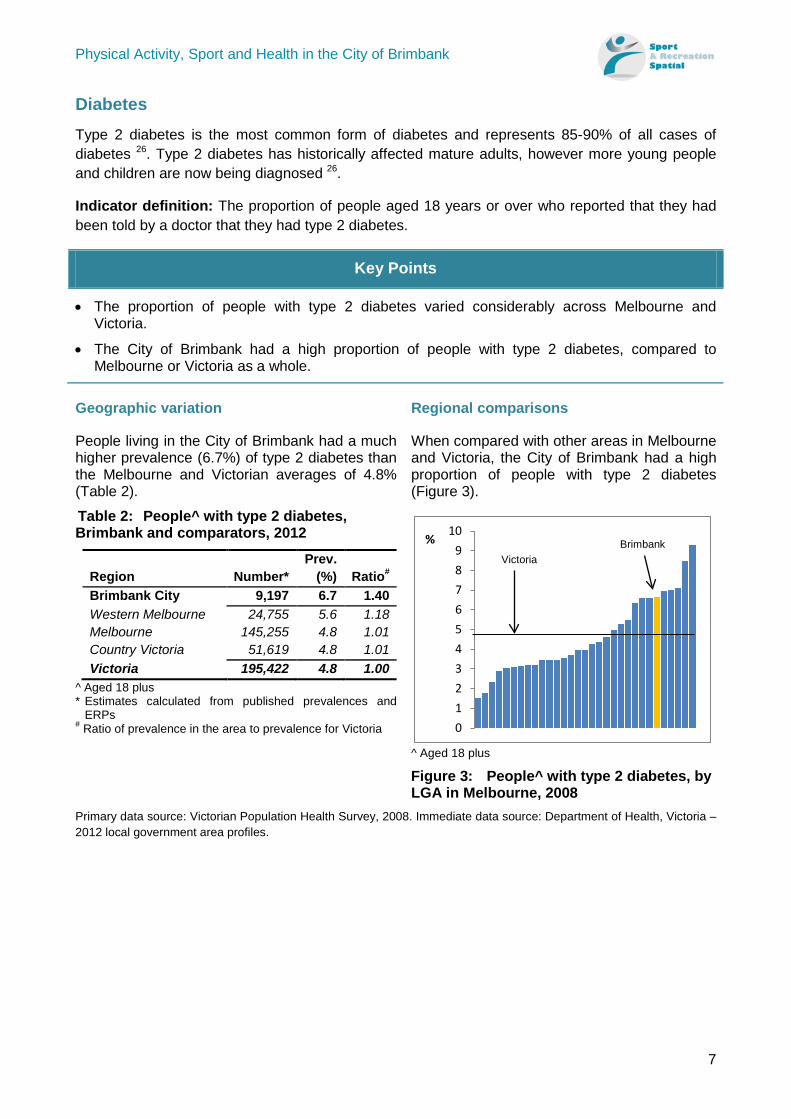
People living in the City of Brimbank had a much higher prevalence (6.7%) of type 2 diabetes than the Melbourne and Victorian averages of 4.8% (Table 2).
Table 2: People^ with type 2 diabetes, Brimbank and comparators, 2012
Region Number* Prev.
(%) Ratio# Brimbank City 9,197 6.7 1.40 Western Melbourne 24,755 5.6 1.18 Melbourne 145,255 4.8 1.01 Country Victoria 51,619 4.8 1.01 Victoria 195,422 4.8 1.00
^ Aged 18 plus * Estimates calculated from published prevalences and
ERPs # Ratio of prevalence in the area to prevalence for Victoria
Regional comparisons
When compared with other areas in Melbourne and Victoria, the City of Brimbank had a high proportion of people with type 2 diabetes (Figure 3).
^ Aged 18 plus
Figure 3: People^ with type 2 diabetes, by LGA in Melbourne, 2008
Primary data source: Victorian Population Health Survey, 2008. Immediate data source: Department of Health, Victoria – 2012 local government area profiles.
0123456789
10%
Victoria Brimbank
Physical Activity, Sport and Health in the City of Brimbank
8
Child development vulnerability
Child development is important for health, education and social outcomes later in life 27. Five domains that are important for early childhood development are: physical health and wellbeing, social competence, emotional maturity, language and cognitive skills, and communication skills and general knowledge.
Indicator definition: The Australian Early Development Census (AEDC) is a population measure of how young children are developing in Australian communities, as they begin school, across the five domains of early childhood development outlined above. Children in the lowest 10% of all Australian children in any of these domains are considered ‘developmentally vulnerable’.
Child development vulnerability: one or more domains
Key Points
• The proportion of children who were developmentally vulnerable in one or more domains of the AEDC varied considerably across Melbourne and Victoria.
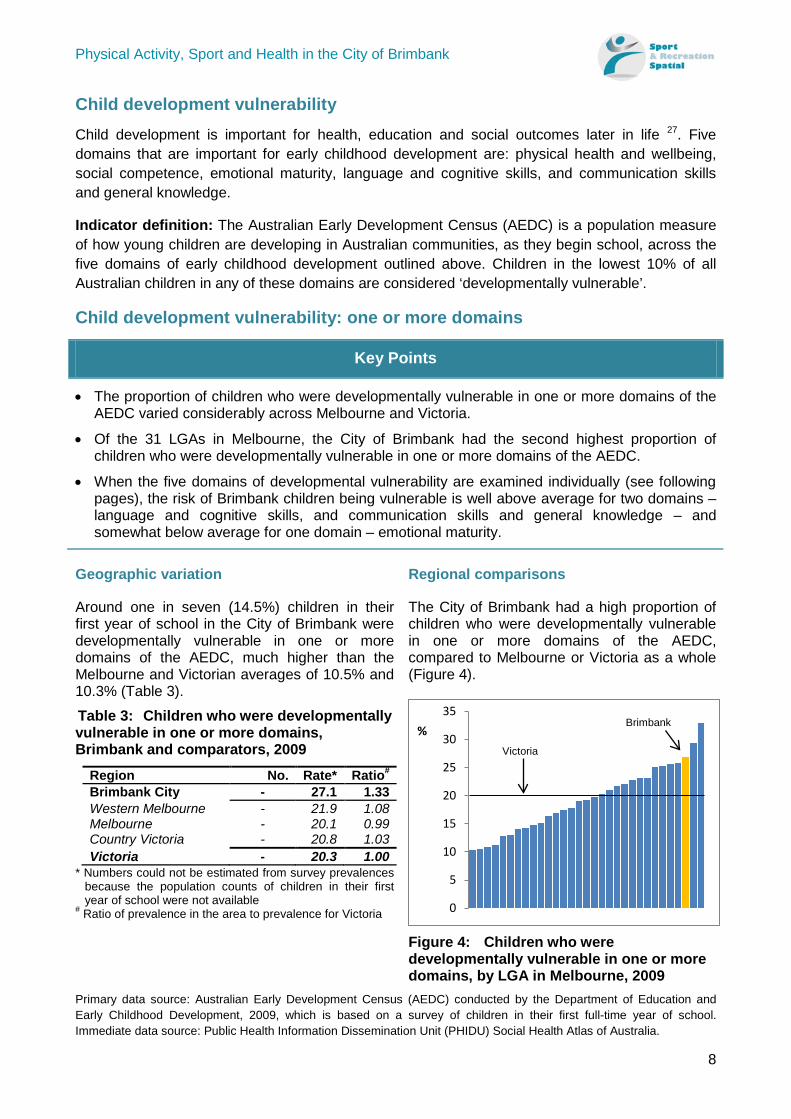
• Of the 31 LGAs in Melbourne, the City of Brimbank had the second highest proportion of children who were developmentally vulnerable in one or more domains of the AEDC.
• When the five domains of developmental vulnerability are examined individually (see following pages), the risk of Brimbank children being vulnerable is well above average for two domains – language and cognitive skills, and communication skills and general knowledge – and somewhat below average for one domain – emotional maturity.
Geographic variation
Around one in seven (14.5%) children in their first year of school in the City of Brimbank were developmentally vulnerable in one or more domains of the AEDC, much higher than the Melbourne and Victorian averages of 10.5% and 10.3% (Table 3).
Table 3: Children who were developmentally vulnerable in one or more domains, Brimbank and comparators, 2009
Region No. Rate* Ratio# Brimbank City - 27.1 1.33 Western Melbourne - 21.9 1.08 Melbourne - 20.1 0.99 Country Victoria - 20.8 1.03 Victoria - 20.3 1.00
* Numbers could not be estimated from survey prevalences because the population counts of children in their first year of school were not available
# Ratio of prevalence in the area to prevalence for Victoria
Regional comparisons
The City of Brimbank had a high proportion of children who were developmentally vulnerable in one or more domains of the AEDC, compared to Melbourne or Victoria as a whole (Figure 4).
Figure 4: Children who were developmentally vulnerable in one or more domains, by LGA in Melbourne, 2009
Primary data source: Australian Early Development Census (AEDC) conducted by the Department of Education and Early Childhood Development, 2009, which is based on a survey of children in their first full-time year of school. Immediate data source: Public Health Information Dissemination Unit (PHIDU) Social Health Atlas of Australia.
0
5
10
15
20
25
30
35%
Victoria
Brimbank
Physical Activity, Sport and Health in the City of Brimbank
9
Child development vulnerability: physical health and wellbeing
Key Points
• The proportion of children who were developmentally vulnerable with regard to physical health and wellbeing varied considerably across Melbourne and Victoria.
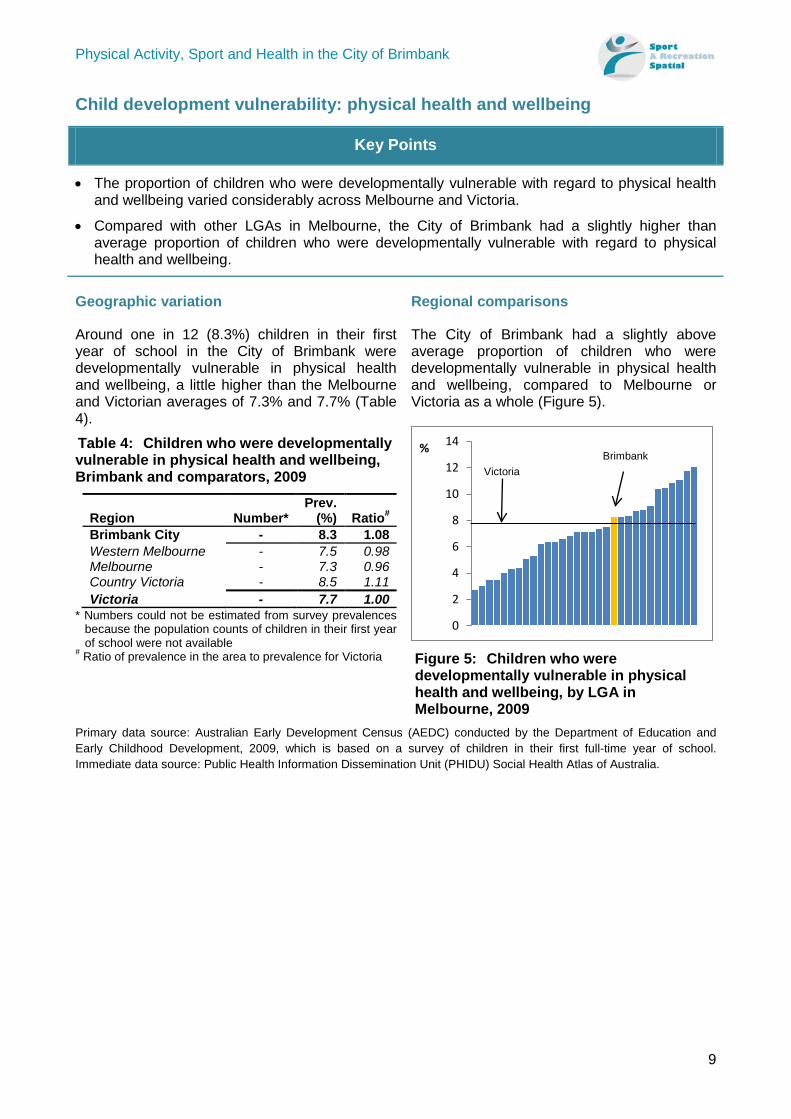
• Compared with other LGAs in Melbourne, the City of Brimbank had a slightly higher than average proportion of children who were developmentally vulnerable with regard to physical health and wellbeing.
Geographic variation
Around one in 12 (8.3%) children in their first year of school in the City of Brimbank were developmentally vulnerable in physical health and wellbeing, a little higher than the Melbourne and Victorian averages of 7.3% and 7.7% (Table 4).
Table 4: Children who were developmentally vulnerable in physical health and wellbeing, Brimbank and comparators, 2009
Region Number* Prev.
(%) Ratio# Brimbank City - 8.3 1.08 Western Melbourne - 7.5 0.98 Melbourne - 7.3 0.96 Country Victoria - 8.5 1.11 Victoria - 7.7 1.00
* Numbers could not be estimated from survey prevalences because the population counts of children in their first year of school were not available
# Ratio of prevalence in the area to prevalence for Victoria
Regional comparisons
The City of Brimbank had a slightly above average proportion of children who were developmentally vulnerable in physical health and wellbeing, compared to Melbourne or Victoria as a whole (Figure 5).
Figure 5: Children who were developmentally vulnerable in physical health and wellbeing, by LGA in Melbourne, 2009
Primary data source: Australian Early Development Census (AEDC) conducted by the Department of Education and Early Childhood Development, 2009, which is based on a survey of children in their first full-time year of school. Immediate data source: Public Health Information Dissemination Unit (PHIDU) Social Health Atlas of Australia.
0
2
4
6
8
10
12
14% Brimbank
Victoria
Physical Activity, Sport and Health in the City of Brimbank
10
Child development vulnerability: social competence
Key Points
• The proportion of children who were developmentally vulnerable with regard to social competence varied considerably across Melbourne and Victoria.
• Compared with other LGAs in Melbourne, the City of Brimbank had a slightly higher than average proportion of children who were developmentally vulnerable with regard to social competence.
Geographic variation
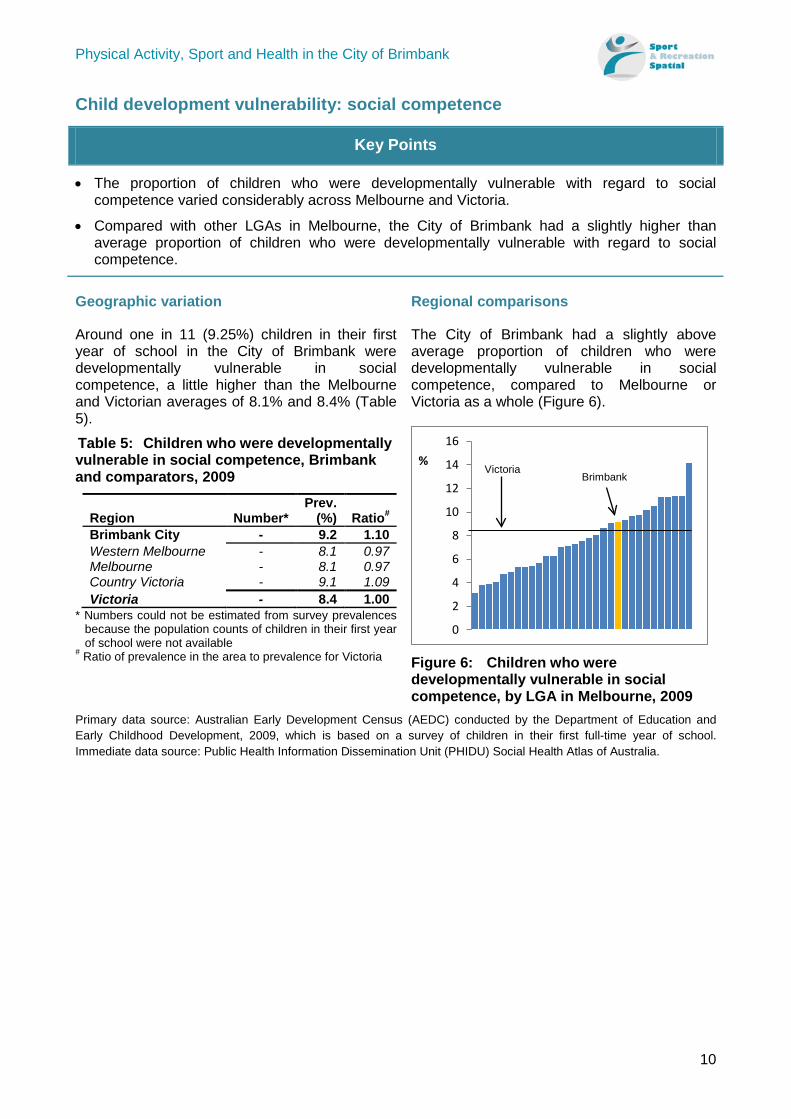
Around one in 11 (9.25%) children in their first year of school in the City of Brimbank were developmentally vulnerable in social competence, a little higher than the Melbourne and Victorian averages of 8.1% and 8.4% (Table 5).
Table 5: Children who were developmentally vulnerable in social competence, Brimbank and comparators, 2009
Region Number* Prev.
(%) Ratio# Brimbank City - 9.2 1.10 Western Melbourne - 8.1 0.97 Melbourne - 8.1 0.97 Country Victoria - 9.1 1.09 Victoria - 8.4 1.00
* Numbers could not be estimated from survey prevalences because the population counts of children in their first year of school were not available
# Ratio of prevalence in the area to prevalence for Victoria
Regional comparisons
The City of Brimbank had a slightly above average proportion of children who were developmentally vulnerable in social competence, compared to Melbourne or Victoria as a whole (Figure 6).
Figure 6: Children who were developmentally vulnerable in social competence, by LGA in Melbourne, 2009
Primary data source: Australian Early Development Census (AEDC) conducted by the Department of Education and Early Childhood Development, 2009, which is based on a survey of children in their first full-time year of school. Immediate data source: Public Health Information Dissemination Unit (PHIDU) Social Health Atlas of Australia.
0
2
4
6
8
10
12
14
16%
Victoria Brimbank
Physical Activity, Sport and Health in the City of Brimbank
11
Child development vulnerability: emotional maturity
Key Points
• The proportion of children who were developmentally vulnerable with regard to emotional maturity varied considerably across Melbourne and Victoria.
• Compared with other LGAs in Melbourne, the City of Brimbank had a slightly lower than average proportion of children who were developmentally vulnerable with regard to emotional maturity.
Geographic variation
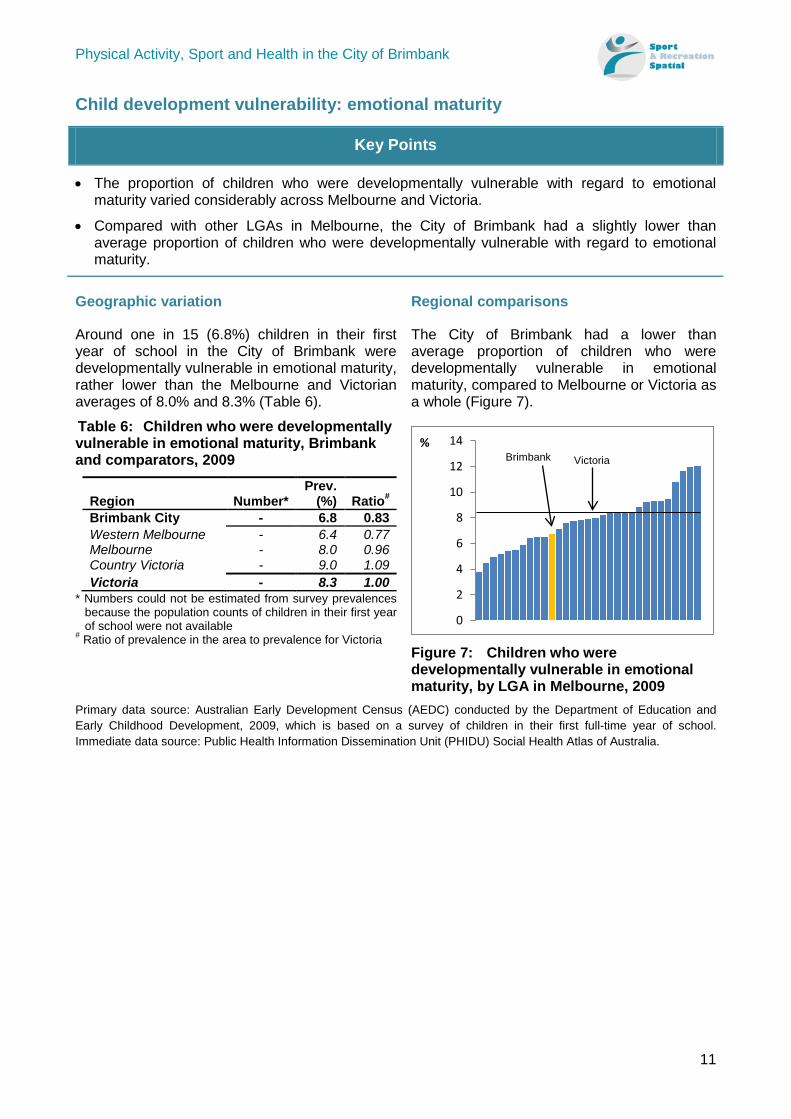
Around one in 15 (6.8%) children in their first year of school in the City of Brimbank were developmentally vulnerable in emotional maturity, rather lower than the Melbourne and Victorian averages of 8.0% and 8.3% (Table 6).
Table 6: Children who were developmentally vulnerable in emotional maturity, Brimbank and comparators, 2009
Region Number* Prev.
(%) Ratio# Brimbank City - 6.8 0.83 Western Melbourne - 6.4 0.77 Melbourne - 8.0 0.96 Country Victoria - 9.0 1.09 Victoria - 8.3 1.00
* Numbers could not be estimated from survey prevalences because the population counts of children in their first year of school were not available
# Ratio of prevalence in the area to prevalence for Victoria
Regional comparisons
The City of Brimbank had a lower than average proportion of children who were developmentally vulnerable in emotional maturity, compared to Melbourne or Victoria as a whole (Figure 7).
Figure 7: Children who were developmentally vulnerable in emotional maturity, by LGA in Melbourne, 2009
Primary data source: Australian Early Development Census (AEDC) conducted by the Department of Education and Early Childhood Development, 2009, which is based on a survey of children in their first full-time year of school. Immediate data source: Public Health Information Dissemination Unit (PHIDU) Social Health Atlas of Australia.
0
2
4
6
8
10
12
14% Victoria Brimbank
Physical Activity, Sport and Health in the City of Brimbank
12
Child development vulnerability: language and cognitive skills
Key Points
• The proportion of children who were developmentally vulnerable with regard to language and cognitive skills varied considerably across Melbourne and Victoria.
• Of the 31 LGAs in Melbourne, the City of Brimbank had the fifth highest proportion of children who were developmentally vulnerable with regard to language and cognitive skills.
Geographic variation
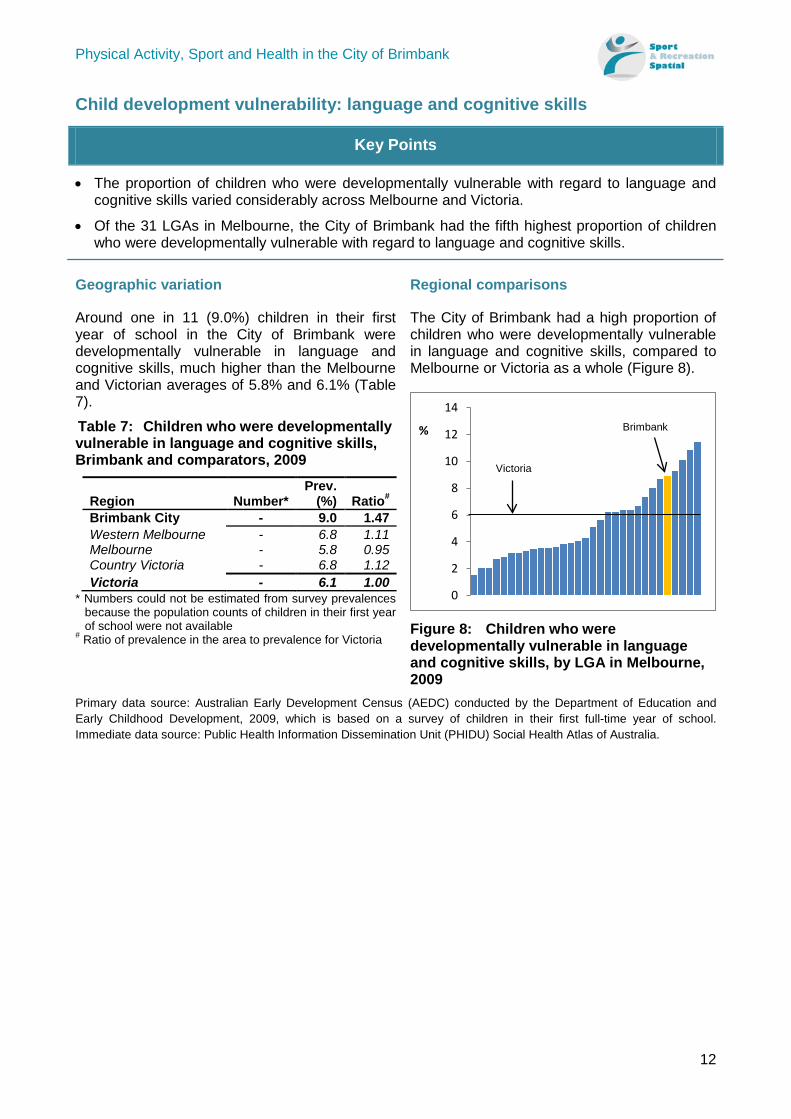
Around one in 11 (9.0%) children in their first year of school in the City of Brimbank were developmentally vulnerable in language and cognitive skills, much higher than the Melbourne and Victorian averages of 5.8% and 6.1% (Table 7).
Table 7: Children who were developmentally vulnerable in language and cognitive skills, Brimbank and comparators, 2009
Region Number* Prev.
(%) Ratio# Brimbank City - 9.0 1.47 Western Melbourne - 6.8 1.11 Melbourne - 5.8 0.95 Country Victoria - 6.8 1.12 Victoria - 6.1 1.00
* Numbers could not be estimated from survey prevalences because the population counts of children in their first year of school were not available
# Ratio of prevalence in the area to prevalence for Victoria
Regional comparisons
The City of Brimbank had a high proportion of children who were developmentally vulnerable in language and cognitive skills, compared to Melbourne or Victoria as a whole (Figure 8).
Figure 8: Children who were developmentally vulnerable in language and cognitive skills, by LGA in Melbourne, 2009
Primary data source: Australian Early Development Census (AEDC) conducted by the Department of Education and Early Childhood Development, 2009, which is based on a survey of children in their first full-time year of school. Immediate data source: Public Health Information Dissemination Unit (PHIDU) Social Health Atlas of Australia.
0
2
4
6
8
10
12
14
%
Victoria
Brimbank
Physical Activity, Sport and Health in the City of Brimbank
13
Child development vulnerability: communication skills and general knowledge
Key Points
• The proportion of children who were developmentally vulnerable with regard to communication skills and general knowledge varied considerably across Melbourne and Victoria.
• Of the 31 LGAs in Melbourne, the City of Brimbank had the second highest proportion of children who were developmentally vulnerable with regard to communication skills and general knowledge.
Geographic variation
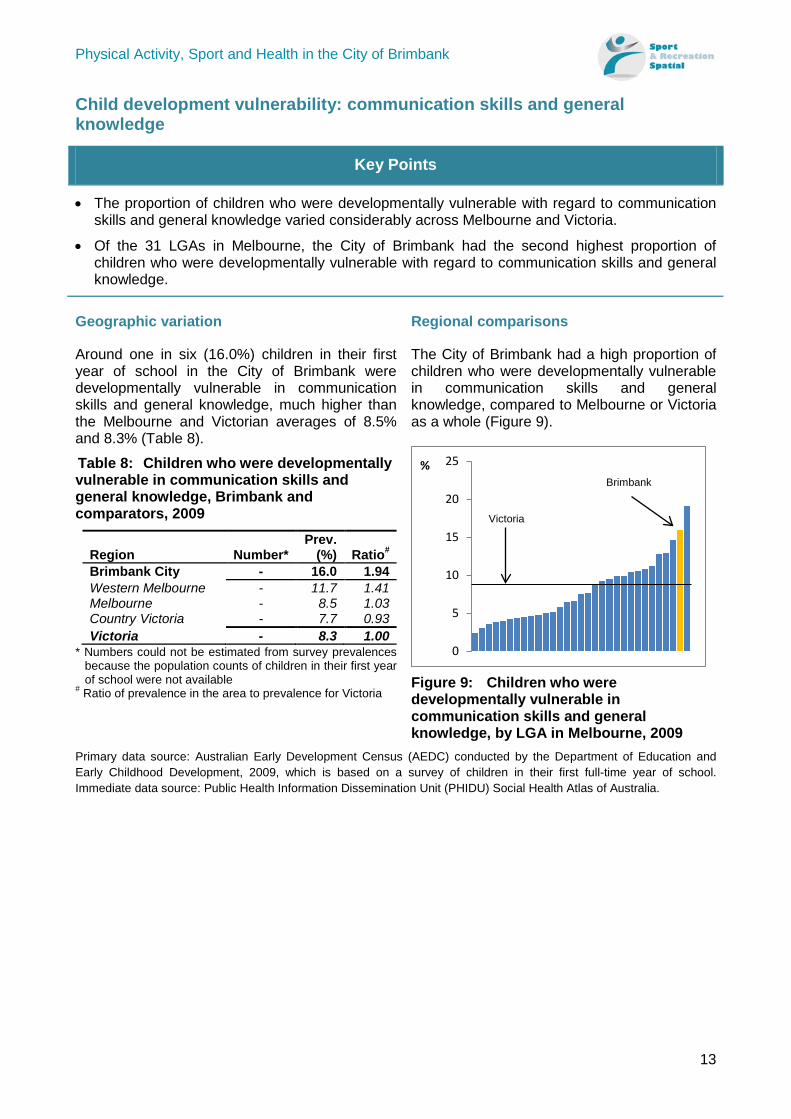
Around one in six (16.0%) children in their first year of school in the City of Brimbank were developmentally vulnerable in communication skills and general knowledge, much higher than the Melbourne and Victorian averages of 8.5% and 8.3% (Table 8).
Table 8: Children who were developmentally vulnerable in communication skills and general knowledge, Brimbank and comparators, 2009
Region Number* Prev.
(%) Ratio# Brimbank City - 16.0 1.94 Western Melbourne - 11.7 1.41 Melbourne - 8.5 1.03 Country Victoria - 7.7 0.93 Victoria - 8.3 1.00
* Numbers could not be estimated from survey prevalences because the population counts of children in their first year of school were not available
# Ratio of prevalence in the area to prevalence for Victoria
Regional comparisons
The City of Brimbank had a high proportion of children who were developmentally vulnerable in communication skills and general knowledge, compared to Melbourne or Victoria as a whole (Figure 9).
Figure 9: Children who were developmentally vulnerable in communication skills and general knowledge, by LGA in Melbourne, 2009
Primary data source: Australian Early Development Census (AEDC) conducted by the Department of Education and Early Childhood Development, 2009, which is based on a survey of children in their first full-time year of school. Immediate data source: Public Health Information Dissemination Unit (PHIDU) Social Health Atlas of Australia.
0
5
10
15
20
25%
Victoria
Brimbank
Physical Activity, Sport and Health in the City of Brimbank
14
Psychological distress
Good mental health is important for wellbeing. Psychological distress is an indicator of an individual’s mental health and wellbeing 25.
Indicator Definition: Psychological distress was measured using the Kessler 10 Psychological Distress Scale (K10), a set of ten questions designed to categorise the level of psychological distress over a four-week period. The K10 cover dimensions of depression and anxiety. Individuals are categorised into four levels of psychological distress based on their score: low (10-15), moderate (16-21), high (22-29) and very high (30-50). The indicator in this report is the proportion of people aged 18 years or over who reported a high (or very high) level of psychological distress.
Key Points
• The proportion of people reporting high levels of psychological distress varied considerably across Melbourne and Victoria.
• Of the 31 LGAs in Melbourne, the City of Brimbank had the second highest proportion of people with high levels of psychological distress.
Geographic variation
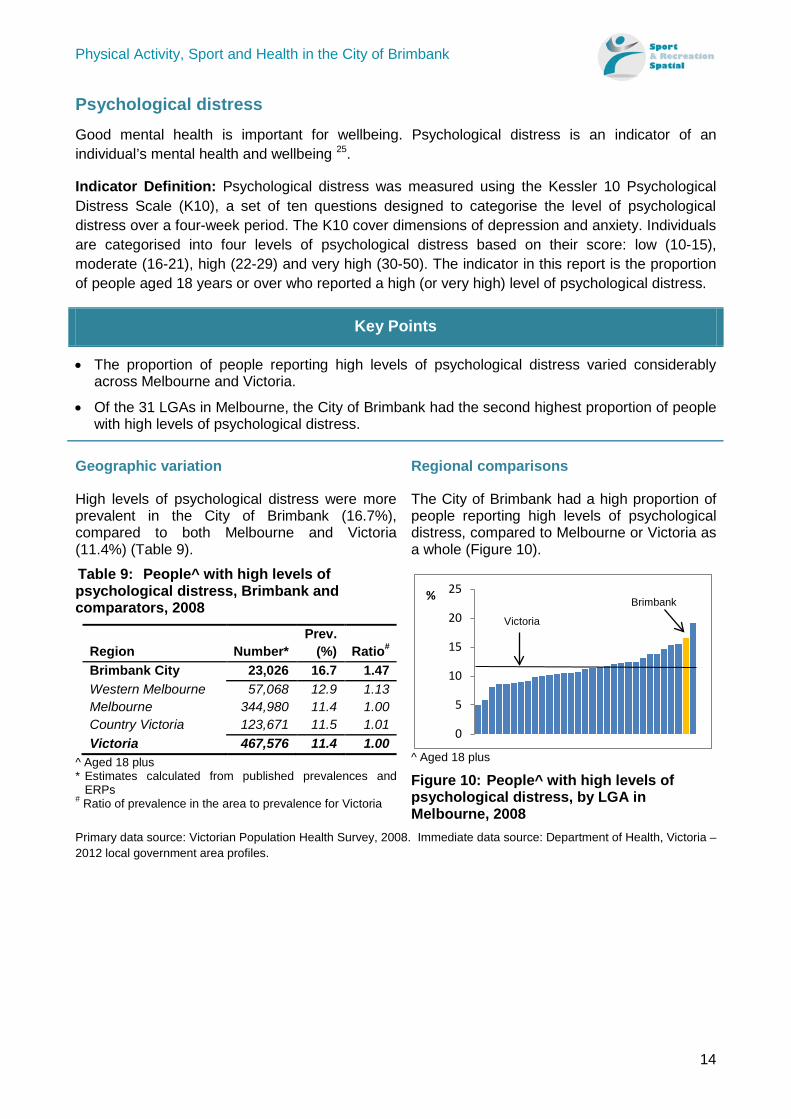
High levels of psychological distress were more prevalent in the City of Brimbank (16.7%), compared to both Melbourne and Victoria (11.4%) (Table 9).
Table 9: People^ with high levels of psychological distress, Brimbank and comparators, 2008
Region Number* Prev.
(%) Ratio# Brimbank City 23,026 16.7 1.47 Western Melbourne 57,068 12.9 1.13 Melbourne 344,980 11.4 1.00 Country Victoria 123,671 11.5 1.01 Victoria 467,576 11.4 1.00
^ Aged 18 plus * Estimates calculated from published prevalences and
ERPs # Ratio of prevalence in the area to prevalence for Victoria
Regional comparisons
The City of Brimbank had a high proportion of people reporting high levels of psychological distress, compared to Melbourne or Victoria as a whole (Figure 10).
^ Aged 18 plus
Figure 10: People^ with high levels of psychological distress, by LGA in Melbourne, 2008
Primary data source: Victorian Population Health Survey, 2008. Immediate data source: Department of Health, Victoria – 2012 local government area profiles.
0
5
10
15
20
25%
Victoria
Brimbank
Physical Activity, Sport and Health in the City of Brimbank
15
New settler arrivals
New settler arrivals include skilled and English-speaking migrants and also refugee and humanitarian settlers. Language barriers, economic difficulties, housing barriers, unemployment and cultural barriers can pose problems for new migrants and refugees 28. Refugees in particular are vulnerable and can arrive with health problems, which makes settlement more difficult 28.
Indicator definition: The number of arrivals from overseas during the 2010–11 financial year, under the permanent resident visa category, based on the stated LGA of intended residence, not the actual LGA of residence after arrival, expressed as a percentage of the estimated resident population.
Key Points
• The proportion of new settlers varied considerably across Melbourne and Victoria.
• The City of Brimbank had an above average proportion of new settlers, compared to Melbourne or Victoria as a whole.
Geographic variation
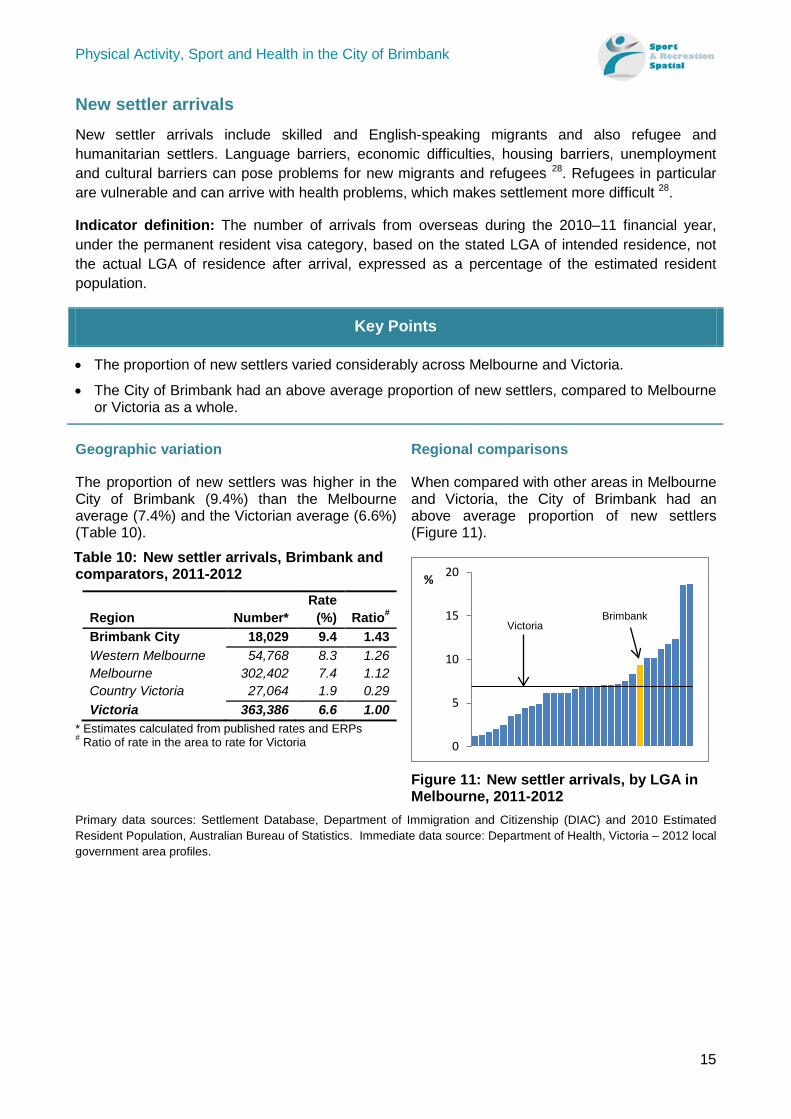
The proportion of new settlers was higher in the City of Brimbank (9.4%) than the Melbourne average (7.4%) and the Victorian average (6.6%) (Table 10).
Table 10: New settler arrivals, Brimbank and comparators, 2011-2012
Region Number* Rate
(%) Ratio# Brimbank City 18,029 9.4 1.43 Western Melbourne 54,768 8.3 1.26 Melbourne 302,402 7.4 1.12 Country Victoria 27,064 1.9 0.29 Victoria 363,386 6.6 1.00
* Estimates calculated from published rates and ERPs # Ratio of rate in the area to rate for Victoria
Regional comparisons
When compared with other areas in Melbourne and Victoria, the City of Brimbank had an above average proportion of new settlers (Figure 11).
Figure 11: New settler arrivals, by LGA in Melbourne, 2011-2012
Primary data sources: Settlement Database, Department of Immigration and Citizenship (DIAC) and 2010 Estimated Resident Population, Australian Bureau of Statistics. Immediate data source: Department of Health, Victoria – 2012 local government area profiles.
0
5
10
15
20%
Victoria Brimbank
Physical Activity, Sport and Health in the City of Brimbank
16
Overseas born
Australia has a large and diverse migrant population. The health of migrant populations can depend on factors such as their age and health status prior to migrating, adversity prior to migrating and the migration experience. Overall, the health of individuals who migrate to Australia is good, although their health often deteriorates with increasing duration of residence 29. In particular, subsequent to migration, these population groups often have higher prevalence of type 2 diabetes than the Australian-born population 29. Further, some newly arrived refugees have health issues associated with non-communicable diseases and mental health 30, 31.
Indicator definition: The percentage of the population who were born overseas. , based on the Australian Bureau of Statistics 2011 Census of Population and Housing. Immediate data source: Department of Health, Victoria – 2012 local government area profiles.
Key Points
• The proportion of people who were born overseas varied considerably across Melbourne and Victoria.
• Of the 31 LGAs in Melbourne, the City of Brimbank had the third highest proportion of people born overseas.
Geographic variation
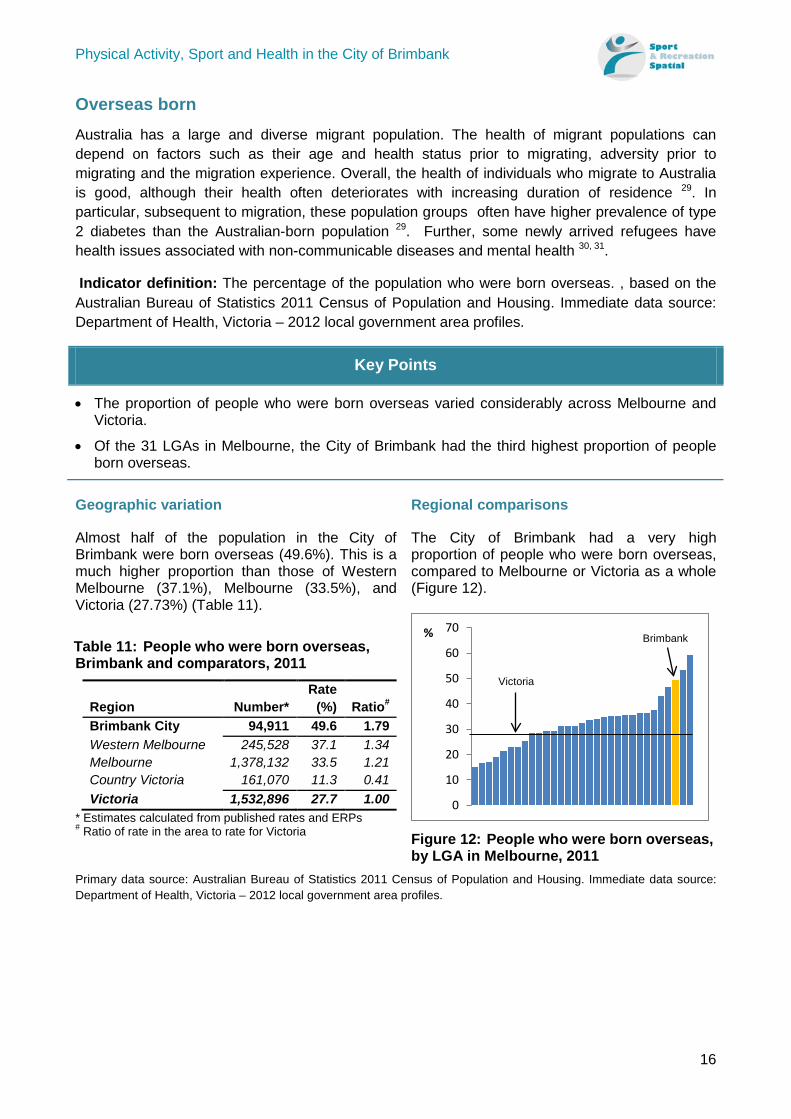
Almost half of the population in the City of Brimbank were born overseas (49.6%). This is a much higher proportion than those of Western Melbourne (37.1%), Melbourne (33.5%), and Victoria (27.73%) (Table 11).
Table 11: People who were born overseas, Brimbank and comparators, 2011
Region Number* Rate
(%) Ratio# Brimbank City 94,911 49.6 1.79 Western Melbourne 245,528 37.1 1.34 Melbourne 1,378,132 33.5 1.21 Country Victoria 161,070 11.3 0.41 Victoria 1,532,896 27.7 1.00
* Estimates calculated from published rates and ERPs # Ratio of rate in the area to rate for Victoria
Regional comparisons
The City of Brimbank had a very high proportion of people who were born overseas, compared to Melbourne or Victoria as a whole (Figure 12).
Figure 12: People who were born overseas, by LGA in Melbourne, 2011
Primary data source: Australian Bureau of Statistics 2011 Census of Population and Housing. Immediate data source: Department of Health, Victoria – 2012 local government area profiles.
0
10
20
30
40
50
60
70%
Victoria
Brimbank
Physical Activity, Sport and Health in the City of Brimbank
17
Low English proficiency
Limited English proficiency increases the risk of poor health as individuals are unable to fully understand basic health information and/or access preventive services 32.
Indicator definition: English proficiency was measured in the Australian Bureau of Statistics 2011 Census of Population and Housing. Individuals were asked to indicate how well they spoke English. This summary is based on the percentage of the population who had ‘low’ English proficiency i.e. those who indicated that they spoke English “not well” or “not at all”.
Key Points
• English proficiency varied considerably across Melbourne and Victoria.
• Of the 31 LGAs in Melbourne, the City of Brimbank had the second highest proportion of people with low English proficiency.
Geographic variation
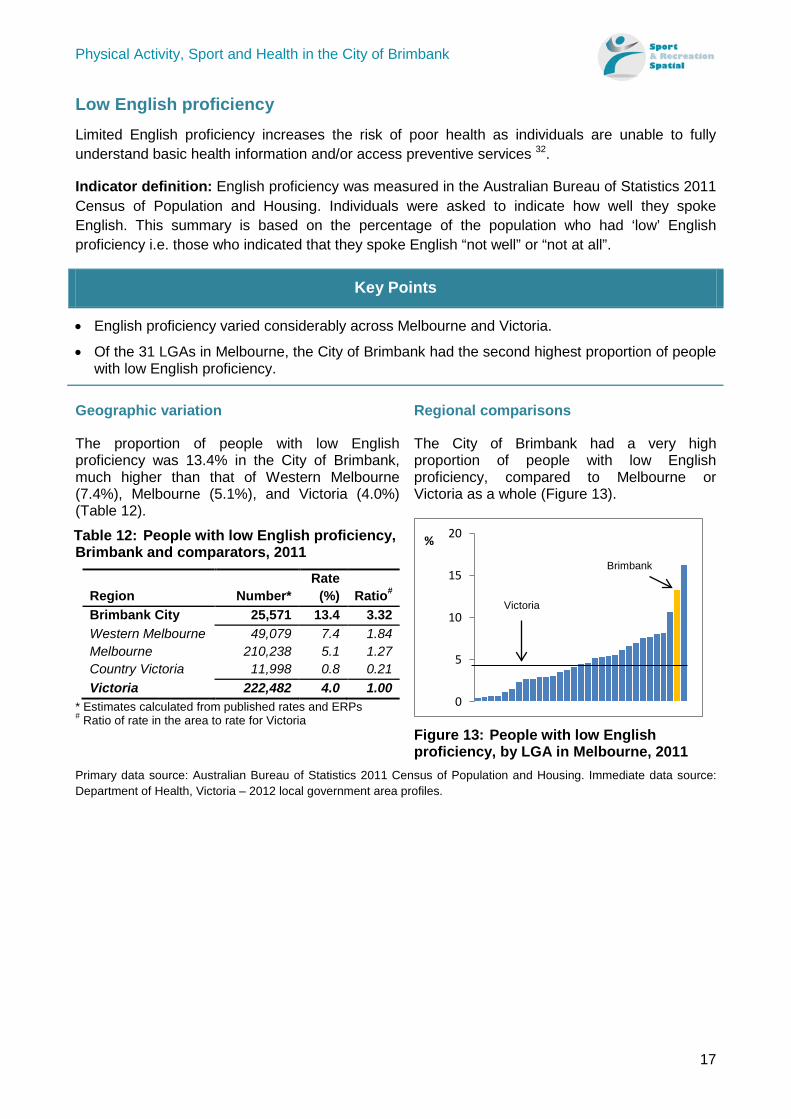
The proportion of people with low English proficiency was 13.4% in the City of Brimbank, much higher than that of Western Melbourne (7.4%), Melbourne (5.1%), and Victoria (4.0%) (Table 12).
Table 12: People with low English proficiency, Brimbank and comparators, 2011
Region Number* Rate
(%) Ratio# Brimbank City 25,571 13.4 3.32 Western Melbourne 49,079 7.4 1.84 Melbourne 210,238 5.1 1.27 Country Victoria 11,998 0.8 0.21 Victoria 222,482 4.0 1.00
* Estimates calculated from published rates and ERPs # Ratio of rate in the area to rate for Victoria
Regional comparisons
The City of Brimbank had a very high proportion of people with low English proficiency, compared to Melbourne or Victoria as a whole (Figure 13).
Figure 13: People with low English proficiency, by LGA in Melbourne, 2011
Primary data source: Australian Bureau of Statistics 2011 Census of Population and Housing. Immediate data source: Department of Health, Victoria – 2012 local government area profiles.
0
5
10
15
20%
Victoria
Brimbank
Physical Activity, Sport and Health in the City of Brimbank
18
Volunteering
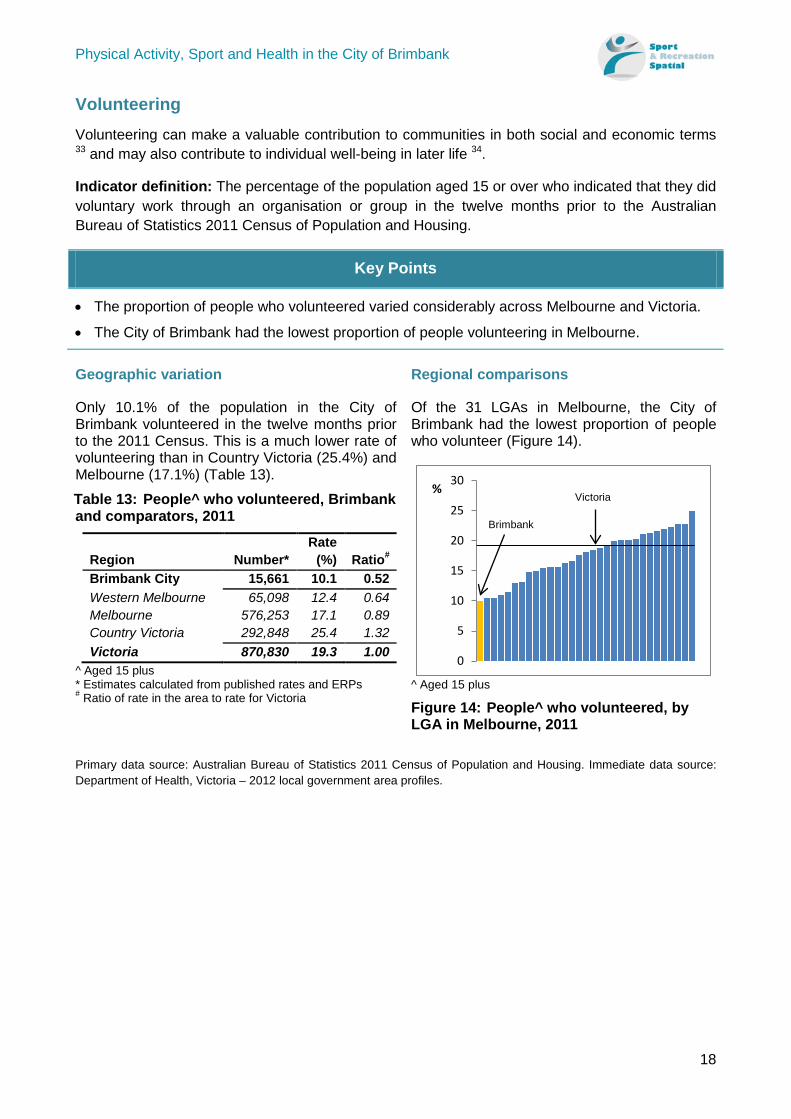
Volunteering can make a valuable contribution to communities in both social and economic terms 33 and may also contribute to individual well-being in later life 34.
Indicator definition: The percentage of the population aged 15 or over who indicated that they did voluntary work through an organisation or group in the twelve months prior to the Australian Bureau of Statistics 2011 Census of Population and Housing.
Key Points
• The proportion of people who volunteered varied considerably across Melbourne and Victoria.
• The City of Brimbank had the lowest proportion of people volunteering in Melbourne.
Geographic variation
Only 10.1% of the population in the City of Brimbank volunteered in the twelve months prior to the 2011 Census. This is a much lower rate of volunteering than in Country Victoria (25.4%) and Melbourne (17.1%) (Table 13).
Table 13: People^ who volunteered, Brimbank and comparators, 2011
Region Number* Rate
(%) Ratio# Brimbank City 15,661 10.1 0.52 Western Melbourne 65,098 12.4 0.64 Melbourne 576,253 17.1 0.89 Country Victoria 292,848 25.4 1.32 Victoria 870,830 19.3 1.00
^ Aged 15 plus * Estimates calculated from published rates and ERPs # Ratio of rate in the area to rate for Victoria
Regional comparisons
Of the 31 LGAs in Melbourne, the City of Brimbank had the lowest proportion of people who volunteer (Figure 14).
^ Aged 15 plus
Figure 14: People^ who volunteered, by LGA in Melbourne, 2011
Primary data source: Australian Bureau of Statistics 2011 Census of Population and Housing. Immediate data source: Department of Health, Victoria – 2012 local government area profiles.
0
5
10
15
20
25
30%
Brimbank
Victoria
Physical Activity, Sport and Health in the City of Brimbank
19
Education participation at age 16
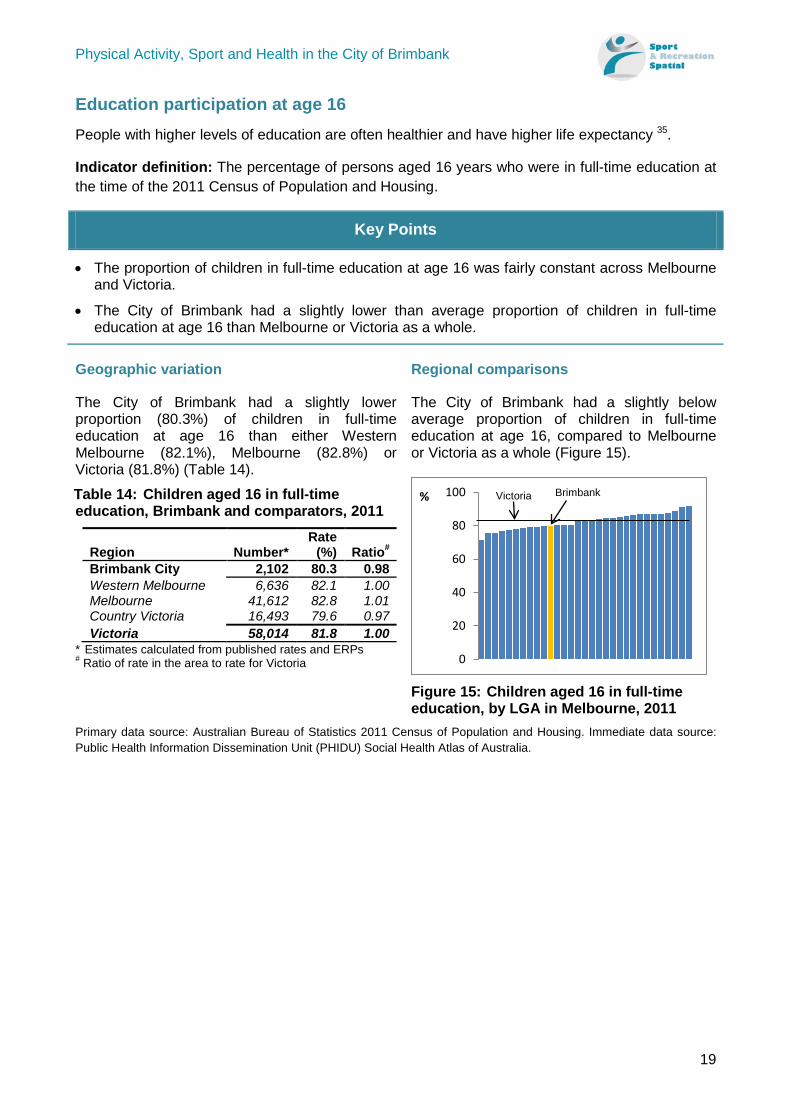
People with higher levels of education are often healthier and have higher life expectancy 35.
Indicator definition: The percentage of persons aged 16 years who were in full-time education at the time of the 2011 Census of Population and Housing.
Key Points
• The proportion of children in full-time education at age 16 was fairly constant across Melbourne and Victoria.
• The City of Brimbank had a slightly lower than average proportion of children in full-time education at age 16 than Melbourne or Victoria as a whole.
Geographic variation
The City of Brimbank had a slightly lower proportion (80.3%) of children in full-time education at age 16 than either Western Melbourne (82.1%), Melbourne (82.8%) or Victoria (81.8%) (Table 14).
Table 14: Children aged 16 in full-time education, Brimbank and comparators, 2011
Region Number* Rate
(%) Ratio# Brimbank City 2,102 80.3 0.98 Western Melbourne 6,636 82.1 1.00 Melbourne 41,612 82.8 1.01 Country Victoria 16,493 79.6 0.97 Victoria 58,014 81.8 1.00
* Estimates calculated from published rates and ERPs # Ratio of rate in the area to rate for Victoria
Regional comparisons
The City of Brimbank had a slightly below average proportion of children in full-time education at age 16, compared to Melbourne or Victoria as a whole (Figure 15).
Figure 15: Children aged 16 in full-time education, by LGA in Melbourne, 2011
Primary data source: Australian Bureau of Statistics 2011 Census of Population and Housing. Immediate data source: Public Health Information Dissemination Unit (PHIDU) Social Health Atlas of Australia.
0
20
40
60
80
100% Victoria Brimbank
Physical Activity, Sport and Health in the City of Brimbank
20
Post-secondary education qualifications
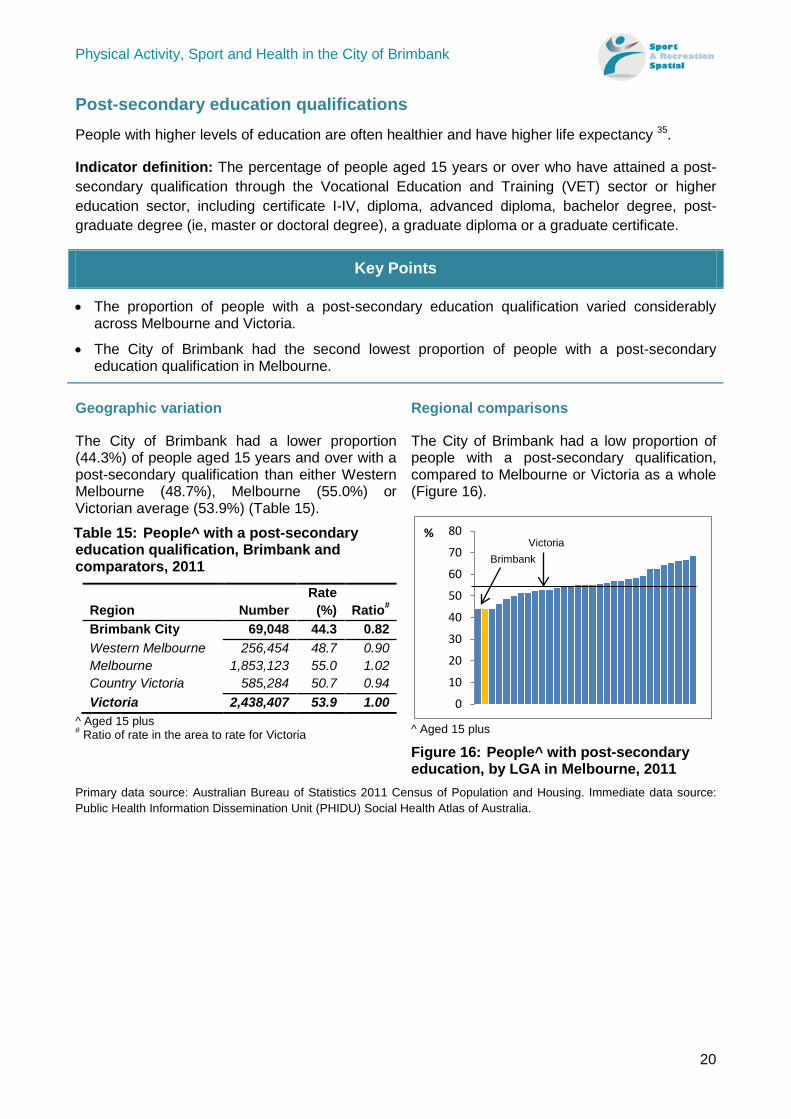
People with higher levels of education are often healthier and have higher life expectancy 35.
Indicator definition: The percentage of people aged 15 years or over who have attained a post-secondary qualification through the Vocational Education and Training (VET) sector or higher education sector, including certificate I-IV, diploma, advanced diploma, bachelor degree, post-graduate degree (ie, master or doctoral degree), a graduate diploma or a graduate certificate.
Key Points
• The proportion of people with a post-secondary education qualification varied considerably across Melbourne and Victoria.
• The City of Brimbank had the second lowest proportion of people with a post-secondary education qualification in Melbourne.
Geographic variation
The City of Brimbank had a lower proportion (44.3%) of people aged 15 years and over with a post-secondary qualification than either Western Melbourne (48.7%), Melbourne (55.0%) or Victorian average (53.9%) (Table 15).
Table 15: People^ with a post-secondary education qualification, Brimbank and comparators, 2011
Region Number Rate
(%) Ratio# Brimbank City 69,048 44.3 0.82 Western Melbourne 256,454 48.7 0.90 Melbourne 1,853,123 55.0 1.02 Country Victoria 585,284 50.7 0.94 Victoria 2,438,407 53.9 1.00
^ Aged 15 plus # Ratio of rate in the area to rate for Victoria
Regional comparisons
The City of Brimbank had a low proportion of people with a post-secondary qualification, compared to Melbourne or Victoria as a whole (Figure 16).
^ Aged 15 plus
Figure 16: People^ with post-secondary education, by LGA in Melbourne, 2011
Primary data source: Australian Bureau of Statistics 2011 Census of Population and Housing. Immediate data source: Public Health Information Dissemination Unit (PHIDU) Social Health Atlas of Australia.
0
10
20
30
40
50
60
70
80%
Brimbank Victoria
Physical Activity, Sport and Health in the City of Brimbank
21
Relative socio-economic advantage and disadvantage
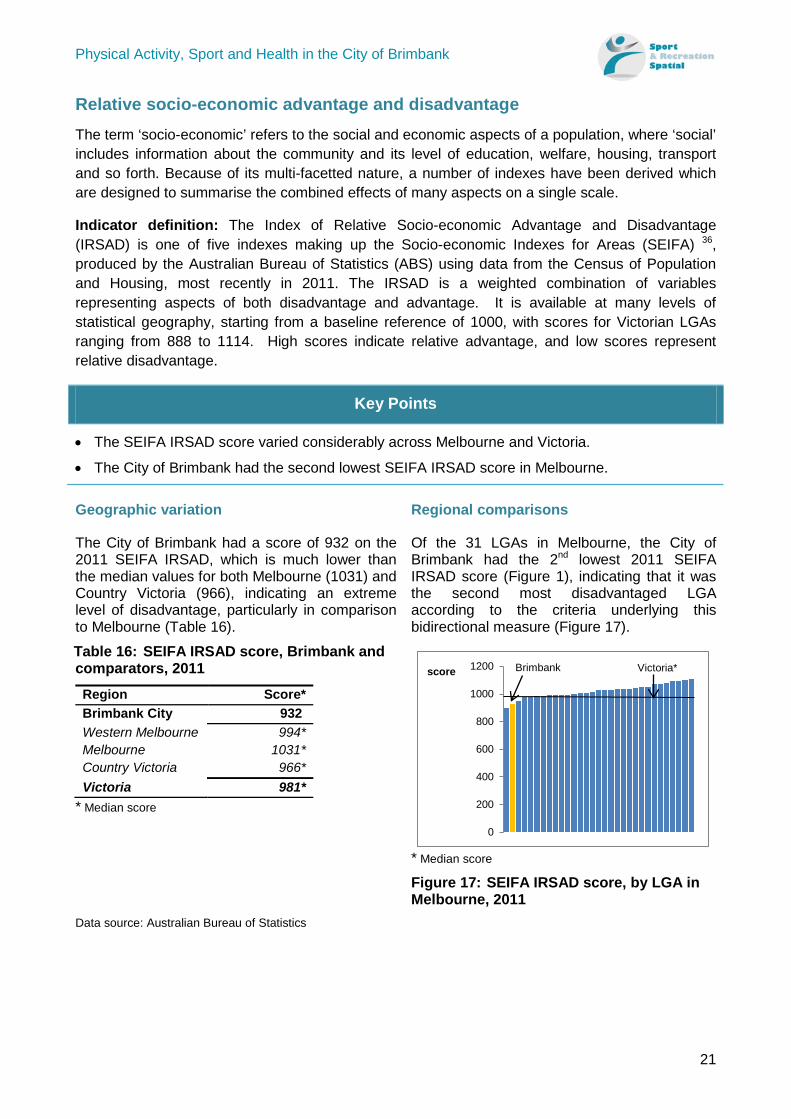
The term ‘socio-economic’ refers to the social and economic aspects of a population, where ‘social’ includes information about the community and its level of education, welfare, housing, transport and so forth. Because of its multi-facetted nature, a number of indexes have been derived which are designed to summarise the combined effects of many aspects on a single scale.
Indicator definition: The Index of Relative Socio-economic Advantage and Disadvantage (IRSAD) is one of five indexes making up the Socio-economic Indexes for Areas (SEIFA) 36, produced by the Australian Bureau of Statistics (ABS) using data from the Census of Population and Housing, most recently in 2011. The IRSAD is a weighted combination of variables representing aspects of both disadvantage and advantage. It is available at many levels of statistical geography, starting from a baseline reference of 1000, with scores for Victorian LGAs ranging from 888 to 1114. High scores indicate relative advantage, and low scores represent relative disadvantage.
Key Points
• The SEIFA IRSAD score varied considerably across Melbourne and Victoria.
• The City of Brimbank had the second lowest SEIFA IRSAD score in Melbourne.
Geographic variation
The City of Brimbank had a score of 932 on the 2011 SEIFA IRSAD, which is much lower than the median values for both Melbourne (1031) and Country Victoria (966), indicating an extreme level of disadvantage, particularly in comparison to Melbourne (Table 16).
Table 16: SEIFA IRSAD score, Brimbank and comparators, 2011 Region Score* Brimbank City 932 Western Melbourne 994* Melbourne 1031* Country Victoria 966* Victoria 981*
* Median score
Regional comparisons
Of the 31 LGAs in Melbourne, the City of Brimbank had the 2nd lowest 2011 SEIFA IRSAD score (Figure 1), indicating that it was the second most disadvantaged LGA according to the criteria underlying this bidirectional measure (Figure 17).
* Median score
Figure 17: SEIFA IRSAD score, by LGA in Melbourne, 2011
Data source: Australian Bureau of Statistics
0
200
400
600
800
1000
1200score Brimbank Victoria*
Physical Activity, Sport and Health in the City of Brimbank
22
Meeting physical activity guidelines
Regular participation in PA is important for health. Data indicates that 31% of the world’s population do not meet the minimum PA guidelines 5.
Indicator definition: The proportion of people aged 18 or over who did met the National Physical Activity Guidelines for Australians, developed by the Department of Health and Aged Care, 1999. These guidelines recommend at least 30 minutes of moderate intensity physical exercise on most, and preferably all, days.
Key Points
• The proportion of people who met the PA guidelines for health varied to a moderate degree across Melbourne.
• Of the 31 LGAs in Melbourne, the City of Brimbank had the third lowest proportion of people who met PA guidelines.
Geographic variation
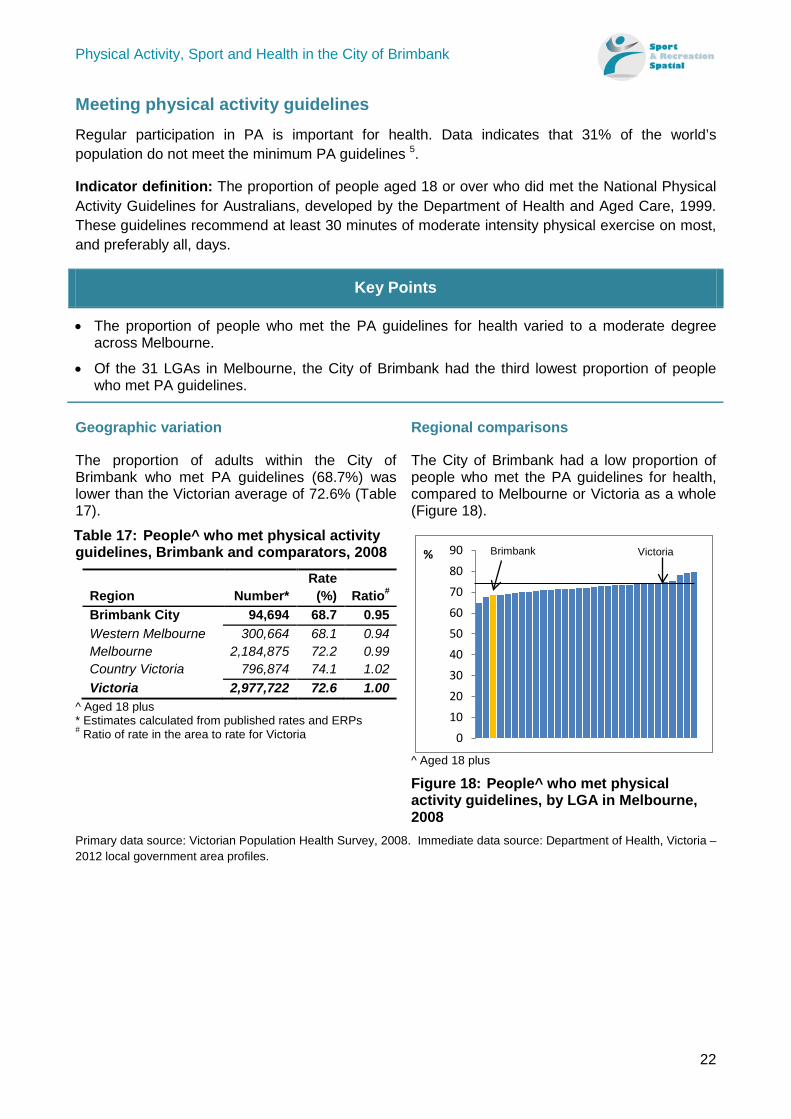
The proportion of adults within the City of Brimbank who met PA guidelines (68.7%) was lower than the Victorian average of 72.6% (Table 17).
Table 17: People^ who met physical activity guidelines, Brimbank and comparators, 2008
Region Number* Rate
(%) Ratio# Brimbank City 94,694 68.7 0.95 Western Melbourne 300,664 68.1 0.94 Melbourne 2,184,875 72.2 0.99 Country Victoria 796,874 74.1 1.02 Victoria 2,977,722 72.6 1.00
^ Aged 18 plus * Estimates calculated from published rates and ERPs # Ratio of rate in the area to rate for Victoria
Regional comparisons
The City of Brimbank had a low proportion of people who met the PA guidelines for health, compared to Melbourne or Victoria as a whole (Figure 18).
^ Aged 18 plus
Figure 18: People^ who met physical activity guidelines, by LGA in Melbourne, 2008
Primary data source: Victorian Population Health Survey, 2008. Immediate data source: Department of Health, Victoria – 2012 local government area profiles.
0102030405060708090% Victoria Brimbank
Physical Activity, Sport and Health in the City of Brimbank
23
Sitting time
Physical inactivity and prolonged sitting are associated with negative health outcomes. Even amongst physically active people there are added health benefits of reducing sitting time 37.
Indicator definition: The proportion of people aged 18 years or over who sit for seven hours or more per typical weekday. This includes activities like driving, working at a desk or computer, reading, watching television and playing computer games.
Key Points
• The proportion of people reporting that they sit for at least seven hours per day varied considerably across Melbourne and Victoria.
• Of the 31 LGAs in Melbourne, the City of Brimbank had the second lowest proportion of people who sat for at least seven hours a day.
Geographic variation
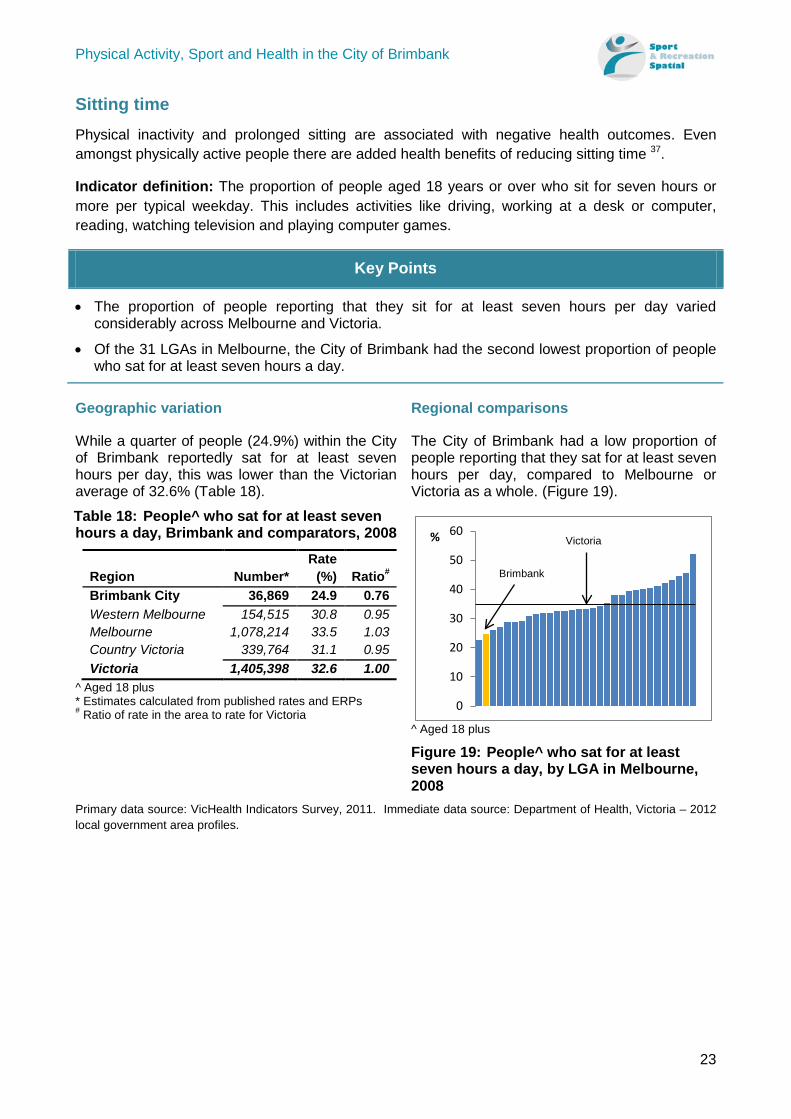
While a quarter of people (24.9%) within the City of Brimbank reportedly sat for at least seven hours per day, this was lower than the Victorian average of 32.6% (Table 18).
Table 18: People^ who sat for at least seven hours a day, Brimbank and comparators, 2008
Region Number* Rate
(%) Ratio# Brimbank City 36,869 24.9 0.76 Western Melbourne 154,515 30.8 0.95 Melbourne 1,078,214 33.5 1.03 Country Victoria 339,764 31.1 0.95 Victoria 1,405,398 32.6 1.00
^ Aged 18 plus * Estimates calculated from published rates and ERPs # Ratio of rate in the area to rate for Victoria
Regional comparisons
The City of Brimbank had a low proportion of people reporting that they sat for at least seven hours per day, compared to Melbourne or Victoria as a whole. (Figure 19).
^ Aged 18 plus
Figure 19: People^ who sat for at least seven hours a day, by LGA in Melbourne, 2008
Primary data source: VicHealth Indicators Survey, 2011. Immediate data source: Department of Health, Victoria – 2012 local government area profiles.
0
10
20
30
40
50
60% Victoria
Brimbank
Physical Activity, Sport and Health in the City of Brimbank
24
Leisure-time physical activity
Leisure-time physical activity (LTPA) is an important component of overall PA for many people 7.
Indicator definition: A participant is defined as a person who participated at least once in any LTPA in the 12 months prior to being interviewed in the 2010 national Exercise, Recreation and Sport Survey (ERASS). The survey was limited to people aged 15 years or older, and encompassed 95 different types of LTPA.
Key Points
• The rate of participation in leisure-time PA was quite high varied to a moderate degree across Melbourne.
• Of the 31 LGAs in Melbourne, the City of Brimbank had the second lowest proportion of people who had participated in leisure-time PA at least once in the previous 12 months.
Geographic variation
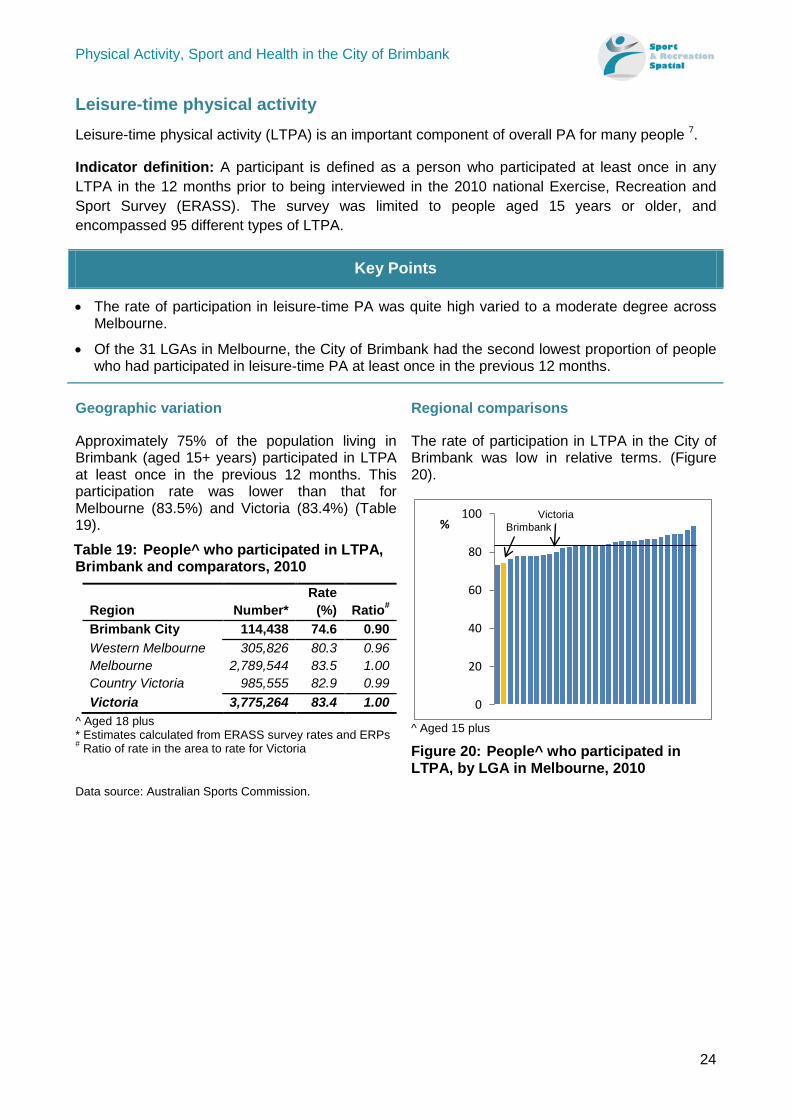
Approximately 75% of the population living in Brimbank (aged 15+ years) participated in LTPA at least once in the previous 12 months. This participation rate was lower than that for Melbourne (83.5%) and Victoria (83.4%) (Table 19).
Table 19: People^ who participated in LTPA, Brimbank and comparators, 2010
Region Number* Rate
(%) Ratio# Brimbank City 114,438 74.6 0.90 Western Melbourne 305,826 80.3 0.96 Melbourne 2,789,544 83.5 1.00 Country Victoria 985,555 82.9 0.99 Victoria 3,775,264 83.4 1.00
^ Aged 18 plus * Estimates calculated from ERASS survey rates and ERPs # Ratio of rate in the area to rate for Victoria
Regional comparisons
The rate of participation in LTPA in the City of Brimbank was low in relative terms. (Figure 20).
^ Aged 15 plus
Figure 20: People^ who participated in LTPA, by LGA in Melbourne, 2010
Data source: Australian Sports Commission.
0
20
40
60
80
100% Brimbank
Victoria
Physical Activity, Sport and Health in the City of Brimbank
25
Organised leisure-time physical activity
There are various modes of participation in leisure-time physical activity (LTPA)6, ranging from non-organised, non-competitive PA such as walking to organised and competitive sports such as soccer. Across Australia, many people (males 42%; females 37%) participate in organised forms of LTPA 7.
Indicator definition: A participant in organised LTPA is defined as a person who participated at least once in the 12 months prior to being interviewed in the 2010 national Exercise, Recreation and Sport Survey (ERASS), in LTPA organised by a club, association or any other type of organisation. The survey was limited to people aged 15 years or older, and encompassed 95 different types of LTPA.
Key Points
• The proportion of people who participated in organised leisure-time PA varied considerably across Melbourne and Victoria.
• Of the 31 LGAs in Melbourne, the City of Brimbank had the second lowest rate of participation in organised leisure-time PA.
Geographic variation
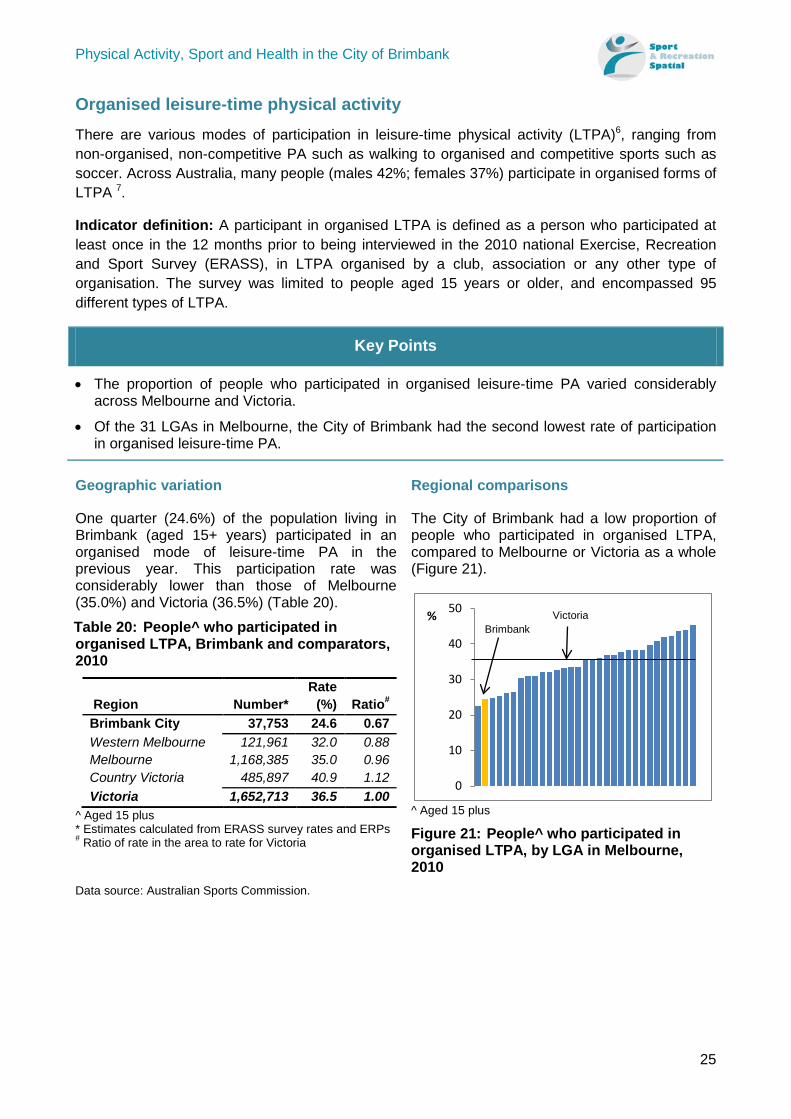
One quarter (24.6%) of the population living in Brimbank (aged 15+ years) participated in an organised mode of leisure-time PA in the previous year. This participation rate was considerably lower than those of Melbourne (35.0%) and Victoria (36.5%) (Table 20).
Table 20: People^ who participated in organised LTPA, Brimbank and comparators, 2010
Region Number* Rate
(%) Ratio# Brimbank City 37,753 24.6 0.67 Western Melbourne 121,961 32.0 0.88 Melbourne 1,168,385 35.0 0.96 Country Victoria 485,897 40.9 1.12 Victoria 1,652,713 36.5 1.00
^ Aged 15 plus * Estimates calculated from ERASS survey rates and ERPs # Ratio of rate in the area to rate for Victoria
Regional comparisons
The City of Brimbank had a low proportion of people who participated in organised LTPA, compared to Melbourne or Victoria as a whole (Figure 21).
^ Aged 15 plus
Figure 21: People^ who participated in organised LTPA, by LGA in Melbourne, 2010
Data source: Australian Sports Commission.
0
10
20
30
40
50% Brimbank
Victoria
Physical Activity, Sport and Health in the City of Brimbank
26
Club-based leisure-time physical activity
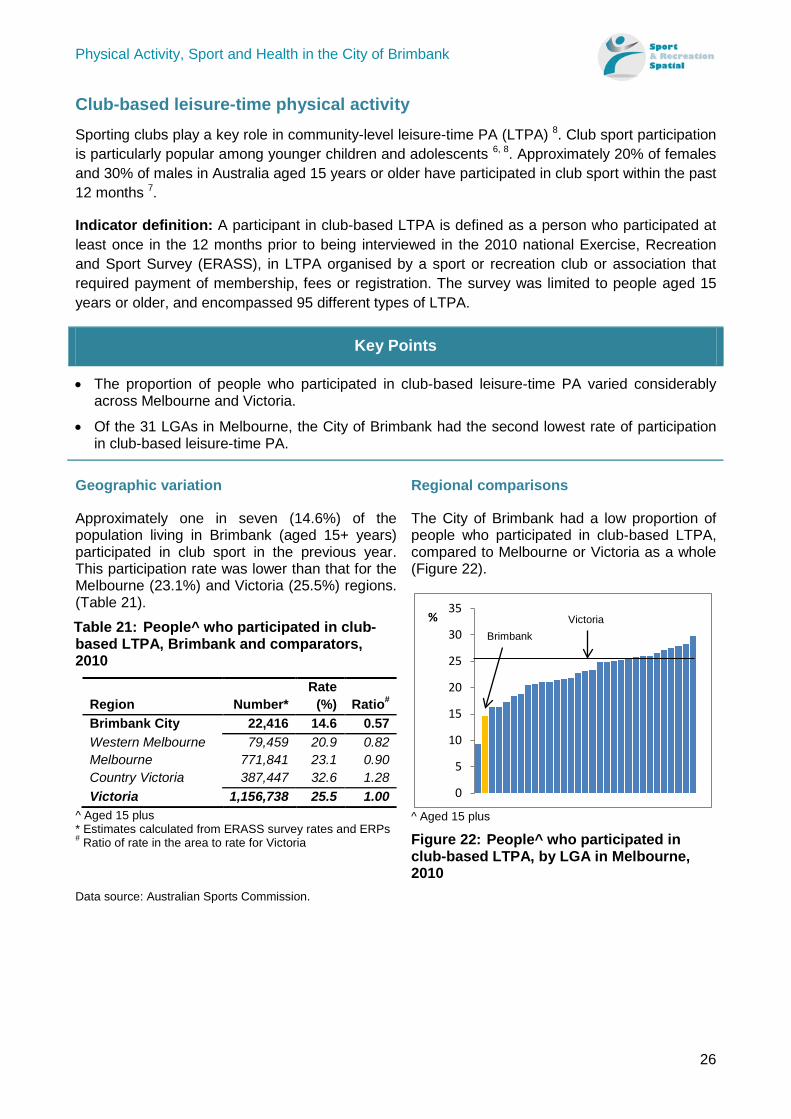
Sporting clubs play a key role in community-level leisure-time PA (LTPA) 8. Club sport participation is particularly popular among younger children and adolescents 6, 8. Approximately 20% of females and 30% of males in Australia aged 15 years or older have participated in club sport within the past 12 months 7.
Indicator definition: A participant in club-based LTPA is defined as a person who participated at least once in the 12 months prior to being interviewed in the 2010 national Exercise, Recreation and Sport Survey (ERASS), in LTPA organised by a sport or recreation club or association that required payment of membership, fees or registration. The survey was limited to people aged 15 years or older, and encompassed 95 different types of LTPA.
Key Points
• The proportion of people who participated in club-based leisure-time PA varied considerably across Melbourne and Victoria.
• Of the 31 LGAs in Melbourne, the City of Brimbank had the second lowest rate of participation in club-based leisure-time PA.
Geographic variation
Approximately one in seven (14.6%) of the population living in Brimbank (aged 15+ years) participated in club sport in the previous year. This participation rate was lower than that for the Melbourne (23.1%) and Victoria (25.5%) regions. (Table 21).
Table 21: People^ who participated in club-based LTPA, Brimbank and comparators, 2010
Region Number* Rate
(%) Ratio# Brimbank City 22,416 14.6 0.57 Western Melbourne 79,459 20.9 0.82 Melbourne 771,841 23.1 0.90 Country Victoria 387,447 32.6 1.28 Victoria 1,156,738 25.5 1.00
^ Aged 15 plus * Estimates calculated from ERASS survey rates and ERPs # Ratio of rate in the area to rate for Victoria
Regional comparisons
The City of Brimbank had a low proportion of people who participated in club-based LTPA, compared to Melbourne or Victoria as a whole (Figure 22).
^ Aged 15 plus
Figure 22: People^ who participated in club-based LTPA, by LGA in Melbourne, 2010
Data source: Australian Sports Commission.
0
5
10
15
20
25
30
35%
Brimbank Victoria
Physical Activity, Sport and Health in the City of Brimbank
27
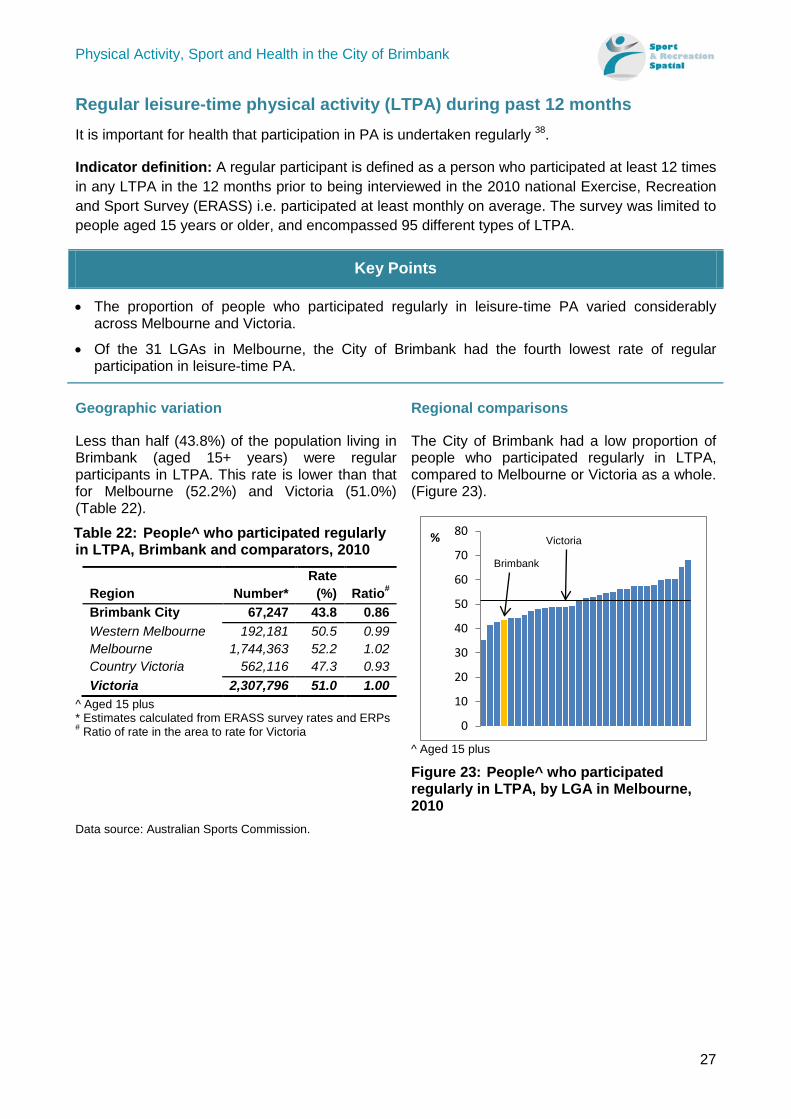
Regular leisure-time physical activity (LTPA) during past 12 months
It is important for health that participation in PA is undertaken regularly 38.
Indicator definition: A regular participant is defined as a person who participated at least 12 times in any LTPA in the 12 months prior to being interviewed in the 2010 national Exercise, Recreation and Sport Survey (ERASS) i.e. participated at least monthly on average. The survey was limited to people aged 15 years or older, and encompassed 95 different types of LTPA.
Key Points
• The proportion of people who participated regularly in leisure-time PA varied considerably across Melbourne and Victoria.
• Of the 31 LGAs in Melbourne, the City of Brimbank had the fourth lowest rate of regular participation in leisure-time PA.
Geographic variation
Less than half (43.8%) of the population living in Brimbank (aged 15+ years) were regular participants in LTPA. This rate is lower than that for Melbourne (52.2%) and Victoria (51.0%) (Table 22).
Table 22: People^ who participated regularly in LTPA, Brimbank and comparators, 2010
Region Number* Rate
(%) Ratio# Brimbank City 67,247 43.8 0.86 Western Melbourne 192,181 50.5 0.99 Melbourne 1,744,363 52.2 1.02 Country Victoria 562,116 47.3 0.93 Victoria 2,307,796 51.0 1.00
^ Aged 15 plus * Estimates calculated from ERASS survey rates and ERPs # Ratio of rate in the area to rate for Victoria
Regional comparisons
The City of Brimbank had a low proportion of people who participated regularly in LTPA, compared to Melbourne or Victoria as a whole. (Figure 23).
^ Aged 15 plus
Figure 23: People^ who participated regularly in LTPA, by LGA in Melbourne, 2010
Data source: Australian Sports Commission.
0
10
20
30
40
50
60
70
80%
Brimbank
Victoria
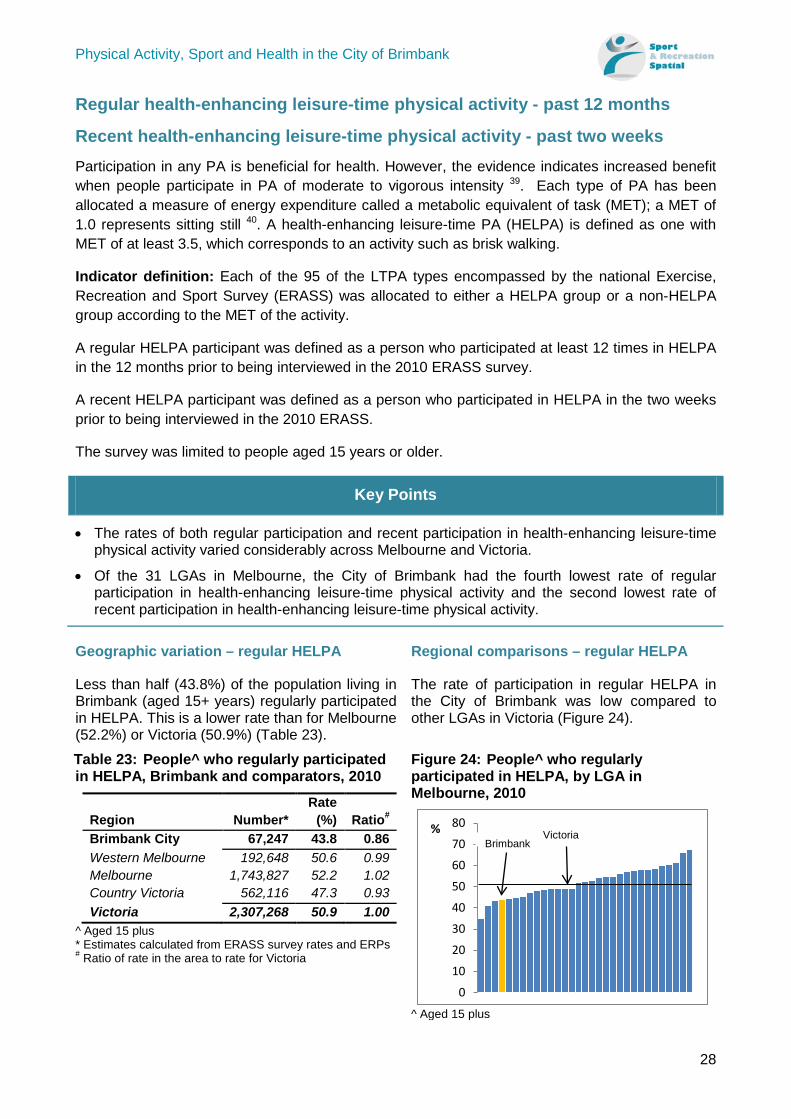
Physical Activity, Sport and Health in the City of Brimbank
28
Regular health-enhancing leisure-time physical activity - past 12 months
Recent health-enhancing leisure-time physical activity - past two weeks Participation in any PA is beneficial for health. However, the evidence indicates increased benefit when people participate in PA of moderate to vigorous intensity 39. Each type of PA has been allocated a measure of energy expenditure called a metabolic equivalent of task (MET); a MET of 1.0 represents sitting still 40. A health-enhancing leisure-time PA (HELPA) is defined as one with MET of at least 3.5, which corresponds to an activity such as brisk walking.
Indicator definition: Each of the 95 of the LTPA types encompassed by the national Exercise, Recreation and Sport Survey (ERASS) was allocated to either a HELPA group or a non-HELPA group according to the MET of the activity.
A regular HELPA participant was defined as a person who participated at least 12 times in HELPA in the 12 months prior to being interviewed in the 2010 ERASS survey.
A recent HELPA participant was defined as a person who participated in HELPA in the two weeks prior to being interviewed in the 2010 ERASS.
The survey was limited to people aged 15 years or older.
Key Points
• The rates of both regular participation and recent participation in health-enhancing leisure-time physical activity varied considerably across Melbourne and Victoria.
• Of the 31 LGAs in Melbourne, the City of Brimbank had the fourth lowest rate of regular participation in health-enhancing leisure-time physical activity and the second lowest rate of recent participation in health-enhancing leisure-time physical activity.
Geographic variation – regular HELPA
Less than half (43.8%) of the population living in Brimbank (aged 15+ years) regularly participated in HELPA. This is a lower rate than for Melbourne (52.2%) or Victoria (50.9%) (Table 23).
Table 23: People^ who regularly participated in HELPA, Brimbank and comparators, 2010
Region Number* Rate
(%) Ratio# Brimbank City 67,247 43.8 0.86 Western Melbourne 192,648 50.6 0.99 Melbourne 1,743,827 52.2 1.02 Country Victoria 562,116 47.3 0.93 Victoria 2,307,268 50.9 1.00
^ Aged 15 plus * Estimates calculated from ERASS survey rates and ERPs # Ratio of rate in the area to rate for Victoria
Regional comparisons – regular HELPA
The rate of participation in regular HELPA in the City of Brimbank was low compared to other LGAs in Victoria (Figure 24).
Figure 24: People^ who regularly participated in HELPA, by LGA in Melbourne, 2010
^ Aged 15 plus
0
10
20
30
40
50
60
70
80% Victoria Brimbank
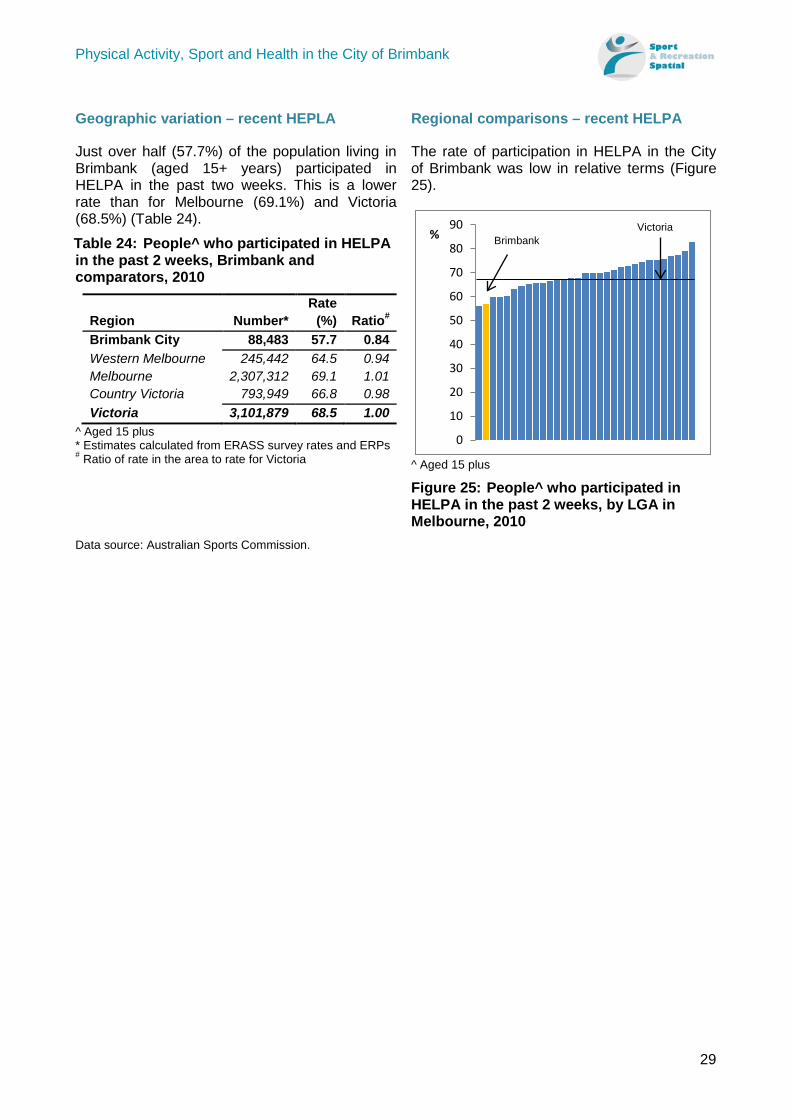
Physical Activity, Sport and Health in the City of Brimbank
29
Geographic variation – recent HEPLA
Just over half (57.7%) of the population living in Brimbank (aged 15+ years) participated in HELPA in the past two weeks. This is a lower rate than for Melbourne (69.1%) and Victoria (68.5%) (Table 24).
Table 24: People^ who participated in HELPA in the past 2 weeks, Brimbank and comparators, 2010
Region Number* Rate
(%) Ratio# Brimbank City 88,483 57.7 0.84 Western Melbourne 245,442 64.5 0.94 Melbourne 2,307,312 69.1 1.01 Country Victoria 793,949 66.8 0.98 Victoria 3,101,879 68.5 1.00
^ Aged 15 plus * Estimates calculated from ERASS survey rates and ERPs # Ratio of rate in the area to rate for Victoria
Regional comparisons – recent HELPA
The rate of participation in HELPA in the City of Brimbank was low in relative terms (Figure 25).
^ Aged 15 plus Figure 25: People^ who participated in HELPA in the past 2 weeks, by LGA in Melbourne, 2010
Data source: Australian Sports Commission.
0
10
20
30
40
50
60
70
80
90% Victoria
Brimbank
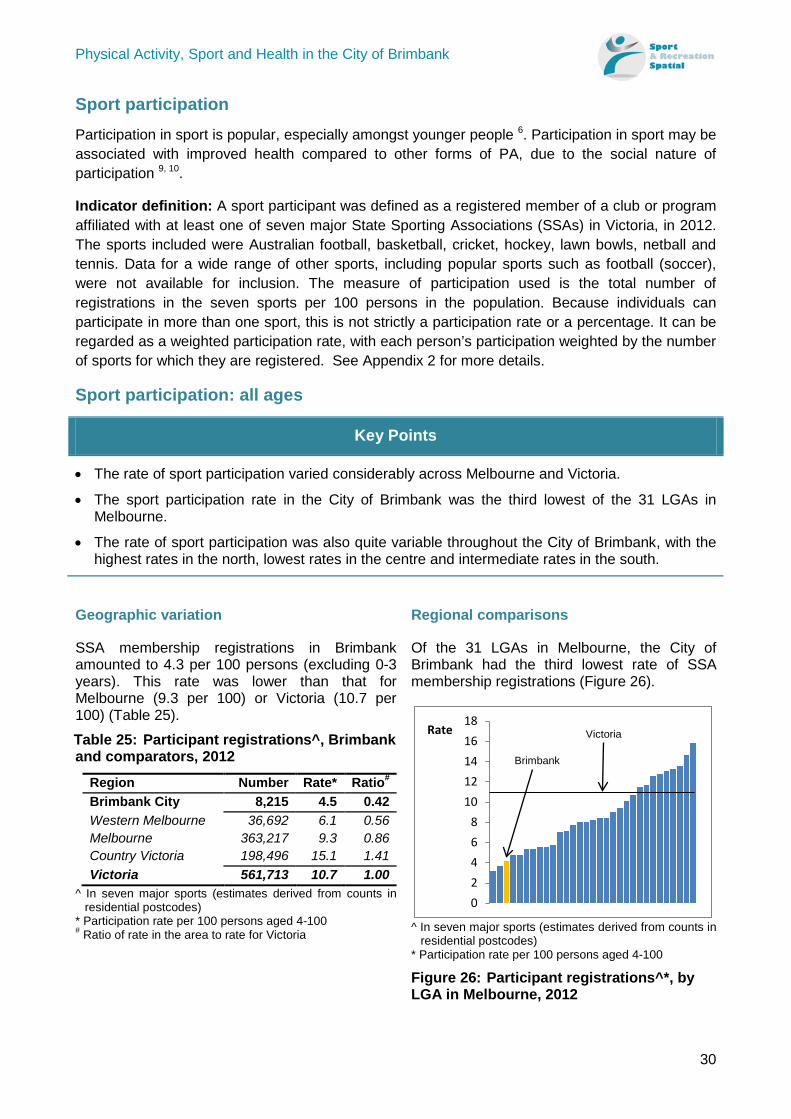
Physical Activity, Sport and Health in the City of Brimbank
30
Sport participation
Participation in sport is popular, especially amongst younger people 6. Participation in sport may be associated with improved health compared to other forms of PA, due to the social nature of participation 9, 10.
Indicator definition: A sport participant was defined as a registered member of a club or program affiliated with at least one of seven major State Sporting Associations (SSAs) in Victoria, in 2012. The sports included were Australian football, basketball, cricket, hockey, lawn bowls, netball and tennis. Data for a wide range of other sports, including popular sports such as football (soccer), were not available for inclusion. The measure of participation used is the total number of registrations in the seven sports per 100 persons in the population. Because individuals can participate in more than one sport, this is not strictly a participation rate or a percentage. It can be regarded as a weighted participation rate, with each person’s participation weighted by the number of sports for which they are registered. See Appendix 2 for more details.
Sport participation: all ages
Key Points
• The rate of sport participation varied considerably across Melbourne and Victoria.
• The sport participation rate in the City of Brimbank was the third lowest of the 31 LGAs in Melbourne.
• The rate of sport participation was also quite variable throughout the City of Brimbank, with the highest rates in the north, lowest rates in the centre and intermediate rates in the south.
Geographic variation
SSA membership registrations in Brimbank amounted to 4.3 per 100 persons (excluding 0-3 years). This rate was lower than that for Melbourne (9.3 per 100) or Victoria (10.7 per 100) (Table 25).
Table 25: Participant registrations^, Brimbank and comparators, 2012
Region Number Rate* Ratio# Brimbank City 8,215 4.5 0.42 Western Melbourne 36,692 6.1 0.56 Melbourne 363,217 9.3 0.86 Country Victoria 198,496 15.1 1.41 Victoria 561,713 10.7 1.00
^ In seven major sports (estimates derived from counts in residential postcodes)
* Participation rate per 100 persons aged 4-100 # Ratio of rate in the area to rate for Victoria
Regional comparisons
Of the 31 LGAs in Melbourne, the City of Brimbank had the third lowest rate of SSA membership registrations (Figure 26).
^ In seven major sports (estimates derived from counts in
residential postcodes) * Participation rate per 100 persons aged 4-100 Figure 26: Participant registrations^*, by LGA in Melbourne, 2012
02468
1012141618
Rate
Brimbank
Victoria
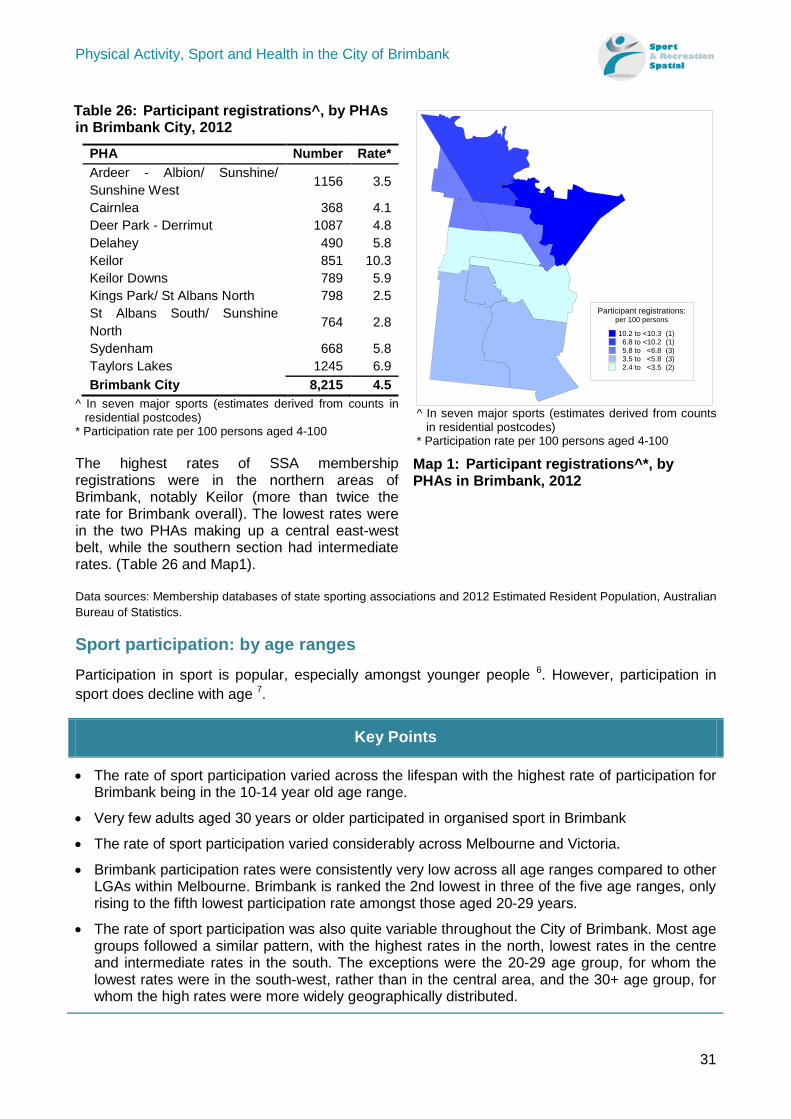
Physical Activity, Sport and Health in the City of Brimbank
31
Table 26: Participant registrations^, by PHAs in Brimbank City, 2012
PHA Number Rate* Ardeer - Albion/ Sunshine/ Sunshine West 1156 3.5
Cairnlea 368 4.1 Deer Park - Derrimut 1087 4.8 Delahey 490 5.8 Keilor 851 10.3 Keilor Downs 789 5.9 Kings Park/ St Albans North 798 2.5 St Albans South/ Sunshine North 764 2.8
Sydenham 668 5.8 Taylors Lakes 1245 6.9 Brimbank City 8,215 4.5
^ In seven major sports (estimates derived from counts in residential postcodes)
* Participation rate per 100 persons aged 4-100 The highest rates of SSA membership registrations were in the northern areas of Brimbank, notably Keilor (more than twice the rate for Brimbank overall). The lowest rates were in the two PHAs making up a central east-west belt, while the southern section had intermediate rates. (Table 26 and Map1).
^ In seven major sports (estimates derived from counts
in residential postcodes) * Participation rate per 100 persons aged 4-100
Map 1: Participant registrations^*, by PHAs in Brimbank, 2012
Data sources: Membership databases of state sporting associations and 2012 Estimated Resident Population, Australian Bureau of Statistics.
Sport participation: by age ranges
Participation in sport is popular, especially amongst younger people 6. However, participation in sport does decline with age 7.
Key Points
• The rate of sport participation varied across the lifespan with the highest rate of participation for Brimbank being in the 10-14 year old age range.
• Very few adults aged 30 years or older participated in organised sport in Brimbank
• The rate of sport participation varied considerably across Melbourne and Victoria.
• Brimbank participation rates were consistently very low across all age ranges compared to other LGAs within Melbourne. Brimbank is ranked the 2nd lowest in three of the five age ranges, only rising to the fifth lowest participation rate amongst those aged 20-29 years.
• The rate of sport participation was also quite variable throughout the City of Brimbank. Most age groups followed a similar pattern, with the highest rates in the north, lowest rates in the centre and intermediate rates in the south. The exceptions were the 20-29 age group, for whom the lowest rates were in the south-west, rather than in the central area, and the 30+ age group, for whom the high rates were more widely geographically distributed.
Participant registrations:per 100 persons
10.2 to <10.3 (1)6.8 to <10.2 (1)5.8 to <6.8 (3)3.5 to <5.8 (3)2.4 to <3.5 (2)
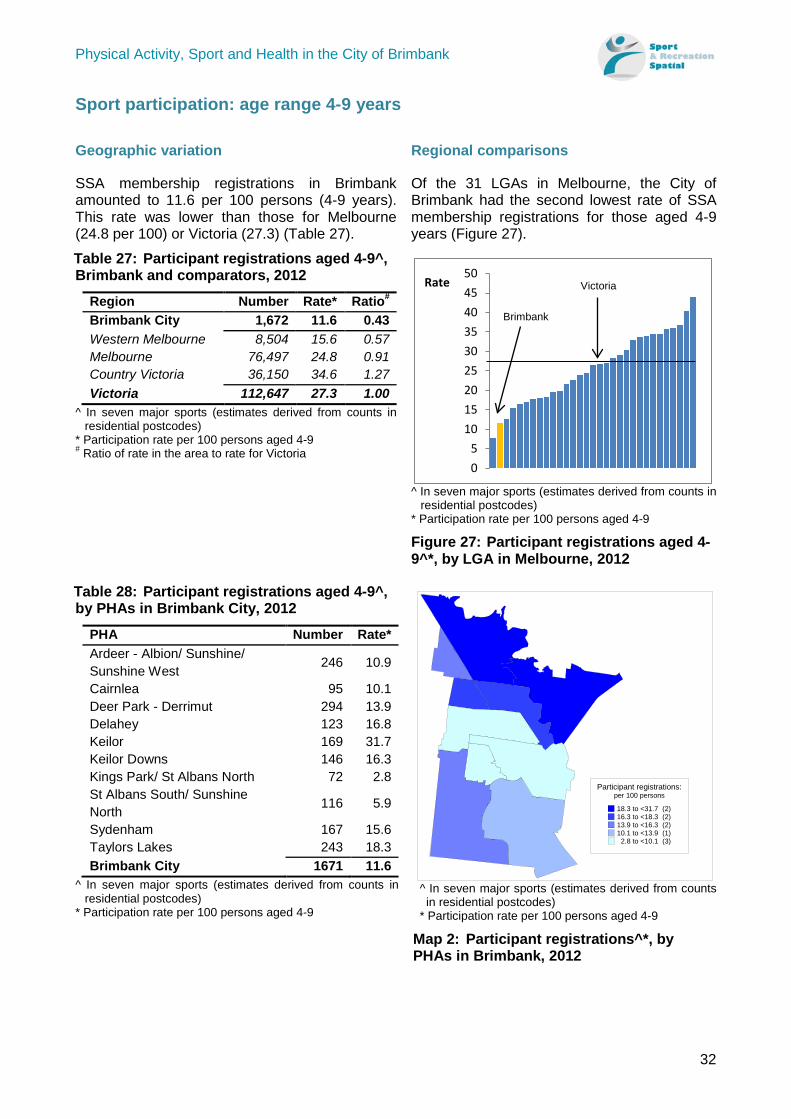
Physical Activity, Sport and Health in the City of Brimbank
32
Sport participation: age range 4-9 years
Geographic variation
SSA membership registrations in Brimbank amounted to 11.6 per 100 persons (4-9 years). This rate was lower than those for Melbourne (24.8 per 100) or Victoria (27.3) (Table 27).
Table 27: Participant registrations aged 4-9^, Brimbank and comparators, 2012
Region Number Rate* Ratio# Brimbank City 1,672 11.6 0.43 Western Melbourne 8,504 15.6 0.57 Melbourne 76,497 24.8 0.91 Country Victoria 36,150 34.6 1.27 Victoria 112,647 27.3 1.00
^ In seven major sports (estimates derived from counts in residential postcodes)
* Participation rate per 100 persons aged 4-9 # Ratio of rate in the area to rate for Victoria
Regional comparisons
Of the 31 LGAs in Melbourne, the City of Brimbank had the second lowest rate of SSA membership registrations for those aged 4-9 years (Figure 27).
^ In seven major sports (estimates derived from counts in
residential postcodes) * Participation rate per 100 persons aged 4-9 Figure 27: Participant registrations aged 4-9^*, by LGA in Melbourne, 2012
Table 28: Participant registrations aged 4-9^, by PHAs in Brimbank City, 2012
PHA Number Rate* Ardeer - Albion/ Sunshine/ Sunshine West 246 10.9
Cairnlea 95 10.1 Deer Park - Derrimut 294 13.9 Delahey 123 16.8 Keilor 169 31.7 Keilor Downs 146 16.3 Kings Park/ St Albans North 72 2.8 St Albans South/ Sunshine North 116 5.9
Sydenham 167 15.6 Taylors Lakes 243 18.3 Brimbank City 1671 11.6
^ In seven major sports (estimates derived from counts in residential postcodes)
* Participation rate per 100 persons aged 4-9
^ In seven major sports (estimates derived from counts
in residential postcodes) * Participation rate per 100 persons aged 4-9 Map 2: Participant registrations^*, by PHAs in Brimbank, 2012
05
101520253035404550
Rate Victoria
Brimbank
Participant registrations:per 100 persons
18.3 to <31.7 (2)16.3 to <18.3 (2)13.9 to <16.3 (2)10.1 to <13.9 (1)2.8 to <10.1 (3)
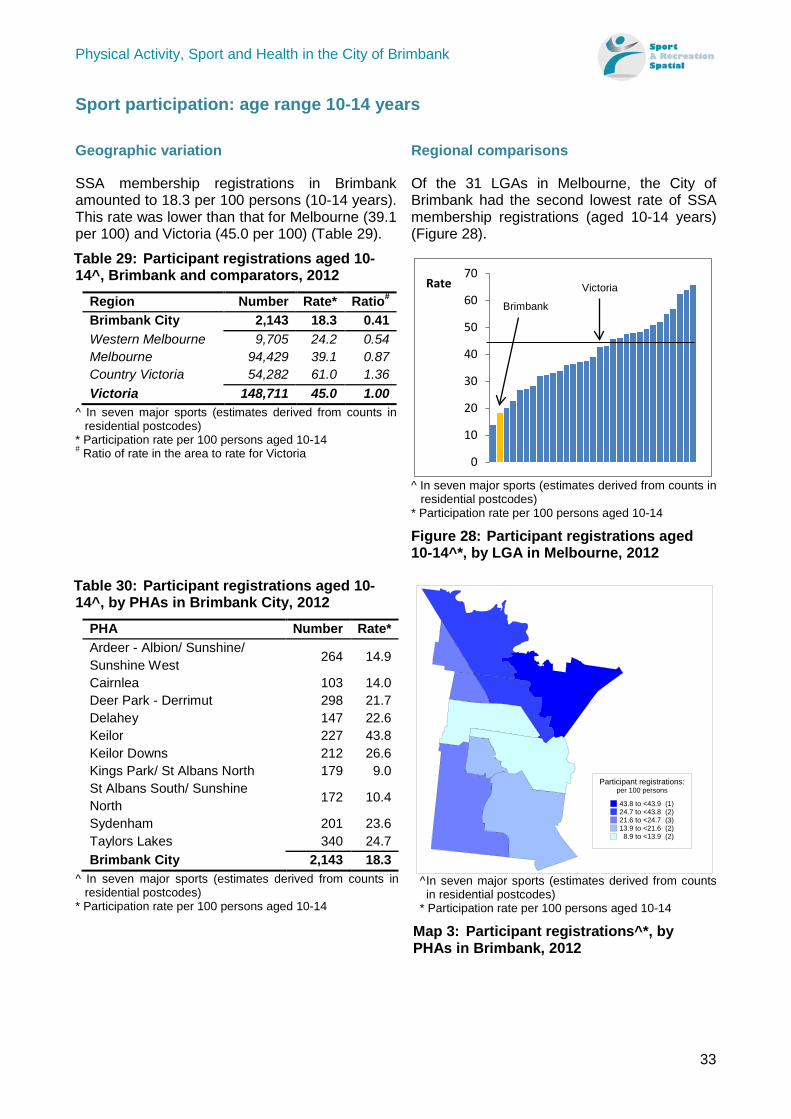
Physical Activity, Sport and Health in the City of Brimbank
33
Sport participation: age range 10-14 years
Geographic variation
SSA membership registrations in Brimbank amounted to 18.3 per 100 persons (10-14 years). This rate was lower than that for Melbourne (39.1 per 100) and Victoria (45.0 per 100) (Table 29).
Table 29: Participant registrations aged 10-14^, Brimbank and comparators, 2012
Region Number Rate* Ratio# Brimbank City 2,143 18.3 0.41 Western Melbourne 9,705 24.2 0.54 Melbourne 94,429 39.1 0.87 Country Victoria 54,282 61.0 1.36 Victoria 148,711 45.0 1.00
^ In seven major sports (estimates derived from counts in residential postcodes)
* Participation rate per 100 persons aged 10-14 # Ratio of rate in the area to rate for Victoria
Regional comparisons
Of the 31 LGAs in Melbourne, the City of Brimbank had the second lowest rate of SSA membership registrations (aged 10-14 years) (Figure 28).
^ In seven major sports (estimates derived from counts in
residential postcodes) * Participation rate per 100 persons aged 10-14 Figure 28: Participant registrations aged 10-14^*, by LGA in Melbourne, 2012
Table 30: Participant registrations aged 10-14^, by PHAs in Brimbank City, 2012
PHA Number Rate* Ardeer - Albion/ Sunshine/ Sunshine West 264 14.9
Cairnlea 103 14.0 Deer Park - Derrimut 298 21.7 Delahey 147 22.6 Keilor 227 43.8 Keilor Downs 212 26.6 Kings Park/ St Albans North 179 9.0 St Albans South/ Sunshine North 172 10.4
Sydenham 201 23.6 Taylors Lakes 340 24.7 Brimbank City 2,143 18.3
^ In seven major sports (estimates derived from counts in residential postcodes)
* Participation rate per 100 persons aged 10-14
^ In seven major sports (estimates derived from counts
in residential postcodes) * Participation rate per 100 persons aged 10-14
Map 3: Participant registrations^*, by PHAs in Brimbank, 2012
0
10
20
30
40
50
60
70Rate Victoria
Brimbank
Participant registrations:per 100 persons
43.8 to <43.9 (1)24.7 to <43.8 (2)21.6 to <24.7 (3)13.9 to <21.6 (2)8.9 to <13.9 (2)
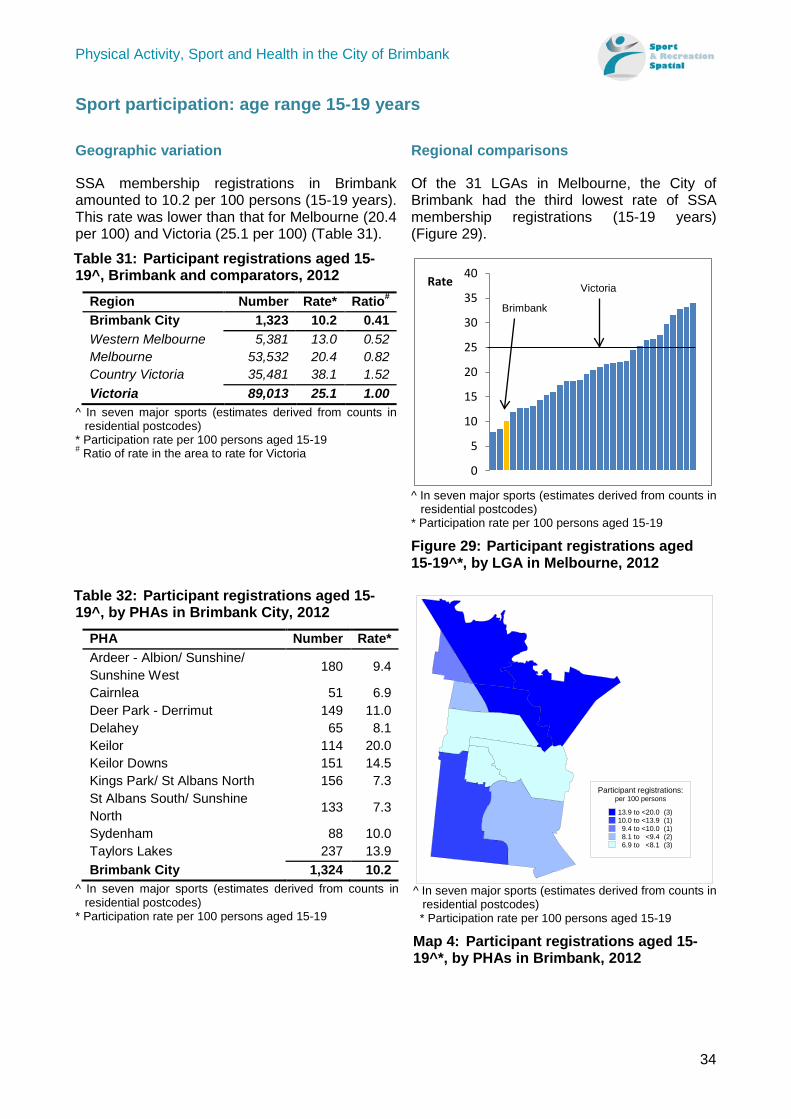
Physical Activity, Sport and Health in the City of Brimbank
34
Sport participation: age range 15-19 years
Geographic variation
SSA membership registrations in Brimbank amounted to 10.2 per 100 persons (15-19 years). This rate was lower than that for Melbourne (20.4 per 100) and Victoria (25.1 per 100) (Table 31).
Table 31: Participant registrations aged 15-19^, Brimbank and comparators, 2012
Region Number Rate* Ratio# Brimbank City 1,323 10.2 0.41 Western Melbourne 5,381 13.0 0.52 Melbourne 53,532 20.4 0.82 Country Victoria 35,481 38.1 1.52 Victoria 89,013 25.1 1.00
^ In seven major sports (estimates derived from counts in residential postcodes)
* Participation rate per 100 persons aged 15-19 # Ratio of rate in the area to rate for Victoria
Regional comparisons
Of the 31 LGAs in Melbourne, the City of Brimbank had the third lowest rate of SSA membership registrations (15-19 years) (Figure 29).
^ In seven major sports (estimates derived from counts in
residential postcodes) * Participation rate per 100 persons aged 15-19 Figure 29: Participant registrations aged 15-19^*, by LGA in Melbourne, 2012
Table 32: Participant registrations aged 15-19^, by PHAs in Brimbank City, 2012
PHA Number Rate* Ardeer - Albion/ Sunshine/ Sunshine West 180 9.4
Cairnlea 51 6.9 Deer Park - Derrimut 149 11.0 Delahey 65 8.1 Keilor 114 20.0 Keilor Downs 151 14.5 Kings Park/ St Albans North 156 7.3 St Albans South/ Sunshine North 133 7.3
Sydenham 88 10.0 Taylors Lakes 237 13.9 Brimbank City 1,324 10.2
^ In seven major sports (estimates derived from counts in residential postcodes)
* Participation rate per 100 persons aged 15-19
^ In seven major sports (estimates derived from counts in
residential postcodes) * Participation rate per 100 persons aged 15-19 Map 4: Participant registrations aged 15-19^*, by PHAs in Brimbank, 2012
0
5
10
15
20
25
30
35
40Rate Victoria
Brimbank
Participant registrations:per 100 persons
13.9 to <20.0 (3)10.0 to <13.9 (1)9.4 to <10.0 (1)8.1 to <9.4 (2)6.9 to <8.1 (3)
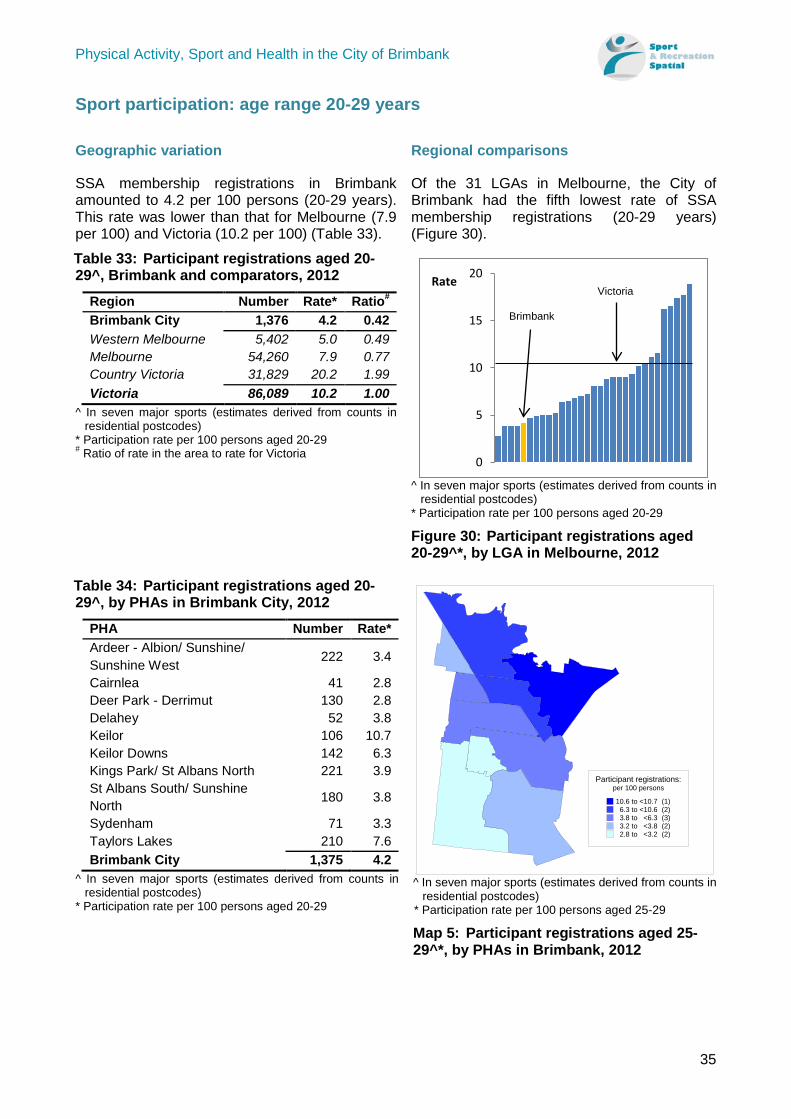
Physical Activity, Sport and Health in the City of Brimbank
35
Sport participation: age range 20-29 years
Geographic variation
SSA membership registrations in Brimbank amounted to 4.2 per 100 persons (20-29 years). This rate was lower than that for Melbourne (7.9 per 100) and Victoria (10.2 per 100) (Table 33).
Table 33: Participant registrations aged 20-29^, Brimbank and comparators, 2012
Region Number Rate* Ratio# Brimbank City 1,376 4.2 0.42 Western Melbourne 5,402 5.0 0.49 Melbourne 54,260 7.9 0.77 Country Victoria 31,829 20.2 1.99 Victoria 86,089 10.2 1.00
^ In seven major sports (estimates derived from counts in residential postcodes)
* Participation rate per 100 persons aged 20-29 # Ratio of rate in the area to rate for Victoria
Regional comparisons
Of the 31 LGAs in Melbourne, the City of Brimbank had the fifth lowest rate of SSA membership registrations (20-29 years) (Figure 30).
^ In seven major sports (estimates derived from counts in
residential postcodes) * Participation rate per 100 persons aged 20-29 Figure 30: Participant registrations aged 20-29^*, by LGA in Melbourne, 2012
Table 34: Participant registrations aged 20-29^, by PHAs in Brimbank City, 2012
PHA Number Rate* Ardeer - Albion/ Sunshine/ Sunshine West 222 3.4
Cairnlea 41 2.8 Deer Park - Derrimut 130 2.8 Delahey 52 3.8 Keilor 106 10.7 Keilor Downs 142 6.3 Kings Park/ St Albans North 221 3.9 St Albans South/ Sunshine North 180 3.8
Sydenham 71 3.3 Taylors Lakes 210 7.6 Brimbank City 1,375 4.2
^ In seven major sports (estimates derived from counts in residential postcodes)
* Participation rate per 100 persons aged 20-29
^ In seven major sports (estimates derived from counts in
residential postcodes) * Participation rate per 100 persons aged 25-29
Map 5: Participant registrations aged 25-29^*, by PHAs in Brimbank, 2012
0
5
10
15
20Rate Victoria
Brimbank
Participant registrations:per 100 persons
10.6 to <10.7 (1)6.3 to <10.6 (2)3.8 to <6.3 (3)3.2 to <3.8 (2)2.8 to <3.2 (2)
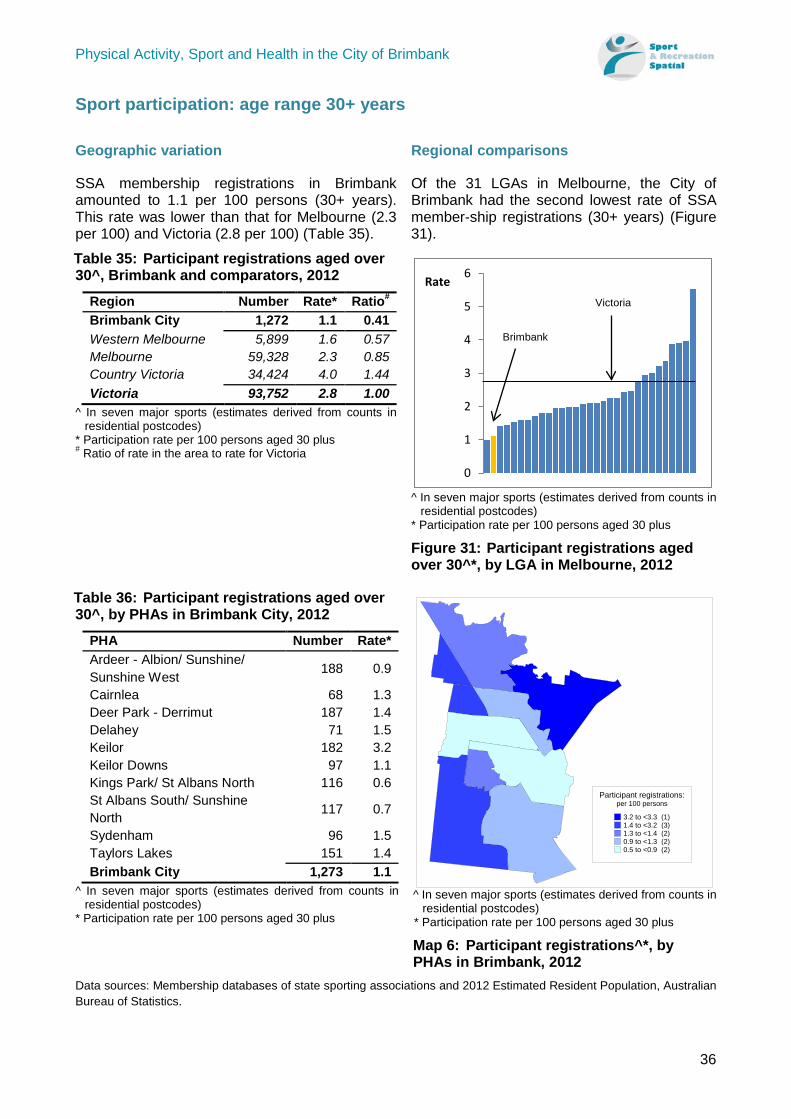
Physical Activity, Sport and Health in the City of Brimbank
36
Sport participation: age range 30+ years
Geographic variation
SSA membership registrations in Brimbank amounted to 1.1 per 100 persons (30+ years). This rate was lower than that for Melbourne (2.3 per 100) and Victoria (2.8 per 100) (Table 35).
Table 35: Participant registrations aged over 30^, Brimbank and comparators, 2012
Region Number Rate* Ratio# Brimbank City 1,272 1.1 0.41 Western Melbourne 5,899 1.6 0.57 Melbourne 59,328 2.3 0.85 Country Victoria 34,424 4.0 1.44 Victoria 93,752 2.8 1.00
^ In seven major sports (estimates derived from counts in residential postcodes)
* Participation rate per 100 persons aged 30 plus # Ratio of rate in the area to rate for Victoria
Regional comparisons
Of the 31 LGAs in Melbourne, the City of Brimbank had the second lowest rate of SSA member-ship registrations (30+ years) (Figure 31).
^ In seven major sports (estimates derived from counts in
residential postcodes) * Participation rate per 100 persons aged 30 plus Figure 31: Participant registrations aged over 30^*, by LGA in Melbourne, 2012
Table 36: Participant registrations aged over 30^, by PHAs in Brimbank City, 2012
PHA Number Rate* Ardeer - Albion/ Sunshine/ Sunshine West 188 0.9
Cairnlea 68 1.3 Deer Park - Derrimut 187 1.4 Delahey 71 1.5 Keilor 182 3.2 Keilor Downs 97 1.1 Kings Park/ St Albans North 116 0.6 St Albans South/ Sunshine North 117 0.7
Sydenham 96 1.5 Taylors Lakes 151 1.4 Brimbank City 1,273 1.1
^ In seven major sports (estimates derived from counts in residential postcodes)
* Participation rate per 100 persons aged 30 plus
^ In seven major sports (estimates derived from counts in
residential postcodes) * Participation rate per 100 persons aged 30 plus
Map 6: Participant registrations^*, by PHAs in Brimbank, 2012
Data sources: Membership databases of state sporting associations and 2012 Estimated Resident Population, Australian Bureau of Statistics.
0
1
2
3
4
5
6Rate
Victoria
Brimbank
Participant registrations:per 100 persons
3.2 to <3.3 (1)1.4 to <3.2 (3)1.3 to <1.4 (2)0.9 to <1.3 (2)0.5 to <0.9 (2)
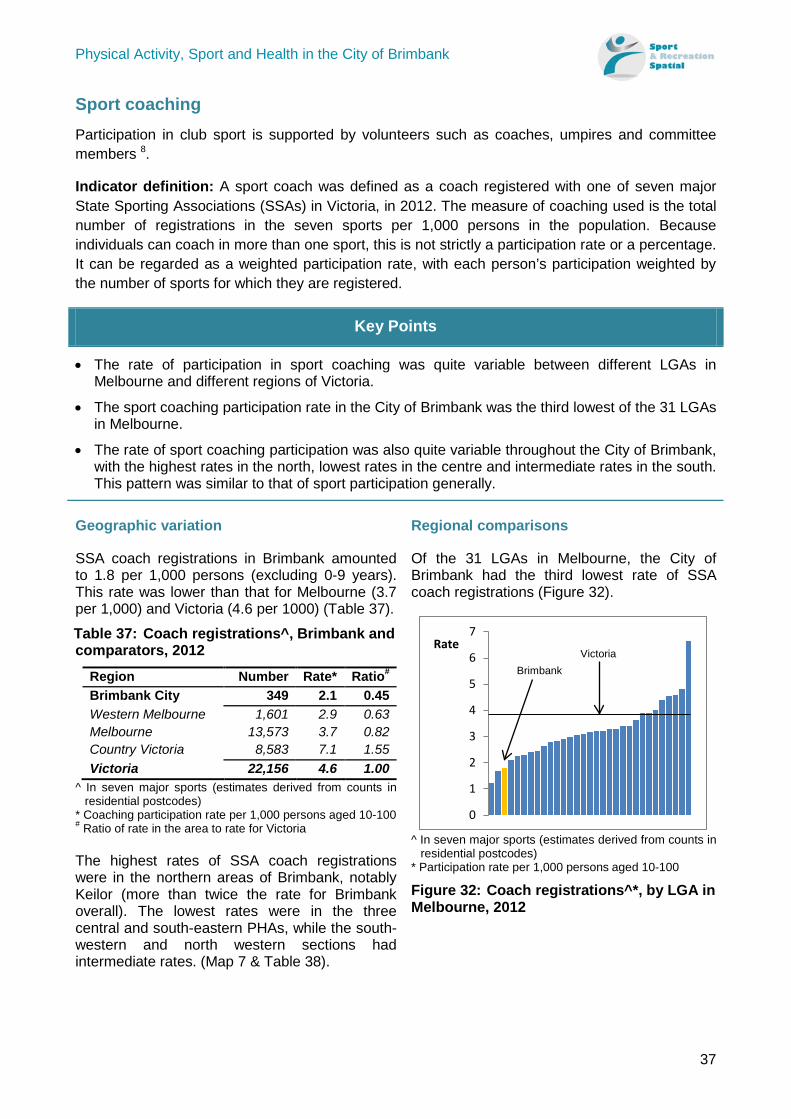
Physical Activity, Sport and Health in the City of Brimbank
37
Sport coaching Participation in club sport is supported by volunteers such as coaches, umpires and committee members 8.
Indicator definition: A sport coach was defined as a coach registered with one of seven major State Sporting Associations (SSAs) in Victoria, in 2012. The measure of coaching used is the total number of registrations in the seven sports per 1,000 persons in the population. Because individuals can coach in more than one sport, this is not strictly a participation rate or a percentage. It can be regarded as a weighted participation rate, with each person’s participation weighted by the number of sports for which they are registered.
Key Points
• The rate of participation in sport coaching was quite variable between different LGAs in Melbourne and different regions of Victoria.
• The sport coaching participation rate in the City of Brimbank was the third lowest of the 31 LGAs in Melbourne.
• The rate of sport coaching participation was also quite variable throughout the City of Brimbank, with the highest rates in the north, lowest rates in the centre and intermediate rates in the south. This pattern was similar to that of sport participation generally.
Geographic variation
SSA coach registrations in Brimbank amounted to 1.8 per 1,000 persons (excluding 0-9 years). This rate was lower than that for Melbourne (3.7 per 1,000) and Victoria (4.6 per 1000) (Table 37).
Table 37: Coach registrations^, Brimbank and comparators, 2012
Region Number Rate* Ratio# Brimbank City 349 2.1 0.45 Western Melbourne 1,601 2.9 0.63 Melbourne 13,573 3.7 0.82 Country Victoria 8,583 7.1 1.55 Victoria 22,156 4.6 1.00
^ In seven major sports (estimates derived from counts in residential postcodes)
* Coaching participation rate per 1,000 persons aged 10-100 # Ratio of rate in the area to rate for Victoria The highest rates of SSA coach registrations were in the northern areas of Brimbank, notably Keilor (more than twice the rate for Brimbank overall). The lowest rates were in the three central and south-eastern PHAs, while the south-western and north western sections had intermediate rates. (Map 7 & Table 38).
Regional comparisons
Of the 31 LGAs in Melbourne, the City of Brimbank had the third lowest rate of SSA coach registrations (Figure 32).
^ In seven major sports (estimates derived from counts in
residential postcodes) * Participation rate per 1,000 persons aged 10-100
Figure 32: Coach registrations^*, by LGA in Melbourne, 2012
0
1
2
3
4
5
6
7Rate
Victoria Brimbank
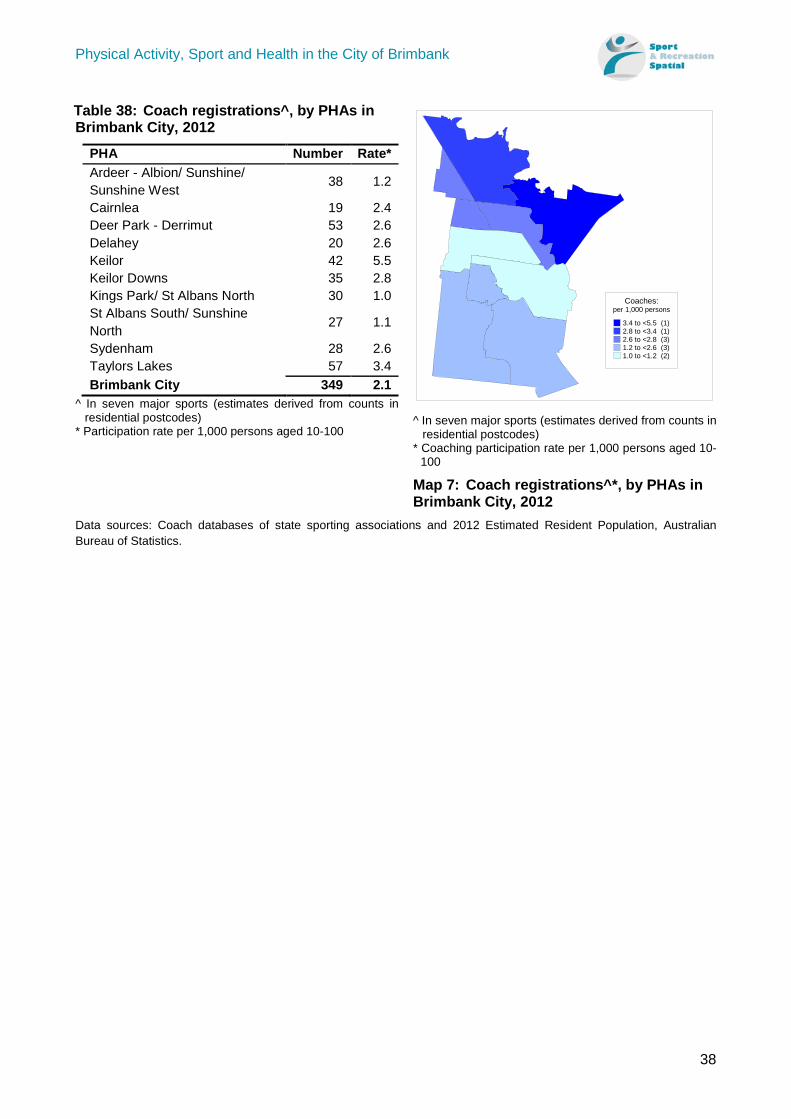
Physical Activity, Sport and Health in the City of Brimbank
38
Table 38: Coach registrations^, by PHAs in Brimbank City, 2012
PHA Number Rate* Ardeer - Albion/ Sunshine/ Sunshine West 38 1.2
Cairnlea 19 2.4 Deer Park - Derrimut 53 2.6 Delahey 20 2.6 Keilor 42 5.5 Keilor Downs 35 2.8 Kings Park/ St Albans North 30 1.0 St Albans South/ Sunshine North 27 1.1
Sydenham 28 2.6 Taylors Lakes 57 3.4 Brimbank City 349 2.1
^ In seven major sports (estimates derived from counts in residential postcodes)
* Participation rate per 1,000 persons aged 10-100
^ In seven major sports (estimates derived from counts in
residential postcodes) * Coaching participation rate per 1,000 persons aged 10-
100
Map 7: Coach registrations^*, by PHAs in Brimbank City, 2012
Data sources: Coach databases of state sporting associations and 2012 Estimated Resident Population, Australian Bureau of Statistics.
Coaches:per 1,000 persons
3.4 to <5.5 (1)2.8 to <3.4 (1)2.6 to <2.8 (3)1.2 to <2.6 (3)1.0 to <1.2 (2)
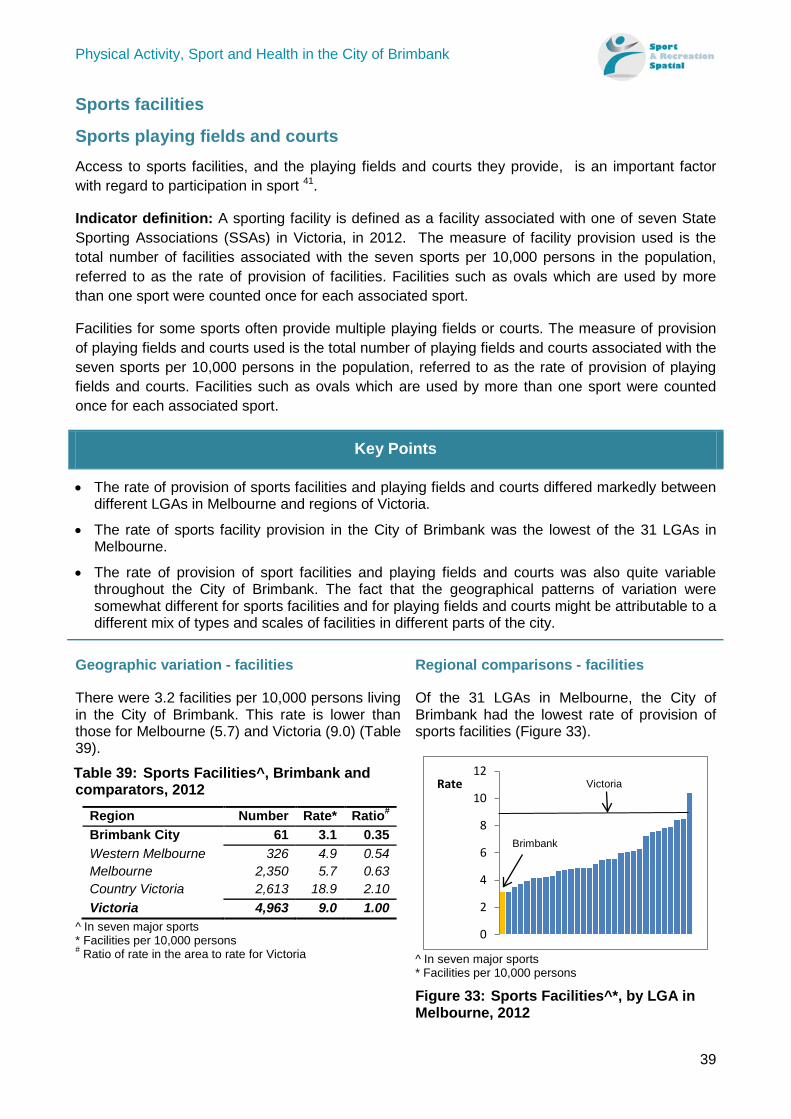
Physical Activity, Sport and Health in the City of Brimbank
39
Sports facilities
Sports playing fields and courts Access to sports facilities, and the playing fields and courts they provide, is an important factor with regard to participation in sport 41.
Indicator definition: A sporting facility is defined as a facility associated with one of seven State Sporting Associations (SSAs) in Victoria, in 2012. The measure of facility provision used is the total number of facilities associated with the seven sports per 10,000 persons in the population, referred to as the rate of provision of facilities. Facilities such as ovals which are used by more than one sport were counted once for each associated sport.
Facilities for some sports often provide multiple playing fields or courts. The measure of provision of playing fields and courts used is the total number of playing fields and courts associated with the seven sports per 10,000 persons in the population, referred to as the rate of provision of playing fields and courts. Facilities such as ovals which are used by more than one sport were counted once for each associated sport.
Key Points
• The rate of provision of sports facilities and playing fields and courts differed markedly between different LGAs in Melbourne and regions of Victoria.
• The rate of sports facility provision in the City of Brimbank was the lowest of the 31 LGAs in Melbourne.
• The rate of provision of sport facilities and playing fields and courts was also quite variable throughout the City of Brimbank. The fact that the geographical patterns of variation were somewhat different for sports facilities and for playing fields and courts might be attributable to a different mix of types and scales of facilities in different parts of the city.
Geographic variation - facilities
There were 3.2 facilities per 10,000 persons living in the City of Brimbank. This rate is lower than those for Melbourne (5.7) and Victoria (9.0) (Table 39).
Table 39: Sports Facilities^, Brimbank and comparators, 2012
Region Number Rate* Ratio# Brimbank City 61 3.1 0.35 Western Melbourne 326 4.9 0.54 Melbourne 2,350 5.7 0.63 Country Victoria 2,613 18.9 2.10 Victoria 4,963 9.0 1.00
^ In seven major sports * Facilities per 10,000 persons # Ratio of rate in the area to rate for Victoria
Regional comparisons - facilities
Of the 31 LGAs in Melbourne, the City of Brimbank had the lowest rate of provision of sports facilities (Figure 33).
^ In seven major sports * Facilities per 10,000 persons Figure 33: Sports Facilities^*, by LGA in Melbourne, 2012
0
2
4
6
8
10
12Rate
Brimbank
Victoria
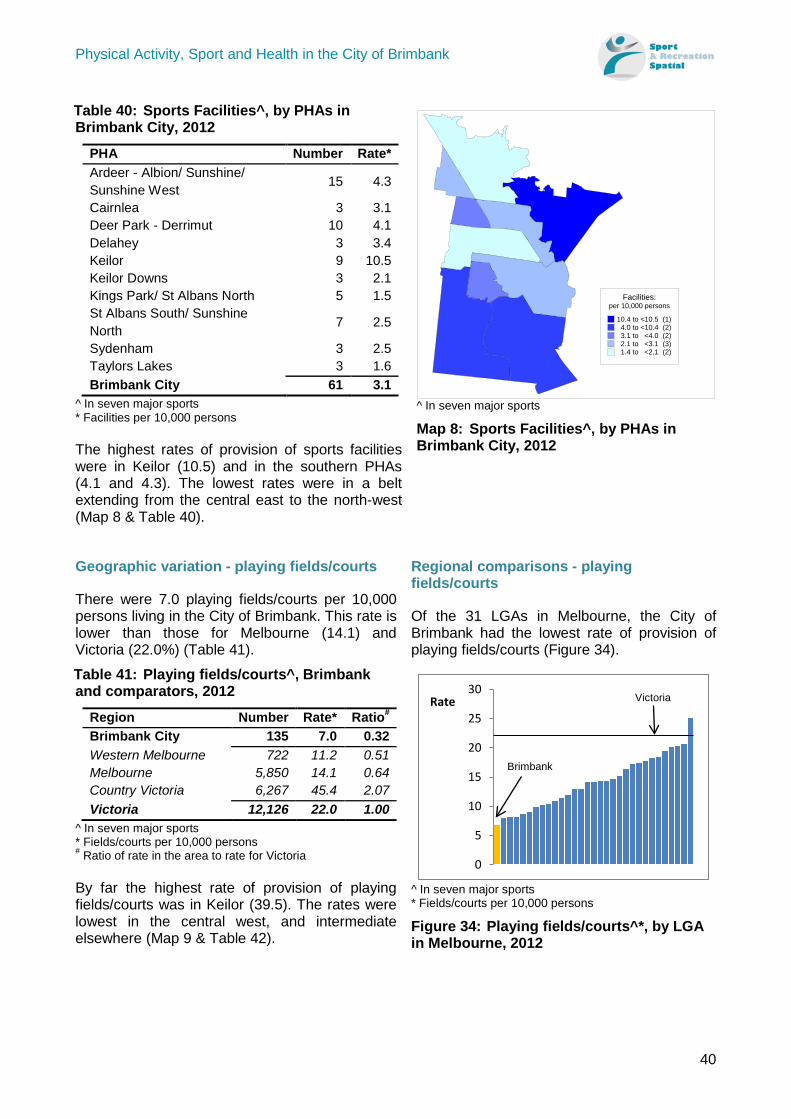
Physical Activity, Sport and Health in the City of Brimbank
40
Table 40: Sports Facilities^, by PHAs in Brimbank City, 2012
PHA Number Rate* Ardeer - Albion/ Sunshine/ Sunshine West 15 4.3
Cairnlea 3 3.1 Deer Park - Derrimut 10 4.1 Delahey 3 3.4 Keilor 9 10.5 Keilor Downs 3 2.1 Kings Park/ St Albans North 5 1.5 St Albans South/ Sunshine North 7 2.5
Sydenham 3 2.5 Taylors Lakes 3 1.6 Brimbank City 61 3.1
^ In seven major sports * Facilities per 10,000 persons The highest rates of provision of sports facilities were in Keilor (10.5) and in the southern PHAs (4.1 and 4.3). The lowest rates were in a belt extending from the central east to the north-west (Map 8 & Table 40).
^ In seven major sports
Map 8: Sports Facilities^, by PHAs in Brimbank City, 2012
Geographic variation - playing fields/courts
There were 7.0 playing fields/courts per 10,000 persons living in the City of Brimbank. This rate is lower than those for Melbourne (14.1) and Victoria (22.0%) (Table 41).
Table 41: Playing fields/courts^, Brimbank and comparators, 2012
Region Number Rate* Ratio# Brimbank City 135 7.0 0.32 Western Melbourne 722 11.2 0.51 Melbourne 5,850 14.1 0.64 Country Victoria 6,267 45.4 2.07 Victoria 12,126 22.0 1.00
^ In seven major sports * Fields/courts per 10,000 persons # Ratio of rate in the area to rate for Victoria By far the highest rate of provision of playing fields/courts was in Keilor (39.5). The rates were lowest in the central west, and intermediate elsewhere (Map 9 & Table 42).
Regional comparisons - playing fields/courts
Of the 31 LGAs in Melbourne, the City of Brimbank had the lowest rate of provision of playing fields/courts (Figure 34).
^ In seven major sports * Fields/courts per 10,000 persons
Figure 34: Playing fields/courts^*, by LGA in Melbourne, 2012
Facilities:per 10,000 persons
10.4 to <10.5 (1)4.0 to <10.4 (2)3.1 to <4.0 (2)2.1 to <3.1 (3)1.4 to <2.1 (2)
0
5
10
15
20
25
30Rate
Brimbank
Victoria
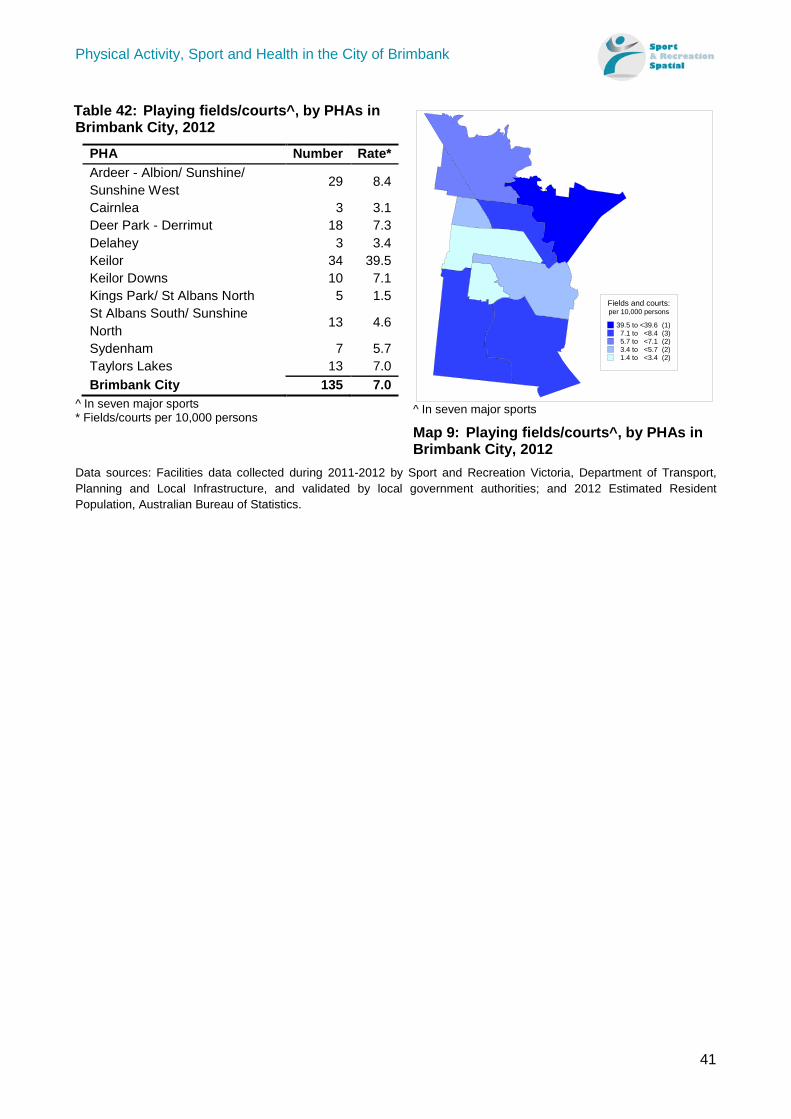
Physical Activity, Sport and Health in the City of Brimbank
41
Table 42: Playing fields/courts^, by PHAs in Brimbank City, 2012
PHA Number Rate* Ardeer - Albion/ Sunshine/ Sunshine West 29 8.4
Cairnlea 3 3.1 Deer Park - Derrimut 18 7.3 Delahey 3 3.4 Keilor 34 39.5 Keilor Downs 10 7.1 Kings Park/ St Albans North 5 1.5 St Albans South/ Sunshine North 13 4.6
Sydenham 7 5.7 Taylors Lakes 13 7.0 Brimbank City 135 7.0
^ In seven major sports * Fields/courts per 10,000 persons
^ In seven major sports
Map 9: Playing fields/courts^, by PHAs in Brimbank City, 2012
Data sources: Facilities data collected during 2011-2012 by Sport and Recreation Victoria, Department of Transport, Planning and Local Infrastructure, and validated by local government authorities; and 2012 Estimated Resident Population, Australian Bureau of Statistics.
Fields and courts:per 10,000 persons
39.5 to <39.6 (1)7.1 to <8.4 (3)5.7 to <7.1 (2)3.4 to <5.7 (2)1.4 to <3.4 (2)
Physical Activity, Sport and Health in the City of Brimbank
42
Correlations To explore the relationships between the 35 indicators included in this report, correlation coefficients were calculated using data for the same set of LGAs which were used as reference comparators for each indicator - the 31 LGAs constituting metropolitan Melbourne. Correlations were calculated between all pairs of 29 indicators, grouped as follows: • Health indicators (9) • Putative educational and other demographic correlates of health and PA (7) • Sport and PA indicators, including
- Leisure-time PA measures (8) - Sport participation measures (6) - Sport facilitation measures (3)
For an explanation of correlation coefficients and statistical significance (p-values) see Appendix 1. This section is structured as follows: • Table 43 shows the correlations among the health indicators • Table 44 shows the correlations among the demographic indicators. • Table 45 shows the correlations among the PA and sport indicators. • Table 46 shows the correlations between the health indicators and the other four groups, and • Table 47 shows the correlations between the demographics and the PA and sport indicators. To aid interpretation, the following colour shading has been used to categorise the sign and magnitude of the correlations. It must be remembered that these correlations are ecological – that is they reflect relationships between the aggregated characteristics of communities (in this case LGAs), not between the characteristics of individuals. Key Correlation +ve -ve .70 or higher Very strong .50 to .69 Strong .30 to .49 Moderate .00 to .29 Weak Correlations among health indicators Table 43 shows that the nine health indicators were strongly positively correlated across the 31 LGAs.
Correlations among demographic indicators Table 44 shows that the seven demographic variables fall into two sub-groups of three and four respectively. One sub-group is associated with immigration and the other involves education, social capital and socio-economic status (SES); we refer to this group as ‘educational and social wellbeing’. The correlations within each of these sub-groups were strongly positive, and the correlations between the sub-groups were weakly to moderately negative. It is noted that while the ‘volunteering’ indicator has some commonality with the sport facilitation measures, volunteering also occurs in many non-sporting contexts.
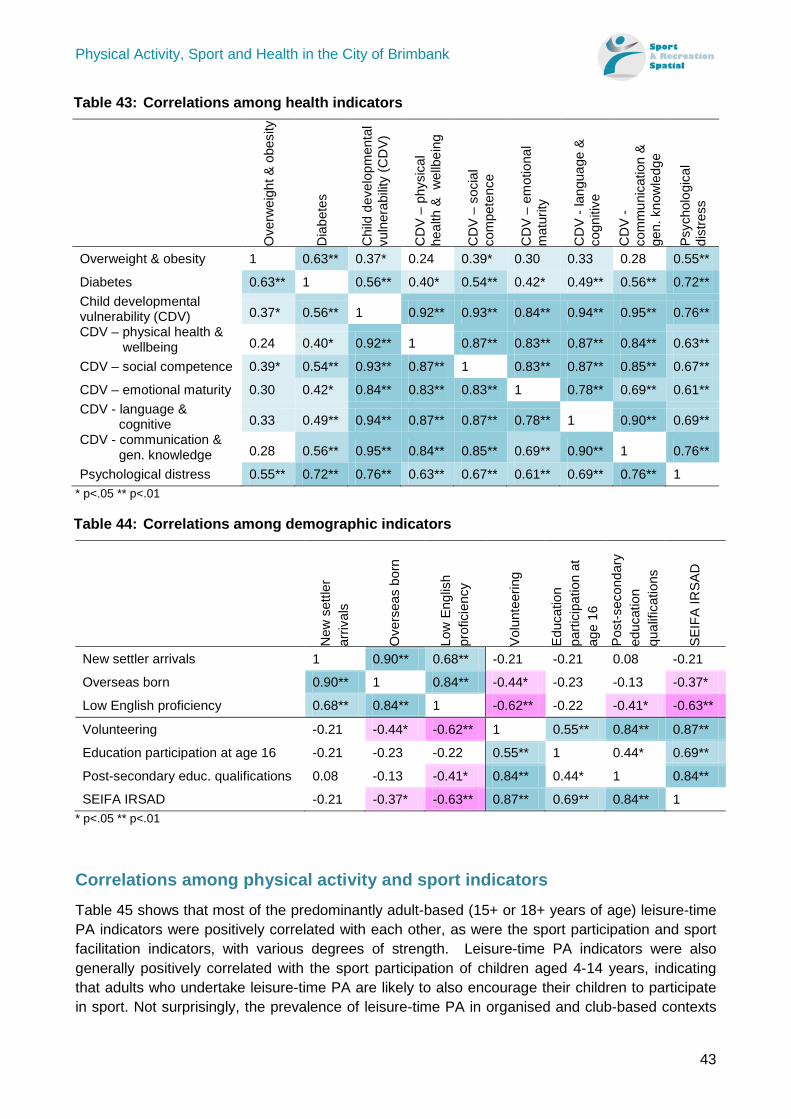
Physical Activity, Sport and Health in the City of Brimbank
43
Table 43: Correlations among health indicators
O
verw
eigh
t & o
besi
ty
Dia
bete
s
Chi
ld d
evel
opm
enta
l vu
lner
abilit
y (C
DV)
CD
V –
phys
ical
he
alth
& w
ellb
eing
CD
V –
soci
al
com
pete
nce
CD
V –
emot
iona
l m
atur
ity
CD
V - l
angu
age
& co
gniti
ve
CD
V -
com
mun
icat
ion
&
gen.
kno
wle
dge
Psyc
holo
gica
l di
stre
ss
Overweight & obesity 1 0.63** 0.37* 0.24 0.39* 0.30 0.33 0.28 0.55**
Diabetes 0.63** 1 0.56** 0.40* 0.54** 0.42* 0.49** 0.56** 0.72** Child developmental vulnerability (CDV) 0.37* 0.56** 1 0.92** 0.93** 0.84** 0.94** 0.95** 0.76** CDV – physical health &
wellbeing 0.24 0.40* 0.92** 1 0.87** 0.83** 0.87** 0.84** 0.63**
CDV – social competence 0.39* 0.54** 0.93** 0.87** 1 0.83** 0.87** 0.85** 0.67**
CDV – emotional maturity 0.30 0.42* 0.84** 0.83** 0.83** 1 0.78** 0.69** 0.61** CDV - language &
cognitive 0.33 0.49** 0.94** 0.87** 0.87** 0.78** 1 0.90** 0.69** CDV - communication &
gen. knowledge 0.28 0.56** 0.95** 0.84** 0.85** 0.69** 0.90** 1 0.76**
Psychological distress 0.55** 0.72** 0.76** 0.63** 0.67** 0.61** 0.69** 0.76** 1 * p<.05 ** p<.01
Table 44: Correlations among demographic indicators
New
set
tler
arriv
als
Ove
rsea
s bo
rn
Low
Eng
lish
prof
icie
ncy
Volu
ntee
ring
Educ
atio
n pa
rtici
patio
n at
ag
e 16
Post
-sec
onda
ry
educ
atio
n qu
alifi
catio
ns
SEIF
A IR
SAD
New settler arrivals 1 0.90** 0.68** -0.21 -0.21 0.08 -0.21
Overseas born 0.90** 1 0.84** -0.44* -0.23 -0.13 -0.37*
Low English proficiency 0.68** 0.84** 1 -0.62** -0.22 -0.41* -0.63**
Volunteering -0.21 -0.44* -0.62** 1 0.55** 0.84** 0.87**
Education participation at age 16 -0.21 -0.23 -0.22 0.55** 1 0.44* 0.69**
Post-secondary educ. qualifications 0.08 -0.13 -0.41* 0.84** 0.44* 1 0.84**
SEIFA IRSAD -0.21 -0.37* -0.63** 0.87** 0.69** 0.84** 1 * p<.05 ** p<.01
Correlations among physical activity and sport indicators Table 45 shows that most of the predominantly adult-based (15+ or 18+ years of age) leisure-time PA indicators were positively correlated with each other, as were the sport participation and sport facilitation indicators, with various degrees of strength. Leisure-time PA indicators were also generally positively correlated with the sport participation of children aged 4-14 years, indicating that adults who undertake leisure-time PA are likely to also encourage their children to participate in sport. Not surprisingly, the prevalence of leisure-time PA in organised and club-based contexts
Physical Activity, Sport and Health in the City of Brimbank
44
was positively correlated with sport participation for all age groups and with sport facilitation indicators.
The one seemingly anomalous result is the fact that the ‘time spent sitting’ indicator (the proportion of people aged 18 years or over who sit for seven hours or more per typical weekday), although inherently an indicator of physical inactivity, was positively correlated with a number of PA measures (highlighted in red in Table 45), though moderately negatively correlated with one sport participation indicator. This indicates that sedentary behaviour and some forms of recreational PA tended to coexist at the level of an LGA. The degree to which this is the case for individuals, or whether it is an ecological effect (whereby different individuals within an LGA do the sitting and the PA) cannot be determined from these data. At either level, the mechanism underlying the relationships is likely to involve other factors such as education, which are associated with both type of employment and patterns of health awareness and behaviour outside working hours.
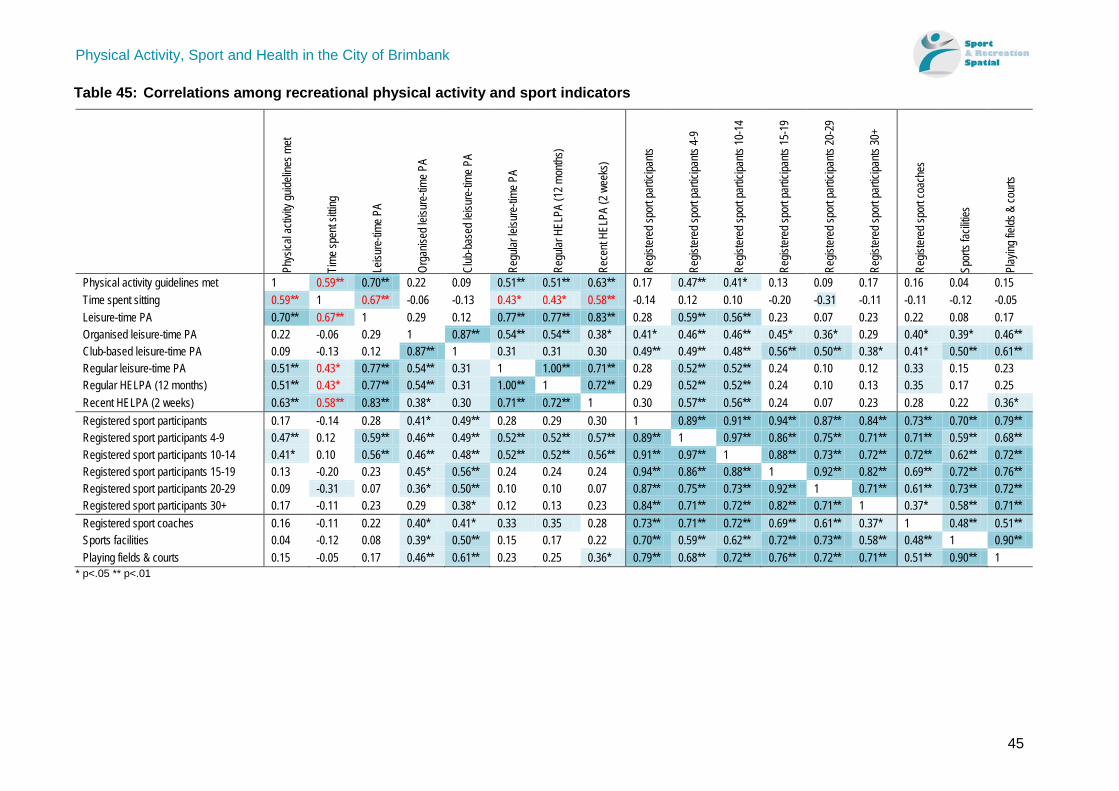
Physical Activity, Sport and Health in the City of Brimbank
45
Table 45: Correlations among recreational physical activity and sport indicators
Phys
ical a
ctivit
y guid
eline
s met
Time s
pent
sittin
g
Leisu
re-tim
e PA
Orga
nised
leisu
re-tim
e PA
Club
-bas
ed le
isure
-time P
A
Regu
lar le
isure
-time P
A
Regu
lar H
ELPA
(12 m
onths
)
Rece
nt HE
LPA
(2 w
eeks
)
Regis
tered
spor
t par
ticipa
nts
Regis
tered
spor
t par
ticipa
nts 4-
9
Regis
tered
spor
t par
ticipa
nts 10
-14
Regis
tered
spor
t par
ticipa
nts 15
-19
Regis
tered
spor
t par
ticipa
nts 20
-29
Regis
tered
spor
t par
ticipa
nts 30
+
Regis
tered
spor
t coa
ches
Spor
ts fac
ilities
Play
ing fie
lds &
cour
ts
Physical activity guidelines met 1 0.59** 0.70** 0.22 0.09 0.51** 0.51** 0.63** 0.17 0.47** 0.41* 0.13 0.09 0.17 0.16 0.04 0.15 Time spent sitting 0.59** 1 0.67** -0.06 -0.13 0.43* 0.43* 0.58** -0.14 0.12 0.10 -0.20 -0.31 -0.11 -0.11 -0.12 -0.05 Leisure-time PA 0.70** 0.67** 1 0.29 0.12 0.77** 0.77** 0.83** 0.28 0.59** 0.56** 0.23 0.07 0.23 0.22 0.08 0.17 Organised leisure-time PA 0.22 -0.06 0.29 1 0.87** 0.54** 0.54** 0.38* 0.41* 0.46** 0.46** 0.45* 0.36* 0.29 0.40* 0.39* 0.46** Club-based leisure-time PA 0.09 -0.13 0.12 0.87** 1 0.31 0.31 0.30 0.49** 0.49** 0.48** 0.56** 0.50** 0.38* 0.41* 0.50** 0.61** Regular leisure-time PA 0.51** 0.43* 0.77** 0.54** 0.31 1 1.00** 0.71** 0.28 0.52** 0.52** 0.24 0.10 0.12 0.33 0.15 0.23 Regular HELPA (12 months) 0.51** 0.43* 0.77** 0.54** 0.31 1.00** 1 0.72** 0.29 0.52** 0.52** 0.24 0.10 0.13 0.35 0.17 0.25 Recent HELPA (2 weeks) 0.63** 0.58** 0.83** 0.38* 0.30 0.71** 0.72** 1 0.30 0.57** 0.56** 0.24 0.07 0.23 0.28 0.22 0.36* Registered sport participants 0.17 -0.14 0.28 0.41* 0.49** 0.28 0.29 0.30 1 0.89** 0.91** 0.94** 0.87** 0.84** 0.73** 0.70** 0.79** Registered sport participants 4-9 0.47** 0.12 0.59** 0.46** 0.49** 0.52** 0.52** 0.57** 0.89** 1 0.97** 0.86** 0.75** 0.71** 0.71** 0.59** 0.68** Registered sport participants 10-14 0.41* 0.10 0.56** 0.46** 0.48** 0.52** 0.52** 0.56** 0.91** 0.97** 1 0.88** 0.73** 0.72** 0.72** 0.62** 0.72** Registered sport participants 15-19 0.13 -0.20 0.23 0.45* 0.56** 0.24 0.24 0.24 0.94** 0.86** 0.88** 1 0.92** 0.82** 0.69** 0.72** 0.76** Registered sport participants 20-29 0.09 -0.31 0.07 0.36* 0.50** 0.10 0.10 0.07 0.87** 0.75** 0.73** 0.92** 1 0.71** 0.61** 0.73** 0.72** Registered sport participants 30+ 0.17 -0.11 0.23 0.29 0.38* 0.12 0.13 0.23 0.84** 0.71** 0.72** 0.82** 0.71** 1 0.37* 0.58** 0.71** Registered sport coaches 0.16 -0.11 0.22 0.40* 0.41* 0.33 0.35 0.28 0.73** 0.71** 0.72** 0.69** 0.61** 0.37* 1 0.48** 0.51** Sports facilities 0.04 -0.12 0.08 0.39* 0.50** 0.15 0.17 0.22 0.70** 0.59** 0.62** 0.72** 0.73** 0.58** 0.48** 1 0.90** Playing fields & courts 0.15 -0.05 0.17 0.46** 0.61** 0.23 0.25 0.36* 0.79** 0.68** 0.72** 0.76** 0.72** 0.71** 0.51** 0.90** 1
* p<.05 ** p<.01
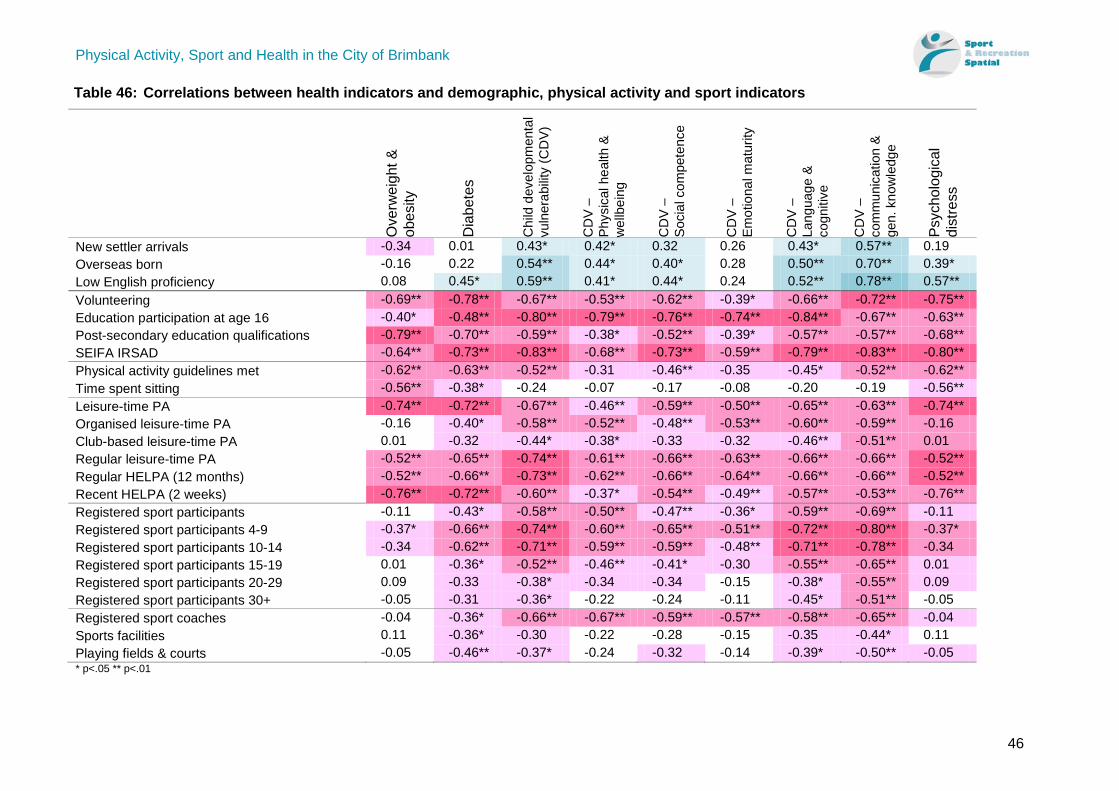
Physical Activity, Sport and Health in the City of Brimbank
46
Table 46: Correlations between health indicators and demographic, physical activity and sport indicators
Ove
rwei
ght &
ob
esity
Dia
bete
s
Chi
ld d
evel
opm
enta
l vu
lner
abilit
y (C
DV)
CD
V –
Ph
ysic
al h
ealth
&
wel
lbei
ng
CD
V –
So
cial
com
pete
nce
CD
V –
Em
otio
nal m
atur
ity
CD
V –
La
ngua
ge &
co
gniti
ve
CD
V –
com
mun
icat
ion
& ge
n. k
now
ledg
e
Psyc
holo
gica
l di
stre
ss
New settler arrivals -0.34 0.01 0.43* 0.42* 0.32 0.26 0.43* 0.57** 0.19 Overseas born -0.16 0.22 0.54** 0.44* 0.40* 0.28 0.50** 0.70** 0.39* Low English proficiency 0.08 0.45* 0.59** 0.41* 0.44* 0.24 0.52** 0.78** 0.57** Volunteering -0.69** -0.78** -0.67** -0.53** -0.62** -0.39* -0.66** -0.72** -0.75** Education participation at age 16 -0.40* -0.48** -0.80** -0.79** -0.76** -0.74** -0.84** -0.67** -0.63** Post-secondary education qualifications -0.79** -0.70** -0.59** -0.38* -0.52** -0.39* -0.57** -0.57** -0.68** SEIFA IRSAD -0.64** -0.73** -0.83** -0.68** -0.73** -0.59** -0.79** -0.83** -0.80** Physical activity guidelines met -0.62** -0.63** -0.52** -0.31 -0.46** -0.35 -0.45* -0.52** -0.62** Time spent sitting -0.56** -0.38* -0.24 -0.07 -0.17 -0.08 -0.20 -0.19 -0.56** Leisure-time PA -0.74** -0.72** -0.67** -0.46** -0.59** -0.50** -0.65** -0.63** -0.74** Organised leisure-time PA -0.16 -0.40* -0.58** -0.52** -0.48** -0.53** -0.60** -0.59** -0.16 Club-based leisure-time PA 0.01 -0.32 -0.44* -0.38* -0.33 -0.32 -0.46** -0.51** 0.01 Regular leisure-time PA -0.52** -0.65** -0.74** -0.61** -0.66** -0.63** -0.66** -0.66** -0.52** Regular HELPA (12 months) -0.52** -0.66** -0.73** -0.62** -0.66** -0.64** -0.66** -0.66** -0.52** Recent HELPA (2 weeks) -0.76** -0.72** -0.60** -0.37* -0.54** -0.49** -0.57** -0.53** -0.76** Registered sport participants -0.11 -0.43* -0.58** -0.50** -0.47** -0.36* -0.59** -0.69** -0.11 Registered sport participants 4-9 -0.37* -0.66** -0.74** -0.60** -0.65** -0.51** -0.72** -0.80** -0.37* Registered sport participants 10-14 -0.34 -0.62** -0.71** -0.59** -0.59** -0.48** -0.71** -0.78** -0.34 Registered sport participants 15-19 0.01 -0.36* -0.52** -0.46** -0.41* -0.30 -0.55** -0.65** 0.01 Registered sport participants 20-29 0.09 -0.33 -0.38* -0.34 -0.34 -0.15 -0.38* -0.55** 0.09 Registered sport participants 30+ -0.05 -0.31 -0.36* -0.22 -0.24 -0.11 -0.45* -0.51** -0.05 Registered sport coaches -0.04 -0.36* -0.66** -0.67** -0.59** -0.57** -0.58** -0.65** -0.04 Sports facilities 0.11 -0.36* -0.30 -0.22 -0.28 -0.15 -0.35 -0.44* 0.11 Playing fields & courts -0.05 -0.46** -0.37* -0.24 -0.32 -0.14 -0.39* -0.50** -0.05 * p<.05 ** p<.01
Physical Activity, Sport and Health in the City of Brimbank
47
Correlations between health indicators and demographic, physical activity and sport indicators Table 46 shows the inter-correlations between the nine health indicators and the demographic, recreational PA and sport indicators.
Overweight and obesity
The prevalence of overweight and obesity was strongly negatively correlated with all three educational and social wellbeing indicators and with all indicators of recreational PA except organised and club-based activities. However, there was no evidence of substantial relationships with immigration measures or sport facilitation, and only two substantial correlations with sport participation measures – those of the two youngest age groups.
The finding that prevalence of overweight and obesity is negatively associated with SES is consistent with the literature 42-45. People who are overweight or obese are less likely to have post-secondary education qualifications, and more likely to live within lower SES areas. They are also less likely to meet the PA guidelines or participate in leisure-time PA. Therefore if we can increase levels of PA amongst the Brimbank community then lower prevalence of overweight and obesity may result. However, the prevalence of overweight and obesity was not significantly associated with the prevalence of being born overseas, low English proficiency or new settler arrivals. Nevertheless, this should be monitored over time since the prevalence of overweight/obesity and type 2 diabetes in migrant and settler populations is proportional to the period of acculturation. Additionally, there may be differences in metabolic characteristics between individuals based on ethnicity 46,47.
Overall, lower prevalence of overweight and obesity is associated with, leisure-time PA, however not with sport participation, except for those age 4-14 years. Sport is one component of leisure-time PA and that alone is not enough to significantly affect overweight and obesity rates. Recent research suggests that sport is an important component to health, however sport alone is not enough, and that other forms of PA levels are important components for fitness and obesity levels 48. However, participation in sport for 4-14 year olds was significantly associated with lower overweight and obesity. Sport is especially popular amongst children, and therefore for the young it may play a larger role in total PA levels.
Diabetes
Prevalence of type 2 diabetes was positively correlated with one of the immigration measures (low English proficiency) and strongly negatively correlated with all four educational and social wellbeing indicators. It was also negatively correlated with all measures of recreational PA, all sports facilitation measures and all sports participation measures, most strongly with participation in the youngest age groups. Given that the onset of type 2 diabetes is generally later in life, these latter correlations are clearly ecological in nature.
Child developmental vulnerability
The measure of children’s overall developmental vulnerability showed a similar pattern of correlation with demographic, recreational PA and sport indicators to those of type 2 diabetes. However, unlike the prevalence of type 2 diabetes, children’s overall developmental vulnerability was also strongly positively correlated with all three immigration measures.
Physical Activity, Sport and Health in the City of Brimbank
48
When children’s vulnerability in the five domains of development were examined separately, the patterns of correlation were broadly similar, with two notable exceptions. The strength of correlation with sport participation measures was generally lower for the emotional maturity domain and generally higher for the communication and general knowledge domain. Having said that, participation in sport was significantly negatively associated with all measures of childhood vulnerability, and most notably for those aged 4-14 years.
Finally, it is notable that children’s development vulnerability was not correlated with ‘time spent sitting’ (the anomalous indicator discussed in connection with Table 45). This is to be expected given that time spent sitting was an indicator for those age 18 years and above.
Psychological distress
The psychological distress indicator showed similar patterns of correlation with demographic, recreational PA and sport indicators to those of type 2 diabetes.
Correlates of health indicators: summary
Considering table 46 as a whole, there was a consistent set of strong correlates of all but two of the nine health measures. On the positive side (in the sense of positive correlation, i.e. negative health outcomes), the strong correlates were proportion of people born overseas and low English proficiency, and to a lesser degree, proportion of new settler arrivals. On the negative side (in the sense of negative correlation, i.e. positive health outcomes), the strong correlates were the four demographic indicators, the proportion meeting the PA guidelines, all of the leisure-time PA indicators sport participation overall and particularly for the two youngest age groups, and availability of sport coaches.
The two exceptions among the health measures were overweight and obesity and children’s development vulnerability in the emotional maturity domain, which were substantially correlated to only a smaller subset of these indicators.
It seems that any participation in PA, whether it be general leisure-time PA or more specifically sport participation, is associated with better health outcomes across the different domains, and specifically for diabetes, children’s development vulnerability and psychological distress.
The notion that participation in PA and sport for children provides great psychological and social benefits is consistent with the literature 10. However, the fact that the ecological relationships between these health outcomes in the community as a whole and sport participation are stronger for participation by children and adolescents rather than by adults requires further study at the level of individuals to investigate paths of causation and the modifying effects of other variables such as education of parents.
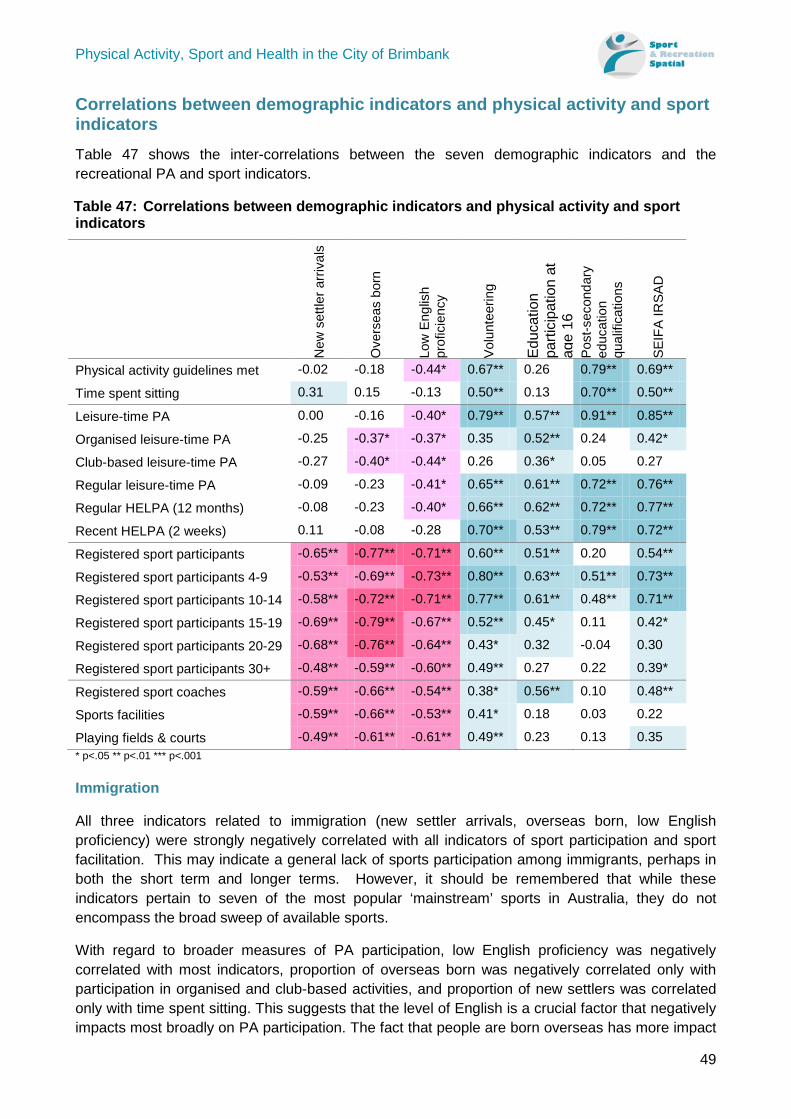
Physical Activity, Sport and Health in the City of Brimbank
49
Correlations between demographic indicators and physical activity and sport indicators Table 47 shows the inter-correlations between the seven demographic indicators and the recreational PA and sport indicators.
Table 47: Correlations between demographic indicators and physical activity and sport indicators
N
ew s
ettle
r arr
ival
s
Ove
rsea
s bo
rn
Low
Eng
lish
prof
icie
ncy
Volu
ntee
ring
Educ
atio
n pa
rtici
patio
n at
ag
e 16
Po
st-s
econ
dary
ed
ucat
ion
qual
ifica
tions
SEIF
A IR
SAD
Physical activity guidelines met -0.02 -0.18 -0.44* 0.67** 0.26 0.79** 0.69**
Time spent sitting 0.31 0.15 -0.13 0.50** 0.13 0.70** 0.50**
Leisure-time PA 0.00 -0.16 -0.40* 0.79** 0.57** 0.91** 0.85**
Organised leisure-time PA -0.25 -0.37* -0.37* 0.35 0.52** 0.24 0.42*
Club-based leisure-time PA -0.27 -0.40* -0.44* 0.26 0.36* 0.05 0.27
Regular leisure-time PA -0.09 -0.23 -0.41* 0.65** 0.61** 0.72** 0.76**
Regular HELPA (12 months) -0.08 -0.23 -0.40* 0.66** 0.62** 0.72** 0.77**
Recent HELPA (2 weeks) 0.11 -0.08 -0.28 0.70** 0.53** 0.79** 0.72**
Registered sport participants -0.65** -0.77** -0.71** 0.60** 0.51** 0.20 0.54**
Registered sport participants 4-9 -0.53** -0.69** -0.73** 0.80** 0.63** 0.51** 0.73**
Registered sport participants 10-14 -0.58** -0.72** -0.71** 0.77** 0.61** 0.48** 0.71**
Registered sport participants 15-19 -0.69** -0.79** -0.67** 0.52** 0.45* 0.11 0.42*
Registered sport participants 20-29 -0.68** -0.76** -0.64** 0.43* 0.32 -0.04 0.30
Registered sport participants 30+ -0.48** -0.59** -0.60** 0.49** 0.27 0.22 0.39*
Registered sport coaches -0.59** -0.66** -0.54** 0.38* 0.56** 0.10 0.48**
Sports facilities -0.59** -0.66** -0.53** 0.41* 0.18 0.03 0.22
Playing fields & courts -0.49** -0.61** -0.61** 0.49** 0.23 0.13 0.35 * p<.05 ** p<.01 *** p<.001
Immigration
All three indicators related to immigration (new settler arrivals, overseas born, low English proficiency) were strongly negatively correlated with all indicators of sport participation and sport facilitation. This may indicate a general lack of sports participation among immigrants, perhaps in both the short term and longer terms. However, it should be remembered that while these indicators pertain to seven of the most popular ‘mainstream’ sports in Australia, they do not encompass the broad sweep of available sports.
With regard to broader measures of PA participation, low English proficiency was negatively correlated with most indicators, proportion of overseas born was negatively correlated only with participation in organised and club-based activities, and proportion of new settlers was correlated only with time spent sitting. This suggests that the level of English is a crucial factor that negatively impacts most broadly on PA participation. The fact that people are born overseas has more impact
Physical Activity, Sport and Health in the City of Brimbank
50
per se on organised and club-based activities, and particularly on participation in popular mainstream sports. This probably involves other immigration-related factors such as unfamiliarity or cultural or religious beliefs and practices.
Other demographic characteristics
Of the four educational and social indicators, volunteering was positively correlated with almost all recreational PA and sport participation and facilitation measures. SEIFA IRSAD was positively correlated with most recreational PA and sport participation measures, but not with provision of sport facilities. Whilst volunteering was positively associated with a range of PA and sport participation measures, it is not limited to PA. Volunteering is a way to engage people in the local community and improve social capital, and has the potential to improve wellbeing 34.
The proportion of 16 year-olds in full-time education was strongly correlated to most measures of leisure time PA and sport participation. Two notable exceptions were the proportion of the broad population meeting PA guidelines, which is also only moderately correlated with many of the other PA and sport measures (see Table 45), and time spent sitting, the anomalous nature of which has already been discussed with reference to Table 45. The proportion of 16 year-olds in full-time education was also strongly correlated to the availability of coaches, which reflects the fact that coaches are often involved in school-based programs.
Finally, the proportion of the population with post-secondary education qualifications was positively correlated with most recreational PA measures but only with sport participation for the two youngest age groups. It has been recently reported that adolescents with more highly educated parents are more likely to participate in sport 41. Our results indicate that a higher level of education is associated with increased leisure-time PA and at health-enhancing levels; however in terms of sport participation this applies only to children and adolescents. We know that people with higher SES are likely to have a higher level of education, and it is reported that people with a higher level of education have amongst other things, more social support and greater capacity to seek, understand and act on health messages that promote PA 49. In terms of sport participation, which often requires purchase of equipment, membership fees etc., it may be the higher SES associated with more highly-educated parents that provides the link with participation, but that for some a lack of resources causes them to place some limits on their sport participation 50.
Correlates of demographic indicators: summary
Considering Table 47 as a whole, the three immigration-related indicators were all strongly negatively correlated to all sport-related indicators. Low English proficiency, and to a lesser extent proportion overseas born, were also more weakly negatively correlated to some recreational PA indicators. The four educational and social indicators were all strongly positively correlated to all the recreational PA indicators (generally including time spent sitting, as discussed in relation to Table 45) except for organised and club-based activities, and to sport participation in the youngest age groups. Volunteering, and to a lesser extent education participation at age 16 and SEIFA IRSAD, were also correlated with a wider range of sport participation and sport facilitation indicators.
Physical Activity, Sport and Health in the City of Brimbank
51
Discussion Influences of participation in physical activity and sport
Participation in PA is influenced by a wide range of factors, which are often considered within the socio-ecological model in order to understand behaviour. The socio-ecological model considers the intrapersonal, interpersonal, organisational, environmental and policy factors that affect participation in physical activities 43, 51. In the following sections, we discuss the key determinants of participation in LTPA, and more specifically sport, that are commonly reported in the academic literature, with particular emphasis on those factors that are most relevant in the context of the City of Brimbank.
Intrapersonal influences on physical activity and sport participation
Intrapersonal influences relate to characteristics of the individual, such as demographics as well as knowledge, attitudes, behaviour and skill level 52. The City of Brimbank is characterised by a high proportion of migrants, low levels of education, and low SES. Key intrapersonal influences on PA and sport participation reported in the literature include the following:
Age and gender
There are some non-modifiable demographic determinants that clearly influence PA participation and these include age and gender 43. People are less likely to participate in PA as they age, and males are more likely to participate than females 43.
Socio-economic status
There is consistent evidence of a higher prevalence or higher levels of leisure-time or moderate-vigorous intensity PA in those with higher socio-economic status (SES) across the lifespan 42-45. A similar association exists with sport participation as well as for PA for migrant communities, where both neighbourhood SES and household SES are predictors of participation 41, 53.
A study on PA for men from low SES neighbourhoods specifically highlighted the need to understand the cumulative contextual life issues and therefore an individual’s capability and readiness to engage in PA 54. Another recent study investigated the correlates of PA and sport participation in culturally and linguistically diverse (CALD) migrants 53. Both were Australian studies, although pertaining to different contexts of low SES, the first relating to men, and the second relating to CALD communities, highlighting the issue of social connectedness. Both focused on the fact that the people being studied were isolated and that social inclusion through PA and sport would be of benefit 53, 54. Casey et al. discuss the need for a community development approach to this matter, whereby individuals are actively involved with the decisions that affect their lives and health 54.
Specifically relating to sport, it is also true that those that participate are likely to be from neighbourhoods and households of higher SES, and this association is particularly evident in metropolitan areas 41 55. Sport can have added costs associated with membership of sports clubs or joining a gym 56. Higher household income is a positive predictor of sport participation and lower income is associated with dropout of organised sport 57. The cost of transport, equipment and access to facilities is often a determinant of participation 55, 58, 59. Studies investigating broad levels
Physical Activity, Sport and Health in the City of Brimbank
52
of PA have reported that access to low-cost recreation facilities can significantly, positively influence PA levels 60.
Education
Another consistently reported determinant of participation in PA is education, with those with higher education more likely to participate in PA 42, 43, and sport 41. Education is often highly associated with SES 41.
Migrants
The City of Brimbank community has a large proportion of migrants. A recent systematic review examined the correlates of PA and sport participation in migrants 53. Acculturation was a key correlate. It was clear that acculturation variables influence most of the other correlates making participation in PA and sport of a CALD community unique to the specific culture of the community and their new location. To understand the issue holistically, it is important to consider the specific circumstances that make these groups unique. For example, time spent in the current country, experience of PA and sport in the home country, reasons for migrating, experience during migration and resettlement process, the possibility of traumatic background, health and wellbeing, the concept of PA and sport, cultural or religious factors impacting on participation, cultural value or meaning of PA and sport, and attitudes and motivations towards participation, are all contributing factors to participation. Knowledge of opportunities, facilities and language difficulties are also reported for migrant communities. These factors do not occur in isolation and the complex interactions that occur between correlates for this population need to be considered 53.
Specifically relating to sport participation, it has been reported that female adolescents are most likely to participate when they are from monolingual Australian-born (i.e. English-speaking) families 41.
Other
Other consistent determinants of PA and sport include self-efficacy, competency and perceived behavioural control and perceptions regarding availability of time 43, 61, 56, 62, 63, 61. However data are not currently available for the City of Brimbank for these determinants and therefore these factors are not elaborated on further.
Previous activity
Previous activity is a strong predictor of current and future activity 43, and there is evidence that sport participation as a child/adolescent is a strong predictor of being physically active as an adult 64. However data are not currently available for the City of Brimbank for this determinant and therefore this factor is not elaborated on further.
Life stages
There are various life stages or life changes that are known to negatively affect participation in PA and sport. These include change in employment status; change in residency; change in physical status; change in relationships and change in family structure 65, 56. Further, for children often a change in interest, including an interest in participating in a different PA, contribute to dropping out of a particular sport or PA 66. During adolescence a priority to succeed educationally contributes to a shift from organised sport participation to individual based activities 6, 51.
Physical Activity, Sport and Health in the City of Brimbank
53
Motivation
Motivation to participate in PA and sport in migrant communities often differ between cultural groups 53. In some cultural groups PA and sport participation are not valued favourably 53. Furthermore people are often bound by cultural gender views and religious considerations 53. Nevertheless, there are common motivators including promoting physical health, managing chronic disease and socialising 53.
Interpersonal influences on physical activity and sport participation
Interpersonal influences relate to social networks and social support systems including family, work and friendships 52. Key interpersonal influences on PA and sport participation include the following:
Social support
Social support is very important for participation in PA and sport, and includes support from family, friends and at work 43. Cultural norms and practices are also key determinants 43. In the context of children and adolescents, social support is mainly in the form of parental and peer support 63. This includes role modelling, support through travel assistance, engagement and general encouragement 63. Parents play an important role for children and adolescents, both in a direct involvement and being role models as well as providing transport, encouragement and positive feedback 41, 67, 68. Friends and peers are also important factors especially for children and adolescents 68. A lack of peer recognition can hinder self-esteem, however playing with friends can boost enjoyment 68. Sport in its nature is a social PA which can improve health 10. Having friends, family members and peers in the community who engage in PA and who provide support through role modelling are also important factors to migrant communities 53. For some CALD migrants, the behaviour of others can also have a negative aspect, for example when people are subject to stereotyping and discrimination 53.
Organisational and environmental influences on physical activity and sport participation
Organisational and environmental influences relate to characteristics of organisations, community and the natural and built environment 52. Key organisational and environmental influences on PA and sport participation include the following:
Organisational factors
Although current data are not available specifically for the City of Brimbank, the following provides a summary of key influences relating to school, sport and workplace organisations.
Participation in PA in schools is sometimes hindered by: restricted timetabling; a lack of access to facilities and equipment 69; a lack of experience for teachers 70; a lack of positive feedback from teachers 68; a predisposition for traditional team sports 71 51; a lack of choice of activities 51, single sex classes 51, and uniforms 51.
Community sports clubs are a common type of community-based organisations for participation in LTPA 8. However, participation through sports clubs can be hindered by: people lacking the
Physical Activity, Sport and Health in the City of Brimbank
54
confidence to approach clubs; not knowing people at a club; not having friends at the club; cost 51; competitive nature; and travel 68. Linking schools and students within schools to community opportunities has been advocated 72 70.
Health promotion initiatives sometimes use the workplace as a setting 73. Workplace setting based health promotion is more likely to be successful when only one health behaviour is targeted 73. Furthermore, the more the program is tailored to individual needs, the more likely it is to be successful 74.
Built environment
The built environment plays an important role, through aspects including community design, neighbourhood walkability, public transport, parks and leisure facilities, proximity and access to facilities, aesthetics and pleasantness, walking and cycling facilities, building location and design, pedestrian safety and crossings 43, 75. A review of environmental characteristics relevant to young people’s use of sports facilities found consistent and positive associations between PA and the presence of sport facilities, open parks and play-recreational facilities 75. Safety, geographical isolation, walkability, neighbourhood characteristics, facilities, and transport are all environmental/organisational determinants of PA identified specifically for migrants to Australia 53. There is evidence that higher SES neighbourhoods have significantly more PA facilities than lower SES neighbourhoods, thus providing more opportunities to be physically active 76. Furthermore, low SES neighbourhoods have been found to have significantly fewer free-for-use facilities than high SES neighbourhoods 76.
Natural environment
In terms of the natural environment, vegetation, topography, weather, trails and walking routes are determinants of PA 43.
Physical Activity, Sport and Health in the City of Brimbank
55
Conclusion Within this report, key influences on participation in PA and sport are categorised within the socio-ecological model as being located in a specific domain. However, a more holistic, integrated approach needs to be considered. These key influences are not singular and do not operate in isolation. Therefore, participation in PA and sport is a very complex issue, and a full understanding of these interacting influences is required. For example, a recent study has investigated the socio-ecological predictors of participation and dropout in organised sports during childhood 57. Variables measured at age eight shown to positively predict participation in organised sports at age 10 included: sex (boy); fewer people in household; higher household income; main language spoken at home (English); higher parental education; child taken to a sporting event; and access to a specialist physical education teacher during primary school. Four variables that predicted dropout from organised sports by age 10 were: lower household income; main language spoken at home (non-English); lower parental education; and, child not taken to a sporting event 57.
Compared to people living in other Melbourne municipalities, there are a high proportion of migrants and low levels of education, socio-economic status, PA and sport participation, and sporting facilities in the City of Brimbank. Health outcomes are poorer. Whilst no specific data are available, other key influences relating to low levels of PA and sport participation may include a lack of knowledge of the benefits of PA and sport participation, a lack of knowledge of available programs/facilities etc, a lack of equipment, and a lack of social support.
Participation in PA and sport can assist in connecting people with their community. Communities are more than structured geo-spatial configurations and involve commitment and social cohesion 59. A sense of community arises out of the fundamental human need to create and maintain social bonds. Community sport can provide a sense of community identity, community belonging and social inclusion 59. Sport is widely recognised as a way of building positive social capital, including in disadvantaged communities with high population densities, low SES, high rates of chronic disease, and high levels of migration and multiculturalism 59.
There is a need to understand the community’s needs, including issues specific to large migrant communities with great cultural variation. An understanding of the specific needs across the genders and ages is also required. In doing so, one must be cognisant of the key determinants of health of this community. In communities with low SES and many migrants, an understanding is required of issues regarding employment/income, medical needs, housing and education, that are often a more immediate concern than is participation in PA and sport 53, 54.
Community capacity building approach
Community capacity building approaches have been used within disadvantaged communities in relation to PA in general as well as specifically for sport participation. A community capacity building approach requires an integrated and coordinated partnership and policy approach that recognises the role of different sectors and levels of government and community organisations 59, 77 78,79. Specifically relating to PA, initiatives have increased effectiveness when health agencies form partnerships with other organisations: schools; businesses; policy; advocacy; nutrition; recreation; planning, and transport agencies; and health-care organisations.
Building capacity of the community needs to be a core objective and includes increasing awareness of the project messages and evaluation 78. Broad capacity building actions include governance, partnerships, coordination, training and resource allocation 78. More specifically, relating to participation in local sport and recreation for low income populations, key dimensions of
Physical Activity, Sport and Health in the City of Brimbank
56
community development include: a shared concern about the social problem requiring action, encouraging active participation of hard-to reach groups, forming public sector partnerships to pool resources and build political support, and adopting collaborative principles 79. The successful delivery of programs is more likely when a social development approach is taken. However it is recognised that community development, involving the population in decision making is a challenge 79. Sport is sometimes used as an engagement tool, with social development the primary focus 59. It is through this engagement that social capital is developed through building respect and trust 59. It must be clearly understood that a sports clubs’ mandate is not traditionally to identify and engage directly with hard-to-reach groups. Clubs are predominantly run by volunteers and focused on delivering sport rather than other health promotion responsibilities 59, 80. There is a need to identify and work with organisations that are ready and have the capacity to engage in community development approaches 80.
A community capacity building approach may include sport-for-development approaches, previously known as ‘development through sport’ approaches 81. These often utilise PA and sport as a vehicle for other campaigns/projects to improve health and education, which is contemporary to the settings-based health promotion approach. For example the Football for Hope project of FIFA (Fédération Internationale de Football Association) partners with organisations and promotes participation in sport to enhance education, social integration and empowerment of young people 81. Other programs use participation in PA and sport to engage, educate and change people on a range of issues including: violence, education, self-confidence, communication skills, literacy, diversion of drugs and crime, health testing, employment, life-skills, community cohesion, gender equality, ethnic conflicts, and developing future leaders.
Facilitating participation in physical activity and sport The characteristics of the Brimbank community are such that participation rates in PA and sport are relatively low, both with regard to the specific traditional sporting activities examined in this report and also for sport and PA in general. Further, the community is not well provided with facilities for sport and physical activity participation.
The City of Brimbank has established a number of initiatives to address this issue. In order to support and expand these initiatives, a comprehensive strategy to promote increased participation in PA and sport might include one or more of the following:
1. Community information and engagement strategies:
• A community capacity development approach- Partnering key organisations and people, and empowering people within the community to be a part of the decision making process in developing opportunities for PA and sport.
• A community education and awareness campaign- (e.g. social media) promoting PA guidelines and associated health benefits.
2. Enhancement strategies for facilities use:
• Availability of facilities- An audit of sport and public recreational facilities and spaces, for both traditional structured sport and unstructured leisure-time PA.
• Use of facilities- A detailed investigation of the use of current sport facilities and public recreation spaces.
• Sport and recreation facility growth plan- Analysis and formulation of a plan for development of sport and recreation facilities taking into account future population growth
Physical Activity, Sport and Health in the City of Brimbank
57
3. Participation support strategies:
• Cost of participation- An analysis of the cost of participation in a range of physical activities and sports including necessary equipment, membership etc.
• Cost amelioration strategies- E.g. sports equipment and uniform library/loan system, sport club participation voucher system.
• Participation, health and education- A survey of participation of children and adults in sport and other leisure-time PA, together with health and education measures. This would provide individual-level evidence to complement the community-level ecological evidence presented in this report.
• Individual competency- Skill development components/strategies/programs for individual competency.
4. School-community strategies:
• Collaborative review of school policies and practices around PA- Review curriculum policies, practices and school facility availability for the 40 primary and secondary schools within Brimbank, including.
• School-community linkages- Programs linking school pupils and those who have recently left school into sport and recreational opportunities.
Options for physical activity, health and education development in Brimbank Based on the findings of this report, and taking into consideration existing infrastructure and initiatives already established in the City of Brimbank, the following four options are supported for further development:
1) Survey of leisure-time physical activity A study of participation in leisure-time physical activity including both structured sport and unstructured activities. This would provide individual-level evidence to complement the community-level ecological evidence presented in this report, and would include demographic characteristics and determinants of PA including cultural characteristics. This would provide details of the scope of participation in leisure-time activities for the Brimbank community and provide evidence to inform future program and policy developments.
2) Survey of school policy and practice Collection and analysis of data from the 40 primary and secondary schools within Brimbank. Audit to include data relating to: school characteristics, school enrolment demographics, school physical education (PE) policy, school PE practice, characteristics of PE deliverers, school sport and recreation facilities. This will provide detailed information on the current PE policy and practices within Brimbank schools.
3) Evaluation of existing voucher program Conduct evaluation of the In2Sport Brimbank. In2Sport Brimbank is a sports club membership subsidy program which aims to meet the specific needs of the disadvantaged Brimbank community. The program provides an opportunity for children living in Brimbank to actively participate in community sport and recreation regardless of their financial situation, through financial assistance to contribute to club membership fees. The evaluation would include process, impact and outcome evaluation, and would involve a range of stakeholders including community partners and organisations as well as the individual recipients.
Physical Activity, Sport and Health in the City of Brimbank
58
4) Analysis of participation data collected by the City of Brimbank Analyses of the number of club participants by sporting type, including breakdowns of gender, junior/senior, social and volunteers. Participation rates referenced to the Brimbank population and relevant subpopulations will be calculated. This will give an indication of participation in organised sport across all sports with clubs in Brimbank.
Physical Activity, Sport and Health in the City of Brimbank
59
References 1. World Health Organization, Preamble to the Constitution of the World Health Organization as
adopted by the International Health Conference, New York, 19-22 June, 1946; signed on 22 July 1946 by the representatives of 61 States Official Records of the World Health Organization, no. 2, p. 100) and entered into force on 7 April 1948., 1948. p. 100.
2. Janssen, I.,A.G. LeBlanc. Systematic review of the health benefits of physical activity and fitness in school-aged children and youth. International Journal of Behavioral Nutrition and Physical Activity 2010; 7(1):40.
3. Warburton, D., C. Nicol,S. Bedin. Health benefits of physical activity: The evidence. Canadian Medical Association Journal 2006; 174(6):801-809.
4. Khan, K., A. Thompson, S. Blair, et al. Sport and exercise as contributors to the health of nations. The Lancet 2012; 380:59-64.
5. Hallal, P., L. Andersen, F. Bull, et al. Global physical activity levels: surveillance progress, pitfalls, and prospects. The Lancet 2012; 380:247-257.
6. Eime, R., J. Harvey, N. Sawyer, et al. Understanding the contexts of adolescent female participation in sport and physical activity. Research Quarterly for Exercise and Sport 2013; 84(2):157-166.
7. Eime, R., N. Sawyer, J. Harvey, et al. Integrating Public Health and Sport Management: Sport participation trends 2001-2010. Sport Management Review 2014; In press.
8. Eime, R., W. Payne,J. Harvey. Trends in organised sport membership: Impact on sustainability. Journal of Science and Medicine in Sport 2009; 12(1):123-129.
9. Eime, R.M., J.A. Young, J.T. Harvey, et al. A systematic review of the psychological and social benefits of participation in sport for children and adolescents: informing development of a conceptual model of health through sport. International Journal of Behavioral Nutrition & Physical Activity, 2013; 10(1):98.
10. Eime, R., J. Young, J. Harvey, et al. A systematic review of the psychological and social benefits of participation in sport for adults: informing development of a conceptual model of health through sport. International Journal of Behavioral Nutrition and Physical Activity 2013; 10(1):135.
11. Eime, R., J. Harvey, W. Payne, et al. Club sport: Contributing to health-related quality of life? Journal of Science and Medicine in Sport 2009; 12(6 Supplement):81.
12. Vella, S.A., D.P. Cliff, C.A. Magee, et al. Sports Participation and Parent-Reported Health-Related Quality of Life in Children: Longitudinal Associations. The Journal of Pediatrics 2014; 164(6):1469-1474.
13. Jewett, R., C. Sabiston, J. Brunet, et al. School sport participation during adolescence and mental health in early adulthood. Journal of Adolescent Health 2014; published online.
14. Eime, R., J. Harvey,W. Payne. Dose-response of women's Health-Related Quality of Life (HRQoL) and life satisfaction to physical activity. Journal of Physical Activity and Health 2014; 11:330-338.
15. Sibley, B.,J. Etnier. The relationship between physical activity and cognitive function in children: A meta-analysis. Pediatric Exercise Science 2003; 15(3):243-256.
16. Trudeau, F.,R. Shephard. Physical education, school physical activity, school sports and academic performance. International Journal of Behavioral Nutrition and Physical Activity 2008; 5(10).
17. Wittberg, R.A., K.L. Northrup,L.A. Cottrell. Children’s Aerobic Fitness and Academic Achievement: A Longitudinal Examination of Students During Their Fifth and Seventh Grade Years. American Journal of Public Health 2012; 102(12):2303-2307.
18. Bass, R.W., D.D. Brown, K.R. Laurson, et al. Physical fitness and academic performance in middle school students. Acta Paediatrica 2013; 102(8):832-837.
19. Telford, R.D., R.B. Cunningham, R.M. Telford, et al. Schools With Fitter Children Achieve Better Literacy and Numeracy Results: Evidence of a School Cultural Effect. Pediatric Exercise Science 2012; 24(1):45-57.
20. Singh, A., L. Uijtdewilligen, J.W.R. Twisk, et al. Physical activity and performance at school: A systematic review of the literature including a methodological quality assessment. Archives of Pediatrics and Adolescent Medicine 2012; 166(1):49-55.
Physical Activity, Sport and Health in the City of Brimbank
60
21. Rasberry, C.N., S.M. Lee, L. Robin, et al. The association between school-based physical activity, including physical education, and academic performance: A systematic review of the literature. Preventive Medicine 2011; 52, Supplement(0):S10-S20.
22. Taras, H. Physical Activity and Student Performance at School. Journal of School Health 2005; 75(6):214-218.
23. Bailey, R., K. Armour, D. Kirk, et al. The educational benefits claimed for physical education and school sport: An academic review. Research Papers in Education 2009; 24(1):1-27.
24. Booth, J.N., S.D. Leary, C. Joinson, et al. Associations between objectively measured physical activity and academic attainment in adolescents from a UK cohort. British Journal of Sports Medicine 2014; 48(3):265-270.
25. Australian Bureau of Statistics, Australian Health Survey: First results, 2011-2012, 2012, Australian Bureau of Statistics: Canberra.
26. Australian Diabetes Council. Type 2 Diabetes. 2014 [cited 2014 24th March]; Available from: http://www.australiandiabetescouncil.com/living-with-diabetes/type-2?gclid=CJ2ggqOJqr0CFYHxpAod214Amw.
27. (DEECD), D.o.E.a.E.C.D. Victorian results for the Australian Early Development Index (AEDI) 2009. 2010.
28. Millbank, A., J. Phillips,C. Bohm. Australia's Settlement Services for Refugees and Migrants. 2006 [cited 2014 Aprill 15th]; Available from: http://www.aph.gov.au/About_Parliament/Parliamentary_Departments/Parliamentary_Library/Publications_Archive/archive/settlement
29. Anikeeva, O., P. Bi, J.E. Hiller, et al. Trends in migrant mortality rates in Australia 1981–2007: a focus on the National Health Priority Areas other than cancer. Ethnicity & Health 2014:1-20.
30. Tiong, A., M. Patel, J. Gardiner, et al. Health issues in newly arrived African refugees attending general practice clinics in Melbourne. Medical Journal Australia 2006; 185:602-606.
31. Kirmayer, L.J., L. Narasiah, M. Munoz, et al. Common mental health problems in immigrants and refugees: general approach in primary care. Canadian Medical Association Journal 2011; 183(12):E959-E967.
32. Andrulis, D.P.,C. Brach. Integrating Literacy, Culture, and Language to Improve Health Care Quality for Diverse Populations. American Journal of Health Behavior 2007; 31(1):S122-S133.
33. Australian Bureau of Statistics, Voluntary Work, in Cat. No. 4441.02011, Australian Bureau of Statistics: Canberra.
34. Jenkinson, C., A. Dickens, K. Jones, et al. Is volunteering a public health intervention? A systematic review and meta-analysis of the health and survival of volunteers. BMC Public Health 2013; 13(733).
35. Marmot, M., J. Allen, R. Bell, et al. WHO European review of social determinants of health and the health divide. The Lancet 2012; 380(9846):1011-1029.
36. Australian Bureau of Statistics, Socio-economic Indexes for Areas (SEIFA), in Cat. no. 2033.0.55.0012013, ABS: Canberra.
37. Dunstan, D.W., B. Howard, G.N. Healy, et al. Too much sitting – A health hazard. Diabetes Research and Clinical Practice 2012; 97(3):368-376.
38. World Health Organisation. Global recommendations on physical activity and health. 2010 [cited 2014 20th April]; Available from: http://whqlibdoc.who.int/publications/2010/9789241599979_eng.pdf.
39. Department of Health. Australia's Physical Activity and Sedentary Behaviour Guidelines. 2014 10th February, 2014]; Available from: http://www.health.gov.au/internet/main/publishing.nsf/content/health-pubhlth-strateg-phys-act-guidelines.
40. Ainsworth, B., W. Haskell, S. Hermann, et al. Compendium of physical activities: a second update of codes and MET values. Medicine and Science in Sports and Exercise 2011; 43(8):1757-1581.
41. Eime, R., J. Harvey, M. Craike, et al. Family support and ease of access link socio-economic status and sports club membership in adolescent girls: A mediation study. International Journal of Behavioral Nutrition and Physical Activity 2013; 10(50).
Physical Activity, Sport and Health in the City of Brimbank
61
42. Gidlow, C., L.H. Johnston, D. Crone, et al. A systematic review of the relationship between socio-economic position and physical activity. Health Education Journal 2006; 65(4):338-367.
43. Bauman, A.E., R.S. Reis, J.F. Sallis, et al. Correlates of physical activity: why are some people physically active and others not? The Lancet 2012; 380(9838):258-271.
44. Stalsberg, R.,A. Pedersen. Effects of socioeconomic status on the physical activity in adolescents: a systematic review of the evidence. Scandinavian Journal of Medicine & Science in Sports 2010; 20:368-383.
45. Pan, S.Y., C. Cameron, M. Desmeules, et al. Individual, social, environmental, and physical environmental correlates with physical activity among Canadians: a cross-sectional study. BMC Public Health 2009; 9:21-21.
46. Delavari, M., A. Sonderlund, B. Swinburn, et al. Acculturation and obesity among migrant populations in high income countries - a systematic review. BMC Public Health 2013; 13(1):458.
47. Flegal, K.M., M.D. Carroll, C.L. Ogden, et al. PRevalence and trends in obesity among us adults, 1999-2008. JAMA 2010; 303(3):235-241.
48. Active Health Kids Australia, The 2014 Active Healthy Kids Australia Report Card on Physical Activity for Children and Young People 2014, Active Healthy Kids Australia: Adelaide, South Australia.
49. Cerin, E.,E. Leslie. How socio-economic status contributes to participation in leisure-time physical activity. Social Science & Medicine 2008; 66(12):2596-2609.
50. Lim, S.Y., S. Warner, M. Dixon, et al. Sport Participation Across National Contexts: A Multilevel Investigation of Individual and Systemic Influences on Adult Sport Participation. European Sport Management Quarterly 2011; 11(3):197-224.
51. Eime, R., W. Payne, M. Casey, et al. Transition in participation in sport and unstructured physical activity for rural living adolescent girls. Health Education Research 2010; 25(2):282-293.
52. McLeroy, K., D. Bibeau, A. Steckler, et al. An ecological perspective on health promotion programs. Health Education Quarterly 1988; 15(4):351-377.
53. O'Driscoll, T., L. Banting, E. Borkoles, et al. A systematic review of sport and physical activity participation in culturally and linguistically diverse (CALD) migrant populations. Journal of Immigrant Minority Health 2014; 16:515-530.
54. Casey, M., R. Eime, K. Ball, et al. Characteristics of physically active and inactive men from low socioeconomic communities and housing estates: a qualitative study using the socioecological model. Annals of Leisure Research 2011; 14(1):1-21.
55. Federico, B., L. Falese, D. Marandola, et al. Socioeconomic differences in sport and physical activity among Italian adults. Journal of Sports Sciences 2012; 31(4):451-458.
56. Foster, C., M. Hillsdon, N. Cavill, et al., Understanding participation in sport:A systematic review, 2005, Sport England.
57. Vella, S., D. Cliff,A. Okely. Socio-ecological predictors of participation and dropout in organised sports during childhood. International Journal of Behavioral Nutrition and Physical Activity 2014; 11(1):62.
58. Dollman, J.,N.R. Lewis. The impact of socioeconomic position on sport participation among South Australian youth. Journal of Science and Medicine in Sport 2010; 13(3):318-322.
59. Skinner, J., D.H. Zakus,J. Cowell. Development through Sport: Building Social Capital in Disadvantaged Communities. Sport Management Review 2008; 11(3):253-275.
60. Sallis, J.F., H.R. Bowles, A. Bauman, et al. Neighborhood Environments and Physical Activity Among Adults in 11 Countries. American Journal of Preventive Medicine 2009; 36(6):484-490.
61. Craike, M., R. Polman, R. Eime, et al. Associations between behavior regulation, competence, physical activity, and health for adolescent females. Journal of Physical Activity and Health 2014; 11:410-418.
62. Craggs, C., K. Corder, E.M.F. van Sluijs, et al. Determinants of Change in Physical Activity in Children and Adolescents: A Systematic Review. American Journal of Preventive Medicine 2011; 40(6):645-658.
63. Park, H.,N. Kim. Predicting Factors of Physical Activity in Adolescents: A Systematic Review. Asian Nursing Research 2008; 2(2):113-128.
Physical Activity, Sport and Health in the City of Brimbank
62
64. Tammelin, T., S. Nayha, A. Hills, et al. Adolescent participation in sports and adult physical activity. American Journal of Preventive Medicine 2003; 24(1):22-28.
65. Allender, S., L. Hutchinson,C. Forster. Life-change events and participation in physical activity: a systematic review. Health Promotion International 2008; 32(2):160-172.
66. Siesmaa, E., J. Blitvich,C. Finch, eds. A systematic review of the factors which are most influential in children's decisions to drop out of organised sport. ed. A. Farelli2011, Nova Science Publishers Incorporated.
67. Edwardson, C.,T. Gorely. Parental influence on different types and intensities of physical activity in youth: A systematic review. Psychology of Sport and Exercise 2010; 11:522-535.
68. Casey, M., R. Eime, W. Payne, et al. Using a socioecological approach to examine participation in sport and physical activity among rural adolescent girls. Qualitative Health Research 2009; 19(7):881-893.
69. Jenkinson, K.,A. Benson. Barriers to providing physical education and physical activity in Victorian state secondary schools. Australian Journal of Teacher Education 2010; 35:1-17.
70. Casey, M., A. Telford, J. Harvey, et al. Linking secondary school physical education with community sport and recreation: A process evaluation of a program for girls using RE-AIM. BMC Public Health 2014; Under review.
71. Marshall, J.,K. Hardman. The state and status of physical education in schools in international context. European Physical Education Review 2000; 6:203-229.
72. Eime, R.,W. Payne. Linking participants in school-based sport programs to community clubs. Journal of Science and Medicine in Sport 2009; 12(2):293-299.
73. Hutchinson, A.,C. Wilson. Improving nutrition and physical activity in the workplace: a meta-analysis of intervention studies. Health Promotion International 2011; 27(2):238-249.
74. Marshall, A. Challenges and opportunities for promoting physical activity in the workplace. Journal of Science and Medicine in Sport 2004; 7(1 supplement):60-66.
75. Limstrand, T. Environmental characteristics relevant to young people's use of sports facilities: a review. Scandinavian Journal of Medicine & Science in Sports 2008; 18:275-287.
76. Estabrooks, P., R. Lee,N. Gyurcsik. Resources for physical activity participation: Does availability and accessibility differ by neighborhood socioeconomic status? Annals of Behavioral Medicine: A Publication of the Society of Behavioral Medicine 2003; 25(2):100-104.
77. Marlier, M., G. Cardon, I. De Bourdeaudhuij, et al. A capacity building approach to increase sports particpiation in disadvantaged urban communities: a multilevel analysis. Journal of urban health: bulletin of the New York Academy of Medicine 2014; published online.
78. Sanigorski, A., A. Bell, P. Kremer, et al. Reducing unhealthy weight gain in children through community capacity-building: results of a quasi-experimental intervention program, Be Active Eat Well. International Journal of Obesity 2008; 32:1060-1067.
79. Frisby, W.,S. Millar. The actualities of doing community development to promote the inclusion of low income populations in local sport and recreation. European Sport Management Quarterly 2002; 2(3):209-233.
80. Casey, M., W. Payne,R. Eime. Organisational readiness and capacity building strategies of sporting organisations to promote health. Sport Management Review 2012; 15:109-124.
81. Levermore, R. Evaluating sport-for-development: approaches and critical issues. Progress in development studies 2011; 11(4):339-353.
Physical Activity, Sport and Health in the City of Brimbank
63
Appendices

Physical Activity, Sport and Health in the City of Brimbank
64
(This page intentionally left blank)
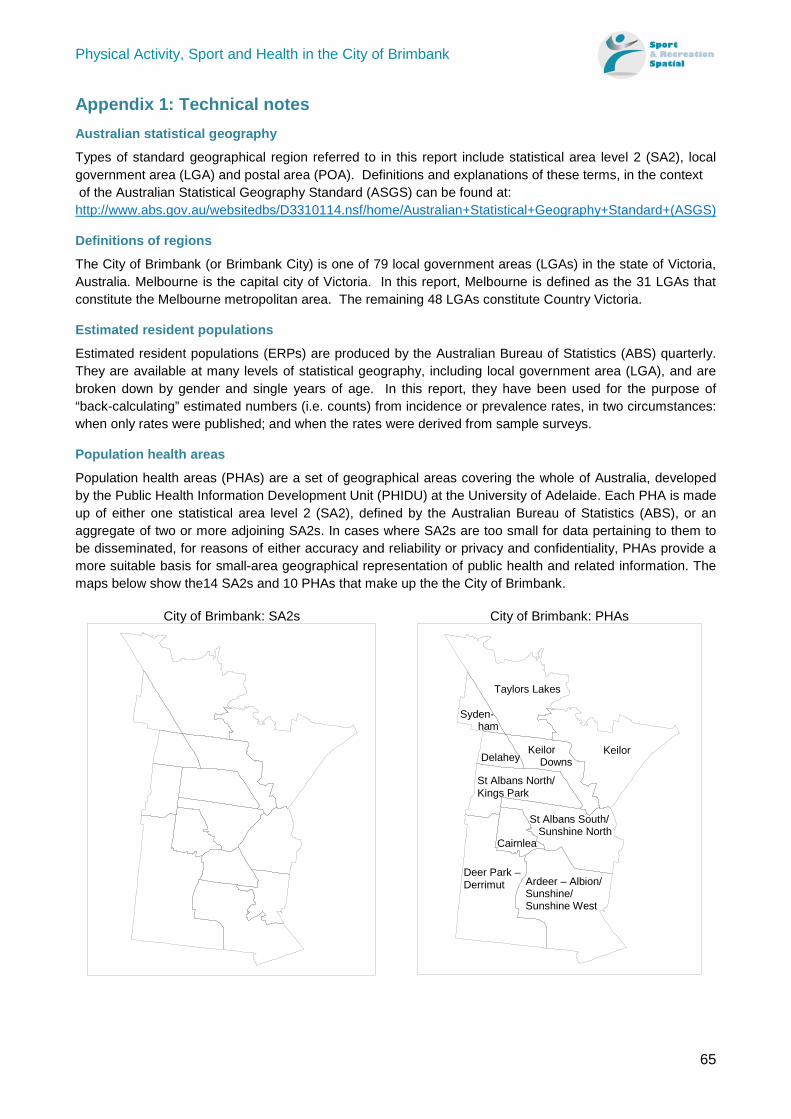
Physical Activity, Sport and Health in the City of Brimbank
65
Appendix 1: Technical notes Australian statistical geography
Types of standard geographical region referred to in this report include statistical area level 2 (SA2), local government area (LGA) and postal area (POA). Definitions and explanations of these terms, in the context of the Australian Statistical Geography Standard (ASGS) can be found at: http://www.abs.gov.au/websitedbs/D3310114.nsf/home/Australian+Statistical+Geography+Standard+(ASGS)
Definitions of regions
The City of Brimbank (or Brimbank City) is one of 79 local government areas (LGAs) in the state of Victoria, Australia. Melbourne is the capital city of Victoria. In this report, Melbourne is defined as the 31 LGAs that constitute the Melbourne metropolitan area. The remaining 48 LGAs constitute Country Victoria.
Estimated resident populations
Estimated resident populations (ERPs) are produced by the Australian Bureau of Statistics (ABS) quarterly. They are available at many levels of statistical geography, including local government area (LGA), and are broken down by gender and single years of age. In this report, they have been used for the purpose of “back-calculating” estimated numbers (i.e. counts) from incidence or prevalence rates, in two circumstances: when only rates were published; and when the rates were derived from sample surveys.
Population health areas
Population health areas (PHAs) are a set of geographical areas covering the whole of Australia, developed by the Public Health Information Development Unit (PHIDU) at the University of Adelaide. Each PHA is made up of either one statistical area level 2 (SA2), defined by the Australian Bureau of Statistics (ABS), or an aggregate of two or more adjoining SA2s. In cases where SA2s are too small for data pertaining to them to be disseminated, for reasons of either accuracy and reliability or privacy and confidentiality, PHAs provide a more suitable basis for small-area geographical representation of public health and related information. The maps below show the14 SA2s and 10 PHAs that make up the the City of Brimbank.
City of Brimbank: SA2s
City of Brimbank: PHAs
Taylors Lakes
Syden- ham
Keilor Delahey
Keilor Downs St Albans North/
Kings Park
St Albans South/ Sunshine North
Cairnlea
Deer Park – Derrimut Ardeer – Albion/
Sunshine/ Sunshine West
Physical Activity, Sport and Health in the City of Brimbank
66
Sources of statistical uncertainty
Sampling uncertainty (often referred to as sampling error) arises whenever data from a sample survey (e.g. the percentage of the sample from a particular local government area (LGA) who participate in regular physical activity (PA)) are used as the basis for estimating the same quantity for the whole population of the LGA. The main source of sample data in this report is the Exercise Recreation and Sport Survey (ERASS). The relative size of the sampling error in the population estimate for a geographical region is inversely related to the sample size in that region (i.e. larger samples result in relatively smaller errors, smaller samples result in relatively smaller errors). The ERASS sample size in each region is roughly proportional to the population of the region, and so ERASS sampling errors are greater for smaller regions than for larger regions. To illustrate, the average annual ERASS sample size in an LGA is approximately 50. Suppose that, in an LGA where the sample size is 50, 10 people participate in PA. The sample participation rate is 20%, and for a sample size of 50 it can be calculated that the sampling error margin is approximately ±11 percentage points i.e. the participation rate in the population of that LGA is very likely to lie somewhere between 9% and 31% of the population. For larger areas (Western Melbourne, Melbourne, Country Victoria and Victoria) the sampling error margins are much narrower.
Non-sampling errors are those sources of inaccuracy or uncertainty caused by factors other than sampling. In this report, the main source of non-sampling error is caused by areal interpolation. This applies to the estimates of participation rates based on participant and coach registration data from state sporting associations (SSAs). These de-identified data are not from samples, they are complete enumerations, and so there are no sampling errors. However, they are geographically encoded by residential postcode. In obtaining estimates for other geographical regions such as LGAs, two sources of uncertainty come into play. First, the boundaries of residential postcode areas can be complex, and are not explicitly defined by Australia Post, but ABS has produced a well-defined set of approximately corresponding postal areas (POAs). Second, the data are redistributed from POAs to other regions such as LGAs according to the overlapping proportions of the two sets of regions. This implicitly assumes that the people with a particular characteristic are evenly distributed throughout the postcode area. This is never exactly true, and so the resulting estimates are inaccurate. However, they are not biased, since the positive and negative discrepancies balance out, and the totals match. These errors cannot be quantified by formula in the manner of sampling errors, but it is still the case that the magnitude of the errors is inversely related to the size of the regions. Because LGAs are generally an order of magnitude larger in scale than POAs, the errors in LGA estimates are generally considered to be relatively small. However, PHAs are commensurate in size with POAs, and so the inaccuracies due to redistribution of POA data to PHAs are relatively greater. The City of Brimbank includes 10 PHAs and involves 12 POAs (all of 5 POAs and sections of a further 7 POAs), and so the PHA estimates in this report should be regarded as providing only a general guide to the variation of participation rates within the City of Brimbank.
Prevalence and rate
These are alternative terms for the proportion of some population or subpopulation who have some characteristic or engage in some behaviour at a particular point in time. e.g. prevalence of obesity among children, club sport participation rate among women with dependent children.
Correlation coefficients
A correlation coefficient is a number between -1.0 and +1.0. The sign represents the direction of the relationship. A positive correlation coefficient means that from LGA to LGA, the two indicators tend to move in the same direction i.e. they tend to rise and fall together. A negative correlation coefficient means that from LGA to LGA, the two indicators tend move in opposite directions i.e. as one rises the other tends to fall. The magnitude of the correlation coefficient indicates the strength of this tendency. If a correlation coefficient is close to +1.0 or -1.0, the relationship is close to perfect; when one of the indicators is graphed against the other, the points representing the 31 LGAs fall close to a straight line. A correlation coefficient close to zero indicates little or no relationship. In accordance with common practice, in this report relationships are classified as in the following table.
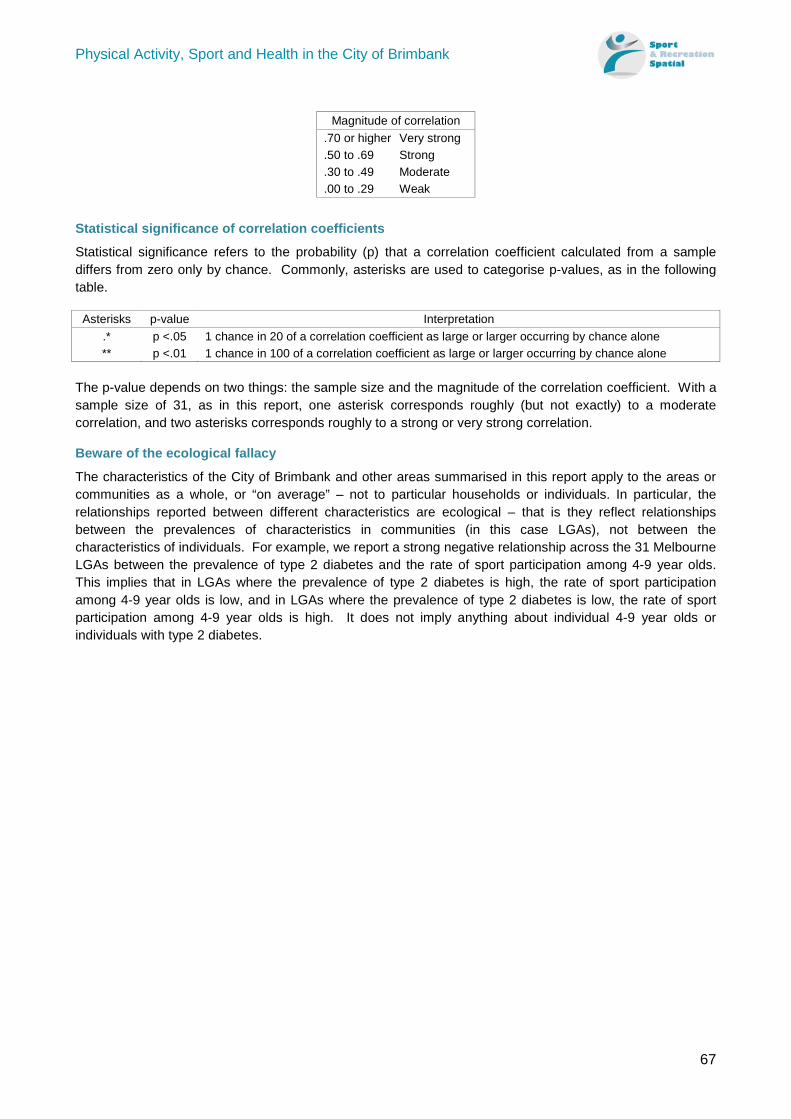
Physical Activity, Sport and Health in the City of Brimbank
67
Magnitude of correlation
.70 or higher Very strong
.50 to .69 Strong
.30 to .49 Moderate
.00 to .29 Weak
Statistical significance of correlation coefficients
Statistical significance refers to the probability (p) that a correlation coefficient calculated from a sample differs from zero only by chance. Commonly, asterisks are used to categorise p-values, as in the following table.
Asterisks p-value Interpretation .* p <.05 1 chance in 20 of a correlation coefficient as large or larger occurring by chance alone ** p <.01 1 chance in 100 of a correlation coefficient as large or larger occurring by chance alone
The p-value depends on two things: the sample size and the magnitude of the correlation coefficient. With a sample size of 31, as in this report, one asterisk corresponds roughly (but not exactly) to a moderate correlation, and two asterisks corresponds roughly to a strong or very strong correlation.
Beware of the ecological fallacy
The characteristics of the City of Brimbank and other areas summarised in this report apply to the areas or communities as a whole, or “on average” – not to particular households or individuals. In particular, the relationships reported between different characteristics are ecological – that is they reflect relationships between the prevalences of characteristics in communities (in this case LGAs), not between the characteristics of individuals. For example, we report a strong negative relationship across the 31 Melbourne LGAs between the prevalence of type 2 diabetes and the rate of sport participation among 4-9 year olds. This implies that in LGAs where the prevalence of type 2 diabetes is high, the rate of sport participation among 4-9 year olds is low, and in LGAs where the prevalence of type 2 diabetes is low, the rate of sport participation among 4-9 year olds is high. It does not imply anything about individual 4-9 year olds or individuals with type 2 diabetes.
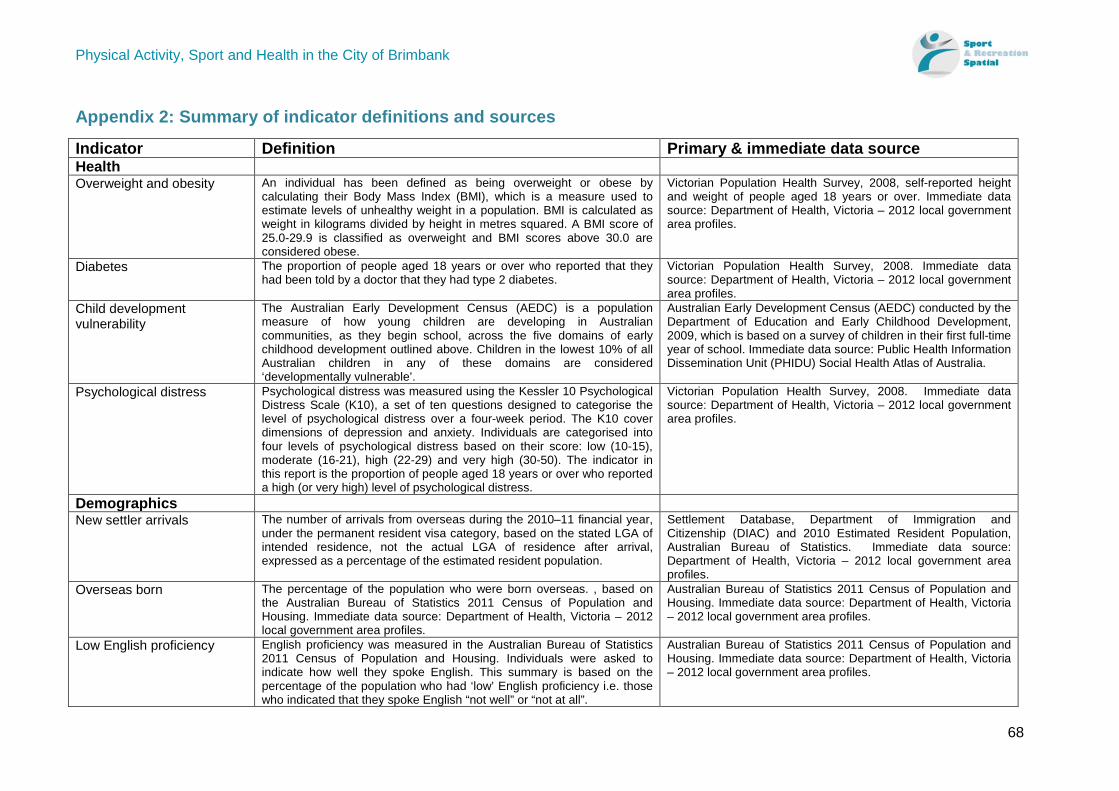
Physical Activity, Sport and Health in the City of Brimbank
68
Appendix 2: Summary of indicator definitions and sources
Indicator Definition Primary & immediate data source Health Overweight and obesity An individual has been defined as being overweight or obese by
calculating their Body Mass Index (BMI), which is a measure used to estimate levels of unhealthy weight in a population. BMI is calculated as weight in kilograms divided by height in metres squared. A BMI score of 25.0-29.9 is classified as overweight and BMI scores above 30.0 are considered obese.
Victorian Population Health Survey, 2008, self-reported height and weight of people aged 18 years or over. Immediate data source: Department of Health, Victoria – 2012 local government area profiles.
Diabetes The proportion of people aged 18 years or over who reported that they had been told by a doctor that they had type 2 diabetes.
Victorian Population Health Survey, 2008. Immediate data source: Department of Health, Victoria – 2012 local government area profiles.
Child development vulnerability
The Australian Early Development Census (AEDC) is a population measure of how young children are developing in Australian communities, as they begin school, across the five domains of early childhood development outlined above. Children in the lowest 10% of all Australian children in any of these domains are considered ‘developmentally vulnerable’.
Australian Early Development Census (AEDC) conducted by the Department of Education and Early Childhood Development, 2009, which is based on a survey of children in their first full-time year of school. Immediate data source: Public Health Information Dissemination Unit (PHIDU) Social Health Atlas of Australia.
Psychological distress Psychological distress was measured using the Kessler 10 Psychological Distress Scale (K10), a set of ten questions designed to categorise the level of psychological distress over a four-week period. The K10 cover dimensions of depression and anxiety. Individuals are categorised into four levels of psychological distress based on their score: low (10-15), moderate (16-21), high (22-29) and very high (30-50). The indicator in this report is the proportion of people aged 18 years or over who reported a high (or very high) level of psychological distress.
Victorian Population Health Survey, 2008. Immediate data source: Department of Health, Victoria – 2012 local government area profiles.
Demographics New settler arrivals The number of arrivals from overseas during the 2010–11 financial year,
under the permanent resident visa category, based on the stated LGA of intended residence, not the actual LGA of residence after arrival, expressed as a percentage of the estimated resident population.
Settlement Database, Department of Immigration and Citizenship (DIAC) and 2010 Estimated Resident Population, Australian Bureau of Statistics. Immediate data source: Department of Health, Victoria – 2012 local government area profiles.
Overseas born The percentage of the population who were born overseas. , based on the Australian Bureau of Statistics 2011 Census of Population and Housing. Immediate data source: Department of Health, Victoria – 2012 local government area profiles.
Australian Bureau of Statistics 2011 Census of Population and Housing. Immediate data source: Department of Health, Victoria – 2012 local government area profiles.
Low English proficiency English proficiency was measured in the Australian Bureau of Statistics 2011 Census of Population and Housing. Individuals were asked to indicate how well they spoke English. This summary is based on the percentage of the population who had ‘low’ English proficiency i.e. those who indicated that they spoke English “not well” or “not at all”.
Australian Bureau of Statistics 2011 Census of Population and Housing. Immediate data source: Department of Health, Victoria – 2012 local government area profiles.
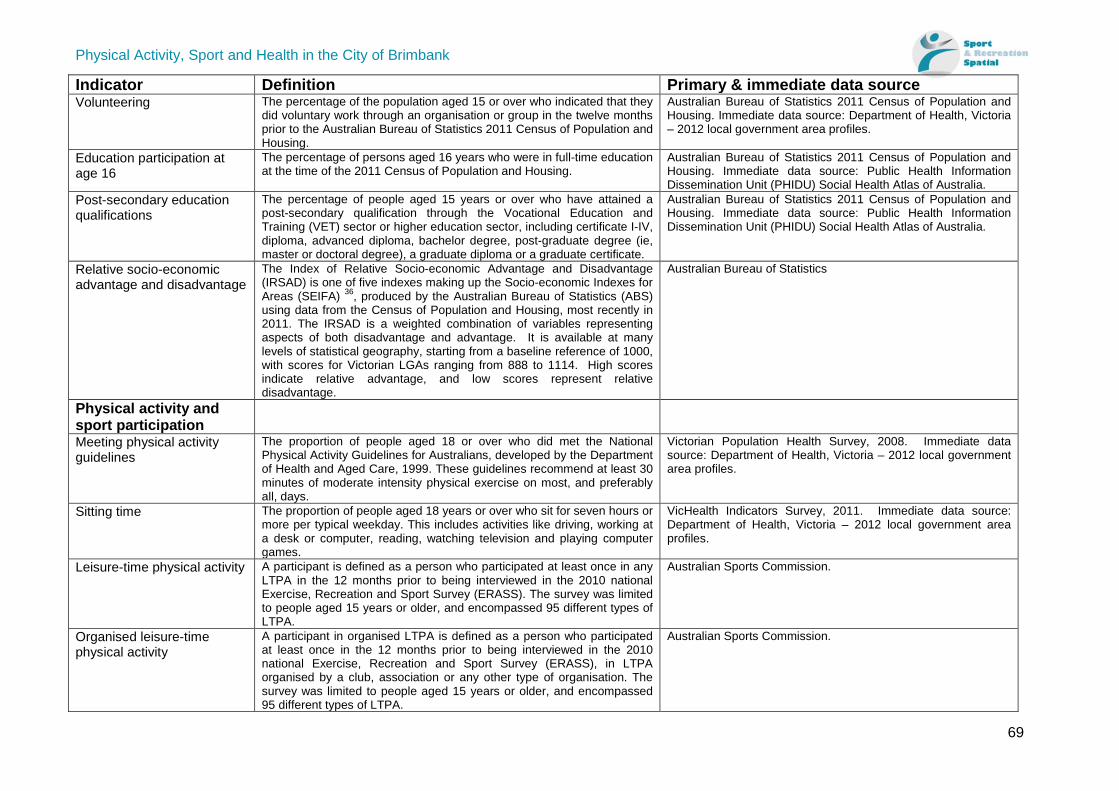
Physical Activity, Sport and Health in the City of Brimbank
69
Indicator Definition Primary & immediate data source Volunteering The percentage of the population aged 15 or over who indicated that they
did voluntary work through an organisation or group in the twelve months prior to the Australian Bureau of Statistics 2011 Census of Population and Housing.
Australian Bureau of Statistics 2011 Census of Population and Housing. Immediate data source: Department of Health, Victoria – 2012 local government area profiles.
Education participation at age 16
The percentage of persons aged 16 years who were in full-time education at the time of the 2011 Census of Population and Housing.
Australian Bureau of Statistics 2011 Census of Population and Housing. Immediate data source: Public Health Information Dissemination Unit (PHIDU) Social Health Atlas of Australia.
Post-secondary education qualifications
The percentage of people aged 15 years or over who have attained a post-secondary qualification through the Vocational Education and Training (VET) sector or higher education sector, including certificate I-IV, diploma, advanced diploma, bachelor degree, post-graduate degree (ie, master or doctoral degree), a graduate diploma or a graduate certificate.
Australian Bureau of Statistics 2011 Census of Population and Housing. Immediate data source: Public Health Information Dissemination Unit (PHIDU) Social Health Atlas of Australia.
Relative socio-economic advantage and disadvantage
The Index of Relative Socio-economic Advantage and Disadvantage (IRSAD) is one of five indexes making up the Socio-economic Indexes for Areas (SEIFA) 36, produced by the Australian Bureau of Statistics (ABS) using data from the Census of Population and Housing, most recently in 2011. The IRSAD is a weighted combination of variables representing aspects of both disadvantage and advantage. It is available at many levels of statistical geography, starting from a baseline reference of 1000, with scores for Victorian LGAs ranging from 888 to 1114. High scores indicate relative advantage, and low scores represent relative disadvantage.
Australian Bureau of Statistics
Physical activity and sport participation
Meeting physical activity guidelines
The proportion of people aged 18 or over who did met the National Physical Activity Guidelines for Australians, developed by the Department of Health and Aged Care, 1999. These guidelines recommend at least 30 minutes of moderate intensity physical exercise on most, and preferably all, days.
Victorian Population Health Survey, 2008. Immediate data source: Department of Health, Victoria – 2012 local government area profiles.
Sitting time The proportion of people aged 18 years or over who sit for seven hours or more per typical weekday. This includes activities like driving, working at a desk or computer, reading, watching television and playing computer games.
VicHealth Indicators Survey, 2011. Immediate data source: Department of Health, Victoria – 2012 local government area profiles.
Leisure-time physical activity A participant is defined as a person who participated at least once in any LTPA in the 12 months prior to being interviewed in the 2010 national Exercise, Recreation and Sport Survey (ERASS). The survey was limited to people aged 15 years or older, and encompassed 95 different types of LTPA.
Australian Sports Commission.
Organised leisure-time physical activity
A participant in organised LTPA is defined as a person who participated at least once in the 12 months prior to being interviewed in the 2010 national Exercise, Recreation and Sport Survey (ERASS), in LTPA organised by a club, association or any other type of organisation. The survey was limited to people aged 15 years or older, and encompassed 95 different types of LTPA.
Australian Sports Commission.
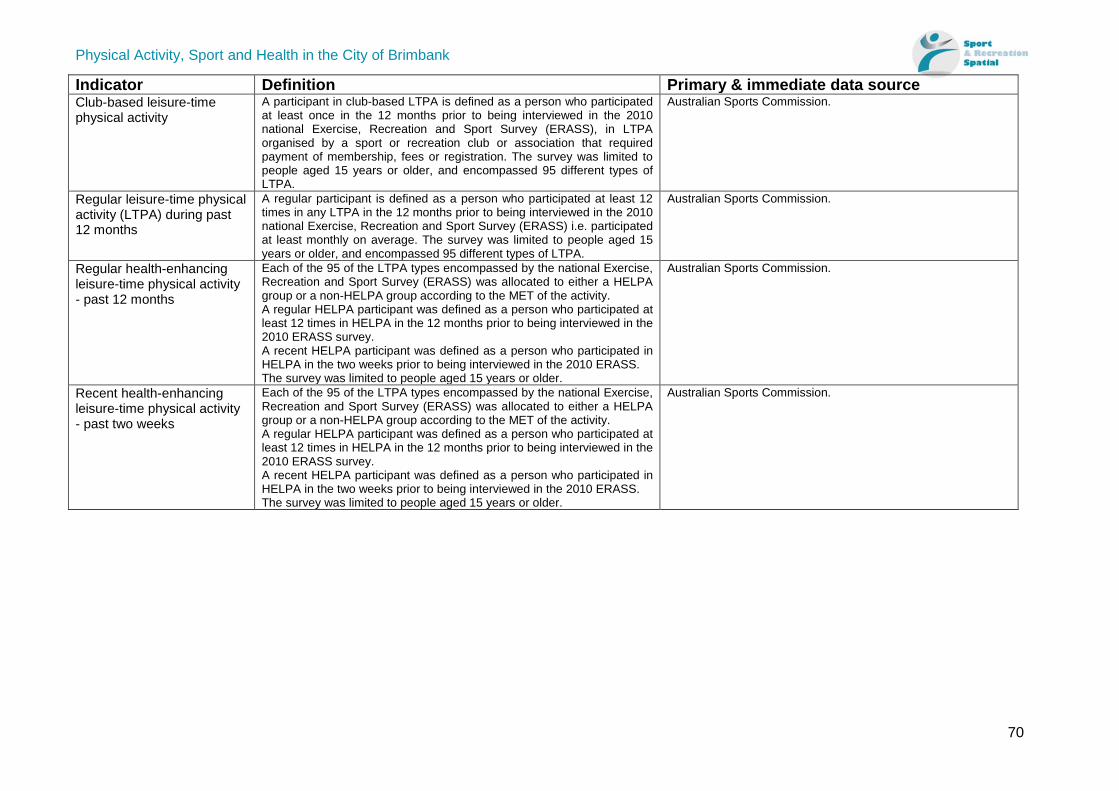
Physical Activity, Sport and Health in the City of Brimbank
70
Indicator Definition Primary & immediate data source Club-based leisure-time physical activity
A participant in club-based LTPA is defined as a person who participated at least once in the 12 months prior to being interviewed in the 2010 national Exercise, Recreation and Sport Survey (ERASS), in LTPA organised by a sport or recreation club or association that required payment of membership, fees or registration. The survey was limited to people aged 15 years or older, and encompassed 95 different types of LTPA.
Australian Sports Commission.
Regular leisure-time physical activity (LTPA) during past 12 months
A regular participant is defined as a person who participated at least 12 times in any LTPA in the 12 months prior to being interviewed in the 2010 national Exercise, Recreation and Sport Survey (ERASS) i.e. participated at least monthly on average. The survey was limited to people aged 15 years or older, and encompassed 95 different types of LTPA.
Australian Sports Commission.
Regular health-enhancing leisure-time physical activity - past 12 months
Each of the 95 of the LTPA types encompassed by the national Exercise, Recreation and Sport Survey (ERASS) was allocated to either a HELPA group or a non-HELPA group according to the MET of the activity. A regular HELPA participant was defined as a person who participated at least 12 times in HELPA in the 12 months prior to being interviewed in the 2010 ERASS survey. A recent HELPA participant was defined as a person who participated in HELPA in the two weeks prior to being interviewed in the 2010 ERASS. The survey was limited to people aged 15 years or older.
Australian Sports Commission.
Recent health-enhancing leisure-time physical activity - past two weeks
Each of the 95 of the LTPA types encompassed by the national Exercise, Recreation and Sport Survey (ERASS) was allocated to either a HELPA group or a non-HELPA group according to the MET of the activity. A regular HELPA participant was defined as a person who participated at least 12 times in HELPA in the 12 months prior to being interviewed in the 2010 ERASS survey. A recent HELPA participant was defined as a person who participated in HELPA in the two weeks prior to being interviewed in the 2010 ERASS. The survey was limited to people aged 15 years or older.
Australian Sports Commission.
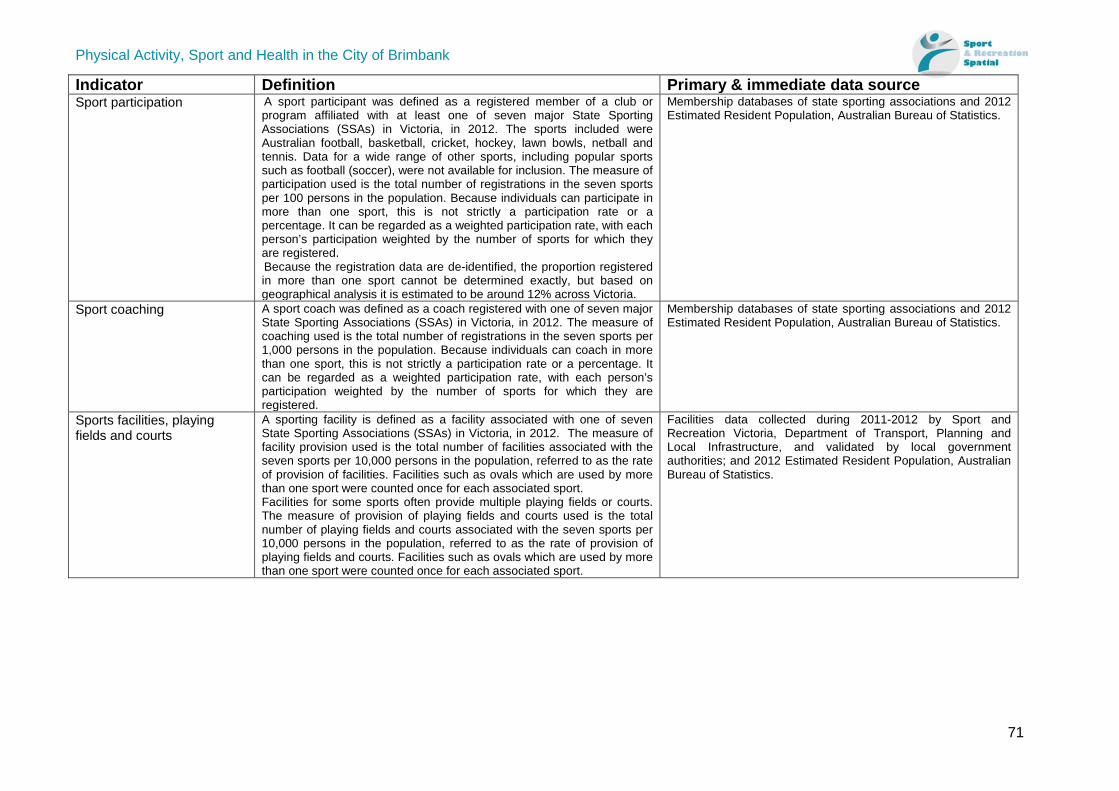
Physical Activity, Sport and Health in the City of Brimbank
71
Indicator Definition Primary & immediate data source Sport participation A sport participant was defined as a registered member of a club or
program affiliated with at least one of seven major State Sporting Associations (SSAs) in Victoria, in 2012. The sports included were Australian football, basketball, cricket, hockey, lawn bowls, netball and tennis. Data for a wide range of other sports, including popular sports such as football (soccer), were not available for inclusion. The measure of participation used is the total number of registrations in the seven sports per 100 persons in the population. Because individuals can participate in more than one sport, this is not strictly a participation rate or a percentage. It can be regarded as a weighted participation rate, with each person’s participation weighted by the number of sports for which they are registered. Because the registration data are de-identified, the proportion registered in more than one sport cannot be determined exactly, but based on geographical analysis it is estimated to be around 12% across Victoria.
Membership databases of state sporting associations and 2012 Estimated Resident Population, Australian Bureau of Statistics.
Sport coaching A sport coach was defined as a coach registered with one of seven major State Sporting Associations (SSAs) in Victoria, in 2012. The measure of coaching used is the total number of registrations in the seven sports per 1,000 persons in the population. Because individuals can coach in more than one sport, this is not strictly a participation rate or a percentage. It can be regarded as a weighted participation rate, with each person’s participation weighted by the number of sports for which they are registered.
Membership databases of state sporting associations and 2012 Estimated Resident Population, Australian Bureau of Statistics.
Sports facilities, playing fields and courts
A sporting facility is defined as a facility associated with one of seven State Sporting Associations (SSAs) in Victoria, in 2012. The measure of facility provision used is the total number of facilities associated with the seven sports per 10,000 persons in the population, referred to as the rate of provision of facilities. Facilities such as ovals which are used by more than one sport were counted once for each associated sport. Facilities for some sports often provide multiple playing fields or courts. The measure of provision of playing fields and courts used is the total number of playing fields and courts associated with the seven sports per 10,000 persons in the population, referred to as the rate of provision of playing fields and courts. Facilities such as ovals which are used by more than one sport were counted once for each associated sport.
Facilities data collected during 2011-2012 by Sport and Recreation Victoria, Department of Transport, Planning and Local Infrastructure, and validated by local government authorities; and 2012 Estimated Resident Population, Australian Bureau of Statistics.
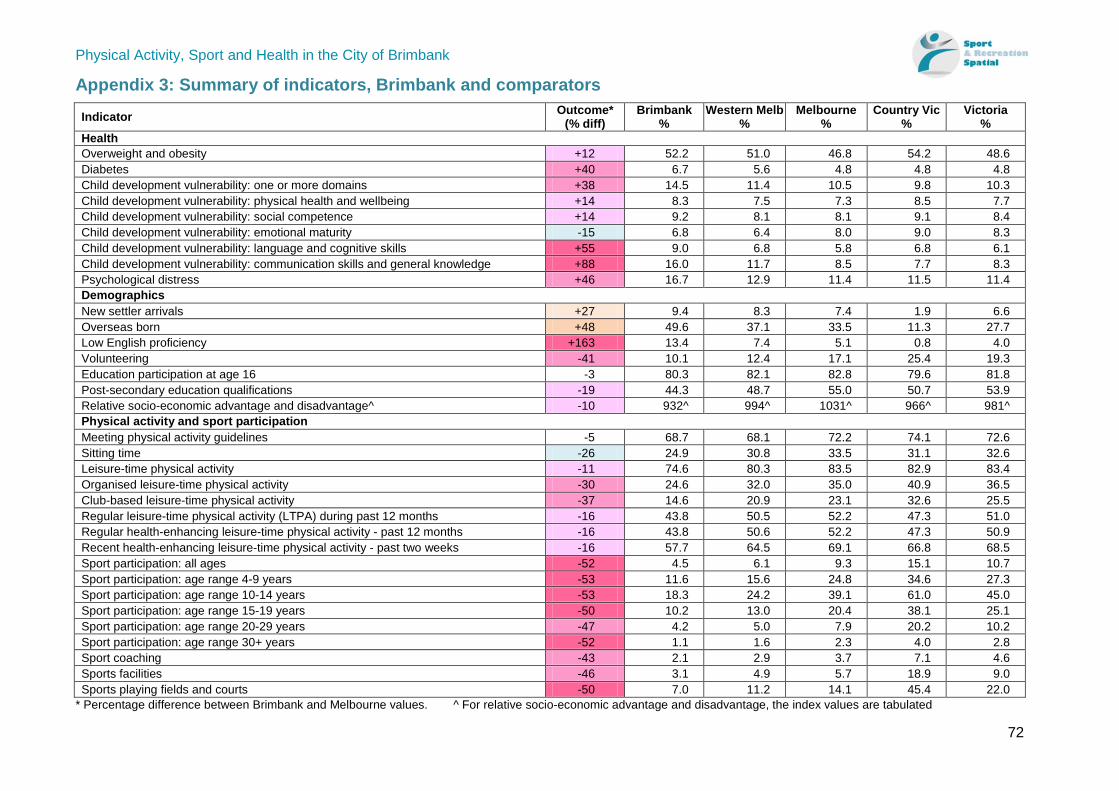
Physical Activity, Sport and Health in the City of Brimbank
72
Appendix 3: Summary of indicators, Brimbank and comparators
Indicator Outcome* (% diff)
Brimbank %
Western Melb %
Melbourne %
Country Vic %
Victoria %
Health Overweight and obesity +12 52.2 51.0 46.8 54.2 48.6 Diabetes +40 6.7 5.6 4.8 4.8 4.8 Child development vulnerability: one or more domains +38 14.5 11.4 10.5 9.8 10.3 Child development vulnerability: physical health and wellbeing +14 8.3 7.5 7.3 8.5 7.7 Child development vulnerability: social competence +14 9.2 8.1 8.1 9.1 8.4 Child development vulnerability: emotional maturity -15 6.8 6.4 8.0 9.0 8.3 Child development vulnerability: language and cognitive skills +55 9.0 6.8 5.8 6.8 6.1 Child development vulnerability: communication skills and general knowledge +88 16.0 11.7 8.5 7.7 8.3 Psychological distress +46 16.7 12.9 11.4 11.5 11.4 Demographics New settler arrivals +27 9.4 8.3 7.4 1.9 6.6 Overseas born +48 49.6 37.1 33.5 11.3 27.7 Low English proficiency +163 13.4 7.4 5.1 0.8 4.0 Volunteering -41 10.1 12.4 17.1 25.4 19.3 Education participation at age 16 -3 80.3 82.1 82.8 79.6 81.8 Post-secondary education qualifications -19 44.3 48.7 55.0 50.7 53.9 Relative socio-economic advantage and disadvantage^ -10 932^ 994^ 1031^ 966^ 981^ Physical activity and sport participation Meeting physical activity guidelines -5 68.7 68.1 72.2 74.1 72.6 Sitting time -26 24.9 30.8 33.5 31.1 32.6 Leisure-time physical activity -11 74.6 80.3 83.5 82.9 83.4 Organised leisure-time physical activity -30 24.6 32.0 35.0 40.9 36.5 Club-based leisure-time physical activity -37 14.6 20.9 23.1 32.6 25.5 Regular leisure-time physical activity (LTPA) during past 12 months -16 43.8 50.5 52.2 47.3 51.0 Regular health-enhancing leisure-time physical activity - past 12 months -16 43.8 50.6 52.2 47.3 50.9 Recent health-enhancing leisure-time physical activity - past two weeks -16 57.7 64.5 69.1 66.8 68.5 Sport participation: all ages -52 4.5 6.1 9.3 15.1 10.7 Sport participation: age range 4-9 years -53 11.6 15.6 24.8 34.6 27.3 Sport participation: age range 10-14 years -53 18.3 24.2 39.1 61.0 45.0 Sport participation: age range 15-19 years -50 10.2 13.0 20.4 38.1 25.1 Sport participation: age range 20-29 years -47 4.2 5.0 7.9 20.2 10.2 Sport participation: age range 30+ years -52 1.1 1.6 2.3 4.0 2.8 Sport coaching -43 2.1 2.9 3.7 7.1 4.6 Sports facilities -46 3.1 4.9 5.7 18.9 9.0 Sports playing fields and courts -50 7.0 11.2 14.1 45.4 22.0
* Percentage difference between Brimbank and Melbourne values. ^ For relative socio-economic advantage and disadvantage, the index values are tabulated
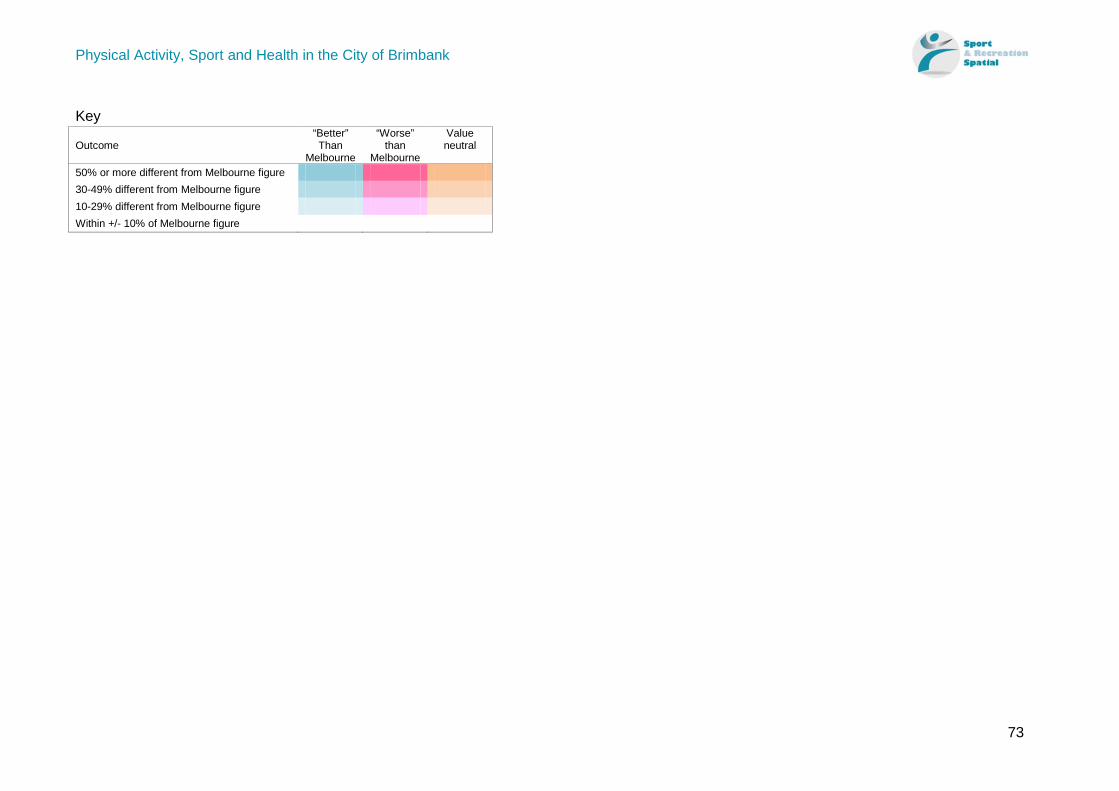
Physical Activity, Sport and Health in the City of Brimbank
73
Key
Outcome “Better” Than
Melbourne
“Worse” than
Melbourne
Value neutral
50% or more different from Melbourne figure 30-49% different from Melbourne figure 10-29% different from Melbourne figure Within +/- 10% of Melbourne figure