Embed Size (px)
Citation preview

PHYSICIAN COMPENSATION & PRODUCTION SURVEY

3 M e d A x i o M P H Y S i C i A N C o M P e N S AT i o N & P R o d U C T i o N S U R V e Y – 2 0 1 3
MedAxiom is a cardiovascular member services organization, with over 300 member institutions representing more than 6,000 cardiovascular physicians. Our membership includes many of the top cardiovascular programs in the country, with members in nearly all 50 states of the Union. For 13 years now, we have conducted a comprehensive survey of our membership collecting pertinent data on both the ambulatory physician practice, but also key data within the hospital cardiovascular service line. With over 800 metrics tracked, the MedAxiom family of surveys is the most comprehensive cardiovascular data set in the country.
This information allows our members to benchmark performance against peer groups across the country, enabling them to find “best practices” and improve performance. Additionally, MedAxiom conducts three major symposiums a year – our Spring Meeting, Cardiovascular Service Line Meeting, and Fall Meeting – providing both members and non-members an outstanding forum to learn from leading programs and industry experts. These meetings also provide an excellent opportunity to network with peers, form alliances and friendships, and discover cutting-edge ways to improve the cardiovascular product.
This inaugural 2013 Provider Compensation and Production Survey pulls select information from our entire data set and brings it together into a single place, adding analysis and meaning to the data and trends. For the first time in the history of our company, these data are being made available to the public and, we believe, will become the gold-standard for cardiovascular benchmarking and fair market testing nationally. Although these published data represent just a fraction of the depth and breadth of the entire MedAxiom warehouse, which is fully available to members through interactive web portals and other user-friendly means, we feel it provides a solid context for cardiology compensation and production.
At MedAxiom, we believe that sound data are the key to transforming and improving healthcare. Contained in these pages is a wealth of information you can use in your own quest to achieve both. In addition, I know you’ll find the data just plain interesting.
Enjoy!
JOEL SAUERVP - Consulting of MedAxiom Consulting
FORWARD
Joel SauerVP – COnSultingMeDAxiOM COnSulting
FORWARD - BY JOel SAueR

MEDICAL DOCUMENT
SOLUTIONS
helping physicians...
Are You Puzzled?
Are you wasting time tracking down physician administrative and directorship hours? We can get you back on track!
Visit www.MDtrak.com to learn more.
Our physician owned company develops efficient and cost
effective solutions to assist in electronic record implementation
and hospital integration.
We help clients increase Provider productivity, reduce implementation
related FTE’s by assisting with indexing, electronic routing, & stat
and same day appointment abstraction entry. We ensure accurate audited data is keyed for Meaningful Use, providing legal chart accuracy for
government reporting, all while saving you time and money!
Visit www.MDabstract.com to learn more.
EHRto
EHRconversiontoo costly?
Data for
Meaningful Use
not entered into
mineable fields?
Paper chart conversion into
EHR?
Struggling to keep up with daily EHR entry?
5 M e d A x i o M P H Y S i C i A N C o M P e N S AT i o N & P R o d U C T i o N S U R V e Y – 2 0 1 3
COntentS
Setting the Stage: Seismic Forces Changing our industry...............................7
Transition from Volume to Value ...................................................................... 7
Rise of the Consumer ....................................................................................... 8
Wired & Data Armed ........................................................................................ 8
Move Toward Populations ................................................................................ 8
New Competitors ............................................................................................. 9
Industry Consolidation ..................................................................................... 9
Pending Physician Workforce Issues ................................................................ 9
impact on Physician Compensation & Production .........................................10
Overview of the Report ................................................................................13
Methodology .................................................................................................. 13
Vetting Process ............................................................................................... 13
Demographics ................................................................................................ 13
Survey Results ...............................................................................................15
Subspecialty Comparisons ............................................................................. 15
Integrated vs Private ...................................................................................... 17
Geographic Differences ................................................................................. 19
Closer Look at Production .............................................................................. 21
Cognitive Encounters ..................................................................................... 22
Key Testing & Procedure Volumes ................................................................. 24
Changing Mix of Business .............................................................................. 26
Private vs Integrated Comparisons ................................................................ 30
non-Physician Providers in Cardiology .........................................................32
non-Clinical Compensation ...........................................................................33
Physician Compensation Data tables ...........................................................34
Physician Productivity Data tables ...............................................................36
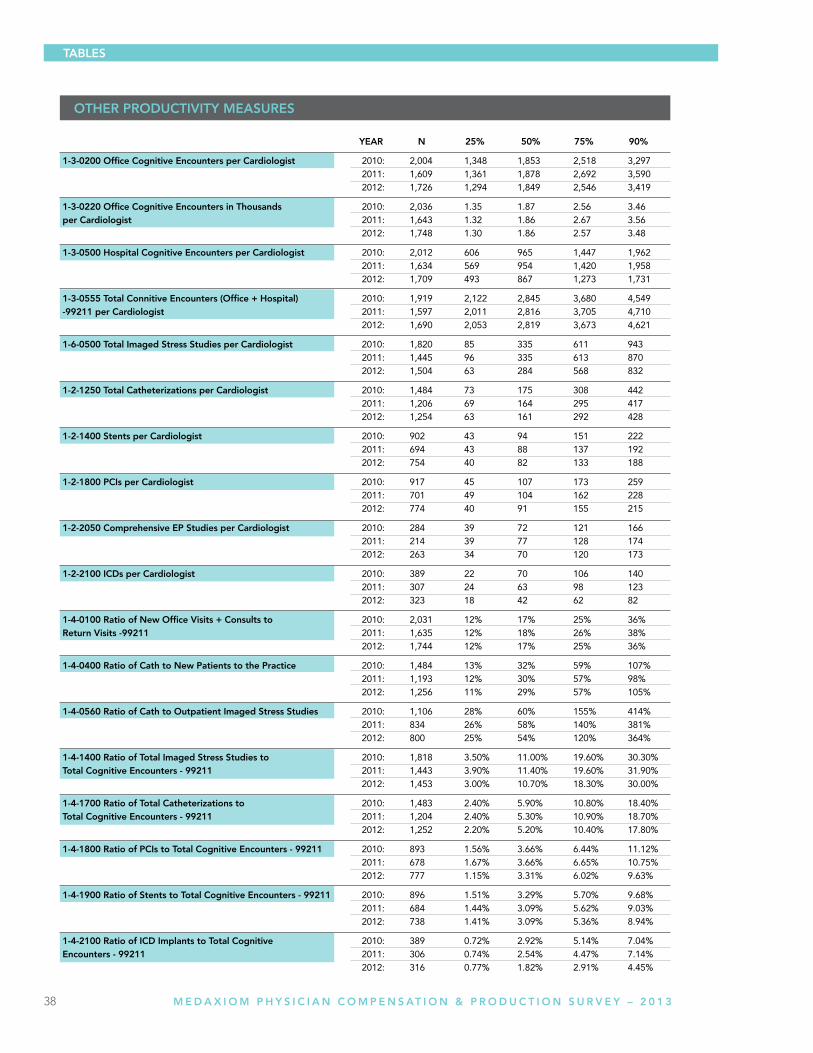
Other Productivity Measures tables ............................................................38
About MedAxiom .........................................................................................40
COntentS
7 M e d A x i o M P H Y S i C i A N C o M P e N S AT i o N & P R o d U C T i o N S U R V e Y – 2 0 1 3
the Move from Volume to ValueSince the advent of the modern healthcare system in the United States, payment for services has been effectively dependent on just one factor: the volume of units provided. This volume-based economy has led to an explosion of life-enhancing and life-saving advancements, but also an explosion of cost. In the next few years, the US will spend 20 percent of its Gross Domestic Product (GDP) on healthcare. By comparison, Sweden’s healthcare – the next most expensive country in the world – consumes 12 percent of GDP.
Perhaps surprising to many, Americans enjoy no real benefit for this additional cost; the World Health Organization ranks us 38th in the world for the health of our population. These facts put the US at a significant disadvantage in a world economy and, left un-checked, will have devastating long-term consequences for all of us.
Given this, cost has moved to front and center in the healthcare conversation. Consumers (Federal and State governments, commercial insurance, employers and patients) are demanding a better product at a lower cost. In other words, value. This new value paradigm is captured by the equation:
Sounds simple enough, but that equation above changes everything. The simplicity of it may make it easy to lose the dramatic impact of this change. Our entire infrastructure as an industry, from the physician office to the hospital, is set up around the volume economy. Consider fictitious patient Jill. When Jill becomes sick – and not until – she enters the system and we treat her. With very few exceptions, each “thing” we do for Jill generates revenue, regardless of whether that “thing” helped Jill’s condition or was even necessary. Then when Jill is better (or stable) she leaves the system and our responsibility.
From a revenue standpoint, all volume has been good volume. Volume drives reimbursement which in turn drives physician compensation. This is not to suggest that physicians don’t care about quality; they do. However, for the same unit of service both the exceptional and the average receive the same payment. Until now.
We’re already seeing value impact reimbursement on the hospital side. Medicare has now instituted penalties for hospitals with readmission rates in the bottom quartile of national comparisons. Further, the Value Based Purchasing (VBP) program provides for bonus payments to hospitals that can achieve certain quality and cost thresholds. Commercial insurance is quickly following suit. These initiatives add up to real dollars at stake and are absolutely changing behaviors.
On the physician side, it’s clear that change is imminent. Late in 2012, the Medicare Payment Advisory Commission (MedPAC), the body that advises Medicare on physician payments, recommended the end of traditional fee-for-service physician reimbursement, putting in place instead a value-based system. Then earlier this year, the National Commission of Physician Payment Reform made a similar recommendation. Each recommended beginning the implementation of such changes as early as 2014. Does this mean the end of CPT codes and work RVUs? Probably not, but it certainly means that value will enter at some level. We’re seeing evidence of this with the advent of Appropriate Use Criteria and the like.
The move from volume to value is undoubtedly the single largest force impacting healthcare today. Unfortunately for all of us, it’s not the only one.
Setting tHe StAge: SeiSMiC FORCeS CHAnging OuR inDuStRY
Setting tHe StAge: SeiSMiC FORCeS CHAnging OuR inDuStRY
8 M e d A x i o M P H Y S i C i A N C o M P e N S AT i o N & P R o d U C T i o N S U R V e Y – 2 0 1 3
Setting tHe StAge: SeiSMiC FORCeS CHAnging OuR inDuStRY
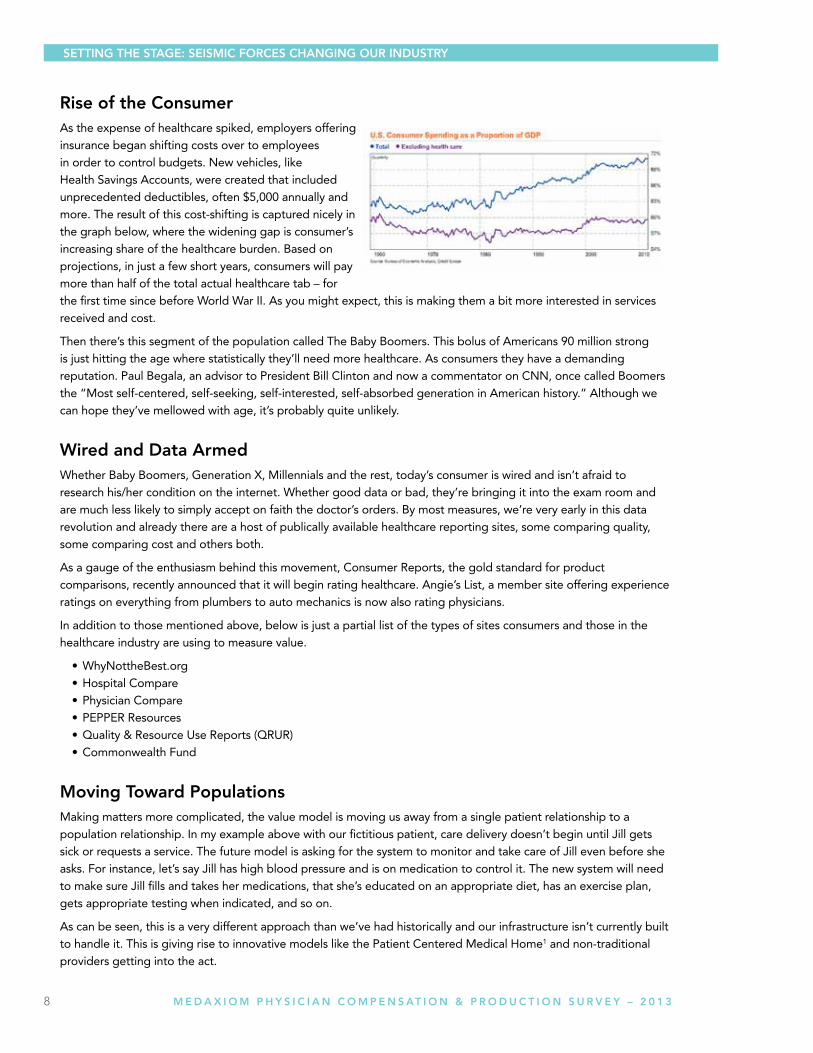
Rise of the ConsumerAs the expense of healthcare spiked, employers offering insurance began shifting costs over to employees in order to control budgets. New vehicles, like Health Savings Accounts, were created that included unprecedented deductibles, often $5,000 annually and more. The result of this cost-shifting is captured nicely in the graph below, where the widening gap is consumer’s increasing share of the healthcare burden. Based on projections, in just a few short years, consumers will pay more than half of the total actual healthcare tab – for the first time since before World War II. As you might expect, this is making them a bit more interested in services received and cost.
Then there’s this segment of the population called The Baby Boomers. This bolus of Americans 90 million strong is just hitting the age where statistically they’ll need more healthcare. As consumers they have a demanding reputation. Paul Begala, an advisor to President Bill Clinton and now a commentator on CNN, once called Boomers the “Most self-centered, self-seeking, self-interested, self-absorbed generation in American history.” Although we can hope they’ve mellowed with age, it’s probably quite unlikely.
Wired and Data ArmedWhether Baby Boomers, Generation X, Millennials and the rest, today’s consumer is wired and isn’t afraid to research his/her condition on the internet. Whether good data or bad, they’re bringing it into the exam room and are much less likely to simply accept on faith the doctor’s orders. By most measures, we’re very early in this data revolution and already there are a host of publically available healthcare reporting sites, some comparing quality, some comparing cost and others both.
As a gauge of the enthusiasm behind this movement, Consumer Reports, the gold standard for product comparisons, recently announced that it will begin rating healthcare. Angie’s List, a member site offering experience ratings on everything from plumbers to auto mechanics is now also rating physicians.
In addition to those mentioned above, below is just a partial list of the types of sites consumers and those in the healthcare industry are using to measure value.
•WhyNottheBest.org •HospitalCompare •PhysicianCompare •PEPPERResources •Quality&ResourceUseReports(QRUR) •CommonwealthFund
Moving toward PopulationsMaking matters more complicated, the value model is moving us away from a single patient relationship to a population relationship. In my example above with our fictitious patient, care delivery doesn’t begin until Jill gets sick or requests a service. The future model is asking for the system to monitor and take care of Jill even before she asks. For instance, let’s say Jill has high blood pressure and is on medication to control it. The new system will need to make sure Jill fills and takes her medications, that she’s educated on an appropriate diet, has an exercise plan, gets appropriate testing when indicated, and so on.
As can be seen, this is a very different approach than we’ve had historically and our infrastructure isn’t currently built to handle it. This is giving rise to innovative models like the Patient Centered Medical Home1 and non-traditional providers getting into the act.
9 M e d A x i o M P H Y S i C i A N C o M P e N S AT i o N & P R o d U C T i o N S U R V e Y – 2 0 1 3
new CompetitorsWe used to just worry about the competition at a local level; the hospital or physician next door. That world has changed. For instance, Walgreens and CVS both now offer diabetes “management” programs by using predictive analytic tools to anticipate patients who are more likely NOT to fill prescriptions and take them regularly. With these data they can pre-emptively provide education, financial assistance, reminders or whatever else might help keep the patient on track.
Insurance companies too are becoming very interested in population-based medicine, investing heavily in Accountable Care Organization (ACO) infrastructure and positioning themselves to attract newly insured individuals through the mandated exchanges. Some are even getting back into the physician acquisition game in an attempt to secure futures.
Then late last year Walmart – the largest employer in the US – announced plans to concentrate cardiac and spine care at six “centers of excellence” across the country. Cases will be steered to the centers with significant out-of-pocket differences for its employees and dependents. Walmart has a reputation for making sound business decisions so this one will certainly be watched and most likely emulated by other large employers. Now that’s a seismic change!
industry ConsolidationIf you subscribe to any healthcare news feeds, hardly a day goes by without some announcement about a significant merger. Insurance companies are consolidating, hospitals are acquiring hospitals, hospital systems are acquiring other systems, and hospitals are acquiring physician practices. Prior to 2008, only a few MedAxiom members were employed by a hospital. According to our 2013 Annual Integration Survey nearly 70 percent of groups are now employed or in the process of becoming employed by a hospital. With the passage of the Affordable Care Act and the move toward accountable care and populations, the industry is feeling the need for safety in numbers.
Pending Workforce issuesAs mentioned above, the 90 million Baby Boomers are hitting 65 years and the age at which their healthcare needs are statistically going to increase. At the same time, we have the impact of the Affordable Care Act (which I haven’t even mentioned yet) and the potential to add between 30 – 40 million newly insured individuals to the system. What impact this latter group will have on volumes is debatable – and quite hotly so, I might add. However, most are predicting the combination of both will put strain on our capacity.
A 2009 study by the American College of Cardiology (being updated this year) predicted a shortage of 16,000 cardiologists by the year 2025. Similarly, a 2011 study by the American Heart Association predicted 20 million new heart patients by 2020. These converging forces present a mathematical problem. Given that it takes around 15 years to educate a cardiologist, the fix for this shortage simply won’t be in time.
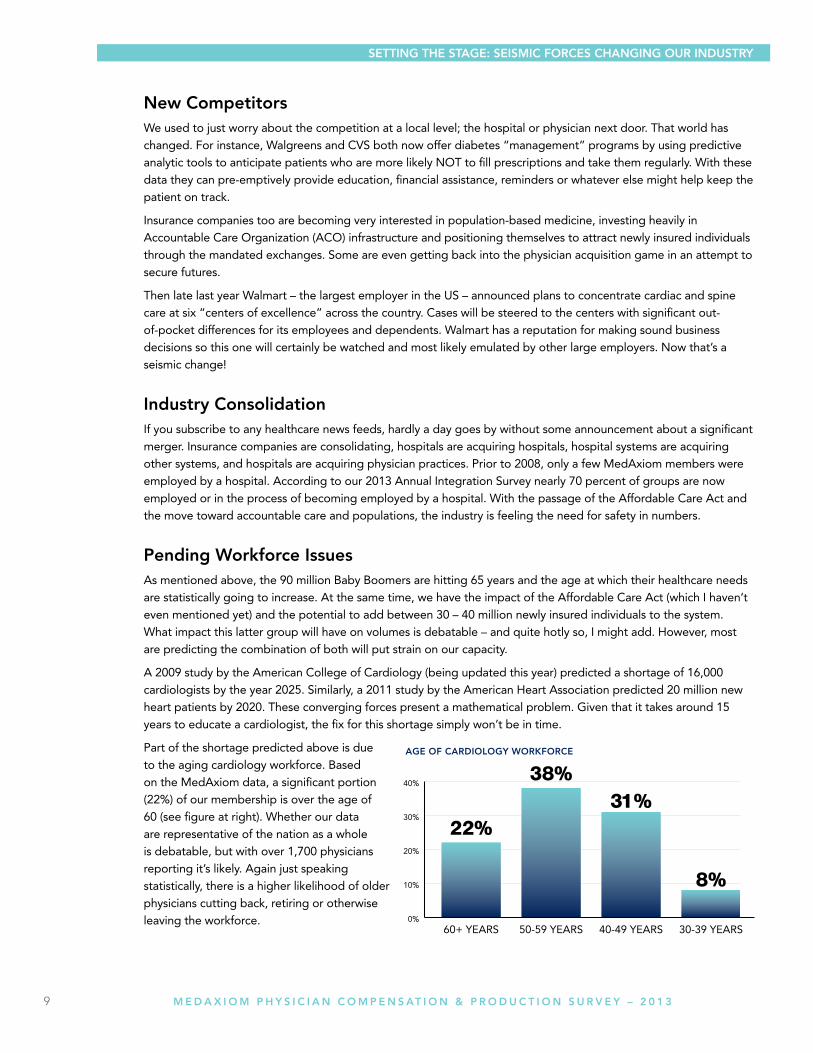
Part of the shortage predicted above is due to the aging cardiology workforce. Based on the MedAxiom data, a significant portion (22%) of our membership is over the age of 60 (see figure at right). Whether our data are representative of the nation as a whole is debatable, but with over 1,700 physicians reporting it’s likely. Again just speaking statistically, there is a higher likelihood of older physicians cutting back, retiring or otherwise leaving the workforce.
Setting tHe StAge: SeiSMiC FORCeS CHAnging OuR inDuStRY

10 M e d A x i o M P H Y S i C i A N C o M P e N S AT i o N & P R o d U C T i o N S U R V e Y – 2 0 1 3
All these trends are forcing us to look carefully at how we measure physician work and value. The traditional methods – work Relative Value Units (wRVU), net revenue and other volume-centric metrics – are no longer enough. We simply need to align total physician value with compensation. Fortunately, we’re seeing this happen.
In his 2010 editorial “The Disquieting Truth,” Arnold Relman, MD, Professor emeritus at Harvard Medical School and former editor of the New England Journal of Medicine notes that total physician expenses, including compensation, account for about 20 percent of total US health expenditures. He goes on to note that physicians influence – and often directly control – 100 percent of health care expenditures. Yet they have been historically absent from financial decision making for this 80 percent component.
To correct this we’re seeing more and more hospitals engaging physicians through co-management agreements, where physicians take an active role in managing services – not just looking at quality, but also at cost. A recent MedAxiom survey found that nearly half (46%) of all cardiology groups have some form of co-management agreement with a hospital. In its most evolved, this agreement covers the entire cardiovascular service line. Compensation for these management activities takes myriad forms, which is covered later in this report, but often includes a portion based on results, not just work alone.
Such activities transcend the ownership model and are reaching both private and hospital integrated groups alike. The key is to get physicians engaged and their economic incentives aligned around the areas they influence, not just in their practice. This will become even more critical for both groups and systems that are adopting an Accountable Care Organization (ACO) model, where significant dollars are at risk for cost and performance.
As was noted earlier, the consumer is playing a growing role in healthcare decisions. This not only comes because he is paying an expanded portion of the tab, but because he’s armed with data. These data are showing large differences in cost, quality and outcomes. In a recent interview, Jack Lewin, former CEO of the American College of Cardiology said, “In the very near future, there will be nowhere to hide in terms of poor performance.”
iMPACt On COMPenSAtiOn & PRODuCtiOn in tHiS VAlue BASeD eCOnOMY
iMPACt On COMPenSAtiOn & PRODuCtiOn in tHiS VAlue BASeD eCOnOMY
11 M e d A x i o M P H Y S i C i A N C o M P e N S AT i o N & P R o d U C T i o N S U R V e Y – 2 0 1 3
Not surprisingly, we’re seeing more focus here in cardiovascular service lines across the country. The 2013 Medaxiom Annual Integration Survey found that patient satisfaction topped the list of performance metrics measured, with quality improvement the top CVSL initiative.
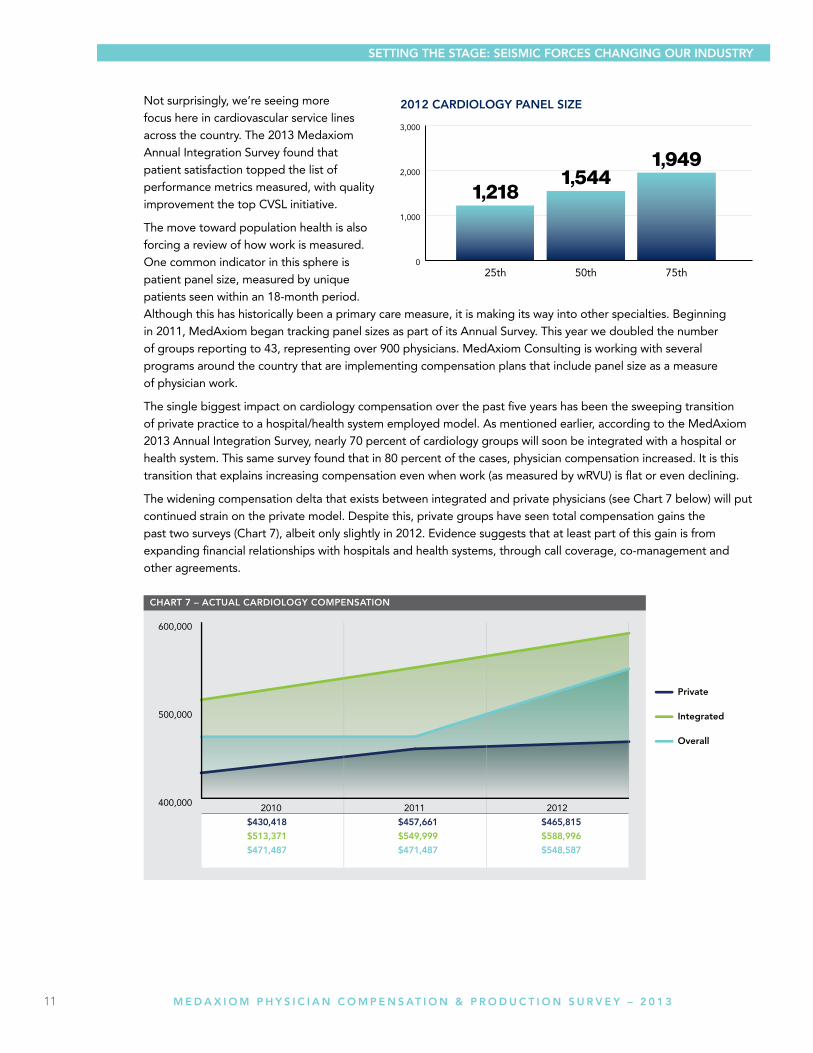
The move toward population health is also forcing a review of how work is measured. One common indicator in this sphere is patient panel size, measured by unique patients seen within an 18-month period. Although this has historically been a primary care measure, it is making its way into other specialties. Beginning in 2011, MedAxiom began tracking panel sizes as part of its Annual Survey. This year we doubled the number of groups reporting to 43, representing over 900 physicians. MedAxiom Consulting is working with several programs around the country that are implementing compensation plans that include panel size as a measure of physician work.
The single biggest impact on cardiology compensation over the past five years has been the sweeping transition of private practice to a hospital/health system employed model. As mentioned earlier, according to the MedAxiom 2013 Annual Integration Survey, nearly 70 percent of cardiology groups will soon be integrated with a hospital or health system. This same survey found that in 80 percent of the cases, physician compensation increased. It is this transition that explains increasing compensation even when work (as measured by wRVU) is flat or even declining.
The widening compensation delta that exists between integrated and private physicians (see Chart 7 below) will put continued strain on the private model. Despite this, private groups have seen total compensation gains the past two surveys (Chart 7), albeit only slightly in 2012. Evidence suggests that at least part of this gain is from expanding financial relationships with hospitals and health systems, through call coverage, co-management and other agreements.
2012 CARDiOlOgY PAnel Size
Setting tHe StAge: SeiSMiC FORCeS CHAnging OuR inDuStRY
12 M e d A x i o M P H Y S i C i A N C o M P e N S AT i o N & P R o d U C T i o N S U R V e Y – 2 0 1 3
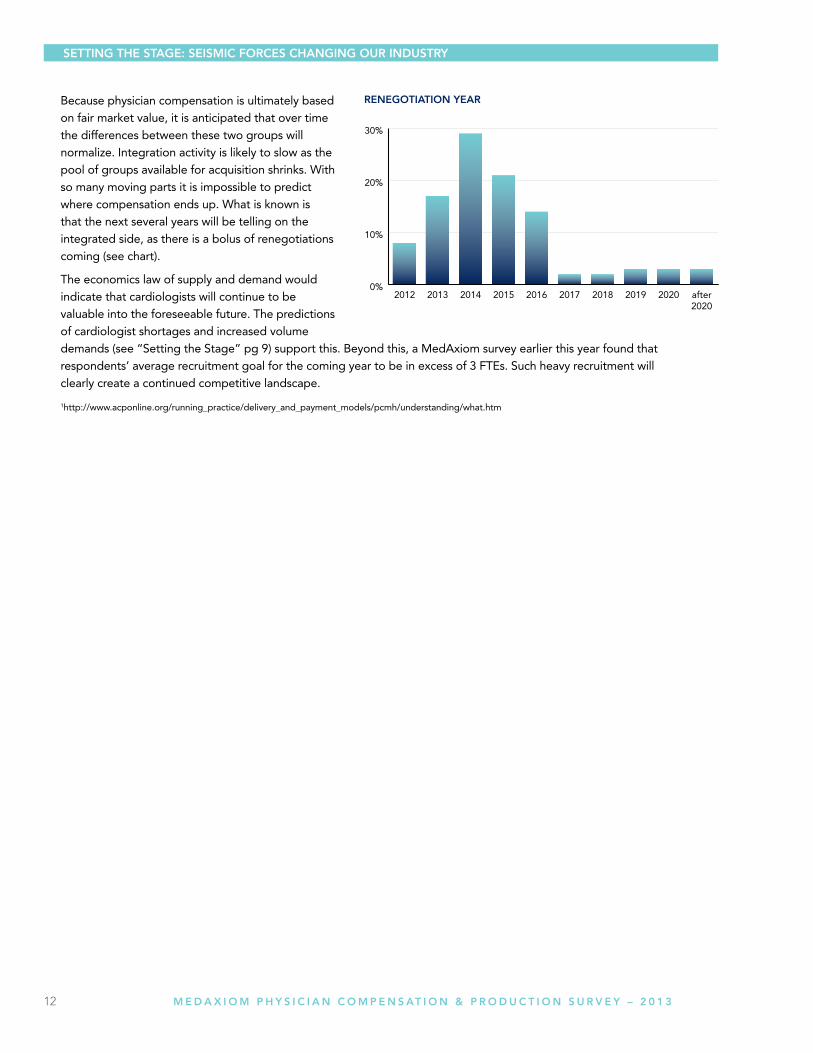
Because physician compensation is ultimately based on fair market value, it is anticipated that over time the differences between these two groups will normalize. Integration activity is likely to slow as the pool of groups available for acquisition shrinks. With so many moving parts it is impossible to predict where compensation ends up. What is known is that the next several years will be telling on the integrated side, as there is a bolus of renegotiations coming (see chart).
The economics law of supply and demand would indicate that cardiologists will continue to be valuable into the foreseeable future. The predictions of cardiologist shortages and increased volume demands (see “Setting the Stage” pg 9) support this. Beyond this, a MedAxiom survey earlier this year found that respondents’ average recruitment goal for the coming year to be in excess of 3 FTEs. Such heavy recruitment will clearly create a continued competitive landscape.
1http://www.acponline.org/running_practice/delivery_and_payment_models/pcmh/understanding/what.htm
Setting tHe StAge: SeiSMiC FORCeS CHAnging OuR inDuStRY
13 M e d A x i o M P H Y S i C i A N C o M P e N S AT i o N & P R o d U C T i o N S U R V e Y – 2 0 1 3
Methodology Each year in early spring MedAxiom surveys its membership on financial, staffing, productivity, compensation metrics, and a number of demographic measures such as location, size of practice, ownership model, physician subspecialties, and so on. Data is submitted through online data entry and via direct exports from the practice management system.
Member submissions are processed in MedAxiom’s data warehouse and compiled into over 800 measures for member analysis. Members then use MedAxiom’s proprietary Business Intelligence tool, called MedAxcess, to perform many different types of analyses. MedAxiom also extracts its own data to create reports for the membership, partnering organizations, and the public.
The physician compensation and production data provided in this report was collected over the 2008-2012 timeframe. It has also been filtered to only include full time physicians.
MedAxiom Data integrity: the Vetting Process MedAxiom realized long ago the importance of well-vetted data and how errant information can destroy the value of a data set. With this recognition, MedAxiom now goes above and beyond in its pursuit of data integrity. The fact-checking process begins with an automated comparison of self-reported RVUs to those calculated by MedAxiom based on the CPT upload provided by our members. If there is a discrepancy of 2% percent or greater, a more thorough review of the data is triggered. Additionally, data manually entered online immediately shows the operator a trend for comparison to the previous year. This provides an instant review if there are large differences from year to year.
Once data is loaded into our MedAxcess database, some of the critical measures relating to Full Time Equivalent physicians and mid-level providers, as well as some elements of financial information, are verified to make sure that they are in alignment with the statistical norms of the rest of the database. A set of limits defined by a team of cardiology administration experts is the key to this step. All data points are examined against their own same-practice historical trend and against the practice’s peer set to determine if the data point is an outlier. If a data point is determined to be an outlier it is excluded from the data set until the practice is contacted and the data point can be verified. Once confirmed or corrected, the data point is allowed back into the data set where it can be viewed by other members in a de-identified fashion.
Data verified in this fashion is included in the overall calculations such as percentiles, mean, and median. All submitted data goes through a rigorous process that relies on cross-checking, computer-automated vetting and review by human eyes, with follow-up phone calls and emails to data submitters when there are questionable results.
Having the right measures and high data integrity is what has made MedAxiom’s data the most trusted data in the cardiology industry.
DemographicsA total of 129 practices completed the 2012 Annual Survey which represents over 1,700 full time physicians. This year for the first time in our history, the number of hospital integrated practices (78) outnumbered the private groups (45). The median size of the responding groups is 16 FTE physicians.
total number of practices = 1291,748 physicians for 2012
OVeRVieW OF tHe RePORt
OVeRVieW OF tHe RePORt

14 M e d A x i o M P H Y S i C i A N C o M P e N S AT i o N & P R o d U C T i o N S U R V e Y – 2 0 1 3
exeCutiVe SuMMARY
geOgRAPHiC AReA
nuMBeR OF PHYSiCiAnS OWneRSHiP MODel
COMPenSAtiOn MetHODOlOgY PROViDeR BASeD Billing
15 M e d A x i o M P H Y S i C i A N C o M P e N S AT i o N & P R o d U C T i o N S U R V e Y – 2 0 1 3
CARDiOlOgY ACtuAl COMPenSAtiOn
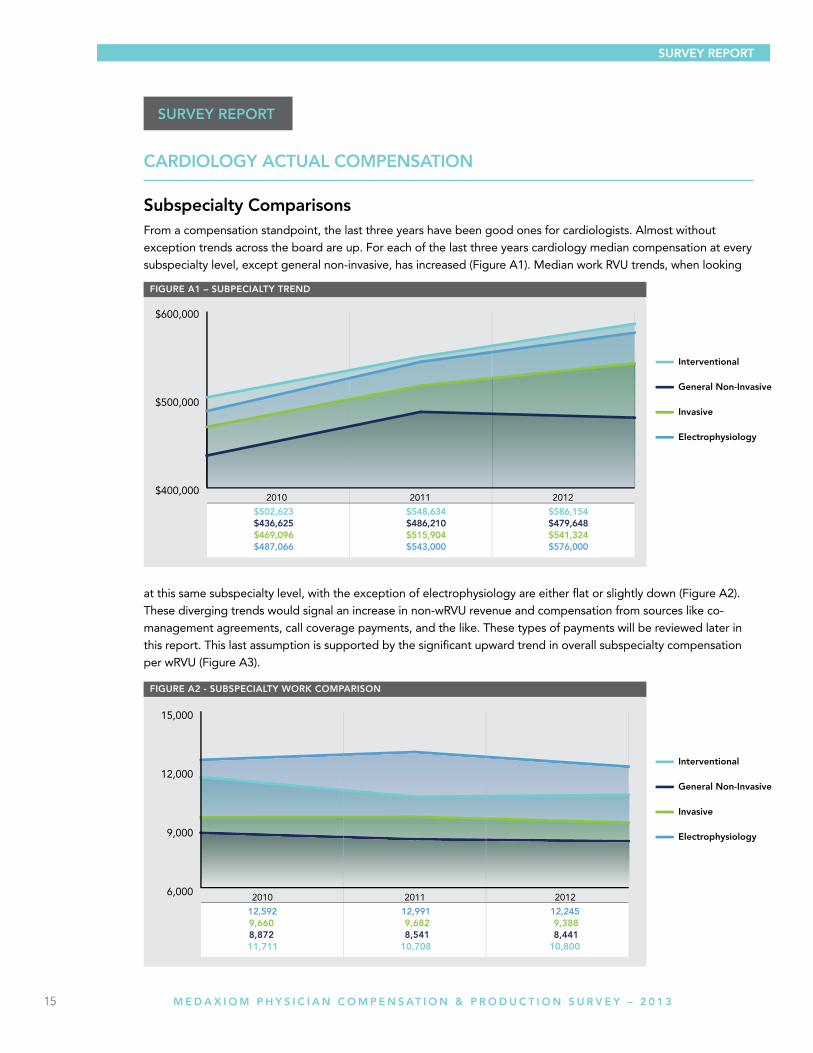
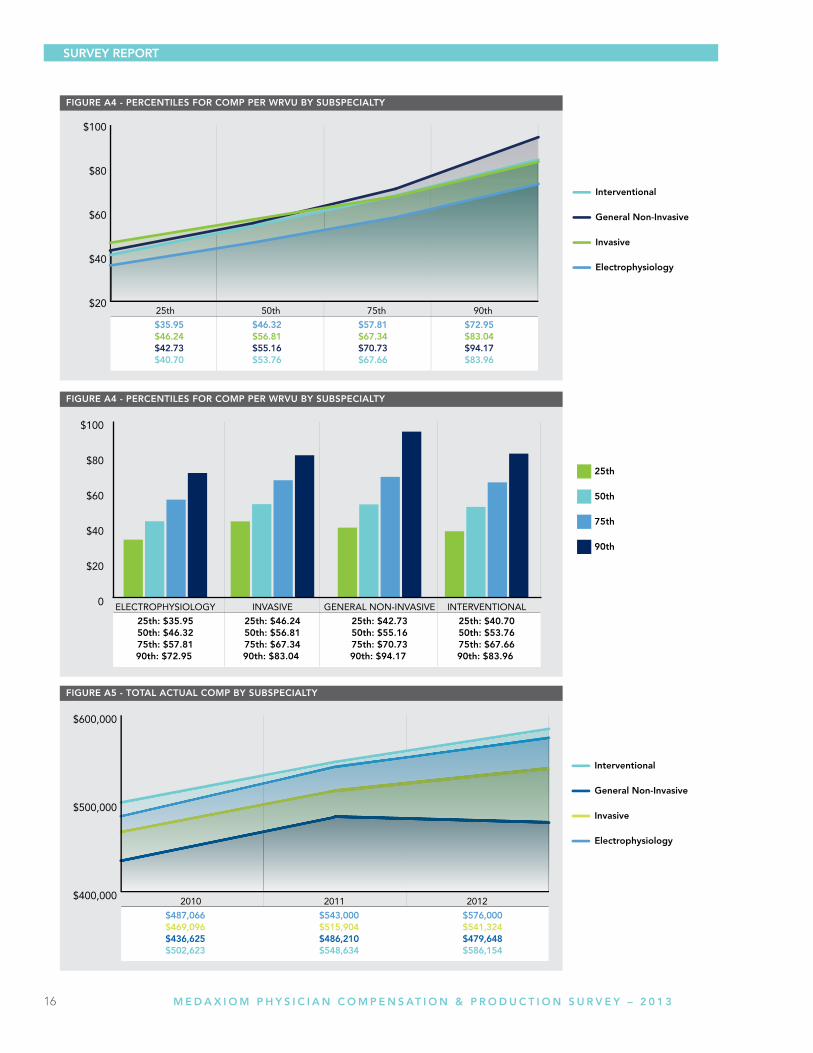
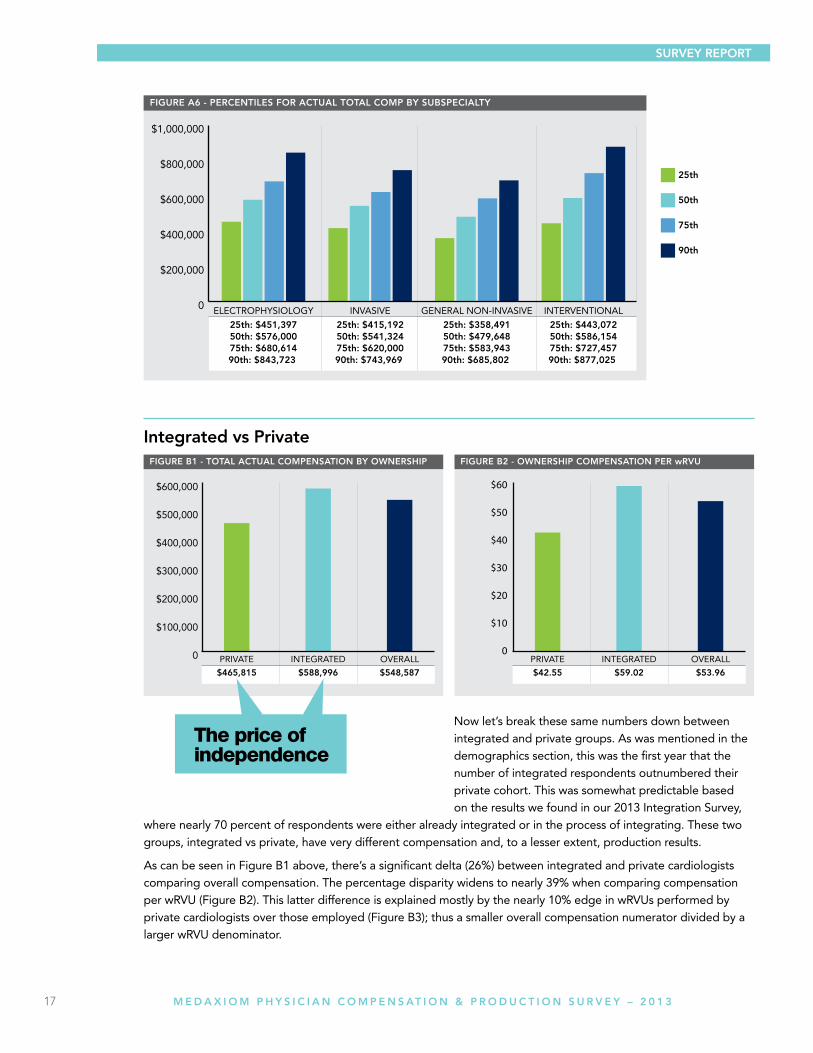
Subspecialty ComparisonsFrom a compensation standpoint, the last three years have been good ones for cardiologists. Almost without exception trends across the board are up. For each of the last three years cardiology median compensation at every subspecialty level, except general non-invasive, has increased (Figure A1). Median work RVU trends, when looking
at this same subspecialty level, with the exception of electrophysiology are either flat or slightly down (Figure A2). These diverging trends would signal an increase in non-wRVU revenue and compensation from sources like co-management agreements, call coverage payments, and the like. These types of payments will be reviewed later in this report. This last assumption is supported by the significant upward trend in overall subspecialty compensation per wRVU (Figure A3).
SuRVeY RePORt
SuRVeY RePORt
16 M e d A x i o M P H Y S i C i A N C o M P e N S AT i o N & P R o d U C T i o N S U R V e Y – 2 0 1 3
SuRVeY RePORt
17 M e d A x i o M P H Y S i C i A N C o M P e N S AT i o N & P R o d U C T i o N S U R V e Y – 2 0 1 3
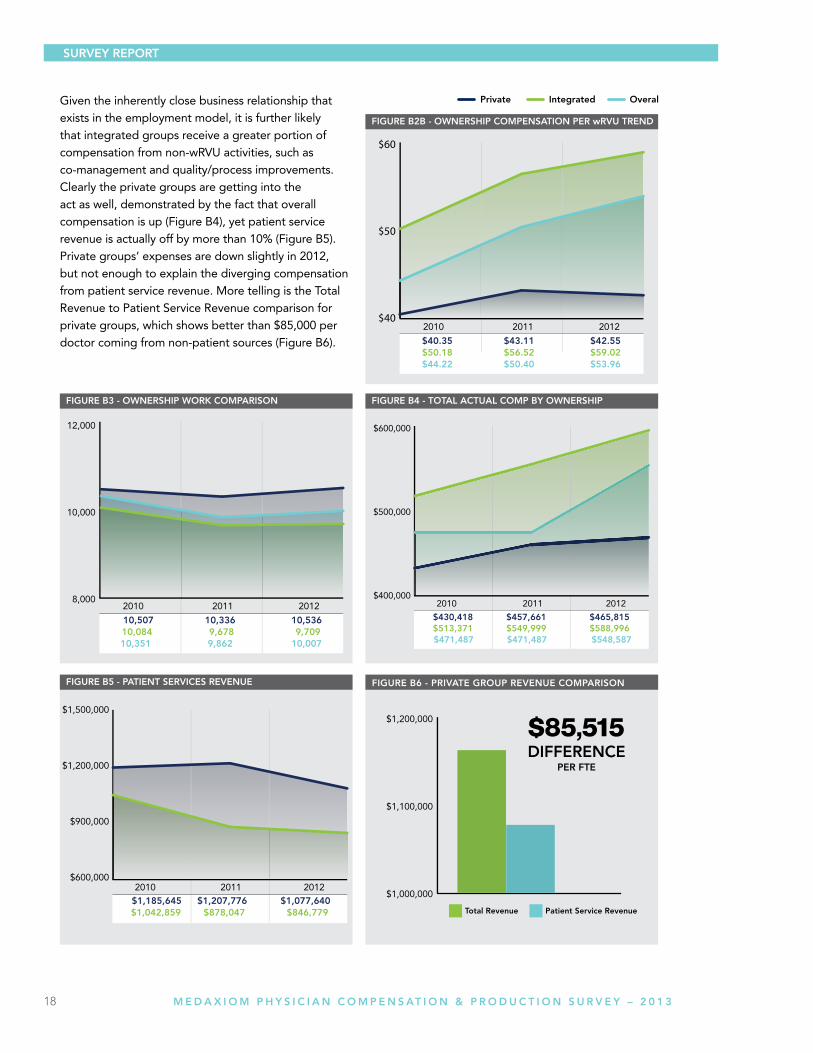
integrated vs Private
Now let’s break these same numbers down between integrated and private groups. As was mentioned in the demographics section, this was the first year that the number of integrated respondents outnumbered their private cohort. This was somewhat predictable based on the results we found in our 2013 Integration Survey,
where nearly 70 percent of respondents were either already integrated or in the process of integrating. These two groups, integrated vs private, have very different compensation and, to a lesser extent, production results.
As can be seen in Figure B1 above, there’s a significant delta (26%) between integrated and private cardiologists comparing overall compensation. The percentage disparity widens to nearly 39% when comparing compensation per wRVU (Figure B2). This latter difference is explained mostly by the nearly 10% edge in wRVUs performed by private cardiologists over those employed (Figure B3); thus a smaller overall compensation numerator divided by a larger wRVU denominator.
SuRVeY RePORt
The price of independence
18 M e d A x i o M P H Y S i C i A N C o M P e N S AT i o N & P R o d U C T i o N S U R V e Y – 2 0 1 3
SuRVeY RePORt
Given the inherently close business relationship that exists in the employment model, it is further likely that integrated groups receive a greater portion of compensation from non-wRVU activities, such as co-management and quality/process improvements. Clearly the private groups are getting into the act as well, demonstrated by the fact that overall compensation is up (Figure B4), yet patient service revenue is actually off by more than 10% (Figure B5). Private groups’ expenses are down slightly in 2012, but not enough to explain the diverging compensation from patient service revenue. More telling is the Total Revenue to Patient Service Revenue comparison for private groups, which shows better than $85,000 per doctor coming from non-patient sources (Figure B6).

19 M e d A x i o M P H Y S i C i A N C o M P e N S AT i o N & P R o d U C T i o N S U R V e Y – 2 0 1 3
SuRVeY RePORt
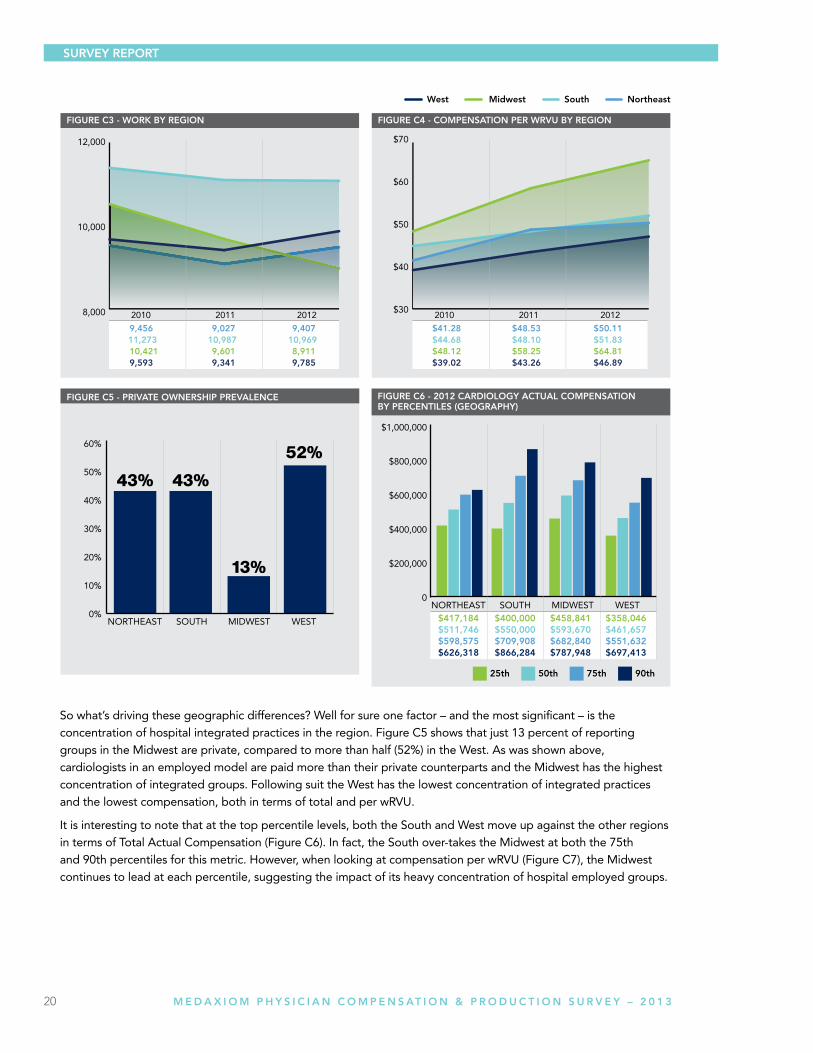
geographic DifferencesThe upward trend in cardiology compensation is being enjoyed by every quadrant of the country (Figure C1). As can be seen, the Midwest shows the highest compensation and has widened the gap the past two years, with the south close behind. Interestingly the two highest paid regions are also home to the largest group sizes, suggesting that size matters in compensation. Figure C2 shows the geographic comparison.
The geographic breakdown of wRVUs, a strong measure of physician productivity, shows a very different story than compensation. Here the South is significantly higher than other regions of the country, with the West coming in second for 2012 (see Figure C3). At the same time the Midwest, which had the highest compensation for 2012, comes in dead last for wRVU production. As could probably be expected this translates into the Midwest leading the pack for compensation per wRVU and the West finishing last (Figure C4).
20 M e d A x i o M P H Y S i C i A N C o M P e N S AT i o N & P R o d U C T i o N S U R V e Y – 2 0 1 3
SuRVeY RePORt
So what’s driving these geographic differences? Well for sure one factor – and the most significant – is the concentration of hospital integrated practices in the region. Figure C5 shows that just 13 percent of reporting groups in the Midwest are private, compared to more than half (52%) in the West. As was shown above, cardiologists in an employed model are paid more than their private counterparts and the Midwest has the highest concentration of integrated groups. Following suit the West has the lowest concentration of integrated practices and the lowest compensation, both in terms of total and per wRVU.
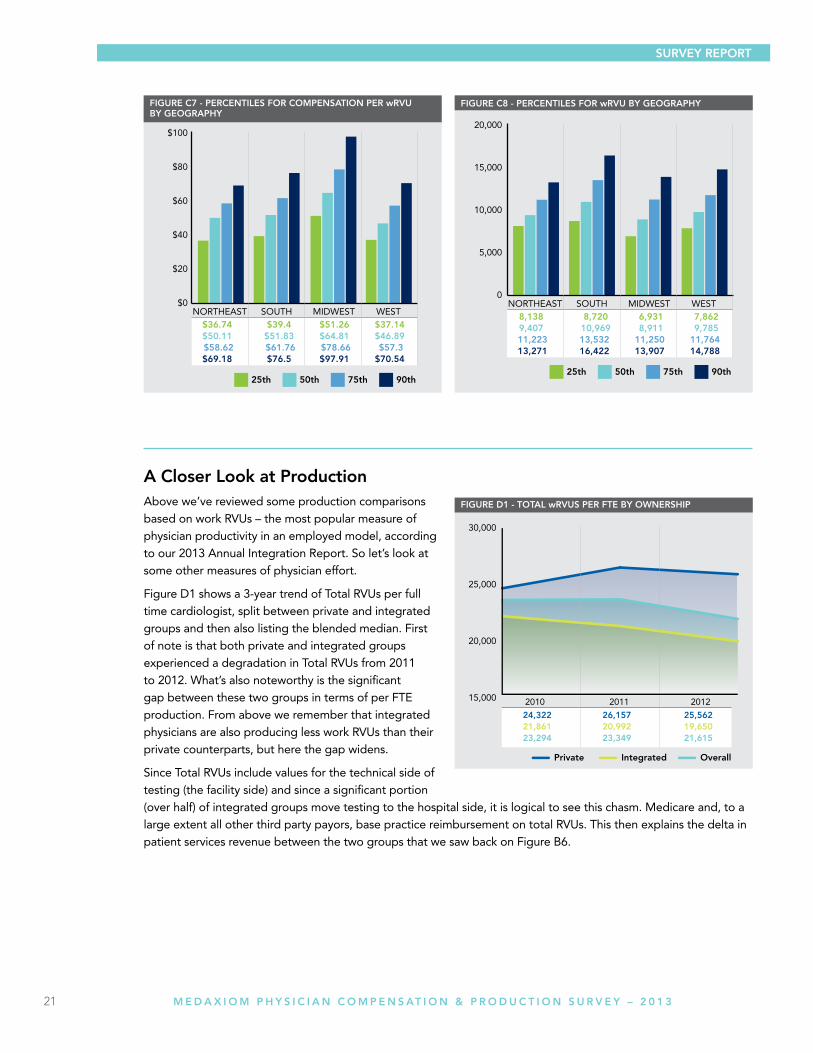
It is interesting to note that at the top percentile levels, both the South and West move up against the other regions in terms of Total Actual Compensation (Figure C6). In fact, the South over-takes the Midwest at both the 75th and 90th percentiles for this metric. However, when looking at compensation per wRVU (Figure C7), the Midwest continues to lead at each percentile, suggesting the impact of its heavy concentration of hospital employed groups.
21 M e d A x i o M P H Y S i C i A N C o M P e N S AT i o N & P R o d U C T i o N S U R V e Y – 2 0 1 3
SuRVeY RePORt
A Closer look at ProductionAbove we’ve reviewed some production comparisons based on work RVUs – the most popular measure of physician productivity in an employed model, according to our 2013 Annual Integration Report. So let’s look at some other measures of physician effort.
Figure D1 shows a 3-year trend of Total RVUs per full time cardiologist, split between private and integrated groups and then also listing the blended median. First of note is that both private and integrated groups experienced a degradation in Total RVUs from 2011 to 2012. What’s also noteworthy is the significant gap between these two groups in terms of per FTE production. From above we remember that integrated physicians are also producing less work RVUs than their private counterparts, but here the gap widens.
Since Total RVUs include values for the technical side of testing (the facility side) and since a significant portion (over half) of integrated groups move testing to the hospital side, it is logical to see this chasm. Medicare and, to a large extent all other third party payors, base practice reimbursement on total RVUs. This then explains the delta in patient services revenue between the two groups that we saw back on Figure B6.
22 M e d A x i o M P H Y S i C i A N C o M P e N S AT i o N & P R o d U C T i o N S U R V e Y – 2 0 1 3
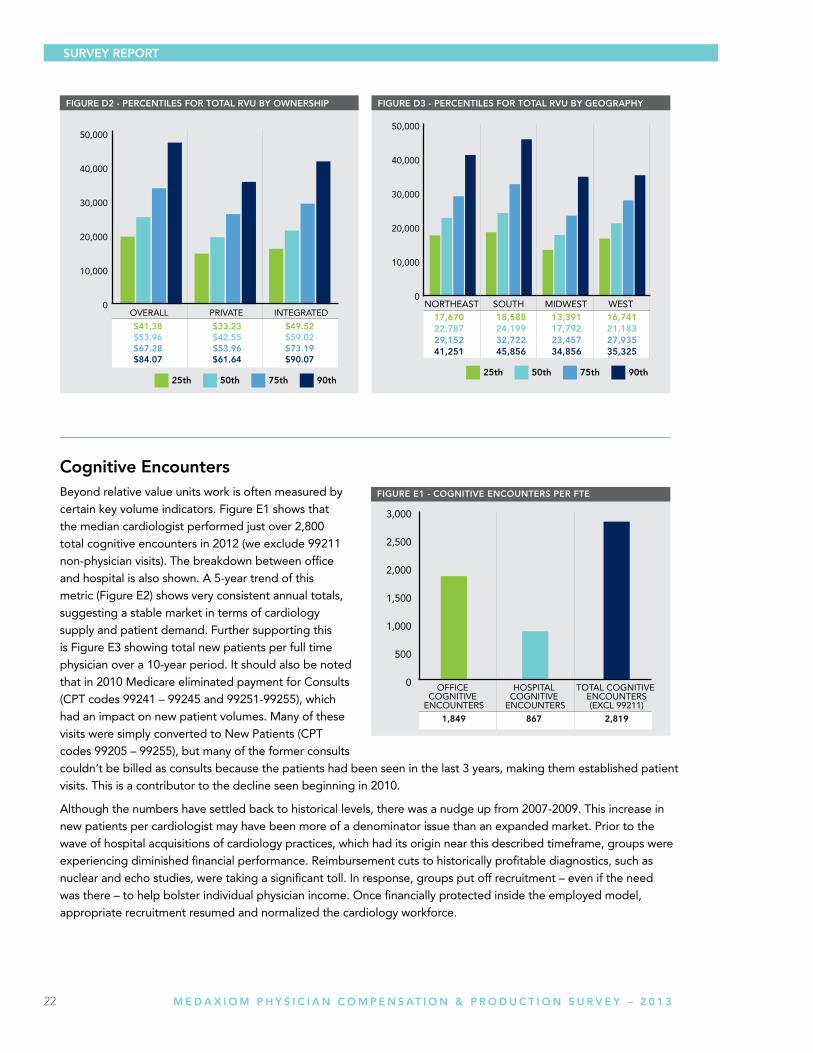
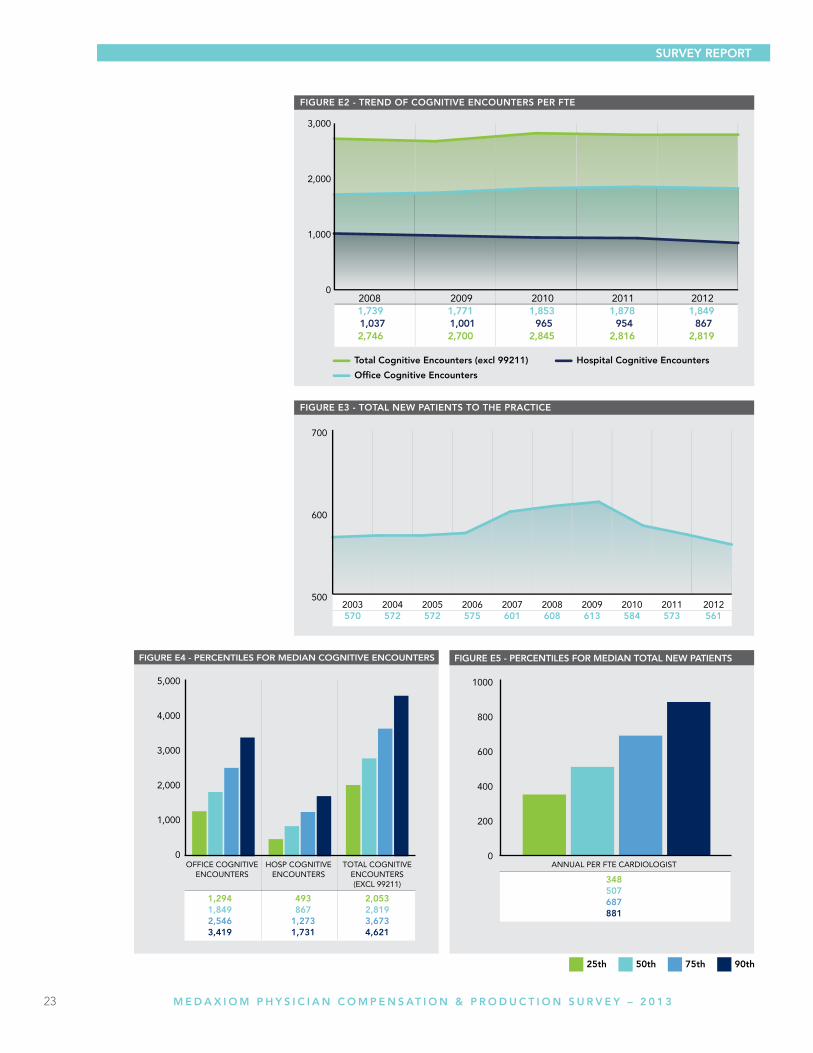
Cognitive encountersBeyond relative value units work is often measured by certain key volume indicators. Figure E1 shows that the median cardiologist performed just over 2,800 total cognitive encounters in 2012 (we exclude 99211 non-physician visits). The breakdown between office and hospital is also shown. A 5-year trend of this metric (Figure E2) shows very consistent annual totals, suggesting a stable market in terms of cardiology supply and patient demand. Further supporting this is Figure E3 showing total new patients per full time physician over a 10-year period. It should also be noted that in 2010 Medicare eliminated payment for Consults (CPT codes 99241 – 99245 and 99251-99255), which had an impact on new patient volumes. Many of these visits were simply converted to New Patients (CPT codes 99205 – 99255), but many of the former consults couldn’t be billed as consults because the patients had been seen in the last 3 years, making them established patient visits. This is a contributor to the decline seen beginning in 2010.
Although the numbers have settled back to historical levels, there was a nudge up from 2007-2009. This increase in new patients per cardiologist may have been more of a denominator issue than an expanded market. Prior to the wave of hospital acquisitions of cardiology practices, which had its origin near this described timeframe, groups were experiencing diminished financial performance. Reimbursement cuts to historically profitable diagnostics, such as nuclear and echo studies, were taking a significant toll. In response, groups put off recruitment – even if the need was there – to help bolster individual physician income. Once financially protected inside the employed model, appropriate recruitment resumed and normalized the cardiology workforce.
SuRVeY RePORt
23 M e d A x i o M P H Y S i C i A N C o M P e N S AT i o N & P R o d U C T i o N S U R V e Y – 2 0 1 3
SuRVeY RePORt
24 M e d A x i o M P H Y S i C i A N C o M P e N S AT i o N & P R o d U C T i o N S U R V e Y – 2 0 1 3
SuRVeY RePORt
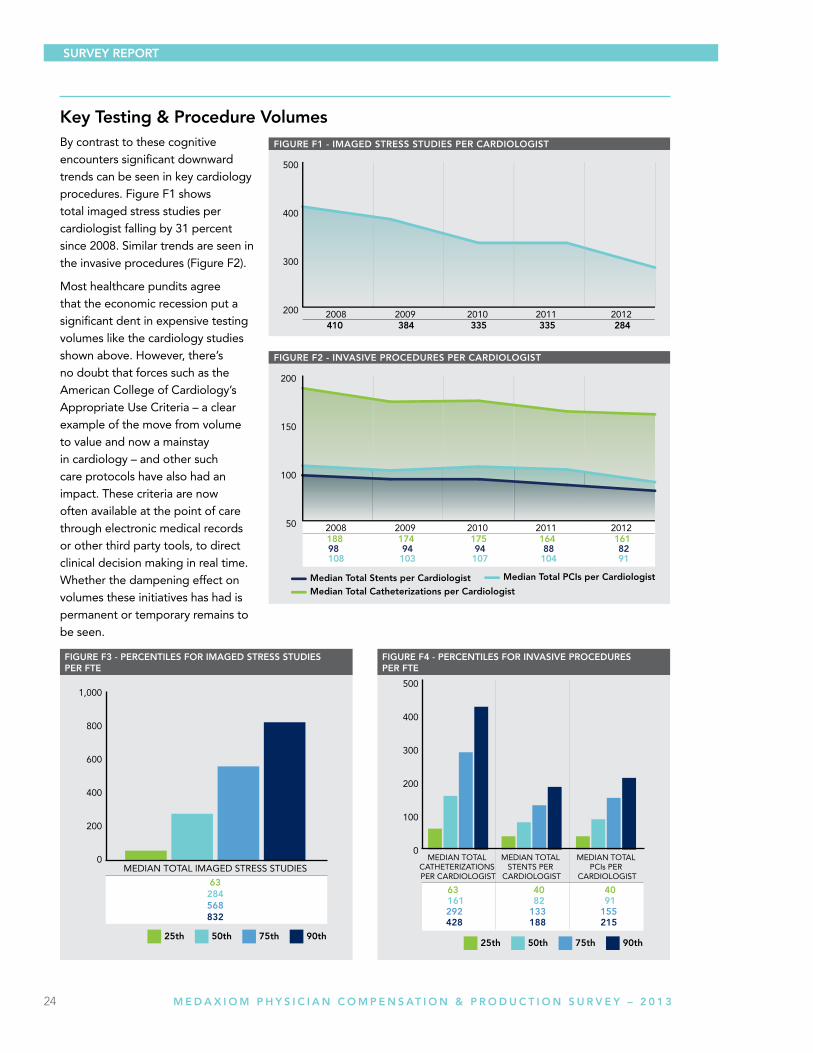
Key testing & Procedure VolumesBy contrast to these cognitive encounters significant downward trends can be seen in key cardiology procedures. Figure F1 shows total imaged stress studies per cardiologist falling by 31 percent since 2008. Similar trends are seen in the invasive procedures (Figure F2).
Most healthcare pundits agree that the economic recession put a significant dent in expensive testing volumes like the cardiology studies shown above. However, there’s no doubt that forces such as the American College of Cardiology’s Appropriate Use Criteria – a clear example of the move from volume to value and now a mainstay in cardiology – and other such care protocols have also had an impact. These criteria are now often available at the point of care through electronic medical records or other third party tools, to direct clinical decision making in real time. Whether the dampening effect on volumes these initiatives has had is permanent or temporary remains to be seen.

25 M e d A x i o M P H Y S i C i A N C o M P e N S AT i o N & P R o d U C T i o N S U R V e Y – 2 0 1 3
Executive Management, Operational & Financial Search
Vision Objectivity Insight Integrity Excellence
Gregory Schultz, Managing DirectorPhone: 269.207.0656
email: [email protected]
A ProuD PArtner of MeDAxioM
26 M e d A x i o M P H Y S i C i A N C o M P e N S AT i o N & P R o d U C T i o N S U R V e Y – 2 0 1 3
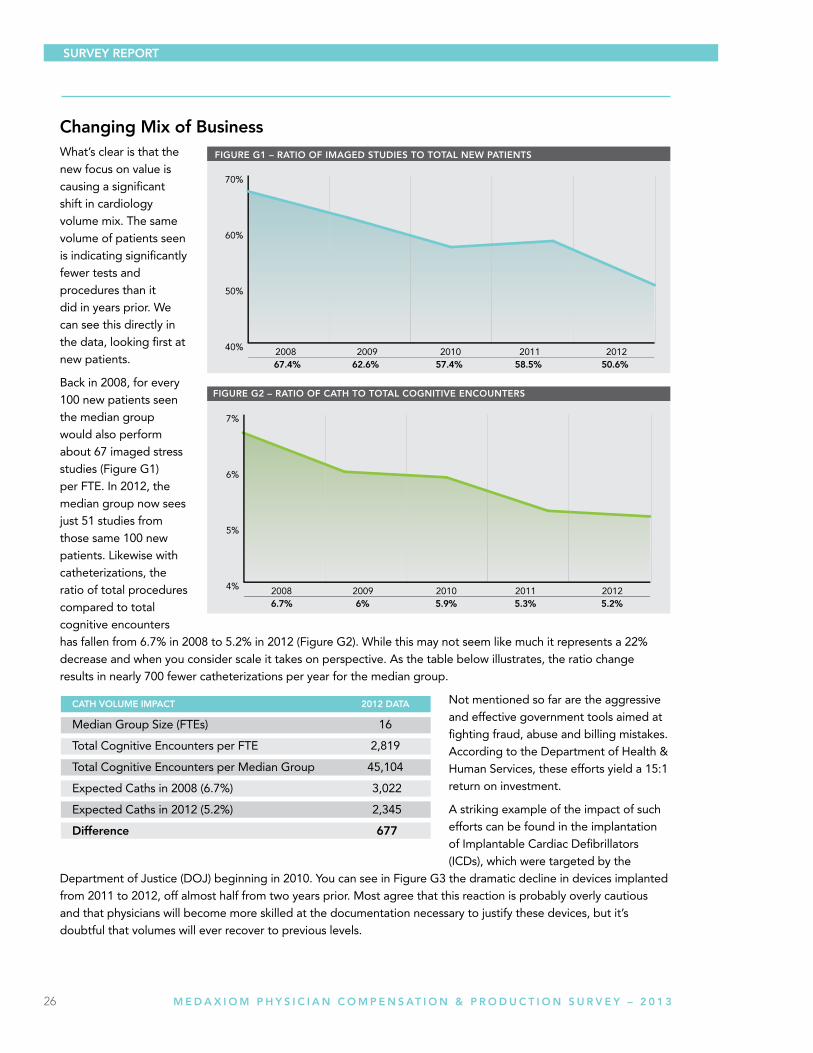
Changing Mix of BusinessWhat’s clear is that the new focus on value is causing a significant shift in cardiology volume mix. The same volume of patients seen is indicating significantly fewer tests and procedures than it did in years prior. We can see this directly in the data, looking first at new patients.
Back in 2008, for every 100 new patients seen the median group would also perform about 67 imaged stress studies (Figure G1) per FTE. In 2012, the median group now sees just 51 studies from those same 100 new patients. Likewise with catheterizations, the ratio of total procedures compared to total cognitive encounters has fallen from 6.7% in 2008 to 5.2% in 2012 (Figure G2). While this may not seem like much it represents a 22% decrease and when you consider scale it takes on perspective. As the table below illustrates, the ratio change results in nearly 700 fewer catheterizations per year for the median group.
Not mentioned so far are the aggressive and effective government tools aimed at fighting fraud, abuse and billing mistakes. According to the Department of Health & Human Services, these efforts yield a 15:1 return on investment.
A striking example of the impact of such efforts can be found in the implantation of Implantable Cardiac Defibrillators (ICDs), which were targeted by the
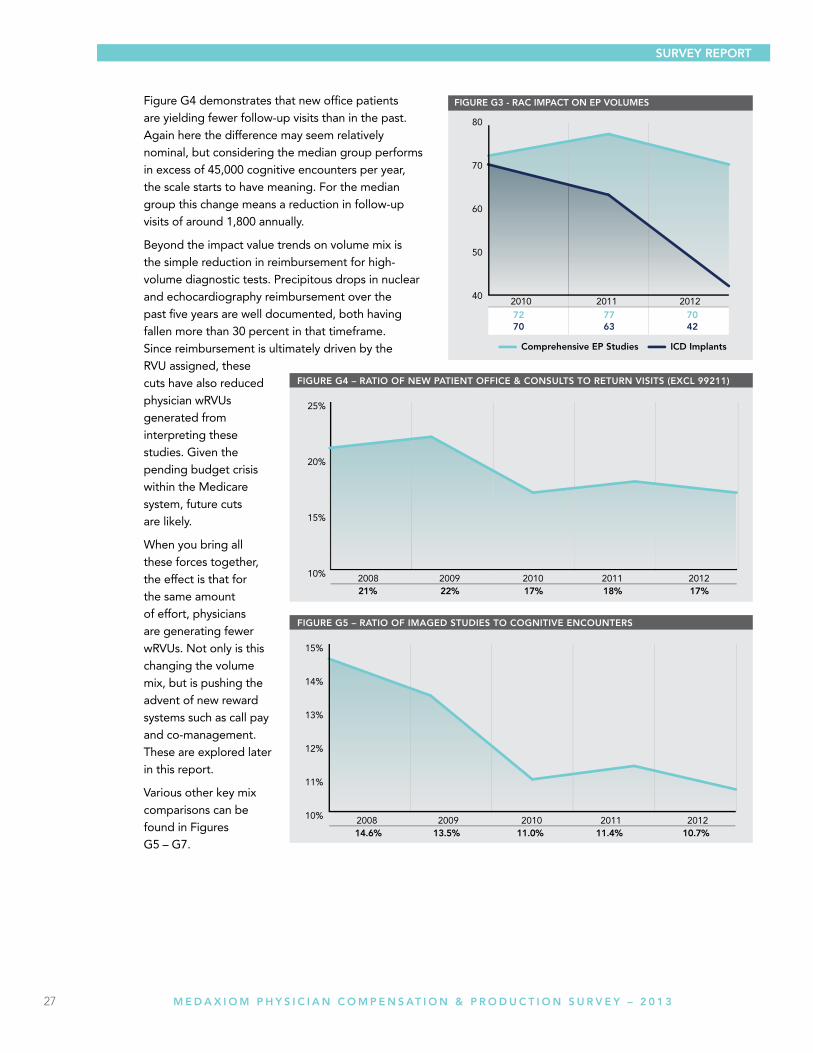
Department of Justice (DOJ) beginning in 2010. You can see in Figure G3 the dramatic decline in devices implanted from 2011 to 2012, off almost half from two years prior. Most agree that this reaction is probably overly cautious and that physicians will become more skilled at the documentation necessary to justify these devices, but it’s doubtful that volumes will ever recover to previous levels.
CAtH VOluMe iMPACt 2012 DAtA
Median Group Size (FTEs) 16
Total Cognitive Encounters per FTE 2,819
Total Cognitive Encounters per Median Group 45,104
Expected Caths in 2008 (6.7%) 3,022
Expected Caths in 2012 (5.2%) 2,345
Difference 677
SuRVeY RePORt
27 M e d A x i o M P H Y S i C i A N C o M P e N S AT i o N & P R o d U C T i o N S U R V e Y – 2 0 1 3
Figure G4 demonstrates that new office patients are yielding fewer follow-up visits than in the past. Again here the difference may seem relatively nominal, but considering the median group performs in excess of 45,000 cognitive encounters per year, the scale starts to have meaning. For the median group this change means a reduction in follow-up visits of around 1,800 annually.
Beyond the impact value trends on volume mix is the simple reduction in reimbursement for high-volume diagnostic tests. Precipitous drops in nuclear and echocardiography reimbursement over the past five years are well documented, both having fallen more than 30 percent in that timeframe. Since reimbursement is ultimately driven by the RVU assigned, these cuts have also reduced physician wRVUs generated from interpreting these studies. Given the pending budget crisis within the Medicare system, future cuts are likely.
When you bring all these forces together, the effect is that for the same amount of effort, physicians are generating fewer wRVUs. Not only is this changing the volume mix, but is pushing the advent of new reward systems such as call pay and co-management. These are explored later in this report.
Various other key mix comparisons can be found in Figures G5 – G7.
SuRVeY RePORt

28 M e d A x i o M P H Y S i C i A N C o M P e N S AT i o N & P R o d U C T i o N S U R V e Y – 2 0 1 3
SuRVeY RePORt

29 M e d A x i o M P H Y S i C i A N C o M P e N S AT i o N & P R o d U C T i o N S U R V e Y – 2 0 1 3
30 M e d A x i o M P H Y S i C i A N C o M P e N S AT i o N & P R o d U C T i o N S U R V e Y – 2 0 1 3
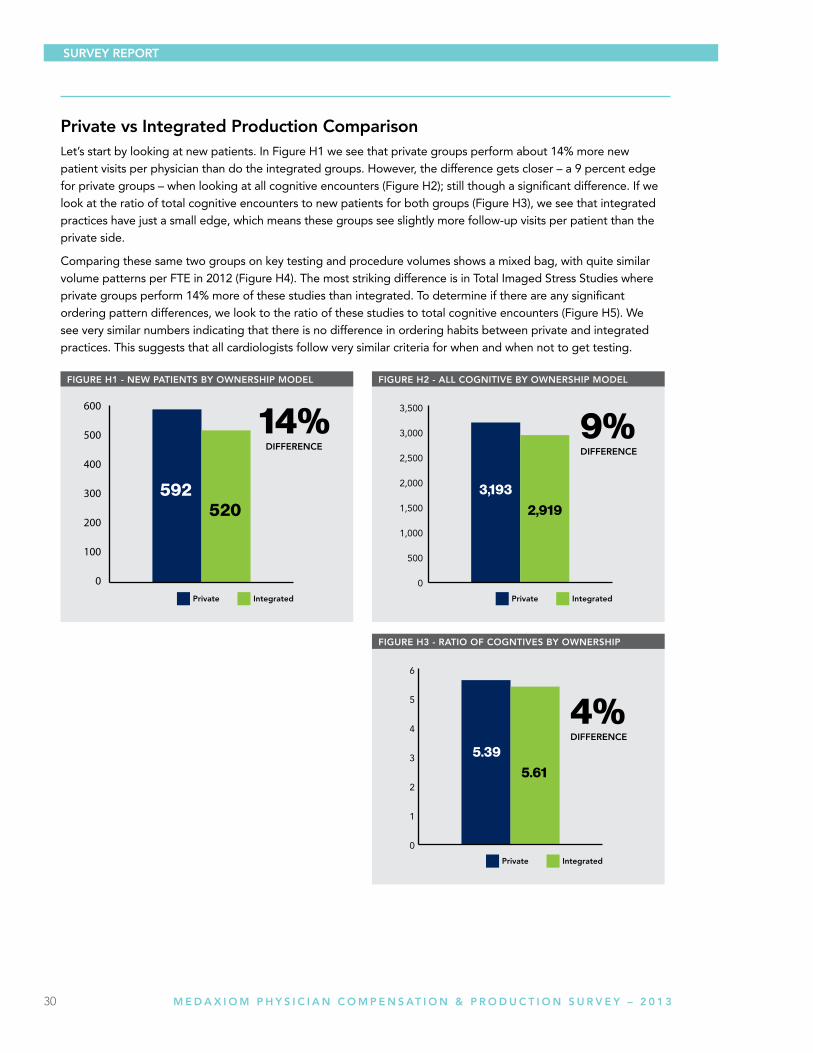
Private vs integrated Production ComparisonLet’s start by looking at new patients. In Figure H1 we see that private groups perform about 14% more new patient visits per physician than do the integrated groups. However, the difference gets closer – a 9 percent edge for private groups – when looking at all cognitive encounters (Figure H2); still though a significant difference. If we look at the ratio of total cognitive encounters to new patients for both groups (Figure H3), we see that integrated practices have just a small edge, which means these groups see slightly more follow-up visits per patient than the private side.
Comparing these same two groups on key testing and procedure volumes shows a mixed bag, with quite similar volume patterns per FTE in 2012 (Figure H4). The most striking difference is in Total Imaged Stress Studies where private groups perform 14% more of these studies than integrated. To determine if there are any significant ordering pattern differences, we look to the ratio of these studies to total cognitive encounters (Figure H5). We see very similar numbers indicating that there is no difference in ordering habits between private and integrated practices. This suggests that all cardiologists follow very similar criteria for when and when not to get testing.
SuRVeY RePORt

31 M e d A x i o M P H Y S i C i A N C o M P e N S AT i o N & P R o d U C T i o N S U R V e Y – 2 0 1 3
SuRVeY RePORt
32 M e d A x i o M P H Y S i C i A N C o M P e N S AT i o N & P R o d U C T i o N S U R V e Y – 2 0 1 3
SuRVeY RePORt
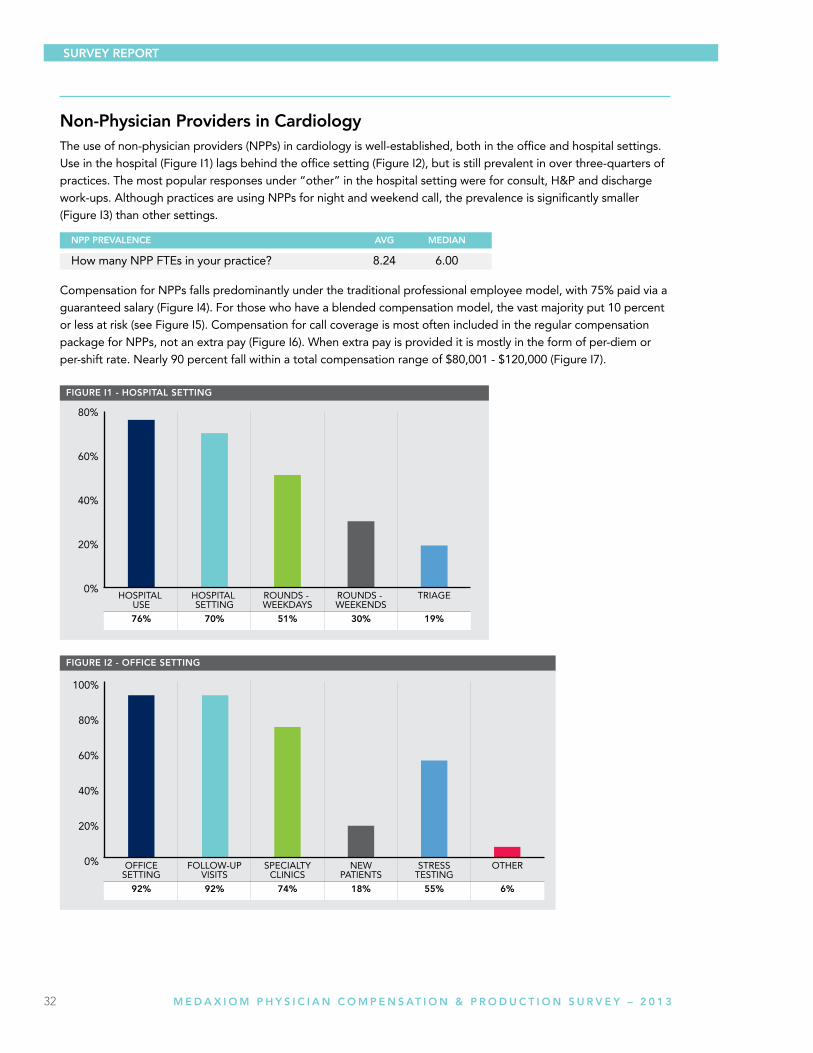
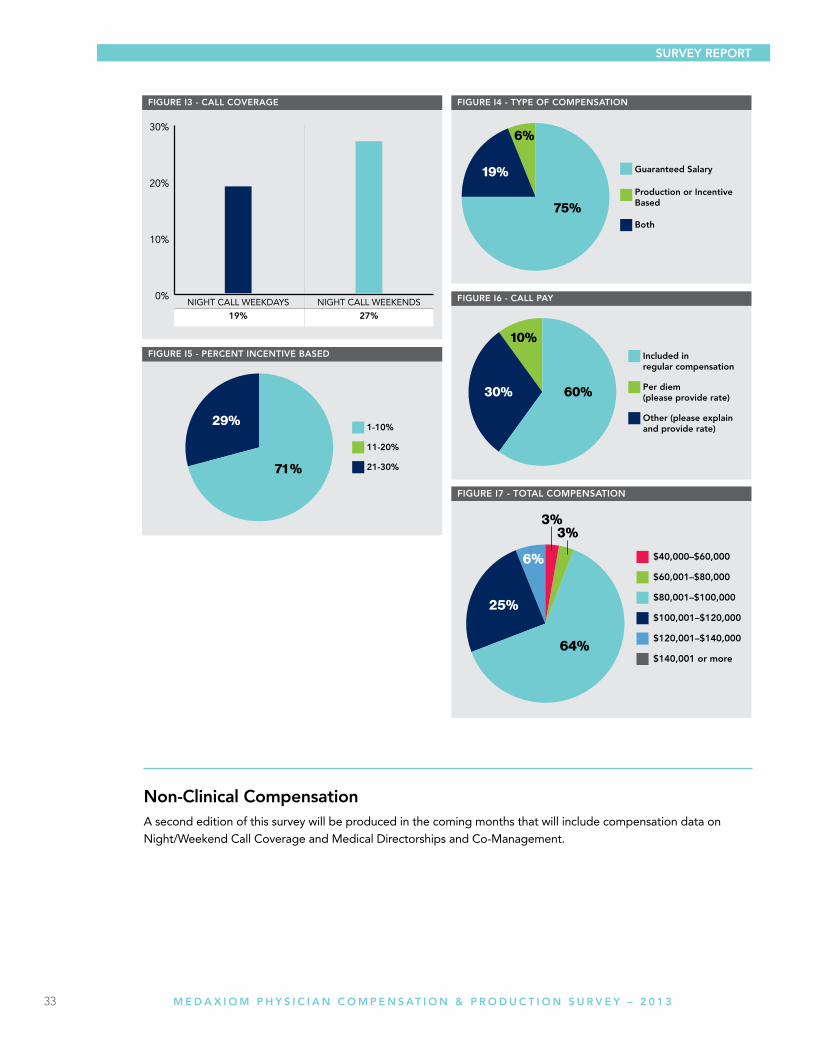
non-Physician Providers in CardiologyThe use of non-physician providers (NPPs) in cardiology is well-established, both in the office and hospital settings. Use in the hospital (Figure I1) lags behind the office setting (Figure I2), but is still prevalent in over three-quarters of practices. The most popular responses under “other” in the hospital setting were for consult, H&P and discharge work-ups. Although practices are using NPPs for night and weekend call, the prevalence is significantly smaller (Figure I3) than other settings.
Compensation for NPPs falls predominantly under the traditional professional employee model, with 75% paid via a guaranteed salary (Figure I4). For those who have a blended compensation model, the vast majority put 10 percent or less at risk (see Figure I5). Compensation for call coverage is most often included in the regular compensation package for NPPs, not an extra pay (Figure I6). When extra pay is provided it is mostly in the form of per-diem or per-shift rate. Nearly 90 percent fall within a total compensation range of $80,001 - $120,000 (Figure I7).
nPP PReVAlenCe AVg MeDiAn
How many NPP FTEs in your practice? 8.24 6.00
33 M e d A x i o M P H Y S i C i A N C o M P e N S AT i o N & P R o d U C T i o N S U R V e Y – 2 0 1 3
non-Clinical CompensationA second edition of this survey will be produced in the coming months that will include compensation data on Night/Weekend Call Coverage and Medical Directorships and Co-Management.
SuRVeY RePORt
34 M e d A x i o M P H Y S i C i A N C o M P e N S AT i o N & P R o d U C T i o N S U R V e Y – 2 0 1 3
tABleS
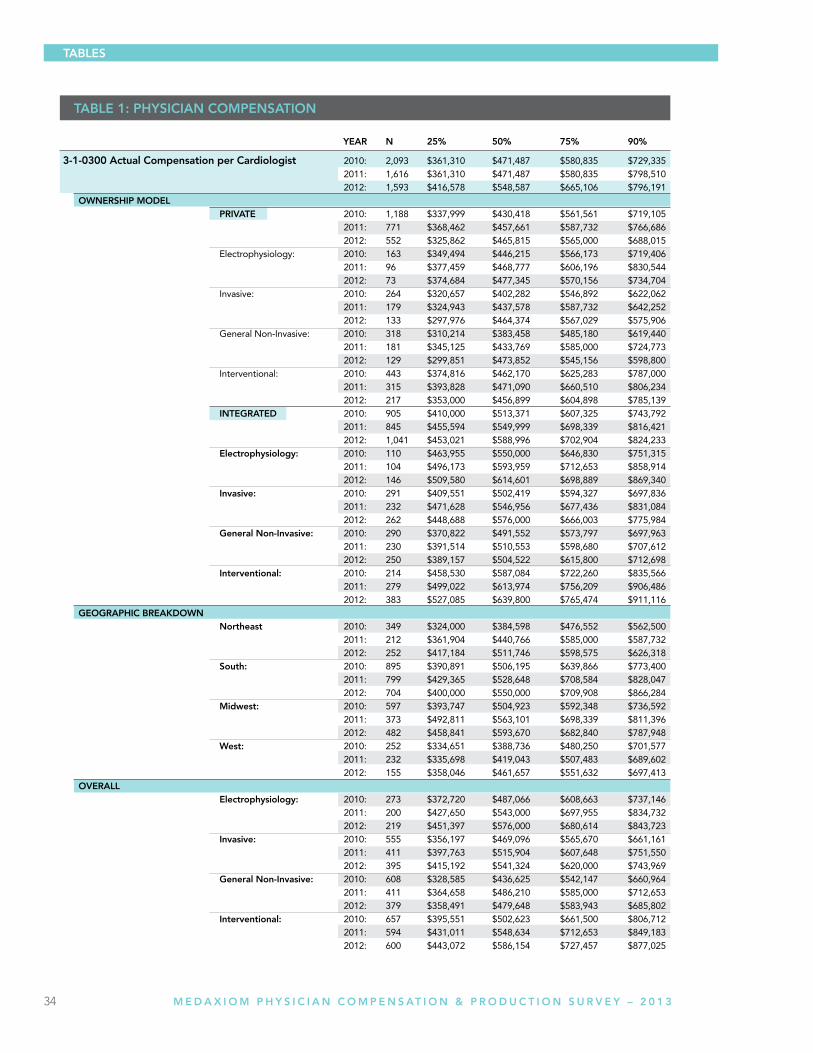
tABle 1: PHYSiCiAn COMPenSAtiOn
YeAR n 25% 50% 75% 90%
3-1-0300 Actual Compensation per Cardiologist 2010: 2,093 $361,310 $471,487 $580,835 $729,335 2011: 1,616 $361,310 $471,487 $580,835 $798,510 2012: 1,593 $416,578 $548,587 $665,106 $796,191 OWneRSHiP MODel PRiVAte 2010: 1,188 $337,999 $430,418 $561,561 $719,105 2011: 771 $368,462 $457,661 $587,732 $766,686 2012: 552 $325,862 $465,815 $565,000 $688,015 Electrophysiology: 2010: 163 $349,494 $446,215 $566,173 $719,406 2011: 96 $377,459 $468,777 $606,196 $830,544 2012: 73 $374,684 $477,345 $570,156 $734,704 Invasive: 2010: 264 $320,657 $402,282 $546,892 $622,062 2011: 179 $324,943 $437,578 $587,732 $642,252 2012: 133 $297,976 $464,374 $567,029 $575,906 General Non-Invasive: 2010: 318 $310,214 $383,458 $485,180 $619,440 2011: 181 $345,125 $433,769 $585,000 $724,773 2012: 129 $299,851 $473,852 $545,156 $598,800 Interventional: 2010: 443 $374,816 $462,170 $625,283 $787,000 2011: 315 $393,828 $471,090 $660,510 $806,234 2012: 217 $353,000 $456,899 $604,898 $785,139 integRAteD 2010: 905 $410,000 $513,371 $607,325 $743,792 2011: 845 $455,594 $549,999 $698,339 $816,421 2012: 1,041 $453,021 $588,996 $702,904 $824,233 electrophysiology: 2010: 110 $463,955 $550,000 $646,830 $751,315 2011: 104 $496,173 $593,959 $712,653 $858,914 2012: 146 $509,580 $614,601 $698,889 $869,340 invasive: 2010: 291 $409,551 $502,419 $594,327 $697,836 2011: 232 $471,628 $546,956 $677,436 $831,084 2012: 262 $448,688 $576,000 $666,003 $775,984 general non-invasive: 2010: 290 $370,822 $491,552 $573,797 $697,963 2011: 230 $391,514 $510,553 $598,680 $707,612 2012: 250 $389,157 $504,522 $615,800 $712,698 interventional: 2010: 214 $458,530 $587,084 $722,260 $835,566 2011: 279 $499,022 $613,974 $756,209 $906,486 2012: 383 $527,085 $639,800 $765,474 $911,116 geOgRAPHiC BReAKDOWn northeast 2010: 349 $324,000 $384,598 $476,552 $562,500 2011: 212 $361,904 $440,766 $585,000 $587,732 2012: 252 $417,184 $511,746 $598,575 $626,318 South: 2010: 895 $390,891 $506,195 $639,866 $773,400 2011: 799 $429,365 $528,648 $708,584 $828,047 2012: 704 $400,000 $550,000 $709,908 $866,284 Midwest: 2010: 597 $393,747 $504,923 $592,348 $736,592 2011: 373 $492,811 $563,101 $698,339 $811,396 2012: 482 $458,841 $593,670 $682,840 $787,948 West: 2010: 252 $334,651 $388,736 $480,250 $701,577 2011: 232 $335,698 $419,043 $507,483 $689,602 2012: 155 $358,046 $461,657 $551,632 $697,413 OVeRAll electrophysiology: 2010: 273 $372,720 $487,066 $608,663 $737,146 2011: 200 $427,650 $543,000 $697,955 $834,732 2012: 219 $451,397 $576,000 $680,614 $843,723 invasive: 2010: 555 $356,197 $469,096 $565,670 $661,161 2011: 411 $397,763 $515,904 $607,648 $751,550 2012: 395 $415,192 $541,324 $620,000 $743,969 general non-invasive: 2010: 608 $328,585 $436,625 $542,147 $660,964 2011: 411 $364,658 $486,210 $585,000 $712,653 2012: 379 $358,491 $479,648 $583,943 $685,802 interventional: 2010: 657 $395,551 $502,623 $661,500 $806,712 2011: 594 $431,011 $548,634 $712,653 $849,183 2012: 600 $443,072 $586,154 $727,457 $877,025
35 M e d A x i o M P H Y S i C i A N C o M P e N S AT i o N & P R o d U C T i o N S U R V e Y – 2 0 1 3
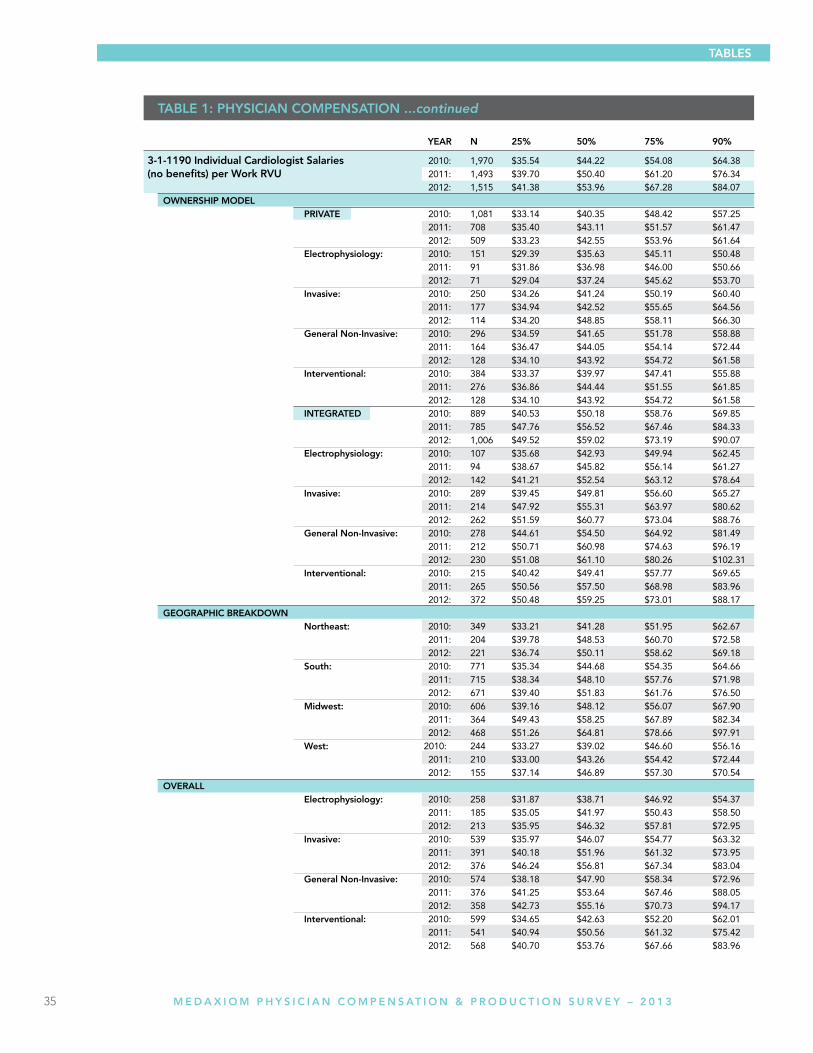
tABle 1: PHYSiCiAn COMPenSAtiOn ...continued
tABleS
YeAR n 25% 50% 75% 90%
3-1-1190 individual Cardiologist Salaries 2010: 1,970 $35.54 $44.22 $54.08 $64.38 (no benefits) per Work RVu 2011: 1,493 $39.70 $50.40 $61.20 $76.34 2012: 1,515 $41.38 $53.96 $67.28 $84.07 OWneRSHiP MODel PRiVAte 2010: 1,081 $33.14 $40.35 $48.42 $57.25 2011: 708 $35.40 $43.11 $51.57 $61.47 2012: 509 $33.23 $42.55 $53.96 $61.64 electrophysiology: 2010: 151 $29.39 $35.63 $45.11 $50.48 2011: 91 $31.86 $36.98 $46.00 $50.66 2012: 71 $29.04 $37.24 $45.62 $53.70 invasive: 2010: 250 $34.26 $41.24 $50.19 $60.40 2011: 177 $34.94 $42.52 $55.65 $64.56 2012: 114 $34.20 $48.85 $58.11 $66.30 general non-invasive: 2010: 296 $34.59 $41.65 $51.78 $58.88 2011: 164 $36.47 $44.05 $54.14 $72.44 2012: 128 $34.10 $43.92 $54.72 $61.58 interventional: 2010: 384 $33.37 $39.97 $47.41 $55.88 2011: 276 $36.86 $44.44 $51.55 $61.85 2012: 128 $34.10 $43.92 $54.72 $61.58 integRAteD 2010: 889 $40.53 $50.18 $58.76 $69.85 2011: 785 $47.76 $56.52 $67.46 $84.33 2012: 1,006 $49.52 $59.02 $73.19 $90.07 electrophysiology: 2010: 107 $35.68 $42.93 $49.94 $62.45 2011: 94 $38.67 $45.82 $56.14 $61.27 2012: 142 $41.21 $52.54 $63.12 $78.64 invasive: 2010: 289 $39.45 $49.81 $56.60 $65.27 2011: 214 $47.92 $55.31 $63.97 $80.62 2012: 262 $51.59 $60.77 $73.04 $88.76 general non-invasive: 2010: 278 $44.61 $54.50 $64.92 $81.49 2011: 212 $50.71 $60.98 $74.63 $96.19 2012: 230 $51.08 $61.10 $80.26 $102.31 interventional: 2010: 215 $40.42 $49.41 $57.77 $69.65 2011: 265 $50.56 $57.50 $68.98 $83.96 2012: 372 $50.48 $59.25 $73.01 $88.17 geOgRAPHiC BReAKDOWn northeast: 2010: 349 $33.21 $41.28 $51.95 $62.67 2011: 204 $39.78 $48.53 $60.70 $72.58 2012: 221 $36.74 $50.11 $58.62 $69.18 South: 2010: 771 $35.34 $44.68 $54.35 $64.66 2011: 715 $38.34 $48.10 $57.76 $71.98 2012: 671 $39.40 $51.83 $61.76 $76.50 Midwest: 2010: 606 $39.16 $48.12 $56.07 $67.90 2011: 364 $49.43 $58.25 $67.89 $82.34 2012: 468 $51.26 $64.81 $78.66 $97.91 West: 2010: 244 $33.27 $39.02 $46.60 $56.16 2011: 210 $33.00 $43.26 $54.42 $72.44 2012: 155 $37.14 $46.89 $57.30 $70.54 OVeRAll electrophysiology: 2010: 258 $31.87 $38.71 $46.92 $54.37 2011: 185 $35.05 $41.97 $50.43 $58.50 2012: 213 $35.95 $46.32 $57.81 $72.95 invasive: 2010: 539 $35.97 $46.07 $54.77 $63.32 2011: 391 $40.18 $51.96 $61.32 $73.95 2012: 376 $46.24 $56.81 $67.34 $83.04 general non-invasive: 2010: 574 $38.18 $47.90 $58.34 $72.96 2011: 376 $41.25 $53.64 $67.46 $88.05 2012: 358 $42.73 $55.16 $70.73 $94.17 interventional: 2010: 599 $34.65 $42.63 $52.20 $62.01 2011: 541 $40.94 $50.56 $61.32 $75.42 2012: 568 $40.70 $53.76 $67.66 $83.96
36 M e d A x i o M P H Y S i C i A N C o M P e N S AT i o N & P R o d U C T i o N S U R V e Y – 2 0 1 3
tABleS
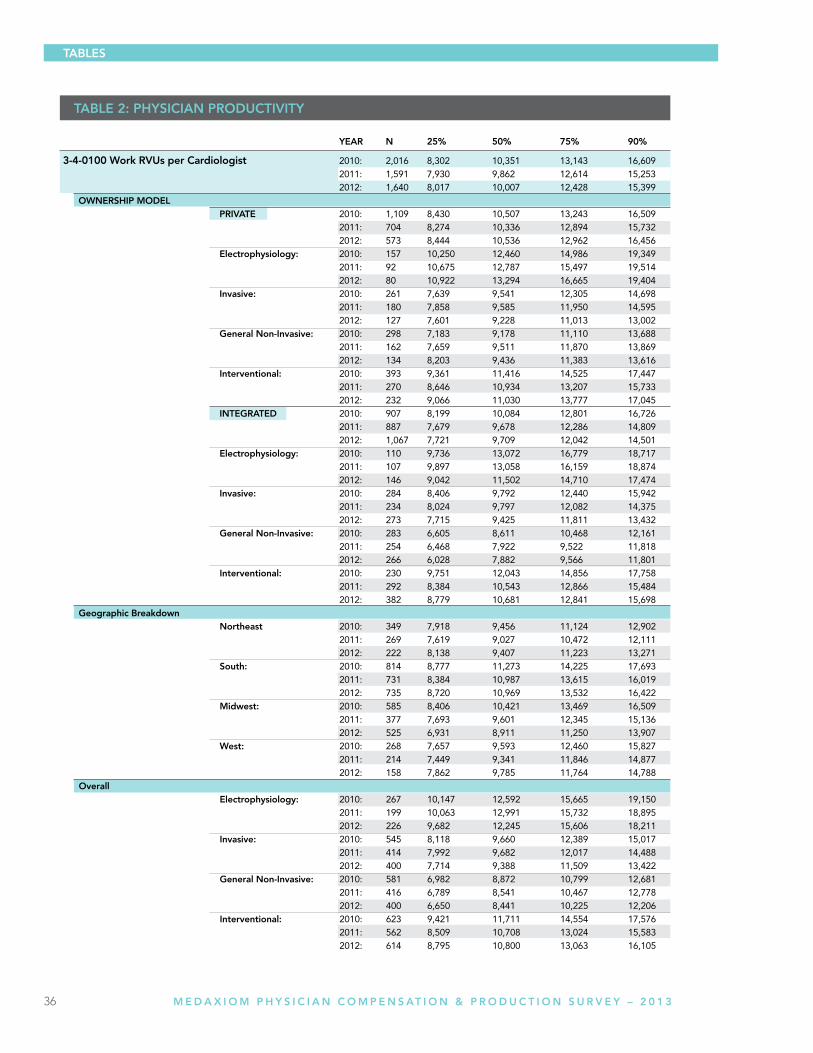
YeAR n 25% 50% 75% 90%
3-4-0100 Work RVus per Cardiologist 2010: 2,016 8,302 10,351 13,143 16,609 2011: 1,591 7,930 9,862 12,614 15,253 2012: 1,640 8,017 10,007 12,428 15,399 OWneRSHiP MODel PRiVAte 2010: 1,109 8,430 10,507 13,243 16,509 2011: 704 8,274 10,336 12,894 15,732 2012: 573 8,444 10,536 12,962 16,456 electrophysiology: 2010: 157 10,250 12,460 14,986 19,349 2011: 92 10,675 12,787 15,497 19,514 2012: 80 10,922 13,294 16,665 19,404 invasive: 2010: 261 7,639 9,541 12,305 14,698 2011: 180 7,858 9,585 11,950 14,595 2012: 127 7,601 9,228 11,013 13,002 general non-invasive: 2010: 298 7,183 9,178 11,110 13,688 2011: 162 7,659 9,511 11,870 13,869 2012: 134 8,203 9,436 11,383 13,616 interventional: 2010: 393 9,361 11,416 14,525 17,447 2011: 270 8,646 10,934 13,207 15,733 2012: 232 9,066 11,030 13,777 17,045 integRAteD 2010: 907 8,199 10,084 12,801 16,726 2011: 887 7,679 9,678 12,286 14,809 2012: 1,067 7,721 9,709 12,042 14,501 electrophysiology: 2010: 110 9,736 13,072 16,779 18,717 2011: 107 9,897 13,058 16,159 18,874 2012: 146 9,042 11,502 14,710 17,474 invasive: 2010: 284 8,406 9,792 12,440 15,942 2011: 234 8,024 9,797 12,082 14,375 2012: 273 7,715 9,425 11,811 13,432 general non-invasive: 2010: 283 6,605 8,611 10,468 12,161 2011: 254 6,468 7,922 9,522 11,818 2012: 266 6,028 7,882 9,566 11,801 interventional: 2010: 230 9,751 12,043 14,856 17,758 2011: 292 8,384 10,543 12,866 15,484 2012: 382 8,779 10,681 12,841 15,698 geographic Breakdown northeast 2010: 349 7,918 9,456 11,124 12,902 2011: 269 7,619 9,027 10,472 12,111 2012: 222 8,138 9,407 11,223 13,271 South: 2010: 814 8,777 11,273 14,225 17,693 2011: 731 8,384 10,987 13,615 16,019 2012: 735 8,720 10,969 13,532 16,422 Midwest: 2010: 585 8,406 10,421 13,469 16,509 2011: 377 7,693 9,601 12,345 15,136 2012: 525 6,931 8,911 11,250 13,907 West: 2010: 268 7,657 9,593 12,460 15,827 2011: 214 7,449 9,341 11,846 14,877 2012: 158 7,862 9,785 11,764 14,788 Overall electrophysiology: 2010: 267 10,147 12,592 15,665 19,150 2011: 199 10,063 12,991 15,732 18,895 2012: 226 9,682 12,245 15,606 18,211 invasive: 2010: 545 8,118 9,660 12,389 15,017 2011: 414 7,992 9,682 12,017 14,488 2012: 400 7,714 9,388 11,509 13,422 general non-invasive: 2010: 581 6,982 8,872 10,799 12,681 2011: 416 6,789 8,541 10,467 12,778 2012: 400 6,650 8,441 10,225 12,206 interventional: 2010: 623 9,421 11,711 14,554 17,576 2011: 562 8,509 10,708 13,024 15,583 2012: 614 8,795 10,800 13,063 16,105
tABle 2: PHYSiCiAn PRODuCtiVitY
37 M e d A x i o M P H Y S i C i A N C o M P e N S AT i o N & P R o d U C T i o N S U R V e Y – 2 0 1 3
tABleS
YeAR n 25% 50% 75% 90%
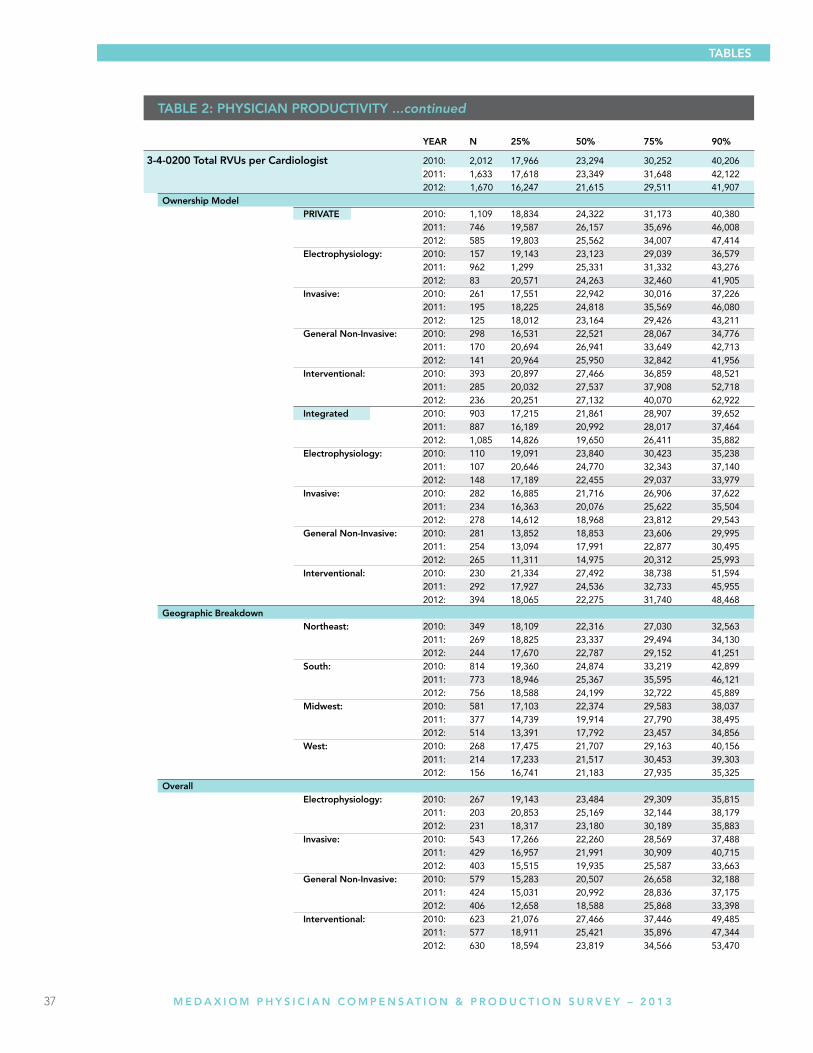
3-4-0200 total RVus per Cardiologist 2010: 2,012 17,966 23,294 30,252 40,206 2011: 1,633 17,618 23,349 31,648 42,122 2012: 1,670 16,247 21,615 29,511 41,907 Ownership Model PRiVAte 2010: 1,109 18,834 24,322 31,173 40,380 2011: 746 19,587 26,157 35,696 46,008 2012: 585 19,803 25,562 34,007 47,414 electrophysiology: 2010: 157 19,143 23,123 29,039 36,579 2011: 96 2 1,299 25,331 31,332 43,276 2012: 83 20,571 24,263 32,460 41,905 invasive: 2010: 261 17,551 22,942 30,016 37,226 2011: 195 18,225 24,818 35,569 46,080 2012: 125 18,012 23,164 29,426 43,211 general non-invasive: 2010: 298 16,531 22,521 28,067 34,776 2011: 170 20,694 26,941 33,649 42,713 2012: 141 20,964 25,950 32,842 41,956 interventional: 2010: 393 20,897 27,466 36,859 48,521 2011: 285 20,032 27,537 37,908 52,718 2012: 236 20,251 27,132 40,070 62,922 integrated 2010: 903 17,215 21,861 28,907 39,652 2011: 887 16,189 20,992 28,017 37,464 2012: 1,085 14,826 19,650 26,411 35,882 electrophysiology: 2010: 110 19,091 23,840 30,423 35,238 2011: 107 20,646 24,770 32,343 37,140 2012: 148 17,189 22,455 29,037 33,979 invasive: 2010: 282 16,885 21,716 26,906 37,622 2011: 234 16,363 20,076 25,622 35,504 2012: 278 14,612 18,968 23,812 29,543 general non-invasive: 2010: 281 13,852 18,853 23,606 29,995 2011: 254 13,094 17,991 22,877 30,495 2012: 265 11,311 14,975 20,312 25,993 interventional: 2010: 230 21,334 27,492 38,738 51,594 2011: 292 17,927 24,536 32,733 45,955 2012: 394 18,065 22,275 31,740 48,468 geographic Breakdown northeast: 2010: 349 18,109 22,316 27,030 32,563 2011: 269 18,825 23,337 29,494 34,130 2012: 244 17,670 22,787 29,152 41,251 South: 2010: 814 19,360 24,874 33,219 42,899 2011: 773 18,946 25,367 35,595 46,121 2012: 756 18,588 24,199 32,722 45,889 Midwest: 2010: 581 17,103 22,374 29,583 38,037 2011: 377 14,739 19,914 27,790 38,495 2012: 514 13,391 17,792 23,457 34,856 West: 2010: 268 17,475 21,707 29,163 40,156 2011: 214 17,233 21,517 30,453 39,303 2012: 156 16,741 21,183 27,935 35,325 Overall electrophysiology: 2010: 267 19,143 23,484 29,309 35,815 2011: 203 20,853 25,169 32,144 38,179 2012: 231 18,317 23,180 30,189 35,883 invasive: 2010: 543 17,266 22,260 28,569 37,488 2011: 429 16,957 21,991 30,909 40,715 2012: 403 15,515 19,935 25,587 33,663 general non-invasive: 2010: 579 15,283 20,507 26,658 32,188 2011: 424 15,031 20,992 28,836 37,175 2012: 406 12,658 18,588 25,868 33,398 interventional: 2010: 623 21,076 27,466 37,446 49,485 2011: 577 18,911 25,421 35,896 47,344 2012: 630 18,594 23,819 34,566 53,470
tABle 2: PHYSiCiAn PRODuCtiVitY ...continued
38 M e d A x i o M P H Y S i C i A N C o M P e N S AT i o N & P R o d U C T i o N S U R V e Y – 2 0 1 3
tABleS
YeAR n 25% 50% 75% 90%
1-3-0200 Office Cognitive encounters per Cardiologist 2010: 2,004 1,348 1,853 2,518 3,297 2011: 1,609 1,361 1,878 2,692 3,590 2012: 1,726 1,294 1,849 2,546 3,419
1-3-0220 Office Cognitive encounters in thousands 2010: 2,036 1.35 1.87 2.56 3.46 per Cardiologist 2011: 1,643 1.32 1.86 2.67 3.56 2012: 1,748 1.30 1.86 2.57 3.48
1-3-0500 Hospital Cognitive encounters per Cardiologist 2010: 2,012 606 965 1,447 1,962 2011: 1,634 569 954 1,420 1,958 2012: 1,709 493 867 1,273 1,731
1-3-0555 total Connitive encounters (Office + Hospital) 2010: 1,919 2,122 2,845 3,680 4,549 -99211 per Cardiologist 2011: 1,597 2,011 2,816 3,705 4,710 2012: 1,690 2,053 2,819 3,673 4,621
1-6-0500 total imaged Stress Studies per Cardiologist 2010: 1,820 85 335 611 943 2011: 1,445 96 335 613 870 2012: 1,504 63 284 568 832
1-2-1250 total Catheterizations per Cardiologist 2010: 1,484 73 175 308 442 2011: 1,206 69 164 295 417 2012: 1,254 63 161 292 428
1-2-1400 Stents per Cardiologist 2010: 902 43 94 151 222 2011: 694 43 88 137 192 2012: 754 40 82 133 188
1-2-1800 PCis per Cardiologist 2010: 917 45 107 173 259 2011: 701 49 104 162 228 2012: 774 40 91 155 215
1-2-2050 Comprehensive eP Studies per Cardiologist 2010: 284 39 72 121 166 2011: 214 39 77 128 174 2012: 263 34 70 120 173
1-2-2100 iCDs per Cardiologist 2010: 389 22 70 106 140 2011: 307 24 63 98 123 2012: 323 18 42 62 82
1-4-0100 Ratio of new Office Visits + Consults to 2010: 2,031 12% 17% 25% 36% Return Visits -99211 2011: 1,635 12% 18% 26% 38% 2012: 1,744 12% 17% 25% 36%
1-4-0400 Ratio of Cath to new Patients to the Practice 2010: 1,484 13% 32% 59% 107% 2011: 1,193 12% 30% 57% 98% 2012: 1,256 11% 29% 57% 105%
1-4-0560 Ratio of Cath to Outpatient imaged Stress Studies 2010: 1,106 28% 60% 155% 414% 2011: 834 26% 58% 140% 381% 2012: 800 25% 54% 120% 364%
1-4-1400 Ratio of total imaged Stress Studies to 2010: 1,818 3.50% 11.00% 19.60% 30.30% total Cognitive encounters - 99211 2011: 1,443 3.90% 11.40% 19.60% 31.90% 2012: 1,453 3.00% 10.70% 18.30% 30.00%
1-4-1700 Ratio of total Catheterizations to 2010: 1,483 2.40% 5.90% 10.80% 18.40% total Cognitive encounters - 99211 2011: 1,204 2.40% 5.30% 10.90% 18.70% 2012: 1,252 2.20% 5.20% 10.40% 17.80%
1-4-1800 Ratio of PCis to total Cognitive encounters - 99211 2010: 893 1.56% 3.66% 6.44% 11.12% 2011: 678 1.67% 3.66% 6.65% 10.75% 2012: 777 1.15% 3.31% 6.02% 9.63%
1-4-1900 Ratio of Stents to total Cognitive encounters - 99211 2010: 896 1.51% 3.29% 5.70% 9.68% 2011: 684 1.44% 3.09% 5.62% 9.03% 2012: 738 1.41% 3.09% 5.36% 8.94%
1-4-2100 Ratio of iCD implants to total Cognitive 2010: 389 0.72% 2.92% 5.14% 7.04% encounters - 99211 2011: 306 0.74% 2.54% 4.47% 7.14% 2012: 316 0.77% 1.82% 2.91% 4.45%
OtHeR PRODuCtiVitY MeASuReS
40 M e d A x i o M P H Y S i C i A N C o M P e N S AT i o N & P R o d U C T i o N S U R V e Y – 2 0 1 3
A COllABORAtiVe BuSineSS MODel As part of the MedAxiom network, you’ll have access to the cumulative knowledge and purchasing and legislative power of hundreds of cardiology practices. Our members possess extraordinary levels of experience, expertise and passion for what they do. They also have an uncommon dedication to continuous improvement and to sharing their experiences with others.
Our members enjoy participation in email-based discussion forums, key initiative work groups, trend surveys and analysis, specialty meetings and conferences, educational webcasts and more.
As our networks continue to grow, our services continue to expand to support this growth. Every practice has different needs depending on its stage of development and outlook on continuous improvement. No matter what stage your practice is at, MedAxiom offers different levels of engagement and different products and services to meet those needs.
MedAxiom memberships and service opportunities include:
•CardiologyPracticeNetwork •BusinessOfficeandCodingNetwork •PracticeImprovementStrategiesandConsultingServices •MedWorkflow-ProcessRedesignServices •MedSatisfactionSurveySuite •CardiosourcePlusforPractices
BuSineSS iMPROVeMent & tOOlS ARe nOW MORe iMPORtAnt tHAn eVeR MedAxiom understands the power of sharing knowledge and optimizing resources in today’s competitive healthcare market. That’s just one reason MedAxiom has become the premier resource for cardiology practices to access data, information, and experiences regarding practice development and operational issues. Our systems and member networks allow you to optimize practice resources and dramatically improve business outcomes.
MedAxiom helps practices in:
• Remainingabreastofbusinesstrendsandopportunities • Takingcontrolofpracticeefficiency • Identifyingstrengthsandweaknesses • Makinginformeddecisions • Usingdatatosupportinitiatives • Leveragingstrategicpartnershipsandgrouppurchasingpower • Expandingutilizationofcurrentsystemsandtechnologies • Providingcontinuededucationalopportunities • Creatingapeer-to-peerprofessionalnetworkforbothphysiciansandpracticemanagementexecutives
ABOut MeDAxiOM
ABOut MeDAxiOM
41 M e d A x i o M P H Y S i C i A N C o M P e N S AT i o N & P R o d U C T i o N S U R V e Y – 2 0 1 3
CuStOMizeD BuSineSS RePORtS Cardiology practices need solid data to make the right operational decisions, optimize resources, continuously improve performance and develop a strategy for the future. Objective, measurable information doesn’t lie. It is a crucial indicator of your performance, and evaluating that data is essential to the successful management of your organization.
The MedAxiom cardiology database is the most extensive—and only—one of its kind in the entire industry. It’s been developed by some of the leading cardiology groups in the country. The benchmarking and trending data measure success and failure and give you insight into vital performance improvement opportunities.
BenCHMARKing Our Annual Benchmarking Survey provides benchmarks for virtually all areas of your practice. The nearly 300 data points are graphically represented in terms of current year benchmarks and trends over the past 10 years. Almost all data points are reported per physician FTE to facilitate comparisons between groups of different sizes. Data points cover procedure volumes, E&M coding distribution, revenue, overhead, physician compensation, staffing, expenses, RVU production, physician call, aged A/R, payer mix and others. Many of the data points are used to create ratios for further comparisons.
Departmental reports, such as the Nuclear, Echo and Cath Lab surveys provide some of the drill-down data you need to manage the resource-intensive areas of the practice. Without benchmarking, how do you know if you are managing the throughput in your noninvasive labs? These surveys look at procedure volume, revenue, cost and profit per camera, per physician, per tech and per procedure. Groups that assumed they were very productive have been surprised to find significant room for improvement once they examined their performance compared to others.
We also offer a Salary Survey for all positions in the practice and a Benefits Survey to help you manage your human resources. Additionally, ad hoc surveys are performed using a web-based tool to address questions that arise throughout the year.
Our reports use your data to provide you with a customized analysis of how well your practice is doing on nearly 300 measures. These detailed and customized reports are the key practice-management tools in determining everything from appropriate staffing ratios to expected ROI on product lines and services. Creating these reports on your own would cost tens of thousands of dollars—that’s if you even had access to the data. Our database and custom-report generation can save you thousands of dollars and months of your valuable time. And it delivers all the information you need to be successful.
ABOut MeDAxiOM
42 M e d A x i o M P H Y S i C i A N C o M P e N S AT i o N & P R o d U C T i o N S U R V e Y – 2 0 1 3
tHe MeDAxCeSS 2.0 inteRACtiVe DAtABASe tOOl MedAxcess 2.0 is an interactive database that allows MedAxiom members to query the company’s extensive data resources on demand through a web-based platform. MedAxcess 2.0 is a powerful tool for organizations seeking to review, benchmark and interpret their data. Members can compare themselves against others using over 600 metrics from key areas such as:
• Physicianproductivitycomparisons • Numberofnewpatientvisits • Procedureratios,suchasCath-to-NuclearratioorNuclear-to-OfficeEncountersratio • Procedurevolumes • Revenue,expense,profitandreturnandnumberofstudies • Generalledger • Staffingcomparison • AccountsreceivableandPayermix
graph types include:
• BenchmarkingReports • TrendingReports • ComparisonReports • QuartileReports • TabularReports • Multi-yearReports
You can customize your reports through different filter types including:
• Geographicarea • Numberofphysicians(practicesize) • Physiciancompensationmethodology • Ownershipmodel • EHRandPMSVendors • Andmanymore
MedAxcess 2.0 is an extremely powerful tool that allows you to see how you are performing compared to your peers. Don’t be in the back of the pack, with MedAxcess 2.0 you can ensure you have the information to become a leader and achieve the best results for your organization.
ABOut MeDAxiOM

The MedAxiom member-only 2013 Fall Conference promises to be another exciting and educational agenda filled with ideas on how to address the complex issues all cardiology organizations are facing today. Learn how members are dealing with health care reform, regulatory requirements, pressures on reimbursement and overhead, IT challenges and more. See how our experts, member organizations and industry partners come together to achieve truly extraordinary results for practice optimization.
Our members experience unique value in MedAxiom’s small-group discussions and find that they truly distinguish MedAxiom as a network rather than just another organization. Our conferences make you feel like you’re joining a family instead of getting lost in the crowd, as many members find is the case at other national conferences.
JOin YOuR PeeRS At CARDiOlOgY’S BeSt-in-ClASS MAnAgeMent eDuCAtiOn FORuM!
to register or to learn more go to www.medaxiom.com/fall2013

44 M e d A x i o M P H Y S i C i A N C o M P e N S AT i o N & P R o d U C T i o N S U R V e Y – 2 0 1 3
FOR MORE INFORMATION, GO TOWWW.MEDAXIOM.COM/MAIN/CONSULTING-SERVICES/OR SCAN HERE
Meet tHe MeDAxiOM COnSulting exPeRtS
With decades of cardiology-specific experience in a variety of organizational settings, our efficient consulting team structure delivers successful outcomes and continuous follow-through, allowing us to bring exceptional value to the table.
Denise Brown • VP - BuSineSS intelligenCe SOlutiOnS AnD SeniOR COnSultAnt
Ms.Brownisahealthcareexecutivewithover25yearsofexperienceinhospitalsystemandprivatepracticehealthcareoperations,operationalefficiency,physicianrecruitment,businessdevelopment,marketing,andfacilitiesplanning.DeniseisacertifiedGreenBeltinLeanSigmafromtheJohnsHopkins,CenterforInnovationinQualityPatientCare.
Contact Denise at 904.349.6468 or [email protected]
Joel Sauer • VP - COnSulting
With previous experience as the CEO of what eventually became a large multi-specialty group, Joel brings a wealth of experience in group expansion, acquisition, site development, accountable care networks, transaction details, operational and cultural integration, as well electronic health record transition. Other relevant experiences Joel brings to the table include: strategic planning, joint venture formation, hospital/health system relations, financial analysis, payor contract negotiations, implementing operational efficiencies, and ancillary services creation.
Contact Joel at 260.245.1015 or [email protected]
Katie Willerick • PeRFORMAnCe iMPROVeMent SPeCiAliSt
LeancertifiedandaGreenBeltinSixSigma,KatiehasfacilitatedmanyKaizen(processimprovement)events.Sheisresponsibleforidentifyingandhelpingmanagersdevelopproductivitymetricsfortheirdepartmentaswellasfindingoptimalcomparegroupstobenchmarktheirperformanceagainst.Katiealsobringsexperienceinhospitalintegration,developingmeasuresforCardiovascularservicelines,aswellasperformanceimprovementprojects.
Contact Katie at 269.254.5105 or [email protected]
Ellie Montanino • exeCutiVe ASSiStAnt
With14yearsofexperienceasanExecutiveAssistanttoCEO’s,CFO’sandotherseniorleadership,ElliebringscriticalsupporttotheMedAxiomConsultingteam.Areasofprimaryimportanceincludebusinessengagementsupport,documentdevelopment,conferencespeakercoordination,and eventplanning.AstheMedAxiomConsultingclientliaison,shefacilitatesactivitiesinallstages oftheconsultingprocess,includingschedulingandlogisticsplanningofsitevisitstostructureaproductiveexperience.
Contact ellie at 904.568.6260 or [email protected]
Suzette Jaskie • PReSiDent & CeO
As President & CEO, Ms. Jaskie leads our team of experts with rich experience in strategic planning and program development. An in-demand speaker, Suzette is uniquely qualified on topics such as Hospital and Physician Integration, Strategies, Co-Management, Service Line Development, Physician Compensation, Strategic Planning, Program Development, Performance Management, Operations Efficiency, as well as Governance and Leadership.
Contact Suzette at 904.625.4811 or [email protected]
ABOut MeDAxiOM
45 M e d A x i o M P H Y S i C i A N C o M P e N S AT i o N & P R o d U C T i o N S U R V e Y – 2 0 1 3
Save the Date
August 20-22, 2013Nashville,TN•HuttonHotel
Join us for the latest information and expert insight on the major coding
challenges we face in Cardiology in 2014.
EMAIL MICHELLE SEDER AT [email protected] FOR MORE INFORMATION

www.medaxiom.com
CORPORAte OFFiCe
2050KingsCircleSouth
NeptuneBeach,FL32266
904.249.1880
Fax904.249.1604
provationmedical.com
Complete, Compliant Cardiology Procedure Documentation and Coding
ProVation® MD
ProVation® MD is an intuitive, easy-to-use procedure documentation system designed by clinicians to match the workfl ow and preferences of cardiologists. Its deep medical content and menu-driven interface allow for fast, easy creation of procedure notes with CPT and ICD codes – which makes cardiologists happy and lessens compliance and fi nancial burdens on administrators.
Benefi ts:
^ Improves documentation and coding compliance
^ Increases revenue and reduces costs
^ Streamlines NCDR CathPCI Reporting
^ Helps ensure an easy ICD-10 transition
Inacuracies happen.Make sure they don’t happen to you.
^