Embed Size (px)
Citation preview
Physiology and Evolution ofMethylamine Metabolism across
Methylobacterium extorquens strainsThe Harvard community has made this
article openly available. Please share howthis access benefits you. Your story matters
Citation Nayak, Dipti Dinkar. 2014. Physiology and Evolution of MethylamineMetabolism across Methylobacterium extorquens strains. Doctoraldissertation, Harvard University.
Citable link http://nrs.harvard.edu/urn-3:HUL.InstRepos:13065009
Terms of Use This article was downloaded from Harvard University’s DASHrepository, and is made available under the terms and conditionsapplicable to Other Posted Material, as set forth at http://nrs.harvard.edu/urn-3:HUL.InstRepos:dash.current.terms-of-use#LAA
Physiology and evolution of methylamine metabolism
across Methylobacterium extorquens strains
A dissertation presented
by
Dipti Dinkar Nayak
to
The Department of Organismic and Evolutionary Biology
in partial fulfillment of the requirements
for the degree of
Doctor of Philosophy
in the subject of
Biology
Harvard University
Cambridge, Massachusetts
August 2014

©2014 - Dipti Dinkar Nayak
All rights reserved.

iii
Dissertation Advisor: Professor Christopher J. Marx Dipti Dinkar Nayak
Physiology and evolution of methylamine metabolism across Methylobacterium extorquens strains
Abstract
The interplay between physiology and evolution in microorganisms is extremely relevant from
the stand-point of human health, the environment, and biotechnology; yet microbial physiology and
microbial evolution largely continue to grow as disjoint fields of research. The goal of this dissertation
was to use experimental evolution to study methylamine metabolism in Methylobacterium extorquens
species. Methylotrophs like the M. extorquens species grow on reduced single carbon compounds and are
the largest biological sink for methane. M. extorquens AM1, the model system for the study of aerobic
methylotrophy, has an unstable genome and severe growth defects as a result of laboratory domestication.
First, I describe the genomic, genetic, and phenotypic characterization of a new model system for the
study of aerobic methylotrophy: M. extorquens PA1. This strain has a stable genome, was recently
isolated from a known ecological niche, and is closely related to AM1. Whereas PA1 grew 10-50% faster
than AM1on most substrates, it was five-fold slower on methylamine. The PA1 genome encodes a poorly
characterized but ecologically relevant N-methylglutamate pathway whereas AM1 also encodes the well-
characterized methylamine dehydrogenase for methylamine oxidation. I characterized the genetics of the
N-methylglutamate pathway in PA1 to resolve a linear topology that requires the formation of two, unique
amino acid intermediates during methylamine oxidation. I also showed that methylamine metabolism via
the N-methylglutamate pathway routes carbon flux in a manner completely different from previous
instances of methylotrophy. Next, I evolved replicate populations of PA1 on methylamine for 150
generations. Based on the empirical heuristic that the initial fitness is negatively correlated to the rate of
adaptation, it was expected that the fitness gain would be rapid. However, methylamine fitness did not
improve at all; adaptive constraints led to evolutionary recalcitrance despite low initial fitness. These
adaptive constraints were alleviated by the horizontal gene transfer of an alternate, functionally
degenerate metabolic module. Finally, I uncovered ecologically distinct roles for two functionally

iv
degenerate routes for methylamine oxidation pathways in the AM1 genome; the highly expressed,
efficient route is primarily used for growth and the tightly regulated, energetically expensive route is used
for assimilating nitrogen in methylamine-limiting environments.
v
Table of Contents
Acknowledgements……………………………………………………………………………...vi
Chapter 1…………………………………………………………………………………………1
Introduction
Chapter 2……………………………………………………………………………………..…17
Genetic and phenotypic characterization of methylotrophy in Methylobacterium extorquens strains PA1
and AM1
Chapter 3……………………………………………………………………………………..…42
Methylamine utilization via a linear N-methylglutamate pathway in Methylobacterium extorquens PA1
does not require the tetrahydrofolate dependent C1 transfer pathway
Chapter 4………………………………………………………………………………………..73
Horizontal Gene Transfer overcomes the adaptive constraints posed by a sub-optimal pathway for
methylamine utilization in Methylobacterium extorquens PA1
Chapter 5………………………………………………………………………………………..94
Experimental evolution reveals ecologically distinct roles for two functionally degenerate routes for
methylamine oxidation in Methylobacterium extorquens AM1
Appendix 1……………………………………………………………………………………..126
Supplementary Material for Chapter 2
Appendix 2……………………………………………………………………………………..135
Supplementary Material for Chapter 3
Appendix 3……………………………………………………………………………………..142
Supplementary Material for Chapter 5
vi
Acknowledgements
This dissertation, all the steps leading up to it and beyond, would not be possible without the
support of friends, mentors, and family. First, I owe a debt of gratitude to Chris for welcoming me into his
research group; for giving me the intellectual freedom to pursue a completely new research thread; and
for the words of encouragement at opportune moments. Chris’ razor sharp intellect and scientific
creativity combined with an addictive enthusiasm for research is awe-inspiring. He has been an
outstanding mentor over the years and it was a joy to be a graduate student in the Marx lab. I would also
like to specifically thank a few members of the Marx lab; Deepa Agashe and Will Harcombe for long and
meandering yet extremely illuminating scientific discussions and Sean Carroll for being a sounding board
on all matters C1 related and for working as a partner-in-crime on the betaine project. A big thank you to
everyone else in the Marx lab for reading manuscripts, patiently sitting through and critiquing practice
talks, sharing technical knowhow, and being awesome!
Colleen Cavanaugh deserves a special mention. The first time I met her, we spent three hours
animatedly discussing the wonderful, curious world of methylotrophy. I admire her passion for
microbiology and really appreciate the regular doses of positive reinforcement from her end; those kind
words have meant a lot. I am grateful to all the faculty members (Martin Polz, Graham Walker, Peter
Girguis, and especially Michael Desai) who have taken the time to read this dissertation, my thesis
proposal, and served as a part of my thesis committee over the last few years; their feedback, support and
encouragement was invaluable. I’d also like to thank my collaborators, Yousif Shamoo and Milya
Davileva at Rice University and Marty Ytreberg at University of Idaho for their time and energy; I’ve
learnt a lot from these collaborations. A big thank you to Chris Preheim for running the OEB graduate
program like a well-oiled machine, as well as to Nikki Hughes, Krista Carmichael, and Becky Chetham
for administrative support through the years.

vii
Heather, Roxie, Kiana, Liz, Didem and Laura, having all of you around made grad school so
much fun. Thank you all being such wonderfully quirky people and for the support and laughter through
these past five years. Aditi and Nithya, thank you for your friendship through the years, and for travelling
far and wide to spend time together. I cannot even fathom what I’d be doing now if wasn’t for the sage
advice that the two of you have given me over the last fifteen years. I am grateful to have extremely kind
and encouraging in-laws, and a wonderful, caring family. I will always be indebted to my maternal
grandparents for being such an integral part of my childhood and for defying gender stereotypes; she is
one of the most progressive, fearless, and independent women I’ve met and he is the most gentle, patient
soul I know. I am so glad to have Mahesh as a sibling; I’ve always admired his quick witted humor and
cheerful disposition and am extremely proud of his accomplishments. My husband Aditya is an
inspiration. It has and will always be reassuring to have his dazzling intellect, pragmatic perspective,
distinct sense of humor, and unconditional love at my side; I, too, look forward to our journey together.
Finally, I am so fortunate to have two brilliant, forward-thinking individuals, Suman and Dinkar, as
parents; they are the sole reason I have made it this far.

Chapter 1
Introduction
2
“Most basically, natural selection converts accident into apparent design, randomness into organized
pattern”- Julian Huxley, Evolution in Action.
The interplay between physiology and evolution is, arguably, the single-most important factor
that governs the diverse metabolic and other physiological features observed in microorganisms
(Falkowski et al. 2008; T. Ferenci 2007). More than a century of research in microbial physiology has
resulted in sophisticated tools for the genetic manipulation of various bacteria (Holloway et al,. 1979;
Simon et al. 1983; Sonenshein et al. 1993; Hopwood 1999; Marx and Lidstrom 2002) and archaea
(Pritchett et al. 2004; Allers and Mevarech 2005; Wagner et al. 2009); and the discovery and
characterization of thousands of enzymes and proteins involved in metabolism, transport, cell division,
virulence, and many other traits (Tatusov et al. 1997; Marakova et al. 1999; Bateman et al. 2000; Haft et
al. 2003). However, one-third of the genes in E. coli K12 - conceivably, the best characterized bacterial
strain - remain functionally unannotated (Vogel and Chothia 2006); the evolutionary processes and
constraints that have shaped many of the functionally annotated traits are also largely unknown.
Microbial evolution is a relatively new field; the advent of experimental evolution (Elena and
Lenski 2003) i.e. evolution of microorganisms in a controlled laboratory environment has spurred a ‘post-
modern synthesis’ in the field of evolutionary biology in the last couple of decades (Lenski et al. 1991;
Rainey and Travisano 1998; Kassen 2002; Perron et al. 2006; Mahajan et al. 2006; Lee et al. 2009; Lang
et al. 2013). Laboratory evolution with microorganisms has opened up experimental avenues to rigorously
test concepts in evolution and population genetics like the DFE or the Distribution of Fitness Effects
(Frenkel et al. 2014; Delaney et al. in prep), the prevalence of epistasis or non-additive interactions (Chou
et al. 2011; Khan et al. 2011; Kryazhimskiy et al. 2014), the role of mutation-selection balance (Taddei et
al. 1997; Elena and Lenski 1997) i.e. clonal interference (Miralles et al. 1999; Kao and Sherlock 2008;
Lang et al. 2013) in evolution of asexual populations; concepts which were otherwise restricted to
theoretical speculation and observational studies (S. Wright 1932; R. A. Fisher 1958; S. J. Gould 1977;
M. Kimura 1977; Gould and Lewontin 1979; Fay et al. 2002). Over the course of experimental evolution,
3
adaptive mutations that rise and fix in populations often point to novel aspects of physiology (Beaumont
et al. 2009; Ratcliff et al. 2012). Often, these adaptive mutations are in conserved genes of
unknown/hypothetical function (Chou et al. 2009; Michener et al. in submission; Nayak et al. in prep) and
provide an ideal framework to probe the function of these proteins. However, apart from their impact on
fitness and growth rate in the selective environment, the physiological underpinnings of these adaptive
mutations are rarely explored. On the whole, despite being fundamentally interconnected, microbial
physiology and microbial evolution continue to grow as disjoint fields.
The overarching goal of various chapters in this thesis was to create an evolutionary
framework to probe microbial physiology. The primary mechanism for addressing this goal was to
develop and implement experimental evolution as a forward genetic screen.
In terms its application as a forward genetic screen and throughout this thesis, the phrase
‘experimental evolution’ explicitly refers to the propagation of replicate populations in batch culture.
Each population is initiated by a distinct colony of an isogenic ancestor and propagated by serial transfer
in well-defined minimal media (Lenski et al. 1991). Under such conditions, selection primarily acts on
growth rate; mutants that grow faster have higher competitive fitness (Lenski et al. 1991; Lee et al. 2009).
The physiological basis of adaptation can be uncovered by sequencing the genome of the evolved isolates
(Barrick et al. 2009). Experimental evolution has several advantages over traditional genetic screens like
transposon- or chemical induced mutagenesis as listed below (also reviewed in Marx, 2011):
Experimental evolution does not require the organism to be genetically tractable since mutations are
uncovered by sequencing the genome. Therefore, experimental evolution can be used as a genetic
screen in a much wider breadth of microorganisms.
Experimental evolution can screen the entire mutational spectrum at once. Separate experiments do
not need to be designed to separately screen for null mutations and gain-of-function mutations that
give rise to a particular phenotype of interest.
4
Experimental evolution is not restricted to non-essential genes (Barrick et al. 2009) unlike
transposon mutagenesis; the screen most commonly used by bacterial geneticists.
Unlike chemical mutagenesis, experimental evolution does have any inherently strong mutational
bias apart from that of the organism itself. Therefore, adaptive mutations that arise in
experimentally evolved populations are more likely to be observed in Nature.
Multiple generations can amplify the effect of smaller fitness improvement. In contrast, traditional
genetic screens require careful screening of tens of thousands of individual colonies. Multiple
genotypes with a particular phenotype of interest can also be uncovered from replicate populations.
Beneficial, but extremely rare, mutations are more likely to be observed due to the prolonged
duration of the experiment (Blount et al. 2012).
If a particular phenotype of interest requires multiple mutations simultaneously, such mutants are
more likely to be enriched by experimental evolution as well (Lee and Palssøn 2010).
Experimental evolution can be used to screen for genes which impact growth in a complex or
variable environment; for instance, during growth on multiple substrates simultaneously or
switching between substrates.
The use of experimental evolution as a genetic screen does have a few drawbacks as well. It is
difficult to screen for mutations with a deleterious impact on an organismal phenotype using experimental
evolution. Clonal interference or competition between beneficial mutations that simultaneously arise in
different individuals (Lang et al. 2013; Kao and Sherlock 2008) eliminates a large fraction of genotypes
with a desired phenotype of interest (Lee and Marx 2013). However, these genotypes can be uncovered
by meta-sequencing the mixed population at different time points over the course of evolution (Kao and
Sherlock 2008; Chubiz et al. 2012; Herron and Doebeli 2013). Also, experimental evolution selects for
the ‘fittest’ or the fastest growing genotypes; since enrichment is directly tied to growth, genotypes with
growth defects relative to others that also give rise to a phenotype of interest will not be detected. But,
given the novel paradigm experimental evolution brings to microbial physiology- the ability to investigate
5
mutations that improve rather the deteriorate growth in a given environment- it is surely a promising
technique for studying microbial physiology in this genome sequencing era.
Over the course of this thesis, experimental evolution was implemented as a genetic screen to
study methylamine metabolism in methylotrophs that belong to the Methylobacterium extorquens species.
Methylotrophs are a polyphyletic group (Boucher et al. 2003) of microorganisms that can grow on
reduced single carbon (C1) compounds, like methanol and methylamine, as the sole source of carbon and
energy (C. Anthony 1982). Methylotrophs are abundant in many ecosystems (Chistoserdova 2011; Swan
et al. 2011) and are the largest biological sink for methane on our planet (Oremland et al. 1982). Due to
the ease of isolation and cultivation, fast and reproducible growth under laboratory conditions, the
Alphaproteobacterium, Methylobacterium extorquens AM1 (referred to as AM1 henceforth) has emerged
as the model system for the study of aerobic methylotrophy in the last few decades (Chistoserdova et al.
2003). By now, almost all methylotrophy-specific metabolic reactions in AM1 are well-characterized
(Chistoserdova et al. 2003; Chistoserdova, 2009) (Figure 1.1). C1 compounds like methanol are oxidized
by a dedicated periplasmic dehydrogenase to produce free formaldehyde (Nunn and Lidstrom 1986;
Chistoserdov et al. 1991). Free formaldehyde enters the cytoplasmic space where it gets oxidized further
to formate by a tetrahydromethanopterin (H4MPT) –dependent formaldehyde oxidation pathway (Marx et
al. 2003(H4MPT); Chistoserdova et al. 2003). Formate serves as the branch point for metabolism
(Crowther et al. 2008; Marx et al. 2005): a small fraction gets oxidized further to CO2 via a panel of
formate dehydrogenases (Chistoserdova et al. 2007) and the rest gets assimilated (along with one-third of
the CO2 produced) to components of biomass via the tetrahydrofolate (H4F) dependent C1 transfer
pathway (E. H. Maden 2000; Marx et al. 2003 (FtfL); Chistoserdova et al. 2003), the serine cycle
(Chistoserdova and Lidstrom 1994; Chistoserdova et al. 2003) and the ethyl-malonyl CoA pathway
(Peyraud et al. 2009).
Metagenomes and metatranscriptomes form aquatic ecosystems (Chistoserdova 2011; Swan et al.
2011), suggest that environmentally abundant, ecologically relevant, methylotrophs use completely
6
different metabolic modules for methylotrophy than those characterized in AM1. In various chapters of
this thesis, I have used a combination of traditional genetics and experimental evolution to uncover the
physiology and evolution of a poorly characterized, environmentally relevant module used for
methylamine oxidation in naturally occurring methylotrophs. In the first two chapters, I describe the
characterization of a new methylotroph that was recently isolated from the environment
(Methylobacterium extorquens PA1) and a new pathway for methylamine utilization (N-methylglutamate
pathway). Subsequent chapters use experimental evolution to uncover that the rate of adaptation in strains
constrained by the N-methylglutamate pathway for methylamine oxidation is not dependent on the initial
fitness but on the genotype and establish ecologically distinct roles for functionally degenerate routes for
methylamine oxidation (including N-methylglutamate pathway and the well-established methylamine
dehydrogeanse).
M. extorquens PA1 as an alternate model system for experimental evolution
Despite being extremely well-characterized from the perspective of methylotrophy, the genome
of AM1 posed a few major challenges for developing and implementing experimental evolution as a
forward genetic screen. Five replicons of varying sizes (Vuilleumier et al. 2009; Marx et al. 2012) and
174 partial or complete insertion sequence (IS) elements across 39 IS families (Vuilleumier et al. 2009;
Robinson et al. 2012) in the AM1 genome contribute to significant genomic plasticity and drastically
increase the rate of spurious recombination during reverse genetic manipulations (Skovran et al. 2011)
and lead to large, beneficial deletions during experimental evolution (Lee and Marx 2012). These
deletions are not physiologically pertinent to the selective environment and confound the use of
experimental evolution as a genetic screen. Also, recent work (Carroll et al. 2014) has demonstrated that
the current laboratory strain of AM1, which has been ‘domesticated’ since the 1950s, grows up to 25%
slower than the ‘archival’ version; aspects of physiology in AM1 may no longer be hold for natural
methylotrophs. Therefore, we sought to find and characterize another strain of the M. extorquens species
that is more ecologically relevant and amenable to using experimental evolution as a forward genetic
7
screen. In the second chapter of this thesis, we describe the genomic, genetic, and phenotypic
characterization of M. extorquens PA1 (referred to as PA1 henceforth), which was recently isolated from
the phyllosphere of Arabidopsis (Knief et al. 2010), and propose the use of this strain as a new/alternate
model system for the study of aerobic methylotrophy. PA1 is 100% identical to AM1 at the 16S rRNA
level (Marx et al. 2012, Knief et al. 2010) but has a single chromosome with only 20 intact IS elements in
its genome. By constructing knockout mutants in methylotrophy-specific modules, quantifying their
phenotype on a large suite of C1- and multi-C compounds, and comparing it to those established for AM1,
we showed that, with a few exceptions (which will be discussed subsequently), the large body of
knowledge in AM1 can be transferred to PA1 which, by virtue of a more streamlined and stable genome,
is better suited for experimental evolution.
Physiological characterization of the N-methylglutamate pathway for methylamine oxidation
The most striking difference between strains AM1 and PA1, in terms of methylotrophic
metabolism, is that AM1 has a doubling time (tD) of 3-4 hours (Delaney et al. 2013) while PA1has a tD of
~18 hours during growth on methylamine. On other methylotrophic substrates, the growth rates of these
strains differ by 10-15%. The stark contrast in methylamine growth rates can be attributed to the
metabolic module used for the primary oxidation of methylamine in each strain. Whereas PA1only
possesses the poorly characterized N-methylglutamate (NMG) pathway (Shaw et al,. 1966; Latypova et
al. 2010; Martinez-Gomez et al. 2013; Gruffaz et al. 2014) for methylamine oxidation, AM1 also encodes
the well-characterized methylamine dehydrogenase (MaDH)(Chistoserdov et al. 1991). Methylamine
plays an important role in the global nitrogen and carbon budget (Oremland et al. 1982; Ge et al. 2011)
and recent metagenomic studies (Chistoserdova, 2011) have revealed the import and abundance of the
NMG pathway in aquatic environments.
In the third chapter of this thesis, I characterized the genetics and physiology of the NMG
pathway for methylamine oxidation in PA1. By coupling traditional genetics (Marx 2008) with
8
quantitative phenotypic assays using an extremely accurate growth measurement platform (Delaney et al.
2013) we showed that the NMG pathway has a linear topology rather than the branched topology
proposed previously (Latypova et al. 2010). So far, all C1 substrates tested in Methylobacterium species,
absolutely require the H4F-dependent C1 transfer pathway for assimilation or dissimilation (Vannelli et al.
1999; Marx et al. 2003 (FtFL); Marx et al. 2005; Crowther et al. 2008). The H4F-dependent C1 transfer
pathway was not essential and the C1 flux flows in a completely novel manner during methylamine
growth using the NMG pathway; C1 units are assimilated directly into the serine cycle and dissimilated
directly by the H4MPT pathway and the branch point of metabolism shifts to either formaldehyde or
methylene tetrahydrofolate (CH2=H4F). Apart from the physiological details of the NMG pathway, the
results in this chapter also suggest that metabolic modules in a particular cell can be used in distinct
configurations to route carbon flux in different ways depending upon the growth substrate in question.
The role of Horizontal Gene Transfer (HGT) in adaptive evolution of methylotrophs
The distribution of methylamine fitness across the M. extorquens species is approximately
bimodal; strains that encode the methylamine dehydrogeanse are at least five fold more fit than strains
that use the NMG pathway for methylamine oxidation. Laboratory evolution studies the span a large cross
section of organisms and environments have established an empirical rule-of-thumb in microbial
evolution; the rate of adaptation is negatively correlated with the initial fitness of an organism (Bennett et
al. 1992; Travisano et al. 1995; Lee et al. 2009; Lee and Marx 2013) and mostly independent of the initial
genotype (Kryazhimskiy et al. 2014). We evolved three replicate populations of M. extorquens PA1 on
methylamine as the sole carbon and energy source; given the distance from the fitness optima, it was
expected that the fitness gain on methylamine would be rapid.
In the fourth chapter, we describe the unexpected outcome of methylamine evolution in PA1.
Despite 150 generations of evolution and adaptation, as indicated by genetic parallelism (Woods et al.
2006) across replicate lines, the growth rate as well as the competitive fitness on methylamine for any of
9
the evolved populations or isolates was not significantly different than that of the founding ancestor. This
result directly counters the recently proposed concept (Kryazhimskiy et al. 2014) that the rate of adaption
is primarily dependent on the initial fitness of an organism in an environment; in a novel or sub-optimal
environment, physiology can pose severe constraints that slow down the rate of adaptation independent of
the initial fitness. In parallel, we also simulated a horizontal gene transfer (HGT) by transforming a low
copy plasmid with the mau gene cluster, encoding methylamine dehydrogeanse and ancillary proteins
(Chistoserdov et al. 1991), in the PA1 genome. The growth rate and competitive fitness of the resulting
transconjugant on methylamine was significantly greater than PA1 and comparable to or even greater than
AM1. This result alluded to the important role of HGT as an evolutionary force in nature; when a novel
environment poses constraints that lead to ‘evolutionary recalcitrance’, HGT can speed up the rate of
adaptation drastically. To the best of our knowledge, this is the first study to quantify and compare the
effect of HGT relative to mutations on the rate of adaptation in asexual, haploid, microbial populations.
Evolutionary physiology of functionally redundant pathways in methylotrophs
Despite 150 generations of laboratory evolution, PA1 did not grow any faster on methylamine.
Therefore we evolved AM1 to use the NMG pathway, instead of MaDH, for primary oxidation during
methylamine growth. In the fifth chapter of this thesis, we delineate novel physiological adaptations in
experimentally evolved mutants of AM1 that grow on methylamine using the NMG pathway.
AMI encodes the NMG pathway too, but in the absence of MaDH strains have extremely low
competitive fitness on methylamine; much lower than PA1, in fact. Why does AM1 not tap into its
genomic potential and use the NMG pathway for methylamine growth? To uncover the physiological
constraints that prevent the actualization of this functional degeneracy, we evolved two distinct genotypes
with extremely low methylamine fitness, but an intact NMG pathway, on methylamine as the sole source
of carbon and energy. In contrast to the PA1 evolution experiment, methylamine fitness of the AM1
mutants increased rapidly (by 20-100 fold) and genome sequencing revealed three major constraints
10
associated with using the NMG pathway for methylamine growth: 1) antagonism with methylamine
dehydrogeanse, 2) low expression and 3) growth inhibition by a sharp rise in cytoplasmic pH due to
ammonia buildup. A novel physiological solution for mitigating the rise in cytoplasmic pH was observed
in each evolved population: 1) constitutive expression of the kefB proton pore (Booth et al. 2003)
independent of the glutathione binding domain and 2) conversion of cytoplasmic ammonia to urea and
subsequent excretion. These observations led to the conclusion that AM1 cells solely use the highly
expressed methylamine dehydrogenase for primary oxidation during growth on high concentrations of
methylamine as a carbon source and switch to the energetically expensive NMG pathway for primary
oxidation perhaps while using limiting concentrations of methylamine as a nitrogen source. We suspect
that trade-offs between the kinetic parameters of these two methylamine oxidation pathways across an
environmentally relevant concentration gradient of methylamine selects for this functional redundancy in
AM1. In addition to the chapters outlined above, I have contributed to the following topics of research as
well:
Used experimental evolution as a genetic screen in PA1 to uncover a functional role for proteins
with the DUF (Domain of Unknown Function) 336 in the cellular response to formaldehyde
buildup. This work has contributed significantly to to resolve the long-standing metabolic paradox
surrounding formaldehyde growth in methylotrophs.
Developed and implemented a high-throughput method for traditional transposon mutagenesis to
uncover a new metabolic pathway for betaine (N-N-N-trimethyl glycine) oxidation in
methylotrophs.
Engineered strains of PA1 to use the RuMP (Ribulose Monophosphate) pathway (Ward et al. 2004)
in place of the native pathway for C1 assimilation and/or C1 dissimilation and experimentally
evolved these engineered strains on methanol. Evolved isolates with higher yields than the ancestor
hold great promise for biotechnological purposes.
11
References
1. Falkowski P. G., T. Fenchel, and E.F. Delong. 2008. The microbial engines that drive Earth’s
biogeochemical cycles. Science 320:1034-1039.
2. Ferenci T. 2007. Bacterial physiology, regulation, and mutational adaptation in a chemostat
environment. Advances in Microbial Physiology 53:169-229.
3. Holloway B. W., V. Krishnapillai, and A. F. Morgan. 1979. Chromosomal genetics of Pseudomonas.
Microbiol. Rev. 43:73-102.
4. Simon R., U. Priefer, and A. Puhler. 1983. A broad host range mobilization system for in vivo genetic
engineering: Transposon mutagenesis in Gram Negative bacteria. Nature Biotech. 1:784-791.
5. Sonenshein A. L., J. A. Hoch, and R. Losick. 1993. Bacillus subtilis and other gram-positive bacteria:
biochemistry, physiology, and molecular genetics. American Society of Microbiology Press,
Washington D.C.
6. Hopwood D. A. 1999. Forty years of genetics with Streptomyces: from in vivo through in vitro to in
silico. Microbiology. 145:2183-2202.
7. Marx C. J., and M. E. Lidstrom. 2002. Broad-host-range cre-lox system for antibiotic marker
recycling in Gram-Negative bacteria. BioTechniques. 33:1062-1067.
8. Pritchett M. A., J. K. Zhang, and W. W. Metcalf. 2004. Development of a markerless genetic
exchange method for Methanosarcina acetivorans C2A and its use in construction of new genetic tools
for methanogenic archaea. Appl. Environ. Microbiol. 70:1425-1433.
9. Allers T., and Mevarech M. 2005. Archaeal genetics – the third way. Nature Rev. Genetics. 6: 58-73.
10. Wagner M., S. Berkner, M. Ajon, A. J. M. Driessen, G. Lipps, and S-J. Albers. 2009. Expanding
and understanding the genetic toolbox of the hyperthermophilic genus Sulfolobus. Biochem. Soc. Trans.
37:97-101.
11. Tatusov R. L., E. V. Koonin, and D. J. Lipman. 1997. A genomic perspective on protein families.
Science. 24:631-637.
12. Marakova K. S., L. Aravind, M. Y. Galperin, N. V. Grishin, R L. Tatusov, Y. I. Wolf and E V.
Koonin. 1999. Comparative genomics of the Archaea (Euryarchaeota): Evolution of conserved protein
families, the stable core, and the variable shell. Genome Res. 9:608-628.
13. Bateman A., E. Birney, R. Durbin, S. R. Eddy, K. L. Howe, and E. L. L. Sonnhammer. 2000. The
Pfam protein families database. Nucl. Acids Res. 28:263-266.
14. Haft D. H., J. D. Selengut, and O. White. 2003. The TIGRFAMs database. Nucl. Acids Res. 31:371-
373.
15. Vogel C., and C. Chotia. 2006. Protein family expansions and biological complexity. PloS Comput.
Biol. 2:e48.
12
16. Elena S. F., and R. E Lenski. 2003. Microbial genetics: Evolution experiments with microorganisms:
the dynamics and genetic basis of adaptation. Nature Rev. Genetics. 4:457-469.
17. Lenski R. E., M. R. Rose, S. C. Simpson, and S. C. Tadler. 1991. Long-term experimental evolution
in Escherichia coli. I. Adaptation and divergence during 2,000 generations. Am. Naturalist. 138:1315-
1341.
18. Rainey P. B., and M. Travisano. 1998. Adaptive radiation in a heterogeneous environment. Nature.
394:69-72.
19. Kassen R. 2002. The experimental evolution of specialists, generalists, and the maintenance of
diversity. J. of Evol. Biol. 15:173-190.
20. Perron G. G., M. Zasloff, and G. Bell. 2006. Experimental evolution of resistance of an antimicrobial
peptide. Proc. R. Soc. B. 273:251-256.
21. Maharjan R. S. Seeto, L. Notley-McRobb, and T. Ferenci. 2006. Clonal adaptive radiation in a
constant environment. Science. 313:514-517.
22. Lee M-C., H-H. Chou, and C. J. Marx. 2009. Asymmetric, bimodal trade-offs during adaptation of
Methylobacterium to distinct growth substrates. Evolution. 63:2816-2830.
23. Ratcliff W. C., R. F. Denison, M. Borrello, and M. Travisano. 2012. Experimental evolution of
multicellularity. PNAS. 109:1595-1600.
24. Chou H-H, J. Berthet J, and C. J. Marx. 2009. Fast growth increases the selective advantage of a
mutation arising recurrently during evolution under metal limitation. PLoS Genetics. 5: e1000652.
25. Lang G. I., D. P. Rice, M. J. Hickman, E. Sodergren, G. M. Weinstock, D. Botstein, and M. M.
Desai. 2013. Pervasive genetic hitchhiking and clonal interference in forty evolving yeast populations.
Nature. 500:571-574.
26. Frenkel E.M., B. H. Good, and M. M. Desai. 2014. The fate of mutant lineages and the distribution of
fitness effects of beneficial mutations in laboratory budding yeast populations. Genetics. 196:1217-
1226.
27. Chou H-H., H-C. Chiu, N. F. Delaney, D. Segre, and C. J. Marx. 2011. Diminishing returns epistasis
among beneficial mutations decelerates adaptation. Science. 332:1190-1192.
28. Khan A. I., D. M. Dinh, D. Schneider, R. E. Lenski, and T. F. Cooper. 2011. Negative epistasis
between beneficial mutations in an evolving bacterial population. Science. 332:1193-1196.
29. Kryazhimskiy S., D. P. Rice, E. Jerison, and M. M. Desai. 2014. Global epistasis makes adaptation
predictable despite sequence-level stochasticity. Science. 344: 1519-1522.
30. Taddei F., M. Radman, J. Maynard-Smith, B. Toupance, P. H. Gouyon and B. Godelle. 1997. Role
of mutator alleles in adaptive evolution. Nature. 387:700-702.
31. Elena S. F., and R. E. Lenski. 1997. Test of synergistic interactions among deleterious mutations in
bacteria. Nature. 390:395-398.
32. Miralles R., P. J. Gerrish, A. Moya, and S. F. Elena. 1999. Clonal interference and the evolution of
RNA viruses. Science. 285:1745-1747.
13
33. Kao K. C., and G. Sherlock. 2008. Molecular characterization of clonal interference during adaptive
evolution in asexual population of Saccharomyces cerevisiae. Nature Genetics. 40: 1499-1504.
34. Wright S. 1932. The role of mutation, inbreeding, crossbreeding and selection in evolution. Sixth
International Congress on Genetics. 1:356-366.
35. Gould S. J., and R. C. Lewontin. 1979. The spandrels of San Marco and the Panglossian paradigm: A
critique of the adaptationist programme. Proc. R. Soc. Lond. B. 205:581-598.
36. Gould S. J., and N. Eldredge. 1977. Punctuated equilibria: the tempo and mode of evolution
reconsidered. Paleobiology. 3:115-151.
37. Fisher R. A. 1958. The genetical theory of natural selection. Рипол Классик.
38. Kimura M. 1977. Preponderance of synonymous changes as evidence for the neutral theory of
molecular evolution. Nature. 267:275-276
39. Fay J. C., G. J. Wyckoff, and C.-I Wu. 2002. Testing the neutral theory of molecular evolution with
genomic data from Drosophila. Nature. 415:1024-1026.
40. Beaumont H. J. E., J. Gallie, C. Kost, G. C. Ferguson, and P. B. Rainey. 2009. Experimental
evolution of bet hedging. Nature. 462:90-93.
41. Barrick J. E., D. S. Yu, S. H. Yoon, H. Jeong, T. K. Oh, D. Schneider, R. E. Lenski, and J. F. Kim.
2009. Genome evolution and adaptation in a long-term experiment with Escherichia coli. Nature.
461:1243-1247.
42. Marx C. J. 2011. Evolution as an experimental tool in microbiology: ‘Bacterium, improve thyself!’
Environmental Microbiology Reports. 3:12-14.
43. Blount Z. D., J. E. Barrick, C. J. Davidson, and R. E. Lenski. 2012. Genomic analysis of a key
innovation in an experimental Escherichia coli population. Nature. 489:513.518.
44. Lee D. H., and B. O. Palssøn. 2010. Adaptive evolution of Escherichia coli K-12 MG1655 during
growth on a nonnative carbon source, L-1, 2-propanediol. Appl. Environ. Microbiol. 76: 4158-4168.
45. Lee M.-C., and C. J. Marx. 2013. Synchronous waves of failed soft sweeps in the laboratory:
remarkably rampant clonal interference of alleles at a single locus. Genetics. 193:943-952.
46. Chubiz L. M., M.-C. Lee, N. F. Delaney, and C. J. Marx. 2012. FREQ-Seq: A rapid, cost-effective,
sequencing-based method to determine allele frequencies directly from mixed populations. PLoS ONE.
7:e47959.
47. Herron M. D., and M. Doebeli. 2013. Parallel evolutionary dynamics of adaptive diversification in
Escherichia coli. PloS Biology. 11:e1001490.
48. Boucher Y., C. J. Doudy, R. T. Papke, D. A. Walsh, M. E. R. Boudreau, C. L. Nesbø, R. J. Case,
and W. F. Doolittle. 2003. Lateral gene transfer and the origin of prokaryotic groups. Ann. Rev. Genet.
37:283-328.
49. Anthony C. 1982. The biochemistry of methylotrophs. Academic Press Ltd., London.
14
50. Oremland R. S., L. M. Marsh, and S. Polcin. 1982. Methane production and simultaneous sulphate
reduction in anoxic, salt marsh sediments. Nature 296:143-145.
51. Chistoserdova L., S. W. Chen, A. Lapidus, and M. E. Lidstrom. 2003. Methylotrophy in
Methylobacterium extorquens AM1 from a genomic point of view. J. Bacteriol. 185:2980-2987.
52. Vuilleumier S., L. Chistoserdova, M-C. Lee, F. Bringel, et al. 2009. Methylobacterium genome
sequences: a reference blueprint to investigate microbial metabolism of C1 compounds from natural and
industrial sources. PLoS One. 4:e5584.
53. Marx C. J., F. Bringel, L. Chistoserdova, et al. 2012. Complete genome sequences of six strains of
the genus Methylobacterium. J. Bacteriol.194:4746-4748.
54. Chistoserdova L., M. G. Kalyuzhnaya, and M. E. Lidstrom. 2009. The expanding world of
methylotrophic metabolism. Annu. Rev. Microbiol. 63:477-499.
55. Nunn D. N., and M. E. Lidstrom. 1986. Isolation and complementation analysis of 10 methanol
oxidation mutant classes and identification of the methanol dehydrogenase structural gene of
Methylobacterium sp. strain AM1. J. Bacteriol. 166:581-590.
56. Chistoserdov A. Y., Y.D. Tsygankov, and M. E. Lidstrom. 1991. Genetic organization of
methylamine utilization genes from Methylobacterium extorquens AM1. J. Bacteriol. 173:5901-5908.
57. Marx C. J., L. Chistoserdova, and M. E. Lidstrom. 2003. Formaldehyde-detoxifying role of the
tetrahydromethanopterin-linked pathway in Methylobacterium extorquens AM1. J. Bacteriol.185:7160-
7168.
58. Marx C. J., S. J. Van Dien, and M. E. Lidstrom. 2005. Flux analysis uncovers key role of functional
redundancy in formaldehyde metabolism, PloS Biol. 3:e16.
59. Crowther G. J., G. Kosaly, and M. E. Lidstrom. 2008. Formate as the main branch point for
methylotrophic metabolism in Methylobacterium extorquens AM1. J. Bacteriol. 190:5057-5062.
60. Chistoserdova L., G. J. Crowther, J. A. Vorholt, E. Skovran, J. C. Portais, and M. E. Lidstrom.
2007. Identification of a fourth formate dehydrogenase in Methylobacterium extorquens AM1 and
confirmation of the essential role of formate oxidation in methylotrophy. J. Bacteriol. 189:9076-9081.
61. Marx C. J., M. Laukel, J. A. Vorholt, and M. E. Lidstrom. 2003. Purification of the formate-
tetrahydrofolate ligase from Methylobacterium extorquens AM1 and demonstration of its requirement
for methylotrophic growth. J. Bacteriol. 185:7169-7175.
62. Maden E.H. 2000.Tetrahydrofolate and tetrahydromethanopterin compared: functionally distinct
carriers in C1 metabolism. Biochem. J. 350: 609-629.
63. Chistoserdova L., and M. E. Lidstrom. 1994. Genetics of the serine cycle in Methylobacterium
extorquens AM1: cloning, sequence, mutation and physiological effect of glyA, the gene for serine
hydroxymethyltransferase. 176: 6759-6762.
64. Peyraud R., P. Kiefer, P. Christen, S. Massou, J. C. Portais, and J. A. Vorholt. 2009.
Demonstration of the ethylmalonyl-CoA pathway by using 13C metabolomics. PNAS. 106: 4846-4851.
15
65. L. Chistoserdova. 2011. Methylotrophy in a lake: from metagenomics to single-organism physiology.
Appl. Environ. Microbiol. 77:4705-4711.
66. Swan B. K., M-M. Garcia, C. M. Preston, A. Sczyrba, T. Woyke, D. Lamy, T. Reinthaler, N. J.
Poulton, E. D. P. Masland, M. L. Gomez, M. E. Sieracki, E. F. DeLong, G. J. Herndl, and R.
Stepanauskas. 2011. Potential for chemolithoautotrophy among ubiquitous bacterial lineages in the
dark ocean. Science. 333:1296-1300.
67. Robinson D. G., M-C. Lee, and C. J. Marx. 2012. OASIS: an automated program for global
investigation of bacterial and archaeal insertion sequences. Nucleic Acids Res. 40:e174.
68. Skovran E., A. D. Palmer, A. M. Rountree, N. M. Good, and M. E. Lidstrom. 2011. XoxF is
required for expression of methanol dehydrogenase in Methylobacterium extorquens AM1. J. Bacteriol.
193:6032-6038.
69. Carroll S. M., K. S. Xue, and C. J. Marx.2014. Laboratory divergence of Methylobacterium
extorquens AM1 through unintended domestication and past selection for antibiotic resistance. BMC
Microbiol. 14: 2.
70. Lee M-C., and C. J. Marx. 2012. Repeated, selection-driven genome reduction of accessory genes in
experimental populations. PLoS Genetics. 8:e1002651.
71. Knief C., L. Frances, and J. A. Vorholt. 2010. Competitiveness of diverse Methylobacterium strains
in the phyllosphere of Arabidopsis thaliana and identification of representative models, including M.
extorquens PA1. Microb. Ecol. 60:440-452.
72. Delaney N. F., M. E. Kaczmarek, L. M. Ward, P. K. Swanson, M-C. Lee, and C. J. Marx.2013.
Development of an optimized medium, strain, and high-throughput culturing methods for
Methylobacterium extorquens. PLoS One. 8:e62957.
73. Shaw W.V., L. Tsai, and R. R. Stadtman. 1966. The enzymatic synthesis of N-methylglutamic acid. J.
Biol. Chem. 241:935-945.
74. Latypova E., S. Yang, Y. S. Wang, T. Wang, T. A. Chavkin, M. Hackett, H. Schafer, and M. G.
Kalyuzhnaya. 2010. Genetics of the glutamate-mediated methylamine utilization pathway in the
facultative methylotrophic beta-proteobacteria Methyloversatilis universalis FAM5. Mol. Microbiol.
75:426-439.
75. Martinez-Gomez N. C., S. Nguyen, and M. E Lidstrom. 2013. Elucidation of the role of methylene-
tetrahydromethanopterin dehydrogenase MtdA in the tetrahydromethanopterin-dependent oxidation
pathway in Methylobacterium extorquens AM1. J. Bacteriol.195:2359-2367.
76. Gruffaz C., E.E. L. Muller, Y. Louhichi-Jelail, Y. R. Nelli, G. Guichard, and F. Bringel. 2014.
Genes of the N-methylglutamate pathway are essential for growth of Methylobacterium extorquens
DM4 on monomethylamine. Appl. Environ. Microbiol. 80:3541-3550.
77. Ge X., A. S. Wexler, and S.L. Clegg. 2011. Atmospheric amines- Part I. A review. Atmospheric
Environment 45:524-546.
78. Marx C. J. 2008. Development of a broad-host-range sacB-based vector for unmarked allelic exchange.
BMC Res. Notes. 1:1.
16
79. Delaney N. F., J. I. Rojas Echenique, and C. J. Marx. 2013. Clarity: an open-source manager for
laboratory automation. J. Lab Autom.18:171-177.
80. Vannelli T., M. Messmer, A. Studer, S. Vuilleumier, and T. Leisinger. 1999. A corrinoid-dependent
catabolic pathway for growth of a Methylobacterium strain with chloromethane. PNAS 96:4615-4620.
81. Bennett A. F., R. E. Lenski, and J. E. Miller. 1992. Evolutionary adaptation to temperature. I. Fitness
response of Escherichia coli to changes in its thermal environment. Evolution. 46: 16-30.
82. Travisano M., J. A. Mongold, A. F. Bennett, and R. E. Lenski. 1995. Experimental tests of the role
of adaptation, chance, and history in evolution. Science. 267: 87-90.
83. Woods R., D. Schneider, C. L. Winkworth, M. A. Riley, and R. E. Lenski. 2006. Tests of parallel
molecular evolution in a long-term evolution experiment with Escherichia coli. PNAS. 103: 9107-9112.
84. Vorholt J. A., C. J. Marx, M. E. Lidstrom, and R. K. Thauer. 2000. Novel formaldehyde-activating
enzyme in Methylobacterium extorquens AM1. 182:6645-6650.
85. Booth I. R., G. P. Ferguson, S. Miller, C. Li, B. Gunasekara, and S. Kinghorn. 2003. Bacterial
production of methylglyoxal: a survival strategy or death by misadventure? Biochem. Soc. Trans.
31:1406-1408.
86. Ward N., Ø. Larson, J. Sakwa, L. Bruseth, et al. 2004. Genomic insights into methanotrophy: The
complete genome sequence of Methylococcus capsulatus (Bath).
Chapter 2
Genetic and phenotypic comparison of methylotrophy
in Methylobacterium extorquens strains PA1 and AM1

18
Genetic and phenotypic comparison of methylotrophy between
Methylobacterium extorquens strains PA1 and AM1
Running title: A new model system for the study of aerobic methylotrophy
Dipti D. Nayak1 and Christopher J. Marx
1, 2,3,4
1Organismic and Evolutionary Biology, Harvard University, Cambridge, MA, USA,
2Faculty of Arts and
Sciences Center for Systems Biology, Harvard University, Cambridge, MA, USA. 3Department of
Biological Sciences, University of Idaho, Moscow, ID, USA. 4Institute for Bioinformatics and
Evolutionary Studies, University of Idaho, Moscow, ID, USA.
#Corresponding author: Christopher J. Marx, [email protected]
19
Abstract
Methylobacterium extorquens AM1, a strain serendipitously isolated half a century ago, has
become the best-characterized model system for the study of aerobic methylotrophy (the ability to grow
on reduced single carbon compounds). However, with 5 replicons, 174 insertion sequence (IS) elements
in the genome and a long history of domestication in the laboratory, genetic and genomic analysis of M.
extorquens AM1 face several challenges. On the other hand, a recently isolated strain - M.extorquens
PA1- is closely related to M. extorquens AM1 (100% 16S rRNA identity) and contains a streamlined
genome with a single replicon and only 20 IS elements. In this paper we report four primary findings
regarding methylotrophy in PA1. First, with a few notable exceptions, the repertoire of methylotrophy
genes between PA1 and AM1 is extremely similar. Second, PA1 grows faster with higher yields
compared to AM1 on C1 and multi-C substrates in minimal media, but AM1 grows faster in rich medium.
Third, deletion mutants in PA1 throughout methylotrophy modules have the same C1 growth phenotypes
observed in AM1. Finally, the precision of our growth assays revealed several unexpected growth
phenotypes for various knockout mutants that serve as leads for future work in understanding their basis
and generality across Methylobacterium strains.
Introduction
Methylotrophy is the ability of microorganisms to grow on reduced single-carbon (C1) compounds like
CH4 (methane) or CH3OH (methanol) as a sole carbon and energy source (Peel and Quayle 1961; Large
and Quayle 1963; Johnson and Quayle 1964; C. Anthony 1982). Methylobacterium extorquens AM1
(Peel and Quayle 1961) is a facultative methylotroph that belongs to the Rhizobiales family of the Alpha-
proteobacteria. Since M. extorquens AM1 is genetically tractable (Marx and Lidstrom 2001; Marx and
Lidstrom 2002; Marx et al. 2003a; Marx and Lidstrom 2004; C. J. Marx 2008; Choi et al. 2006;
Kaczmarczyk et al. 2013), has fast, roughly comparable growth rates on C1 compounds (tD~3-4 h on
methanol and methylamine) and multi-carbon compounds (tD~2.5 -3 h on succinate) (Delaney et al. 2013;
20
Lee et al. 2009), it has emerged as the model system for the study of aerobic methylotrophy
(Chistoserdova et al. 2003; Chistoserdova et al. 2009). There are three specific aspects of the genome
architecture and physiology of AM1 that pose challenges (Vuilleumier et al. 2009; Lee and Marx 2012;
Robinson et al. 2012; Chou et al. 2009; Chou and Marx 2012; Lee and Marx 2013; Carroll and Marx
2013; Carroll et al. 2014). First, the AM1 genome has five replicons of varying sizes (Vuilleumier et al.
2009). One of the replicons in the AM1 genome is a 1.3 Mb megaplasmid that contains many insertion
sequence (IS) elements; recombination events mediated by IS elements often lead to large, beneficial
deletions (Lee and Marx 2012). Hence, experiments designed to study a variety of questions have and will
commonly result in this particular change of large benefit (Lee and Marx 2012). Second, the 174 intact or
partial IS elements across 39 IS families present in the AM1 genome (Vuilleumier et al. 2009; Robinson
et al. 2012) are responsible for a significant amount of genome plasticity which has often been observed
during genetic manipulations and evolution experiments with AM1 (Chou et al. 2009; Chou and Marx
2012; Lee and Marx 2013; Carroll and Marx 2013). Such high rates of IS insertion/recombination in AM1
leads to spurious recombination events across the genome during reverse genetic manipulations (Nayak,
Carroll, and Marx; unpublished) and skews the mutational spectrum during experimental evolution (Lee
and Marx 2012). Third, the current strain of AM1 has been domesticated in laboratory conditions since
the late 1950s (Peel and Quayle 1961; Large and Quayle 1963; Johnson and Quayle 1964) and has
changed significantly ever since (Carroll et al. 2014). A notable difference is that the ‘modern’ strain (C.
J. Marx 2008) grows ~25% worse than an archival version under a wide variety of conditions. These
results indicate that aspects of physiology uncovered in the modern AM1 may be hard to extrapolate to
other environmentally relevant methylotrophs.
Of late, an increasing number of studies have been conducted with several members of the M.
extorquens species and genome sequence data is now available for six strains (Vuilleumier et al. 2009;
Marx et al. 2012). Despite 16S rRNA sequence similarity, these strains vary significantly in terms of their
metabolic breadth, genetic tractability, ecological niche and genomic composition (Marx et al. 2012). We
21
considered whether one of these six sequenced strains might overcome the challenges posed by AM1 and
finally narrowed in on M. extorquens PA1 (hereafter PA1) as it has the most streamlined genome, with a
single 5.47 Mb chromosome, that contains only 20 intact IS elements. These features can make the design
and implementation of genetic screens more efficient, and prevent beneficial elimination of extra-
chromosomal elements or IS-mediated events from dominating the spectrum of beneficial mutations.
Recent isolation of PA1 from the leaves of Arabidopsis thaliana (Knief et al. 2010), and immediate
cryopreservation obviate concerns associated with domestication of the ‘modern’ AM1 strain and provide
a clear link to a known ecological niche.
There are some clear advantages of the genome composition and culturing history of PA1 over
AM1. In order to ascertain how well the decades of characterization of methylotrophy in AM1 will apply
directly to PA1, we identified the shared repertoire of methylotrophy genes and performed a broad genetic
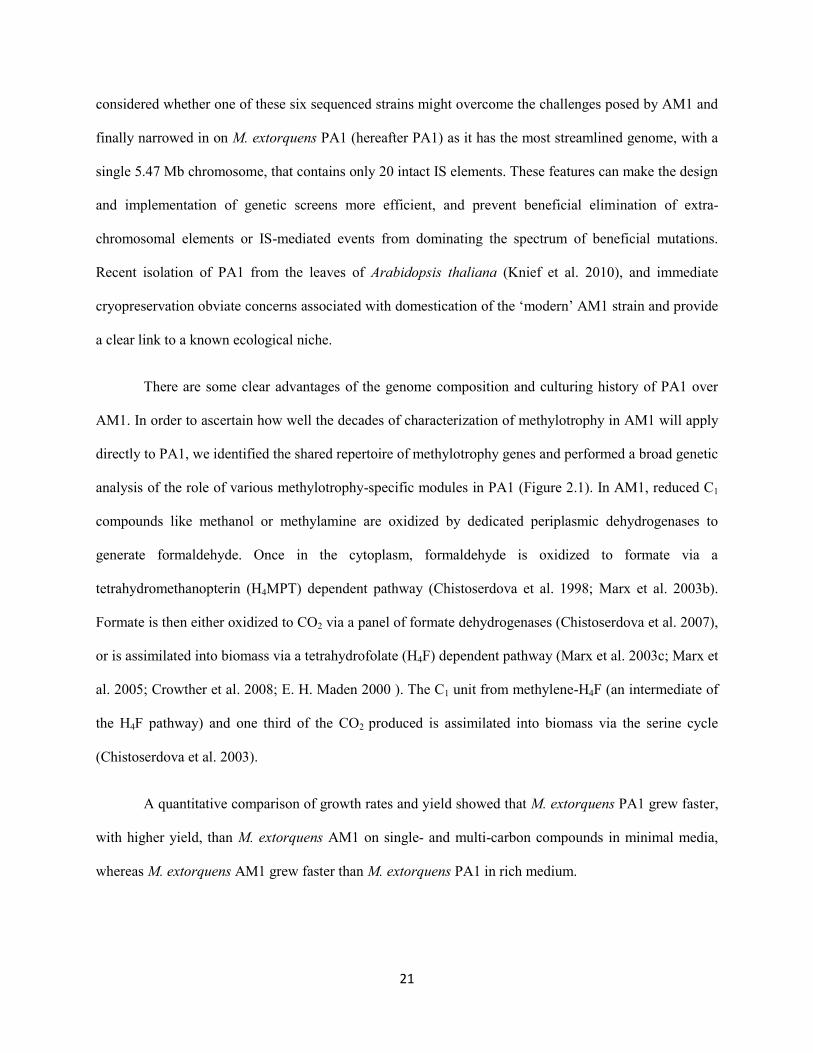
analysis of the role of various methylotrophy-specific modules in PA1 (Figure 2.1). In AM1, reduced C1
compounds like methanol or methylamine are oxidized by dedicated periplasmic dehydrogenases to
generate formaldehyde. Once in the cytoplasm, formaldehyde is oxidized to formate via a
tetrahydromethanopterin (H4MPT) dependent pathway (Chistoserdova et al. 1998; Marx et al. 2003b).
Formate is then either oxidized to CO2 via a panel of formate dehydrogenases (Chistoserdova et al. 2007),
or is assimilated into biomass via a tetrahydrofolate (H4F) dependent pathway (Marx et al. 2003c; Marx et
al. 2005; Crowther et al. 2008; E. H. Maden 2000 ). The C1 unit from methylene-H4F (an intermediate of
the H4F pathway) and one third of the CO2 produced is assimilated into biomass via the serine cycle
(Chistoserdova et al. 2003).
A quantitative comparison of growth rates and yield showed that M. extorquens PA1 grew faster,
with higher yield, than M. extorquens AM1 on single- and multi-carbon compounds in minimal media,
whereas M. extorquens AM1 grew faster than M. extorquens PA1 in rich medium.
22
Figure 2.1.: The methylotrophy specific metabolic network in in M. extorquens AM1. All methylotrophy-specific
genes, except for the mau cluster (gray), are present and >95% identical in M. extorquens PA1. M. extorquens AM1
and M. extorquens PA1 were grown on various C1 and multi-C substrates (blue) for this study. Genes highlighted in
red were deleted in M. extorquens PA1 to uncover that the metabolic network involved in methylotrophy in M.
extorquens PA1 is identical to M. extorquens AM1. FDH: Formate Dehydrogeanse, TCA: Tricarboxylic acid Cycle
and EMC: Ethyl-malonyl CoA Pathway.
Analysis of the growth phenotypes of a large suite of M. extorquens PA1 knockout mutants in various
methylotrophy-specific modules revealed that the metabolic network functions as established for M.
extorquens AM1. Our analysis demonstrated that the vast body of knowledge for M. extorquens AM1 is
largely transferable to M. extorquens PA1: an alternate model system for the study of aerobic
23
methylotrophy in the future. Additionally, our quantitative physiological analysis has unveiled novel
phenotypes for methylotrophy-specific genes that generate leads to uncover poorly understood aspects of
regulation in future work.
Materials and Methods
Bacterial Strains and Growth Conditions
Strains relevant to this study included the following: the ∆cel mutant of the pink-pigmented ‘wildtype’
stock of AM1 (CM2720) and the ∆cel mutant of the pink-pigmented ‘wildtype’ stock of PA1 (CM2730)
used for growth comparisons are described elsewhere (Delaney et al. 2013a). Standard growth conditions
utilized a modified version of Hypho minimal medium consisting of: 100 mL phosphate salts solution
(25.3 g of K2HPO4 plus 22.5 g Na2HPO4 in 1L deionized water), 100 mL sulfate salts solution (5 g of
(NH4)2SO4 and 2 g of MgSO4 • 7 H2O in 1L deionized water), 799 mL of deionized water, and 1 mL of
trace metal solution (Agashe et al. 2013). All components were autoclaved separately before mixing
under sterile conditions. Filter-sterilized carbon sources were added just prior to inoculation in liquid
minimal media with a final concentration of 15 mM methanol, 3.5 mM sodium succinate, 15 mM
methylamine hydrochloride, 7.5 mM ethanol, 5 mM sodium succinate, 15 mM glycine betaine, 7.5 mM
methanol and 1.25 mM succinate, or Difco nutrient broth. Difco nutrient broth (Becton, Dickson, and
Company, Franklin Lakes, NJ) was prepared according to the manufacturer’s guidelines.
Growth Rate Measurements
Cells were acclimated and grown in 48-well microtiter plates (CoStar-3548) in an incubation tower
(Liconic USA LTX44 with custom fabricated cassettes) shaking at 650 rpm, in a room that was constantly
maintained at 30 ºC and 80% humidity, (Delaney et al. 2013b), containing Hypho medium with the
appropriate carbon source to a volume of 640 L. All growth regimes consisted of three cycles consisting
of inoculation, acclimation, and growth measurement. All strains were stored in vials at -80 °C in 10%
DMSO; growth was initiated by transferring 10 L freezer stock into 10 mL of Hypho medium with 3.5
24
mM succinate. Upon reaching stationary phase (~2 days), cultures were transferred 1:64 into fresh
medium with the carbon source to be tested, allowed to reach saturation in this acclimation phase, and
diluted 1:64 again into fresh medium for the measured (experimental) growth. The increase in OD600 for
strains grown in 48-well microtiter plates was measured using an automated, robotic culturing and
monitoring system (Delaney et al. 2013b). A series of robotic instruments (including a shovel, a transfer
station, and a twister arm), all controlled by an open-source control program, Clarity (Delaney et al.
2013b), were used to move the 48-well plates from the incubation tower (Liconic USA LTX44 with
custom fabricated cassettes) to a Perkin-Elmer Victor2 plate reader for optical density (OD600)
measurements. The dynamics and specific growth rate of cultures were calculated from the log-linear
growth phase using an open source, custom-designed growth analysis software called CurveFitter
available at http://www.evolvedmicrobe.com/CurveFitter/ . Growth rates reported for each strain and
condition are the mean plus SEM calculated from triplicate biological replicates, unless otherwise noted.
Generation of Mutant Strains
M. extorquens PA1 deletion mutants lacking the mxa operon, fae, mptG, ftfL, glyA, or hprA (Figure 2.1,
Table 2.1) were generated on the genetic background of CM2730 using the allelic exchange vector
pCM433 (C. J. Marx 2008). The double deletion mutants lacking mptG and mch or fhcBACD were
generated on the genetic background of CM3803 (∆mptG in CM2730) using the allelic exchange vector
pCM433 (C. J. Marx 2008). A region upstream and downstream of each of these genes or operons of ~0.5
kb was amplified using PCR. The forward primer for the upstream flank was designed to have a 30 bp
long sequence at the 5’ end homologous to the sequence upstream of the NotI cut site in pCM433. The
reverse primer for the upstream flank was designed to have a 30 bp sequence at the 5’ end homologous to
the first 30 bp of the downstream flank. The reverse primer for the downstream flank was designed to
have a 30 bp long sequence at the 5’ end homologous to the sequence downstream of the NotI cut site in
pCM433. The PCR products representing the upstream and downstream flank were ligated on the
pCM433 vector cut with NotI using the Gibson assembly protocol described elsewhere (Gibson et al.
25
2009). Cloning the upstream and downstream flanks for fae, ftfL, glyA, mptG, the mxa operon, fhcBACD,
mch, and hprA in pCM433 resulted in pDN50, pDN56, pDN66, pDN68, pDN94, pDN108, pDN109, and
pDN125, respectively. Mutant strains of M. extorquens PA1 were made by introducing the appropriate
donor constructs through conjugation by a tri-parental mating between the competent E.coli NEB 10β
(New England Biolabs, Ipswich, MA) containing the donor construct, an E. coli strain containing the
conjugative plasmid pRK2073, and PA1 as described elsewhere (C. J. Marx 2008). All mutant strains
were confirmed by diagnostic PCR analysis and validated by Sanger sequencing the mutant locus. All
strains and plasmids used and generated for this study are listed in Table 2.1.
Results and Discussion
Comparison of methylotrophy genes in PA1 versus AM1
As a first step to compare methylotrophy in PA1 and AM1, we considered the content, similarity
and organization of C1 genes in each genome. Apart from 100% identity at the16S rRNA locus (25), the
two strains also share 95.9% ITS (Internal Transcribed Spacer) 1 sequence identity, each has five rrn
operons, and their GC contents are quite close (68.2% versus 68.5%). Of the 5333 coding sequences in
the PA1 genome, 4260 are shared with AM1 (amino acid identity > 30%). Of the 90 genes known to be
involved in methylotrophy, 62 have >99% identity and the remaining 28 have at least 95% identity at the
amino acid level between AM1 and PA1 (Table S1.1, Appendix 1). This repertoire includes the genes
involved in methanol oxidation, the H4MPT- and H4F-dependent C1-transfer pathways, the four formate
dehydrogenases, and genes of the serine cycle (Figure 2.1). The arrangement of genes is extremely similar
between the main chromosome of AM1 and PA1 (Figure S1.1, Appendix 1).
26
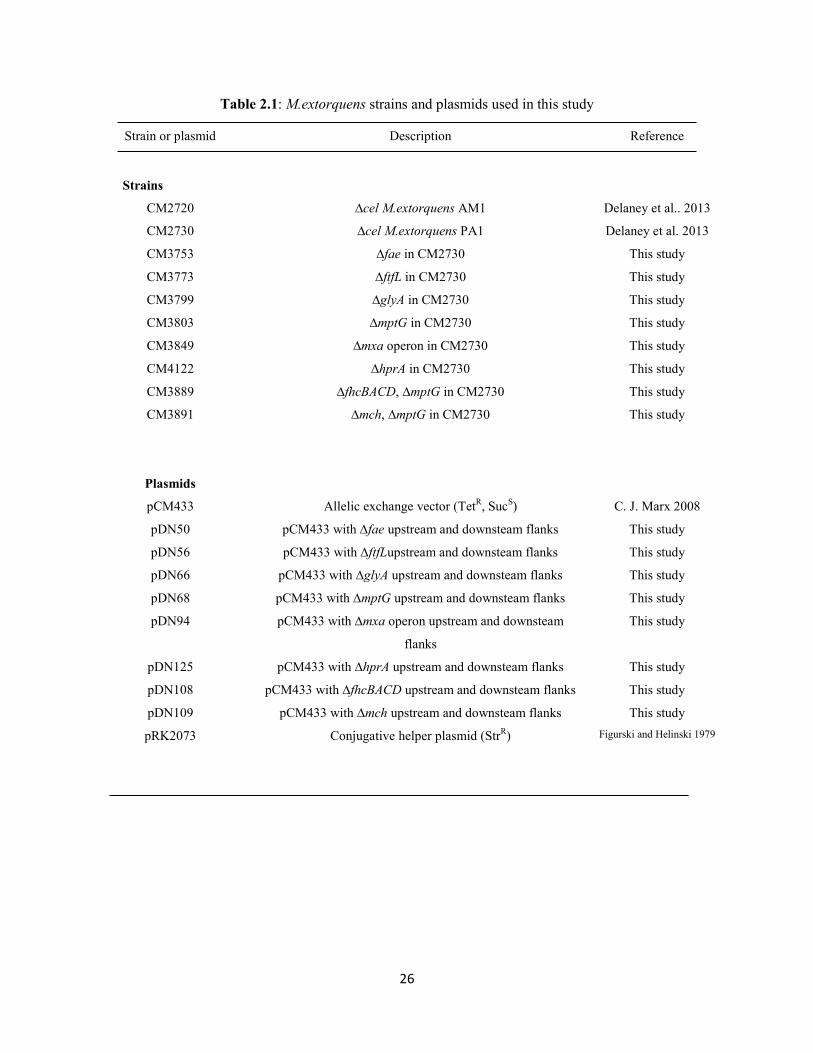
Table 2.1: M.extorquens strains and plasmids used in this study
Strain or plasmid Description Reference
Strains
CM2720
CM2730
CM3753
CM3773
CM3799
CM3803
CM3849
CM4122
CM3889
CM3891
Plasmids
pCM433
pDN50
pDN56
pDN66
pDN68
pDN94
pDN125
pDN108
pDN109
pRK2073
∆cel M.extorquens AM1
∆cel M.extorquens PA1
∆fae in CM2730
∆ftfL in CM2730
∆glyA in CM2730
∆mptG in CM2730
∆mxa operon in CM2730
∆hprA in CM2730
∆fhcBACD, ∆mptG in CM2730
∆mch, ∆mptG in CM2730
Allelic exchange vector (TetR, Suc
S)
pCM433 with ∆fae upstream and downsteam flanks
pCM433 with ∆ftfLupstream and downsteam flanks
pCM433 with ∆glyA upstream and downsteam flanks
pCM433 with ∆mptG upstream and downsteam flanks
pCM433 with ∆mxa operon upstream and downsteam
flanks
pCM433 with ∆hprA upstream and downsteam flanks
pCM433 with ∆fhcBACD upstream and downsteam flanks
pCM433 with ∆mch upstream and downsteam flanks
Conjugative helper plasmid (StrR)
Delaney et al.. 2013
Delaney et al. 2013
This study
This study
This study
This study
This study
This study
This study
This study
C. J. Marx 2008
This study
This study
This study
This study
This study
This study
This study
This study
Figurski and Helinski 1979
27
There is one major difference: the cluster of genes encoding methylamine dehydrogenase (mau) is
missing in PA1. The mau cluster in AM1 and M. extorquens CM4 is flanked by IS elements, and is also
missing in another sequenced strain, M. extorquens DM4. These data further support the hypothesis that
the mau cluster was acquired by horizontal gene transfer (Vuilleumier et al. 2009; Marx et al. 2012).
Phenotypic comparison of growth on C1 and multi-C substrates for PA1 versus AM1
Even though methylotrophy-specific genes are shared are extremely similar between PA1 and AM1, it
does not necessarily translate into quantitatively similar growth phenotypes on C1 compounds or multi-C
substrates. In order to rigorously compare the growth capabilities of the two strains, we took advantage of
the recent development of an automated, robotic platform for high-throughput, quantitative measurements
of M. extorquens growth (Delaney et al. 2013a, Delaney et al. 2013b). No significant difference in cell
shape, cell size and biomass/ OD600 ratio was observed between PA1 and AM1 (Table S2, Appendix 1)
hence maximum OD600 during growth was used as a proxy for yield. Additionally, for all phenotypic
analyses we used strains of PA1 and AM1 that lacked the cel locus for cellulose biosynthesis. The Δcel
manipulation prevents ‘clumping’ of cells in 48-well plates, thereby made growth measurements more
accurate and consistent (Delaney et al. 2013a). With a few notable exceptions, PA1 grew faster, with
significantly higher yields, than AM1 on C1 and multi-C substrates (Figure 2.2a and 2.2b). For C1
substrates like methanol and formate, PA1 grew 10-15% faster, with 50-75% higher yield on them, than
AM1. A stark difference in growth was observed on ethanol. An increase in OD600 (Figure 2.2b) after ~
48 hours of incubation indicated that AM1 does grow on ethanol, however we were unable to reliably
estimate the growth rate since it was below the detection limit (tD ~17.5 h) of our growth measurement
platform. In contrast, PA1 grew with a tD 4.39± 0.05 h (mean ± 95% C.I. (Confidence Interval) of the
mean of three biological replicates) on ethanol. At a genomic level, such a striking difference in ethanol
growth rates might be due to specific genes downstream of primary oxidation, such as an aldehyde
dehydrogeanse (Mext_1295), that are present in PA1 but absent in AM1. On multi-C organic acids, PA1
grew faster than AM1 by 5-25% with 12-25% higher yield.

28
Figure 2.2: A) Quantitative comparison of growth rates and B) maximum OD600 for the ∆cel ‘wild-type’ strain of
AM1 (filled) versus the ∆cel ‘wild-type’ strain of PA1 (open) on C1 substrates (M, 15 mM methanol; MA, 15 mM
methylamine; F, 15 mM formate), the joint C1 and multi-C substrate betaine (B, 15 mM), multi-carbon substrates (S,
3.5 mM succinate; P, 5 mM pyruvate; E, 7.5 mM ethanol) and a combination of C1 and multi-carbon substrates
(½M+½S, 1.75 mM succinate and 7.5 mM methanol). The line indicates the approximate detection limit of our
automated growth rate measurement device of 0.04 hr-1
. Growth rates for PA1 on MA or B and for AM1 on E were
below this detection limit. Error bars represent the 95% C.I. of the average of three biological replicates.
0
0.05
0.1
0.15
0.2
0.25
0.3
M MA B F ½M+½S S P E
GR
OW
TH
RA
TE
(h
-1)
AM1
PA1
0
0.1
0.2
0.3
0.4
0.5
M MA B F ½M+½S S P E
MA
XIM
UM
OD
600
AM1
PA1
A)
B)
29
In contrast to the results above, AM1 grew faster than PA1 on two C1 substrates: methylamine
and betaine (N, N, N- tri-methyl glycine). A small but significant increase in OD600 (Figure 2.2b)
indicated that PA1 can grow on methylamine, but the growth rate was extremely slow and below the
detection limit of our growth measurement platform. In PA1, slow methylamine growth was corroborated
by the lack of methylamine dehydrogeanse (mau) operon, and was consistent with the growth rates known
for other organisms dependent upon the N-methylglutamate pathway for methylamine utilization
(Martinez-Gomez et al. 2013; Gruffaz et al. 2014). Specific proteins involved in betaine transport and
utilization have not been discovered in AM1, so we can speculate that these genes may be missing or
insufficiently active in PA1. AM1 also grew faster than PA1 on Nutrient Broth. Growth in Nutrient Broth
did not have the typical log-linear dynamics that display a consistent, quantifiable growth rate (Figure
S1.2, Appendix 1) because: a) Nutrient Broth is a composite of many different growth substrates and b)
Nutrient Broth is not buffered so the pH of the media changes drastically over the course of growth.
However, given that AM1 reached stationary phase much before PA1, it was evident that AM1 grew
significantly faster than PA1 (Figure S1.2, Appendix 1). As previously hypothesized (Carroll et al. 2014),
faster growth of AM1 on Nutrient Broth may stem from ‘laboratory adaptation’ since AM1 was stored on
agar slants (Stieglitz and Mateles 1973) in the refrigerator for prolonged periods of time prior to
cryopreservation. These conditions could have led to cryptic nutrient cycling of a wide variety of
compounds, perhaps even lysed cell material, by surviving lineages (Carroll et al. 2014).
Genetic characterization of methylotrophy in PA1
In order to probe the architecture of the metabolic network involved in methylotrophy in PA1
(Figure 2.1) and ascertain how similar it is to that described for AM1, we deleted from the Δcel PA1
strain (referred to as WT from here on) key genes involved each methylotrophy-specific module and
examined the resulting growth phenotypes on C1, multi-C, and a combination of C1 and multi-C
substrates (Table S1.3-S1.8, Appendix 1).
30
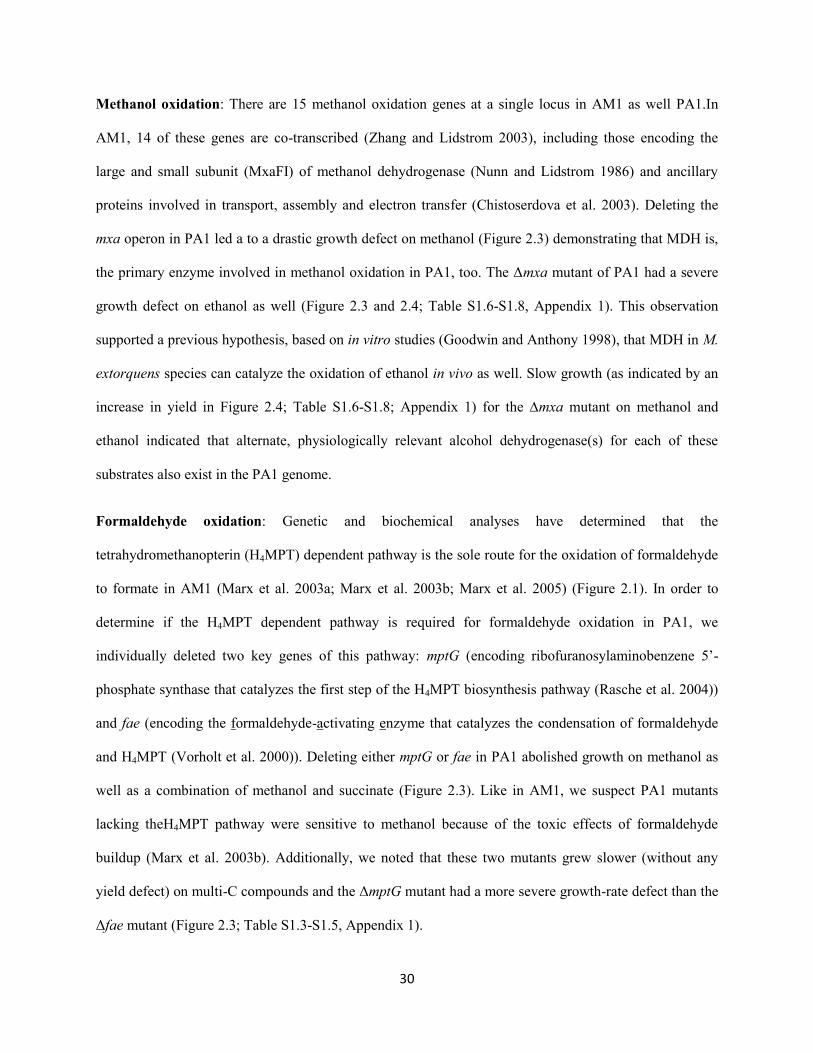
Methanol oxidation: There are 15 methanol oxidation genes at a single locus in AM1 as well PA1.In
AM1, 14 of these genes are co-transcribed (Zhang and Lidstrom 2003), including those encoding the
large and small subunit (MxaFI) of methanol dehydrogenase (Nunn and Lidstrom 1986) and ancillary
proteins involved in transport, assembly and electron transfer (Chistoserdova et al. 2003). Deleting the
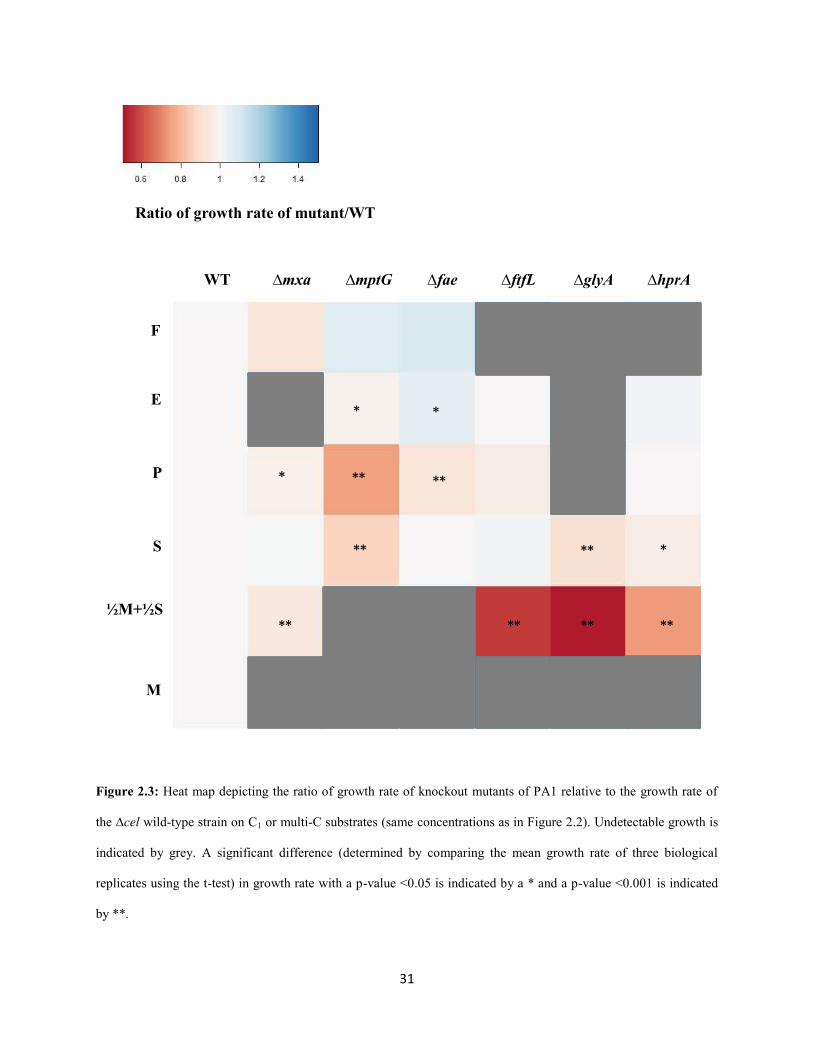
mxa operon in PA1 led a to a drastic growth defect on methanol (Figure 2.3) demonstrating that MDH is,
the primary enzyme involved in methanol oxidation in PA1, too. The Δmxa mutant of PA1 had a severe
growth defect on ethanol as well (Figure 2.3 and 2.4; Table S1.6-S1.8, Appendix 1). This observation
supported a previous hypothesis, based on in vitro studies (Goodwin and Anthony 1998), that MDH in M.
extorquens species can catalyze the oxidation of ethanol in vivo as well. Slow growth (as indicated by an
increase in yield in Figure 2.4; Table S1.6-S1.8; Appendix 1) for the ∆mxa mutant on methanol and
ethanol indicated that alternate, physiologically relevant alcohol dehydrogenase(s) for each of these
substrates also exist in the PA1 genome.
Formaldehyde oxidation: Genetic and biochemical analyses have determined that the
tetrahydromethanopterin (H4MPT) dependent pathway is the sole route for the oxidation of formaldehyde
to formate in AM1 (Marx et al. 2003a; Marx et al. 2003b; Marx et al. 2005) (Figure 2.1). In order to
determine if the H4MPT dependent pathway is required for formaldehyde oxidation in PA1, we
individually deleted two key genes of this pathway: mptG (encoding ribofuranosylaminobenzene 5’-
phosphate synthase that catalyzes the first step of the H4MPT biosynthesis pathway (Rasche et al. 2004))
and fae (encoding the formaldehyde-activating enzyme that catalyzes the condensation of formaldehyde
and H4MPT (Vorholt et al. 2000)). Deleting either mptG or fae in PA1 abolished growth on methanol as
well as a combination of methanol and succinate (Figure 2.3). Like in AM1, we suspect PA1 mutants
lacking theH4MPT pathway were sensitive to methanol because of the toxic effects of formaldehyde
buildup (Marx et al. 2003b). Additionally, we noted that these two mutants grew slower (without any
yield defect) on multi-C compounds and the ΔmptG mutant had a more severe growth-rate defect than the
Δfae mutant (Figure 2.3; Table S1.3-S1.5, Appendix 1).
31
Figure 2.3: Heat map depicting the ratio of growth rate of knockout mutants of PA1 relative to the growth rate of
the ∆cel wild-type strain on C1 or multi-C substrates (same concentrations as in Figure 2.2). Undetectable growth is
indicated by grey. A significant difference (determined by comparing the mean growth rate of three biological
replicates using the t-test) in growth rate with a p-value <0.05 is indicated by a * and a p-value <0.001 is indicated
by **.
WT ∆mxa ∆mptG ∆fae ∆ftfL ∆glyA ∆hprA
F
E
P
S
½M+½S
M
* *
* ** **
** ** *
** ** ** **
Ratio of growth rate of mutant/WT
32
Figure 2.4: Heat map depicting the ratio of maximum OD600 of knockout mutants of PA1 relative to the maximum
OD600 of the ∆cel wild-type strain on several C1 or multi-C substrates (same concentrations as in Figure 2.2).
Maximum OD600 values below 0.01 are indicated by grey. A significant difference in maximum OD600 (determined
by comparing the mean growth rate of three biological replicates using the t-test) with a p-value < 0.05 is indicated
by a * and a p-value <0.001 is indicated by **.
Ratio of Max. OD600
of mutant/WT
WT ∆mxa ∆mptG ∆fae ∆ftfL ∆glyA ∆hprA
F
E
P
S
½M+½S
M
** ** ** **
** * * *
**
*
*
**
33
For example, on pyruvate, the ΔmptG mutant grew 25% slower (p<0.001; Student’s two-sided t-test with
n=3) and the Δfae mutant grew 7% slower (p<0.01) than WT. These results are consistent with, and build
upon, previous work in AM1 that qualitatively demonstrated that the ΔmptG mutant has a growth defect
on succinate (Marx et al. 2003b). Furthermore, ethanol growth was not abolished in formaldehyde
oxidation mutants, suggesting that the overlap between methanol and ethanol growth includes just
primary oxidation but not any further oxidation steps (Table S1.3-S1.8, Appendix 1).
As observed in AM1 (Marx et al. 2003b), deletions in the genes encoding the final two enzymes
of the H4MPT pathway, mch and fhc (Pomper et al. 1999; Pomper and Vorholt 2001; Pomper et al. 2002),
could only be generated in strains already lacking H4MPT biosynthesis due to a lesion in mptG (Rasche et
al. 2004). This result is consistent with the hypothesis (Marx et al. 2003b) that a late block in the H4MPT
mediated formaldehyde oxidation pathway leads to the accumulation of either methylene- or methenyl-
H4MPT, which may be either be directly toxic and/or lead to a regulatory response halting growth.
Formate assimilation: In order to establish the role of the H4F mediated C1 transfer pathway during
methylotrophy in PA1, we deleted ftfL (encoding formate-H4F ligase) (Marx et al. 2003c) and assayed the
phenotype of the resulting strain on a panel of substrates (Figure 2.3 and Figure 2.4; Table S1.3-S1.8,
Appendix 1). The ∆ftfL mutant in PA1 could not grow on methanol or formate because of a lesion in the
first dedicated step toward assimilation of C1 compounds (Marx et al. 2005; Crowther et al. 2008) (Figure
2.3). Since carbon from multi-C can be shunted into biomass and rescue the inability to assimilate
methanol, we observed that the ΔftfL mutant could grow on a combination of methanol and succinate
(Marx et al. 2003c). However, the ΔftfL PA1 mutant, unlike the ∆ftfL AM1 mutant (Carroll et al. 2013),
did not have a significant growth rate or yield advantage on multi-C compounds (Table S1.3-S1.5,
Appendix 1).
Serine cycle: Carbon from C1 substrates is converted to various components of biomass through
the serine cycle in AM1 (C. Anthony 1982; Chistoserdova et al. 2003). To determine whether the serine
cycle plays a key role during C1 assimilation in PA1 as well, we deleted glyA (serine hydroxyl
34
methyltransferase), and hprA (hydroxypyruvate reductase) (Figure 2.1) (Chistoserdova et al. 2003). As in
AM1, neither mutant could grow on any C1 substrates (Figure 2.3). While the ΔhprA strain had WT-like
growth characteristics on multi-C compounds, the ΔglyA mutant exhibited several unexpected
phenotypes: a complete inability to grow on ethanol, extremely slow growth on pyruvate and a 10%
decrease (p<0.01) in growth rate on succinate compared to WT (Figure 2.3 and Figure 2.4; Table S1.3-
S1.8, Appendix 1). These results suggest that alternative pathway(s) used to generate C1-H4F
intermediates during multi-C growth, such as glycine cleavage (G. Kikuchi 1973), only partially rescue
growth in the ΔglyA strain. Future work will be required to understand why the magnitude of growth
defects on ethanol, pyruvate, and succinate varies for the ΔglyA mutant.
Growth on the combination of C1- and multi-C substrates: The major goal of this study was a
comprehensive comparison of the metabolic network involved in C1- and multi-C metabolism in PA1 to
that established for AM1. In addition, however, we also uncovered a number of unexpected growth
phenotypes, especially on the combination of C1- and multi-C substrates. In contrast to a previous study
(Peyraud et al. 2012), which showed that AM1 grows on a combination of succinate and methanol at the
same rate as succinate or methanol, PA1 grew 16% faster, with a 35% increase in yield, on a combination
of methanol and succinate, compared to succinate alone (Figure 2.5a and 2.5b). Just like AM1, however,
PA1 grew on a combination of methanol and succinate without the typical diauxic growth patterns. Since
growth on succinate is energy-limited and growth on methanol is reducing-power limited (Peyraud et al.
2012; Skovran et al. 2010), it is likely that growth and yield on methanol and succinate is greater because
the combination compensates for limitations posed by each substrate in isolation. Having determined the
growth characteristics of mutants in methylotrophy-specific modules on either just C1 or multi-C
compounds, we proposed straightforward hypotheses for phenotypes during growth on the combination of
C1 and multi-C substrates.
35
Figure 2.5: A) Ratio of growth rates, of the ∆cel ‘wildtype’ strain of PA1 and various knockout mutants, on a
combination of ½M+½S (7.5 mM methanol + 1.75 mM succinate) versus S (3.5 mM succinate). The dotted line
depicts the expected ratio for growth rate, if no methanol was oxidized in a combination of M+S. B) Ratio of yield
(measured as the maximum OD600 value during growth), for the ∆cel ‘wildtype’ strain of PA1 and various knockout
mutants, on M+S versus S. The dotted line depicts expected ratio for yields, if no methanol was assimilated in a
combination of M+S. For all data error bars represent the 95% C.I. of the average ratio of three biological replicates
grown in each condition.
0
0.2
0.4
0.6
0.8
1
1.2
1.4
WT ∆mxa ∆mptG ∆fae ∆ftfL ∆glyA ∆hprA
GR
OW
TH R
ATE
(½M
+½S)
/ G
RO
WTH
RA
TE (
S)
0
0.2
0.4
0.6
0.8
1
1.2
1.4
1.6
1.8
WT ∆mxa ∆mptG ∆fae ∆ftfL ∆glyA ∆hprA
YIE
LD
(½
M+
½S
) / Y
IEL
D (
S)
A)
B)
36
Since the ∆mxa mutant was incapable of methanol growth, we anticipated that its growth rate on a
combination of methanol and succinate would be the same as that on succinate, but with 50% lower yield
since the combination contains half the concentration of succinate and methanol. While the observed
yield on the combination matched the expected value, the ∆mxa mutant grew 11% faster (p<0.001) on the
combination than in succinate alone (Figure 2.5a and 2.5b). One possibility is that methanol is either
being sensed or oxidized by the XoxFI system -a MxaFI homolog that has been suggested to play a
regulatory role in M. extorquens (Skovran et al. 2011, Schmidt et al. 2010). Next, we hypothesized that
the C1 assimilation mutants (i.e., ∆ftfL, ∆glyA, and ∆hprA mutants) might be able to grow faster on a
combination of methanol and succinate because these mutants are capable of completely oxidizing
methanol to generate reducing power. The ability to generate additional reducing power from methanol
might also result in a proportional increase in the yield. Although yields on the combination of methanol
and succinate were significantly elevated for the ∆glyA and ∆hprA strains, growth rate was compromised
relative to succinate growth (∆ftfL and ∆glyA by 35% and ∆hprA by 9%; Figure 2.5a). This partial
methanol sensitivity, though not as severe as seen for H4MPT mutants, may be due to build-up of
(potentially toxic) C1 intermediates and/or a regulatory mismatch between C1 dissimilation and succinate
assimilation. Future work will be required to understand the basis for these effects, and to determine
whether they hold for other strains of Methylobacterium.
Conclusions
Aerobic methylotrophy is well studied in M. extorquens AM1; however, it also has a long history of
laboratory domestication, and a bulky, flexible genome containing a large number of IS elements that
pose challenges for both traditional genetic screens and selection for improved growth during laboratory
evolution. M. extorquens PA1, a closely related strain, was recently isolated from the environment and
overcomes these hurdles due to a streamlined, stable genome. Since extremely closely-related strains
sometimes occupy distinct niches (Shapiro et al. 2012) and have distinct metabolic capabilities, we felt it
was critical to compare the growth of PA1 and AM1 on a range of substrates in order to establish just
37
how much confidence one should have in transferring knowledge gained from the long-studied AM1 to
the newer option of PA1. With the exception of a couple of C1 substrates (methylamine, betaine) and
nutrient broth, PA1 grew significantly faster, with significantly higher yields, than AM1. In general,
growth rates and yield for AM1 might be slower due to mutations that occurred over the course of its
‘laboratory domestication’. Notably, there are two non-synonymous substitutions in the rpoB gene,
encoding one of the subunits of the RNA polymerase holoenzyme, which lead to rifamycin/rifampicin
resistance. These substitutions involved in rifampicin/rifamycin resistance were recently shown to lead to
slow growth (Carroll et al. 2014). The stark difference in growth rate and yield on substrates like betaine,
methylamine, and ethanol between the two strains might reflect adaptation/s to unique ecological niches
by each of these strains prior to isolation, such as via recent gain or loss of certain metabolic genes
(Coleman et al. 2006) or differential regulation (Coleman et al. 2006). Although we present a case for
PA1 being a more tractable system overall, these differences in substrate use would specifically make
PA1 a better system in which to study ethanol metabolism, whereas betaine metabolism may be better
addressed in AM1.
Our genetic analysis of methylotrophy in PA1 establishes that the roles of the various methylotrophy
specific modules during C1 growth are the same as described in AM1. In addition, owing to the
quantitative nature of our analyses, several knockout mutants also revealed unexpected phenotypes on
multi-C compounds as well as a combination of C1 and multi-C compounds. These phenotypes point
towards yet-undiscovered aspects of metabolism in these facultative methylotrophs in terms of regulation
that allows cells to switch between C1 metabolism and multi-C growth, as well as to establish balanced
growth on multiple substrates simultaneously.
38
References
1. Peel D, Quayle JR (1961) Microbial growth on C1 compounds. 1. Isolation and characterization of
Pseudomonas AM1. Biochem J. 81: 465-469.
2. Large PJ, Quayle JR (1963) Microbial growth on C1 compounds. 5. Enzyme activities in extracts of
Pseudomonas AM1. Biochem J. 87: 386-396.
3. Johnson PA, Quayle JR (1964) Microbial growth on C1 compounds. 6. Oxidation of methanol,
formaldehyde, and formate by methanol-growth Pseudomonas AM1. Biochem J. 93: 281-290.
4. Anthony C (1982) The biochemistry of methylotrophs. Academic Press Ltd., London.
5. Marx CJ, Lidstrom ME (2001) Development of improved versatile broad host-range vectors for use in
methylotrophs and other Gram-negative bacteria. Microbiology. 147: 2065-2075.
6. Marx CJ, Lidstrom ME (2002) Broad-host-range cre-lox system for antibiotic marker recycling in
Gram-negative bacteria. Biotechniques. 33: 1062-1067.
7. Marx CJ, O’Brien BN, Breezee J, Lidstrom ME (2003) Novel methylotrophy genes of
Methylobacterium extorquens AM1 identified by using transposon mutagenesis including a putative
dihydromethanopterin reductase. J. Bacteriol. 185: 669-673.
8. Marx CJ, Lidstrom ME (2004) Development of an insertional expression vector system for
Methylobacterium extorquens AM1 and generation of null mutants lacking mtdA and/or fch.
Microbiology. 150: 9-19.
9. Marx CJ (2008) Development of a broad-host-range sacB-based vector for unmarked allelic
exchange. BMC Res. Notes. 1: 1.
10. Choi YJ, Morel L, Bourque D, Mullick A, Massie B, Miguez CB (2006) Bestowing inducibility on
the cloned methanol dehydrogenase promoter (PmxaF) of Methylobacterium extorquens by applying
regulatory elements of Pseudomonas putida F1. Appl. Environ. Microbiol. 72: 7723-7729.
11. Chubiz LM, Purswani J, Carroll SM, Marx CJ (2013) A novel pair of inducible expression vectors for
use in Methylobacterium extorquens. BMC Res. Notes. 6: 183.
12. Kaczmarczyk A, Vorholt JA, Francez-Charlot A (2013) Cumate-inducible gene expression system for
sphingomonads and other Alphaproteobacteria. Appl. Environ. Microbiol. 79: 6795-6802.
13. Delaney NF, Kaczmarek ME, Ward LM, Swanson PK, Lee M-C, Marx CJ (2013) Development of an
optimized medium, strain, and high-throughput culturing methods for Methylobacterium extorquens.
PLoS One. 8: e62957.
14. Lee M-C, Chou H-H, Marx CJ (2009) Asymmetric, bimodal trade-offs during adaptation of
Methylobacterium to different growth substrates. Evolution. 63: 2816-2830.
15. Chistoserdova L, Chen SW, Lapidus A, Lidstrom ME (2003) Methylotrophy in Methylobacterium
extorquens AM1 from a genomic point of view. J. Bacteriol. 185:2980-2987.
16. Chistoserdova L, Kalyuzhnaya MG, Lidstrom ME (2009) The expanding world of methylotrophic
metabolism. Annu. Rev. Microbiol. 63: 477-499.
39
17. Vuilleumier S, Chistoserdova L, Lee M-C et al. (2009) Methylobacterium genome sequences: a
reference blueprint to investigate microbial metabolism of C1 compounds from natural and industrial
sources. PLoS One. 4: e5584.
18. Lee M-C, Marx CJ (2012) Repeated, selection-driven genome reduction of accessory genes in
experimental populations. PLoS Genetics. 8: e1002651.
19. Robinson DG, Lee M-C, Marx CJ (2012) OASIS: an automated program for global investigation of
bacterial and archaeal insertion sequences. Nucleic Acids Res. 40: e174.
20. Chou H-H, Berthet J, Marx CJ (2009) Fast growth increases the selective advantage of a mutation
arising recurrently during evolution under metal limitation. PLoS Genetics. 5: e1000652.
21. Chou H-H, Marx CJ (2012) Optimization of gene expression through divergent mutational paths. Cell
Rep. 1: 133-140.
22. Lee M-C, Marx CJ (2013) Synchronous waves of failed soft sweeps in the laboratory: remarkably
rampant clonal interference of alleles at a single locus. Genetics. 193: 943-952.
23. Carroll SM, Marx CJ (2013) Evolution after introduction of a novel metabolic pathway consistently
leads to restoration of wild-type physiology. PloS Genet. 9: e1003427.
24. Carroll SM, Xue KS, Marx CJ (2014) Laboratory divergence of Methylobacterium extorquens AM1
through unintended domestication and past selection for antibiotic resistance. BMC Microbiol. 14: 2.
25. Marx CJ, Bringel F, Chistoserdova L et al. (2012) Complete genome sequences of six strains of the
genus Methylobacterium. J. Bacteriol. 194: 4746-4748.
26. Knief C, Frances L, Vorholt JA (2010) Competitiveness of diverse Methylobacterium strains in the
phyllosphere of Arabidopsis thaliana and identification of representative models, including M.
extorquens PA1. Microb. Ecol. 60: 440-452.
27. Chistoserdova L, Vorholt JA, Thauer RK, Lidstrom ME (1998) C1 transfer enzymes and coenzymes
linking methylotrophic bacteria and methanogenic archaea. Science. 281: 99-102.
28. Marx CJ, Chistoserdova L, Lidstrom ME (2003) Formaldehyde-detoxifying role of the
tetrahydromethanopterin-linked pathway in Methylobacterium extorquens AM1. J. Bacteriol. 185:
7160-7168.
29. Chistoserdova L, Crowther GJ, Vorholt JA, Skovran E, Portais J-C, Lidstrom ME (2007)
Identification of a fourth formate dehydrogenase in Methylobacterium extorquens AM1 and
confirmation of the essential role of formate oxidation in methylotrophy. J. Bacteriol. 189: 9076-
9081.
30. Marx CJ, Laukel M, Vorholt JA, Lidstrom ME (2003) Purification of the formate-tetrahydrofolate
ligase from Methylobacterium extorquens AM1 and demonstration of its requirement for
methylotrophic growth. J. Bacteriol. 185: 7169-7175.
31. Marx CJ, Van Dien SJ, Lidstrom ME (2005) Flux analysis uncovers key role of functional
redundancy in formaldehyde metabolism, PloS Biol. 3: e16.

40
32. Crowther GJ, Kosaly G, Lidstrom ME (2008) Formate as the main branch point for methylotrophic
metabolism in Methylobacterium extorquens AM1. J. Bacteriol. 190: 5057-5062.
33. Maden EH (2000) Tetrahydrofolate and tetrahydromethanopterin compared: functionally distinct
carriers in C1 metabolism. Biochem. J. 350: 609-629.
34. Delaney NF, Rojas Echenique JI, Marx CJ (2013) Clarity: an open-source manager for laboratory
automation. J. Lab Autom. 18: 171-177.
35. Martinez-Gomez NC, Nguyen S, Lidstrom ME (2013) Elucidation of the role of methylene-
tetrahydromethanopterin dehydrogenase MtdA in the tetrahydromethanopterin-dependent oxidation
pathway in Methylobacterium extorquens AM1. J. Bacteriol.195:2359-2367.
36. Gruffaz C, Muller EEL, Louhichi-Jelail Y, Nelli YR, Guichard G, Bringel F (2014) Genes of the N-
methylglutamate pathway are essential for growth of Methylobacterium extorquens DM4 on
monomethylamine. Appl. Environ. Microbiol. 80:3541-3550.
37. Stieglitz B, Mateles RI (1973) Methanol metabolism in pseudomonad C. J. Bacteriol. 114: 390-398.
38. Zhang M, Lidstrom ME (2003) Promoters and transcripts for genes involved in methanol oxidation in
Methylobacterium extorquens AM1. Microbiology. 149: 1033-1040.
39. Nunn DN, Lidstrom ME(1986) Isolation and complementation analysis of 10 methanol oxidation
mutant classes and identification of the methanol dehydrogenase structural gene of Methylobacterium
sp. strain AM1. J. Bacteriol. 166: 581-590.
40. Goodwin PM, Anthony C (1998) The biochemistry, physiology, and genetics of PQQ and PQQ-
containing enzymes. Adv. Microb. Physiol. 40: 1-80.
41. Rasche ME, Havemann SA, Rosenzvaig M (2004) Characterization of two methanopterin
biosynthesis mutants of Methylobacterium extorquens AM1 by use of a tetrahydromethanopterin
bioassay. J. Bacteriol. 186: 1565-1570.
42. Vorholt JA, Marx CJ, Lidstrom ME, Thauer RK (2000) Novel formaldehyde-activating enzyme in
Methylobacterium extorquens AM1. 182: 6645-6650.
43. Pomper BK, Vorholt JA, Chistoserdova L, Lidstrom ME, Thauer RK (1999) A methenyl
tetrahydromethanopterin cyclohydrolase and a methenyl tetrahydrofolate cyclohydrolase in
Methylobacterium extorquens AM1. Eur. J. Biochem. 261: 475-480.
44. Pomper BK, Vorholt JA (2001) Characterization of the formyltransferase from Methylobacterium
extorquens AM1. Eur. J. Biochem. 268: 4769-4675.
45. Pomper BK, Saurel O, Milon A, Vorholt JA (2002) Generation of formate by the
formyltransferase/hydrolase (Fhc) complex in Methylobacterium extorquens AM1.FEBS Lett. 523:
133-137.
46. Carroll SM, Lee M-C, Marx CJ (2013) Sign epistasis limits evolutionary trade-offs at the confluence
of single- and multi-carbon metabolism in Methylobacterium extorquens AM1. Evolution. 68: 760-
771
41
47. Kikuchi G (1973) The glycine cleavage system: composition, reaction mechanism, and physiological
significance. Mol. Cell Biochem. 1: 169-187.
48. Peyraud R, Kiefer P, Christen P, Portais J-C, Vorholt JA (2012) Co-consumption of methanol and
succinate by Methylobacterium extroquens AM1. PLoS ONE.7: e48271.
49. Skovran E, Crowther GJ, Guo X, Yang S, Lidstrom ME (2010) A systems biology approach to
uncover cellular strategies used by Methylobacterium extorquens AM1 during the switch from multi-
to single-carbon growth. PloS One. 5: e14091.
50. Skovran E, Palmer AD, Rountree AM, Good NM, Lidstrom ME (2011) XoxF is required for
expression of methanol dehydrogenase in Methylobacterium extorquens AM1. J. Bacteriol. 193:
6032-6038.
51. Schmidt S, Christen P, Kiefer P, Vorholt JA (2010) Functional investigation of methanol
dehydrogenase-like protein XoxF in Methylobacterium extorquens AM1. Microbiology. 156: 2575-
2586.
52. Shapiro BJ, Friedman J, Cordero OX et al. (2012) Population genomics of early events in the
ecological differentiation of bacteria. Science.336: 48-51.
53. Coleman ML, Sullivan MB, Martiny AC et al. (2006) Genomic islands and the ecology and evolution
of Prochlorococcus. Science. 311: 1768-1770.
54. Agashe D, Martinez-Gomez NC, Drummond DA, Marx CJ (2013) Good codons, bad transcript: large
reductions in gene expression and fitness arising from synonymous mutations in a key enzyme. Mol.
Biol. Evol. 30: 549-560.
55. Gibson DG, Young L, Chuang RY et al. (2009) Enzymatic assembly of DNA molecules up to several
hundred kilobases. Nat. Methods. 6: 343-345.
56. Figurski DH, Helinski DR (1979) Replication of an origin-containing derivative of plasmid RK2
dependent on a plasmid function provided in trans. PNAS.76: 1648-1652.
Chapter 3
Methylamine utilization via a linear N-methylglutamate pathway
in Methylobacterium extorquens PA1 does not require
the tetrahydrofolate-dependent C1 transfer pathway
43
Methylamine utilization via a linear N-methylglutamate pathway in Methylobacterium extorquens
PA1 does not require the tetrahydrofolate-dependent C1 transfer pathway
Running title: Methylotrophic growth using a novel topology of C1 pathways
Dipti D. Nayak1 and Christopher J. Marx
1, 2, 3, 4, *
1Organismic and Evolutionary Biology, Harvard University, Cambridge, MA, USA,
2Faculty of Arts and
Sciences Center for Systems Biology, Harvard University, Cambridge, MA, USA, 3Biological Sciences,
University of Idaho, Moscow, ID, USA, 4Institute for Bioinformatics and Evolutionary Studies,
University of Idaho, Moscow, ID, USA.
* Corresponding author: Biological Sciences, University of Idaho, Moscow, ID 83843, USA. Tel.: + 1
208 885 8594; Fax: + 1 208 885 7905; E-mail: [email protected]
44
Abstract
Methylotrophs grow on reduced single carbon compounds like methylamine as the sole source of carbon
and energy. In Methylobacterium extorquens AM1, the best-studied aerobic methylotroph, a periplasmic
methylamine dehydrogenase that catalyzes the primary oxidation of methylamine to formaldehyde has
been examined in great detail. However, recent metagenomic data from natural ecosystems is revealing
the abundance and importance of lesser-known routes such as the N-methylglutamate pathway for
methylamine oxidation. In this paper we use M. extorquens PA1, a strain closely related to M. extorquens
AM1 but lacking the methylamine dehydrogenase, to dissect the genetics and physiology of the
ecologically relevant N-methylglutamate pathway for methylamine oxidation. Phenotypic analyses of null
mutants in genes encoding enzymes of the N-methylglutamate pathway strongly support a linear topology
for the pathway in M.extorquens PA1. Furthermore, analysis of M. extorquens PA1 mutants with lesions
in methylotrophy-specific dissimilatory and assimilatory modules suggested that, compared to other C1-
substrates, methylamine use via the N-methylglutamate pathway results in a shift of the branch point for
C1 metabolism from formate to formaldehyde and/or methylene tetrahydrofolate (CH2=H4F). Due to this
shift, the C1 flux emerging from the N-methylglutamate pathway is routed through the pre-existing
metabolic network in a novel fashion where a complete H4F-mediated pathway for C1 assimilation is no
longer needed. Additionally, we present genetic evidence that formaldehyde-activating enzyme (FAE)
homologs might be involved in methylotrophy. Null mutants revealed that FAE and FAE2 influence
growth rate and FAE3 influences yield during growth of M. extorquens PA1 on methylamine.
Introduction
Methylated amines are a large group of biologically, industrially, and environmentally relevant
compounds. The simplest methylated amine, (mono-) methylamine (MA), is produced by anaerobic
bacteria that decarboxylate nitrogenous organic matter in the gastrointestinal tract or animal waste, and
decompose methylated osmolytes such as glycine betaine in the marine environment (Ge et al. 2011;
45
Oremland et al. 1982). In addition, a growing fraction of MA is also being released during the degradation
of nitrogen containing herbicides and pesticides (Chen et al. 2010a), biomass combustion (Ge et al. 2011),
and industrial processes such as fish processing. MA also plays an important role in the global carbon and
nitrogen budget (Oremland et al. 1982; Neff et al. 2002). However, MA does not accumulate in aerobic
environments (Neff et al. 2002) because it gets rapidly consumed by methylotrophs, that oxidize reduced
single-carbon or C1 substrates to produce biomass and CO2 (C. Anthony 1982), and serves as a nitrogen
source for several classes of aerobic microorganisms (Chen et al. 2010b; Y. Chen 2012).
There are three well-characterized enzymes/pathways used by methylotrophs to oxidize MA. In many
gram-negative methylotrophs, such as Methylobacterium extorquens AM1 (hereafter AM1), MA is
oxidized by a periplasmic dehydrogeanse (MaDH) (Eady and Large 1962; Chistoserdov et al. 1991) to
formaldehyde. Methylamine oxidase, a Cu-containing enzyme present in Gram-positive methylotrophs
(Van Iersel et al. 1986) and methylotrophic yeast (Cai et al. 1994) oxidizes MA to formaldehyde (Dooley
et al. 1990) in a single step as well. In contrast, the N-methylglutamate (NMG) pathway, originally
described in Pseudomonas spp. (now Aminobacter sp. (Shaw et al. 1966)), is a complex, multi-step
pathway in which the methyl group from MA is transferred to glutamate to form two novel amino acid
derivatives - NMG and γ-glutamylmethylamide (GMA) - which are then oxidized to release
formaldehyde (Bamforth and O’Connor 1979). The NMG pathway involves at least three unique
enzymes: N-methylglutamate synthase, N-methylglutamate dehydrogenase, and γ-glutamylmethylamide
synthetase (Chen et al. 2010a; Latypova et al. 2010; Martinez-Gomez et al. 2013; Gruffaz et al. 2014).
While the enzymes involved in the NMG pathway were purified and characterized over three decades ago
(Hersh et al. 1971; Pollock and Hersh 1973; Bamforth and Large 1977a; Bamforth and Large 1977b;
Kung and Wagner 1969; Boulton et al. 1979), the genes were discovered very recently (Chen et al. 2010a;
Latypova et al. 2010; Gruffaz et al. 2014). Genes encoding the enzymes of the NMG pathway are often
clustered in a ~10 kb genomic region (Figure 3.1).
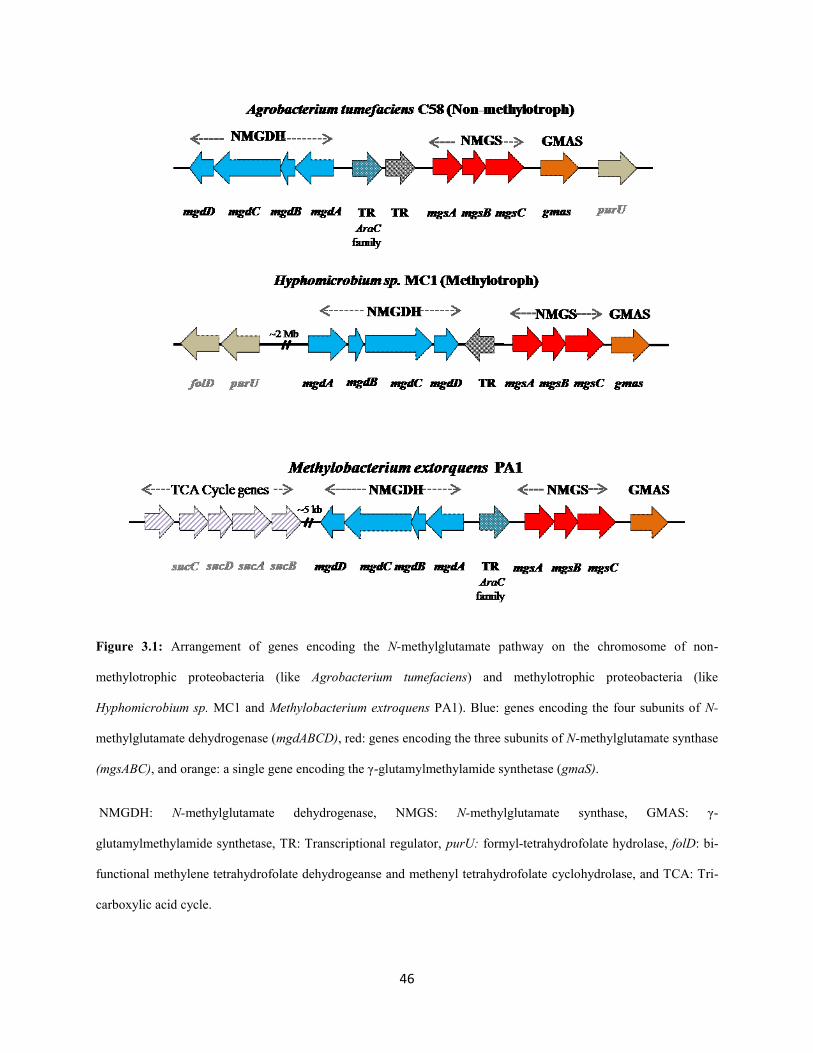
46
Figure 3.1: Arrangement of genes encoding the N-methylglutamate pathway on the chromosome of non-
methylotrophic proteobacteria (like Agrobacterium tumefaciens) and methylotrophic proteobacteria (like
Hyphomicrobium sp. MC1 and Methylobacterium extroquens PA1). Blue: genes encoding the four subunits of N-
methylglutamate dehydrogenase (mgdABCD), red: genes encoding the three subunits of N-methylglutamate synthase
(mgsABC), and orange: a single gene encoding the γ-glutamylmethylamide synthetase (gmaS).
NMGDH: N-methylglutamate dehydrogenase, NMGS: N-methylglutamate synthase, GMAS: γ-
glutamylmethylamide synthetase, TR: Transcriptional regulator, purU: formyl-tetrahydrofolate hydrolase, folD: bi-
functional methylene tetrahydrofolate dehydrogeanse and methenyl tetrahydrofolate cyclohydrolase, and TCA: Tri-
carboxylic acid cycle.

47
A sarcosine oxidase-like group of four genes encode the N-methylglutamate dehydrogeanse (mgdABCD),
a glutamate synthase-like group of three genes encode the N-methylglutamate synthase (mgsABC) and a
glutamine synthetase-like gene encodes the γ-glutamylmethylamide synthetase (gmaS). Since the
discovery of the NMG pathway gene cluster, sequence based analysis has revealed that the NMG pathway
is present in a large fraction of methylotrophs (even those containing MADH) as well as non-
methylotrophs where it serves to extract the nitrogen from MA (Chen et al. 2010b).
Recent genetic analyses of the NMG pathway have produced somewhat contradictory results in terms of
its topology. A study using Methyloversatilis universalis FAM5 (a facultative methylotroph of the
Betaproteobacteria) (Latypova et al. 2010) showed that the enzyme γ-glutamylmethylamide synthetase
was not essential for MA growth using the NMG pathway. This observation supported a branched
topology for the NMG pathway (Figure 3.2a): MA flux gets partitioned to NMG (via N-methylglutamate
synthase) and GMA (via γ-glutamylmethylamide synthetase) and each of these amino acid derivatives,
independently, get oxidized to formaldehyde. However, in Methylocella silvestris BL2 (a facultative
methanotroph of the Alphaproteobacteria) (Chen et al. 2010a) and very recently, Methylobacterium
extroquens DM4 (hereafter DM4) (Gruffaz et al. 2014), γ-glutamylmethylamide synthetase was shown to
be essential for MA growth. These studies supported a linear topology for the NMG pathway (Figure
3.2b) where GMA, not MA, is the true substrate for N-methylglutamate synthase (Pollock and Hersh
1971) and N-methylglutamate dehydrogenase is the sole enzyme involved in dissimilation. A linear
topology for the NMG pathway was further corroborated by the absence of an additional GMA
dissimilating enzyme in many NMG pathway-containing methylotrophs (Chen et al. 2010a).
Additionally, uncertainty surrounding the end-product of methylamine oxidation via the NMG pathway
has occluded our understanding of how the NMG pathway feeds into the C1 assimilatory and
dissimilatory modules. For a long time, it was assumed that methylamine oxidation mediated by the NMG
pathway led to the production of formaldehyde (Bamforth and Large 1977a).
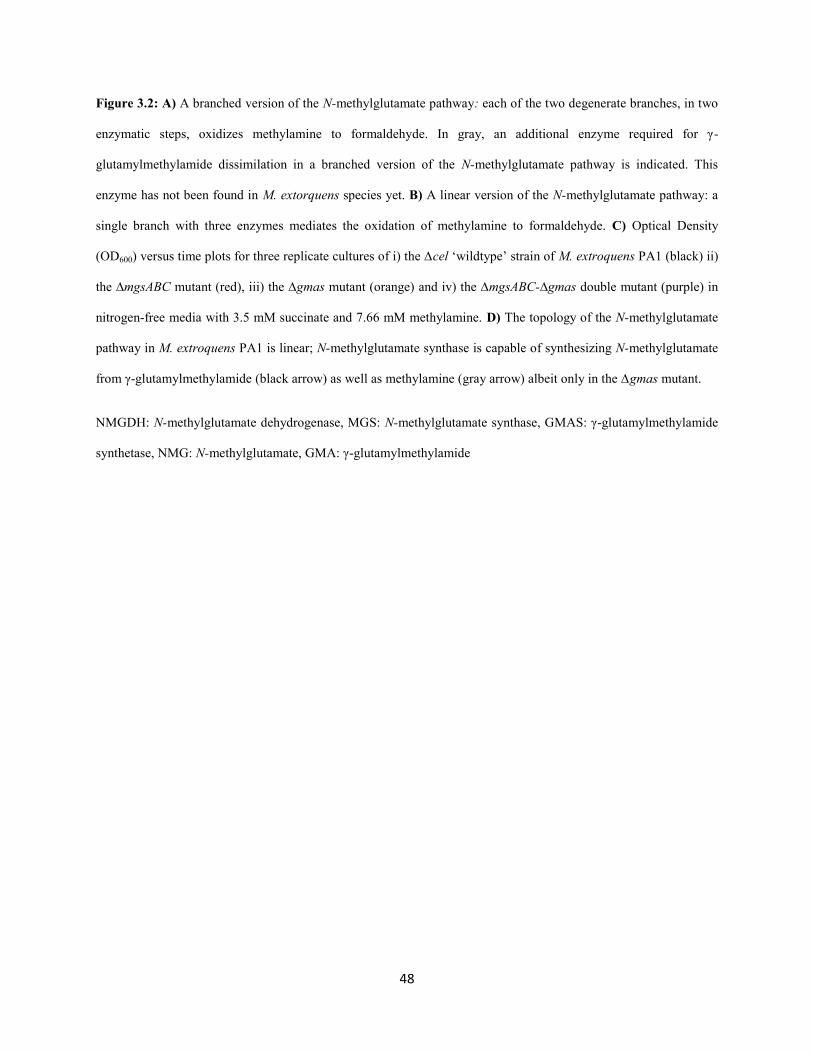
48
Figure 3.2: A) A branched version of the N-methylglutamate pathway: each of the two degenerate branches, in two
enzymatic steps, oxidizes methylamine to formaldehyde. In gray, an additional enzyme required for γ-
glutamylmethylamide dissimilation in a branched version of the N-methylglutamate pathway is indicated. This
enzyme has not been found in M. extorquens species yet. B) A linear version of the N-methylglutamate pathway: a
single branch with three enzymes mediates the oxidation of methylamine to formaldehyde. C) Optical Density
(OD600) versus time plots for three replicate cultures of i) the ∆cel ‘wildtype’ strain of M. extroquens PA1 (black) ii)
the ∆mgsABC mutant (red), iii) the ∆gmas mutant (orange) and iv) the ∆mgsABC-∆gmas double mutant (purple) in
nitrogen-free media with 3.5 mM succinate and 7.66 mM methylamine. D) The topology of the N-methylglutamate
pathway in M. extroquens PA1 is linear; N-methylglutamate synthase is capable of synthesizing N-methylglutamate
from γ-glutamylmethylamide (black arrow) as well as methylamine (gray arrow) albeit only in the ∆gmas mutant.
NMGDH: N-methylglutamate dehydrogenase, MGS: N-methylglutamate synthase, GMAS: γ-glutamylmethylamide
synthetase, NMG: N-methylglutamate, GMA: γ-glutamylmethylamide
49
0
0.05
0.1
0.15
0.2
0.25
0 5 10 16 21 26 31 37 42
Op
tica
l D
ensi
ty (
OD
60
0)
Time (Hours)
WT(2)
mgs(3)
gmas(3)
mgs_gmas(2)
GMAS
Glutamate, ATP
ADP
Glutamate
NH4
+
(GMA)
(NMG)
NMGDH
GMA
dissimilation?
NADH,
Glutamate
H2O
H2O
NH4
+
, glutamate, 2e-
CH3NH
2
NMGS
HCHO
CH3NH
2
NMGS
GMAS
Glutamate, ATP
ADP
(GMA)
(NMG)
HCHO
NMGDH
NH4
+
H2O
Glutamate,
NADH
WT
∆mgsABC
∆gmas
∆mgsABC ∆gmas
CH3NH
2
NMGS*
GMAS
Glutamate, ATP
ADP
(GMA)
HCHO
NMGDH
NH4
+
H2O
Glutamate,
NADH
(NMG)
NH4
+
NMGS
A) B)
C)
D)
50
Then, as observed during methanol growth in M. extorquens species (Nayak and Marx 2014), the
tetrahydromethanopterin (H4MPT)-dependent formaldehyde oxidation pathway (Marx et al. 2003a) would
serve as the primary dissimilatory module. Formate, thus produced, would be incorporated into biomass
through the H4F-dependent C1 assimilation pathway (Marx et al. 2003b; Marx et al. 2005; Crowther et al.
2008) and the serine cycle (Chistoserdova et al. 2003) (Figure S2.1, Appendix 2). Of late, genes encoding
a dissimilatory version of the H4F-dependent C1 transfer pathway (Vannelli et al. 1999) (characterized by
the presence of folD and purU instead of mtdA, fch, and ftfL) have been found in the vicinity of the NMG
pathway gene cluster (Latypova et al. 2010) (Figure 3.1). Additionally, N-methylglutamate
dehydrogenase (mgdC) contains a tetrahydrofolate (H4F) binding domain and produces CH2=H4F in the
presence of H4F in vitro (Latypova et al. 2010). In light of these recent findings, CH2=H4F, instead of
formaldehyde, has been proposed as the end product of the NMG pathway. Like in the case of
chloromethane metabolism by M. extroquens CM4 (Vannelli et al. 1999; Studer et al. 2002), CH2=H4F as
the end-product of primary oxidation would seem to circumvent the need for a H4MPT-dependent
formaldehyde oxidation pathway. A portion of the CH2=H4F would get directly assimilated via the serine
cycle, while the rest would be oxidized by the dissimilatory branch of the H4F-dependent C1 transfer
pathway (Figure S2.2, Appendix 2). However, with burgeoning sequence data, we now know that
methylotrophs, including Methyloversatilis universalis FAM5 (the source of the NMGDH assayed in
vitro) that encode the NMG pathway often do not contain either folD or purU (data not shown). How do
these methylotrophs oxidize CH2=H4F to formate, then? Or does MA oxidation via the NMG pathway
lead to the production of some free formaldehyde, instead?
In order to better understand how the NMG pathway operates in vivo, we genetically dissected its
physiology in M. extorquens PA1 (hereafter PA1). Although PA1 utilizes methanol in the same way as
the better characterized AM1 strain (Nayak and Marx 2014), here we find that it lacks methylamine
dehydrogenase and only possesses the NMG pathway for MA use. By creating mutant strains with lesions
in one or more genes of the NMG pathway and assaying the growth patterns of each of these strains on
51
MA, we uncovered that the NMG pathway has a linear topology in PA1 akin to that very recently
suggested for DM4 and M. silvestris BL2. MA growth of null mutants in genes encoding enzymes of
modules involved in C1 transfer pathways revealed a novel pattern; the H4MPT-dependent formaldehyde
oxidation pathway was required for C1 dissimilation whereas an intact H4F-mediated C1 transfer pathway
was not required for either formate assimilation or dissimilation of CH2=H4F. Further, we unveiled that
homologs of FAE (Formaldehyde Activating Enzyme) (Vorholt et al. 2000), often found in genomes of
methylotrophs (FAE2, FAE3), (Kalyuzhnaya et al. 2005; Chistoserdova et al. 2009) play a functional role
during methylamine growth using the NMG pathway. The presence of either FAE or FAE2 significantly
increased growth rate but not yield on methylamine whereas the presence of FAE3 increased yield on
methylamine.
Materials and Methods
Bacterial Strains and Growth Conditions
Strains relevant to this study included the following: the ∆cel strain of the pink-pigmented ‘wildtype’
stock of M. extorquens AM1 (CM2720), the ∆cel strain of the pink-pigmented ‘wildtype’ stock of M.
extorquens PA1 (CM2730) as described elsewhere (Delaney et al. 2013a). Unless specified, all growth
conditions utilized a modified version of Hypho minimal medium consisting of: 100 mL phosphate salts
solution (25.3 g of KH2PO4 plus 22.5 g Na2HPO4 in 1L deionized water), 100 mL sulfate salts solution (5
g of (NH4)2SO4 and 2 g of MgSO4 • 7 H2O in 1L deionized water), 799 mL of deionized water, and 1 mL
of trace metal solution (Agashe et al. 2013)). A nitrogen-free version of the modified Hypho minimal
media used the same recipe as above but with a nitrogen-free sulfate salts solution: (7 g of MgSO4 • 7
H2O in 1L deionized water).All components were autoclaved separately before mixing under sterile
conditions. Filter-sterilized carbon sources were added just prior to inoculation in liquid minimal media
with a final concentration of: 3.5 mM sodium succinate, 15 mM methylamine hydrochloride, 15 mM
methanol, and 3.5 mM sodium succinate with 7.66 mM methylamine as a nitrogen source.
52
Growth Rate Measurements
Apart from growth on methylamine as a carbon source, all other growth measurements were conducted
using an automated growth platform (Delaney et al. 2013b). All growth regimes consisted of three cycles
consisting of inoculation, acclimation, and growth measurement. All strains were stored in vials at -80 °C
in 10% DMSO; growth was initiated by transferring 10 L freezer stock into 10mL of Hypho medium
with 3.5 mM succinate in 50 mL flasks (covered with a 50 mL plastic beaker) in a shaking incubator at
225 r.p.m. and maintained at 30ºC. Upon reaching stationary phase (~2 days), cultures were transferred
1:64 into fresh medium (in 48-well microtiter plates- CoStar 3548) with the carbon source to be tested to
a final volume of 640 L, allowed to reach saturation in this acclimation phase, and diluted 1:64 again
into fresh medium for the measured (experimental) growth. The 48-well microtiter plates were incubated
in a room maintained at 30ºC and 80% humidity in an incubation tower (Liconic USA LTX44 with
custom fabricated cassettes) shaking at 650 rpm (Delaney et al. 2013b).The increase in OD600 for strains
grown in 48-well microtiter plates was measured using an automated, robotic culturing and monitoring
system (Delaney et al. 2013b). A series of robotic instruments (including a shovel, a transfer station, and a
twister arm), all controlled by Clarity, were used to move the 48-well plates from the incubation tower to
a Perkin-Elmer Victor2 plate reader for optical density (OD600) measurements. The dynamics and specific
growth rate of cultures were calculated from the log-linear growth phase using an open source, custom-
designed growth analysis software called CurveFitter available at
http://www.evolvedmicrobe.com/CurveFitter/ .
Growth on methylamine as a carbon source was below the detection threshold of the automated growth
platform described above. Growth from freezer stocks at -80 ºC was initiated by transferring 10 L
freezer stock into 10 mL of Hypho medium with 3.5 mM succinate in 50 mL flasks (covered with a 50
mL plastic beaker) in a shaking incubator at 225 r.p.m. and maintained at 30ºC. Upon reaching stationary
phase (~2 days), cultures were transferred 1:16 into 9.4 mL fresh medium with 20 mM methylamine
hydrochloride and allowed to reach saturation in this acclimation phase (~3 days), and diluted 1:16 again
53
into 9.4 mL fresh medium with 15 mM methylamine for the measured (experimental) growth (~3 days).
A 50 μL aliquot of three replicate cultures, for each strain, was sampled every 8-10 hours during the
growth phase. Optical Density of the culture was measured at 600 nm (OD600) using a spectrophotometer
(Bio-Rad). The dynamics and specific growth rate of cultures were calculated from the log-linear growth
phase. Yield (Max OD600) was measured as the maximum OD600 during the growth phase. Growth rate
and yield reported for each strain and condition is the mean calculated from three biological replicates,
unless otherwise noted.
Methanol and Methylamine Shock Experiments
10 μL of the freezer stock of CM3803 (∆mptG in CM2730) and CM 2730 were grown in 48-well
microtiter plates with 3.5 mM succinate as the carbon source. . Upon reaching stationary phase (~2 days)
CM3803 and CM2730 were transferred 1:64 into 630 L of fresh medium with 3.5 mM succinate in two
48-well microtiter plates. After 12 hours of incubation, a pulse of methanol resulting in a final
concentration of: a) 1 mM methanol, b) 5 mM methanol , c) 10mM methanol , and d) 50 mM methanol
was added to triplicate cultures of CM3803 and CM2730 in one 48-well plate. Similarly, after 12 hours of
incubation, a pulse of methylamine resulting in a final concentration of: a) 1 mM methylamine, b) 5 mM
methylamine , c) 10mM methylamine , and d) 50 mM methylamine was added to triplicate cultures of
CM3803 and CM2730 in the other 48-well plate. Triplicate control wells of CM2730 and CM3803 (to
which no methanol and methylamine were added) were maintained in each 48-well plate as well. The
increase in OD600 was measured as described earlier.
Generation of Mutant Strains
M. extorquens PA1 deletion mutants lacking mgsABC, fae2, fae3, gmaS and mgdABCD were generated
on the genetic background of CM2730 using the allelic exchange vector pCM433 (C. J. Marx 2008). The
double deletion mutants lacking fae and fae2 or fae3 were generated on the genetic background of
CM3753 (∆fae in CM2730) using the allelic exchange vector pCM433 (C. J. Marx 2008). The double
54
deletion mutants lacking fae2 and fae3 was generated on the genetic background of CM3757 (∆fae2 in
CM2730) using the allelic exchange vector pCM433 (C. J. Marx 2008). The double deletion mutants
lacking mgsABC and gmaS was generated on the genetic background of CM3733 (∆mgsABC in CM2730)
using the allelic exchange vector pCM433 (C. J. Marx 2008).The triple deletion mutants lacking fae, fae2,
and fae3 were generated on the genetic background of CM4208 (∆fae∆fae3 in CM2730) using the allelic
exchange vector pCM433 (C. J. Marx 2008). A region upstream and downstream of each of these genes
or operons of ~0.5 kb was amplified using PCR. The forward primer for the upstream flank was designed
to have a 30 bp long sequence at the 5’ end homologous to the sequence upstream of the NotI cut site in
pCM433. The reverse primer for the upstream flank was designed to have a 30 bp sequence at the 5’ end
homologous to the first 30 bp of the downstream flank. The reverse primer for the downstream flank was
designed to have a 30 bp long sequence at the 5’ end homologous to the sequence downstream of the NotI
cut site in pCM433. The PCR products representing the upstream and downstream flank were
simultaneously ligated into the pCM433 vector cut with NotI using a three-part Gibson assembly protocol
described elsewhere (Gibson et al. 2009). Cloning the upstream and downstream flanks for fae2, fae3,
mgsABC, gmaS and mgdABCD in pCM433 resulted in pDN51, pDN52, pDN53, pDN54, pDN55,
respectively. Mutant strains of M. extorquens PA1 were made by introducing the appropriate donor
constructs through conjugation by a tri-parental mating between the NEB 10β competent cells (New
England Biolabs, Ipswich, MA) containing the donor construct, an E. coli strain containing the
conjugative plasmid pRK2073, and PA1 as described elsewhere (C. J. Marx 2008). All mutant strains
were confirmed by a diagnostic PCR analysis and validated by Sanger sequencing the mutant locus. All
strains and plasmids used and generated for this study are listed in Table 3.1.
Results
M. extorquens PA1 uses a linear version of the N-methylglutamate pathway for methylamine
utilization
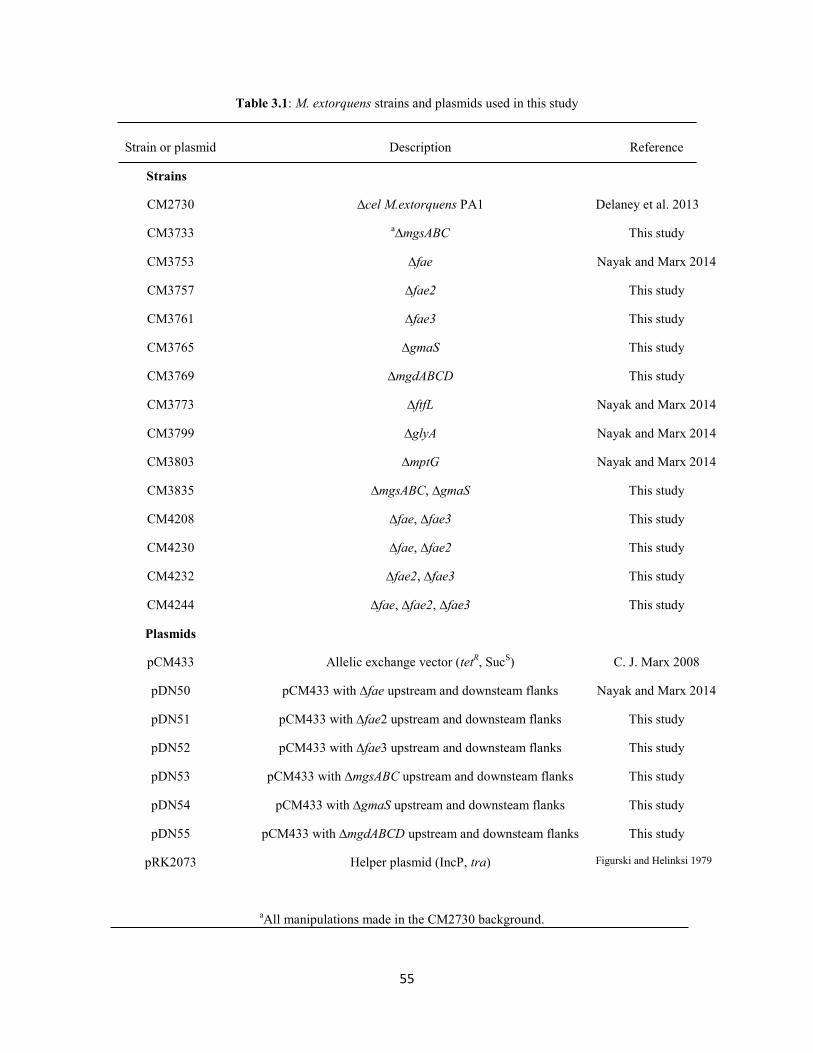
55
Table 3.1: M. extorquens strains and plasmids used in this study
Strain or plasmid Description Reference
Strains
CM2730
CM3733
CM3753
CM3757
CM3761
CM3765
CM3769
CM3773
CM3799
CM3803
CM3835
CM4208
CM4230
CM4232
CM4244
Plasmids
pCM433
pDN50
pDN51
pDN52
pDN53
pDN54
pDN55
pRK2073
∆cel M.extorquens PA1
a∆mgsABC
∆fae
∆fae2
∆fae3
∆gmaS
∆mgdABCD
∆ftfL
∆glyA
∆mptG
∆mgsABC, ∆gmaS
∆fae, ∆fae3
∆fae, ∆fae2
∆fae2, ∆fae3
∆fae, ∆fae2, ∆fae3
Allelic exchange vector (tetR, Suc
S)
pCM433 with ∆fae upstream and downsteam flanks
pCM433 with ∆fae2 upstream and downsteam flanks
pCM433 with ∆fae3 upstream and downsteam flanks
pCM433 with ∆mgsABC upstream and downsteam flanks
pCM433 with ∆gmaS upstream and downsteam flanks
pCM433 with ∆mgdABCD upstream and downsteam flanks
Helper plasmid (IncP, tra)
aAll manipulations made in the CM2730 background.
Delaney et al. 2013
This study
Nayak and Marx 2014
This study
This study
This study
This study
Nayak and Marx 2014
Nayak and Marx 2014
Nayak and Marx 2014
This study
This study
This study
This study
This study
C. J. Marx 2008
Nayak and Marx 2014
This study
This study
This study
This study
This study
Figurski and Helinksi 1979
56
Our strain of PA1 lacking the cel locus encoding cellulose biosynthesis (to prevent clumping and permit
accurate measurement of growth characteristics; simply referred to as WT here) (Delaney et al. 2013a)
could grow on 15 mM MA with an average growth rate of 0.042 h-1
, and an average final OD600 of 0.712
(three biological replicates throughout unless otherwise noted). A 10 kb genomic region encoding
enzymes of the NMG pathway was recently characterized in DM4 during the preparation of this
manuscript (Gruffaz et al. 2014). In PA1, a completely syntenic cluster of nine genes (of which eight had
>95% amino acid identity and one had ~93% amino acid identity to the corresponding genes in DM4)
encoding the enzymes of the NMG pathway was observed as well (Figure 2.1). To determine if the NMG
pathway is active and involved in MA oxidation, we made and tested the growth of null mutants lacking
individual enzymes of the NMG pathway on MA. No growth or measurable change in OD600 was
observed for the ∆mgdABCD mutant, the ∆mgsABC mutant, or the ∆gmaS mutant on MA as the sole
carbon source. Contrary to studies in other methylotrophs (Latypova et al. 2010), we did not detect any
growth for the ∆gmaS mutant on any concentration of MA ranging from 1 to 25 mM after 7 days, or after
a14 day incubation on 15 mM MA. The essential role of all three enzymes (especially GMAS) for
methylamine oxidation supported a linear topology for the NMG pathway in PA1.
In order to even more sensitively test whether MA could be converted by mutant strains, we took
advantage of the fact that MA can also be used as a nitrogen source given that ammonia (NH4+) ions are a
by-product of MA oxidation (Figure 3.2a, 3.2b). When MA is used only as a nitrogen source in the
presence of another carbon source, the stoichiometric ratio of biomass (A. C. Redfield 1958) and carbon
yield of the serine cycle (Van Dien and Lidstrom 2002) indicates that cells need to intake 15-20 fold more
carbon than nitrogen. As a result, growth on succinate with MA as a nitrogen source is 5-fold faster than
on MA as a carbon source, requires a 3-4 fold lower rate of MA conversion and is still contingent on a
functional NMG pathway. We leveraged these fast growth conditions to detect subtle phenotypes for
NMG pathway null mutants and further verify the linear topology of the NMG pathway. If the NMG
pathway is linear then neither the ∆mgsABC mutant nor the ∆gmaS mutant should be able to use MA as a
57
nitrogen source (Figure 3.2a). If the NMG pathway is branched then, both, the ∆mgsABC mutant and the
∆gmaS mutant should be able to use MA as a nitrogen source (Figure 3.2b). While the ∆mgsABC mutant
and the ∆mgsABC-∆gmaS double mutant could not use MA as a nitrogen source (Figures 3.2c), the
∆gmaS mutant grew poorly in succinate with MA as the nitrogen source without the typical log-linear
growth characteristics (Figure 3.2c). The marginal ability of the ∆gmaS mutant to use MA as a nitrogen
source indicated that the conversion of MA to NMG (with a concomitant release of NH4+) catalyzed by
NMGS is physiologically relevant only when GMAS is absent. Additionally, the inability of the
∆mgsABC mutant to use MA as a nitrogen source corroborated the lack of a GMA-dissimilating enzyme
in PA1. Altogether, these data are congruent with a linear topology for the NMG pathway in PA1 as
indicated in Figure 3.2d.
The H4MPT-dependent formaldehyde oxidation pathway is required during growth on MA with
the NMG pathway
It was recently proposed that, instead of formaldehyde, the oxidized C1 compound emerging from the
NMG pathway might actually be CH2=H4F (Latypova et al. 2010). If so, this end-product should obviate
the H4MPT-mediated formaldehyde oxidation pathway during MA growth. We tested the hypothesis that
MA growth mediated by the NMG pathway avoids formaldehyde production by examining a mutant
lacking mptG (encoding β-ribofuranosylaminobenzene 5’-phosphate synthase: the first enzyme of the
H4MPT biosynthesis pathway (Rasche et al. 2004). Previous work with AM1 has shown that methanol
oxidation leads to formaldehyde buildup and rapid cell death in the ∆mptG mutant, and that MA has the
same effect, albeit to a lesser extent (Marx et al. 2003a). We measured the capacity of the ∆mptG mutant
in PA1 to withstand conditions that might lead to the production of variable amounts of formaldehyde at
different rates.
First, we tested the capacity of the ∆mptG mutant to tolerate different doses of methanol shock and MA
shock during growth on a multi-carbon substrate (succinate). As had been seen with AM1, even a pulse of
58
1 mM methanol completely inhibited the growth of the ∆mptG mutant of PA1 on succinate (Figure 3.3a).
In contrast, a pulse of 50 mM MA did not impede the growth of the ∆mptG mutant in succinate (Figure
3.3b). Since the ∆mptG mutant was resilient to MA shock, we then tested whether it could use MA as the
sole nitrogen source. WT, the ∆mptG mutant, and the ∆mgsABC mutant, were grown to saturation on
succinate with NH4+ as the nitrogen source, and were then diluted 64-fold in media with succinate as the
carbon source and MA as the sole nitrogen source. After ~16 hours, the ∆mgsABC mutant could no longer
grow whereas WT and the ∆mptG mutant continued to grow (Figure 3.3c). These growth data suggested
that once the internal nitrogen reservoir ran out, the ∆mptG mutant could still use MA as a nitrogen
source; growth was moderately compromised (23% slower on succinate with MA as the nitrogen source
compared to NH4+ as the nitrogen source; p<0.001 for the difference in mean growth rate of three
biological replicates compared using the Student’s t-test). The growth defect incurred by using MA versus
NH4+ as a nitrogen source for the ∆mptG mutant was more severe than for WT, where growth on
succinate with MA as the nitrogen source was merely 11% slower than with NH4+ as the nitrogen source
(p=0.001) (Table S2.1, Appendix 2).
Next, we examined the ability of the ∆mptG mutant strain to grow on MA as the sole carbon source. No
observable growth or significant change in OD600 was detected for the ∆mptG mutant strain on MA as a
carbon source (Figure 3.4). In order to quantify the extent of H4MPT-dependent formaldehyde oxidation
required during MA growth we used a strain lacking fae (encoding formaldehyde-activating enzyme that
catalyzes the condensation of free formaldehyde with H4MPT (Vorholt et al. 2000)). A marginal rate of
CH2=H4MPT production can be sustained by the spontaneous condensation of formaldehyde and H4MPT
in a ∆fae mutant (Vorholt et al. 2000). Therefore, the fae deletion only partially abolishes the H4MPT
dependent formaldehyde oxidation pathway and leads to an intermediate mutant phenotype in terms of
methanol sensitivity (Marx et al. 2003a). Unlike the ∆mptG strain, the fae deletion showed WT-like MA
growth (Figure 3.4).
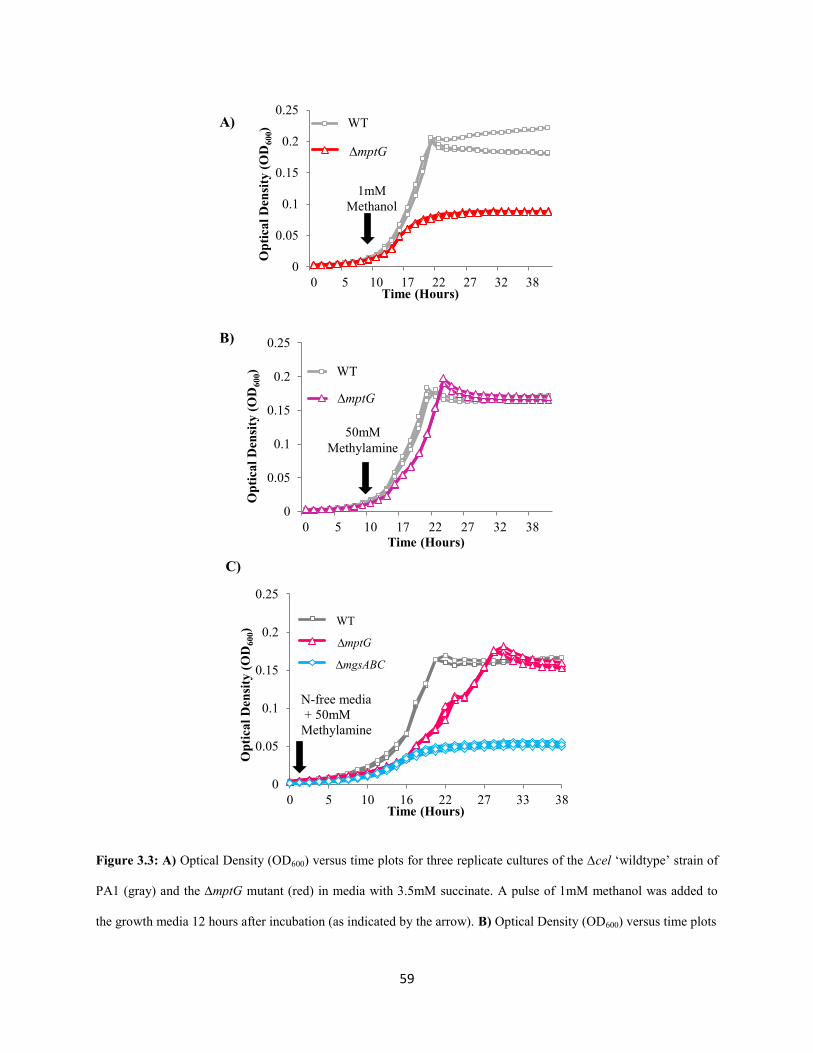
59
Figure 3.3: A) Optical Density (OD600) versus time plots for three replicate cultures of the ∆cel ‘wildtype’ strain of
PA1 (gray) and the ∆mptG mutant (red) in media with 3.5mM succinate. A pulse of 1mM methanol was added to
the growth media 12 hours after incubation (as indicated by the arrow). B) Optical Density (OD600) versus time plots
0
0.05
0.1
0.15
0.2
0.25
0 5 10 16 22 27 33 38
Op
tica
l D
ensi
ty (
OD
600)
Time (Hours)
2730
3803
3765
WT
∆mptG
∆mgsABC
0
0.05
0.1
0.15
0.2
0.25
0 5 10 17 22 27 32 38
Op
tica
l D
ensi
ty (
OD
600)
Time (Hours)
WT
Series4
WT
∆mptG
1mM
Methanol
0
0.05
0.1
0.15
0.2
0.25
0 5 10 17 22 27 32 38
Op
tica
l D
ensi
ty (
OD
600)
Time (Hours)
WT
Series4
50mM Methylamine
WT
∆mptG
N-free media + 50mM
Methylamine
A)
B)
C)
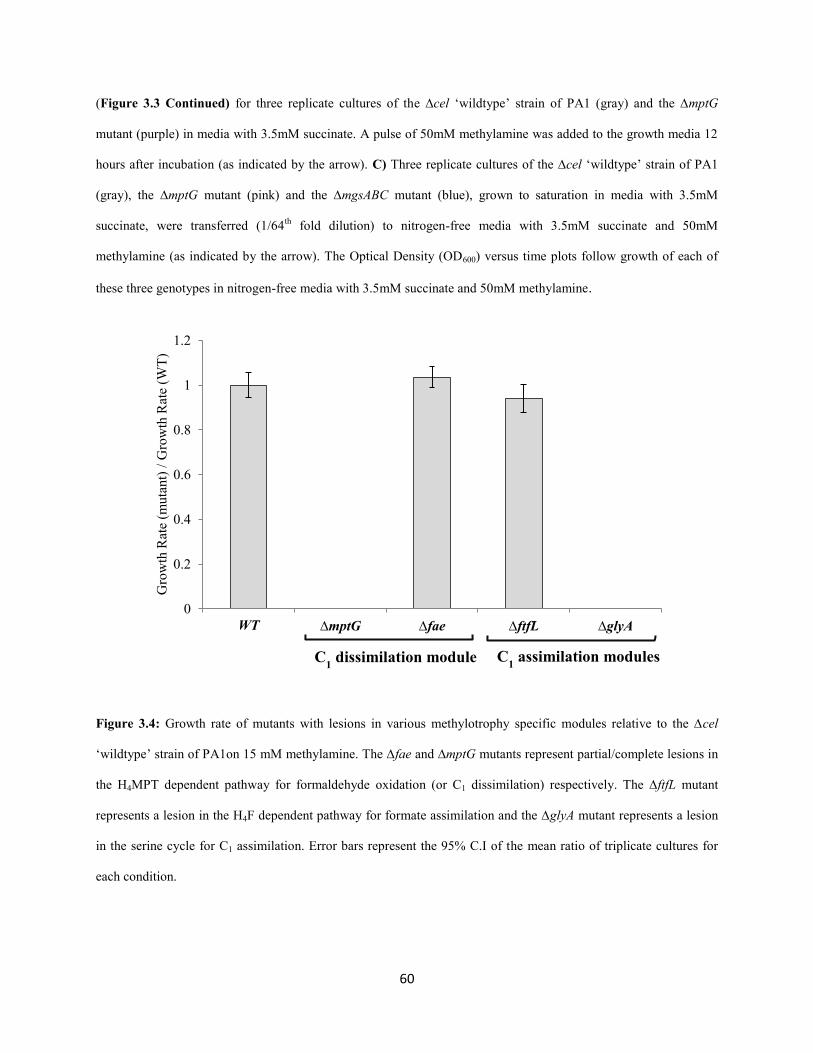
60
(Figure 3.3 Continued) for three replicate cultures of the ∆cel ‘wildtype’ strain of PA1 (gray) and the ∆mptG
mutant (purple) in media with 3.5mM succinate. A pulse of 50mM methylamine was added to the growth media 12
hours after incubation (as indicated by the arrow). C) Three replicate cultures of the ∆cel ‘wildtype’ strain of PA1
(gray), the ∆mptG mutant (pink) and the ∆mgsABC mutant (blue), grown to saturation in media with 3.5mM
succinate, were transferred (1/64th
fold dilution) to nitrogen-free media with 3.5mM succinate and 50mM
methylamine (as indicated by the arrow). The Optical Density (OD600) versus time plots follow growth of each of
these three genotypes in nitrogen-free media with 3.5mM succinate and 50mM methylamine.
Figure 3.4: Growth rate of mutants with lesions in various methylotrophy specific modules relative to the ∆cel
‘wildtype’ strain of PA1on 15 mM methylamine. The ∆fae and ∆mptG mutants represent partial/complete lesions in
the H4MPT dependent pathway for formaldehyde oxidation (or C1 dissimilation) respectively. The ∆ftfL mutant
represents a lesion in the H4F dependent pathway for formate assimilation and the ∆glyA mutant represents a lesion
in the serine cycle for C1 assimilation. Error bars represent the 95% C.I of the mean ratio of triplicate cultures for
each condition.
0
0.2
0.4
0.6
0.8
1
1.2
WT ∆mptG ∆fae ∆ftfL ∆glyA
Gro
wth
Rat
e (m
uta
nt)
/ G
row
th R
ate
(WT
)
C1 dissimilation module C
1 assimilation modules
61
During MA growth, the absolute requirement for the H4MPT-mediated formaldehyde oxidation pathway
indicates that at least some of the carbon from MA is ending up as formaldehyde, but the slow rate of
formaldehyde oxidation needed can be sustained in the absence of FAE.
An intact H4F pathway is not required for assimilation or dissimilation during methylamine growth
of M. extorquens PA1
Growth of M. extorquens on any methylotrophic compound yet tested requires an intact H4F pathway for
either assimilation (i.e., methanol growth) (Marx et al. 2003) or dissimilation (i.e., chloromethane growth
by CM4) (Studer et al. 2002). Given that at least some of the carbon from MA appears to require the
H4MPT pathway for dissimilation, we tested whether a complete H4F-dependent C1 transfer pathway was
also required for MA growth. A strain lacking ftfL (encoding formyl-tetrahydrofolate ligase that catalyzes
the reduction of formate and free H4F to formyl-H4F in an ATP-dependent manner (Marx et al. 2003b))
cannot grow on C1 compounds like methanol and formate (Nayak and Marx 2014) because of an early
block in assimilation (Marx et al, 2003b). Contrary to other C1 compounds, the ∆ftfL mutant could not
only grow on MA, but at a rate indistinguishable from WT (p = 0.8887). In contrast, a mutant lacking
glyA (encoding serine hydroxymethyltransferase (Chistoserdova and Lidstrom 1994)) was incapable of
MA growth, confirming that C1 units are still assimilated via the serine cycle. These data, especially the
non-essentiality of ftfL, indicate that use of the NMG pathway for MA growth involves a novel flow of
carbon through the C1-specific metabolic pathways such that the H4MPT-dependent pathway handles
oxidation, and CH2=H4F enters directly into the serine cycle. This observation is consistent with a shift in
the branch-point of metabolism from formate to either formaldehyde or CH2=H4F (or both) during MA
growth, as depicted in Figure 3.5c and 3.5d.
FAE-homologs play a functional role during MA growth in PA1
Do any unique gene products play a role in rerouting carbon through the C1-specific metabolic pathways
when the NMG pathway operates?
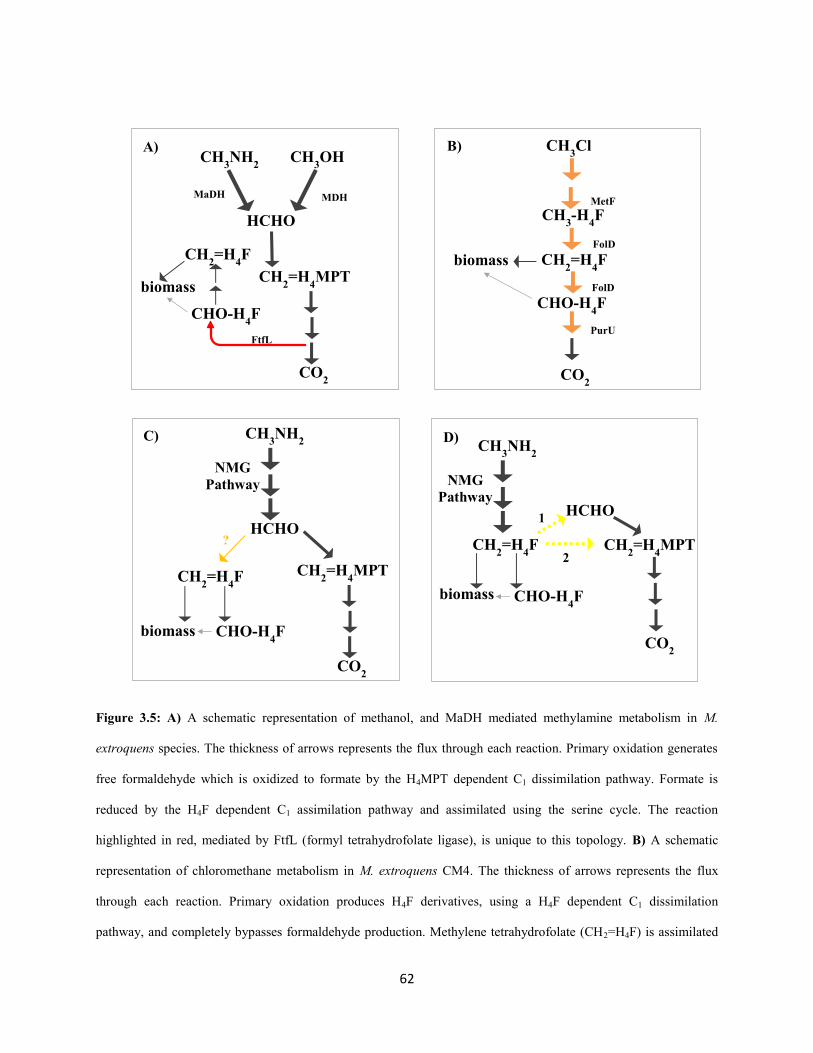
62
Figure 3.5: A) A schematic representation of methanol, and MaDH mediated methylamine metabolism in M.
extroquens species. The thickness of arrows represents the flux through each reaction. Primary oxidation generates
free formaldehyde which is oxidized to formate by the H4MPT dependent C1 dissimilation pathway. Formate is
reduced by the H4F dependent C1 assimilation pathway and assimilated using the serine cycle. The reaction
highlighted in red, mediated by FtfL (formyl tetrahydrofolate ligase), is unique to this topology. B) A schematic
representation of chloromethane metabolism in M. extroquens CM4. The thickness of arrows represents the flux
through each reaction. Primary oxidation produces H4F derivatives, using a H4F dependent C1 dissimilation
pathway, and completely bypasses formaldehyde production. Methylene tetrahydrofolate (CH2=H4F) is assimilated
CH3NH
2
HCHO
CH2=H
4MPT
CO2
CH2=H
4F
CH3OH
MaDH
MDH
CHO-H4F
FtfL
CH3Cl
CH2=H
4F
CH3-H
4F
CHO-H4F
biomass
CO2
MetF
FolD
FolD
PurU
CH3NH
2
NMG
Pathway
HCHO
CH2=H
4MPT
CO2
CH2=H
4F
CHO-H4F
?
CH3NH
2
NMG
Pathway
CH2=H
4F
CHO-H4F
HCHO
CH2=H
4MPT
CO2
1
2
A) B)
C) D)
biomass
biomass
biomass
63
Figure 3.5(Continued) using the serine cycle. The reactions highlighted in orange - catalyzed by enzymes of the
H4F dependent C1 dissimilatory pathway (MetF, FolD and PurU) - are unique to this topology. C) A schematic
representation of the metabolic network involved in methylamine growth if the end-product of the N-
methylglutamate pathway is formaldehyde. The thickness of arrows represents the flux through each reaction. The
condensation of formaldehyde and H4F to form CH2=H4F, highlighted in orange, is unique to this topology. D) A
schematic representation of the metabolic network involved in methylamine growth if the end-product of the N-
methylglutamate pathway is CH2=H4F. The thickness of arrows represents the flux through each reaction. CH2=H4F
enters the H4MPT mediated C1 assimilation pathway either by dissociation to formaldehyde (Reaction 1) or by a
direct cofactor switch (Reaction 2). These two alternate reactions, indicated in yellow dashed arrows, are unique to
this topology. In PA1, the topology of methylamine metabolism in vivo, could also be a linear combination of the
topology shown in C) and D) if the NMG pathway formaldehyde as well as CH2=H4F during primary oxidation of
methylamine.
Many methylotrophs, including PA1, have two distant FAE homologs – fae2 (Mext_3143) and fae3
(Mext_1450) – in the genome, yet their role in methylotrophy, if any, remains unknown (Kalyuzhnaya et
al. 2005; Chistoserdova et al. 2004). We hypothesized that these gene products may play a role during
MA growth, perhaps catalyzing some of the novel reactions in Figure 3.5c and Figure 3.5d. To test our
hypothesis, we deleted fae, fae2, and fae3 individually and in all possible combinations (Figure 3.6a,
3.6b), and tested the growth of each of these mutants on 15 mM MA. Neither fae2 nor fae3 were essential
for MA growth since all the single-, double- and triple-knockout mutants could grow on MA. Growth
rates of strains encoding either one of fae or fae2 were indistinguishable from or significantly higher than
PA1 in the case of the ∆fae2 mutant (12%; p = 0.0108). However, mutant strains lacking both fae and
fae2 showed a significant growth defect on MA (Figure 3.6a). In addition, all mutant strains lacking fae3
showed a significant yield (maximum OD600) defect relative to WT on MA (Figure 3.6b).To determine
whether the role of fae2, and fae3 in methylotrophy was limited to growth on MA via the NMG pathway,
we tested the growth of each of these mutants on another C1 compound (methanol), a multi-C compound
(succinate), and succinate with MA as the nitrogen source (Figure S2.3, Appendix 2). As expected (Marx
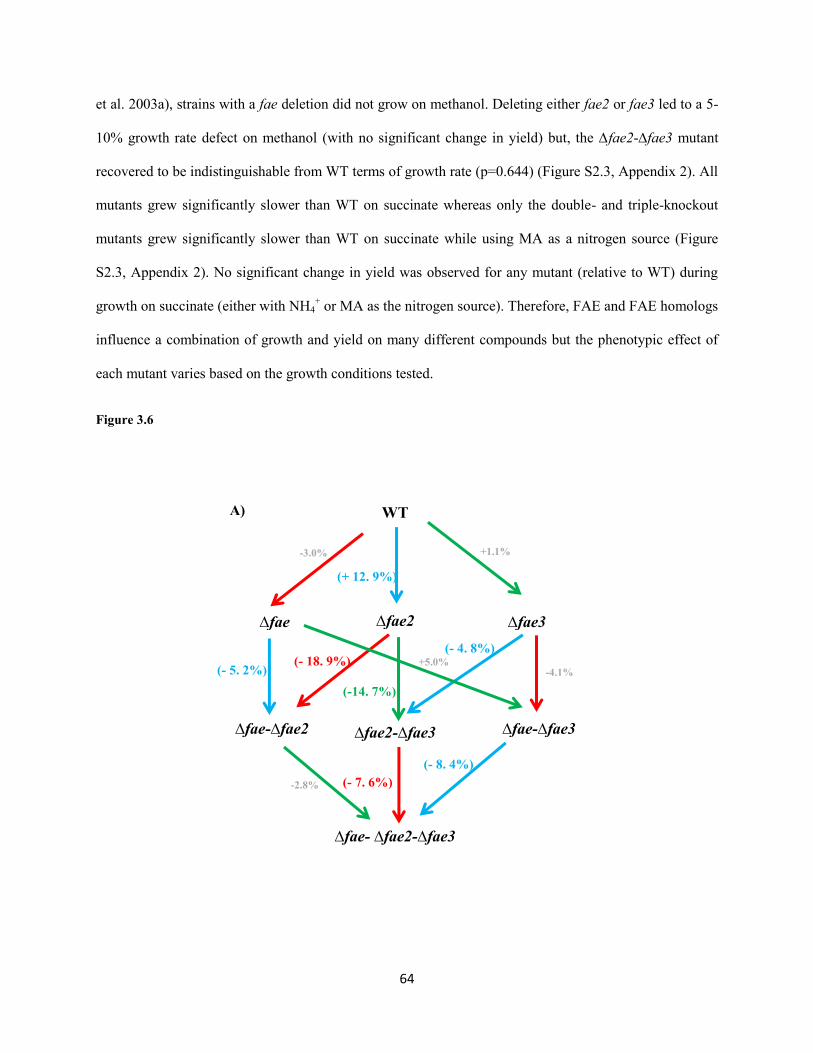
64
et al. 2003a), strains with a fae deletion did not grow on methanol. Deleting either fae2 or fae3 led to a 5-
10% growth rate defect on methanol (with no significant change in yield) but, the ∆fae2-∆fae3 mutant
recovered to be indistinguishable from WT terms of growth rate (p=0.644) (Figure S2.3, Appendix 2). All
mutants grew significantly slower than WT on succinate whereas only the double- and triple-knockout
mutants grew significantly slower than WT on succinate while using MA as a nitrogen source (Figure
S2.3, Appendix 2). No significant change in yield was observed for any mutant (relative to WT) during
growth on succinate (either with NH4+ or MA as the nitrogen source). Therefore, FAE and FAE homologs
influence a combination of growth and yield on many different compounds but the phenotypic effect of
each mutant varies based on the growth conditions tested.
Figure 3.6
WT
∆fae2
∆fae2-∆fae3
∆fae- ∆fae2-∆fae3
-3.0%
(+ 12. 9%)
+1.1%
(- 5. 2%) (- 18. 9%)
(-14. 7%)
(- 4. 8%)
-4.1% +5.0%
-2.8%
(- 8. 4%) (- 7. 6%)
A)
∆fae ∆fae3
∆fae-∆fae2 ∆fae-∆fae3
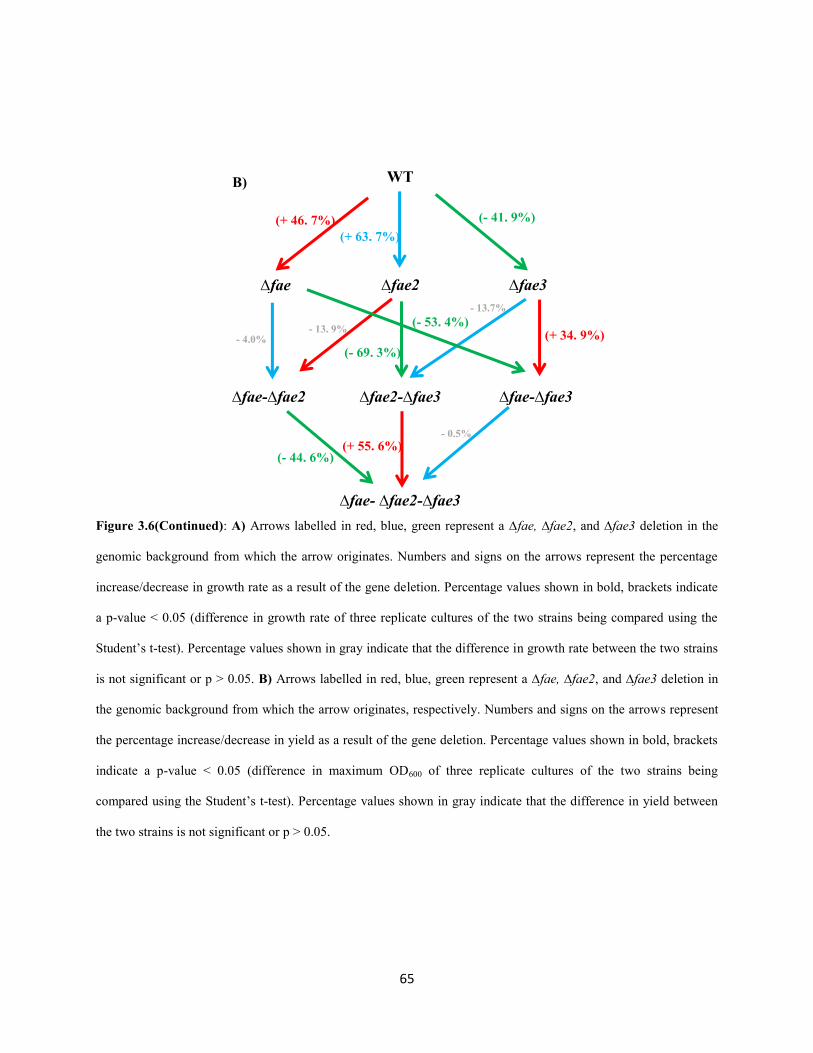
65
Figure 3.6(Continued): A) Arrows labelled in red, blue, green represent a ∆fae, ∆fae2, and ∆fae3 deletion in the
genomic background from which the arrow originates. Numbers and signs on the arrows represent the percentage
increase/decrease in growth rate as a result of the gene deletion. Percentage values shown in bold, brackets indicate
a p-value < 0.05 (difference in growth rate of three replicate cultures of the two strains being compared using the
Student’s t-test). Percentage values shown in gray indicate that the difference in growth rate between the two strains
is not significant or p > 0.05. B) Arrows labelled in red, blue, green represent a ∆fae, ∆fae2, and ∆fae3 deletion in
the genomic background from which the arrow originates, respectively. Numbers and signs on the arrows represent
the percentage increase/decrease in yield as a result of the gene deletion. Percentage values shown in bold, brackets
indicate a p-value < 0.05 (difference in maximum OD600 of three replicate cultures of the two strains being
compared using the Student’s t-test). Percentage values shown in gray indicate that the difference in yield between
the two strains is not significant or p > 0.05.
WT
∆fae ∆fae2 ∆fae3
∆fae-∆fae2 ∆fae2-∆fae3 ∆fae-∆fae3
∆fae- ∆fae2-∆fae3
(+ 46. 7%) (+ 63. 7%)
(- 41. 9%)
- 13. 9%
(- 69. 3%)
- 13.7%
(+ 34. 9%) (- 53. 4%)
(+ 55. 6%)
- 4.0%
(- 44. 6%)
- 0.5%
B)
66
Discussion
In this study we dissected the genetics of the NMG pathway mediating slow MA growth in PA1.
All three enzymes of the NMG pathway – NMGS, NMGDH, and GMAS – were essential for using MA
as a carbon source, but only NMGDH and NMGS were absolutely essential for using MA as a nitrogen
source. These results corroborate the findings of a recent study of the NMG pathway in DM4 (Gruffaz et
al. 2014). In DM4 though, it was suggested that a distant gmaS homolog (found in all sequenced M.
extroquens species) partially compensates for a gmaS deletion and enables the ∆gmaS mutant to use MA
as a nitrogen source at much slower rates compared to WT. We observed that the slow, steadily
decelerating growth rate of the ∆gmaS mutant (Figure 3.2c), in succinate with MA as the nitrogen source,
was completely abolished in a ∆gmaS-∆mgsABC mutant. Our data supports the notion that NMGS has a
physiologically relevant – albeit low – kcat for the conversion of MA to NMG in vivo only in the absence
of GMAS. In the presence of GMAS, instead of MA, GMA is the true substrate for NMGS. The precision
of our automated growth measurement platform (Delaney et al. 2013b) along with a screen that coupled
fast growth to a reduced demand upon the NMG pathway (using MA as a nitrogen source in the presence
of an alternate carbon source) revealed that the NMG pathway has a linear topology in PA1, akin to that
proposed for M. silvestris BL2 (Chen et al. 2010a), and very recently DM4 (Gruffaz et al. 2014). This
genetic evidence for a linear topology for the NMG pathway (Figure 3.2d) might also explain: a) the
extremely low specific activity observed for the conversion of MA and glutamate to NMG by NMGS in
vitro (Pollock and Hersh 1971) and b) accumulation of GMA in ∆mgs mutants (Latypova et al. 2010).
While it has been demonstrated in other systems (Latypova et al. 2010) that the NMG pathway produces
CH2=H4F, neither FolD nor PurU – enzymes known to work in the dissimilatory direction of the H4F
dependent C1 transfer pathway to generate formate – are encoded in the PA1 genome. We also observed
that the H4MPT-dependent C1 dissimilatory module was essential but that deletion of a complete H4F-
67
dependent C1 assimilation pathway had no effect upon growth on MA (Figure 3.4). This result led us
reevaluate if CH2=H4F really was the end product of the NMG pathway in PA1. The extreme
formaldehyde sensitivity of a mutant incapable of synthesizing H4MPT (∆mptG mutant) – a cofactor
involved in formaldehyde oxidation (Marx et al. 2003a, Rasche et al. 2004) – was leveraged to identify
whether formaldehyde is generated by the NMG pathway. The ∆mptG mutant could not grow on MA as a
carbon source but could use MA as a nitrogen source (Figure 3.3c, 3.4). Additionally, a strain with a
partial lesion in the H4MPT mediated formaldehyde oxidation pathway (∆fae) could still grow on MA.
These data suggest that at least some formaldehyde is generated during MA growth, but unlike methanol
growth (where the ∆fae mutant cannot grow) it is likely that either a) less than 100% of MA is oxidized to
formaldehyde and/or b) the rate of formaldehyde production is low enough to be sustained by a
spontaneous reaction with H4MPT and H4F. The rate of formaldehyde production is likely to be even
lower when MA is used as a nitrogen source; perhaps low enough that the flux can be handled by non-
specific aldehyde dehydrogenases. However, given the reactive nature of formaldehyde, it is almost
impossible to resolve whether formaldehyde is generated as the direct end-product (Figure 3.5c) or by the
dissociation of CH2=H4F (Figure 3.5d). Alternately, we cannot rule out a third scenario where CH2=H4F
is the end product of the NMG pathway and a methylene transfer occurs to generate CH2=H4MPT. In this
case, mptG would be essential for MA growth but not fae, which is consistent with our data as well.
Typically, based on whether formaldehyde or CH2=H4F is produced as the end-product of primary
oxidation, one of two distinct topologies is used for methylotrophic metabolism in M. extorquens species
(Figure 3.5a, 3.5b). The key difference between the two topologies is whether C1 flux is channeled
through an assimilatory or dissimilatory branch of the H4F dependent C1 transfer pathway. In this study
we have uncovered a novel topology of C1 use in PA1 that completely avoids the H4F-dependent C1
pathway for net dissimilation or assimilation (Figure 3.5c, 3.5d).
Finally, this paper is the first to report functional roles for FAE homologs (FAE2, FAE3) that are often
found in the genomes of methylotrophs. FAE2 and FAE appear to play somewhat redundant roles during
68
MA growth – positively reinforcing growth rates but not yield (Figure 3.6a). Three of the four key
residues that make and stabilize contact with the methyl groups of H4MPT in FAE (Acharya et al. 2005)
are conserved or similar in FAE2 (Figure S2.4, Appendix 2). Therefore, FAE2 could either be an enzyme
like FAE but with different kinetic parameters or perhaps a regulator that changes the expression of the
H4MPT-dependent formaldehyde oxidation pathway by sensing one or both of H4MPT and CH2=H4MPT.
FAE3 appears to play a distinct role from FAE and FAE2 by only impacting yield during MA growth
(Figure 3.6b), and thus likely has a different biochemical function. Specific residues that allow FAE to
distinguish H4MPT and H4F (Acharya et al. 2005) are not conserved in FAE3. It is thus unlikely to be
involved in the H4MPT dependent formaldehyde oxidation pathway, and may work as either an enzyme
or regulator of the H4F pathway. Further investigation will be required to uncover the precise
physiological roles and underlying biochemistry of FAE2 and FAE3.
Extremely slow MA growth (tD ~1 day) when MA oxidation is mediated by the NMG pathway had
occluded the genetic and physiological analysis of methylamine growth mediated by this pathway. Of late
though, the NMG pathway is going through a phase of rediscovery in light of its importance in several
environmental regimes (Y. Chen 2012; Vorobev et al. 2013; L. Chistoserdova 2011). While various
studies with different model systems (Latypova et al, 2010; Martinez-Gomez et al. 2013; Gruffaz et al.
2014) have dissected the genomics, genetics, and physiology of the NMG pathway in isolation, we
extended this genetic approach to understand how NMG-dependent MA metabolism links to central C1-
specific metabolic pathways in PA1. Unlike all previously documented instances of methylotrophy, we
found that cells simultaneously require the H4MPT-dependent formaldehyde oxidation pathway and the
serine cycle, but do not need to move C1 units through an intact H4F dependent C1 transfer pathway for
either assimilation or dissimilation. Our work highlights that a single set of metabolic modules can be
used in distinct configurations to route C1 flux in different ways depending upon the growth substrate in
question.
69
References
1. Ge X., A. S. Wexler, and S.L. Clegg. 2011. Atmospheric amines- Part I. A review. Atmospheric
Environment 45:524-546.
2. Oremland R. S., L. M. Marsh, and S. Polcin. 1982. Methane production and simultaneous sulphate
reduction in anoxic, salt marsh sediments. Nature 296:143-145.
3. Chen Y., J. Scanlan , L. Song, A. Crombie, M.T. Rahman, H. Schafer, and J.C. Murrell. 2010.
Γ-glutamylmethylamide is an essential intermediate in the metabolism of methylamine by
Methylocella silvestris. Appl. Environ. Microbiol. 76:4350-4357.
4. Neff J. C., E. A. Holland, F. J. Dentener, W. H. McDowell, and K. M. Russell. 2002. The origin,
composition and rates of organic nitrogen deposition: A missing piece of the nitrogen cycle?
Biogeochemistry. 57-58:99-136.
5. Anthony C. 1982. The biochemistry of methylotrophs. Academic Press Ltd., London.
6. Chen Y., K.L. McAleer, and J. C. Murrell. 2010. Monomethylamine as a nitrogen source for the
nonmethylotrophic bacterium, Agrobacterium tumefaciens. Appl. Environ. Microbiol. 76:4102-4104.
7. Y. Chen. 2012. Comparative genomics of methylated amine utilization by marine Roseobacter clade
bacteria and development of functional gene markers (tmm, gmaS). Environ. Microbiol. 14: 2308-
2322.
8. Eady R. R., and P. J. Large. Purification and properties of an amine dehydrogeanse from
Pseudomonas AM1 and its role in growth on methylamine. 1968. Biochem J. 106:245-255.
9. Chistoserdov A. Y., Y.D. Tsygankov, and M. L. Lidstrom. 1991. Genetic organization of
methylamine utilization genes from Methylobacterium extorquens AM1. J. Bacteriol. 173:5901-5908.
10. Van Iersel J., R. A. van der Meek, and J A. Duine. 1986. Methylamine oxidase from Arthrobacter
P1. A bacterial copper-quinoprotein amine oxidase. Eur. J. Biochem. 161:415-419.
11. Cai D., and J. P. Klinman. 1994. Copper amine oxidase: heterologous expression, purification, and
characterization of an active enzyme in Saccharomyces cerevisiae. Biochemistry. 33:7647-7653.
12. Dooley D. M., W.S. McIntire, M. A. McGuirl, C. E Cote, and J. L. Bates. 1990. Characterization
of the active site of Arthrobacter P1 methylamine oxidase: evidence for copper-quinone interactions.
J. Am. Chem. Soc. 112:2782-2789.
13. Shaw W.V., L. Tsai, and R. R. Stadtman. 1966. The enzymatic synthesis of N-methylglutamic acid.
J. Biol. Chem. 241:935-945.
14. Bamforth C. W., and M. L. O’Connor. 1979. The isolation of pleiotropic mutants of Pseudomonas
aminovorans deficient in the ability to grow on methylamine and an examination of their enzymic
constitution. Microbiology 110:143-149.
15. Latypova E., S. Yang, Y. S. Wang, T. Wang, T. A. Chavkin, M. Hackett, H. Schafer, and M. G.
Kalyuzhnaya. 2010. Genetics of the glutamate-mediated methylamine utilization pathway in the

70
facultative methylotrophic beta-proteobacteria Methyloversatilis universalis FAM5. Mol. Microbiol.
75:426-439.
16. Martinez-Gomez N. C., S. Nguyen, and M. E Lidstrom. 2013. Elucidation of the role of
methylene-tetrahydromethanopterin dehydrogenase MtdA in the tetrahydromethanopterin-dependent
oxidation pathway in Methylobacterium extorquens AM1. J. Bacteriol.195:2359-2367.
17. Gruffaz C., E.E. L. Muller, Y. Louhichi-Jelail, Y. R. Nelli, G. Guichard, and F. Bringel. 2014.
Genes of the N-methylglutamate pathway are essential for growth of Methylobacterium extorquens
DM4 on monomethylamine. Appl. Environ. Microbiol. 80:3541-3550.
18. Hersh L.B., J. A. Peterson, and A. A. Thompson. 1971. An N-methylglutamate dehydrogenase
from Pseudomonas M.A. Archives of Biochemistry and Biophysics. 145:115-120.
19. Pollock R J., and L. B. Hersh. 1973. N-methylglutamate synthetase. The use of flavin
mononucleotide oxidative catalysis. J. Biol. Chem. 248:6724-6733.
20. Bamforth C. W., and P. J. Large. 1977. Solubilization, partial purification, and properties of N-
methylglutamate dehydrogeanse from Pseudomonas aminovorans. Biochem. J. 161:357-370.
21. Bamforth C. W., and P. J. Large. 1977. The molecular size of N-methylglutamate dehydrogenase of
Pseudomonas aminovorans. Biochem. J. 167:509-512.
22. Kung H-F., and C. Wagner. 1969. Γ-glutamylmethylamide. A new intermediate in the metabolism
of methylamine. J. Biol. Chem. 244:4136-4140.
23. Boulton C. A., G. W. Haywood, and P. J. Large. 1979. N-methylglutamate dehydrogeanse, a
flavoprotein purified from a new pink trimethylamine-utilizing bacterium. Microbiology. 117:293-
304.
24. Pollock R. J., and L. B. Hersh. 1971. N-methylglutamate synthetase. Purification and properties of
the enzyme. J. Biol. Chem. 246:4737-4743.
25. Nayak D. D., and C. J. Marx. 2014. Genotypic and phenotypic comparison of methylotrophy
between Methylobacterium extorquens strains AM1 and PA1. In revision for PloS ONE
26. Marx C. J., L. Chistoserdova, and M. E. Lidstrom. 2003. Formaldehyde-detoxifying role of the
tetrahydromethanopterin-linked pathway in Methylobacterium extorquens AM1. J. Bacteriol.
185:7160-7168.
27. Marx C. J., M. Laukel, J. A. Vorholt, and M. E. Lidstrom. 2003. Purification of the formate-
tetrahydrofolate ligase from Methylobacterium extorquens AM1 and demonstration of its requirement
for methylotrophic growth. J. Bacteriol. 185:7169-7175.
28. Marx C. J., S. J. Van Dien, and M. E. Lidstrom. 2005. Flux analysis uncovers key role of
functional redundancy in formaldehyde metabolism, PloS Biol. 3:e16.
29. Crowther G. J., G. Kosaly, and M. E. Lidstrom. 2008. Formate as the main branch point for
methylotrophic metabolism in Methylobacterium extorquens AM1. J. Bacteriol. 190:5057-5062.
30. Chistoserdova L., S. W. Chen, A. Lapidus, and M. E. Lidstrom. 2003. Methylotrophy in
Methylobacterium extorquens AM1 from a genomic point of view. J. Bacteriol. 185:2980-2987.
71
31. Vannelli T., M. Messmer, A. Studer, S. Vuilleumier, and T. Leisinger. 1999. A corrinoid-
dependent catabolic pathway for growth of a Methylobacterium strain with chloromethane. PNAS
96:4615-4620.
32. Studer A., C. McAnulla, R. Buchele, T. Leisinger, and S. Vuilleumier. 2002. Chloromethane-
induced genes define a third C1 utilization pathway in Methylobacterium chloromethaanicum CM4.
J. Bacteriol. 184:3476-3484.
33. Kalyuzhnaya M. G., N. Korotkova, G. Crowther, C.J. Marx, M. E. Lidstrom, and L.
Chistoserdova. 2005. Analysis of gene islands involved in methanopterin-linked C1 transfer reactions
reveals new functions and provides evolutionary insights. J. Bacteriol. 187:4607-4614.
34. Chistoserdova L., M. G. Kalyuzhnaya, and M. E. Lidstrom. 2009. The expanding world of
methylotrophic metabolism. Annu. Rev. Microbiol. 63:477-499.
35. Delaney N. F., M. E. Kaczmarek, L. M. Ward, P. K. Swanson, M-C. Lee, and C. J. Marx. 2013.
Development of an optimized medium, strain, and high-throughput culturing methods for
Methylobacterium extorquens. PLoS One. 8:e62957.
36. Redfield A.C. 1958. The biological control of chemical factors in the environment. American
Scientist. 46:205-221.
37. Van Dien S. J., and M. E. Lidstrom. 2002. Stoichiometric model for evaluating the metabolic
capacities of the facultative methylotroph Methylobacterium extorquens AM1, with applications to
reconstruction of C3 and C4 metabolism. Biotechnology and Bioengineering 78:296-312.
38. Rasche M. E., S. A. Havemann, and M. Rosenzvaig. 2004. Characterization of two methanopterin
biosynthesis mutants of Methylobacterium extorquens AM1 by use of a tetrahydromethanopterin
bioassay. J. Bacteriol. 186:1565-1570.
39. Vorholt J. A., C. J. Marx, M. E. Lidstrom, and R. K. Thauer. 2000. Novel formaldehyde-
activating enzyme in Methylobacterium extorquens AM1. 182:6645-6650.
40. Chistoserdova L., and M. E. Lidstrom. 1994. Genetics of the serine cycle in Methylobacterium
extorquens AM1: cloning, sequence, mutation and physiological effect of glyA, the gene for serine
hydroxymethyltransferase. 176: 6759-6762.
41. Chistoserdova L., C. Jenkins, M. G. Kalyuzhnaya, C. J. Marx, A. Lapidus, J A. Vorholt, J. A.
Staley, and M. E. Lidstrom. 2004. The enigmatic Planctomycetes may hold a key to the origins of
methanogenesis and methylotrophy. Mol. Biol. Evol. 21:1234-1241.
42. Delaney N. F., J. I. Rojas Echenique, and C. J. Marx. 2013. Clarity: an open-source manager for
laboratory automation. J. Lab Autom. 18:171-177.
43. Acharya P, M. Goenrich, C. H. Hagemeier, U. Demmer, J. A. Vorholt, R. K. Thauer, and U.
Ermler. 2005. How an enzyme binds the C1 carrier tetrahydromethanopterin. Structure of the
tetrahydromethanopterin-dependent formaldehyde-activating enzyme (fae) from Methylobacterium
extorquens AM1. J. Biol. Chem. 280:13712-13719.
44. Vorobev A., D. A. C. Beck, M. G. Kalyuzhnaya, M. E. Lidstrom, and L. Chistoserdova. 2013.
Comparative transcriptomics in three Methylophilaceae species uncover different strategies for
environmental adaptation. Peer J. 1:e115.
72
45. L. Chistoserdova. 2011. Methylotrophy in a lake: from metagenomics to single-organism
physiology. Appl. Environ. Microbiol. 77:4705-4711.
46. Agashe D., N. C. Martinez-Gomez, D. A. Drummond, and C. J. Marx. 2013. Good codons, bad
transcript: large reductions in gene expression and fitness arising from synonymous mutations in a
key enzyme. Mol. Biol. Evol. 30:549-560.
47. Marx C. J. 2008. Development of a broad-host-range sacB-based vector for unmarked allelic
exchange. BMC Res. Notes. 1:1.
48. Gibson D. G., L. Young, R. Y. Chuang, J. C. Venter, C. A. Hutchison 3rd
, and H. O. Smith.
2009. Enzymatic assembly of DNA molecules up to several hundred kilobases. Nat. Methods. 6:343-
345.
49. Figurski D. H., and D.R. Helinski.1979. Replication of an origin-containing derivative of plasmid
RK2 dependent on a plasmid function provided in trans. PNAS.76: 1648-1652.
Chapter 4
Horizontal Gene transfer overcomes the adaptive
constraints posed by a sub-optimal pathway
for methylamine utilization in
Methylobacterium extorquens PA1
74
Horizontal Gene Transfer overcomes the adaptive constraints posed by a sub-
optimal pathway for methylamine utilization in Methylobacterium extorquens
PA1
Running title: Adaptive constraints prevent fitness increase in novel environments
Dipti D. Nayak1 and Christopher J. Marx
1, 2, 3, 4, *
1Organismic and Evolutionary Biology, Harvard University, Cambridge, MA, USA,
2Faculty of Arts and
Sciences Center for Systems Biology, Harvard University, Cambridge, MA, USA, 3Biological Sciences,
University of Idaho, Moscow, ID, USA, 4Institute for Bioinformatics and Evolutionary Studies,
University of Idaho, Moscow, ID, USA.
* Corresponding author: Biological Sciences, University of Idaho, Moscow, ID 83843, USA. Tel.: + 1
208 885 8594; Fax: + 1 208 885 7905; E-mail: [email protected]
75
Abstract
It is commonly assumed that genotypes which are phenotypically farther away from fitness
optima can adapt rapidly. This intuition, formalized in Fisher’s geometric model, has been validated by
numerous laboratory evolution studies across many organisms and environments. On the contrary, a
multi-peaked adaptive landscape invoked by Wright suggests evolutionary recalcitrance; that some
genotypes simply exist in regions where they are stuck on a lower fitness peak. Therefore, when the
fitness of two closely related organisms in a given environment differs greatly, it is generally unclear
whether the low fitness genotype is capable of rapidly improving to match the phenotype of the fitter
genotype, or whether there are fundamental constraints that would prevent this. The competitive fitness of
strains of the Methylobacterium extroquens species during growth on methylamine is correlated with the
presence of a mau (methylamine utilization) gene cluster in the genome; likely to have been introduced
via horizontal gene transfer (HGT). Strains like M. extorquens AM1, which possess the mau gene cluster,
had at least five fold higher competitive fitness than strains like M. extorquens PA1. We evolved three
replicate populations of M. extorquens PA1 on 20 mM methylamine as the sole carbon and energy source
for 150 generations. Despite low initial fitness, scant indication of fitness improvement was detected. In
contrast, by mimicking a HGT event, we introduced the mau gene cluster in the PA1genome.
Instantaneously, an eleven-fold fitness increase, which even surpassed the fitness of AM1, was observed.
These results suggest that, despite the low fitness, certain environments can pose evolutionary constraints
that are difficult to overcome via adaptive mutations, but can be readily overcome by HGT.
Introduction
An a priori intuition of the adaptive landscape is a big challenge in evolutionary biology.
Whether a low fitness strain has easy access to routes that lead to higher fitness or if constraints exist that
would frustrate improvement is hard to determine by just examining the genotype. However, in almost all
instances of experimental evolution reported thus far, microorganisms have been shown to rapidly evolve
76
to grow faster on substrates and conditions that they were originally poorly adapted to. Some of these
studies have focused on rapid recovery in genetically modified strains with low initial fitness due
perturbations that removed or added new metabolic pathways. Escherichia coli strains with deletions in
key metabolic genes have been shown to recover and even surpass WT growth within 10 days (Fong and
Palsson 2004); an engineered strain of Methylobacterium, forced to utilize a foreign central metabolic
pathway, can show a 40% improvement in growth in just 72 generations (Lee and Marx 2013). Other
studies where multiple starting points with differing fitness have been tested, a quantitative trend toward
compensation has often emerged; the least fit strains evolves the fastest, independent of the genotype
(Travisano et al. 1995; Moore et al. 2000; MacLean et al. 2010; Kryazhimskiy et al. 2014).
These experimental results have given rise to an evolutionary heuristic: the rate of evolutionary
adaptation is primarily dependent on the initial fitness of an organism relative to what it can achieve in a
given environment. The underlying basis for this widely accepted notion is that the adaptive potential of a
microorganism can surpasses most, if not all, physiological constraints posed by a novel or sub-optimal
environmental condition or substrate (Hottes et al. 2013); and diminishing returns epistasis reduces the
fitness gain resulting from an adaptive mutation as the organismal fitness increases (Khan et al. 2011;
Chou et al. 2011; Kvitek and Sherlock, 2011; Rokyta et al. 2011). This rule-of-thumb finds its theoretical
origin in Fisher’s geometric model (FGM) (R. A. Fisher, 1930; H. A. Orr, 2005; Gordo and Campos,
2012): in an adaptive landscape which contains a single, static fitness peak, the frequency and magnitude
of beneficial mutations decrease as an organism moves closer to the fitness optima. Here we present an
example that counters the wide-spread generalization that low fitness genotypes can adapt quickly, and
further show that introduction of new genes can immediately overcome adaptive constraints in such cases.
Closely-related strains within the Methylobacterium extroquens species can all grow on reduced
single carbon compounds like methanol or methylamine as their sole source of carbon and energy (C.
Anthony, 1982). Even though these strains are more than 99% identical at the 16s rRNA locus (Marx et
77
al. 2012) and share a core metabolic repertoire (Nayak and Marx, 2014a), some stark phenotypic
differences have been observed (Nayak and Marx, 2014a; Nayak and Marx, 2014b). For instance, M.
extorquens AM1 (referred to as AM1 henceforth) can grow five-fold faster than M. extorquens PA1
(referred to as PA1 henceforth) on methylamine. The genomic basis for this marked distinction in
methylamine growth rates is well established (Vuillimier et al. 2009; Nayak and Marx, 2014a): all M.
extorquens strains possess the sub-optimal, energetically expensive N-methylglutamate (NMG) pathway
(Shaw et al. 1966; Latypova et al. 2010; Gruffaz et al. 2014; Nayak and Marx, 2014b), whereas only
AM1 and CM4 also contain the methylamine dehydrogeanse (referred to as MaDH henceforth) )Eady and
Large, 1968; Chistoserdov et al. 1991), (Figure 4.1). In AM1, the mau gene cluster (Chistoserdov et al.
1991 and 1994) encoding MaDH is present in a 10 kb genomic region that is flanked by two IS (Insertion
Sequence) elements of the ISMex15 family, indicative of recent acquisition by HGT (Vuillimier et al.
2009). The MaDH functions by producing formaldehyde and ammonia in the periplasm, and electrons are
passed to the electron transport chain (Eady and Large, 1968). In contrast, the NMG pathway is
cytoplasmic, requires an ATP, and generates an NADH (Latypova et al. 2010). Thus, beyond possible
kinetic differences, distinct localization and cofactor coupling could pose constraints upon the efficiency
of each pathway.
Given the large difference in methylamine growth rate for a strain with MaDH versus another that
only possesses the NMG pathway, will selection for growth on methylamine rapidly improve use of the
NMG pathway in the low fitness strain? Or, will one or more of the physiological differences between the
pathways pose constraints that are difficult to overcome, short of introduction of MaDH via HGT? We
experimentally evolved replicate populations of PA1 on methylamine as the sole carbon and energy
source for 150 generations. To our surprise, the competitive fitness and growth rate of populations or
isolates after 150 generations of evolution were no different or even slightly lower than the founding
ancestor.
78
Figure 4.1: A) A schematic of methylamine metabolism using the methylamine dehydrogeanse (encoded by the
mau gene cluster) for methylamine oxidation (orange). B) A schematic of methylamine metabolism using the N-
methylglutamate pathway for methylamine oxidation (blue). MaDH: Methylamine dehydrogeanse
Based on mutations identified by sequencing the genome of evolved isolates across replicate populations,
it was clear some degree of adaptation occurred, but not in a manner that led to rapid growth or a fitness
increase in competition assays. In contrast, by simply introducing MaDH on a plasmid to simulate the
HGT events inferred to have occurred naturally, the methylamine fitness of the PA1 transconjugant was
even higher than AM1. These results provide a counter example to the common pattern in microbial
evolution of rapid adaptation for low fitness strains. Furthermore, we directly demonstrate the speed with
HCHO CH3NH
2
METHYLAMINE (CH
3NH
2)
cytoplasm
periplasm
NH4
+,2e
-
MaDH
HCHO
CO2
biomass
METHYLAMINE (CH
3NH
2)
cytoplasm
periplasm
HCHO
CO2
biomass
CH3NH
2
NH4+ NADH ADP ATP
N-methylglutamate pathway
A) B)
79
which an HGT event can overcome previous physiological constraints and dramatically change the
performance and fitness of an organism.
Materials and Methods
Chemicals and media
All chemicals were purchased from Sigma-Aldrich (St. Louis, MO) unless otherwise noted. Escherichia
coli were grown in LB at 37 °C with the standard antibiotic concentrations. Standard growth conditions
for M. extroquens PA1 and M. extorquens AM1 utilized a modified version of Hypho minimal medium
consisting of: 100 mL phosphate salts solution (25.3 g of K2HPO4 plus 22.5 g Na2HPO4 in 1L deionized
water), 100 mL sulfate salts solution (5 g of (NH4)2SO4 and 2 g of MgSO4 • 7 H2O in 1L deionized water),
799 mL of deionized water, and 1 mL of trace metal solution (Agashe et al. 2013). Filter-sterilized carbon
sources were added just prior to inoculation in liquid minimal media with a final concentration of 3.5 mM
for sodium succinate and 20 mM for methylamine hydrochloride,
Experimental Evolution
Three independent colonies of the ∆cel strain of M. extorquens PA1 (CM2730; Delaney et al. 2013) were
isolated from Hypho, succinate, agar (2% w/v) plates and were inoculated in 50 mL flasks with 10 mL of
Hypho minimal media and 20 mM methylamine hydrochloride to initiated three replicate populations for
experimental evolution. Flasks were incubated in a 30 ºC shaking incubator at 225 rpm for 3.5 days after
which a 32-fold dilution (for the first 11 transfers) and a 128-fold dilution (for the next 14 transfers) was
transferred in fresh Hypho minimal media with 20 mM methylamine hydrochloride. At regular intervals,
populations were frozen at -80ºC with 10% DMSO. M. extorquens AM1 contamination was tested after
every transfer by using mau specific primers for PCR amplification from the population lysate. Evolved
clones were obtained as independent colonies from Hypho, 7.5 mM sodium succinate, 20 mM
methylamine, agar (2% w/v) plates.
Fitness Assays
80
Competitive fitness was measured by competing strains against a fluorescently labelled ancestor (M.
extorquens PA1 ∆cel-∆hpt::Ptac-mCherry (CM3839) ) described elsewhere (Michener et al. 2014) using
modified version of a protocol described elsewhere (Lee et al. 2009; Chou and Marx, 2012). Growth was
initiated by transferring 10 L freezer stock into 10 mL of Hypho medium with 3.5 mM succinate. Upon
reaching stationary phase, cultures were transferred 1:128 into fresh medium with the carbon source to be
tested in 50 mL flasks with a total culture volume of 10 mL. At the end of the acclimation phase,
CM3839 and the test strain or the mixed population were mixed in equal proportions by volume and this
initial mix (T0) was transferred 1:128 into fresh media with the same conditions as the acclimation phase.
To test fitness at a 32-fold dilution, 1:32 transfers were performed for both the acclimation and testing
growth cycles. 450 µL of the T0 mix was also mixed with 10% DMSO and frozen at -80 ºC. A 500 µL
sample at the end of the growth phase (T1) was collected and the ratio of CM3839 and the test strain or
the mixed population before and after the growth phase was ascertained using flow cytometry. Cells were
diluted appropriately such that at a flow rate of 0.5 μl/sec on the LSRFortesssa (BD, Franklin Lakes, NJ)
~1000 events/sec would be recorded. Fluorescent mCherry was excited at 561 nm and measured at 620/10
nm. The competitive fitness was calculated as
where R1 and R0 represent the
population fraction of the test strain before and after mixed growth, and N represents the fold increase in
the population density. Competitive fitness assays were conducted in triplicate unless specified. Data are
reported as the mean fitness ± 95% confidence interval of the mean fitness value.
Genome Sequencing
Each strain grown to saturation in hypho media with 7 mM succinate, was centrifuged, re-suspended in
Tris-EDTA buffer with 1% Triton-X 100, and then lysed using a combination of lysozyme and heat shock
at 70 ºC-90 ºC for 10 minutes. Lysed cells were treated with proteinase K and RNase A at 37 ºC for 2
hours and genomic DNA was extracted using the phenol-chloroform extraction protocol. DNA
concentration was quantified using the Nanodrop spectrophotometer (ND-1000, Thermo Fischer
81
Scientific, Wilmington, DE). Single-end 50 bp reads for Illumina sequencing were prepared using the
TruSeq DNA sample prep Kit (Illumina, San Diego, CA) as per the manufacturer’s instructions and
sequenced using an Illumina Hi-Seq machine at the Genomics and Microarray Core Facility, Huntsman
Cancer Institute, Salt lake City, Utah. Reads were assembled and aligned on the M. extroquens PA1
reference genome using Breseq version 0.21 (Deatherage et al. 2014). Mutations were verified by PCR
amplification and subsequent Sanger sequencing. Allele frequencies were measured by amplifying the
Mext_2327 locus or the promoter region for Mext_2010 in eight isolates from each replicate population
as well as the entire mixed population.
Plasmids and Strains
Chromosomal allele replacement from the evolved isolates in the ancestral background was conducted
using the allelic exchange vector pCM433 (Marx, 2008). A genomic region containing a 200 bp region
upstream of Mext_2010 as well as the entire coding sequence of Mext_2010 was amplified using PCR.
The forward primer was designed to have a 30 bp long sequence at the 5’ end homologous to the
sequence upstream of the NotI cut site in pCM433(ATGGATGCATATGCTGCAGCTCGAGCGGCCGCCGG
TCGCGTAGATCAGGTTG ). The reverse primer was designed to have a 30 bp long sequence at the 5’ end
homologous to the sequence downstream of the NotI cut site in pCM433 (GGTTAACACGCGTACGTAGGG
CCCGCGGCCGCCGGTTT CAGAGCGATGCTCC).The PCR product was ligated on the pCM433 vector cut
with NotI using the Gibson assembly protocol described elsewhere (Gibson et al. 2009). Cloning the
promoter mutation upstream of Mext_2010 in pCM433 resulted in pDN93. A region upstream and
downstream of Mext_2010 was also amplified using PCR. The forward primer for the upstream flank was
designed to have a 30 bp long sequence at the 5’ end homologous to the sequence upstream of the NotI
cut site in pCM433 (ATGGATGCATATGCTGCAGCTCGAGCGGCCGCGTCTTGGTCTGGAGCTGGAAGC
and reverse primer TAC GCGCTGAACCTCACGAAGG) . The forward primer for the downstream flank
was designed to have a 30 bp sequence at the 5’ end homologous to the last 30 bp of the upstream flank
(TACGCGCTGAACCTCACGAAGGCGTGAACGCCGAGGATGACG). The reverse primer for the downstream
82
flank was designed to have a 30 bp long sequence at the 5’ end homologous to the sequence downstream
of the NotI cut site in pCM433 (GGTTAACACGCGTACGTAGGGCCCGCGGCCGCCGCCCT
GAAGTTCGACAAACC). The PCR products representing the upstream and downstream flank were
ligated on the pCM433 vector cut with NotI using the Gibson assembly protocol described elsewhere
(Gibson et al. 2009). Cloning the upstream and downstream flanks for Mext_2010 in pCM433 resulted in
pDN94. Mutant strains of M. extorquens PA1 were made by introducing the appropriate donor constructs
through conjugation by a tri-parental mating between 10β competent cells (New England Biolabs,
Ipswich, MA) containing the donor construct, an E. coli strain containing the conjugative plasmid
pRK2073, and M. extorquens PA1 as described elsewhere (Marx, 2008). All mutant strains were
confirmed by a diagnostic PCR analysis and validated by Sanger sequencing the mutant locus. All strains
and plasmids used for this study are listed in Table 4.1.
Growth Rate Measurement
Growth from freezer stocks at -80 ºC was initiated by transferring 10 L freezer stock into 10 mL of
Hypho medium with 3.5 mM succinate in 50 mL flasks in a shaking incubator at 225 rpm and maintained
at 30 ºC. Upon reaching stationary phase (2 days), cultures were transferred 1:16 into 9.4 mL fresh
medium with 20 mM methylamine hydrochloride and allowed to reach saturation in this acclimation
phase (3.5 days), and diluted 1:32 again into 9.4 mL fresh medium with 20 mM methylamine for the
measured (experimental) growth (3.5 days). A 50 μL aliquot of three replicate cultures, for each strain,
was sampled every 8-10 hours during the growth phase. Optical density of the culture was measured at
600 nm (OD600) using a spectrophotometer (Bio-Rad, Hercules, CA). The dynamics and specific growth
rate of cultures were calculated from the log-linear growth phase using CurveFitter (Delaney et al. 2013).
Yield was measured as the maximum OD600 during the growth phase. Growth rate and yield reported for
each strain and condition is the mean calculated from three biological replicates, unless otherwise noted.
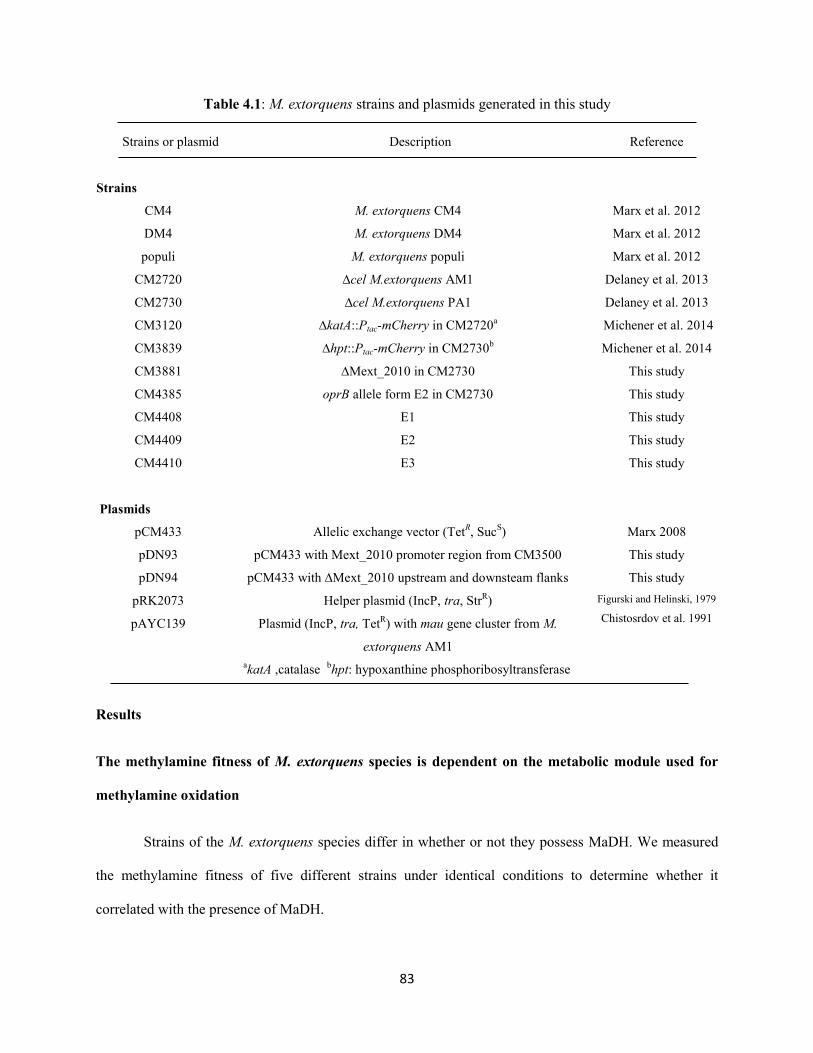
83
Table 4.1: M. extorquens strains and plasmids generated in this study
Strains or plasmid Description Reference
Strains
CM4
DM4
populi
CM2720
CM2730
CM3120
CM3839
CM3881
CM4385
CM4408
CM4409
CM4410
Plasmids
pCM433
pDN93
pDN94
pRK2073
pAYC139
M. extorquens CM4
M. extorquens DM4
M. extorquens populi
∆cel M.extorquens AM1
∆cel M.extorquens PA1
∆katA::Ptac-mCherry in CM2720a
∆hpt::Ptac-mCherry in CM2730b
∆Mext_2010 in CM2730
oprB allele form E2 in CM2730
E1
E2
E3
Allelic exchange vector (TetR, Suc
S)
pCM433 with Mext_2010 promoter region from CM3500
pCM433 with ∆Mext_2010 upstream and downsteam flanks
Helper plasmid (IncP, tra, StrR)
Plasmid (IncP, tra, TetR) with mau gene cluster from M.
extorquens AM1
Marx et al. 2012
Marx et al. 2012
Marx et al. 2012
Delaney et al. 2013
Delaney et al. 2013
Michener et al. 2014
Michener et al. 2014
This study
This study
This study
This study
This study
Marx 2008
This study
This study
Figurski and Helinski, 1979
Chistosrdov et al. 1991
akatA ,catalase
bhpt: hypoxanthine phosphoribosyltransferase
Results
The methylamine fitness of M. extorquens species is dependent on the metabolic module used for
methylamine oxidation
Strains of the M. extorquens species differ in whether or not they possess MaDH. We measured
the methylamine fitness of five different strains under identical conditions to determine whether it
correlated with the presence of MaDH.
84
Figure 4.2: Methylamine fitness of M. extorquens species relative to AM1. Strains that use the N-methylglutamate
pathway are depicted in blue and strains that use the methylamine dehydrogenase enzyme (but also contain the N-
methylglutamate pathway) are depicted in orange. Error bars depict the 95% confidence interval (C.I.) of the mean
relative fitness determined by three replicate competition assays. ** p < 0.01 and *p < 0.05 for a significant
difference in fitness on methylamine for strains that use the same pathway for methylamine oxidation.
The resulting fitness values were quite variable but had a simple pattern: the two strains encoding MaDH,
AM1 and CM4, were 5 to 20-fold more fit than PA1, DM4, and BJ001 which only possess the NMG
pathway (Figure 4.2). Thus, although there were small, but significant differences between strains with
the same pathway for methylamine utilization, the dominant factor influencing fitness on methylamine is
the presence of MaDH.
Adaptive evolution did not lead to a rapid increase in methylamine fitness for M. extorquens PA1
In order to test whether a strain with the NMG pathway could evolve rapidly toward the growth
rate observed for a strain containing MaDH, we evolved replicate populations of PA1 on methylamine for
0
0.2
0.4
0.6
0.8
1
1.2
1.4
Populi PA1 DM4 AM1 CM4
Fit
ness r
ela
tiv
e t
o A
M1
NMG pathway only MaDH (+ NMG pathway)
*
**
**

85
over 150 generations. Three replicate populations were grown in minimal media with 20 mM
methylamine as the sole source of carbon and energy. Cells were transferred into fresh media every 3.5
days, at a 32-fold dilution for the first 55 generations, and then 128-fold for the final 98 generations.
Single isolates from each evolved population were obtained, denoted as E1, E2, and E3, and fitness on
methylamine was measured relative to the ancestor expressing the fluorescent protein mCherry (Figure
4.3a). None of the isolates were more fit than the ancestor and, to our surprise, E1 and E3 actually had
significantly lower fitness on methylamine (p = 0.01 and p < 0.01, respectively). To check whether the
strains isolated were anomalous in their performance, we also performed the same competition using the
mixed populations against the labeled ancestor. Two of the three populations were significantly less fit
than the ancestor (P1 and P3; p < 0.01 in each case) and the fitness of one population was not
significantly different from the ancestor (P2; p = 0.17 (Figure 4.3b). We also examined the growth rates
and yield (assayed via max OD600) of two of the evolved isolates (Figure 4.3c) and neither of these traits
changed significantly, either (p > 0.2 for all tests). Altogether, these data indicate that the fitness or
growth rate on methylamine did not increase despite 150 generations of selection for fast growth.
Genome sequencing reveals parallel mutations across replicates that suggest adaptation over 150
generations of selection on methylamine
Even though there was no net increase in growth or fitness relative to the ancestor, we sequenced
the genomes of E1, E2, and E3 to determine whether any mutational changes had occurred over the
course of evolution. E1 and E3 had a single base (+C) insertion and a 35 bp deletion in the coding
sequence of a hypothetical exported protein (gene ID: Mext_2327) respectively, whereas E2 had a C->T
mutation 32 bases upstream of a carbohydrate-specific porin of the OprB family (Gene ID: Mext_2010)
(Wylie and Worobec, 1995) (Table 4.2).

86
Figure 4.3: A) Methylamine fitness of ∆cel M. extorquens PA1 (gray) and an evolved isolate from each population
(E1: Blue, E2: Orange and E3: Green) relative to mCherry PA1. B) Methylamine fitness of ∆cel PA1 (gray) and the
mixed population at generation 150 (P1: Blue, P2: Orange and P3: Green) relative to mCherry PA1. C)
Methylamine growth rate and yield (maximum OD600) of PA1 (gray), E2 (orange) and E3 (green). D) Methylamine
fitness of PA1 (gray circle), E2 (orange square), PA1 with the oprBE2
(orange circle), and ΔoprB PA1 (light orange
circle) relative to mCherry PA1. Error bars depict the 95% C.I. of the mean relative fitness determined by three
replicate competition assays or the 95% confidence interval of the mean growth rate/ mean yield of three biological
replicates.
0.85
0.9
0.95
1
1.05
1.1
1.15F
itn
ess r
ela
tiv
e t
o P
A1
PA1 E2 oprBEvo SG ∆oprB SG
0.85
0.9
0.95
1
1.05
1.1
1.15
Fit
ness r
ela
tiv
e t
o P
A1
PA1 E1 E2 E3
0.85
0.9
0.95
1
1.05
1.1
1.15
Fit
ness r
ela
tiv
e t
o P
A1
PA1 P1 P2 P3
0
0.2
0.4
0.6
0.8
1
1.2
1.4
MA Growth Rate MA Yield
Gro
wth
Rate
/ Y
ield
re
lati
ve t
o P
A1
PA1 E2 E3
PA1 +PoprB
mutation ∆oprB PA1
A) B)
C) D)
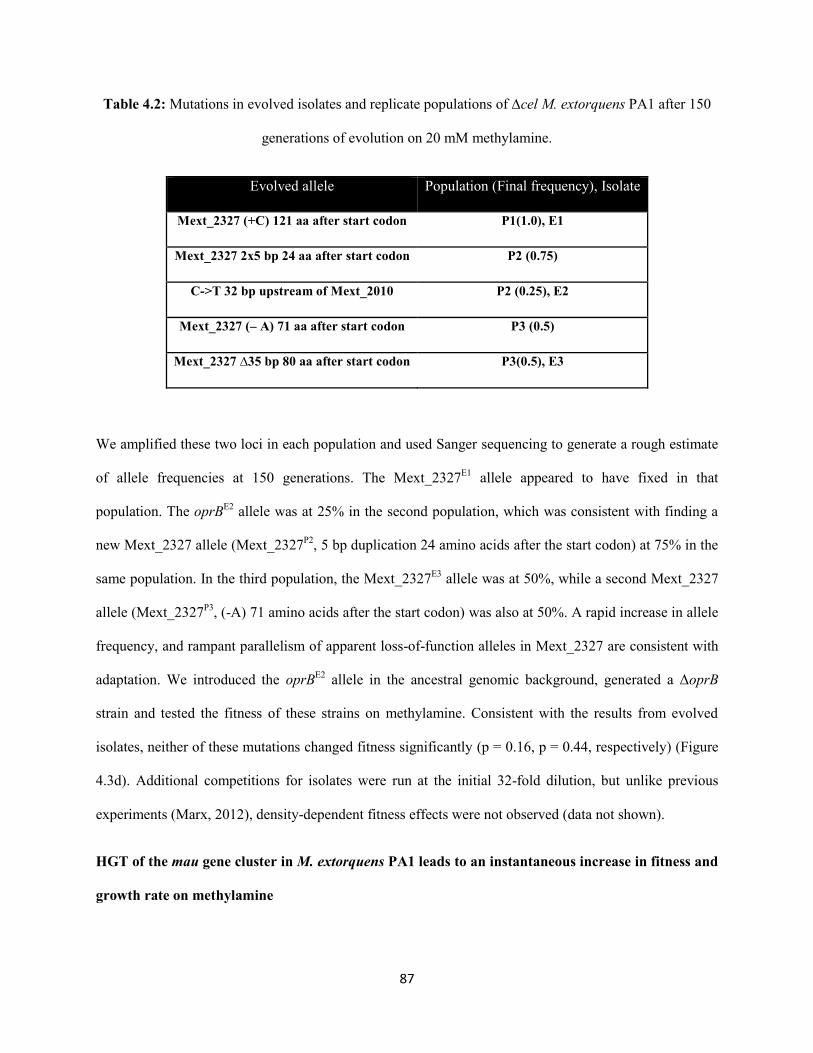
87
Table 4.2: Mutations in evolved isolates and replicate populations of ∆cel M. extorquens PA1 after 150
generations of evolution on 20 mM methylamine.
Evolved allele Population (Final frequency), Isolate
Mext_2327 (+C) 121 aa after start codon P1(1.0), E1
Mext_2327 2x5 bp 24 aa after start codon P2 (0.75)
C->T 32 bp upstream of Mext_2010 P2 (0.25), E2
Mext_2327 (– A) 71 aa after start codon P3 (0.5)
Mext_2327 ∆35 bp 80 aa after start codon P3(0.5), E3
We amplified these two loci in each population and used Sanger sequencing to generate a rough estimate
of allele frequencies at 150 generations. The Mext_2327E1
allele appeared to have fixed in that
population. The oprBE2
allele was at 25% in the second population, which was consistent with finding a
new Mext_2327 allele (Mext_2327P2
, 5 bp duplication 24 amino acids after the start codon) at 75% in the
same population. In the third population, the Mext_2327E3
allele was at 50%, while a second Mext_2327
allele (Mext_2327P3
, (-A) 71 amino acids after the start codon) was also at 50%. A rapid increase in allele
frequency, and rampant parallelism of apparent loss-of-function alleles in Mext_2327 are consistent with
adaptation. We introduced the oprBE2
allele in the ancestral genomic background, generated a ΔoprB
strain and tested the fitness of these strains on methylamine. Consistent with the results from evolved
isolates, neither of these mutations changed fitness significantly (p = 0.16, p = 0.44, respectively) (Figure
4.3d). Additional competitions for isolates were run at the initial 32-fold dilution, but unlike previous
experiments (Marx, 2012), density-dependent fitness effects were not observed (data not shown).
HGT of the mau gene cluster in M. extorquens PA1 leads to an instantaneous increase in fitness and
growth rate on methylamine

88
M. extorquens strains with MaDH have an order of magnitude higher fitness on methylamine
compared to either ancestral or evolved PA1. Would the introduction of genes encoding MaDH in the
PA1 genome be sufficient to speed up methylamine growth in the absence of subsequent evolutionary
refinement? We simulated the HGT events that are likely to have occurred naturally for AM1 and CM4
by transforming a low-copy plasmid (pAYC139) (Chistoserdov et al. 1991) containing the mau genes,
which encode MaDH, into PA1. The methylamine growth rate of the pAYC139+
PA1 transconjugant was
4.3-fold greater than PA1 (p < 0.01) and only 15% lower than AM1 (p< 0.01) (Figure 4.4). Despite
slightly slower growth than AM1, the pAYC139+
PA1 transconjugant was 75% more fit than AM1 (p<
0.001) (Figure 4.4).
Figure 4.4: Methylamine growth rate and fitness of AM1 (light brown), PA1 (dark gray), and PA1 + pAYC139
expressing MaDH (light gray) relative to AM1 (for growth rate) or mCherry AM1 (for fitness). Error bars depict the
95% C.I. of the mean relative growth rate of three biological replicates and the 95% C.I. of the mean relative fitness
determined by three replicate competition assays.
0
0.25
0.5
0.75
1
1.25
1.5
1.75
2
Growth Rate Fitness
Gro
wth
Rate
/ F
itn
ess r
ela
tiv
e t
o A
M1 FG PA1 PA1AM1 + MaDH
89
Discussion
In this study we show that, for closely related, natural isolates with distinct fitness values in a
given environment, the heuristic that the rate of evolutionary adaptation is negatively correlated with the
initial fitness and independent of the starting genotype does not necessarily hold (Perfetio et al. 2014;
Kryazhimskiy et al. 2014). The methylamine fitness of strains of the M. extorquens species was extremely
variable (Figure 4.2), but mostly dependent upon the metabolic module used for methylamine oxidation.
The two strains that possessed MaDH had five fold or greater fitness than the three strains which only
encode the NMG pathway. We evolved replicate populations of PA1, a strain with low initial fitness, on
methylamine for over 150 generations to observe that, despite clear signs of adaptation (Table 4.2), the
competitive fitness or growth rates of the evolved isolates or populations was no different or even slightly
lower than that of the founding ancestor. However, genome sequencing revealed parallel mutations –
apparent loss-of-function alleles of Mext_2327 (a conserved exported protein of unknown function) – and
a rapid rise in the frequency of these alleles within 150 generations. Genetic parallelism suggests some
degree of non-transitivity, as was previously observed for AM1 on methanol (Lee et al. 2009), which will
require further study beyond the scope of this work. Though, it is clear that this experiment is in sharp
contrast to previous laboratory evolution experiments with engineered M. extorquens strains in which
adaptation was rapid and growth rate and fitness increased by 40% within 72 generations (Lee and Marx,
2013).
The observation that adaptive mutations did not lead to an increase in growth or competitive
fitness suggests that various Methylobacterium strains inhabit a multi-peaked, rugged adaptive landscape
(S. A Wright, 1932; Kvitek and Sherlock, 2011) that can constrain further improvement. This is in
contrast to the common assumption of a single, static fitness peak in the adaptive landscape (R. A. Fisher,
1930) that is observed in most examples of laboratory evolution (Bennett et al. 1992; Travisano et al.
1995; Estes and Lynch, 2007; Joseph and Kirkpatrick, 2008; Lee and Marx, 2013). In a rugged, multi-
peaked adaptive landscape, the adaptive mutations that overcome constraints might be dependent on
90
complex epistatic interactions (Quandt et al. 2014) as was observed in the citrate+
E.coli that evolved after
31,000 generations of laboratory evolution (Blount et al. 2012). As a result of these complex interactions,
the rate of adaption slows down and becomes difficult, if not impossible, to generalize across different
microorganisms and in different environments.
In this we work we also showed that introducing the mau gene cluster (Chistoserdov et al. 1991)
encoding methylamine dehydrogeanse on a plasmid increased the methylamine fitness and growth rate of
PA1 instantaneously and the resulting strain had higher fitness than AM1 (Figure 4.4). This outcome
suggests that the NMG pathway poses one or more physiological constraints – perhaps linked to the
cofactors or cellular locations that distinguish the NMG pathway from MaDH – which is difficult to
overcome by adaptive mutations but can be overcome with a new pathway in its place. Based on the
observed frequency of gene transfer across natural lineages (Koonin et al. 2001) and the rapid fitness
gains without any evolutionary refinement observed in this study, we suggest that HGT can plays a major
role in the evolutionary dynamics of microorganisms in nature and permits microbial populations to
instantly jump across the fitness landscape to overcome adaptive constraints.
91
References
1. Agashe D, Martinez-Gomez NC, Drummond DA, and Marx CJ: Good codons, bad transcript: large
reductions in gene expression and fitness arising from synonymous mutations in a key enzyme.
Mol Biol Evol 2013, 30:549-560.
2. Anthony C: The biochemistry of methylotrophs. Academic Press Ltd., London, 1982.
3. Bennett AF, Lenski RE, Miller JE: Evolutionary adaptation to temperature. I. Fitness response of
Escherichia coli to changes in its thermal environment. Evolution 1992, 46:16-30.
4. Blount ZD, Barrick JE, Davidson CJ, Lenski RE: Genomic analysis of a key innovation in an
experimental Escherichia coli population. Nature 2012, 489:513-518.
5. Chistoserdov AY, Tsygankov YD, Lidstrom ME: Genetic organization of methylamine utilization
genes from Methylobacterium extorquens AM1. J Bacteriol 1991, 173:5901-5908.
6. Chou HH, Chiu HC, Delaney NF, Segre D, Marx CJ: Diminishing returns epistasis among
beneficial mutations decelerates adaptation. Science 2011, 332:1190-1192.
7. Chou HH, Marx CJ: Optimization of gene expression through divergent mutational paths. Cell
Reports 2012, 1:133-140.
8. Deatherage DE, Barrick JE: Identification of mutations in laboratory-evolved microbes from
next-generation sequencing data using Breseq .Methods Mol Biol 2014, 1151:165-188.
9. Delaney NF, Rojas Echenique JI, Marx CJ: Clarity: an open-source manager for laboratory
automation. J Lab Autom 2013, 18:171-177.
10. Delaney NF, Kaczmarek ME, Ward LM, Swanson PK, Lee MC, Marx CJ: Development of an
optimized medium, strain, and high-throughput culturing methods for Methylobacterium
extorquens. PLoS One 2012, 8:e62957.
11. Eady RR, Large PJ: Purification and properties of an amine dehydrogeanse from Pseudomonas
AM1 and its role in growth on methylamine. Biochem J 1968, 106:245-255.
12. Elena SF., Cooper VS, Lenski RE: Punctuated evolution caused by selection of rare beneficial
mutations. Science 1996, 272:1802-1804.
13. Estes S, Lynch M: Rapid fitness recovery in mutationally degraded lines of Caenorhabditis
elegans. Evolution 2007, 57:1022-1030.
14. Figurski DH, Helinski DR: Replication of an origin-containing derivative of plasmid RK2
dependent on a plasmid function provided in trans. PNAS 1979, 76:1648-1652.
15. Fisher RA: The genetical theory of natural selection. Oxford Univ. Press, Oxford, 1930.
16. Fong SS, BØ Palsson BØ: Metabolic gene-deletion strains of Escherichia coli evolve to
computationally predicted growth phenotypes. Nat Genet 2004, 36:1056-1058.
92
17. Gordo I, Campos PRA: Evolution of clonal populations approaching a fitness peak. Biol Lett
2013, 9: 20120239.
18. Gruffaz C, Muller EEL, Louhichi-Jelail Y, Nelli YR, Guichard G, Bringel F: Genes of the N-
methylglutamate pathway are essential for growth of Methylobacterium extorquens DM4 on
monomethylamine. Appl Environ Microbiol 2014, 80:3541-3550.
19. Hottes SK, Freddolino PL , Khare A, Donnell ZN, Liu JC, Tavazoie S: Bacterial adaptation
through Loss of Function. PloS Genet 2013, 9:e1003617.
20. Joseph SB, Kirkpatrick M: Effects of the [PSI+] prion on the rates of adaptation in yeast. J Evol
Biol 2008, 21:773-780.
21. Khan AI, Dinh DM, Schneider D, Lenski RE, Cooper TF: Negative epistasis between beneficial
mutations in an evolving bacterial population. Science 2011, 332:1193-1196.
22. Koonin EV, Marakova KS, Aravind L: Horizontal gene transfer in prokaryotes: Quantification
and classification. Ann Rev Microbiol 2001, 55:709-742.
23. Kryazhimskiy S, Rice DP, Jerison E, Desai MM: Global epistasis makes adaptation predictable
despite sequence-level stochasticity. Science 2014, 344:1519-1522.
24. Kvitek DJ, Sherlock G: Reciprocal sign epistasis between frequently experimentally evolved
mutations causes a rugged fitness landscape. PLoS Genet 2011, 7:e1002056.
25. Latypova E, Yang S, Wang YS, Wang T, Chavkin TA, Hackett M, Schafer H, Kalyuzhnaya MG:
Genetics of the glutamate-mediated methylamine utilization pathway in the facultative
methylotrophic beta-proteobacteria Methyloversatilis universalis FAM5. Mol Microbiol 2010,
75:426-439.
26. Lee MC, Chou HH, Marx CJ: Asymmetric, bimodal trade-offs during adaptation of
Methylobacterium to different growth substrates. Evolution 2009, 63:2816-2830.
27. Lee MC, Marx CJ: Synchronous waves of failed soft sweeps in the laboratory: remarkably
rampant clonal interference of alleles at a single locus. Genetics 2013, 193:943-952.
28. MacLean RAC, Perron GG, Gardner A: Diminishing returns from beneficial mutations and
pervasive epistasis shape the fitness landscape for rifamycin resistance in Pseudomonas
aeruginosa. Genetics 2010, 186:1345-1354.
29. Marx CJ: Development of a broad-host-range sacB-based vector for unmarked allelic exchange.
BMC Res Notes 2008, 1:1.
30. Marx CJ, Bringer F, Chistoserdova L, Moulin L, Ul Haque MF, Fleischman DE, Gruffaz C, Jourand
P, Knief C, Lee MC, Muller EEL, Nadalig T, Peyraud R, Roselli S, Russ L, Goodwin LA, Ivanova N,
Kyrpides N, Lajus A, Land ML, Medigue C, Mikhailova Nolan NM, Woyke T, Stolyar S, Vorholt
JA, Vuilleumier S: Complete genome sequences of six strains of the genus Methylobacterium. J.
Bacteriol 2012, 194:4746-4748.
31. Marx CJ: Recovering from a bad start: rapid adaptation and tradeoffs to growth below a
threshold density. BMC Evol Biol 2012, 12:109.
93
32. Michener JK, Vuilleumier S, Bringer F, Marx CJ: Phylogeny poorly predicts the utility of a
challenging horizontally transferred gene in Methylobacterium strains. J Bacteriol 2014,
196:2101-2107.
33. Moore FBG, Rozen DE, Lenski RE: Pervasive compensatory adaptations in Escherichia coli. Proc
R Soc Lond B 2000, 267:515-522.
34. Nayak DD, Marx CJ: Genetic and phenotypic comparison of methylotrophy between
Methylobacterium extorquens strains PA1 and AM1. PLoS One 2014, in revision.
35. Nayak DD, Marx CJ: Methylamine utilization via a linear N-methylglutamate pathway does not
require the tetrahydrofolate-dependent C1 transfer pathway. J Bacteriol 2014, in review.
36. Orr HA: The genetic theory of adaptation: a brief history. Nat Rev Genet 2005, 6:119-127.
37. Perfeito L, Sousa A, Bataillon T, Gordo I: Rates of fitness decline and rebound suggest pervasive
epistasis. Evolution 2014, 68:150-162.
38. Quandt EM, Deatherage DE, Ellington AD, Georgiou G, Barrick JE: Recursive genomewide
recombination and sequencing reveals a key refinement step in the evolution of a metabolic
innovation in Escherichia coli. PNAS 2014, 111:2217-2222.
39. Rokyta DR, Joyce P, Caudle SB, Miller C, Beisel CJ, Wichman HA: Epistasis between beneficial
mutations and the phenotype-to-fitness map for a ssDNA virus. PLoS Genet 2011, 7:e1002075.
40. Shaw WV, Tsai L, Stadtman RR: The enzymatic synthesis of N-methylglutamic acid. J Biol Chem
1966, 241:935-945.
41. Travisano M, Mongold JA, Bennett AF, Lenski RE: Experimental tests of the role of adaptation,
chance, and history in evolution. Science 1995, 267:87-90.
42. Vuilleumier S, Chistoserdova L, Lee MC, Bringer F, Lajus A, Zhou Y, Gourion B, Barbe V, Chang J,
Cruveiller S, Dossat C, Gillett W, Gruffaz C, Haugen E, Hourcade E, Levy R, Mangenot S, Muller E,
Nadalig T, Pagni M, Penny C, Peyraud R, Robinson DG, Roche D, Rouy Z, Saenampechek C,
Salvignol G, Vallenet D, Wu Z, Marx CJ, Vorholt JA, Olson MV, Kaul R, Weissenbach J, Medigue
C, Lidstrom ME: Methylobacterium genome sequences: a reference blueprint to investigate
microbial metabolism of C1 compounds from natural and industrial sources. PLoS One 2009,
4:e5584.
43. Wright S: The role of mutation, inbreeding, crossbreeding and selection in evolution. Sixth
International Congress on Genetics 1932, 1:356-366.
44. Wylie JL, Worobec EA: The OprB porin plays a central role in carbohydrate uptake in
Pseudomonas aeruginosa. J Bacteriol 1995, 177:3021-3026.
Chapter 5
Experimental evolution reveals ecologically distinct roles
for two functionally degenerate routes for methylamine oxidation
in Methylobacterium extorquens AM1
95
Experimental evolution reveals ecologically distinct roles for two functionally
degenerate routes for methylamine oxidation in Methylobacterium extorquens
AM1
Dipti D. Nayak1, Deepa Agashe
2, Ming-Chun Lee
3, and Christopher J. Marx
1, 4, 5, 6, #,*
1Organismic and Evolutionary Biology, Harvard University, Cambridge, MA, USA,
2National Centre for
Biological Sciences, Bangalore, India. 3Department of Biochemistry, University of Hong Kong,
Pokfulam, Hong Kong. 4Faculty of Arts and Sciences Center for Systems Biology, Harvard University,
Cambridge, MA, USA.5Department of Biological Sciences, University of Idaho, Moscow, ID, USA.
6Institute for Bioinformatics and Evolutionary Studies, University of Idaho, Moscow, ID, USA.
# Present address: Biological Sciences, University of Idaho, Moscow, ID, USA
* Corresponding author: Biological Sciences, University of Idaho, Moscow, ID 83843, USA. Tel.: + 1
208 885 8594; Fax: + 1 208 885 7905; E-mail: [email protected]
96
Abstract
Bacterial genomes often encode multiple, biochemically distinct, but functionally degenerate pathways
for a particular metabolic reaction. In some cases degeneracy adds robustness to the metabolic network,
but in others it reveals a discrepancy between the genomic potential and physiological relevance. We
sought to uncover physiological constraints that prevent a cell from tapping into functional degenerate
pathways in the well-studied aerobic methylotroph – Methylobacterium extorquens AM1. M. extorquens
AM1 encodes two non-orthologous routes for methylamine oxidation; methylamine dehydrogenase
(MaDH) and the N-methylglutamate (NMG) pathway. Despite an intact NMG pathway, strains lacking a
functional MaDH are completely incapable of methylamine growth. Two distinct genotypes of
M.extorquens AM1, in which the MaDH was either deleted or suppressed, were experimentally evolved
on methylamine as the sole carbon and energy source. Genomic and genetic analyses of the evolved
strains revealed three key physiological constraints that prevented WT from channeling methylamine flux
through the NMG pathway. Deleting the mau gene cluster (encoding MaDH) was the first step towards
using the NMG pathway for methylamine growth. Mutations that increased the expression level of the
NMG pathway and buffered a rise in cytoplasmic pH due to ammonia buildup further enhanced growth
on methylamine. Two distinct mechanisms to buffer pH during ammonia buildup were discovered:
constitutive expression of the kefB potassium/proton anti-porter and up-regulation of an ABC- transporter
associated with the ykkC/yxkD RNA element to serve as a urea efflux pump. We also tested and validated
the hypothesis that these two pathways for methylamine oxidation in AM1 are ecologically specialized to
enable the cell to optimally utilize methylamine as a carbon source as well as a nitrogen source.
Introduction
Degeneracy in biological functions, especially metabolism, is prevalent across the bacterial domain.
Distinct enzymes and pathways, with unique biochemistry and cofactors, are known to catalyze the same
(set of) metabolic reaction/s (Romano and Connway1996; Edelman and Gally 2001; Boucher et al. 2003;
97
Marx et al. 2005; L. Chistoserdova et al. 2011; I. Berg 2011; Flamholz et al. 2013 ). The distribution of
these functionally degenerate enzymes and pathways in bacteria is dependent on a set of complex criteria
including phylogenetic relatedness (Flamholz et al. 2013), the ecological niche which may comprise of
one or more of temperature (I. Berg 2011), oxygen (I. Berg 2011), cofactor availability (I. Berg 2011;
Martiny et al. 2006), and thermodynamic constraints or the energy yield versus cost trade-offs (Flamholz
et al. 2013). Metabolic degeneracy also manifests within a single bacterium; many bacteria encode more
than one pathway for a particular (set of) reaction/s in their genome (Chain et al. 2007; Flamholz et al.
2013). Despite the cost, functional degeneracy is beneficial in highly variable, unpredictable natural
environments. By buffering environmental fluctuations, multiple pathways can ensure a constant flux
through key metabolic reactions (Stelling et al. 2004; Deutscher et al. 2006). For instance, the genome of
Burkholderia xenovorans LB400 (Chain et al. 2007) contains three functionally degenerate pathways for
formaldehyde oxidation and null mutants in one/two pathways do not lead to a significant decrease in the
formaldehyde detoxification potential (Marx et al. 2004). Sometimes though, an interesting paradox
manifests; despite metabolic degeneracy at the genomic level, the metabolic flux is primarily channeled
through one route. For instance, the genome of Methylobacillus flagellatus KT contains two functionally
degenerate pathways for formaldehyde oxidation (Chistoserdova et al. 2000; Chistoserdova et al. 2007)
but only one is essential during growth on single-carbon compounds. A discrepancy between metabolic
degeneracy at the genomic level and functional level is often uncovered (Marx et al. 2004; Flamholz et al.
2013) but the underlying physiological basis is rarely investigated.
Methylotrophs are a group of microorganisms that grow on reduced single carbon (C1)
compounds, like methane and methylamine, as the sole carbon and energy source (C. Anthony 1982).
Physiological analysis of methylamine utilization in a facultative methylotrophic Alphaproteobacteria-
Methylobacterium extroquens AM1 (referred to as AM1 from here on) - led to the discovery of a
periplasmic methylamine dehydrogenase (MaDH) (Eady and Large 1968; McIntire et al. 1991) and
ancillary proteins that are encoded by the mau gene cluster (Chistoserdov et al. 1991). MaDH, a
98
quinoprotein (Chen et al. 1994), catalyzes the primary oxidation of methylamine to formaldehyde and
transfers the electrons released to cytochrome c via an amicyanin electron acceptor (Tobari and Harada
1981; Chen et al. 1992). Recent genomic (Nayak and Marx 2014 a) and genetic analyses have revealed
that a completely non-orthologous pathway for the primary oxidation of methylamine – the N-
methylglutamate (NMG) pathway (Shaw et al. 1966; Latypova et al. 2010; Chen et al. 2010) – is not just
present but also active (Martinez-Gomez et al. 2013) in AM1 and other M. extorquens species (Gruffaz et
al. 2014; Nayak and Marx 2014b). Unlike MaDH, the NMG pathway mediates the primary oxidation of
methylamine in three enzymatic steps (Figure 5.1a). γ-glutamylmethylamide synthase (GMAS) catalyzes
the condensation of methylamine and glutamate to form γ-glutamylmethylamide which is converted to N-
methylglutamate by N-methylglutamate synthase (NMGS) and then oxidized to formaldehyde by N-
methylglutamate dehydrogenase (NMGDH). Apart from biochemistry, the NMG pathway and MaDH
also differ in their cellular localization. MaDH and its ancillary proteins are found in the periplasmic
space (Eady and Large 1968; McIntire et al. 1991) whereas enzymes of the NMG pathway are
cytoplasmic (Latypova et al. 2010). These two pathways have different energy yields and cofactor
requirements as well; the NMG pathway oxidizes methylamine in an ATP-dependent set of reactions
(1mol ATP/mol methylamine) and produces NADH (Kung and Wagner 1969; Latypova et al. 2010)
whereas MaDH oxidizes methylamine in an ATP-independent manner. Mutants of AM1 lacking a
functional MaDH are known to be completely incapable of methylamine growth (Chistoserdov et al.
1991).Thus, despite an ‘apparent’ functional degeneracy, the NMG pathway cannot, even partially, rescue
the growth defect of the ∆mau mutant in methylamine. To uncover the physiological constraints that
prevent the NMG pathway from taking over in the absence of MaDH, we experimentally evolved two
distinct genotypes of AM1 (Figure 5.1b, Figure 5.1c), to switch to the NMG pathway for primary
oxidation during growth on methylamine. The adaptive mutations were used to infer the physiological
constraints that prevented methylamine growth using the NMG pathway.
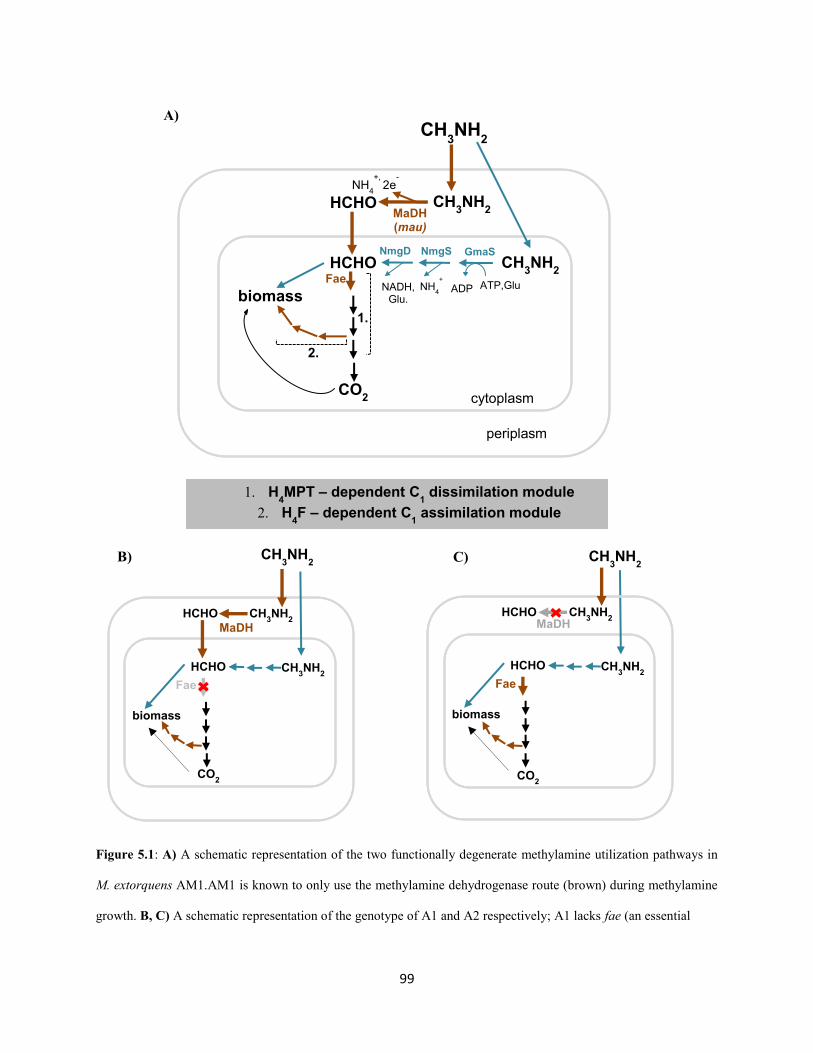
99
Figure 5.1: A) A schematic representation of the two functionally degenerate methylamine utilization pathways in
M. extorquens AM1.AM1 is known to only use the methylamine dehydrogenase route (brown) during methylamine
growth. B, C) A schematic representation of the genotype of A1 and A2 respectively; A1 lacks fae (an essential
CH3NH
2 HCHO
MaDH (mau)
HCHO
CO2
Fae
biomass
CH3NH
2
CH3NH
2
GmaS NmgS NmgD
cytoplasm
periplasm
ATP,Glu ADP
1.
2.
1. H4MPT – dependent C
1 dissimilation module
2. H4F – dependent C
1 assimilation module
NH4
+
NH4
+, 2e
-
NADH, Glu.
HCHO
CO2
Fae
biomass
CH3NH
2
CH3NH
2 HCHO
MaDH
CH3NH
2 CH
3NH
2
HCHO
CO2
Fae
biomass
CH3NH
2
CH3NH
2 HCHO
MaDH
A)
B) C)
100
(Figure 5.1 continued) enzyme immediately downstream of methylamine oxidation) and A2 lacks the entire mau
gene cluster encoding methylamine dehydrogeanse.
MaDH: Methylamine dehydrogenase; NmgD: N-methylglutamate dehydrogeanse; NmgS: N-
methylglutamate synthase; GmaS: γ-glutamylmethylamide synthetase; Glu: Glutamate; Fae: Formaldehyde
activating Enzyme; H4MPT: Tetrahydromethanopterin; H4F: Tetrahydrofolate
The NMG pathway has extremely low expression in WT and when overexpressed leads to a rise in the
cytoplasmic pH due to ammonia buildup. Based on the physiological constraints we were able to infer
and test ecologically distinct roles for these two functionally, degenerate pathways. MaDH is a highly
expressed, poorly regulated, energetically favorable enzyme that enables AM1 to grow on high
concentrations of methylamine with relatively fast growth rates. In contrast, NMG pathway has low basal
expression, is tightly regulated, has lower energetic yield but is likely to have a greater affinity (lower Km)
for methylamine than MaDH since it is especially beneficial in environments with ≤ 1 mM methylamine
as the sole nitrogen source.
Materials and Methods
Chemicals and media
All chemicals were purchased from Sigma-Aldrich (St. Louis, MO) unless otherwise noted. Escherichia
coli were grown in LB at 37 °C with the standard antibiotic concentrations. Standard growth conditions
for Methylobacterium extroquens AM1utilized a modified version of Hypho minimal medium consisting
of: 100 mL phosphate salts solution (25.3 g of K2HPO4 plus 22.5 g Na2HPO4 in 1L deionized water), 100
mL sulfate salts solution (5 g of (NH4)2SO4 and 2 g of MgSO4 • 7 H2O in 1L deionized water), 799 mL of
deionized water, and 1 mL of trace metal solution (Agashe et al. 2013). Growth conditions that utilized a
nitrogen-free version of the modified Hypho minimal media consisted of: 100 mL phosphate salts
solution (25.3 g of KH2PO4 plus 22.5 g Na2HPO4 in 1L deionized water), and 100 mL nitrogen- free
sulfate salts solution (7 g of MgSO4 • 7 H2O in 1L deionized water), 799 mL of deionized water, and 1
101
mL of trace metal solution All components were autoclaved separately before mixing under sterile
conditions. Filter-sterilized carbon sources were added just prior to inoculation in liquid minimal media
with a final concentration of 3.5 mM for sodium succinate, 20 mM for methylamine hydrochloride,
15mM for methanol, and 15mM for sodium formate.
Experimental Evolution
Experimental Evolution I: A ∆fae ∆cel strain of AM1 (CM2770) was experimentally evolved in 48-well
microtiter plates (CoStar-3548) - in an incubation tower (Liconic USA LTX44 with custom fabricated
cassettes) shaking at 650 rpm, in a room that was constantly maintained at 30 ºC and 80% humidity,
(Delaney et al. 2013) - containing hypho medium with 20mM methylamine hydrochloride to a volume of
640 L. A 32-fold dilution was serially passaged in fresh hypho medium with 20 mM methylamine
hydrochloride at regular intervals for 150 generations.
Experimental Evolution II: Eight replicate populations of WT AM1 (CM501 and CM502) were evolved
in hypho media with 1.75 mM disodium succinate and 7.5 mM methanol for 1500 generations as
described earlier (Lee and Marx 2012). CM1054, an evolved isolate could no longer grow on 20 mM
methylamine hydrochloride in liquid media, therefore was evolved on 20 mM methylamine hydrochloride
in a 50 mL flask with 10 mL of culture in a shaking incubator maintained at a constant speed (225 r.pm.)
and temperature (30ºC). The culture was allowed to grow for ~ 14 days till the media turned cloudy and
then plated on hypho, methylamine, agar (2% w/v) plates. E2 (or CM3014) was isolated and used for the
analyses described in the text.
Growth Rate Measurements
Cells were acclimated and grown in 48-well microtiter plates (CoStar-3548) in an incubation tower
(Liconic USA LTX44 with custom fabricated cassettes) shaking at 650 rpm, in a room that was constantly
maintained at 30 ºC and 80% humidity, (Delaney et al. 2013), containing Hypho medium with the
appropriate carbon source to a volume of 640 L. All growth rate measurements were conducted as
102
described in Nayak and Marx 2014a. The dynamics and specific growth rate of cultures were calculated
from the log-linear growth phase using an open source, custom-designed growth analysis software called
CurveFitter available at http://www.evolvedmicrobe.com/CurveFitter/ . Growth rates reported for each
strain and condition are the mean plus 95% CI calculated from triplicate biological replicates, unless
otherwise noted.
Plasmids and Strains
Chromosomal allele replacement was conducted using the allelic exchange vector pCM433 (Marx 2008).
For Mext_1544- the entire gene- and for kefB -a1000bp of the intergenic region containing the mutant or
ancestral allele- was amplified using PCR. The forward primer was designed to have a 30 bp long
sequence at the 5’ end homologous to the sequence upstream of the NotI cut site in pCM433. The reverse
primer was designed to have a 30 bp long sequence at the 5’ end homologous to the sequence downstream
of the NotI cut site in pCM433. The PCR product was ligated on the pCM433 vector cut with NotI using
the Gibson assembly protocol described elsewhere (Gibson et al. 2009). Cloning the WT and evolved
allele of Mext_1544 in pCM433 resulted in pDN150 and pDN151. Cloning the evolved and WT allele of
kefB in pCM433 resulted in pDN136 and pDN137. Deletion mutants lacking mptG, mgdABCD, kefB were
generated in the evolved, ancestral and WT genomic background using the allelic exchange vector
pCM433 (Marx 2008). A region upstream and downstream of each of these genes or operons of ~0.5 kb
was amplified using PCR. The forward primer for the upstream flank was designed to have a 30 bp long
sequence at the 5’ end homologous to the sequence upstream of the NotI cut site in pCM433. The reverse
primer for the upstream flank was designed to have a 30 bp sequence at the 5’ end homologous to the first
30 bp of the downstream flank. The reverse primer for the downstream flank was designed to have a 30
bp long sequence at the 5’ end homologous to the sequence downstream of the NotI cut site in pCM433.
The PCR products representing the upstream and downstream flank were ligated on the pCM433 vector
cut with NotI using the Gibson assembly protocol described elsewhere (Gibson et al. 2009). Cloning the
upstream and downstream flanks for mptG, mgdABCD, and kefB in pCM433 resulted in pDN69 and
103
pDN112 and pDN142. Mutant strains of M. extorquens AM1 were made by introducing the appropriate
donor constructs through conjugation by a tri-parental mating between 10β competent cells (New England
Biolabs, Ipswich, MA) containing the donor construct, an E. coli strain containing the conjugative
plasmid pRK2073, and AM1 as described elsewhere (Marx 2008). All mutant strains were confirmed by a
diagnostic PCR analysis and validated by Sanger sequencing the mutant locus. All strains and plasmids
used and generated for this study are listed in Table 5.1.
Competitive Fitness Assays
Competitive fitness was measured by competing each strain against a M. extorquens AM1 ∆cel-
∆katA::Ptac-mCherry (CM3120) described elsewhere (Michener et al. 2014) using a modified version of a
protocol described elsewhere (Lee et al. 2009; Chou and Marx 2012). Growth was initiated by
transferring 10 L freezer stock into 10mL of Hypho medium with 3.5 mM succinate. Upon reaching
stationary phase, cultures were transferred 1:64 into fresh medium with the carbon source to be tested in
48-well microtiter plates (CoStar-3548) and allowed to reach saturation in this acclimation phase. The
acclimation phase for strains that could barely grow in methylamine consisted of growth in media with
equimolar succinate and methylamine. At the end of the acclimation phase, CM3120 and the test strain
was mixed in equal proportions by volume and this initial mix (T0) was transferred 1:64 into fresh media
with the same conditions as the acclimation phase. 450 µL of the T0 mix was also mixed with 10%
DMSO and frozen at -80ºC. A 500 µL sample at the end of the growth phase (T1) was collected and the
ratio of CM3120 and the test strain before and after the growth phase was ascertained using flow
cytometry. Cells were diluted appropriately such that at a flow rate of 0.5 μl/ sec on the LSRFortesssa
(BD, Franklin Lakes, NJ) ~1000events/second would be recorded. Fluorescent mCherry was excited at
561 nm and measured at 620/10 nm. The competitive fitness was calculated as
where
R1 and R0 represent the population fraction of the test strain before and after mixed growth, and N
represents the fold increase in the population density. Since the test strains were unlabeled, the population
104
fraction was the ratio of mCherry-negative cells to mCherry-positive cells. Competitive fitness assays
were conducted in triplicate unless specified. Data are reported as the mean fitness ± 95% confidence
interval of the mean fitness value.
N-methylglutamate Dehydrogenase Assay
Three biological replicates per strain were grown to half maximum OD600 in hypho and 7.0 mM succinate
and induced with 20 mM methylamine hydrochloride overnight. Cells were centrifuged, resuspended in
Tris-HCl (pH 7.5), and lysed using a FastPrep-24 (MP Bio, Santa Ana, CA) and lysing matrix B (MP
Bio). Lysates were centrifuged at 13000 rpm for 5 minutes and total protein in the supernatant was
quantified using the Quick Start Bradford Assay (BioRad, Hercules, CA) using bovine serum albumin
(BSA) as a standard. Approximately, 0.1mg of protein was incubated in 50 mM sodium phosphate buffer
(pH= 7.6) with 5mM N-methylglutamate and 0.5mM NAD at room temperature for 40 minutes. An equal
volume of the Nash reagent was added to each reaction tube at T0 as well as T40 and incubated at 58ºC for
30 minutes. Formaldehyde production was estimated by measuring the absorbance at 412 nm (Nash 1958)
and comparison to a standard curve generated for formaldehyde concentrations ranging from 50 μM to 1
mM. NMGDH activity was measured as the nmol formaldehyde produced / (mg protein. minute) and
reported as the mean ± 95% confidence interval of three biological replicates.
Genome Sequencing
Cells grown to saturation in hypho media with 7mM succinate were centrifuged, re-suspended in Tris-
EDTA buffer with 1% Triton-X 100, and lysed using a combination of lysozyme and heat shock at 70ºC-
90ºC for 10 minutes. Lysed cells were treated with proteinase K and RNase A at 37ºC for two hours and
genomic DNA was extracted using the phenol-chloroform extraction protocol. DNA concentration was
quantified using the Nanodrop spectrophotometer ND-1000 (Thermo Fischer Scientific, Wilmington,
DE). Single-end 50 bp reads for Illumina sequencing were prepared using the TruSeq DNA sample prep
Kit (Illumina, San Diego, CA) and sequenced using an Illumina Hi-Seq machine at the Microarray and
105
Genomics Core Facility, Huntsman Cancer Institute, Utah. Reads were assembled and aligned on the M.
extroquens AM1 genome using Breseq version 0.21 (Deatherage and Barrick 2014). Mutations were
verified by PCR and Sanger sequencing.
q-RT PCR
Three biological replicates per strain were grown to half maximum OD600 in hypho and 7.0 mM succinate
and induced with 20 mM methylamine hydrochloride overnight. Cultures were centrifuged at 4ºC for 10
mins at 4500g and RNA was extracted using an RNeasy Kit (Qiagen, Germantown, MD) and RNAse-free
DNAse (Qiagen). Total RNA concentration was quantified using a Nanodrop spectrophotometer ND-
1000 (Thermo Fischer Scientific, Wilmington, DE). For the synthesis of cDNA, 1 µg RNA was reverse
transcribed using SuperScript III (Life Technologies, Carlsbad, CA). qPCR was performed using a CFX-
96 qPCR machine (Bio-Rad, Hercules, CA) and EvaGreen qPCR mix (Biotium, Hayward, CA). The
transcript level of the ribosomal protein RpsB was used as an internal standard and the relative expression
of Meta1_4101 and Meta1_4102 was quantified using the protocol described elsewhere (Chou et al. 2009;
Agashe et al. 2013). A no template control, a no RT control, and a standard curve with DNA
concentrations from 1 ng to 10-6
ng was run for every primer pair.
Urea Quantification Assay
The urea concentration in the spent media was tested in two conditions: a) half maximum OD600 in hypho
with 3.5 mM succinate and induction with 20 mM methylamine hydrochloride overnight and b) half
maximum OD600 in hypho with 3.5 mM succinate. Spent media was collected by centrifuging the cells at
4500g for 10 mins and running the supernatant through a 1 micron sterile membrane filter (Millipore).
Urea concentration was measured using the Urea Assay Kit (Sigma-Aldrich, St. Louis, MO) as per the
manufacturer’s instructions. Two technical replicates were performed per biological replicate. The urea
concentration reported is the mean ± 95% confidence interval of three biological replicates.
106
Table 5.1: M.extorquens strains and plasmids used in this study
Strain or plasmid Description Reference
Strains
CM501
CM1054
CM2351
CM2720
CM2770
CM2986
CM3014
CM3488
CM3807
CM3811
CM3813
CM4135
CM4140
CM4142
CM4149
CM4152
CM4153
CM4169
CM4187
CM4189
CM4194
CM4311
Plasmids
pCM433
pDN50
pDN69
pDN112
pDN136
pDN137
pDN142
pDN150
pDN151
pAYC139
pRK2073
M.extorquens AM1
A2
∆mau in M. extorquens AM1
∆cel in M. extorquens AM1
∆fae in CM2720 (A1)
E1
E2
CM2986 + pAYC139
∆mptG in CM2720
∆mptG in CM2986
∆mptG in CM3014
kefBE1 in CM2770
∆kefB in CM2986
kefBWT in CM2986
∆mgdABCD in CM2986
∆mgdABCD in CM3014
Meta1_1544WT in CM3014
kefBE1 in CM2720
∆mgdABCD in CM2720
∆mgdABCD’in CM4149
Meta1_1544E2 in CM2720
∆mau ∆fae in M. extorquens AM1
Allelic exchange vector (TetR, SucS)
pCM433 with ∆fae upstream and downsteam flanks
pCM433 with ∆mptG upstream and downsteam flanks
pCM433 with ∆mgdABCD upstream and downsteam flanks
pCM433 with kefB allele from E1
pCM433 with kefB allele from WT
pCM433 with ∆kefB upstream and downsteam flanks
pCM433 with Meta1_1544 from E2
pCM433 with Meta1_1544 from WT
Plasmid with mau gene cluster from AM1 (IncP, tra, TetR)
Conjugative helper plasmid (IncP, tra, StrR)
Lee et al., 2009
Lee and Marx 2012
This study
Delaney et al., 2013
This study
This study
This study
This study
This study
This study
This study
This study
This study
This study
This study
This study
This study
This study
This study
This study
This study
This study
C. J. Marx 2008
Nayak and Marx 2014a
This study
This study
This study
This study
This study
This study
This study
Chistoserdov et al. 1991
Figurski and Helinski 1979
107
Results
Experimental evolution of Methylobacterium extorquens AM1 mutants to grow on methylamine via
the N-methylglutamate pathway
AM1 encodes two alternate routes for the primary oxidation of methylamine in its genome:
MaDH and the NMG pathway. While MaDH is essential for methylamine growth in AM1 (Chistoserdov
et al. 1991), the NMG pathway is not (M. E. Lidstrom 2006). To unravel a physiological basis for this
discrepancy between degeneracy in the metabolic context and the organismal context, we experimentally
evolved two distinct strains of AM1that were incapable of methylamine growth but still had an intact
NMG pathway for the primary oxidation of methylamine.
The first strain (Figure 5.1b) (referred to as A1 from here on) had a lesion in fae (Vorholt et al. 2000).
FAE (Formaldehyde Activating Enzyme) catalyzes the condensation of formaldehyde and
tetrahydromethanopterin (H4MPT) (Vorholt et al. 2000); a reaction immediately downstream of primary
oxidation of C1 compounds (Figure 5.1a). While fae is essential when MaDH mediates the primary
oxidation of methylamine (Agashe et al. 2013), it is not requires when the NMG pathway is (Nayak and
Marx 2014b) used instead. The second strain (Figure 5.1c) (referred to as A2 from here on) was isolated
from a population of AM1 that was evolved for 1500 generations in media containing a C1 substrate
(methanol) as well as a multi-C substrate (succinate) (CJ Marx, unpublished; Lee and Marx 2012).
Phenotypic assays post-isolation revealed that A2 could not grow on methylamine in liquid media and
genome sequencing of A2 elucidated the underlying genotype: an IS-mediated recombination event that
led to the deletion of the mau gene cluster (Figure 5.1c) (TableS3.1, Appendix 3). The methylamine
fitness of A1 and A2 relative to AM1 expressing the fluorescent protein mCherry (Michener et al. 2014)
was extremely low; the mean fitness values (calculated from three replicate competitions) were 0.4% and
1.0% respectively (Figure 5.2c).
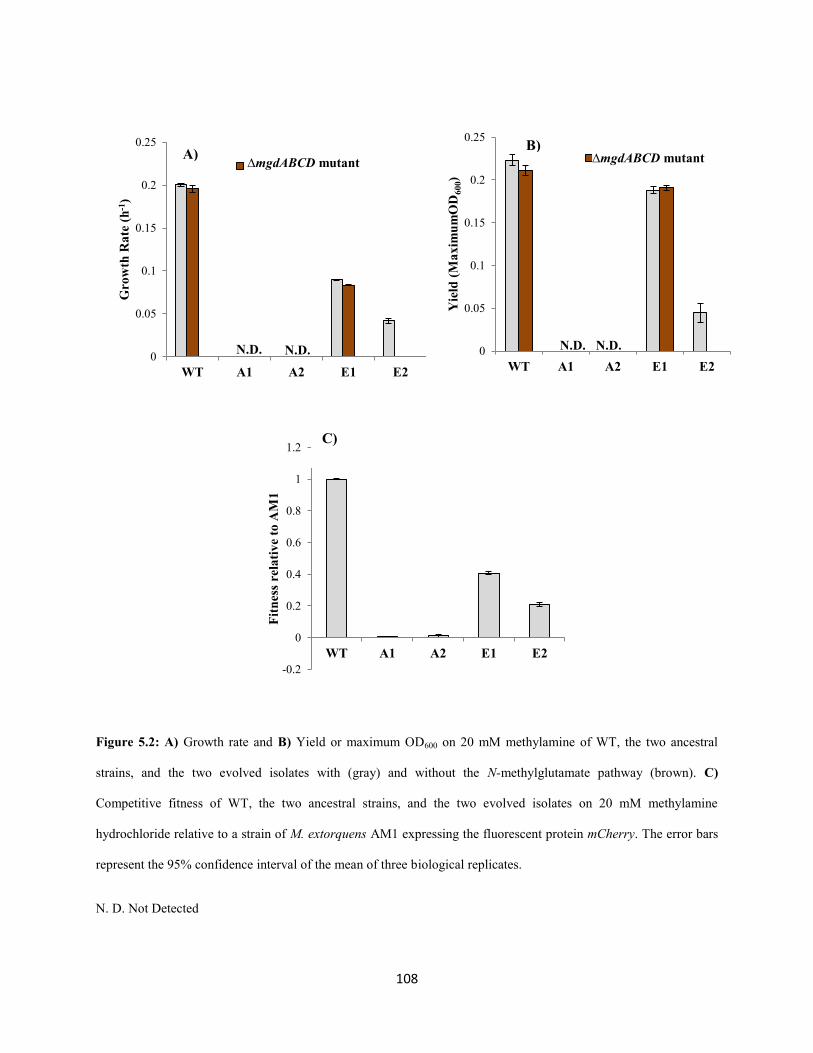
108
Figure 5.2: A) Growth rate and B) Yield or maximum OD600 on 20 mM methylamine of WT, the two ancestral
strains, and the two evolved isolates with (gray) and without the N-methylglutamate pathway (brown). C)
Competitive fitness of WT, the two ancestral strains, and the two evolved isolates on 20 mM methylamine
hydrochloride relative to a strain of M. extorquens AM1 expressing the fluorescent protein mCherry. The error bars
represent the 95% confidence interval of the mean of three biological replicates.
N. D. Not Detected
0
0.05
0.1
0.15
0.2
0.25
WT A1 A2 E1 E2
Yie
ld (
Ma
xim
um
OD
600)
Series2
N.D. N.D.
∆mgdABCD mutant
0
0.05
0.1
0.15
0.2
0.25
WT A1 A2 E1 E2
Gro
wth
Ra
te (
h-1
)
Mgd∆mgdABCD mutant
N.D.
N.D.
N.D.
-0.2
0
0.2
0.4
0.6
0.8
1
1.2
WT A1 A2 E1 E2
Fit
nes
s re
lati
ve
to A
M1
C)
A) B)
109
The methylamine fitness of A1 and A2 was also significantly lower than other M. extorquens strains like
PA1 (Nayak and Marx 2014c) which only possess the NMG pathway for methylamine oxidation (Nayak
and Marx 2014b). These low fitness values further corroborate that the NMG pathway has a miniscule
contribution towards methylamine growth in AM1.
A single population of A1 as well as A2 was experimentally evolved to grow on 20 mM
methylamine as the sole carbon and energy source. The methylamine fitness of A1 increased by 110.5-
fold after 150 generations whereas the methylamine fitness of A2 in methylamine increased by 21.7-fold
after ~20-50 generations (Figure 5.2c). A single isolate, representative of each population in terms of the
mean fitness on methylamine (referred to as E1 and E2 from here on), was used to conduct further
analyses. Despite being significantly faster than their respective ancestors, E1 and E2 grew 53.8% (p<
0.01) and 79.2% (p<0.01) slower with 15.7% (p<0.01) and 80% (p<0.01) lower yield (measured as
maximum OD600) than WT on methylamine (Figure 5.2a, Figure 5.2b).
To ascertain if the NMG pathway mediates in E1 and E2, we deleted mgdABCD - encoding N-
methylglutamate dehydrogeanse (NMGDH) (Martinez-Gomez et al. 2013; Gruffaz et al. 2014) (Figure
5.2a, Figure 5.2b) – in each of these strains. The ∆mgdABCD mutant of E2 could no longer grow on
methylamine whereas the ∆mgdABCD mutant of E1 was only 7% slower (p<0.01). Residual NMGDH
activity in the ∆mgdABCD mutant of E1 (Table S3.2, Appendix 3) indicated a second copy of mgdABCD
in theE1 genome which was subsequently deleted and the resulting double knockout could no longer
grow on methylamine.
While MaDH produces free formaldehyde as the end product (McIntire et al. 1991; Chistoserdova
et al. 2003), the end product of the NMG pathway is still being debated (Latypova et al. 2010; Martinez-
Gomez et al. 2013; Nayak and Marx 2014b). Prior work with M. extorquens PA1, a strain that grows on
methylamine only using the NMG pathway, has shown that the H4MPT-dependent formaldehyde
oxidation pathway ( Nayak and Marx, 2014b) is essential during methylamine growth but it was unclear
110
formaldehyde was the sole end-product of methylamine oxidation. We deleted mptG (encoding β
ribofuranosylaminobenzene 5’phosphate synthase, an enzyme that catalyzes the first step of the H4MPT
biosynthesis pathway (Rasche et al. 2004) in WT, E1, and E2. None of the resulting mutants grew on
methylamine. Contrary to the ∆mptG mutant of PA1 (Nayak and Marx 2014 a), the ∆mptG mutants of E1
as well as E2 could no longer use methylamine as a nitrogen source. Surprisingly though, the ∆mptG WT
strain could still use (albeit poorly) methylamine as a nitrogen source (data not shown). Therefore, the
extreme sensitivity of the ∆mptG mutants of E1 and E2 to methylamine suggested that methylamine
oxidation via the NMG pathway might actually produce free formaldehyde as the end-product.
Genetic basis of adaptation to grow on methylamine using the N-methylglutamate pathway
To unravel the physiological constraints that needed to be overcome to grow on methylamine
using the NMG pathway, we sequenced the genome of E1, A2, and E2 and mapped the mutations relative
to the AM1 reference genome (Table S3.1, Appendix 3; Figure 5.3a, Figure 5.3b). E1 had three unique
mutations relative to A1 (Figure 5.3a): a) an IS mediated recombination event that led to the deletion of
the mau gene cluster, b) a Q446* mutation in kefB and c) a duplication of a 10kb genomic region
comprising the genes that encode enzymes of the NMG pathway. E2 had two unique mutations relative to
A2: a) a W173* mutation in Meta1_1544 (a gene upstream of the 10 kb gene cluster encoding the three
enzymes of the NMG pathway) and b) an IS insertion in the ykkC/yxkD RNA element (Barrick et al.
2004) immediately upstream of an ABC transporter (TableS3.1, Appendix 4; Figure5.3b).
We investigated the role of each of these mutations on methylamine growth by introducing the
mutant alleles from the evolved strain in the ancestor (or vice versa) in isolation and also in combination
with each other. Of the three mutations in E1, only the mutation that led to the deletion of the mau operon
significantly was beneficial in the A1genomic background (Figure 5.3c). A combination of the mutations
that lead to the deletion of the mau gene cluster and the duplication of the NMG pathway genes was
extremely beneficial; this strain was 93-fold more fit than A1 on methylamine (p < 0.01).
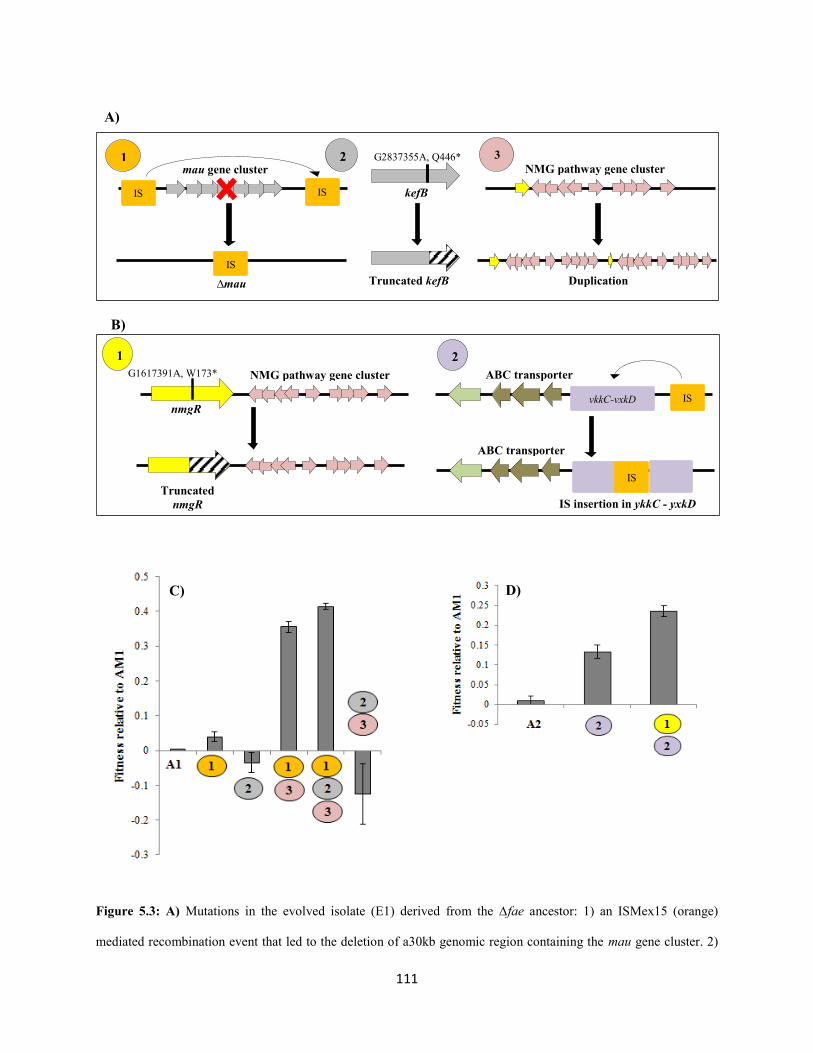
111
Figure 5.3: A) Mutations in the evolved isolate (E1) derived from the ∆fae ancestor: 1) an ISMex15 (orange)
mediated recombination event that led to the deletion of a30kb genomic region containing the mau gene cluster. 2)
IS IS
mau gene cluster
IS
∆mau
kefB
G2837355A, Q446*
Truncated kefB
NMG pathway gene cluster
Duplication
1 2 3
1 2 NMG pathway gene cluster G1617391A, W173*
nmgR
Truncated
nmgR
ykkC-yxkD
ABC transporter
IS
ABC transporter
IS
IS insertion in ykkC - yxkD
C) D)
B)
A)
112
(Figure 5.3 Continued) A non-synonymous point mutation leading to a premature stop codon in kefB. 3) A tandem
duplication of a 10 kb genomic region containing the NMG pathway genes (in pink) B) Mutations in the evolved
isolate (E2) derived from the ∆mau ancestor. 1) A non-synonymous point mutation leading to a premature stop
codon in a gene (yellow) directly upstream of the NMG pathway gene cluster (pink). 2) An ISMex15 family
mediated transposition event in the ykkC/yxkD RNA element (purple) 488 bp upstream of ABC transporter. C)
Competitive fitness of strains with different combinations of mutations from E1 on 20mM methylamine. D)
Competitive fitness of strains with different combinations of mutations from E2 on 20mM methylamine. The error
bars represent the 95% confidence interval of the mean of three biological replicates.
The Q446* mutation in kefB further increased the fitness on methylamine by 14.1% (Figure 5.3c). To
determine whether this truncated kefB allele behaves like a null mutant, we deleted kefB in the E1
genomic background. The methylamine fitness of the E1+ ∆kefB mutant was significantly lower than E1
(8%; p < 0.01) (Figure S3.1, Appendix 3) suggesting that the truncated version of kefB is not a null
mutation, and encodes functional protein. The fitness data of different combination of mutations that
arose in E1 suggested that the deletion of the mau gene cluster was the first mutation to have fixed in the
A1 population. In fact, when the mau gene cluster was re-introduced on a plasmid (pAYC139)
(Chistoserdov et al. 1991) in the E1 genomic background, the fitness of the resulting transconjugant on
methylamine was -12.4% (p < 0.01) (Figure 5.3c).
Contrary to E1, no evidence of sign epistasis was detected in E2 (Figure 3d). Both mutations were
beneficial; the IS insertion in the ykkC/yxkD RNA element increased the fitness on methylamine by 15-
fold (p < 0.01) and the W173* mutation in Meta1_1544 increased the fitness further by 37% (p < 0.01)
(Figure 5.3d).
Low expression levels prevent methylamine growth using the N-methylglutamate pathway in M.
extroquens AM1
The duplication of the 10 kb genomic region with the genes of the NMG pathway in E1 as well
the W173* mutation in Meta1_1544 (immediately upstream of the NMG pathway genes) in E2 suggested
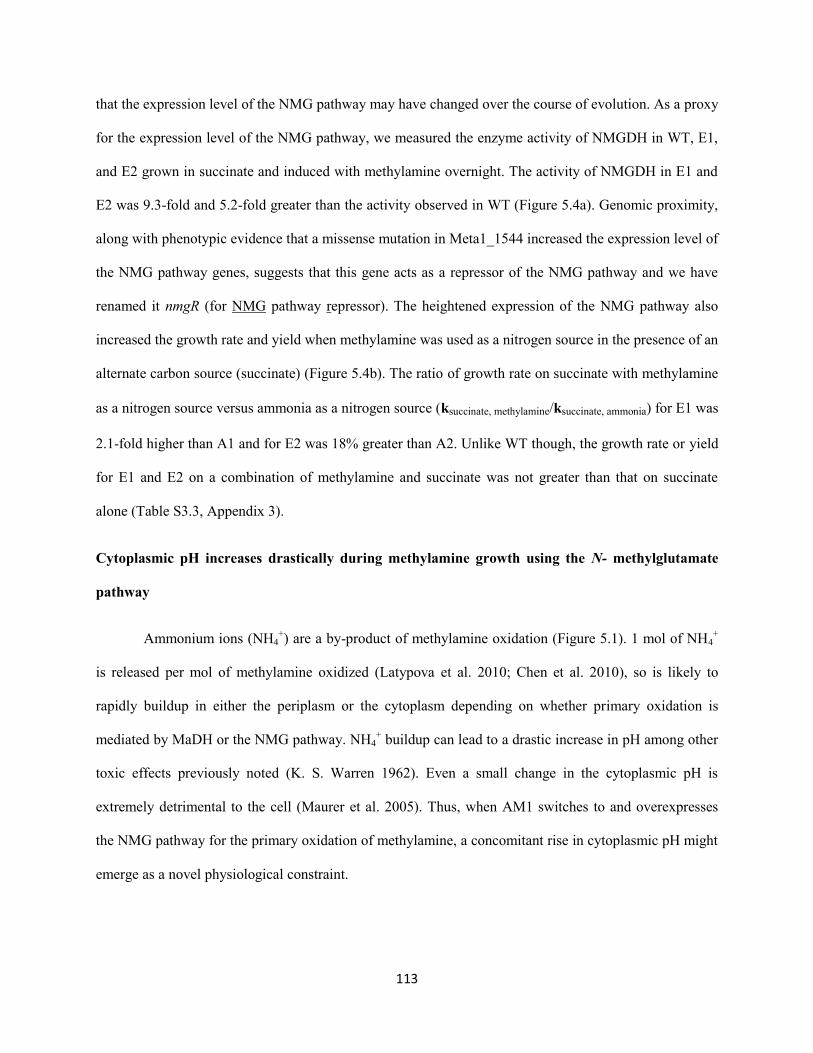
113
that the expression level of the NMG pathway may have changed over the course of evolution. As a proxy
for the expression level of the NMG pathway, we measured the enzyme activity of NMGDH in WT, E1,
and E2 grown in succinate and induced with methylamine overnight. The activity of NMGDH in E1 and
E2 was 9.3-fold and 5.2-fold greater than the activity observed in WT (Figure 5.4a). Genomic proximity,
along with phenotypic evidence that a missense mutation in Meta1_1544 increased the expression level of
the NMG pathway genes, suggests that this gene acts as a repressor of the NMG pathway and we have
renamed it nmgR (for NMG pathway repressor). The heightened expression of the NMG pathway also
increased the growth rate and yield when methylamine was used as a nitrogen source in the presence of an
alternate carbon source (succinate) (Figure 5.4b). The ratio of growth rate on succinate with methylamine
as a nitrogen source versus ammonia as a nitrogen source (ksuccinate, methylamine/ksuccinate, ammonia) for E1 was
2.1-fold higher than A1 and for E2 was 18% greater than A2. Unlike WT though, the growth rate or yield
for E1 and E2 on a combination of methylamine and succinate was not greater than that on succinate
alone (Table S3.3, Appendix 3).
Cytoplasmic pH increases drastically during methylamine growth using the N- methylglutamate
pathway
Ammonium ions (NH4+) are a by-product of methylamine oxidation (Figure 5.1). 1 mol of NH4
+
is released per mol of methylamine oxidized (Latypova et al. 2010; Chen et al. 2010), so is likely to
rapidly buildup in either the periplasm or the cytoplasm depending on whether primary oxidation is
mediated by MaDH or the NMG pathway. NH4+ buildup can lead to a drastic increase in pH among other
toxic effects previously noted (K. S. Warren 1962). Even a small change in the cytoplasmic pH is
extremely detrimental to the cell (Maurer et al. 2005). Thus, when AM1 switches to and overexpresses
the NMG pathway for the primary oxidation of methylamine, a concomitant rise in cytoplasmic pH might
emerge as a novel physiological constraint.
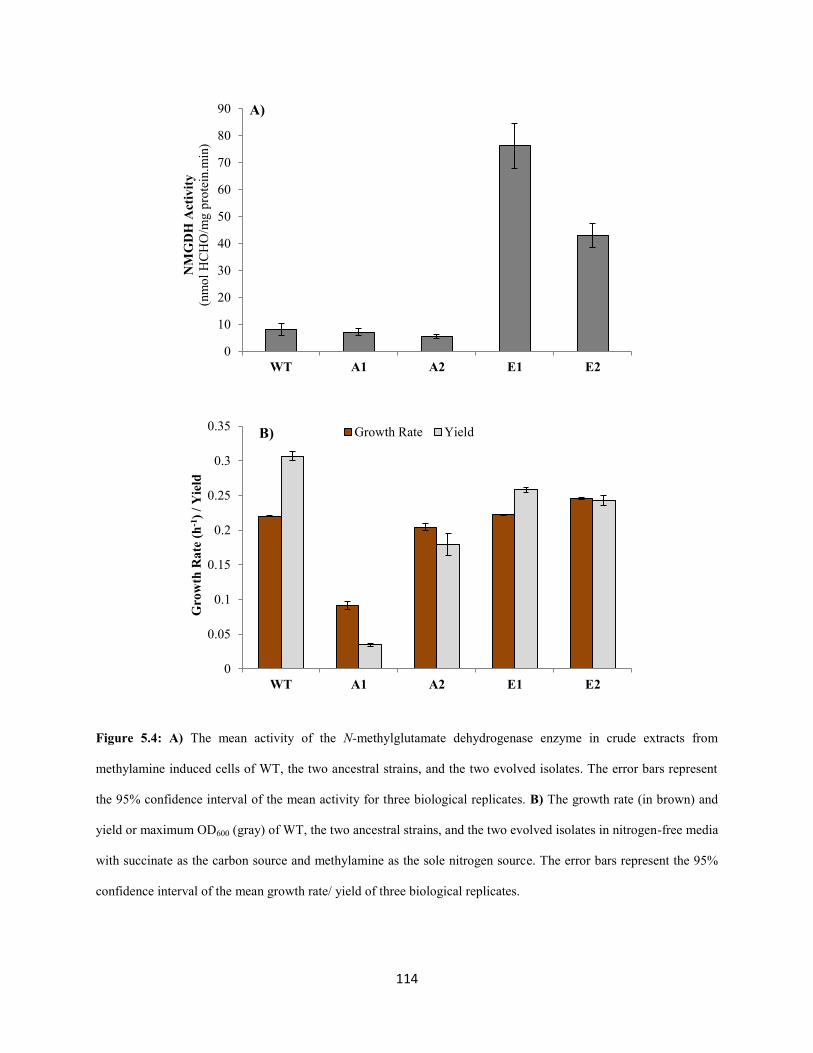
114
Figure 5.4: A) The mean activity of the N-methylglutamate dehydrogenase enzyme in crude extracts from
methylamine induced cells of WT, the two ancestral strains, and the two evolved isolates. The error bars represent
the 95% confidence interval of the mean activity for three biological replicates. B) The growth rate (in brown) and
yield or maximum OD600 (gray) of WT, the two ancestral strains, and the two evolved isolates in nitrogen-free media
with succinate as the carbon source and methylamine as the sole nitrogen source. The error bars represent the 95%
confidence interval of the mean growth rate/ yield of three biological replicates.
0
10
20
30
40
50
60
70
80
90
WT A1 A2 E1 E2
NM
GD
H A
ctiv
ity
(nm
ol
HC
HO
/mg p
rote
in.m
in)
0
0.05
0.1
0.15
0.2
0.25
0.3
0.35
WT A1 A2 E1 E2
Gro
wth
Ra
te (
h-1
) /
Yie
ld
Growth Rate Yield
A)
B)
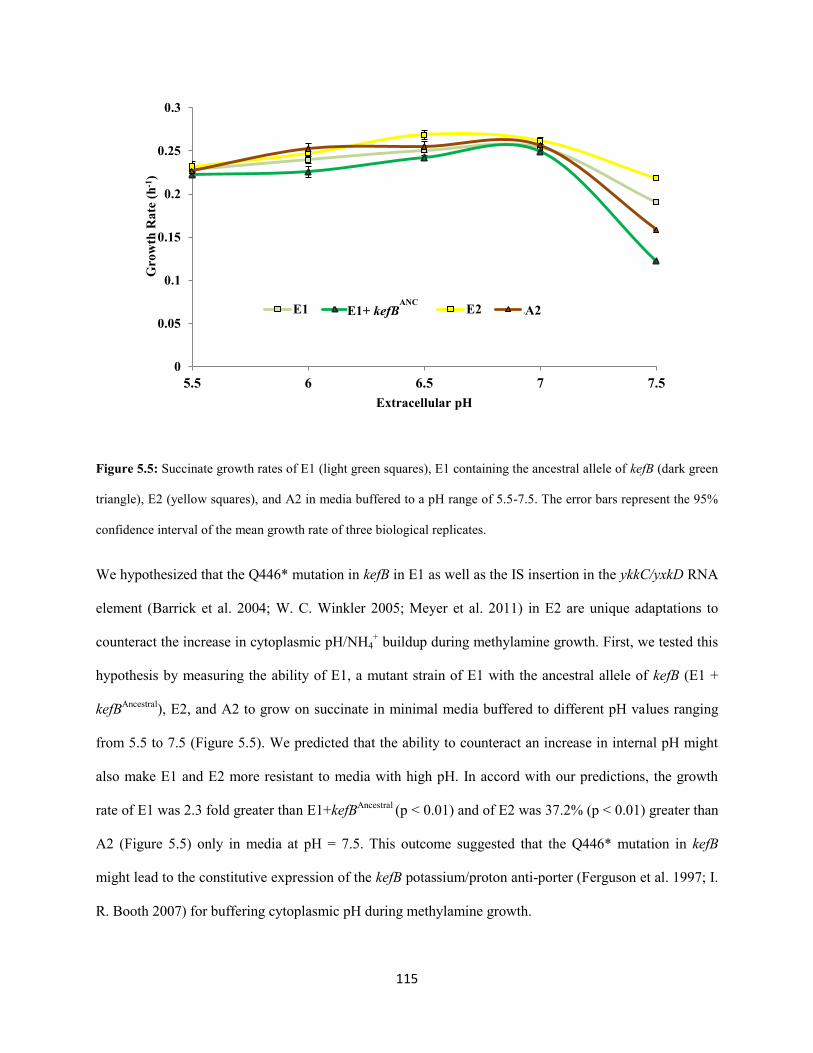
115
Figure 5.5: Succinate growth rates of E1 (light green squares), E1 containing the ancestral allele of kefB (dark green
triangle), E2 (yellow squares), and A2 in media buffered to a pH range of 5.5-7.5. The error bars represent the 95%
confidence interval of the mean growth rate of three biological replicates.
We hypothesized that the Q446* mutation in kefB in E1 as well as the IS insertion in the ykkC/yxkD RNA
element (Barrick et al. 2004; W. C. Winkler 2005; Meyer et al. 2011) in E2 are unique adaptations to
counteract the increase in cytoplasmic pH/NH4+ buildup during methylamine growth. First, we tested this
hypothesis by measuring the ability of E1, a mutant strain of E1 with the ancestral allele of kefB (E1 +
kefBAncestral
), E2, and A2 to grow on succinate in minimal media buffered to different pH values ranging
from 5.5 to 7.5 (Figure 5.5). We predicted that the ability to counteract an increase in internal pH might
also make E1 and E2 more resistant to media with high pH. In accord with our predictions, the growth
rate of E1 was 2.3 fold greater than E1+kefBAncestral
(p < 0.01) and of E2 was 37.2% (p < 0.01) greater than
A2 (Figure 5.5) only in media at pH = 7.5. This outcome suggested that the Q446* mutation in kefB
might lead to the constitutive expression of the kefB potassium/proton anti-porter (Ferguson et al. 1997; I.
R. Booth 2007) for buffering cytoplasmic pH during methylamine growth.
0
0.05
0.1
0.15
0.2
0.25
0.3
5.5 6 6.5 7 7.5
Gro
wth
Ra
te (
h-1
)
Extracellular pH
E1 E1kefB(Anc) E2 A2E1+ kefBANC
A2
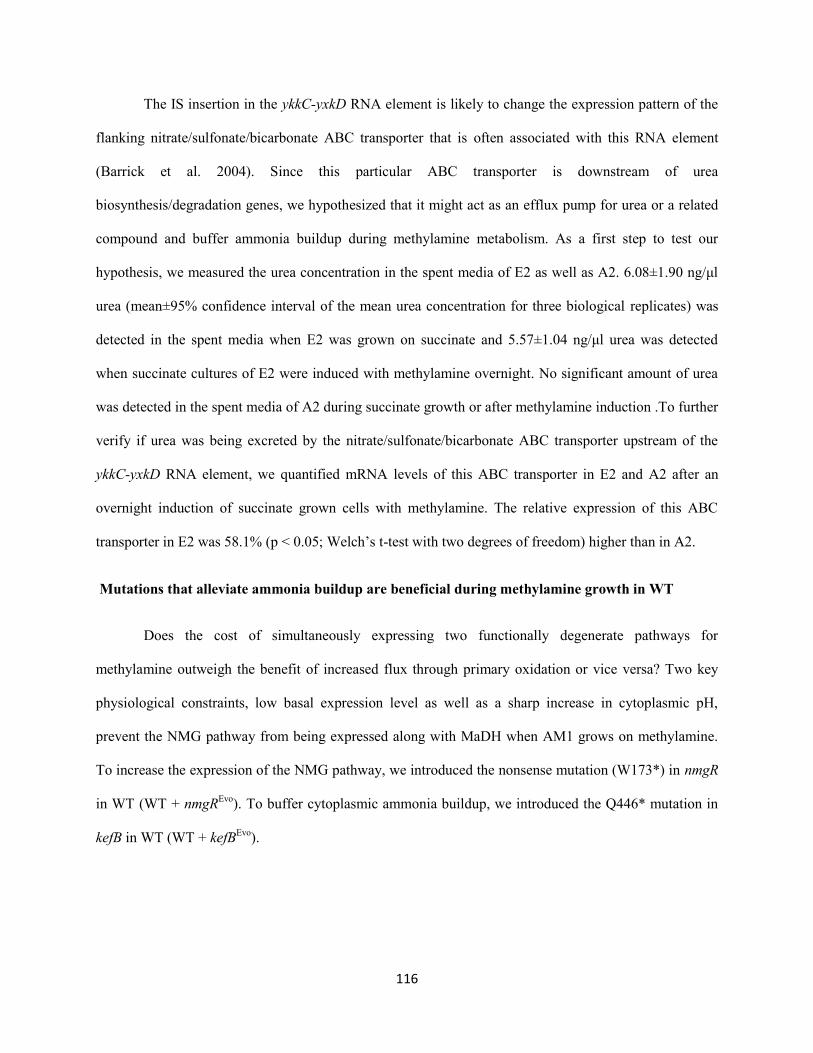
116
The IS insertion in the ykkC-yxkD RNA element is likely to change the expression pattern of the
flanking nitrate/sulfonate/bicarbonate ABC transporter that is often associated with this RNA element
(Barrick et al. 2004). Since this particular ABC transporter is downstream of urea
biosynthesis/degradation genes, we hypothesized that it might act as an efflux pump for urea or a related
compound and buffer ammonia buildup during methylamine metabolism. As a first step to test our
hypothesis, we measured the urea concentration in the spent media of E2 as well as A2. 6.08±1.90 ng/μl
urea (mean±95% confidence interval of the mean urea concentration for three biological replicates) was
detected in the spent media when E2 was grown on succinate and 5.57±1.04 ng/μl urea was detected
when succinate cultures of E2 were induced with methylamine overnight. No significant amount of urea
was detected in the spent media of A2 during succinate growth or after methylamine induction .To further
verify if urea was being excreted by the nitrate/sulfonate/bicarbonate ABC transporter upstream of the
ykkC-yxkD RNA element, we quantified mRNA levels of this ABC transporter in E2 and A2 after an
overnight induction of succinate grown cells with methylamine. The relative expression of this ABC
transporter in E2 was 58.1% (p < 0.05; Welch’s t-test with two degrees of freedom) higher than in A2.
Mutations that alleviate ammonia buildup are beneficial during methylamine growth in WT
Does the cost of simultaneously expressing two functionally degenerate pathways for
methylamine outweigh the benefit of increased flux through primary oxidation or vice versa? Two key
physiological constraints, low basal expression level as well as a sharp increase in cytoplasmic pH,
prevent the NMG pathway from being expressed along with MaDH when AM1 grows on methylamine.
To increase the expression of the NMG pathway, we introduced the nonsense mutation (W173*) in nmgR
in WT (WT + nmgREvo
). To buffer cytoplasmic ammonia buildup, we introduced the Q446* mutation in
kefB in WT (WT + kefBEvo
).
117
Figure 5.6: A) Growth rate (brown), yield or maximum OD600 (gray) and B) competitive fitness on 20 mM
methylamine for WT, WT with the evolved allele of kefB from E1, WT with the evolved allele of nmgR from E2.
The error bars represent the 95% confidence interval of the mean of three biological replicates.
Relative to WT, no significant difference in growth rate (p = 0.6555), yield (p= 0.7915) or competitive
fitness (p = 0.0749) on methylamine was observed for WT + nmgREvo
. (Figure 5.6a, Figure 5.6b). In
contrast, WT + kefBEvo
was 8.5% more fit (p < 0.01) and grew 12.0% faster (p < 0.01) on methylamine but
had a 2.9% decrease in yield (p < 0.01) compared to WT (Figure 5.6a, Figure 6b). Additionally, WT +
kefBEvo
was 14.0 %, 14.3%, and 4.1% more fit than WT on succinate (p < 0.01), methanol (p < 0.01) and
formate (p < 0.01) respectively (FigureS3.2, Appendix 3). Altogether, overexpressing the NMG pathway
in WT does not change the growth rate or yield in methylamine but physiological solutions that alleviate
NH4+ buildup are beneficial in WT too.
Discussion
Decades of research had established that MaDH was the sole pathway for the primary oxidation
of methylamine in AM1. This notion was recently challenged when a study (Martinez-Gomez et al. 2013)
0.15
0.2
0.25
0.3
0.35
WT WT
nmgRevo
WT kefBevo
Gro
wth
Ra
te (
h-1
) /
Yie
ld
Growth Rate Yield
WT
kefBevo
WT
nmgRevo
WT
nmgRevo
0.8
0.85
0.9
0.95
1
1.05
1.1
1.15
WT WT
nmgRevo
WT
kefBevo
Fit
nes
s
WT
kefBevo
WT
nmgRevo
B) A)
118
reported that enzymes of the NMG pathway for methylamine oxidation are also encoded and, under
specific conditions, highly expressed in AM1. Then why was this degeneracy not discovered earlier?
What physiological constraints occluded the functional realization of metabolic degeneracy in AM1? To
answer these questions two mutant strains of AM1, conventionally known to have a methylamine-
phenotype, were experimentally evolved on methylamine as the sole carbon and energy source. The first
strain, a ∆fae mutant (A1) , had a partial lesion in the H4MPT dependent formaldehyde oxidation module
so as to constrain the rate of formaldehyde oxidation to that mediated by the spontaneous reaction with
H4MPT (Marx et al. 2003). In the presence of methylamine, free formaldehyde rapidly builds up in the
∆fae mutant; by switching to the NMG pathway this mutant should be able to sustain methylamine
growth, albeit at a slower rate (Nayak and Marx 2014b). The second strain (A2) had an IS mediated
recombination that led to the deletion of the entire mau gene cluster encoding MaDH and ancillary
proteins. Comparative genomic analysis of the evolved mutants revealed three key adaptive mutations
that were required to facilitate the functional actualization of genomic degeneracy. The potentiating
mutation, a deletion of the mau operon, was unique to the ∆fae evolved population (E1). Deletion of
MaDH counters the buildup of free formaldehyde inside the cell and is likely to increase the survival of
the ∆fae mutant on methylamine drastically. Also, mutations that increased the flux through the NMG
pathway were contingent on a ∆mau deletion background. Sign epistasis between rate-enhancing
mutations and survival-enhancing mutations are likely to manifest in environments where survival, rather
than growth rate, is the first and foremost evolutionary hurdle cells have to overcome.
A striking observation about mutants lacking a functional MaDH is that they can still use
methylamine as a nitrogen source (Chistoserdov et al. 1991). Also, as a consequence of increasing flux
through the NMG pathway, the growth rate of both the evolved isolates on methylamine as a nitrogen
source improved tremendously (Figure 5.4b). These data suggest that, in the natural environment, AM1
probably encounters methylamine in two completely different roles - as a carbon source or as a nitrogen
source. In environments where methylamine is abundant and serves as the preferred carbon source,
119
MaDH catalyzes primary oxidation. In environments with other carbon source/s but with methylamine as
the sole/preferred nitrogen source, the NMG pathway might be recruited for primary oxidation instead.
Functionally degenerate pathways specialized for unique ecological roles would only co-exist in a
genome if there were trade-offs. We theorize that the NMG pathway should have a much lower Km than
MaDH to use low concentrations of methylamine as a nitrogen source and MaDH should have a higher
Vmax than the NMG pathway to use methylamine as a carbon source.
An increase in the expression level of the NMG pathway was observed in both evolved
populations. A tandem duplication of the entire 10kb genomic region containing the NMG pathway genes
(Figure 5.3a) in E1 and a nonsense mutation in a repressor of the NMG pathway gene cluster (named
nmgR) (Figure 5.3b) in E2 were extremely beneficial and led to a significant increase in the competitive
fitness as well as growth rate on methylamine (Figure 5.3c, Figure 5.3d). These adaptive mutations reveal
two salient aspects of regulation that prevent functional degeneracy: 1) if a functional MaDH is present,
the NMG pathway is tightly repressed, even in the presence of methylamine (Figure 5.4a and 5. 2) even if
MaDH is absent, the expression level of the NMG pathway is much lower than that has been observed for
MaDH (Figure 5.4a) (McIntire et al. 1991). Compared to MaDH, the NMG pathway is energetically
unfavorable because it oxidizes methylamine in an ATP-dependent manner (Kung and Wagner 1969;
Latypova et al. 2010). A regulatory framework that controls the expression of the NMG pathway and
restricts it to those environments (with low concentrations of methylamine as a nitrogen source) in which
the MaDH is suboptimal would enable higher yield/growth rate on methylamine as a carbon source. The
exact mechanism by which the cell determines the methylamine concentration and switches between
these two pathways is yet to be determined
Overexpression of the NMG pathway in methylotrophs like AM1, that typically use a periplasmic
MaDH for methylamine growth, results in alkalization of the cytoplasmic space. Unique physiological
innovations to counter the rise in cytoplasmic pH/ NH4+ ions were observed in each of the evolved
populations. KefB, a glutathione-gated K+/H
+ anti-porter protects E. coli from electrophiles by acidifying
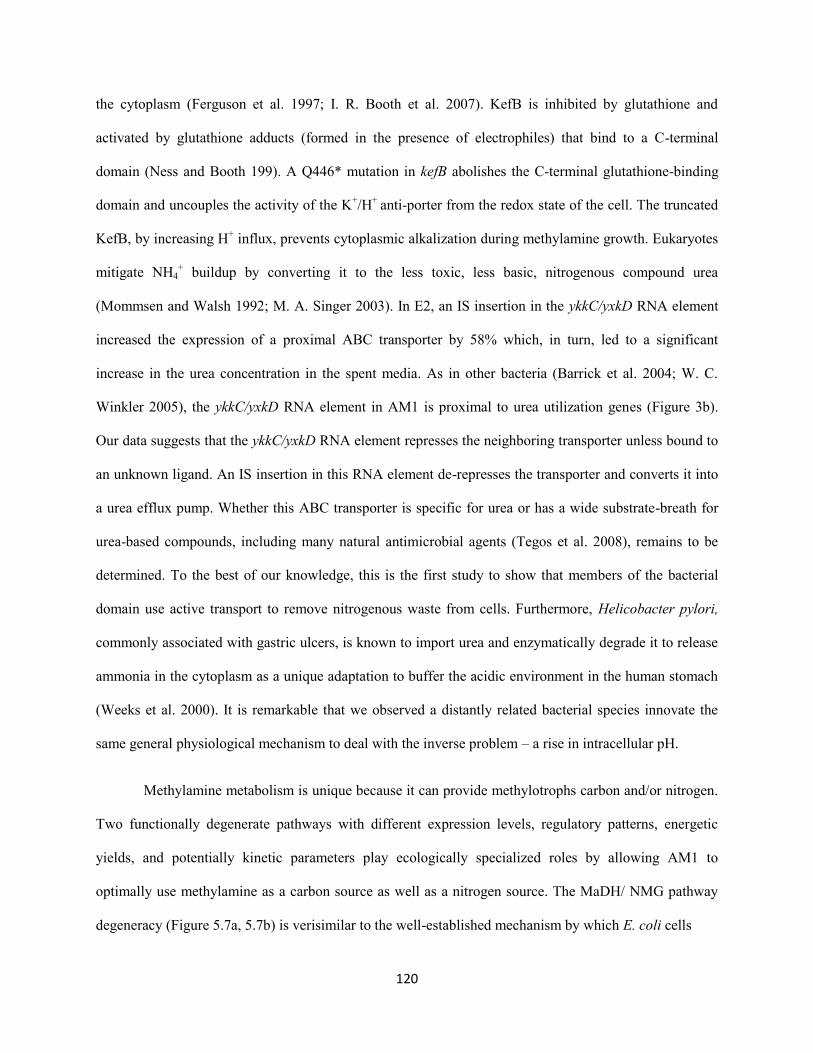
120
the cytoplasm (Ferguson et al. 1997; I. R. Booth et al. 2007). KefB is inhibited by glutathione and
activated by glutathione adducts (formed in the presence of electrophiles) that bind to a C-terminal
domain (Ness and Booth 199). A Q446* mutation in kefB abolishes the C-terminal glutathione-binding
domain and uncouples the activity of the K+/H
+ anti-porter from the redox state of the cell. The truncated
KefB, by increasing H+ influx, prevents cytoplasmic alkalization during methylamine growth. Eukaryotes
mitigate NH4+ buildup by converting it to the less toxic, less basic, nitrogenous compound urea
(Mommsen and Walsh 1992; M. A. Singer 2003). In E2, an IS insertion in the ykkC/yxkD RNA element
increased the expression of a proximal ABC transporter by 58% which, in turn, led to a significant
increase in the urea concentration in the spent media. As in other bacteria (Barrick et al. 2004; W. C.
Winkler 2005), the ykkC/yxkD RNA element in AM1 is proximal to urea utilization genes (Figure 3b).
Our data suggests that the ykkC/yxkD RNA element represses the neighboring transporter unless bound to
an unknown ligand. An IS insertion in this RNA element de-represses the transporter and converts it into
a urea efflux pump. Whether this ABC transporter is specific for urea or has a wide substrate-breath for
urea-based compounds, including many natural antimicrobial agents (Tegos et al. 2008), remains to be
determined. To the best of our knowledge, this is the first study to show that members of the bacterial
domain use active transport to remove nitrogenous waste from cells. Furthermore, Helicobacter pylori,
commonly associated with gastric ulcers, is known to import urea and enzymatically degrade it to release
ammonia in the cytoplasm as a unique adaptation to buffer the acidic environment in the human stomach
(Weeks et al. 2000). It is remarkable that we observed a distantly related bacterial species innovate the
same general physiological mechanism to deal with the inverse problem – a rise in intracellular pH.
Methylamine metabolism is unique because it can provide methylotrophs carbon and/or nitrogen.
Two functionally degenerate pathways with different expression levels, regulatory patterns, energetic
yields, and potentially kinetic parameters play ecologically specialized roles by allowing AM1 to
optimally use methylamine as a carbon source as well as a nitrogen source. The MaDH/ NMG pathway
degeneracy (Figure 5.7a, 5.7b) is verisimilar to the well-established mechanism by which E. coli cells
121
Figure 5.7: A) A schematic representing the metabolic route followed by methylamine when M. extorquens AM1
grows on abundant methylamine as a carbon source and/or a nitrogen source. Methylamine dehydrogeanse is the
sole module involved in primary oxidation. B) A schematic representing the metabolic route likely to be followed by
methylamine when M. extorquens AM1 uses limiting concentrations of methylamine as the sole nitrogen source in
the presence of other, more abundant, carbon substrate/s. The N-methylglutamate pathway is the sole module
involved in primary oxidation.
MaDH: Methylamine dehydrogeanse
exploit one of glutamine synthetase-glutamate synthase (GOGAT) and glutamate dehydrogenase (GDH)
for optimal ammonia assimilation based on substrate and ammonia availability (Yuan et al. 2009; L.
Reitzer 2003). Thus, metabolic degeneracy that isn’t functionally relevant in the laboratory might still be
environmentally relevant by allowing the cells to exploit a wider concentration gradient or optimally use
different units of a complex compound.
CH3NH
2
HCHO
CO2
Fae
biomass
CH3NH
2 HCHO
MaDH
NH4
+, 2e
-
CH3NH
2
HCHO
CO2
biomass
CH3NH
2
Alternate Carbon Source
NH4
+, 2e
-
ATP ADP
2e-
B) A)
122
References
1. Romano AH, Conway T (1996) Evolution of carbohydrate metabolic pathways. Res. Microbiol.
147:448-455.
2. Edelman GM, Gally JA (2001) Degeneracy and complexity in biological systems. PNAS 98:13763-
13768.
3. Boucher Y, Douady CJ, Papke RT, Walsh DA, Boudreau MER, NesbØ CL, Case RJ, Doolittle WF
(2003) Lateral gene transfer and the origins of prokaryotic groups. Ann. Rev. Genet. 37:283-328.
4. Marx CJ, Van Dien SJ, Lidstrom ME (2005) Flux analysis uncovers key role of functional
redundancy in formaldehyde metabolism. PLoS Biol. 3: e16.
5. Chistoserdova L (2011) Modularity of methylotrophy, revisited. Environ. Microbiol. 13:2603-2622.
6. Berg IA (2011) Ecological aspects of the distribution of different autotrophic CO2 fixation pathways.
Appl. Environ. Microbiol. 77:1925-1936
7. Flamholz A, Noor E, Bar-Even A, Liebermeister W, Milo R (2013) Glycolytic strategy as a tradeoff
between energy yield and protein cost. PNAS 110:10039-10044.
8. Martiny JBH, Bohannan BJM, Brown JH, et al., (2006) Microbial biogeography: putting
microorganisms on the map. Nat. Rev. Microbiol. 4:102-112.
9. Chain PSG, Denaf VJ, Konstantinidis KT, et al., (2007) Burkholderia xenovorans LB400 harbors a
multi-replicon 9.73-Mbp genome shaped for versatility. PNAS 103:15280-15287
10. Stelling J, Sauer U, Szallasi Z, Doyle III FJ, Doyle J (2004) Robustness of cellular functions. Cell
118:675-685.
11. Deutscher D, Meilijson I, Kupiec M, Ruppin E (2006) Multiple knockout analysis of genetic
robustness in the yeast metabolic network. Nat. Genet. 38:993-998.
12. Marx CJ, Miller JA, Chistoserdova L, Lidstrom ME (2004) Multiple formaldehyde
oxidation/detoxification pathways in Burkholderia fungorum LB400. J. Bacteriol. 186:2173-2178.
13. Chistoserdova L, Gomelsky L, Vorholt JA, Gomelsky M, Tsygankov YD, Lidstrom ME (2000)
Analysis of two formaldehyde oxidation pathways in Methylobacillus flagellatus KT, a Ribulose
monophosphate cycle methylotroph. Microbiology 146:233-238.
14. Chistoserdova L, Lapidus A, Han C, et al., (2007) Genome of Methylobacillus flagellatus, molecular
basis for obligate methylotrophy, and polyphyletic origin of methylotrophy. J. Bacteriol. 189:4040-
4027.
15. Anthony C (1982) The biochemistry of methylotrophs. Academic Press Ltd., London.
16. Eady RR, Large PJ (1968) Purification and properties of an amine dehydrogenase from Pseudomonas
AM1 and its role in growth on methylamine. Biochem J., 106:245-255.
123
17. McIntire WS, Wemmer DE, Chistoserdov A, Lidstrom ME (1991) A new cofactor in a prokaryotic
enzyme: tryptophan tryptophylquinone as the redox prosthetic group in methylamine dehydrogeanse.
Science 252:817-824.
18. Chistoserdov AY, Tsygankov YD, Lidstrom ME (1991) Genetic organization of methylamine
utilization genes from Methylobacterium extorquens AM1. J. Bacteriol. 18:5901-5908.
19. Chen L, Durley RC, Mathews FS, Davidson VL (1994) Structure of an electron transfer complex:
methylamine dehydrogeanse, amicyanin, and cytochrome c551i. Science 264:86-90.
20. Tobari J, Harada Y (1981) Amicyanin: an electron acceptor of methylamine dehydrogeanse.
Biochem. Biophysics Res. Comm. 101:502-508.
21. Chen L, Durley R, Poliks BJ, Hamada K, Chen Z, Mathews FS, Davidson VL, Satow Y, Huizinga E
(1992) Crystal structure of an electron-transfer complex between methylamine dehydrogeanse and
amicyanin. Biochemistry 31:4959-4964.
22. Nayak DD, Marx CJ (2014) Genetic and phenotypic comparison of methylotrophy between
Methylobacterium extorquens strains AM1 and PA1. PloS One (in revision)
23. Shaw WV, Tsai L, Stadtman (1966) The enzymatic synthesis of N-methylglutamic acid. J. Biol.
Chem. 241:935-945.
24. Latypova E, Yang S, Wang YS, Wang T, Chavkin TA, Hackett M, Schafer H, Kalyuzhnaya MG
(2010) Genetics of the glutamate-mediated methylamine utilization pathway in the facultative
methylotrophic beta-proteobacteria Methyloversatilis universalis FAM5. Mol. Microbiol. 75:426-439.
25. Chen Y, Scanlan J , Song L, Crombie A, Rahman MT, Schafer H, Murrell JC (2010) γ-
glutamylmethylamide is an essential intermediate in the metabolism of methylamine by Methylocella
silvestris. Appl. Environ. Microbiol. 76:4350-4357.
26. Martinez-Gomez NC, Nguyen S, Lidstrom ME (2013) Elucidation of the role of methylene-
tetrahydromethanopterin dehydrogenase MtdA in the tetrahydromethanopterin-dependent oxidation
pathway in Methylobacterium extorquens AM1. J. Bacteriol.195:2359-2367.
27. Gruffaz C, Muller EEL, Louhichi-Jelail Y, Nelli YR, Guichard G, Bringel F (2014) Genes of the N-
methylglutamate pathway are essential for growth of Methylobacterium extorquens DM4 on
monomethylamine. Appl. Environ. Microbiol. 80:3541-3550.
28. Nayak DD, Marx CJ (2014) Methylamine utilization via a linear N-methylglutamate pathway in
Methylobacterium extorquens PA1 does not require the tetrahydrofolate-dependent C1 transfer
pathway. J. Bacteriol (in revision)
29. Kung HF, C Wagner (1969) γ-glutamylmethylamide a new intermediate in the metabolism of
methylamine. J. Biol. Chem. 244:4136-4140.
30. Agashe D, Martinez-Gomez NC, Drummond DA, Marx CJ (2013) Good codons, bad transcript: large
reductions in gene expression and fitness arising from synonymous mutations in a key enzyme. Mol.
Biol. Evol. 30: 549-560.
124
31. Michener JK, Vuilleumier S, Bringer F, Marx CJ (2014) Phylogeny poorly predicts the utility of a
challenging horizontally transferred gene in Methylobacterium strains. J. Bacteriol. 196:2101-2107.
32. Lee M-C, Marx CJ (2012) Repeated, selection-driven genome reduction of accessory genes in
experimental populations. PLoS Genetics. 8: e1002651.
33. Delaney NF, Kaczmarek ME, Ward LM, Swanson PK, Lee M-C, Marx CJ (2013) Development of an
optimized medium, strain, and high-throughput culturing methods for Methylobacterium extorquens.
PLoS One. 8: e62957.
34. Gibson DG, Young L, Chuang RY et al. (2009) Enzymatic assembly of DNA molecules up to several
hundred kilobases. Nat. Methods. 6: 343-345.
35. Marx CJ (2008) Development of a broad-host-range sacB-based vector for unmarked allelic
exchange. BMC Res. Notes. 1: 1.
36. Lee M-C, Chou H-H, Marx CJ (2009) Asymmetric, bimodal trade-offs during adaptation of
Methylobacterium to different growth substrates. Evolution. 63: 2816-2830.
37. Chou H-H, Marx CJ (2012) Optimization of gene expression through divergent mutational paths. Cell
Rep. 1: 133-140.
38. Figurski DH, Helinski DR (1979) Replication of an origin-containing derivative of plasmid RK2
dependent on a plasmid function provided in trans. PNAS.76: 1648-1652.
39. Lidstrom ME (2006) Aerobic methylotrophic prokaryotes. Prokaryotes 2:618-634.
40. Vorholt JA, Marx CJ, Lidstrom ME, Thauer RK (2000) Novel formaldehyde-activating enzyme in
Methylobacterium extorquens AM1. 182: 6645-6650.
41. Nayak DD, Marx CJ (2014). Horizontal gene transfer overcomes the adaptive constraints posed by a
sub-optimal pathway for methylamine utilization in Methylobacterium extorquens PA1. BMC
Evolutionary Biology (in review)
42. Chistoserdova L, Chen SW, Lapidus A, Lidstrom ME (2003) Methylotrophy in Methylobacterium
extorquens AM1 from a genomic point of view. J. Bacteriol. 185:2980-2987.
43. Rasche ME, Havemann SA, Rosenzvaig M (2004) Characterization of two methanopterin
biosynthesis mutants of Methylobacterium extorquens AM1 by use of a tetrahydromethanopterin
bioassay. J. Bacteriol. 186: 1565-1570.
44. Barrick Je, Corbino KA, Winkler WC, et al., (2004) New RNA motifs suggest an expanding scope for
riboswitches in bacterial genetic control. PNAS 101:6421-6426.
45. Warren KS (1962) Ammonia toxicity and pH. Nature 195:47-49.
46. Maurer LM, Yohannes E, Bondurant SS, Radmacher M, Slonczewski JL (2005) pH regulates genes
for flagellar motility, catabolism and oxidative stress in Escherichia coli K-12. J. Bacteriol. 187:304-
319
125
47. Winkler WC, Breaker RR (2005) Regulation of bacterial gene expression by riboswitches. Ann. Rev.
Microbiol. 59:487-517.
48. Meyer MM, Hammond MC, Salinas Y, Roth A, Sudarsan N, Breaker RR (2011) Challenges of ligand
identification for riboswitch candidates. RNA Biol. 8:5-10.
49. Ferguson GP, Nikolaev Y, McLaggan D, Maclean M, Booth IR (1997) Survival during exposure to
the electrophilic reagent N-ethylmaleimide in Escherichia coli : role of KefB and KefC potassium
channels. J. Bacteriol. 179:1007-1012.
50. Booth IR (2007) The regulation of intracellular pH in bacteria. Novartis Foundation Symposium 221
– Bacterial responses to pH, John Wiley & Sons, Ltd.
51. Marx CJ, Chistoserdova L, Lidstrom ME (2003) Formaldehyde-detoxifying role of the
tetrahydromethanopterin-linked pathway in Methylobacterium extorquens AM1. J. Bacteriol. 185:
7160-7168.
52. Different foci for the regulation of the activity of the KefB and KefC glutathione-gated K+
efflux
systems. J. Biol. Chem. 274:9524-9530.
53. Mommsen TJ, Walsh PJ (1992) Biochemical and environmental perspectives on nitrogen metabolism
in fishes. Experientia 48:583-593.
54. Singer MA (2003) Do mammals, birds, reptiles, and fish have similar nitrogen conserving systems?
Comp. Biochem. Phys. Part B: Biochem. And Mol. Biol. 134:543-558.
55. Tegos GP, Masago K, Aziz F, Higginbottom A, Stermitiz FR, Hamblin MR (2008) Inhibitors of
bacterial multidrug efflux pumps potentiate antimicrobial photoinactivation. Antimicrob. Agents
Chemother. 52:3202-3209.
56. Weeks DL, Eskandari S, Scott DR, Sachs G (2000) An H+-gated urea channel: the link between
Helicobacter pylori urease and gastric colonization. Science 287: 482-485
57. Yuan J, Doucette CD, Fowler WU, Feng XJ, Piazza M, Rabitz HA, Wingreen NS, Rabinowitz JD
(2009) Metabolomics-driven quantitative analysis of ammonia assimilation in E. coli. Mol. Sys. Biol.
5:302.
58. Reitzer L (20030 Nitrogen assimilation and global regulation in Escherichia coli. Ann. Rev.
Microbiol. 57:155-176.

Appendix 1
Supplementary Material for Chapter 2
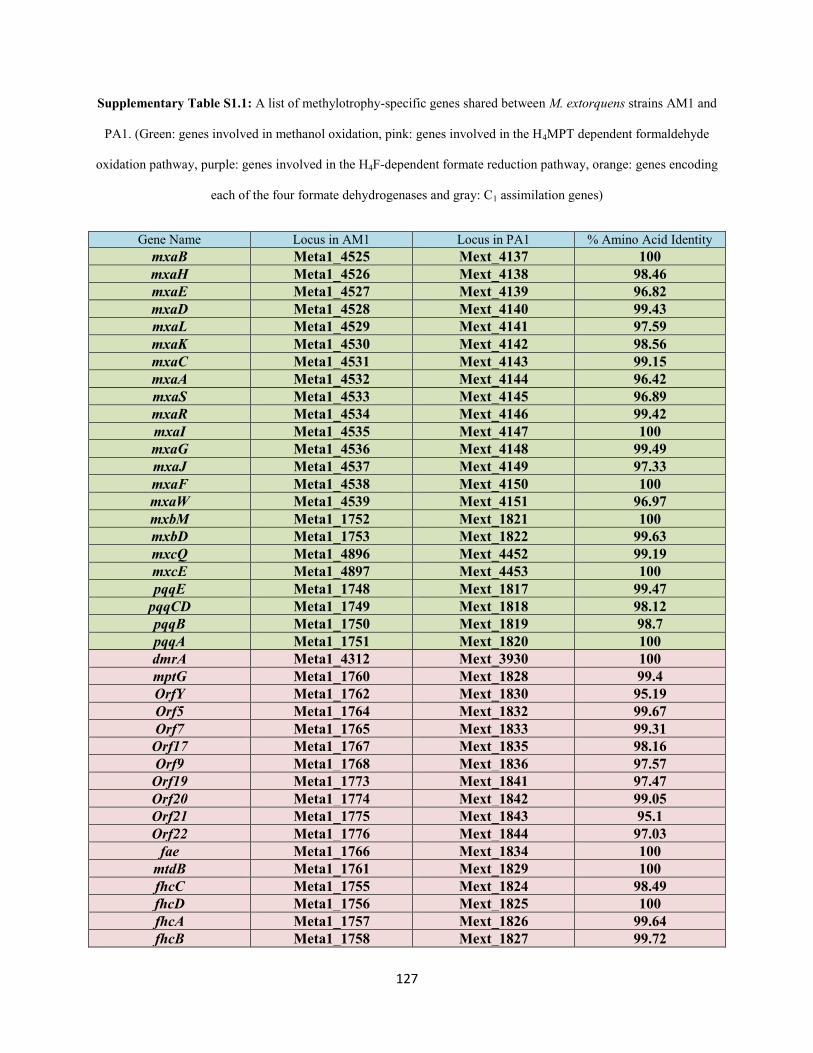
127
Supplementary Table S1.1: A list of methylotrophy-specific genes shared between M. extorquens strains AM1 and
PA1. (Green: genes involved in methanol oxidation, pink: genes involved in the H4MPT dependent formaldehyde
oxidation pathway, purple: genes involved in the H4F-dependent formate reduction pathway, orange: genes encoding
each of the four formate dehydrogenases and gray: C1 assimilation genes)
Gene Name Locus in AM1 Locus in PA1 % Amino Acid Identity
mxaB Meta1_4525 Mext_4137 100
mxaH Meta1_4526 Mext_4138 98.46
mxaE Meta1_4527 Mext_4139 96.82
mxaD Meta1_4528 Mext_4140 99.43
mxaL Meta1_4529 Mext_4141 97.59
mxaK Meta1_4530 Mext_4142 98.56
mxaC Meta1_4531 Mext_4143 99.15
mxaA Meta1_4532 Mext_4144 96.42
mxaS Meta1_4533 Mext_4145 96.89
mxaR Meta1_4534 Mext_4146 99.42
mxaI Meta1_4535 Mext_4147 100
mxaG Meta1_4536 Mext_4148 99.49
mxaJ Meta1_4537 Mext_4149 97.33
mxaF Meta1_4538 Mext_4150 100
mxaW Meta1_4539 Mext_4151 96.97
mxbM Meta1_1752 Mext_1821 100
mxbD Meta1_1753 Mext_1822 99.63
mxcQ Meta1_4896 Mext_4452 99.19
mxcE Meta1_4897 Mext_4453 100
pqqE Meta1_1748 Mext_1817 99.47
pqqCD Meta1_1749 Mext_1818 98.12
pqqB Meta1_1750 Mext_1819 98.7
pqqA Meta1_1751 Mext_1820 100
dmrA Meta1_4312 Mext_3930 100
mptG Meta1_1760 Mext_1828 99.4
OrfY Meta1_1762 Mext_1830 95.19
Orf5 Meta1_1764 Mext_1832 99.67
Orf7 Meta1_1765 Mext_1833 99.31
Orf17 Meta1_1767 Mext_1835 98.16
Orf9 Meta1_1768 Mext_1836 97.57
Orf19 Meta1_1773 Mext_1841 97.47
Orf20 Meta1_1774 Mext_1842 99.05
Orf21 Meta1_1775 Mext_1843 95.1
Orf22 Meta1_1776 Mext_1844 97.03
fae Meta1_1766 Mext_1834 100
mtdB Meta1_1761 Mext_1829 100
fhcC Meta1_1755 Mext_1824 98.49
fhcD Meta1_1756 Mext_1825 100
fhcA Meta1_1757 Mext_1826 99.64
fhcB Meta1_1758 Mext_1827 99.72
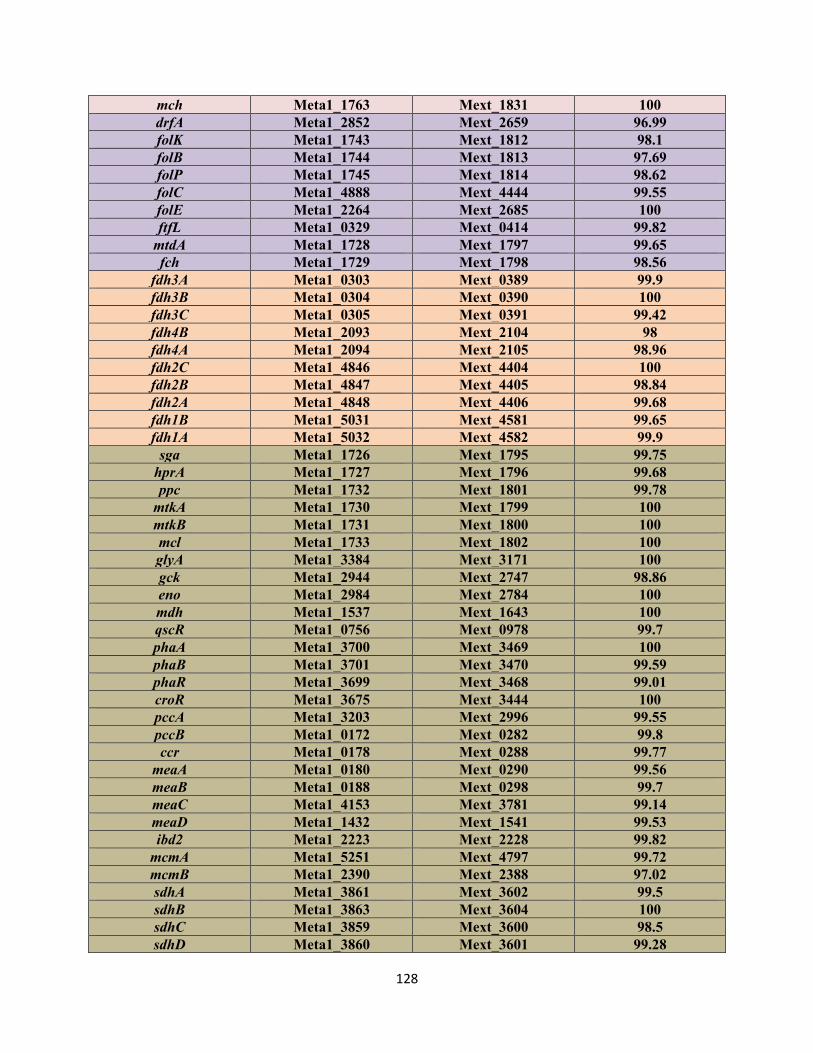
128
mch Meta1_1763 Mext_1831 100
drfA Meta1_2852 Mext_2659 96.99
folK Meta1_1743 Mext_1812 98.1
folB Meta1_1744 Mext_1813 97.69
folP Meta1_1745 Mext_1814 98.62
folC Meta1_4888 Mext_4444 99.55
folE Meta1_2264 Mext_2685 100
ftfL Meta1_0329 Mext_0414 99.82
mtdA Meta1_1728 Mext_1797 99.65
fch Meta1_1729 Mext_1798 98.56
fdh3A Meta1_0303 Mext_0389 99.9
fdh3B Meta1_0304 Mext_0390 100
fdh3C Meta1_0305 Mext_0391 99.42
fdh4B Meta1_2093 Mext_2104 98
fdh4A Meta1_2094 Mext_2105 98.96
fdh2C Meta1_4846 Mext_4404 100
fdh2B Meta1_4847 Mext_4405 98.84
fdh2A Meta1_4848 Mext_4406 99.68
fdh1B Meta1_5031 Mext_4581 99.65
fdh1A Meta1_5032 Mext_4582 99.9
sga Meta1_1726 Mext_1795 99.75
hprA Meta1_1727 Mext_1796 99.68
ppc Meta1_1732 Mext_1801 99.78
mtkA Meta1_1730 Mext_1799 100
mtkB Meta1_1731 Mext_1800 100
mcl Meta1_1733 Mext_1802 100
glyA Meta1_3384 Mext_3171 100
gck Meta1_2944 Mext_2747 98.86
eno Meta1_2984 Mext_2784 100
mdh Meta1_1537 Mext_1643 100
qscR Meta1_0756 Mext_0978 99.7
phaA Meta1_3700 Mext_3469 100
phaB Meta1_3701 Mext_3470 99.59
phaR Meta1_3699 Mext_3468 99.01
croR Meta1_3675 Mext_3444 100
pccA Meta1_3203 Mext_2996 99.55
pccB Meta1_0172 Mext_0282 99.8
ccr Meta1_0178 Mext_0288 99.77
meaA Meta1_0180 Mext_0290 99.56
meaB Meta1_0188 Mext_0298 99.7
meaC Meta1_4153 Mext_3781 99.14
meaD Meta1_1432 Mext_1541 99.53
ibd2 Meta1_2223 Mext_2228 99.82
mcmA Meta1_5251 Mext_4797 99.72
mcmB Meta1_2390 Mext_2388 97.02
sdhA Meta1_3861 Mext_3602 99.5
sdhB Meta1_3863 Mext_3604 100
sdhC Meta1_3859 Mext_3600 98.5
sdhD Meta1_3860 Mext_3601 99.28
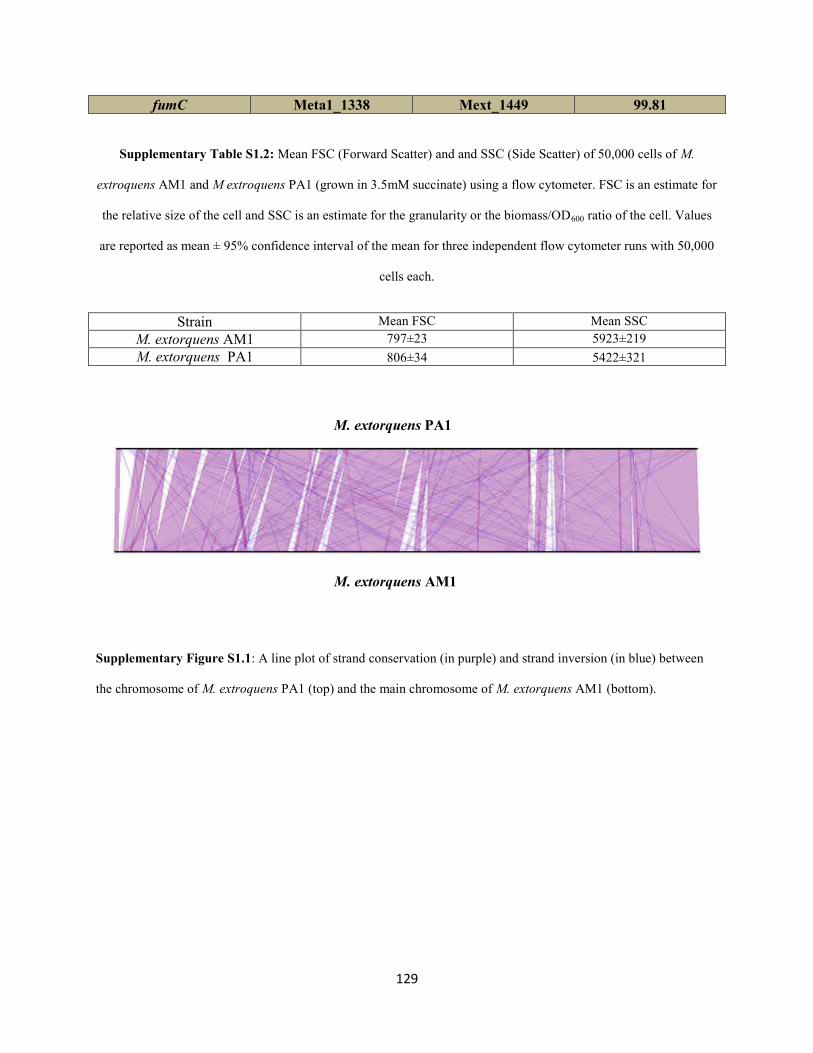
129
fumC Meta1_1338 Mext_1449 99.81
Supplementary Table S1.2: Mean FSC (Forward Scatter) and and SSC (Side Scatter) of 50,000 cells of M.
extroquens AM1 and M extroquens PA1 (grown in 3.5mM succinate) using a flow cytometer. FSC is an estimate for
the relative size of the cell and SSC is an estimate for the granularity or the biomass/OD600 ratio of the cell. Values
are reported as mean ± 95% confidence interval of the mean for three independent flow cytometer runs with 50,000
cells each.
Strain Mean FSC Mean SSC
M. extorquens AM1 797±23 5923±219
M. extorquens PA1 806±34 5422±321
Supplementary Figure S1.1: A line plot of strand conservation (in purple) and strand inversion (in blue) between
the chromosome of M. extroquens PA1 (top) and the main chromosome of M. extorquens AM1 (bottom).
M. extorquens PA1
M. extorquens AM1
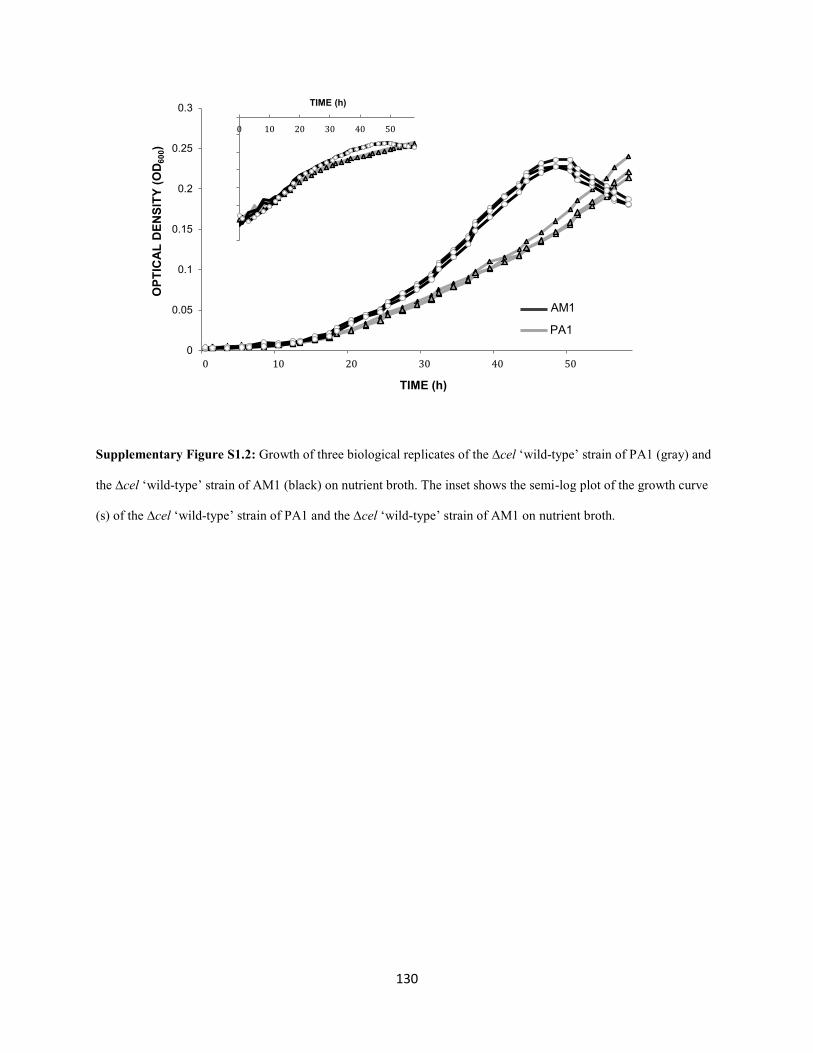
130
Supplementary Figure S1.2: Growth of three biological replicates of the ∆cel ‘wild-type’ strain of PA1 (gray) and
the ∆cel ‘wild-type’ strain of AM1 (black) on nutrient broth. The inset shows the semi-log plot of the growth curve
(s) of the ∆cel ‘wild-type’ strain of PA1 and the ∆cel ‘wild-type’ strain of AM1 on nutrient broth.
0
0.05
0.1
0.15
0.2
0.25
0.3
0 10 20 30 40 50
OP
TIC
AL
DE
NS
ITY
(O
D6
00)
TIME (h)
AM1
PA1
0 10 20 30 40 50
TIME (h)
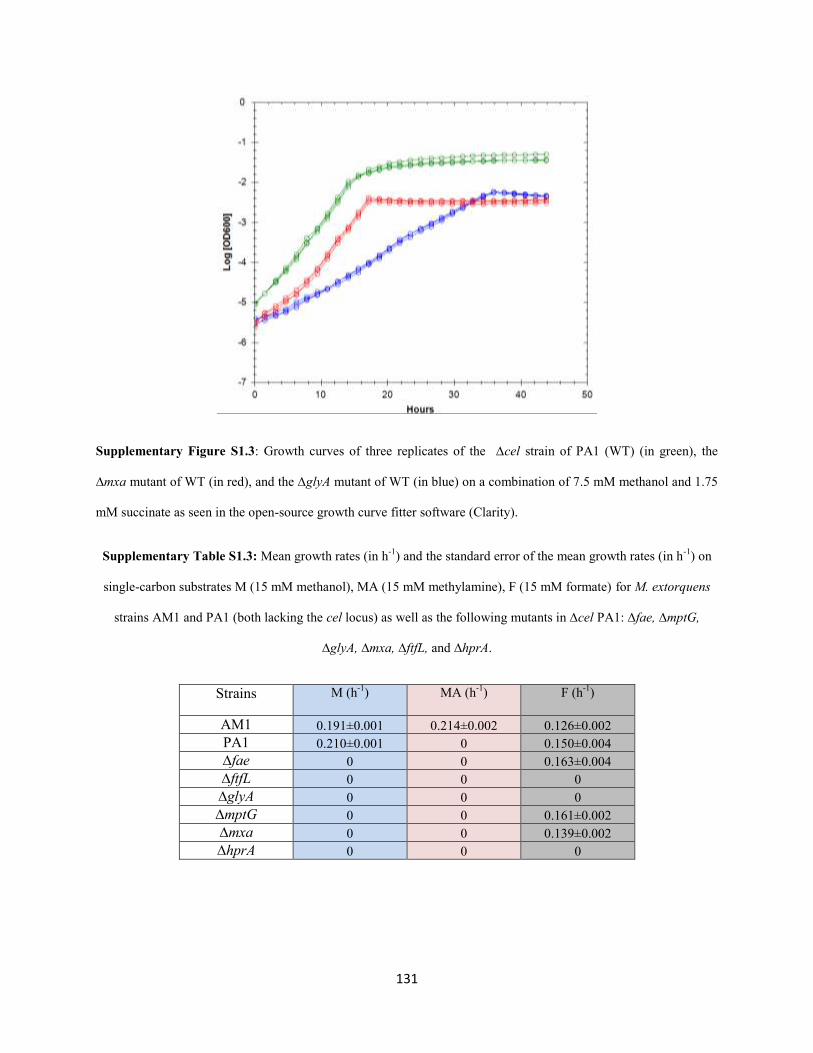
131
Supplementary Figure S1.3: Growth curves of three replicates of the ∆cel strain of PA1 (WT) (in green), the
∆mxa mutant of WT (in red), and the ∆glyA mutant of WT (in blue) on a combination of 7.5 mM methanol and 1.75
mM succinate as seen in the open-source growth curve fitter software (Clarity).
Supplementary Table S1.3: Mean growth rates (in h-1
) and the standard error of the mean growth rates (in h-1
) on
single-carbon substrates M (15 mM methanol), MA (15 mM methylamine), F (15 mM formate) for M. extorquens
strains AM1 and PA1 (both lacking the cel locus) as well as the following mutants in ∆cel PA1: ∆fae, ∆mptG,
∆glyA, ∆mxa, ∆ftfL, and ∆hprA.
Strains
M (h-1
) MA (h-1
) F (h-1
)
AM1 0.191±0.001 0.214±0.002 0.126±0.002
PA1 0.210±0.001 0 0.150±0.004
∆fae 0 0 0.163±0.004
∆ftfL 0 0 0
∆glyA 0 0 0
∆mptG 0 0 0.161±0.002
∆mxa 0 0 0.139±0.002
∆hprA 0 0 0
132
Supplementary Table S1.4: Mean growth rates (in h-1
) (and the standard srror of the mean growth rates (in h-1
) on
multi-carbon substrates S (3.5 mM succinate), P (5 mM pyruvate), E (7.5 mM ethanol) for M. extorquens strains
AM1 and PA1 (both lacking the cel locus) as well as the following mutants in ∆cel PA1: ∆fae, ∆mptG, ∆glyA,
∆mxa, ∆ftfL, and ∆hprA
Strains S (h-1
) P (h-1
) E (h-1
)
AM1 0.202±0.001 0.141±0.001 0
PA1 0.213±0.002 0.192±0.002 0.158±0.001
∆fae 0.212±0.001 0.178±0.002 0.166±0.001
∆ftfL 0.217±0.001 0.184±0.003 0.158±0.001
∆glyA 0.194±0.002 0 0
∆mptG 0.184±0.002 0.144±0.003 0.155±0.001
∆mxa 0.213±0.002 0.185±0.001 0
∆hprA 0.203±0.001 0.192±0.001 0.160±0.001
Supplementary Table S1.5: Mean growth rates (in h-1
) and the standard error of the mean growth rates (in h-1
) on a
joint single-carbon and multi-carbon substrate B (15 mM betaine) and a combination of single-carbon and multi-
carbon substrates ½ M + ½ S (7.5 mM methanol and 1.75 mM succinate) for M. extorquens strains AM1 and PA1
(both lacking the cel locus) as well as the following mutants in ∆cel PA1: ∆fae, ∆mptG, ∆glyA, ∆mxa, ∆ftfL, and
∆hprA.
Strains B (h-1
) ½ M + ½ S (h-1
)
AM1 0.160±0.001 0.207±0.001
PA1 0 0.248±0.001
∆fae 0 0
∆ftfL 0 0.141±0.001
∆glyA 0 0.125±0.001
∆mptG 0 0
∆mxa 0 0.236±0.002
∆hprA 0 0.184±0.001
Supplementary Table S1.6: Max OD600 and the standard error of the max OD600 on single-carbon substrates M (15
mM methanol), MA (15 mM methylamine), F (15 mM formate) for M. extorquens strains AM1 and PA1 (both
lacking the cel locus) as well as the following mutants in ∆cel PA1: ∆fae, ∆mptG, ∆glyA, ∆mxa, ∆ftfL, and ∆hprA.
Max OD values <0.01 are reported as 0
Strains M (h-1
) MA (h-1
) F (h-1
)
AM1 0.165±0.009 0.227±0.005 0.046±0.001
133
PA1 0.288±0.02 0.021±0.002 0.069±0.0001
∆fae 0 0 0.069±0.001
∆ftfL 0 0 0
∆glyA 0 0 0
∆mptG 0 0 0.071±0.002
∆mxa 0.012±0.0003 0 0.067±0.001
∆hprA 0 0 0
Supplementary Table S1.7: Mean max OD600 and the standard error of the max OD600 on multi-carbon substrates S
(3.5 mM succinate), P (5 mM pyruvate), E (7.5 mM ethanol) for M. extorquens strains AM1 and PA1(both lacking
the cel locus) as well as the following mutants in ∆cel PA1: ∆fae, ∆mptG, ∆glyA, ∆mxa, ∆ftfL, and ∆hprA. Max OD
values <0.01 are reported as 0
Strains S (h-1
) P (h-1
) E (h-1
)
AM1 0.162±0.002 0.188±0.002 0.012±0.001
PA1 0.182±0.003 0.231±0.002 0.252±0.003
∆fae 0.189±0.001 0.232±0.0003 0.245±0.011
∆ftfL 0.180±0.004 0.229±0.001 0.208±0.009
∆glyA 0.178±0.006 0.048±0.0004 0
∆mptG 0.194±0.001 0.230±0.001 0.259±0.008
∆mxa 0.177±0.006 0.226±0.002 0.022±0.002
∆hprA 0.190±0.002 0.233±0.002 0.202±0.015
Supplementary Table S1.8: Mean maxOD600 (Column 1) and the standard error of the Max OD600 (Column 2) on a
joint single-carbon and multi-carbon substrate B (15 mM betaine) and a combination of single-carbon and multi-
carbon substrates ½ M + ½ S (7.5 mM methanol and 1.75 mM succinate) for M. extorquens strains AM1 and
PA1(both lacking the cel locus) as well as the following mutants in ∆celPA1: ∆fae, ∆mptG, ∆glyA, ∆mxa, ∆ftfL, and
∆hprA. Max OD values <0.01 are reported as 0
Strains B (h-1
) ½ M + ½ S (h-1
)
AM1 0.384±0.013 0.155±0.006
PA1 0 0.245±0.011
∆fae 0 0
∆ftfL 0 0.091±0.002
∆glyA 0 0.103±0.001
∆mptG 0 0
∆mxa 0 0.087±0.002
∆hprA 0 0.139±0.005

134
Supplementary Table S1.9: List of primers used for making null mutants in M. extorquens PA1
Primer Primer Sequence Primer Description
∆fae_us_f ATGGATGCATATGCTGCAGCTCGAGCGGC
CGCCGACGTGTCCCAAACCGATG Gibson forward linker with Not1 and 24 bp of
pCM433 backbone at 5' end. Product size = 695 bp
∆fae_us_r GTCCAAGGAAGATCGAAGCCAGTCGCTG
GA GGTCTCTCCCTGGATTCCTG 30 bp of ds region linker at 5'end. Product size = 695
bp
∆fae_ds_f TCCAGCGACTGGCTTCGATC Product size = 424 bp
∆fae_ds_r GGTTAACACGCGTACGTAGGGCCCGCGGC
CGC CAGCGAGAGCCAGCTTGATG Gibson reverse linker with Not1 and 24 bp of
pCM433 backbone at 5' end. Product size = 424 bp
∆ftfL_us_f GTC CCT ATG CTT CCG TGG TAG C Product size = 617 bp
∆ftfL_us_r GGTTAACACGCGTACGTAGGGCCCGCGGC
CGC CGC AGA ACG TGT GGG TGA AAC G Gibson reverse linker with Not1 and 24 bp of pCM
433 backbone. Product size = 617 bp
∆ftfL_ds_f ATGGATGCATATGCTGCAGCTCGAGCGGC
CGCCGA CAT GAC GCT GCA TCT CTC C 30 bp of us region linker at 5'end. Product size = 451
bp
∆ftfL_ds_r TTCCGTTCGCTACCACGGAAGCATAGGGA
CCCT GAC TTG GGC GGA TCG TTG Gibson forward linker with Not1 and 24 bp of
pCM433 backbone at 5' end. Product size = 451 bp
∆mptG_us_f ATGGATGCATATGCTGCAGCTCGAGCGGC
CGCGAT CTC GGC GAT CAG CTC ACC Gibson forward linker with Not1 and 24 bp of
pCM433 backbone at 5' end. Product size =859 bp
∆mptG_us_r GCC GTT GAG ATC GAG GAA GCC Product size = 859 bp
∆mptG_ds_f CTGCATTTCGGCTTCCTCGATCTCAACGGC
CTC GCA GAA GGA GGC GGA Gibson forward linker from 2049230 to 2049259 on
PA1 genome. Product size = 723 bp
∆mptG_ds_r GGTTAACACGCGTACGTAGGGCCCGCGGC
CGCGGT GAA GGC GAT CTT CGA GAC G Gibson reverse linker with Not1 and 24 bp of
pCM433 backbone at 5' end. Product size 723 bp
∆glyA_us_f GAT CAG CTC GAT CTC GTG CTG CTG C Product size = 497 bp
∆glyA_us_r GGTTAACACGCGTACGTAGGGCCCGCGGC
CGCTGA CGC TTC CGA TCG CAC GTG Gibson Reverse Linker with Not1 and 24 bp of
pCM433 backbone at 5'end. Product size = 497 bp
∆glyA-ds_f
ATGGATGCATATGCTGCAGCTCGAGCGGC
CGCCGC GCA ACC TTC AGG TGA AGG
ATG G
Gibson forward linker with Not1 and 24 bp of pCM
433 backbone at 5'end. Product size = 526 bp
∆glyA_ds_r GGT ACC GAC AAC CAC CTG ATG CTG G Product size = 526 bp
∆mxa_us_f ATGGATGCATATGCTGCAGCTCGAGCGGC
CGCGAT CGA GGT GCA ACT CGG CAG Gibson forward linker with Not1 and 24 bp of
pCM433 backbone at 5' end. Product size = 701bp
∆mxa_us_r TGG TCC AGA TCG CGG TCA AC Product size = 701bp
∆mxa_ds_f CGTTGCGCCGGTTGACCGCGATCTGGACC
ATCG TGA TGC TGA ACG CGC AC Gibson linker with 4606355 through 4606384 on
PA1 genome. Product size = 496bp
∆mxa_ds_r GGTTAACACGCGTACGTAGGGCCCGCGGC
CGCAAC TCG ATG TCG AAG GCG TGC Gibson reverse linker with Not1 and 24 bp of
pCM433 backbone at 5' end. Product size = 496bp
∆hprA_us_f ATGGATGCATATGCTGCAGCTCGAGCGGC
CGCCTC ATC GAC AAC GGC GTG AAG G Gibson forward linker with Not1 and 24 bp of
pCM433 backbone at 5' end. Product size = 344bp
∆hprA_us_r GGGCAATCGTGTCGCTCAC Product size = 344bp
∆hprA_ds_f GCAGGGGTTTTGTGAGCGACACGATTGCC
CCTCGTGGACAACGTCGAAGC 30 bp from 2016078 to 2016107 on PA1 genome at
5' end. Product size = 447bp
∆hprA_ds_r GGTTAACACGCGTACGTAGGGCCCGCGGC
CGCTCT TCA CCG CCT CGA ACA CC Gibson reverse linker with Not1 and 24 bp of
pCM433 backbone at 5' end. Product size = 447bp
∆fhc_us_f ATGGATGCATATGCTGCAGCTCGAGCGGC
CGCCCG AGA TGC TTG AGG CTC TG Gibson forward linker with Not1 and 24 bp of
pCM433 backbone at 5' end. Product size = 480bp
∆fhc_us_r GCT CTC GCA AGG CTC GAT CC Product size = 480bp
∆fhc_ds_f CCCTCGACCCGGATCGAGCCTTGCGAGAG
CTCC GGG TCG TAG ACG ATG AC 30 bp from 2044769 to 2044798 on PA1 genome at
5' end. Product size = 569bp
∆fhc_ds_r GGTTAACACGCGTACGTAGGGCCCGCGGC
CGCTGA GGA AGC ATG GCA GCC TG Gibson reverse linker with Not1 and 24 bp of
pCM433 backbone at 5' end. Product size =569bp

Appendix 2
Supplementary Material for Chapter 3
136
Supplementary Figure S2.1: A metabolic map illustrating metabolic modules that are involved in methanol growth
in M. extorquens PA1. Methanol dehydrogenase serves as the primary C1 oxidation module that oxidizes methanol
to formaldehyde. Formaldehyde is further oxidized to formate by a H4MPT mediated pathway which acts as the
formaldehyde oxidation module. Formate is the branch point for metabolism - a part gets oxidized to CO2 by
formate dehydrogenases and the rest gets reduced and assimilated via a H4F mediated pathway and serine cycle.
Genes highlighted in red, representative of a particular module, were deleted to test the role of the specific module in
methylamine growth via the N-methylglutamate pathway.
137
Supplementary Figure S2.2: A metabolic map illustrating the various metabolic modules that are involved in
chloromethane growth in M. extorquens CM4. The primary C1 oxidation module consists of CmuA and CmuB- that
catalyze dehalogenation of chloromethane and subsequent methyl transfer to tetrahydrofolate (H4F) to form methyl
tetrahydrofolate (CH3-H4F) - and MetF that catalyzes the reduction of CH3-H4F to methylene tetrahydrofolate
(CH2=H4F). CH2=H4F is the branch point of metabolism –a part gets oxidized by methylene tetrahydrofolate
reductase (folD) and formyl tetrahydrofolate hydrolase (purU) to formate, which subsequent gets oxidized to CO2 by
a panel of formate dehydrogenases, and the rest gets assimilated via the serine cycle. *metF, folD, and purU are
absent in M. extorquens PA1
138
Supplementary Figure S2.3: A) Ratio of growth rates, of various knockout mutants versus the ∆cel ‘wildtype’
strain of PA1 and, in 3.5 mM succinate (white), 15mM methanol (light brown),nitrogen free media with 3.5 mM
succinate and 7.66 mM methylamine (dark gray) and 15mM methylamine (blue) B) Ratio of yield (measured as the
0.5
0.6
0.7
0.8
0.9
1
1.1
1.2
1.3
2730 3753 3757 3761 4208 4230 4232 4244
Gro
wth
Rat
e (M
uta
nt)
/ G
row
th r
ate
(WT
)
Succinate Methanol Succinate + MA as N source Methylamine
0.4
0.6
0.8
1
1.2
1.4
1.6
1.8
2
2730 3753 3757 3761 4208 4230 4232 4244
Yie
ld (
Muta
nt)
/ Y
ield
(W
T)
Succinate Methanol Succinate MA as N source Methylamine
WT ∆fae ∆fae2 ∆fae3 ∆fae∆fae3 ∆fae∆fae2 ∆fae2∆fae3 ∆fae∆fae2 ∆fae3
WT ∆fae ∆fae2 ∆fae3 ∆fae∆fae2 ∆fae∆fae3 ∆fae2∆fae3 ∆fae∆fae2 ∆fae3
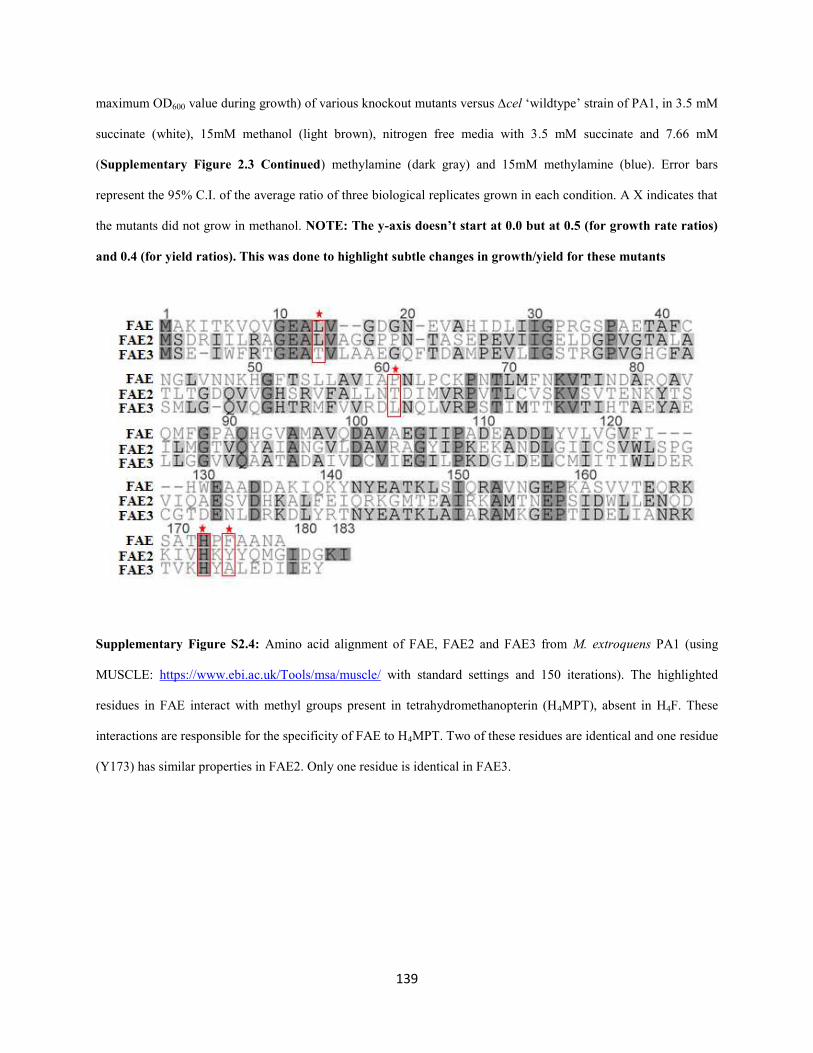
139
maximum OD600 value during growth) of various knockout mutants versus ∆cel ‘wildtype’ strain of PA1, in 3.5 mM
succinate (white), 15mM methanol (light brown), nitrogen free media with 3.5 mM succinate and 7.66 mM
(Supplementary Figure 2.3 Continued) methylamine (dark gray) and 15mM methylamine (blue). Error bars
represent the 95% C.I. of the average ratio of three biological replicates grown in each condition. A X indicates that
the mutants did not grow in methanol. NOTE: The y-axis doesn’t start at 0.0 but at 0.5 (for growth rate ratios)
and 0.4 (for yield ratios). This was done to highlight subtle changes in growth/yield for these mutants
Supplementary Figure S2.4: Amino acid alignment of FAE, FAE2 and FAE3 from M. extroquens PA1 (using
MUSCLE: https://www.ebi.ac.uk/Tools/msa/muscle/ with standard settings and 150 iterations). The highlighted
residues in FAE interact with methyl groups present in tetrahydromethanopterin (H4MPT), absent in H4F. These
interactions are responsible for the specificity of FAE to H4MPT. Two of these residues are identical and one residue
(Y173) has similar properties in FAE2. Only one residue is identical in FAE3.
140
Supplementary Table S2.1: Growth rates of the ∆cel ‘wildtype’ strain of PA1 and the ∆mptG mutant (in the WT
background) in 3.5 mM succinate with either 7.66 mM NH4+
as the nitrogen source or 7.66 mM methylamine as the
nitrogen source. S.E.M. represents the standard error of the mean growth rate for three biological replicates in each
condition
Strain Nitrogen Source Mean Growth Rate (h-1
) S.E.M. (h-1
)
WT NH4
+
0.213 0.002
∆mptG NH4
+
0.184 0.002
WT Methylamine 0.188 0.001
∆mptG Methylamine 0.148 0.002
Supplementary Table S2.2: Growth rates and maximum OD600 of the ∆cel ‘wildtype’ strain of PA1 and single-,
double-, triple-knockout mutants (in the WT background) lacking ∆fae, ∆fae2, and/or ∆fae3 in 15mM methylamine
Strain Mean Growth Rate (h-1
) ± 95%C.I. (h-1
) Average Max. OD600
± 95% C.I.
WT 0.0422±0.0018 0.712±0.071
∆fae 0.0407±0.0004 1.044±0058
∆fae 2 0.0476±0.0015 1.165±0.146
∆fae 3 0.0427±0.0011 0.413±0.0.49
∆fae -∆fae2 0.0386±0.0008 1.003±0.033
∆fae -∆fae3 0.0406±0.0006 0.558±0.021

141
∆fae2-∆fae3 0.0409±0.0015 0.357±0.011
∆fae -∆fae2-∆fae3 0.0375±0.0003 0.555±0.040
Supplementary Table S2.3: List of primers used to construct knockout mutants in the N-methylglutamate pathway
as well as FAE-homologs in this study
Primer Primer Sequence Primer Description ∆fae2_us_f ATGGATGCATATGCTGCAGCTCGAGCGGCCGC
TCTGCATCAGGTCGTGCAGG Gibson forward linker with Not1 and 24 bp of pCM433
backbone at 5' end. Product size = 311 bp ∆fae2_us_r CTTTTCGACACTCAAACGCATCGAAGCGCGAG
GATGATGCGGTCGCTCATGG 30 bp of ds region linker at 5'end. Product size = 311
bp ∆fae2_ds_f CGCGCTTCGATGCGTTTGAG Product size = 412 bp ∆fae2_ds_r GGTTAACACGCGTACGTAGGGCCCGCGGCCGC
CGACACCTCGTCGTTGCTCAAG Gibson reverse linker with Not1 and 24 bp of pCM433
backbone at 5' end. Product size = 412 bp ∆fae3_us_f GCGGAACCAGATCTCGGACATG Product size = 252 bp ∆fae3_us_r GGTTAACACGCGTACGTAGGGCCCGCGGCCGC
TTCCCTCGCCTGATCCACTG Gibson reverse linker with Not1 and 24 bp of pCM 433
backbone at 5' end. Product size = 252 bp ∆fae3_ds_f ATGGATGCATATGCTGCAGCTCGAGCGGCCGC
CGATGGTCACCCTTCAGGTG 30 bp of us region linker at 5'end. Product size = 420
bp ∆fae3_ds_r ATGACCGACATGTCCGAGATCTGGTTCCGCGCC
TCACGCGAGAAGACTAC Gibson forward linker with Not1 and 24 bp of pCM433
backbone at 5' end. Product size = 420 bp ∆mgs1,2,3_us_f ATGGATGCATATGCTGCAGCTCGAGCGGCCGC
GGCAATGGAGGCGAATCTCG Gibson forward linker with Not1 and 24 bp of pCM433
backbone at 5'end. Product size =433 bp ∆mgs1,2,3_us_r TCGCGGCCCTCGTGCCAATCGTCATAGGCGCGT
TCGATCACTGTCGCGAG 30 bp of ds region linker at 5'end. Product size = 433
bp ∆mgs1,2,3_ds_f CGCCTATGACGATTGGCACG Product size = 441 bp
∆mgs1,2,3_ds_r GGTTAACACGCGTACGTAGGGCCCGCGGCCGC
CAGATCGGTGTAGGACACGAGG Gibson reverse linker with Not1 and 24 bp of pCM 433
backbone at 5' end. Product size = 441 bp ∆gmas_us_f ATGGATGCATATGCTGCAGCTCGAGCGGCCGC
TCGCAGTGATGACGCTGGAG Gibson forward linker with Not1 and 24 bp of pCM433
backbone at 5'end. Product size =492 bp ∆gmas_us_r CGCTTGACGCCCTCCACCGTGTGCCCGTCGGTG
TACATGTTTCCAGGGGAGCTGGATCAG 30 bp of ds region linker at 5'end. Product size = 492
bp
∆gmas_ds_f ACATGTACACCGACGGGCAC Product size = 435 bp
∆gmas_ds_r GGTTAACACGCGTACGTAGGGCCCGCGGCCGC
TGGCCACGATTAGGGCGAAG Gibson reverse linker with Not1 and 24 bp of pCM 433
backbone at 5' end. Product size = 435 bp ∆mgd1,2,3,4_us_f GACGATCACCACGTCGTAGG Product size = 493 bp
∆mgd1,2,3,4_us_r GGTTAACACGCGTACGTAGGGCCCGCGGCCGC
TAGAGTTCGCAGCCCGACAG Gibson reverse linker with Not1 and 24 bp of pCM 433
backbone at 5'end. Product size = 493 bp ∆mgd1,2,3,4_ds_f ATGGATGCATATGCTGCAGCTCGAGCGGCCGC
CTCGACTCGTACGCGCATTG 30 bp of us region linker at 5'end. Product size = 607
bp ∆mgd1,2,3,4_ds_r CCGCAGGAGGCCTACGACGTGGTGATCGTCTG
ACGAGCATCGCCCATCTC Gibson forward linker with Not1 and 24 bp of pCM433
backbone at 5' end. Product size = 607 bp

Appendix 3
Supplementary Material for Chapter 5
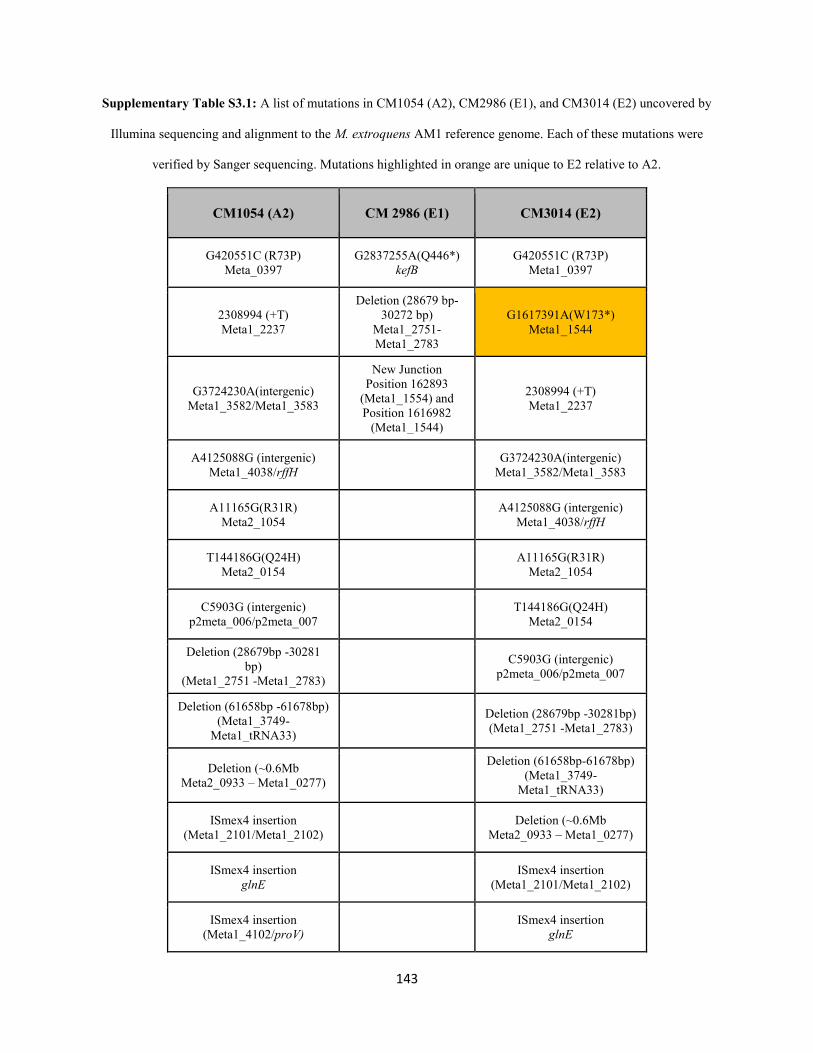
143
Supplementary Table S3.1: A list of mutations in CM1054 (A2), CM2986 (E1), and CM3014 (E2) uncovered by
Illumina sequencing and alignment to the M. extroquens AM1 reference genome. Each of these mutations were
verified by Sanger sequencing. Mutations highlighted in orange are unique to E2 relative to A2.
CM1054 (A2) CM 2986 (E1) CM3014 (E2)
G420551C (R73P) Meta_0397
G2837255A(Q446*) kefB
G420551C (R73P) Meta1_0397
2308994 (+T) Meta1_2237
Deletion (28679 bp-
30272 bp) Meta1_2751-
Meta1_2783
G1617391A(W173*) Meta1_1544
G3724230A(intergenic) Meta1_3582/Meta1_3583
New Junction Position 162893
(Meta1_1554) and
Position 1616982
(Meta1_1544)
2308994 (+T) Meta1_2237
A4125088G (intergenic) Meta1_4038/rffH
G3724230A(intergenic) Meta1_3582/Meta1_3583
A11165G(R31R) Meta2_1054
A4125088G (intergenic) Meta1_4038/rffH
T144186G(Q24H) Meta2_0154
A11165G(R31R) Meta2_1054
C5903G (intergenic) p2meta_006/p2meta_007
T144186G(Q24H) Meta2_0154
Deletion (28679bp -30281
bp) (Meta1_2751 -Meta1_2783)
C5903G (intergenic) p2meta_006/p2meta_007
Deletion (61658bp -61678bp) (Meta1_3749-
Meta1_tRNA33) Deletion (28679bp -30281bp) (Meta1_2751 -Meta1_2783)
Deletion (~0.6Mb Meta2_0933 – Meta1_0277)
Deletion (61658bp-61678bp) (Meta1_3749-
Meta1_tRNA33)
ISmex4 insertion (Meta1_2101/Meta1_2102)
Deletion (~0.6Mb Meta2_0933 – Meta1_0277)
ISmex4 insertion glnE
ISmex4 insertion (Meta1_2101/Meta1_2102)
ISmex4 insertion (Meta1_4102/proV)
ISmex4 insertion glnE
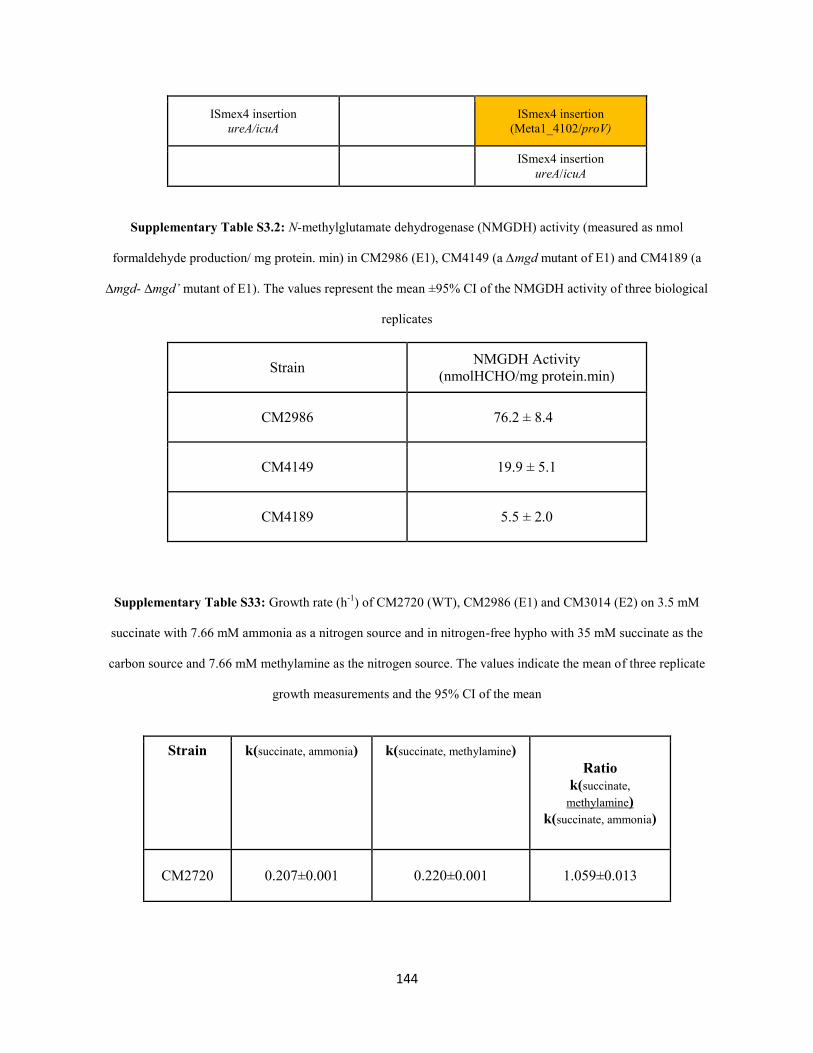
144
ISmex4 insertion ureA/icuA
ISmex4 insertion (Meta1_4102/proV)
ISmex4 insertion
ureA/icuA
Supplementary Table S3.2: N-methylglutamate dehydrogenase (NMGDH) activity (measured as nmol
formaldehyde production/ mg protein. min) in CM2986 (E1), CM4149 (a ∆mgd mutant of E1) and CM4189 (a
∆mgd- ∆mgd’ mutant of E1). The values represent the mean ±95% CI of the NMGDH activity of three biological
replicates
Strain NMGDH Activity (nmolHCHO/mg protein.min)
CM2986 76.2 ± 8.4
CM4149 19.9 ± 5.1
CM4189 5.5 ± 2.0
Supplementary Table S33: Growth rate (h-1
) of CM2720 (WT), CM2986 (E1) and CM3014 (E2) on 3.5 mM
succinate with 7.66 mM ammonia as a nitrogen source and in nitrogen-free hypho with 35 mM succinate as the
carbon source and 7.66 mM methylamine as the nitrogen source. The values indicate the mean of three replicate
growth measurements and the 95% CI of the mean
Strain k(succinate, ammonia) k(succinate, methylamine) Ratio
k(succinate,
methylamine) k(succinate, ammonia)
CM2720 0.207±0.001 0.220±0.001 1.059±0.013
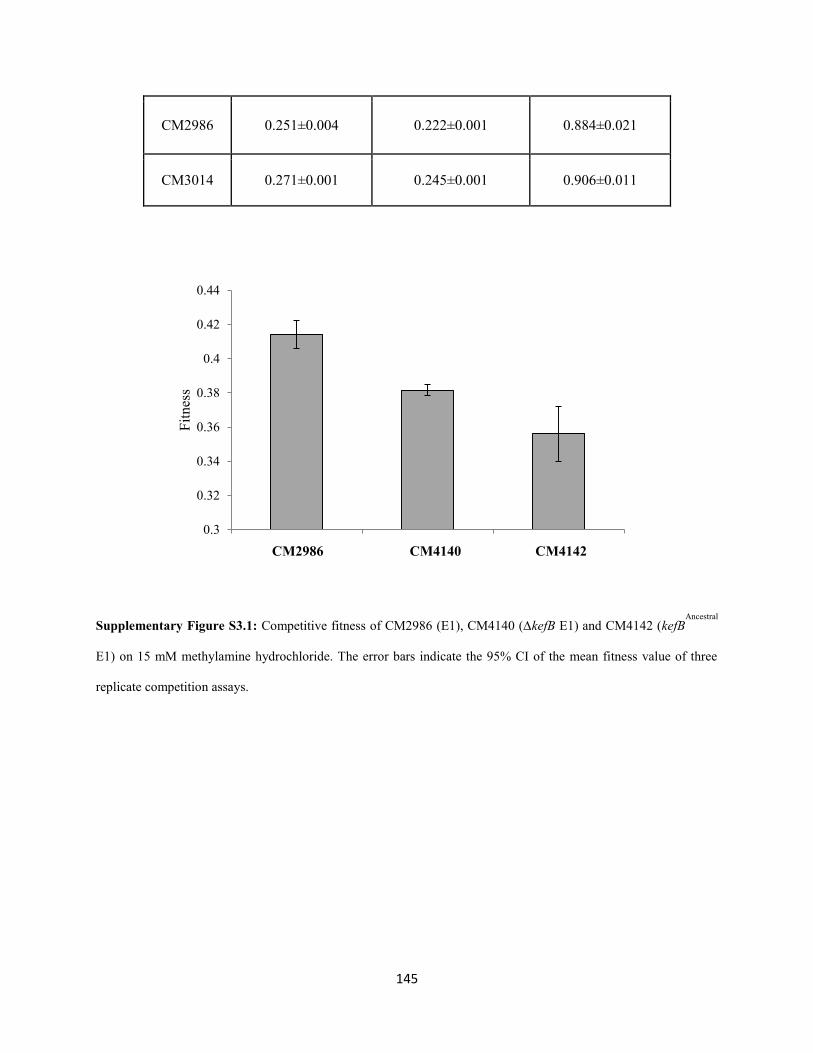
145
CM2986 0.251±0.004 0.222±0.001 0.884±0.021
CM3014 0.271±0.001 0.245±0.001 0.906±0.011
Supplementary Figure S3.1: Competitive fitness of CM2986 (E1), CM4140 (∆kefB E1) and CM4142 (kefBAncestral
E1) on 15 mM methylamine hydrochloride. The error bars indicate the 95% CI of the mean fitness value of three
replicate competition assays.
0.3
0.32
0.34
0.36
0.38
0.4
0.42
0.44
1 2 3
Fit
nes
s
CM2986 CM4140 CM4142
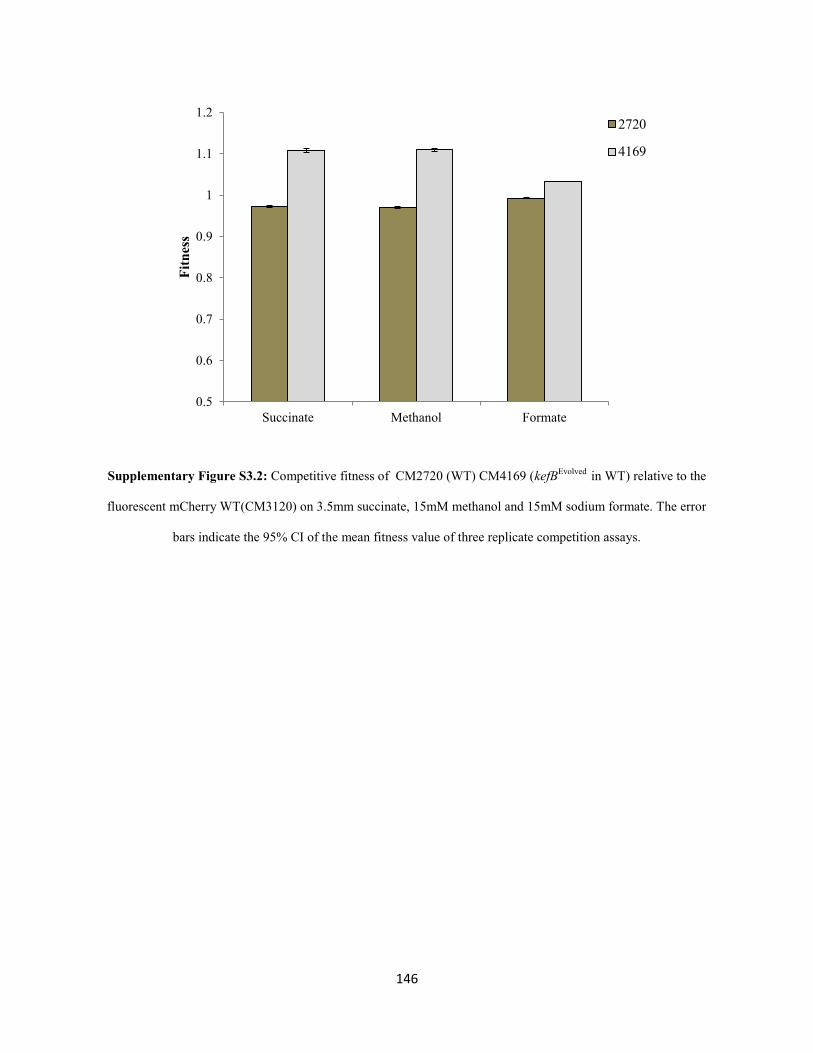
146
Supplementary Figure S3.2: Competitive fitness of CM2720 (WT) CM4169 (kefBEvolved
in WT) relative to the
fluorescent mCherry WT(CM3120) on 3.5mm succinate, 15mM methanol and 15mM sodium formate. The error
bars indicate the 95% CI of the mean fitness value of three replicate competition assays.
0.5
0.6
0.7
0.8
0.9
1
1.1
1.2
Succinate Methanol Formate
Fit
nes
s
2720
4169