Embed Size (px)
Citation preview
Phytoplankton Composition and Productivity of a ShallowTropical Lake
M.Y, FATIMAH, A.K. MOHAMMAD MOHSIN and A.S. MUSTAFA KAMALFaculty of Fisheries and Marine Science,
Universiti Pertanian Malaysia,Serdang, Selangor, Malaysia,
Keywords: Swamp lake; tropical; phytopiankton; composition; productivity.
RINGKASAN
Komposisi dan pengeluaran fitoplankton di paya Bungor, Pahang, masing-masing telah dikaji dartOktober 1981 hingga September 1982 dan dari Januari hingga Disember 1982. Pelbagaian fitoplankton ada-lah dalam susunan (klorofita Basilariofiseae Sinofita Krisofiseae; tetapi susunan mengikut kelimpahan ialahSinofita Krisofiseae Klorofita Basilariofiseae. Sistem air coklat di Paya Bungor mengandungi pengeluaranfitoplankton yang lebih tinggi daripada sistem air putih. Pengeluaran maksimum amnya berlaku di lapisanpermukaan, tetapi semasa hari panas, pengeluaran maksimum berlaku di subpermukaan kerana perencatan-foto di lapisan permukaan. Amnya, nutrien dan tenaga cahaya adalah dua faktor yang penting di dalampengawalan day a pengeluaran fitoplankton di Paya Bungor.
SUMMARY
Phytoplankton composition and production in Paya Bungor, Pahang, were studied from October1981 to Septemoer 1982 and from January to December 1982 respectively. Phytoplankton diversity is inthe order of Chlorophyta > Bacillariophyceae > Cyanophyta > Chrysophyceae > Euglenophyta >Phyrrhophyta; but the order in terms or abundance is Cyanophyta > Chrysophyceae > Chlorophyceae >Bacillariophyceae. The brown water system of Paya Bungor seems to contain a higher phytoplanktonproduction than the white water system. Maximum production generally occurs at the top layer of thewater, but shifts to the subsurface layers on hot days due to photo-inhibition at the surface. Generally,nutrient and light energy are the two most important factors controlling phytoplankton production inPaya Bungor.
INTRODUCTION o n a s w a m P lake, Paya Bungor to elucidate thesuccessional periodicity of phytoplankton pro-
Phytoplankton constitute the base of the ductivity and composition. According to Wetzelecological pyramid providing food energy for <1 9 7 5) ' .^asonal variations of phytoplanktonthe higher trophic levels of the aquatic ecosystems. m insignificant in unperturbed systems.In view of this relationship, attempts have been However, with increasing development inmade to correlate primary productivity and fish Malaysia involving aquatic systems, it u.likelyyields (e.g. Sreenivasan 1964, 1968; Melack, that most water oodies will experience additional1979). In addition, phytoplankton is also nutrients and thus eutrophication, which willimportant as an index of the trophic status of a b .nn* a b ? u t c h a n ? e s l n phytoplanktonic produc-water- body. Thunmark and Nygaard (in Wetzel, t l v l t y a n d c ° m P ° " t l o n -1975) have developed a number of phytoplanktonindices to quantify algal species as indicators of Study Areaaquatic enrichment. Relationship between algal _ , . , . .associations and lake fertility is also discussed , / h e study area is located in Paya Bungorin detail by Hutchinson (1967). L a k e - P a h a n S <3
c 4 7 N : . 1 0 2 , 5 5 ,E) w h i c h
covers an area of approximately 2.84 km sq.A brief description of the lake has been given by
In view of the importance of phytoplank- Fatimah et al. (1982). Physical and chemicaltonic communities, a study has been undertaken characteristics of the lake water are described
101

M.Y. FATIMAH, A.K. MOHAMMAD MOHSIN AND A.S. MUSTAFA KAMAL
by Fatimah et at. (1983). Based on the physicaland chemical characteristics, the lake can bedivided into having a brown water systemin the south and a white water system in thenorth. Five stations were chosen (Stations I, II,III in the white water system and Stations IVand V in the brown water system) for the deter-mination of phytoplankton abundance and com-position. For primary productivity study, StationII which is located in the deepest part (3.0 m)of the white water system and Station V (in thedeepest part of the brown water system) wereselected (Fig. 1).
MATERIALS AND METHODS
Phytoplankton samples were collected twicea month at the surface and mid depth using a
water sampler at Stations I. II, III, IV and Vfrom October 1981 to September 1982, and werepreserved in Lugol's solution. Identification andenumeration were carried out using an invertedmicroscope. The data from stations I, II and IIIwere averaged to represent the white watersystem and from Stations IV and V to representthe brown water systems.
The primary productivity study was carriedout from January to December 1982. Stations IIand IV in the open-water zone were chosen torepresent the white and brown water systemsrespectively. Productivity measurements wereobtained at monthly invervals using the light anddark bottles technique (Vollenweider, 1974).The paired light and dark bottles were filled withlake water collected from the surface, 1.5 m and3.0 m depths, and exposed for 4 hours at the
RECD SWAMP
J ROAD
0 50 100 200
Fig. 1. A map of Paya Bungor Lake showing the Sampling Stations in the white water system (I, II,HI) and in the brown water system (IV & V).
102

PHYTOPLANKTON COMPOSITION AND PRODUCTIVITY OF A SHALLOW TROPICAL LAKK
same depths from where the samples wereobtained. The experiment was carried out twicea day, from morning to noon (0900 — 1300
hours) and from afternoon to early evening(1300 — 1700 hours) to obtain mean dailyproductivity. Dissolved oxygen concentrationswere determined by Winkler's method (AmericanPublic Health Association, 1976). Photosyn-thetic values in O /I/day were multiplied by0.375 to give values in mg C/l/day (Sreenivasan,1964).
Water transparency was measured using aSecchi disk,
RESULTS
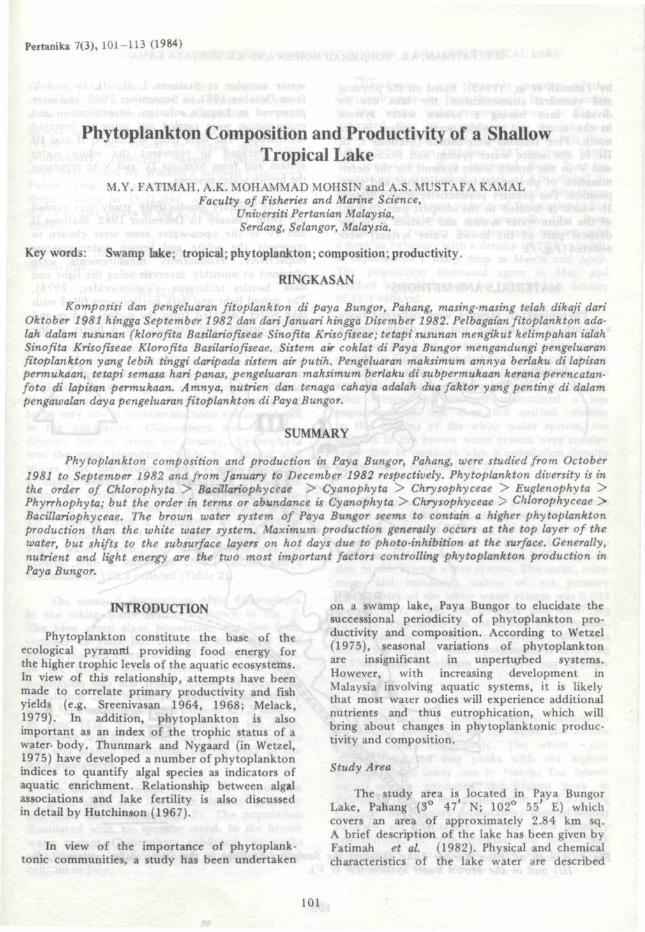
Phytoplankton communities of Paya BungorLake consist of 7 genera of Cyanophyta (bluegreen algae), 22 genera of Chlorophyta (greenalgae), 8 genera of Bacillariophyceae (diatoms)and 2 genera of Chrysophyceae, 3 genera ofEuglenophyta and 1 genus of Pyrrhophyta (Table1). Euglenophyta and Pyrrhophyta are foundto be very few in number and were not consideredin the calculation. Chlorophyta was the mostdiverse, but in terms of density, Cyanophytawas the most abundant (Table 2). Table 2 alsoshows that the brown water system supporteda higher density of phytoplankton populationthan, the white water system. The mean phyto-plankton density of the brown water system was19.7 cells/ml with a minimum of 0.1 cell/mland a maximum of 397.9 cells/ml, whereas in thewhite water system, the mean density was 5.6cells/ml with a minimum of 0.1 cell/ml and amaximum of 128.3 cells/ml (Table 2).
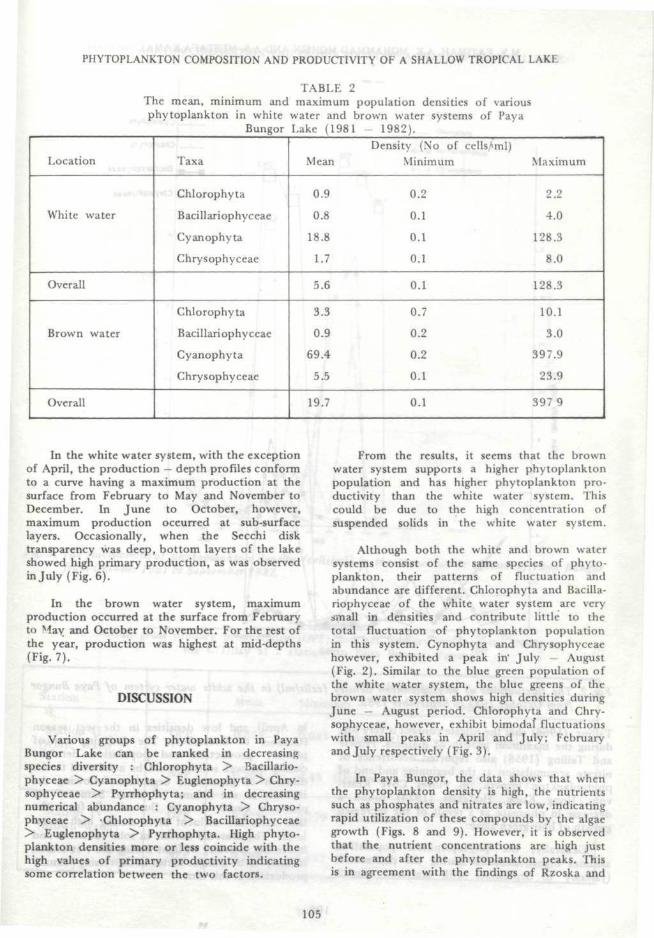
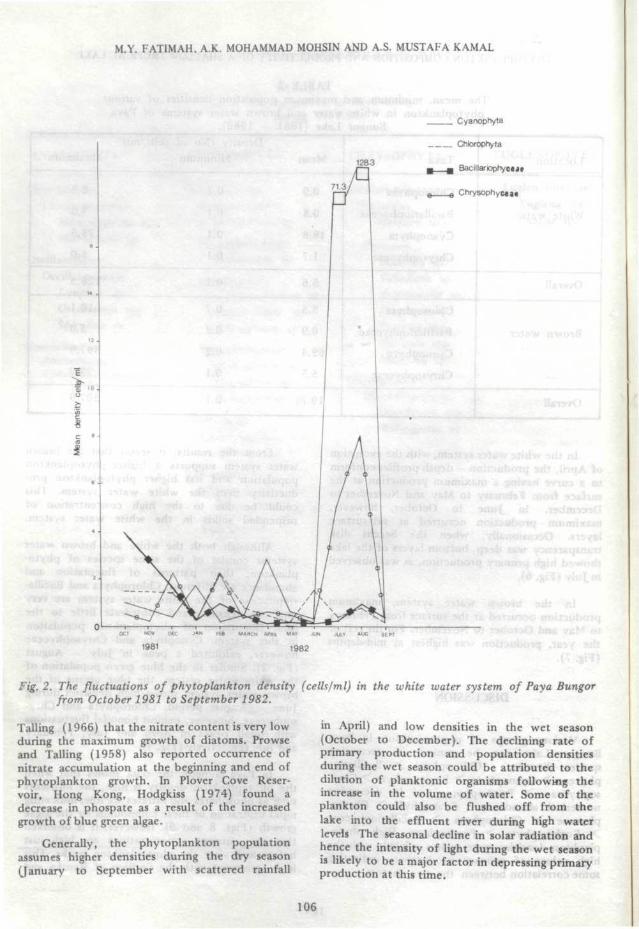
The seasonal fluctuations ofthe Cyanophytain the white water system is shown in Fig. 2.The blue green algae population was low fromOctober to June but increased soon after thatuntil it reached a peak of 128.3 cells/ml in August.In the brown water system, the blue greenpopulation was low from October to May. Thepopulation then began to exhibit a high densityfrom June to August with a peak of 397.9 cells/mlin June (Fig. 3). In both parts of the Lake,Anabaena was by far the most abundant speciesand was mainly responsible for the peak of thetotal blue greens.
In the white water system, the populationof green algae was low with density generallyless than 20 cells/ml (Fig. 2). The populationfluctuated with no specific trend. In the brownwater system, Chlorophyta exhibited two peakswith densities of 8.5 cells/ml in April and 10.1cells/ml in July.
Dinobryon was the only member of theChrysophycene in Paya Bungor. Its periodicityin the white water system shown in Fig. 2indicated that its appearance in the lake wassporadic and fluctuated with a density less than2.2 cells/ml from October 1981 to June 1982.The population then increased from June toAugust when it attained a peak of 8.0 cells/ml. Inthe brown water system, however, Dinobryonexhibited a different pattern of fluctuations (Fig.3). The population was generally low fromOctober to January but increased and attaineda peak in February with a density of 23.9 cells/ml;it experienced a sharp drop in March and April.The population increased again in May andreached a second peak in July with a densityof 15.1 cells/ml.
The graph of diatoms in the white watersystem in Fig. 2 shows that the highest populationdensity was about 4.0 cells/ml in October. Thiswas followed by a gradual decline, in Januaryafter which the diatoms maintained a lowpopulation of less than 0.5 cell/ml. Similarto the diatoms of the white water system, thediatoms in the brown water system were consist-ently low in numbers with a population densityof less than 3 cells/ml (Fig. 3).
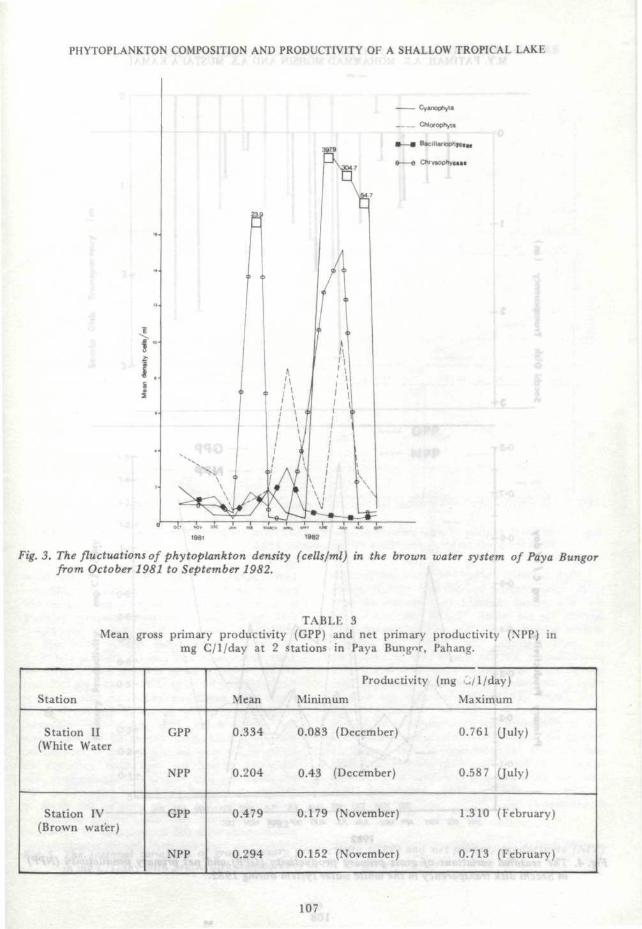
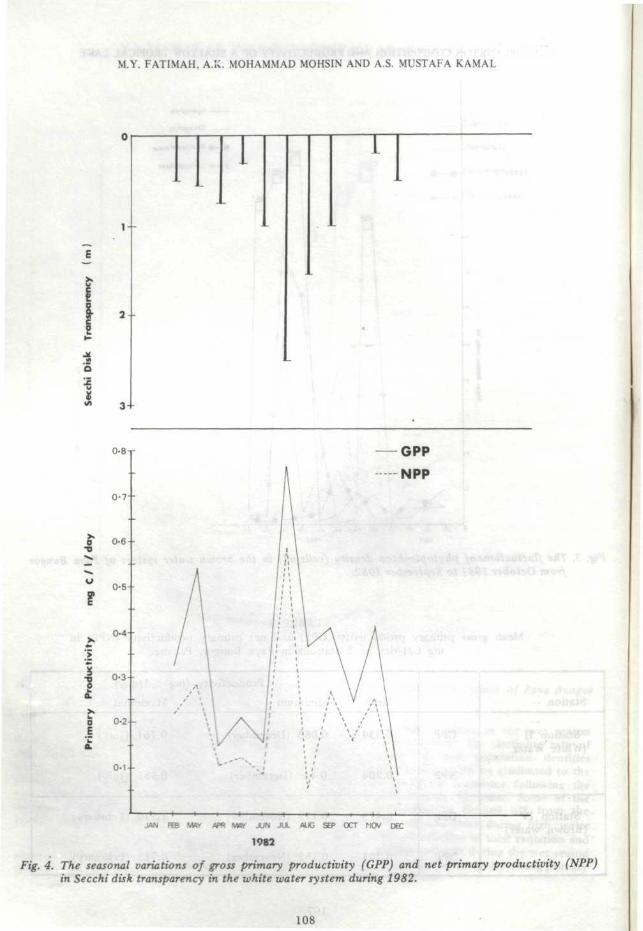
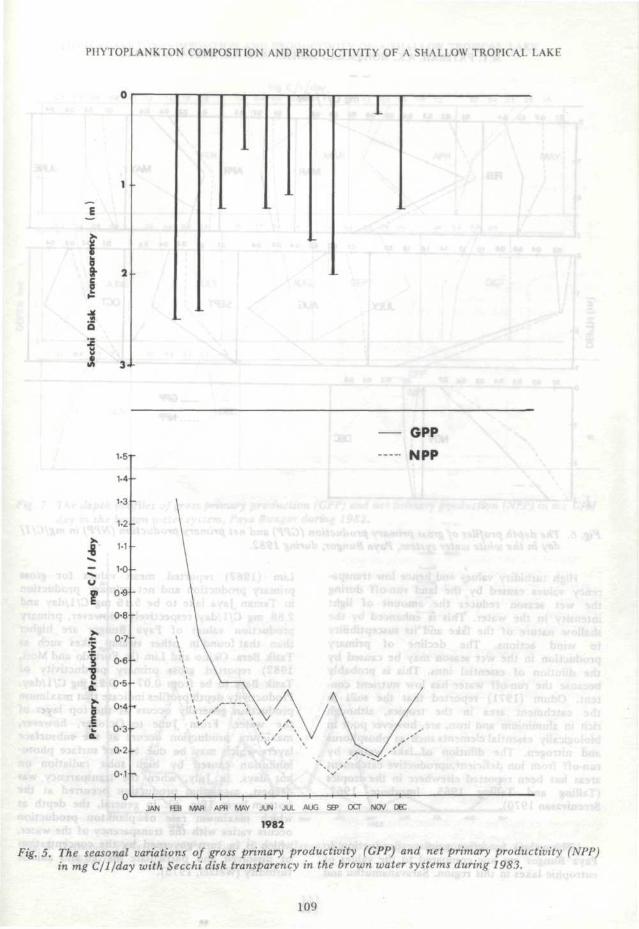
The gross phytoplankton production valuesranged from 0.083 mg C/l/day to 0.76 mg C/l/day with a mean of 0.334 mg C/l/day in the whitewater system; and from 0.179 mg C/l/day to1.310 mg C/l/day with a mean of 0.479 mg C/l/day in the brown water system. The mean, mini-mum and maximum values of net primaryproductivity of the white water system was 0.204mg C/l/day, 0.043 mg C/l/day and 0.587 mgC/l/day respectively. In the brown water system,the mean net primary production value was0.294 mg C/l/day with a minimum of 0.152 mgC/l/day and maximum of 0.713 mg C/l/day(Table 3).
Figures 4 and 5 represent seasonal fluctuationsof primary production of the white and brownwater systems respectively. The white watersystem registered two peaks with the highestin July and a lower one in March. The brownwater system exhibited the highest peak inFebruary with a maximum value of 1.310 mgC/l/day. Net primary productivity showed similarpatterns of fluctuation as the gross primaryproductivity. In both systems, the Secchi disktransparency was deepest when the productionwas highest (Figs., 4 and 5).
103

M.Y. FATIMAH, A.K. MOHAMMAD MOHSIN AND A.S. MUSTAFA KAMAL
TABLE 1List of Phytoplankton in Paya Bungor
during 1981-82.
CYANOPHYTA CHLOROPHYTA CHRYSOPHYTA EUGLENOPHYTA
ChrococcalesChroococcaceae
Merismopodia sppMicrocystis sp.
OscillatorialesOscillatoriaceae
Lyngbya sp.Oscillatoria spp.Spirulina sp.
XostochaceaeAnabaena sp.Aphanizonmenon sp.
ChlorococcalesCoelastraceae
Coelastrum sp.
HydrodictyaceaePediastrum sp.
OocystaceaeAnkistrodesmus spp.Closteriopsis sp.Selenastrum sp.
ScenedesmaceacActinastrum sp.Crucigenia sp.Scenedesmus sp.
UlotrichalesUlotrichasceae
Ulothrix sp.
VolvocalesChlamydomonaceae
Chlamydomonas sp.
VolvocaceaeVolvox sp.
ZygnematalesDesmidiaceae
Closterium spp.Cosmarium spp.Desmidium spp.Euastrum spp.Spondylosium spp.Staurastrum spp.Triploceras spp.
MesotaeniaceaeMicrasterias spp.Pleurotaenium spp.
ZygnemataceaeMougeotia soo.Zygnema spp.
BacillariophyceaeCentrales
Melosira sp.
PennalesDiatoma sp.Tabellaria sp.Asterionella sp.Fragilaria sp.Eunotia spp.Navicula spp.Nitzschia sp.
ChyrophyceaeDinobryonaceae
Dinobryon spp.Mallomonas sp.
EuglenophyceaeEuglena spp.Phacus sp.
104
PHYTOPLANKTON COMPOSITION AND PRODUCTIVITY OF A SHALLOW TROPICAL LAKE
TABLE 2The mean, minimum and maximum population densities of variousphytoplankton in white water and brown water systems of Pay a
Bungor Lake (1981 1982).
Location
White water
Overall
Brown water
Overall
Taxa
Chlorophyta
Bacillariophyceae
Cyanophyta
Chrysophyceae
Chlorophyta
Bacillariophyceae
Cyanophyta
Chrysophyceae
Mean
0.9
0.8
18.8
1.7
5.6
3.3
0.9
69.4
5.5
19.7
Density (No of cells/>ml)Minimum
0.2
0.1
0.1
0.1
0.1
0.7
0.2
0.2
0.1
0.1
Maximum
2.2
4.0
128.3
8.0
128.3
10.1
3.0
397.9
23.9
397 9
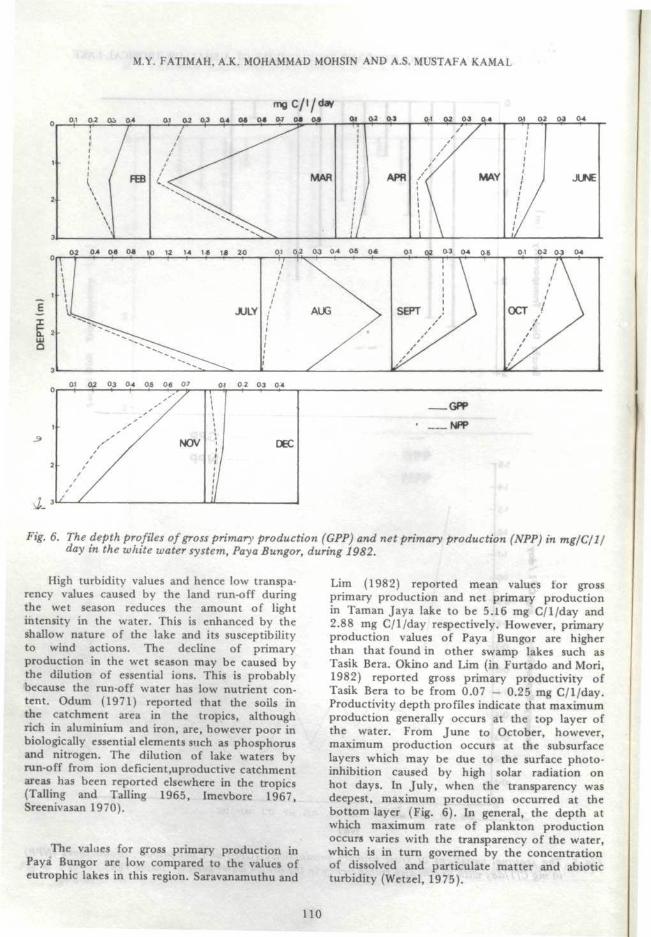
In the white water system, with the exceptionof April, the production — depth profiles conformto a curve having a maximum production at thesurface from February to May and November toDecember. In June to October, however,maximum production occurred at sub-surfacelayers. Occasionally, when the Secchi disktransparency was deep, bottom layers of the lakeshowed high primary production, as was observedin July (Fig. 6).
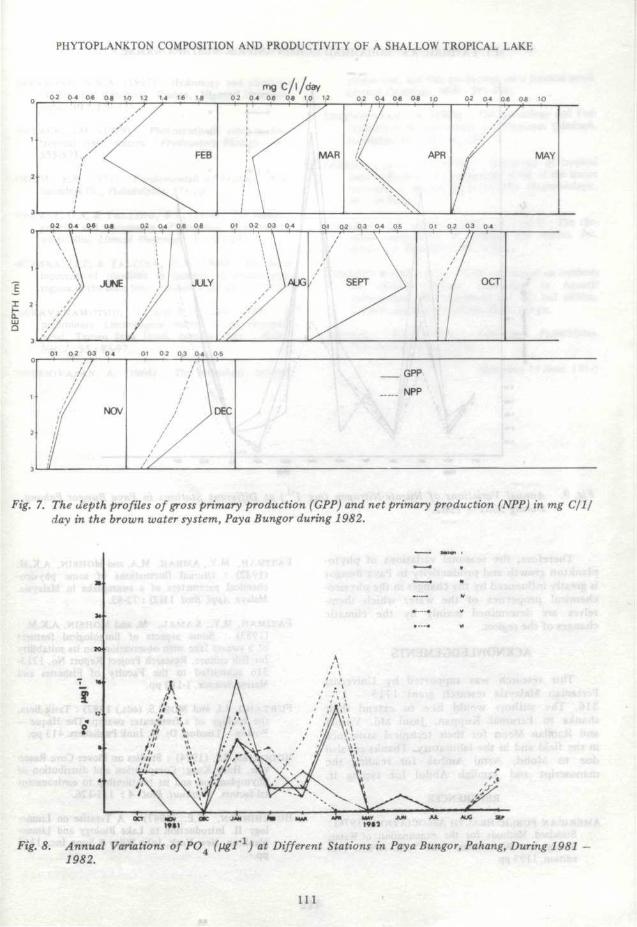
In the brown water system, maximumproduction occurred at the surface from Februaryto May and October to November. For the rest ofthe year, production was highest at mid-depths(Fig. 7).
DISCUSSION
Various groups of phytoplankton in PayaBungor Lake can be ranked in decreasingspecies diversity : Chlorophyta > Bacillario-phyceae > Cyanophyta > Euglenophyta > Chry-sophyceae > Pyrrhophyta; and in decreasingnumerical abundance : Cyanophyta > Chryso-phyceae > Chlorophyta > Bacillariophyceae> Euglenophyta > Pyrrhophyta. High phyto-plankton densities more or less coincide with thehigh values of primary productivity indicatingsome correlation between the two factors.
From the results, it seems that the brownwater system supports a higher phytoplanktonpopulation and has higher phytoplankton pro-ductivity than the white water system. Thiscould be due to the high concentration ofsuspended solids in the white water system.
Although both the white and brown watersystems consist of the same species of phyto-plankton, their patterns of fluctuation andabundance are different. Chlorophyta and Bacilla-riophyceae of the white water system are verysmall in densities and contribute little to thetotal fluctuation of phytoplankton populationin this system. Cynophyta and Chrysophyceaehowever, exhibited a peak in' July — August(Fig. 2). Similar to the blue green population ofthe white water system, the blue greens of thebrown water system shows high densities duringJune — August period. Chlorophyta and Chry-sophyceae, however, exhibit bimodaf fluctuationswith small peaks in April and July; Februaryand July respectively (Fig. 3).
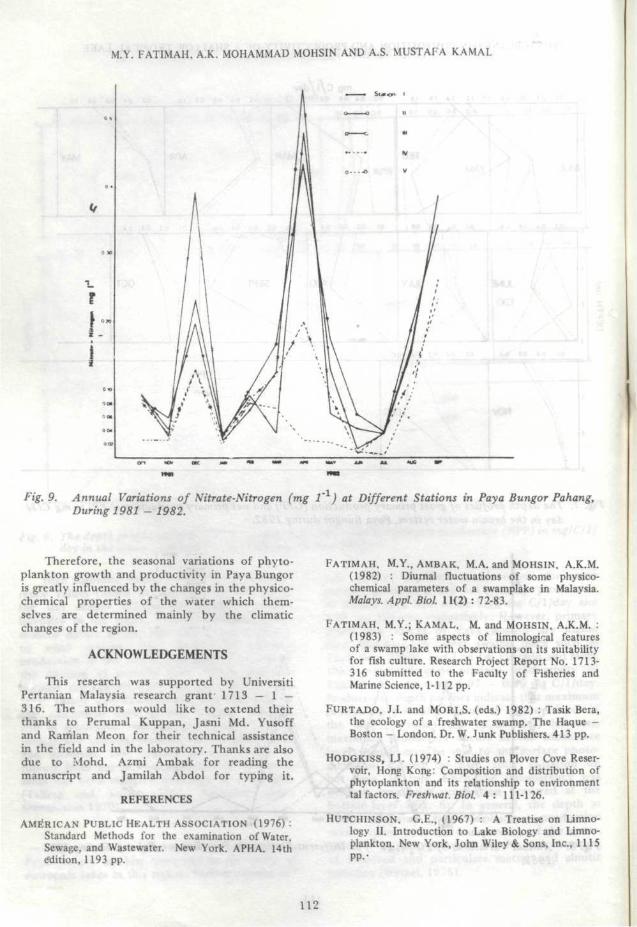
In Paya Bungor, the data shows that whenthe phytoplankton density is high, the nutrientssuch as phosphates and nitrates are low, indicatingrapid utilization of these compounds by the algaegrowth (Figs. 8 and 9). However, it is observedthat the nutrient concentrations are high justbefore and after the phytoplankton peaks. Thisis in agreement with the findings of Rzoska and
105
M.Y. FATIMAH, A.K. MOHAMMAD MOHSIN AND A.S. MUSTAFA KAMAL
Cyanophyta
Chtorophyta
1283BacillarophyciJ*
Chrysophyc«a,
8
1982
Fig. 2. The fluctuations of phytoplankton density (cells/ml) in the white water system of Paya Bungorfrom October 1981 to September 1982.
Tailing (1966) that the nitrate content is very lowduring the maximum growth of diatoms. Prowseand Tailing (1958) also reported occurrence ofnitrate accumulation at the beginning and end ofphytoplankton growth. In Plover Cove Reser-voir, Hong Kong, Hodgkiss (1974) found adecrease in phospate as a result of the increasedgrowth of blue green algae.
Generally, the phytoplankton populationassumes higher densities during the dry season(January to September with scattered rainfall
in April) and low densities in the wet season(October to December). The declining rate ofprimary production and population densitiesduring the wet season could be attributed to thedilution of planktonic organisms following theincrease in the volume of water. Some of theplankton could also be flushed off from thelake into the effluent river during high waterlevels The seasonal decline in solar radiation andhence the intensity of light during the wet seasonis likely to be a major factor in depressing primaryproduction at this time.
106
PHYTOPLANKTON COMPOSITION AND PRODUCTIVITY OF A SHALLOW TROPICAL LAKE
- Cyanophyta
Chlorophyta
• — • BacillanophjrciM
ChrysopHyeiat
Fig. 3. The fluctuations of phytoplankton density (cells/ml) in the brown water system of Pay a Bungorfrom October 1981 to September 1982.
TABLE 3Mean gross primary productivity (GPP) and net primary productivity (NPP) in
mg C/l/day at 2 stations in Paya Bung^r, Pahang.
Station
Station II(White Water
Station IV(Brown water)
GPP
NPP
GPP
NPP
Mean
0.334
0.204
0.479
0.294
Productivity
Minimum
0.083 (December)
0.43 (December)
0.179 (November)
0.152 (November)
(mg C/l/day)Maximum
0.761 (July)
0.587 (July)
1.310 (February)
0.713 (February)
107
M.Y. FATIMAH, A.IC. MOHAMMAD MOHSIN AND A.S. MUSTAFA KAMAL
•51 •> -
T
L
Tr
0-8 T
0 - 7 -
0 -6 - •
0-5-
0-4- •
0-3-
0 0-2- -E
0-1- -
JAN F€B fVWY APR W f f JUN JUL AUG SEP OCT MOV DEC
1982
Fig. 4. The seasonal variations of gross primary productivity (GPP) and net primary productivity (NPP)in Secchi disk transparency in the white water system during 1982.
108
PHYTOPLANKTON COMPOSITION AND PRODUCTIVITY OF A SHALLOW TROPICAX LAKE
1.5
'day
-
t
1
Pri
mar
y
1*3
1.2
M
VO
0-9
0*8
0-7
0*6
0*5
0*4
0-3
0-2
0-1
0
GPP
NPP
JAN FEB NtftR APR MAY JUN JUL AUG SEP OCT N0V DEC
1982
Fig. 5. The seasonal variations of gross primary productivity (GPP) and net primary productivity (NPP)in mg C/l/day with Secchi disk transparency in the brown water systems during 1983.
109
M.Y. FATIMAH, A.K. MOHAMMAD MOHSIN AND A.S. MUSTAFA KAMAL
04 qg 0* 1Q 1.2 1-4 1-6 )& 20 01 0,̂2 03 04 0-5 OS 0-1 Q2 0-3 04 Q;6 01 03 Q-3 04
JULY SEPT OCT I
0-1 QL2 0-3 04 05 0^ 0-? Qj 0 2 03 04
.GPP
.NPP
Fig. 6. The depth profiles of gross primary* production (GPP) and net primary production (NPP) in mg/C/1/day in the white water system, Paya Bungor, during 1982.
High turbidity values and hence low transpa-rency values caused by the land run-off duringthe wet season reduces the amount of lightintensity in the water. This is enhanced by theshallow nature of the lake and its susceptibilityto wind actions. The decline of primaryproduction in the wet season may be caused bythe dilution of essential ions. This is probablybecause the run-off water has low nutrient con-tent. Odum (1971) reported that the soils inthe catchment area in the tropics, althoughrich in aluminium and iron, are, however poor inbiologically essential elements such as phosphorusand nitrogen. The dilution of lake waters byrun-off from ion deficient,uproductive catchmentareas has been reported elsewhere in the tropics(Tailing and Tailing 1965, Imevbore 1967,Sreenivasan 1970).
The values for gross primary production inPaya Bungor are low compared to the values ofeutrophic lakes in this region. Saravanamuthu and
Lim (1982) reported mean values lor grossprimary production and net primary productionin Taman Jaya lake to be 5.16 mg C/l/day and2.88 mg C/l/day respectively. However, primaryproduction values of Paya Bungor are higherthan that found in other swamp lakes such asTasik Bera. Okino and Lim (in Furtado and Mori,1982) reported gross primary productivity ofTasik Bera to be from 0.07 - 0.25 mg C/l/day.Productivity depth profiles indicate that maximumproduction generally occurs at the top layer ofthe water. From June to October, however,maximum production occurs at the subsurfacelayers which may be due to the surface photo-inhibition caused by high solar radiation onhot days. In July, when the transparency wasdeepest, maximum production occurred at thebottom layer (Fig. 6). In general, the depth atwhich maximum rate of plankton productionoccurs varies with the transparency of the water,which is in turn governed by the concentrationof dissolved and particulate matter and abioticturbidity (Wetzel, 1975).
110
PHYTOPLANKTON COMPOSITION AND PRODUCTIVITY OF A SHALLOW TROPICAL LAKE
iC/l/day0 2 04 0-6 08 10 12 M 16 18 0 2 04 0-6 OS 1,0 1;2 02 04 0< 08 to q2 g.4 06 OS 10
MAR APR MAY
I 2
t
02 04 &6 08 02 0-4 0,6 0^ 01 02 03 04 01 02 0,3 04 0-5 01 02 03 04
JUNE JULY \ \ALX3 OCT
01 0 2 03 0 4 0 1 0 2 O;3 0 4 0 5
/ /
if11
' / / \/ \ DEC
/ /
_ _ GPP
_.... NPP
. 7. 7̂ 1̂ depth profiles of gross primary production (GPP) and net primary production (NPP) in mg C/1 /day in the brown water system, Paya Bungor during 1982.
JUN JUL AuG Sir
Fig. 8. Annual Variations of PO (fJgl'1) at Different Stations in Paya Bungor, Pahang, During 19811982.
I l l
M.Y. FATIMAH, A.K. MOHAMMAD MOHSIN AND A.S. MUSTAFA KAMAL
1;
Fig. 9, Annual Variations of Nitrate-Nitrogen (mg T ) at Different Stations in Paya Bungor Pahangy
During 1981 - 1982.
Therefore, the seasonal variations of phyto-plankton growth and productivity in Paya Bungoris greatly influenced by the changes in the physico-chemical properties of the water which them-selves are determined mainly by the climaticchanges of the region.
ACKNOWLEDGEMENTS
This research was supported by UniversitiPertanian Malaysia research grant' 1713 — 1 —316. The authors would like to extend theirthanks to Perumal Kuppan, Jasni Md. Yusoffand Rarhlan Meon for their technical assistancein the field and in the laboratory. Thanks are alsodue to Mohd. Azmi Ambak for reading themanuscript and Jamilah Abdol for typing it.
REFERENCES
AMERICAN PUBLIC HEALTH ASSOCIATION (1976) :Standard Methods for the examination of Water,Sewage, and Wastewater. New York. APHA. 14thedition, 1193 pp.
FATIMAH, M.Y., AMBAK, M.A. and MOHSIN, A.K.M.(1982) : Diurnal fluctuations of some physico-chemical parameters of a swamplake in Malaysia.Malays. Appl. Biol 11(2) : 72-83.
FATIMAH, M.Y.; KAMAL, M. and MOHSIN, A.K.M. :(1983) : Some aspects of limnological featuresof a swamp lake with observations on its suitabilityfor fish culture. Research Project Report No. 1713-316 submitted to the Faculty of Fisheries andMarine Science, 1412 pp.
FURTADO. J.I, and MORI,S. (eds.) 1982) : Tasik Bera,the ecology of a freshwater swamp. The Haque -Boston - London. Dr. W. Junk Publishers. 413 pp.
HODGKISS, U . (1974) : Studies on Plover Cove Reser-voir, Hong Kong: Composition and distribution ofphytoplankton and its relationship to environmenttal factors. Freshwat. Biol 4 : 111-126.
HUTCHINSON, G.E., (1967) : A Treatise on Limno-logy II. Introduction to Lake Biology and Limno-plankton. New York, John Wiley & Sons, Inc., 1115PP.*
112

PHYTOPLANKTON COMPOSITION AND PRODUCTIVITY OF A SHALLOW TROPICAL LAKE
IMEVBORE, A.M.A. (1967) : Hydrology and planktonof Eleiyele Reservoir, Ibadan, Nigeria Hydrobio-togia, 30 : 154-176.
MELACK, I.M. (1979) : Photosynthetic rates in fourtropical fresh waters. Freshwaters Biology. 9 :555-571.
ODUM, E.P. (1971) : Fundamentals of Ecology W.B.Saunders Co., Philadelphia. 574 pp.
PROWSE, G.A, & TALLING, F.J., (1958) : The seasonalgrowth and succession of plankton algae in thewhite Nile, Limnol Oceanogr. 3 : 222-237.
RZOSKA, J.P. & TALLING, F.S. (1966) : The deve-lopment of plankton in relation to hydrologicalregime in the Blue Nile. J. Anim. Ecol 55 : 637-662.
SARAVANAMUTHU, J., and R. P. LIM (1982) : Apreliminary Limnological survey of an eutrophicpond, Taman Jaya Pond, Petaling Jaya. Malay.Nat. J. 35 : 83-97.
SREENIVASAN, A. (1964) ; The limnology, primary
production, and fish production on a tropical pond.Limnol Oceanogr., 9(4) : 391-396.
SREENIVASAN, A. (1968) : The Limnology and Fishproduction in Two ponds in Chinglepat (Madras).Hydrobiologia, 32:131-144.
SREENIVASAN, A. (1970) : Limnology of tropicalimpoundments : A comparative study of the majorreservoirs in Madras State (INDIA) Hydrobiologia,36 : 443-469.
TALLING, J.F. and TALLING, J.B. (1965) : The che-mical composition of African lake waters. Int.Revue, ges, Hydrobiol $0 : 1-32.
VOLLENWEIDER, R.A. (1974) : A manual on methodsfor measing primary production in AquaticEnvironment, IBP Handbook no. 12. 2nd edition.London. Blackwell Scientific Publ. 225 pp.
WETZEL, R.G. (1975) : Limnology. Philadelphia.W.B. Saunders, Co. 743 pp.
(Received 13 June, 1984}
113