Embed Size (px)
Citation preview
FULL LENGTH Iranian Biomedical Journal 21(4): 249-260 July 2017
Iran. Biomed. J. 21 (4): 249-260 249
Plackett-Burman Design and Response
Surface Optimization of Medium Trace Nutrients for
Glycolipopeptide Biosurfactant Production
Maurice George Ekpenyong*1, Sylvester Peter Antai1, Atim
David Asitok1 and Bassey Offiong Ekpo2,3
1Environmental Microbiology and Biotechnology Unit, Department of Microbiology, Faculty of Biological
Sciences, University of Calabar, P.M.B.1115 Calabar, Nigeria; 2Exploration, Research and Services Section,
Research and Development (R&D) Division, Nigerian National Petroleum Corporation (NNPC), Port-Harcourt, Nigeria;
3Environmental Geochemistry Unit, Department of Pure and Applied Chemistry, Faculty
of Physical Sciences, University of Calabar, P.M.B. 1115, Calabar, Nigeria
Received 29 August 2016; revised 8 October 2016; accepted 10 October 2016
ABSTRACT
Background: A glycolipopeptide biosurfactant produced by Pseudomonas aeruginosa strain IKW1 reduced the surface tension of fermentation broth from 71.31 to 24.62 dynes/cm at a critical micelle concentration of 20.80 mg/L. The compound proved suitable for applications in emulsion stabilization in food, as well as in cosmetic and pharmaceutical formulations. Methods: In the present study, Plackett-Burman design (PBD) and response surface method (RSM) were employed to screen and optimize concentrations of trace nutrients in the fermentation medium, to increase surfactant yield. Results: The PBD selected 5 significant trace nutrients out of the 12 screened. The RSM, on the other hand, resulted in the production of 84.44 g glycolipopeptide/L in the optimized medium containing 1.25 mg/L nickel, 0.125 mg/L zinc, 0.075 mg/L iron, 0.0104 mg/L boron, and 0.025 mg/L copper. Conclusion: Significant second-order quadratic models for biomass (P<0.05; adjusted R2=94.29%) and biosurfactant (R2=99.44%) responses suggest excellent goodness-of-fit of the models. However, their respective non-significant lack-of-fit (Biomass: F=1.28; P=0.418; Biosurfactant: F=1.20; P=0.446) test results indicate their adequacy to explain data variations in the experimental region. The glycolipopeptide is recommended for the formulation of inexpensive pharmaceutical products that require surface-active compounds. DOI: 10.18869/acadpub.ibj.21.4.249 Keywords: Pseudomonas aeruginosa, Surface-active agents, Fermentation, Nickel, Copper
Corresponding Author: Maurice George Ekpenyong Environmental Microbiology and Biotechnology Unit, Department of Microbiology, Faculty of Biological Sciences, University of Calabar, P.M.B.1115 Calabar, Nigeria. Tel.: (+234-70)38218972; E-mail: [email protected] or [email protected]
INTRODUCTION
iosurfactants are amphiphilic compounds that
reduce the free surface enthalpy per unit area of
surfaces and interfaces[1]
. They are derived
from biological sources including plants, animals, and
microorganisms; however, world commercial interest
has focused, principally, on microbial derivatives from bacteria, yeasts, and molds
[2].
Microbial surfactants are of diverse chemical nature,
including glycolipids[3]
, flavolipids[4]
, lipopeptides[5]
,
and glycolipopeptides[6-8]
. Each biosurfactant performs
specialized function(s) in their respective producing
organisms. Such functions include solubilization,
emulsification, pathogenesis, antibiosis, swarming
motility, as well as wetting of and attachment to
surfaces[9]
. Commercial interest in biosurfactant production has
B
Dow
nloa
ded
from
ibj.p
aste
ur.a
c.ir
at 1
:48
IRD
T o
n M
onda
y Ju
ne 1
8th
2018
[
DO
I: 10
.188
69/a
cadp
ub.ib
j.21.
4.24
9 ]

Nutrient Optimization for Biosurfactant Production Ekpenyong et al.
250 Iran. Biomed. J. 21 (4): 249-260
heightened over the years owing to their increasingly
widening applications. Surface-active compounds are
applied for different purposes in pharmaceutical,
detergent, food, cosmetic, petroleum, and agricultural
sectors, as well as the environment[10,11]
. A threatening
bottleneck in microbial production of biosurfactants is
the economics of production[1]
. Several strategies exist
to increase biosurfactant yield, that include the use of
low-cost substrates, medium optimization, strain
improvement, and development of fermentation
conditions[12,13]
.
Optimization of fermentation media involving major
and trace nutrients, as well as environmental and
fermentation conditions has been documented[14-16]
. A
good number of biosurfactant fermentation media
compositions incorporating both major and minor
nutrients have been reported without information on
source of trace element composition. A remarkable
study on trace mineral composition of a biosurfactant
medium has been reported by Joshi et al.[17]
.
Trace elements are required in small amounts and
play essential roles in cellular metabolism, mostly as
enzyme co-factors and/or side groups in some
microbial metabolites[18]
. Selection of significant trace
elements for incorporation into fermentation media is
an uphill task from the viewpoint of variable size. A
classical method for screening large variables is the use
of Plackett-Burman design (PBD). It is a small-sized
two-level factorial experimental design programmed to
identify critical physicochemical parameters from N
number of variables in N+1experiments without
recourse to the interaction effects between and among
the variables. Since the sample size is traditionally
small, the interaction effects are completely shrouded
in the main effects. PBD therefore simply screens the
design space to detect large main effects[19]
. The
selected parameters are further optimized by the means
of an appropriate design technique of a response
surface method (RSM). This method is a collection of
statistical techniques that uses design of experiments to
build models, evaluate the effect of factors and predict
optimum conditions for the factors[20]
. The objective of
the present study was to optimize the conditions of
trace nutrients in a fermentation medium using PBD
and RSM to improve biosurfactant yield.
MATERIALS AND METHODS
Producing organism
The bacterium, Pseudomonas aeruginosa strain
IKW1, was earlier isolated[6,21]
. The stock culture of
the bacterium was retrieved and subcultured in Tryptic
Soy Agar by the quadrant-streak plate technique at
30°C for 36 h. The bacterium was passed a second time
through the reactivation step in the same medium for
24 h, after which a loop-full of culture was used to
inoculate freshly prepared Luria broth in 50-mL
Erlenmeyer flask containing 10 mL of medium. Flasks
were incubated on a rotary shaker at 150 rpm at room
temperature (28±2°C) for 18 h.
Optimization experiments
Screening trace elements
The PBD incorporated into MINITAB 17 statistical
software (trial version) was used to screen 12 trace
nutrients in 20 randomized experimental runs. The
nutrients were purchased from Sigma Aldrich, USA
and included NaCl, KCl, CaCl2, MgSO4.7H2O,
CuSO4.5H2O, NiCl2.6H2O, FeCl3, ZnCl2.7H2O,
K3BO3, MoNa2O4.2H2O, CoCl2, and MnSO4.4H2O.
Each was tested only at two levels, low and high.
Biosurfactant concentration (g/L) served as the only
response variable. Fermentation medium was
formulated according to the experimental design and
based on 50 mL of each formulation dispensed into
250-mL Erlenmeyer flask. Phosphorus (1.0 g/L
(NH4)2HPO4/NH4H2PO4) and carbon (5% v/v waste
frying sunflower oil with composition of [% w/w]
stearic acid [2.21], palmitic acid [6.11], volatile
fractions (16.23), oleic acid [22.34], and linoleic acid
[50.76]; saponification value 76 and density [30°C]
283.3 kg/m3) sources were added to the media, and
flasks were corked and sterilized by autoclaving at
121°C for 15 min. Upon cooling, filter-sterilized urea
(1.19 g/L) and inoculum (10% v/v-108
cells/mL) were
added to the medium, and flasks were incubated on a
rotary shaker agitating at 150 rpm at room temperature
for 72 h. All arrangements were made in triplicates.
Biosurfactant quantification was performed as
described elsewhere[6]
. Data were analyzed using the
same statistical software that generated the design.
Significant trace elements were selected for RSM and
optimization.
Response surface design and fermentation studies
The experimental design employed to fit the multiple
regression models of the fermentation study was a 25-1
half-fractional factorial central composite rotatable
design. The test variables were Ni2+
, Zn2+
, Fe3+
, B3+
,
and Cu2+
; each at five levels. The selection of factor
levels for RSM followed, on one hand, the method of
the path of steepest ascent, a procedure that moves
nutrient levels sequentially in the direction of
maximum increase in the response investigated, and on
the other, a consideration for the introduction of
biomass concentration as a second response variable to
facilitate the determination of biosurfactant production
Dow
nloa
ded
from
ibj.p
aste
ur.a
c.ir
at 1
:48
IRD
T o
n M
onda
y Ju
ne 1
8th
2018
[
DO
I: 10
.188
69/a
cadp
ub.ib
j.21.
4.24
9 ]

Nutrient Optimization for Biosurfactant Production Ekpenyong et al.
251 Iran. Biomed. J. 21 (4): 249-260
yield, Yp/x. Results of preliminary screening for the
effects of increasing concentrations of metals on the
growth of the bacterium were also considered in the
selection of factor levels of significant trace nutrients
from PBD for biomass and biosurfactant formation.
Actual levels of each factor were calculated using the
equation of Myers and Montgomery[20]
.
The coded levels were determined as follows:
X1=(Ni2+
-0.75)/0.25, X2=(Zn2+
–0.075)/0.025, X3=
(Fe3+
–0.075)/0.025, X4=(B3+
–0.03)/0.01, and X5=(Cu2+
-
0.075)/0.025. The response variables were biomass Y1
(g/L) and biosurfactant Y2 (g/L) concentrations. The
experimental design required 32 experimental runs,
which were set up in 250-mL Erlenmeyer flasks, each
containing 50 mL of fermentation medium composed
(g/L) of Na2HPO4/KH2PO4 (2:1; 4.5), MgSO4.7H2O
(0.2), NaCl (0.5), CaCl2 (0.5), KCl (0.5),
MoNa2O4.2H2O (0.05 mg/L), CoCl2.6H2O (0.05
mg/L), and MnSO4.4H2O (0.05 mg/L). Different
concentrations of the five significant trace elements
obtained from PBD screening were then added to the
flasks according to the actual values of the factor levels
specified by the coded values in Table 1. Medium pH
was adjusted to 7.0 with KOH pellets[4]
. Waste frying
oil was subsequently added to each flask at 5% (v/v)
concentration and flasks, without nitrogen source, were
sterilized by autoclaving at 121°C for 15 min. Upon
cooling, filter-sterilized urea (1.19 g/L) and inoculum
(10% v/v–108 cells/mL) were introduced into flasks
prepared in triplicates, and then the flasks were
incubated on rotary shakers agitating at 150 rpm at
room temperature for 72 h.
Determination of biomass (Y1) and biosurfactant
(Y2) concentrations
Small portions of 72-h fermentation broth from each
experimental setting (10 mL) were centrifuged at 8,000
g for 10 min. Cell-free supernatants were collected,
and the cell pellets were washed twice in de-
mineralized water. The supernatants were subjected to
0.45-µM and 0.2-µM Millipore membrane filtrations
and subsequently to acid precipitation with 6N HCl,
pH 2.0. Biomass and biosurfactant concentrations were
determined from cell pellets and acid precipitates of
supernatants, respectively as described previously[6]
.
Statistical analysis
All data generated from the factorial experiment
were subjected to multiple regression analysis using
least squares to build the regression models. A second-
order (quadratic) function was used to fit the data
generated. Experimental design, data analysis,
interaction plotting, and optimization of factor
conditions were done with MINITAB 17 statistical
software, while Excel 2007 was used for confirmation
Table 1. Placket-Burman design matrix (randomized) for trace element contribution to biosurfactant formation in coded units
Run A B C D E F G H J K L M BSC (g/L)
1 -1 -1 -1 1 -1 1 -1 1 1 1 1 -1 23.58
2 1 1 1 1 -1 -1 1 1 -1 1 1 -1 25.96
3 -1 -1 1 1 -1 1 1 -1 -1 -1 -1 1 24.21
4 1 -1 -1 1 1 -1 1 1 -1 -1 -1 -1 21.43
5 -1 1 1 -1 -1 -1 -1 1 -1 1 -1 1 24.19
6 1 1 -1 1 1 -1 -1 -1 -1 1 -1 1 28.96
7 -1 1 1 1 1 -1 -1 1 1 -1 1 1 31.73
8 1 1 -1 -1 -1 -1 1 -1 1 -1 1 1 32.75
9 -1 -1 -1 -1 -1 -1 -1 -1 -1 -1 -1 -1 17.45
10 1 -1 1 -1 1 1 1 1 -1 -1 1 1 36.02
11 1 -1 1 1 1 1 -1 -1 1 1 -1 1 24.72
12 -1 1 -1 1 -1 1 1 1 1 -1 -1 1 23.48
13 1 1 1 -1 -1 1 1 -1 1 1 -1 -1 22.31
14 1 -1 1 1 -1 -1 -1 -1 1 -1 1 -1 27.08
15 -1 -1 -1 -1 1 -1 1 -1 1 1 1 1 33.27
16 -1 1 -1 1 1 1 1 -1 -1 1 1 -1 25.31
17 -1 1 1 -1 1 1 -1 -1 -1 -1 1 -1 28.78
18 1 1 -1 -1 1 1 -1 1 1 -1 -1 -1 21.08
19 1 -1 -1 -1 -1 1 -1 1 -1 1 1 1 33.10
20 -1 -1 1 -1 1 -1 1 1 1 1 -1 -1 23.29
A, boron; B, calcium, C, cobalt; D, copper; E, iron; F, potassium; G, magnesium; H, manganese; J, molybdenum; K, sodium; L,
nickel; M, zinc; ‘1’, high value; ‘-1‘, low value; BSC, biosurfactant concentration
251 Iran. Biomed. J. 21 (4): 249-260
Nutrient Optimization for Biosurfactant Production Ekpenyong et al.
Dow
nloa
ded
from
ibj.p
aste
ur.a
c.ir
at 1
:48
IRD
T o
n M
onda
y Ju
ne 1
8th
2018
[
DO
I: 10
.188
69/a
cadp
ub.ib
j.21.
4.24
9 ]

Nutrient Optimization for Biosurfactant Production Ekpenyong et al.
252 Iran. Biomed. J. 21 (4): 249-260
of model fits where predicted responses were plotted
against experimentally-derived data. All hypotheses
were tested at 95% confidence level.
For the five factors considered in the optimization
experiment, the quadratic model took the form below:
where b0 is the value of the fixed response at the
central point (0, 0, 0, 0, 0); b1, b2, b3, b4, and b5 the
coefficients of the linear terms; b11, b22, b33, b44, and
b55 the coefficients of the quadratic terms; b12, b13,
b14, b15, b23, b24, b25, b34, b35, and b45 are the
coefficients of the cross products (interactive terms).
Verification experiments
Studies to confirm the validity of the results of the
optimization experiment were done by setting up
glycolipopeptide production in the optimized medium.
The medium had the same composition as that
described in Materials and Methods with
concentrations of nickel, zinc, iron, boron, and copper
incorporated in accordance with the results of the
various optimized conditions. Fermentation was
conducted in 250-mL Erlenmeyer flasks containing 50
mL of fermentation medium supplemented with 5%
(v/v) waste frying sunflower oil as carbon source.
Cooled sterilized media were supplemented with filter-
sterilized urea (1.19 g/L) and then inoculated with 10%
(v/v–108 cells/mL) inoculum of Pseudomonas
aeruginosa strain IKW1. Flasks were incubated as
earlier described and biomass and biosurfactant
concentrations determined as described in Ekpenyong
et al.[6]
. Means of triplicate determinations of
concentrations of biomass and biosurfactant from
corroborating experiments were compared with those
predicted by the regression models.
RESULTS AND DISCUSSION
Plackett-Burman design
The design matrix of the PBD for the effects of 12
trace nutrients on biosurfactant production and their
responses are shown in Table 1. Results showed the
highest biosurfactant concentration of 36.02 g/L in run
10. However, the results of the trace element modeling
experiment by PBD revealed that only 5 out of 12
nutrient elements significantly influenced the
glycolipopeptide production. The non-selection of the
remaining seven elements suggests their non-
significant (P>0.05) contributions to the response
under investigation at the confidence level selected for
the study.
Fig. 1. Normal plot of standardized effects of significant trace nutrients of a Plackett-Burman design for glycolipoeptide-
biosurfactant production. Bo is used loosely to indicate boron and not as a chemical symbol.
Dow
nloa
ded
from
ibj.p
aste
ur.a
c.ir
at 1
:48
IRD
T o
n M
onda
y Ju
ne 1
8th
2018
[
DO
I: 10
.188
69/a
cadp
ub.ib
j.21.
4.24
9 ]

Ekpenyong et al. Nutrient Optimization for Biosurfactant Production
Iran. Biomed. J. 21 (4): 249-260 253
Fig. 2. Main effects plots of contributions of significant trace elements to glycolipopeptide-biosurfactant production by
Pseudomonas aeruginosa strain IKW1. BSC, biosurfactant concentration
Results of the trace element screen test by PBD
indicated the same results as trace element modeling
experiment. Figure 1 is the normal plot of the
standardized effect of the significant nutrients, showing
the magnitude and direction of their significant effects.
The Figure reveals that nickel has the highest
significant positive effect on biosurfactant production
by the bacterium since its effect is positioned the
furthest to the right of the response line. Other
nutrients with significant enhancement effect on
biosurfactant production were zinc, iron, and boron,
which is in agreement with the Joshi et al.'s study[17]
.
However, the Figure reveals a significant reductive
effect of copper on glycolipopeptide production by the
bacterium since its effect is positioned to the left of the
biosurfactant response line. Figure 2 shows the main
effects plots of significant trace nutrients on the
response variable and confirms the results displayed in
Figure 1. Nickel has been shown to make the highest
contribution to biosurfactant production, whereas
copper exerts a negative effect on biosurfactant
production.
The analysis of variance (ANOVA) result for
significant trace elements is demonstrated in Table 2
and confirms nickel as having the most significant
(P<0.05) enhancement effect on biosurfactant
production given by its very large F value. The linear
regression coefficient of determination, adjusted R2 of
91.81%, indicates that the model equation (below),
given in un-coded units, was significant and could
explain 91.81% of the variability in the response data.
The equation reveals that nickel has the largest
coefficient that is preceded by a positive sign,
confirming once again its strong enhancement effect on
biosurfactant formation.
Response surface optimization
Experimental data of the response surface method
Table 3 shows the actual factor levels corresponding
to coded factor levels for a 25-1
half-fractional factorial,
Table 2. Analysis of variance (ANOVA) of the regression model from the Plackett-Burman
design for trace element contribution to biosurfactant formation in un-coded units
Source DF Adj. SS Adj. MS F value P value
Model 5 428.38 85.677 43.61 0.000
Linear 5 428.38 85.677 43.61 0.000
Bo 1 16.42 16.417 8.36 0.012
Cu 1 12.45 12.450 6.34 0.025
Fe 1 20.97 20.972 10.67 0.006
Ni 1 220.85 220.847 112.41 0.000
Zn 1 157.70 157.697 80.27 0.000
Error 14 27.51 1.965
Total 19 455.89
Model Summary: S, 1.40166; R2, 93.97%; adjusted R2, 91.81%; predicted R2,
87.69%; P<0.05, 5% significance level. Bo is used loosely to indicate boron and not as a
chemical symbol. DF, degrees of freedom; SS, sum of squares; MS, mean sum of squares.
Dow
nloa
ded
from
ibj.p
aste
ur.a
c.ir
at 1
:48
IRD
T o
n M
onda
y Ju
ne 1
8th
2018
[
DO
I: 10
.188
69/a
cadp
ub.ib
j.21.
4.24
9 ]

Nutrient Optimization for Biosurfactant Production Ekpenyong et al.
254 Iran. Biomed. J. 21 (4): 249-260
Table 3. Actual factor levels corresponding to coded factor levels for 25-1 half-fractional factorial
central composite rotatable design of response surface method
Variable (mg/L) Actual values
Code -2 -1 0 1 2
NiCl2.6H2O X1 0.250 0.50 0.750 1.00 1.250
ZnSO4.7H2O X2 0.025 0.05 0.075 0.10 0.125
FeCl3 X3 0.025 0.05 0.075 0.10 0.125
K3BO3 X4 0.010 0.02 0.030 0.04 0.050
CuSO4.5H2O X5 0.025 0.05 0.075 0.10 0.125
Table 4. Actual factor levels corresponding to coded factor levels for the CCRD of the response surface optimization showing biomass
and biosurfactant concentrations
Run
order X1 X2 X3 X4 X5
NiCl2
(mg/L)
ZnSO4
(mg/L)
FeCl3
(mg/L)
K3BO3
(mg/L)
CuSO4
(mg/L)
BMC
(g/L)
BSC
(g/L)
1 0 0 0 0 0 0.750 0.075 0.075 0.030 0.075 16.86 41.03
2 -2 0 0 0 0 0.250 0.075 0.075 0.030 0.075 14.36 29.55
3 -1 -1 -1 1 -1 0.500 0.050 0.050 0.040 0.050 8.96 36.04
4 1 -1 1 1 -1 1.000 0.050 0.100 0.040 0.050 12.98 38.32
5 0 0 0 2 0 0.750 0.075 0.075 0.050 0.075 13.52 28.39
6 0 0 0 -2 0 0.750 0.075 0.075 0.010 0.075 18.52 36.57
7 0 0 0 0 -2 0.750 0.075 0.075 0.030 0.025 15.39 46.47
8 -1 1 -1 -1 -1 0.500 0.100 0.050 0.020 0.050 11.35 38.32
9 -1 1 1 1 -1 0.500 0.100 0.100 0.040 0.050 18.26 35.31
10 1 -1 -1 -1 -1 1.000 0.050 0.050 0.020 0.050 10.62 32.19
11 0 0 0 0 0 0.750 0.075 0.075 0.030 0.075 18.76 41.22
12 0 -2 0 0 0 0.750 0.025 0.075 0.030 0.075 9.67 36.82
13 0 0 0 0 0 0.750 0.075 0.075 0.030 0.075 18.87 41.46
14 -1 1 -1 1 1 0.500 0.100 0.050 0.040 0.100 13.28 27.54
15 -1 -1 1 1 1 0.500 0.050 0.100 0.040 0.100 13.41 26.79
16 0 0 2 0 0 0.750 0.075 0.125 0.030 0.075 16.59 40.45
17 1 1 -1 1 -1 1.000 0.100 0.050 0.040 0.050 12.38 31.07
18 1 1 -1 -1 1 1.000 0.100 0.050 0.020 0.100 16.58 30.01
19 0 0 -2 0 0 0.750 0.075 0.025 0.030 0.075 8.95 28.12
20 0 2 0 0 0 0.750 0.125 0.075 0.030 0.075 15.38 46.05
21 1 1 1 1 1 1.000 0.100 0.100 0.040 0.100 8.47 39.67
22 0 0 0 0 2 0.750 0.075 0.075 0.030 0.125 11.04 37.58
23 1 -1 1 -1 1 1.000 0.050 0.100 0.020 0.100 11.94 41.40
24 -1 -1 1 -1 -1 0.500 0.050 0.100 0.020 0.050 21.07 29.56
25 1 1 1 -1 -1 1.000 0.100 0.100 0.020 0.050 19.53 57.21
26 0 0 0 0 0 0.750 0.075 0.075 0.030 0.075 18.94 42.08
27 -1 1 1 -1 1 0.500 0.100 0.100 0.020 0.100 17.39 37.99
28 0 0 0 0 0 0.750 0.075 0.075 0.030 0.075 19.04 41.68
29 -1 -1 -1 -1 1 0.500 0.050 0.050 0.020 0.100 9.47 31.07
30 0 0 0 0 0 0.750 0.075 0.075 0.030 0.075 18.83 40.78
31 1 -1 -1 1 1 1.000 0.050 0.050 0.040 0.100 9.57 30.24
32 2 0 0 0 0 1.250 0.075 0.075 0.030 0.075 12.35 39.00
X1, nickel; X2, zinc; X3, iron; X4, boron; X5, copper; BMC, biomass concentration; BSC, biosurfactant concentration
Dow
nloa
ded
from
ibj.p
aste
ur.a
c.ir
at 1
:48
IRD
T o
n M
onda
y Ju
ne 1
8th
2018
[
DO
I: 10
.188
69/a
cadp
ub.ib
j.21.
4.24
9 ]

Ekpenyong et al. Nutrient Optimization for Biosurfactant Production
Iran. Biomed. J. 21 (4): 249-260 255
a central composite rotatable design of RSM. The
experimental responses from the 32 experimental runs
of the surface methodology are presented in Table 4.
Maximum biomass concentration of 21.07 g/L was
obtained at conditions set at (X1, X2, X3, X4, X5)=(-1,
-1, 1, -1, -1) corresponding to 0.5 mg/L nickel, 0.05
mg/L zinc, 0.1 mg/L iron, 0.02 mg/L boron, and 0.05
mg/L copper. In these conditions, biosurfactant
concentration obtained was 29.56 g/L. However, the
highest biosurfactant concentration of 57.21 g/L was
acquired at conditions set at (X1, X2, X3, X4, X5)=(1, 1,
1, -1, -1) corresponding to 1 mg/L nickel, 0.1 mg/L
zinc, 0.1 mg/L iron, 0.02 mg/L boron, and 0.05 mg/L
copper and a corresponding biomass concentration of
19.53 g/L. Glycolipopeptide production yield, Yp/x,
under these conditions would be 2.93. The attainment
of peak biomass and biosurfactant concentrations at
different experimental runs suggest the requirement of
different trace nutrient conditions for cellular growth
and metabolite synthesis, especially metabolites
obtained during or near idiophasic metabolism of
organisms.
Regression model for biomass concentration, Y1 The data presented in Table 4 was subjected to
multiple regression analyses using least squares
regression to fit a second-order (quadratic) regression
model for biomass concentration, Y1. The model
stipulated 20 predictors; however, the result of
ANOVA of the model in Table 5 reveals that 5
interactive terms were removed by stepwise selection,
since their contributions were not significant at P=0.05.
The T values of the predictor coefficients (data not
shown) suggest that all model predictors, except the
linear terms of zinc and iron, made significant negative
contributions to the model, implying their reductive
effects on biomass formation. The model equation is
presented in un-coded units as equation 4 below:
Table 5. Analysis of variance of the 25-1 half-fractional factorial central composite rotatable design of an response surface
method for biomass regression model in un-coded units
Source DF Adjusted SS Adjusted MS F value P value
Model 15 435.332 29.0222 35.12 0.000
Linear 5 199.895 39.9790 48.38 0.000
Ni 1 9.551 9.5508 11.56 0.004
Zn 1 39.117 39.1171 47.34 0.000
Fe 1 88.627 88.6273 107.26 0.000
Bo 1 39.117 39.1171 47.34 0.000
Cu 1 23.483 23.4828 28.42 0.000
Square 5 134.701 26.9401 32.60 0.000
Ni*Ni 1 35.179 35.1787 42.57 0.000
Zn*Zn 1 49.773 49.7729 60.23 0.000
Fe*Fe 1 45.202 45.2022 54.70 0.000
Bo*Bo 1 5.395 5.3951 6.53 0.021
Cu*Cu 1 37.463 37.4633 45.34 0.000
Two-way interaction 5 100.737 20.1473 24.38 0.000
Ni*Fe 1 33.931 33.9306 41.06 0.000
Ni*Bo 1 6.126 6.1256 7.41 0.015
Zn*Fe 1 7.182 7.1824 8.69 0.009
Fe*Bo 1 10.530 10.5300 12.74 0.003
Fe*Cu 1 42.968 42.9680 52.00 0.000
Error 16 13.221 0.8263
Lack-of-fit 11 9.748 0.8862 1.28 0.418
Pure error 5 3.473 0.6946
Total 31 448.554
Model Summary: S, 0.909022; R2, 97.05%; adjusted R2, 94.29%; Predicted R2, 86.75%; P<0.05, 5% significance level. Bo is used
loosely to indicate boron and not as a chemical symbol. DF, degrees of freedom; SS, sum of squares; MS, mean sum of squares
Dow
nloa
ded
from
ibj.p
aste
ur.a
c.ir
at 1
:48
IRD
T o
n M
onda
y Ju
ne 1
8th
2018
[
DO
I: 10
.188
69/a
cadp
ub.ib
j.21.
4.24
9 ]

Nutrient Optimization for Biosurfactant Production Ekpenyong et al.
256 Iran. Biomed. J. 21 (4): 249-260
The metal, iron, is described as the only macro-bio-
element of the heavy metals and the most biologically
relevant trace nutrient[18]
. The effect of its linear term
on biomass formation was understandably pronounced,
and the significant reductive effect of its quadratic term
suggests possible toxicity at high concentrations and
therefore its trace requirement. Abalos et al.[14]
have
reported a similar result trend during production of
rhamnolipid from a strain of Pseudomonas aeruginosa. The requirement of zinc for biomass formation
derives from its role in DNA-binding proteins and a
variety of enzymes. Zinc is also known to act as a
Lewis base needed to activate water for involvement in
aqueous reactions[6]
.
The significance of a model is given by its goodness-
of-fit test, often expressed as the coefficient of
determination R2, which is the percentage of the
variations in the response that can be explained by
independent factors and their interactions. In this study,
the biomass regression model (Table 5) was highly
significant (F=35.12; P=0.000) with an adjusted R2
of
94.29%, indicating that only 5.71% of the variability in
the response is not explainable by the model.
A well-fitted model estimated by adjusted R2 might
not adequately explain data variations in the region of
experimentation. The lack-of-fit test is therefore
frequently used as a support test for adequacy of the
fitted model. The ANOVA table for the biomass
regression model in this study shows a non-significant
lack-of-fit (F=1.28; P=0.418) for the model, which
suggests its adequacy for the explanation of data
variations in the region of experimentation.
The regression plot of experimental against predicted
biomass responses is presented as Figure 3 and reveals
a coefficient of determination, R2 of 0.9705, which is in
agreement with the R2 for the model in the ANOVA
table.
Regression model for biosurfactant concentration,
Y2
The ANOVA for the biosurfactant regression model
presented in Table 6 indicated that the model was
highly significant (F=371.07; P=0.000). All the linear
predictor terms and only the square terms of nickel,
iron, and boron were significant. Six of the interactive
predictor terms were also significant; however, Fe*Cu
interaction, although included in the model, was not
significant (P=0.051). The magnitude and direction of
significant effect of model predictors are given by the
T values of the coefficient estimates of the predictors
(data not shown) and reveal that the linear, but not the
quadratic terms of nickel, zinc, and iron, significantly
enhanced biosurfactant formation. It is probably
because of the enhancing effect of Fe*Cu that the term
was included in the model, to increase biosurfactant
concentration as long as the adjusted R2
of the model
was not negatively affected. The model equation, in
un-coded units, is therefore presented as equation 5
below.
The model was shown to have an adjusted R
2 value
of 99.44%, suggesting that only 0.56% of the
variability in biosurfactant responses could not be
explained by it, and that the observed variations were
due to the factor effects and not due to noise. To
confirm the adequacy of the biosurfactant model in
explaining the variations about the data, an
examination of the lack-of-fit test result in the
ANOVA table was made and demonstrated a non-
significant (F=1.20; P=0.446) lack-of-fit, indicating
the adequacy of the model to explain data in the
experimental region.
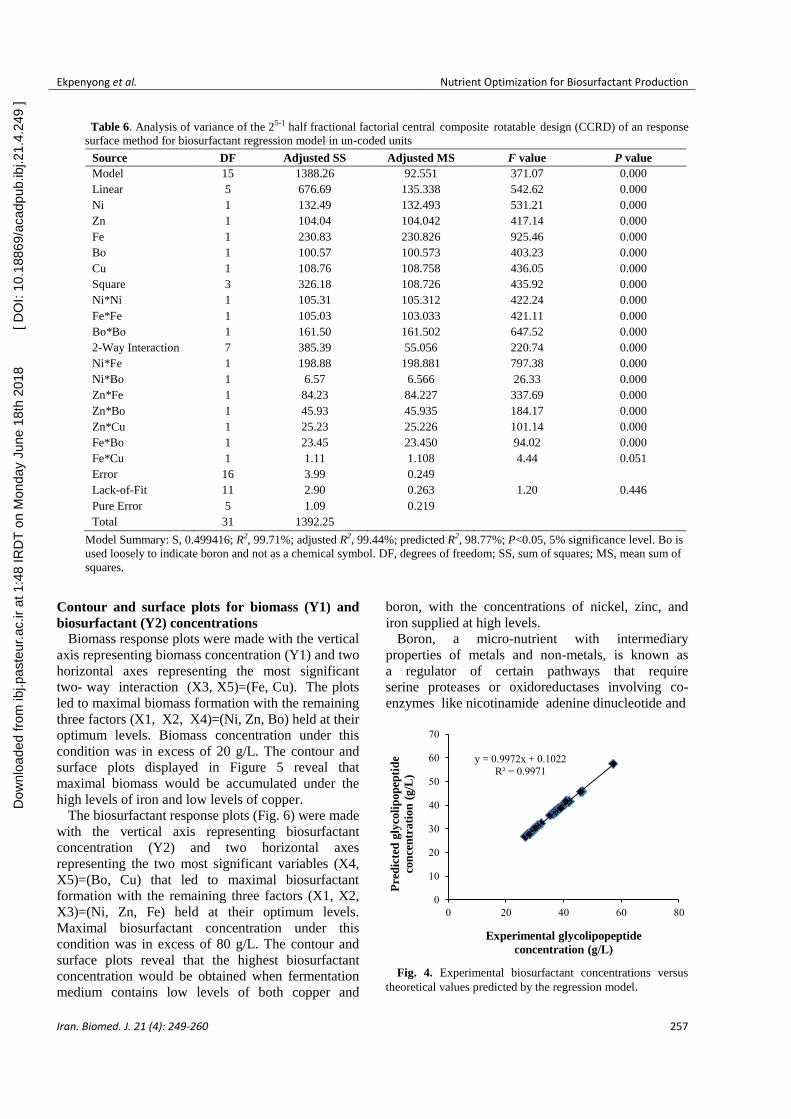
A plot of experimental biosurfactant concentrations
against predicted concentrations obtained by solving
equation 5 is presented in Figure 4 as the final
ratification of the fit of the biosurfactant regression
model and confirms a goodness-of-fit, R2 (unadjusted)
value of 99.97%.
Fig. 3. Experimental biomass concentration plotted against
biomass concentration predicted by the fitted model.
y = 0.9707x + 0.4223
R² = 0.9705
0
5
10
15
20
25
0 5 10 15 20 25
Experimental biomass concentration (g/L)
Pre
dic
ted
bio
ma
ss c
on
cen
tra
tion
(g
/L)
Dow
nloa
ded
from
ibj.p
aste
ur.a
c.ir
at 1
:48
IRD
T o
n M
onda
y Ju
ne 1
8th
2018
[
DO
I: 10
.188
69/a
cadp
ub.ib
j.21.
4.24
9 ]
Ekpenyong et al. Nutrient Optimization for Biosurfactant Production
Iran. Biomed. J. 21 (4): 249-260 257
Table 6. Analysis of variance of the 25-1 half fractional factorial central composite rotatable design (CCRD) of an response
surface method for biosurfactant regression model in un-coded units
Source DF Adjusted SS Adjusted MS F value P value
Model 15 1388.26 92.551 371.07 0.000
Linear 5 676.69 135.338 542.62 0.000
Ni 1 132.49 132.493 531.21 0.000
Zn 1 104.04 104.042 417.14 0.000
Fe 1 230.83 230.826 925.46 0.000
Bo 1 100.57 100.573 403.23 0.000
Cu 1 108.76 108.758 436.05 0.000
Square 3 326.18 108.726 435.92 0.000
Ni*Ni 1 105.31 105.312 422.24 0.000
Fe*Fe 1 105.03 103.033 421.11 0.000
Bo*Bo 1 161.50 161.502 647.52 0.000
2-Way Interaction 7 385.39 55.056 220.74 0.000
Ni*Fe 1 198.88 198.881 797.38 0.000
Ni*Bo 1 6.57 6.566 26.33 0.000
Zn*Fe 1 84.23 84.227 337.69 0.000
Zn*Bo 1 45.93 45.935 184.17 0.000
Zn*Cu 1 25.23 25.226 101.14 0.000
Fe*Bo 1 23.45 23.450 94.02 0.000
Fe*Cu 1 1.11 1.108 4.44 0.051
Error 16 3.99 0.249
Lack-of-Fit 11 2.90 0.263 1.20 0.446
Pure Error 5 1.09 0.219
Total 31 1392.25
Model Summary: S, 0.499416; R2, 99.71%; adjusted R2, 99.44%; predicted R2, 98.77%; P<0.05, 5% significance level. Bo is
used loosely to indicate boron and not as a chemical symbol. DF, degrees of freedom; SS, sum of squares; MS, mean sum of
squares.
Contour and surface plots for biomass (Y1) and
biosurfactant (Y2) concentrations Biomass response plots were made with the vertical
axis representing biomass concentration (Y1) and two
horizontal axes representing the most significant
two- way interaction (X3, X5)=(Fe, Cu). The plots
led to maximal biomass formation with the remaining
three factors (X1, X2, X4)=(Ni, Zn, Bo) held at their
optimum levels. Biomass concentration under this
condition was in excess of 20 g/L. The contour and
surface plots displayed in Figure 5 reveal that
maximal biomass would be accumulated under the
high levels of iron and low levels of copper.
The biosurfactant response plots (Fig. 6) were made
with the vertical axis representing biosurfactant
concentration (Y2) and two horizontal axes
representing the two most significant variables (X4,
X5)=(Bo, Cu) that led to maximal biosurfactant
formation with the remaining three factors (X1, X2,
X3)=(Ni, Zn, Fe) held at their optimum levels.
Maximal biosurfactant concentration under this
condition was in excess of 80 g/L. The contour and
surface plots reveal that the highest biosurfactant
concentration would be obtained when fermentation
medium contains low levels of both copper and
boron, with the concentrations of nickel, zinc, and
iron supplied at high levels.
Boron, a micro-nutrient with intermediary
properties of metals and non-metals, is known as
a regulator of certain pathways that require
serine proteases or oxidoreductases involving co-
enzymes like nicotinamide adenine dinucleotide and
Fig. 4. Experimental biosurfactant concentrations versus
theoretical values predicted by the regression model.
y = 0.9972x + 0.1022
R² = 0.9971
0
10
20
30
40
50
60
70
0 20 40 60 80
Pre
dic
ted
gly
coli
pop
epti
de
con
cen
trati
on
(g
/L)
Experimental glycolipopeptide
concentration (g/L)
Dow
nloa
ded
from
ibj.p
aste
ur.a
c.ir
at 1
:48
IRD
T o
n M
onda
y Ju
ne 1
8th
2018
[
DO
I: 10
.188
69/a
cadp
ub.ib
j.21.
4.24
9 ]

Nutrient Optimization for Biosurfactant Production Ekpenyong et al.
258 Iran. Biomed. J. 21 (4): 249-260
Fig. 5. Contour (A) and surface (B) plots of two-way
interactions of independent variables for maximal biomass
production. Bo is used loosely to indicate boron and not as a
chemical symbol. BMC, biomass concentration
nicotinamide adenine dinucleotide phosphate for
activity[22]
. These activities of boron in bacteria could
very well be the reason for its very little requirement
both for cellular growth and secondary metabolism.
Copper, on the other hand, is mostly important in
cytochrome C oxidases; oxygen-dependent terminal
oxidases in the electron transport chain of aerobic
organisms[23]
. The interaction therefore between
boron and copper has to be very important in
biosurfactant synthesis since the whole process is
energy driven; copper to generate energy and boron
to inhibit the process.
Nickel is a transition metal useful only in a few
selected reactions. It associates with iron in NiFe
hydrogenases; an enzyme system that splits molecular
hydrogen into protons and electrons. The metal is
also intrinsically bound to urease; an enzyme that
catalyses the splitting of urea into carbon dioxide and
ammonia thus supplying nitrogen in its available
form for cellular metabolism[18,24]
. The preference of urea as a nitrogen source for glycolipopeptide
biosurfactant production by Pseudomonas aeruginosa
strain IKW1 (unpublished data) demystifies the
significant enhancement effect of nickel on
biosurfactant production and suggests a correlation
between urease activity and biosurfactant production
in the bacterium.
Selection of optimum conditions for response
variables For situations where biomass accumulation is
desired instead of the surface-active compound,
which was not the case in this study, the highest
predictable biomass concentration of 26.55 g/L was
obtained at trace mineral conditions set at (X1, X2,
X3, X4, X5)=(-1.0707, -0.0202, 2.0, -2.0, -1.8788)
corresponding to 0.482 mg/L nickel, 0.074 mg/L
zinc, 0.125 mg/L iron, 0.010 mg/L boron, and 0.028
mg/L copper.
For tertiary oil recovery and spilled oil remediation
where maximum concentrations of both responses
Fig. 6. Contour (A) and surface (B) plots of two-way
interactions of independent variables for maximal
glycolipopeptide production. Bo is used loosely to indicate
boron and not as a chemical symbol. BSC, biosurfactant
concentration
Ni 0
Zn 0
Bo 0
Hold Values
2
0 0
10
-2
0 -22
20
CMB
uC
eF
urface plS t for bio mass concentrationo
Ni 2
Zn 2
Fe 2
Hold Values
Bo
Cu
210-1-2
2
1
0
-1
-2
>
–
–
–
–
–
< 30
30 40
40 50
50 60
60 70
70 80
80
BSC
Contour plot for biosurfactant concentration
Ni 2
Zn 2
Fe 2
Hold Values
40
60
2-
0 2-2
0
2
80
CSB
uC
oB
urface plot S or biosuf factant concentrationr
(A)
(B)
(B)
(A)
Ni 2
Zn 2
Fe 2
Hold Values
Bo
Cu
210-1-2
2
1
0
-1
-2
>
–
–
–
–
–
< 30
30 40
40 50
50 60
60 70
70 80
80
BSC
Contour plot for biosurfactant concentration
Dow
nloa
ded
from
ibj.p
aste
ur.a
c.ir
at 1
:48
IRD
T o
n M
onda
y Ju
ne 1
8th
2018
[
DO
I: 10
.188
69/a
cadp
ub.ib
j.21.
4.24
9 ]

Ekpenyong et al. Nutrient Optimization for Biosurfactant Production
Iran. Biomed. J. 21 (4): 249-260 259
Table 7. Design codes, actual values, experimental and predicted responses of validation
experiments of an RSM for glycolipopeptide production
Parameters BMC
maximized
BSC
maximized
BMC and BSC
maximized
X1 -1.0707 2 0.2626
X2 -0.0202 2 0.9495
X3 2 2 2
X4 -2 -1.9596 -2
X5 -1.8788 -2 -2
Ni (mg/L) 0.482 1.25 0.816
Zn (mg/L) 0.074 0.125 0.099
Fe (mg/L) 0.125 0.125 0.125
Bo (mg/L) 0.010 0.010 0.010
Cu (mg/L) 0.028 0.025 0.025
eBMC (g/L 25.74 19.14 25.14
pBMC (g/L) 26.55 NP 23.40
eBSC (g/L) 25.96 84.44 56.83
pBSC (g/L) NP 81.92 57.55
X1, nickel (Ni); X2, zinc (Zn); X3, iron (Fe); X4, boron (Bo); X5, copper (Cu); eBMC,
experimental biomass concentration; pBMC, predicted biomass concentration; eBSC,
experimental biosurfactant concentration; pBSC, predicted biosurfactant concentration; NP,
not predicted. Bo is used loosely to indicate boron and not as a chemical symbol.
are desired, trace mineral conditions set at (X1, X2,
X3, X4, X5)=(0.2626, 0.9495, 2.0, -2.0, -2.0)
corresponding to 0.816 mg/L nickel, 0.099 mg/L zinc,
0.125 mg/L iron, 0.01 mg/L boron, and 0.025
mg/L copper, which would lead to 23.4 g/L biomass
and 57.55 g/L biosurfactant.
Finally, for detergent, food, cosmetic, and
pharmaceutical applications where maximum surface-
active compound and zero microbial cells are desired,
the response optimizer set conditions for maximum
biosurfactant concentration of 81.92 g/L at (X1, X2,
X3, X4, X5)=(2.0, 2.0, 2.0, -1.9596, -2) corresponding
to 1.25 mg/L nickel, 0.125 mg/L zinc, 0.125 mg/L iron,
0.0104 mg/L boron, and 0.025 mg/L copper.
Verification experiments
Table 7 shows that maximum biosurfactant
concentration obtained in the validation experiments
under conditions (X1, X2, X3, X4, X5) =(2, 2, 2, -
1.9596, -2) corresponding to 1.25 mg/L nickel, 0.125
mg/L zinc, 0.125 mg/L iron, 0.0104 mg/L boron, and
0.025 mg/L copper was 84.44 g/L with a
corresponding biomass concentration of 19.14 g/L,
giving a production yield (Yp/x) of 4.41. When
fermentation conditions were set to maximize both
responses, biosurfactant yield of 2.26 was achieved.
Compared to the 81.92 g/L biosurfactant concentration
predicted by the optimizer, the concentration obtained
in the confirmation experiment was only 0.03% higher,
thus validating the prediction of the response
optimizer. A glycolipopeptide biosurfactant
concentration of 84.44 g/L, when compared to 23.86
g/L obtained from a previous (control) experiment
(unpublished data), reveals a ~3.54fold increase in
biosurfactant concentration, thereby making separate
optimization experiments for trace nutrients
appropriate for developing the fermentation media for
the production of microbial metabolites.
PBD selected nickel, zinc, iron, boron, and copper as
the most significant (P<0.05; adjusted R2=91.82%)
trace minerals for glycolipopeptide biosurfactant
production. Optimization of the nutrients by RSM
resulted in 84.44 g/L of the biosurfactant under
conditions set at (X1, X2, X3, X4, X5)=(2, 2, 2, -
1.9596, -2). These conditions corresponded to 1.2500
mg/L nickel, 0.125 mg/L zinc, 0.125 mg/L iron, 0.0104
mg/L boron, and 0.025 mg/L copper, giving a
production yield, Yp/x of 4.41. In conclusion, PBD and
RSM are dependable tools for selecting and optimizing
conditions of nutrients for biosurfactant production.
ACKNOWLEDGEMENTS
The authors are grateful to the government of Cross
River State, Nigeria for the research grant
(CRS/SB/P/149/30) awarded for this work through
their Ministry of Education, Scholarship and Grant
unit. Sincere gratitude also goes to Mr. Obi Oyeka-
Director of Bez Pharmacy and Stores, Calabar, Nigeria
and Dr. Samuel Ekpata for their financial assistance
towards this research.
Dow
nloa
ded
from
ibj.p
aste
ur.a
c.ir
at 1
:48
IRD
T o
n M
onda
y Ju
ne 1
8th
2018
[
DO
I: 10
.188
69/a
cadp
ub.ib
j.21.
4.24
9 ]

Nutrient Optimization for Biosurfactant Production Ekpenyong et al.
260 Iran. Biomed. J. 21 (4): 249-260
CONFLICT OF INTEREST. None declared.
REFERENCES
1. Desai JD, Banat IM. Microbial production of surfactants
and their commercial potential. Microbiology and
molecular biology reviews 1997; 61(1): 47-64.
2. Abouseoud M, Maachi R, Amrane A, Boudergua S,
Nabi A. Evaluation of different carbon and nitrogen
sources in production of biosurfactant by Pseudomonas
fluorescens. Desalination 2008; 223(1-3): 143-151.
3. Banat IM, Franzetti A, Gandolfi I, Bestetti G, Martinotti
M G, Fracchia L, Smyth T J, Marchant R. Microbial
biosurfactants production, applications and future
potential. Applied microbiology and biotechnology
2010; 87(2): 427- 444.
4. Bodour AA, Drecs KP, Maier RM. Distribution of
biosurfactant-producing bacteria in undisturbed and
contaminated arid southwestern soils. Applied and
environmental microbiology 2003; 69(6): 3280-3287.
5. Morikawa M, Daido H, Takao T, Murata S, Shimonishi
Y, Imanaka T. A new lipopeptide biosurfactant
produced by Arthrobacter sp. strain MIS38. Journal of
bacteriology 1993; 175(20): 6459-6466.
6. Ekpenyong M, Antai SP, Asitok, A. A Pseudomonas
aeruginosa strain IKW1 produces an unusual polymeric
surface-active compound in waste frying oil-minimal
medium. International journal of sciences 2016; 5(6):
108-123.
7. Ilori MO, Amund DI. Production of a peptidoglycolipid
bioemulsifier from Pseudomonas aeruginosa grown on
hydrocarbon. Zeitschrift für naturforschung c 2001;
56(7-8): 547-552.
8. Thavasi R, Jayalakshmi S, Balasubramaian T, Banat IM.
Biosurfactants production by Corynebacterium
kutscheri from waste motor lubricant oil and peanut oil
cake. Letters in applied microbiology 2007; 45(6): 686-
691.
9. Ron EZ, Rosenberg E. Natural roles of biosurfactants.
Environmental microbiology 2001; 3(4): 229-236.
10. Pacwa-Plociniczak M, Plaza GA, Piotrowska-Seget Z,
Cameotra SS. Environmental applications of
biosurfactants: recent advances. International journal of
molecular sciences 2011; 12(1): 633-654.
11. Sachdev DP, Cameotra SS. Biosurfactants in
agriculture. Applied microbiology and biotechnology
2013; 97(3): 1005-1016.
12. Sekhon KK, Khanna S, Cameotra SS. Enhanced
biosurfactant production through cloning of three genes
and role of esterase in biosurfactant release. Microbial
cell factories 2011; 10: 49.
13. Thavasi R, Subramanyam Nambaru VRM, Jayalakshmi
S, Balasubramanian T, Banat IM. Biosurfactant
production by Pseudomonas aeruginosa from renewable
resources. Indian journal of microbiology 2011; 51(1):
30-36.
14. Abalos A, Maximo F, Manresa MA, Bastida J.
Utilization of response surface methodology to optimize
the culture media for the production of rhamnolipids by
Pseudomonas aeruginosa AT10. Journal of chemical
technology and biotechnology 2002; 77(7): 777-784.
15. Deepika KV, Kalam S, Sridhar PR, Podile AR,
Bramhachari PV. Optimization of rhamnolipid
biosurfactant production by mangrove sediment
bacterium Pseudomonas aeruginosa KVR-HR42 using
response surface methodology. Biocatalysis and
agricultural biotechnology 2016; 5: 38-47.
16. Rodrigues L, Teixeira J, Oliveira R, van der Mei H C.
Response surface optimization of the medium
components for the production of biosurfactants by
probiotic bacteria. Process biochemistry 2006; 41(1): 1-
10.
17. Joshi S, Yadav S, Nerurkar A, Desai AJ. Statistical
optimization of medium components for the production
of biosurfactant by Bacillus licheniformis K51. Journal
of microbiology and biotechnology 2007; 17(2): 313-
319.
18. Nies DH. Microbial heavy-metal resistance. Applied
microbiology and biotechnology 1999; 51(6): 730-750.
19. Cavazzuti M. Optimization Methods: from Theory to
Design, London: Springer, 2013.
20. Myers R H, Montgomery D C. Response Surface
Methodology: Product and Process Optimization Using
Designed Experiments. Second ed. New York: John
Wiley & Sons, 2002.
21. Raorane CJ, Gavimath CC, Kukreja GP, Kalsekar DP,
Kulkarni SM, Ravishankar, BE, Hooli RS. Isolation,
identification and phylogenetic analysis of phthalic acid-
degrading bacteria. International journal of advanced
biotechnology and research 2012; 3(4): 804-809.
22. Hunt CD. Dietary boron: progress in establishing
essential roles in human physiology. Journal of trace
elements in medicine and biology 2012; 26(2-3): 157-
160.
23. Michel H, Behr J, Harrenga A, Kannt A. Cytochrome C
oxidase: structure and spectroscopy. Annual review of
biophysics and biomolecular structure 1998; 27: 329-
356.
24. Maier T, Jacobi A, Sauter M, Bock A. The product of
the hypB gene, which is required for nickel
incorporation into hydrogenases, is a novel guanine
nucleotide-binding protein. Journal of bacteriology
1993; 175(3): 630-635.
Dow
nloa
ded
from
ibj.p
aste
ur.a
c.ir
at 1
:48
IRD
T o
n M
onda
y Ju
ne 1
8th
2018
[
DO
I: 10
.188
69/a
cadp
ub.ib
j.21.
4.24
9 ]