Embed Size (px)
Citation preview
Global Labour Journal, 2018, 9(1), Page 19
Political and Economic Factors Influencing Strike Activity during the Recent Economic Crisis: A Study of the Spanish
Case between 2002 and 20131
Nicholas Pohl, University of Lausanne, Switzerland ABSTRACT The Great Recession and the upsurge of widespread social movements in various crisis-ridden countries have given new impetus to the debate on the relationship between economic breakdown and the occurrence of collective action. I revisit the issue by examining strike activity in Spain between 2002 and 2013. For a better understanding of the continuities and changes, I contrast two sets of literature on industrial conflict. The first deals with economic factors influencing strikes or, in other words, with the question of whether and how fluctuations in manpower supply and demand account for continuities and changes in strike activity. The second advocates for a look beyond the economy, towards the political exchange that takes place between unions and state actors and which, depending on its positive or negative nature, leads to shifts of the distributional struggle away from the marketplace towards the public arena or vice versa. The findings reveal that, rather than exclusive, the two perspectives prove to be mutually conducive and are most significant when they are combined. The political exchange model is helpful for understanding the rather stable or even declining strike frequency prior to the economic crisis but also the three nationwide general strikes in 2010 and 2012, which represented a rupture in the social consensus. If the general strikes are left aside, the economic variables come into play: an increased strike frequency during the economic crisis is in fact accompanied by a shift towards smaller strikes related to a single workplace, and to so-called “defensive” strikes. This indicates that an actual decrease in workers’ bargaining power was overcompensated by a growing number of circumstances in which the recourse to strike action became a means of last resort. KEY WORDS strikes; economic cycles; political exchange; Great Recession; Spain Introduction In the aftermath of the Great Recession (2007–2012) more and more scholars began to dedicate their work to people’s political responses to the negative consequences of the economic crisis. An ever-growing literature in electoral research trying to explain apparent shifts in voting behaviour (Bartels and Bermeo, 2014; Hernández and Kriesi, 2016; Whiteley, 2016) is accompanied by an increasing 1 A draft of this paper was presented at the International Sociological Association’s RC48 PhD Workshop, Vienna, 9 July 2016.
Global Labour Journal, 2018, 9(1), Page 20
number of publications on social movements, notably on the “Indignados” in Spain and the “Occupy” movement in the United States (Graeber, 2012; Della Porta and Mattoni, 2014; Ancelovici, Dufour and Nez, 2016; Romanos, 2016; Della Porta et al., 2017). Research on industrial conflict, too, has benefited from this general upswing (Gallas, Nowak and Wilde, 2012; Nowak and Gallas, 2014; Gallas and Nowak, 2016). However, the literature on Spain still reveals some weaknesses: either it is mainly descriptive (Gil and Hernández, 2014; Lacalle, 2015) or it focuses primarily on political aspects of strikes (Luque, 2012b), leaving aside economic factors that are likely to affect strike activity in times of economic crisis.
By conducting this research on the evolution of strike activity in Spain between 2002 and 2013, I will contribute to filling this gap. The economic factors will be analysed by measuring shifts in manpower supply and demand which, according to the Business Cycle Model (Rist, 1907; Rees, 1952; Skeels, 1971), lead to concomitant shifts in workers’ bargaining power and thereby influence the likelihood of strikes. Regarding the political aspects of strikes, I will include the tripartite negotiations between unions, employers and the state in order to examine whether strikes should rather be considered as a consequence of a rupture in the positive political exchange between unions and the state, in which the government trades goods in exchange for social consensus (Pizzorno, 1978).
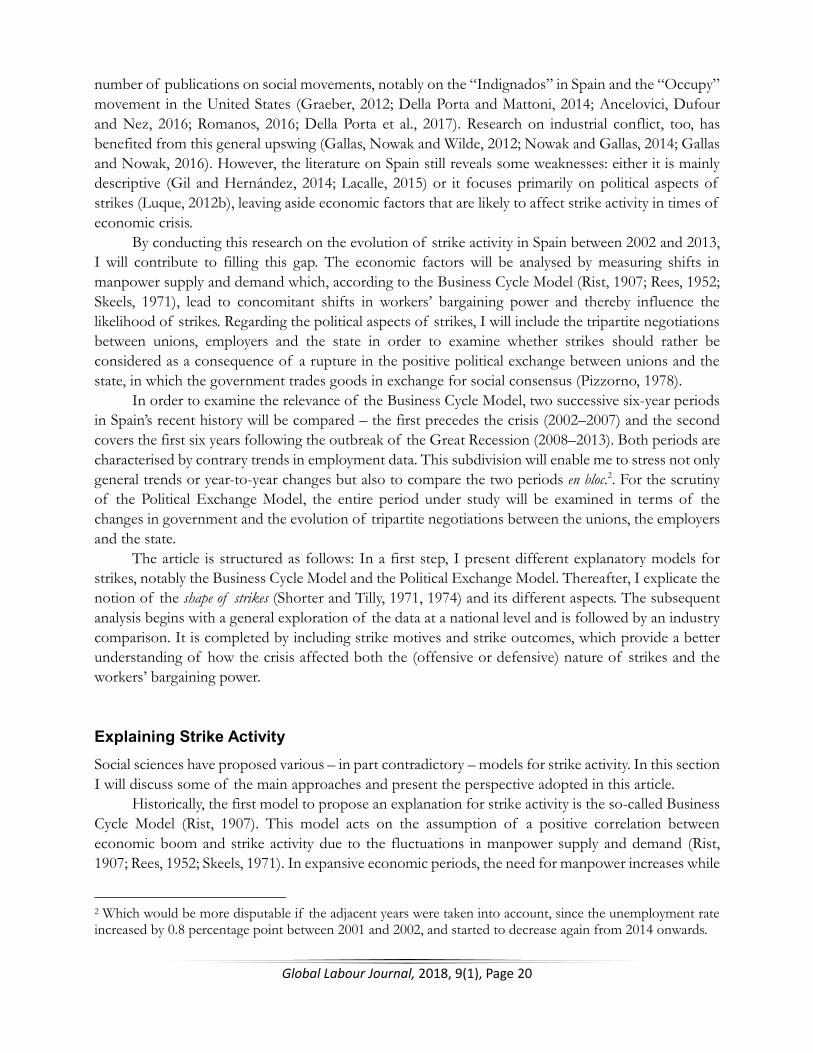
In order to examine the relevance of the Business Cycle Model, two successive six-year periods in Spain’s recent history will be compared – the first precedes the crisis (2002–2007) and the second covers the first six years following the outbreak of the Great Recession (2008–2013). Both periods are characterised by contrary trends in employment data. This subdivision will enable me to stress not only general trends or year-to-year changes but also to compare the two periods en bloc.2. For the scrutiny of the Political Exchange Model, the entire period under study will be examined in terms of the changes in government and the evolution of tripartite negotiations between the unions, the employers and the state.
The article is structured as follows: In a first step, I present different explanatory models for strikes, notably the Business Cycle Model and the Political Exchange Model. Thereafter, I explicate the notion of the shape of strikes (Shorter and Tilly, 1971, 1974) and its different aspects. The subsequent analysis begins with a general exploration of the data at a national level and is followed by an industry comparison. It is completed by including strike motives and strike outcomes, which provide a better understanding of how the crisis affected both the (offensive or defensive) nature of strikes and the workers’ bargaining power. Explaining Strike Activity Social sciences have proposed various – in part contradictory – models for strike activity. In this section I will discuss some of the main approaches and present the perspective adopted in this article.
Historically, the first model to propose an explanation for strike activity is the so-called Business Cycle Model (Rist, 1907). This model acts on the assumption of a positive correlation between economic boom and strike activity due to the fluctuations in manpower supply and demand (Rist, 1907; Rees, 1952; Skeels, 1971). In expansive economic periods, the need for manpower increases while
2 Which would be more disputable if the adjacent years were taken into account, since the unemployment rate increased by 0.8 percentage point between 2001 and 2002, and started to decrease again from 2014 onwards.
Global Labour Journal, 2018, 9(1), Page 21
its supply decreases. Due to the difficulties of hiring new staff, employers would thus try to avoid dismissals when facing strike actions. The workers – knowing that even if they were to be dismissed, they could rapidly take on a new job – are strengthened in their bargaining position, which increases their propensity to participate in strike action.
In opposition to the Business Cycle Model, economic hardship or relative deprivation theories expect that “both short-term and persistent deprivation are significant causes of the various forms of civil strife” (Gurr, 1969: 603). These theories, which were initially used for understanding the emergence of mobs, revolts or revolutions, were later applied to industrial conflict in order to explain heightened strike activity after periods of high inflation (Jackson, Turner and Wilkinson, 1972; Soskice, 1978).
In a Marxist perspective, struggle is inherent in labour–capital relations (Hyman, 1975). In this line, Silver (2003) asserts that historical capitalism is based on two contradictory tendencies, which lead to pendulum swings between “crises of profitability and crises of social legitimacy” (Silver, 2003: 17). Thus, the expansion of capitalist production would lead to a strengthening of labour movements. With the objective of bringing labour under control, capital (and states) would have to make concessions, which provoke crises of profitability. In order to restore profits, capital (and states) would then again have to break established social conventions and intensify the commodification of labour, thereby producing crises of social legitimacy and backlash resistances. In this perspective, crises of profitability are provoked by so-called “Marx-type labour unrest” – that is, offensive struggles led by the emerging working class. On the opposite side, crises of social legitimacy lead to “Polanyi-type labour unrest” – that is, backlash resistances to the continuous spread of self-regulating markets, in particular by the workers most affected by the disbanding of social contracts or by global economic transformations (Silver, 2003: 20).
Proponents of the institutionalisation approach argue that more attention should be paid to the institutional context and to the continuing regulation and thus institutionalisation of unions and their means of action (Adam and Reynaud, 1978). In this perspective, unions would increasingly opt for institutional channels – which are considered more efficient and less costly than strike actions – in order to reach agreements with employers (Tixier, 2007).
Closer to political science, researchers stressed the importance of considering the political context and the resulting political exchange between governments and unions (Hibbs, 1978; Pizzorno, 1978). In this model, strike activity is explained by the power of unions in the political sphere. In countries where bonds between government and unions are strong, unions are expected to avoid the costs of strike action and to intervene in the political sphere, where they have good chances to attain their goals. In contrast, in countries where these bonds are weak or absent, unions have to exert pressure by the means of collective action (Korpi and Shalev, 1979). The Political Exchange Model not only allows for cross-country analyses but also for single case studies, where the focus is put on shifts of power between different political parties (on the Spanish case, see Luque, 2012a, 2012b, 2013). The political exchange can be considered as “positive” if bonds between unions and the government are strong and an ongoing social dialogue prevails. It turns “negative” when the dialogue comes to a halt or does not exist and the unions adopt contentious tactics to exert pressure on the state (Luque, 2012b: 99).
Because of the limited time period under study, I will not be able to put all the models to the test. Institutionalisation, for instance, is considered an ongoing but in particular a long-run process. For its examination, it would be necessary to include the entire process since Spain’s so-called transition
Global Labour Journal, 2018, 9(1), Page 22
to democracy in the second half of the 1970s. The same accounts for the scrutiny of Silver’s (2003) model of the pendulum swings between crises of profitability and crises of social legitimacy. Her model better suits mid- or long-term processes and does not apply to the 2008 financial crisis, which was not a “crisis of profitability” caused by concessions made by employers in order to bring labour movements under control.
The above-mentioned restrictions led me to focus this analysis on two dimensions of strikes and on their related explanatory models: first, the political dimension and the corresponding political exchange model, which expects heightened strike activity after the imposition of labour market reforms by the Spanish government against the will of the unions; and second, the economic dimension, where I will address the question of whether the economic crisis has weakened the workers’ bargaining power and thus led to a decrease in strike activity (which would be in line with the Business Cycle Model) or, on the contrary, whether the relative deprivation produced by the economic crisis has fomented the use of strikes (which would be in line with the relative deprivation hypothesis).
Conceptualisation of Strike Activity Following the definition of the International Labour Organization (ILO, 1993: n.p.), strikes are considered here as “a temporary work stoppage effected by one or more groups of workers with a view to enforcing or resisting demands or expressing grievances, or supporting other workers in their demands or grievances”. The investigation of strike activity will be based on annual data provided by the Spanish Ministry of Employment and Social Security. It collects statistics on the number of strikes, the number of workers participating in strike action and the number of working days lost due to strike action, and breaks these variables down according to different subcategories (e.g. economic sector, strike motives, strike outcome). Not included in the data provided by this ministry are values regarding one nationwide strike of the public sector in 2010 and three nationwide general strikes3 (one in 2010 and two in 2012). Following the approach adopted by González and Luque (2014) and Luque and González (2016), the missing data regarding the three nationwide general strikes will be reconstructed on the basis of surveys conducted by the Centro de Investigaciones Sociológicas in the aftermath of each general strike. Extrapolating these numbers to the entire working population allows for rough estimates regarding participation in the general strikes. As a result, only the 2010 strike of the public sector, for which the same survey procedure does not apply, has to be omitted from the analysis.
In this paper, I will go beyond an evaluation of the absolute numbers provided by the Spanish Ministry of Employment and Social Security and include an analysis of the shape of strikes, as proposed by Shorter and Tilly (1971; 1974) and later adopted by various other scholars (Hibbs, 1978; Luque, Cueto and Mato, 2008; Luque, 2013). According to this conceptualisation, various aspects of strike activity should be considered: first, the size of strikes, defined as the total number of strikers over the total number of strikes; second, their duration, specified as working days lost in strike action over the number of workers involved; and third, the strike frequency, calculated by the total number of strikes over the working population under study. Based on these three aspects of strikes, two additional
3 Although three general strikes occurred during the economic crisis, the Spanish Ministry of Employment and Social Security provides data only on the first general strike of the period under study, which took place in 2002.
Global Labour Journal, 2018, 9(1), Page 23
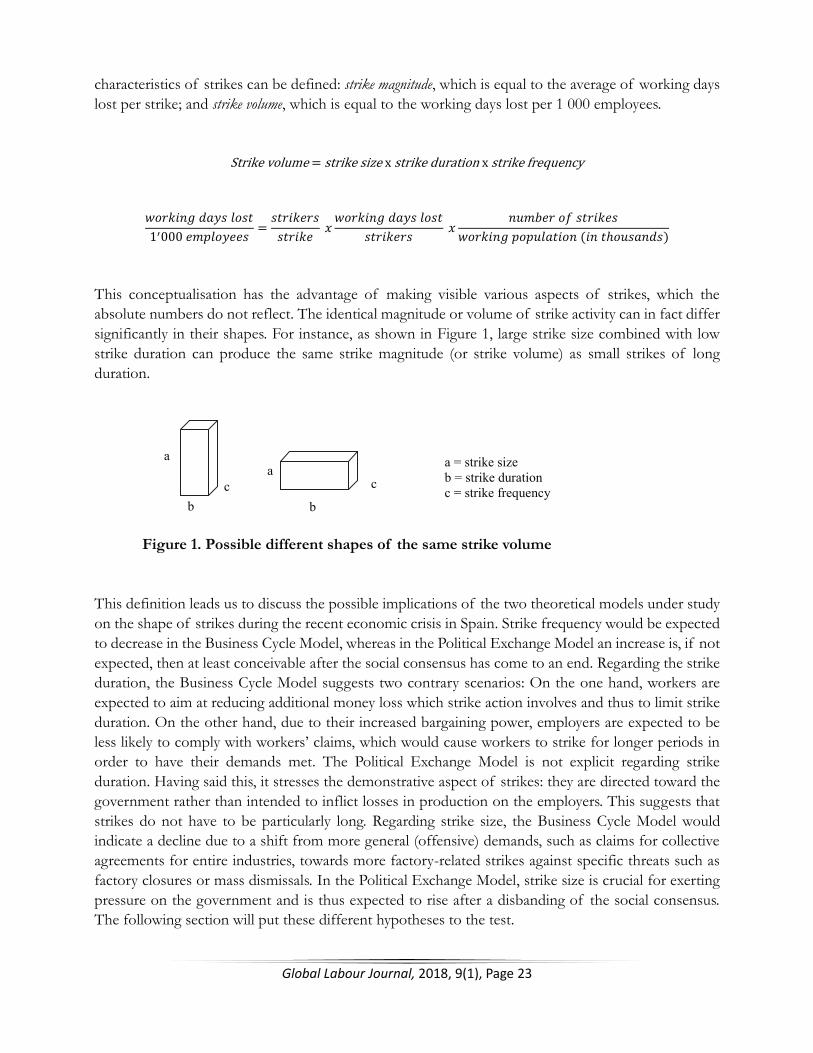
characteristics of strikes can be defined: strike magnitude, which is equal to the average of working days lost per strike; and strike volume, which is equal to the working days lost per 1 000 employees.
Strike volume = strike size x strike duration x strike frequency
1 000 = ( ℎ )
This conceptualisation has the advantage of making visible various aspects of strikes, which the absolute numbers do not reflect. The identical magnitude or volume of strike activity can in fact differ significantly in their shapes. For instance, as shown in Figure 1, large strike size combined with low strike duration can produce the same strike magnitude (or strike volume) as small strikes of long duration.
Figure 1. Possible different shapes of the same strike volume
This definition leads us to discuss the possible implications of the two theoretical models under study on the shape of strikes during the recent economic crisis in Spain. Strike frequency would be expected to decrease in the Business Cycle Model, whereas in the Political Exchange Model an increase is, if not expected, then at least conceivable after the social consensus has come to an end. Regarding the strike duration, the Business Cycle Model suggests two contrary scenarios: On the one hand, workers are expected to aim at reducing additional money loss which strike action involves and thus to limit strike duration. On the other hand, due to their increased bargaining power, employers are expected to be less likely to comply with workers’ claims, which would cause workers to strike for longer periods in order to have their demands met. The Political Exchange Model is not explicit regarding strike duration. Having said this, it stresses the demonstrative aspect of strikes: they are directed toward the government rather than intended to inflict losses in production on the employers. This suggests that strikes do not have to be particularly long. Regarding strike size, the Business Cycle Model would indicate a decline due to a shift from more general (offensive) demands, such as claims for collective agreements for entire industries, towards more factory-related strikes against specific threats such as factory closures or mass dismissals. In the Political Exchange Model, strike size is crucial for exerting pressure on the government and is thus expected to rise after a disbanding of the social consensus. The following section will put these different hypotheses to the test.
a a
c c b b
a = strike size b = strike duration c = strike frequency
Global Labour Journal, 2018, 9(1), Page 24
Political and Economic Aspects of Strike Activity during the Recent Economic Crisis in Spain The state of the economy and political transformations between 2002 and 2013 In this section, I will first present the economic performance of the country by taking a closer look at employment levels in general but also at the different economic sectors. In a second step, I will portray some of the most relevant political transformations which are likely to have affected workers and unions. This will help to examine, in the later sub-sections, which factors actually account for continuities and changes in strike activity during the recent economic crisis.
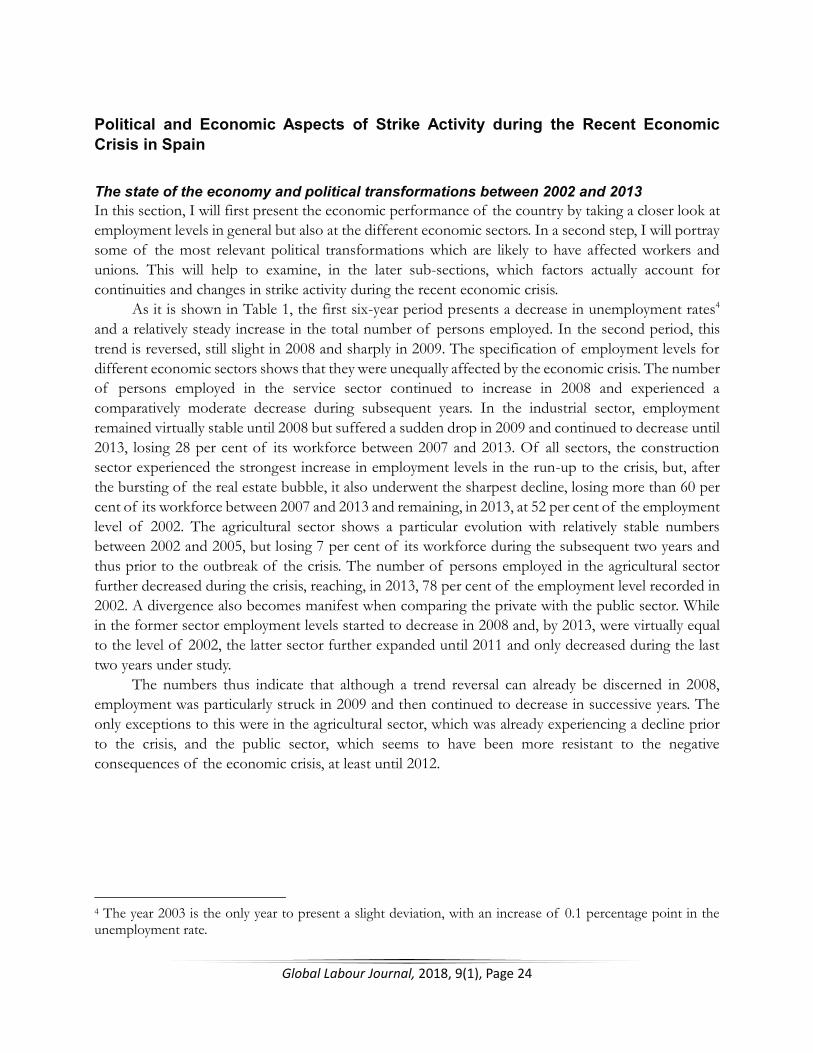
As it is shown in Table 1, the first six-year period presents a decrease in unemployment rates4 and a relatively steady increase in the total number of persons employed. In the second period, this trend is reversed, still slight in 2008 and sharply in 2009. The specification of employment levels for different economic sectors shows that they were unequally affected by the economic crisis. The number of persons employed in the service sector continued to increase in 2008 and experienced a comparatively moderate decrease during subsequent years. In the industrial sector, employment remained virtually stable until 2008 but suffered a sudden drop in 2009 and continued to decrease until 2013, losing 28 per cent of its workforce between 2007 and 2013. Of all sectors, the construction sector experienced the strongest increase in employment levels in the run-up to the crisis, but, after the bursting of the real estate bubble, it also underwent the sharpest decline, losing more than 60 per cent of its workforce between 2007 and 2013 and remaining, in 2013, at 52 per cent of the employment level of 2002. The agricultural sector shows a particular evolution with relatively stable numbers between 2002 and 2005, but losing 7 per cent of its workforce during the subsequent two years and thus prior to the outbreak of the crisis. The number of persons employed in the agricultural sector further decreased during the crisis, reaching, in 2013, 78 per cent of the employment level recorded in 2002. A divergence also becomes manifest when comparing the private with the public sector. While in the former sector employment levels started to decrease in 2008 and, by 2013, were virtually equal to the level of 2002, the latter sector further expanded until 2011 and only decreased during the last two years under study.
The numbers thus indicate that although a trend reversal can already be discerned in 2008, employment was particularly struck in 2009 and then continued to decrease in successive years. The only exceptions to this were in the agricultural sector, which was already experiencing a decline prior to the crisis, and the public sector, which seems to have been more resistant to the negative consequences of the economic crisis, at least until 2012.
4 The year 2003 is the only year to present a slight deviation, with an increase of 0.1 percentage point in the unemployment rate.
Global Labour Journal, 2018, 9(1), Page 25
Table 1. Unemployment rates, total employment and employment in different sectors
Notes: (1) Per cent values show the relative changes compared to the base year, 2002. (2) Employment numbers are in thousands and include self-employed people. As the latter implies that the number of employed people susceptible to participate in strike action is in fact lower, the calculated rates of strike frequency (and thus also of strike volumes) have to be considered underestimations. Sources: labour statistics from Eurostat (n.d.), ILO (n.d.) and OECD (n.d.).
At a political level, the timeframe under study begins with the two last years of the conservative Popular Party’s (PP) government led by José María Aznar, whose “third way conservatism” (Hamann, 2005), characterised by tripartite negotiations, came to a momentary halt when he implemented a reform of the unemployment benefit system despite the opposition of the two major unions Comisiones Obreras (CCOO) and Unión General de Trabajadores (UGT). In 2004, the Spanish Socialist Workers’ Party (PSOE) wan the parliamentary elections and José Luis Rodriguéz Zapatero was elected Prime Minister of Spain. This led to a strengthening of the social dialogue between unions, employers and the state. Yet, the economic crisis and the concomitant credit restrictions in the private sector and the steep rise in unemployment led to a severe fiscal crisis. In 2010, the social democratic government considered that cuts in public spending were unavoidable to remedy the country’s budget crisis, and in May of that same year the government decreed the first austerity measures, including a 5 per cent wage cut in the public sector. Shortly after, in June 2010, the government finally unilaterally decreed a labour market reform. This unilateral path did not last long. During the following year, tripartite negotiations were resumed and a “social and economic agreement” was reached, which should favour growth, job creation and guarantee pensions. That same year, Zapatero called early elections, which were won by the Popular Party under the leadership of Mariano Rajoy. This government pushed another labour market reform, which was decreed in February 2012 against the will of CCOO and UGT.
The overview: a descriptive account of strike activity prior to and during the recent economic crisis in Spain Before trying to understand why some aspects of strikes changed after the outbreak of the Great Recession, I will draw a picture of how they have changed, notably by comparing the six-year period

Global Labour Journal, 2018, 9(1), Page 26
preceding the Great Recession (2002–2007) and the one covering the first six years since its outbreak (2008–2013).
As is clear from Table 2, different aspects of strikes have evolved unequally over time. Furthermore, certain aspects of strikes – notably strike size – vary greatly depending on whether or not general strikes are taken into account. In order to facilitate the subsequent interpretation, I will first depict the evolution of the shape of strikes by omitting the general strikes and then show how the picture changes when they are included. Table 2. Strike activity in Spain between 2002 and 2013
Notes: (1) Values in brackets include general strikes. (2) Due to lack of data, the values do not include the general strike of the public sector which took place on 8 June 2010. (3) Numbers of participants in the 2010 and 2012 general strikes are taken from Luque and González (2016: 12). Source: Spanish Ministry of Employment and Social Security (n.d.) (unless otherwise specified); own calculations.
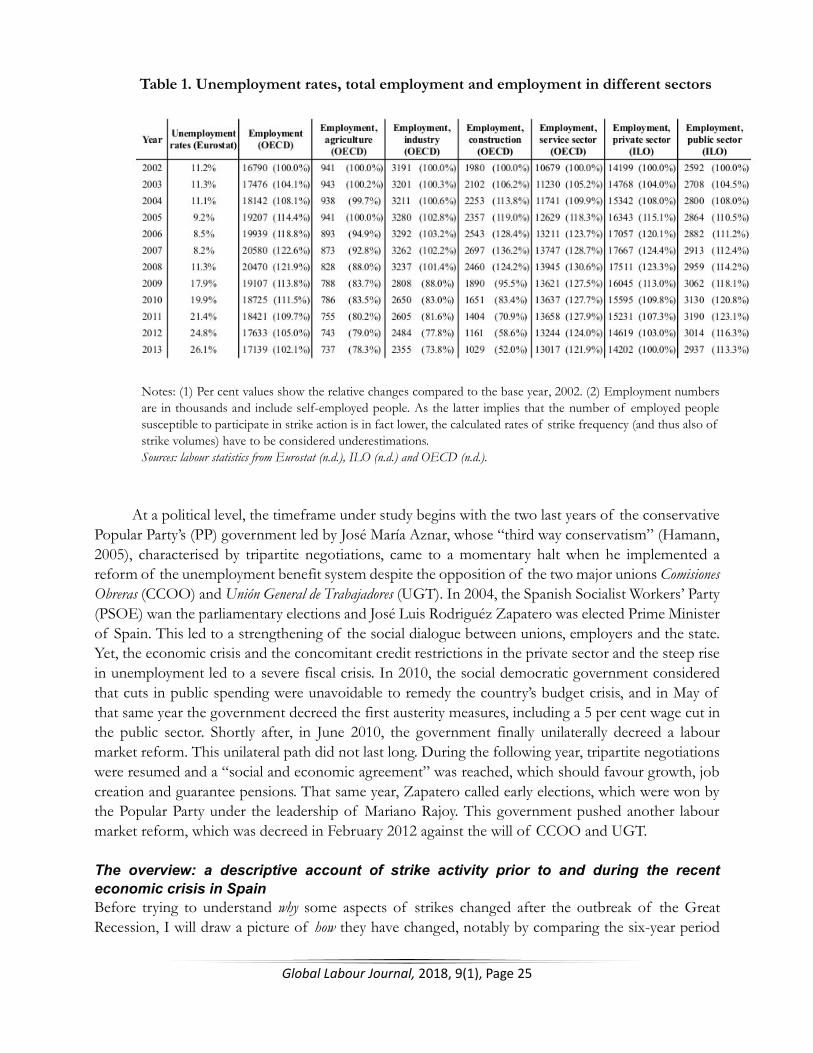
Regarding the mean strike frequency, the value for the second period under study is 29 per cent
(or 1.1 percentage point) higher than the one recorded for the pre-crisis period. Contemplating only the absolute numbers of strikes, one would be tempted to infer that an increase in strike activity already occurred prior to the crisis, since 2006 and 2007 show the highest values of the first six-year period. The measurement of strike frequency (and thus the consideration of the growing employment levels during the first six years under study), however, shows that strike frequency remained rather stable (or even decreased) during this first period and that it experienced a first sharp increase only in 2009 (see
Global Labour Journal, 2018, 9(1), Page 27
Figure 2). The data also reveal a dip in 2011 before reaching the highest score in 2013, overtopping (in strike frequency but not in absolute values) the level of 2009.
Source: Spanish Ministry of Employment and Social Security (n.d.); own calculations.
Figure 2. Number of strikes and strike frequency in Spain
Regarding strike size, a trend towards smaller strikes can be observed. The first six-year period
is characterised by relatively high strike size levels (978 workers per strike in 2002 and 1 081 workers per strike in 2003); this more than halves by 2005, reaching only 495 per strike in that year. During the following four years the level settles at around 650, but then drops again in 2010, reaching the lowest level in 2011 (286 workers per strike). During the two subsequent years the level slightly increases again, but remains under the level observed at the onset of the crisis.
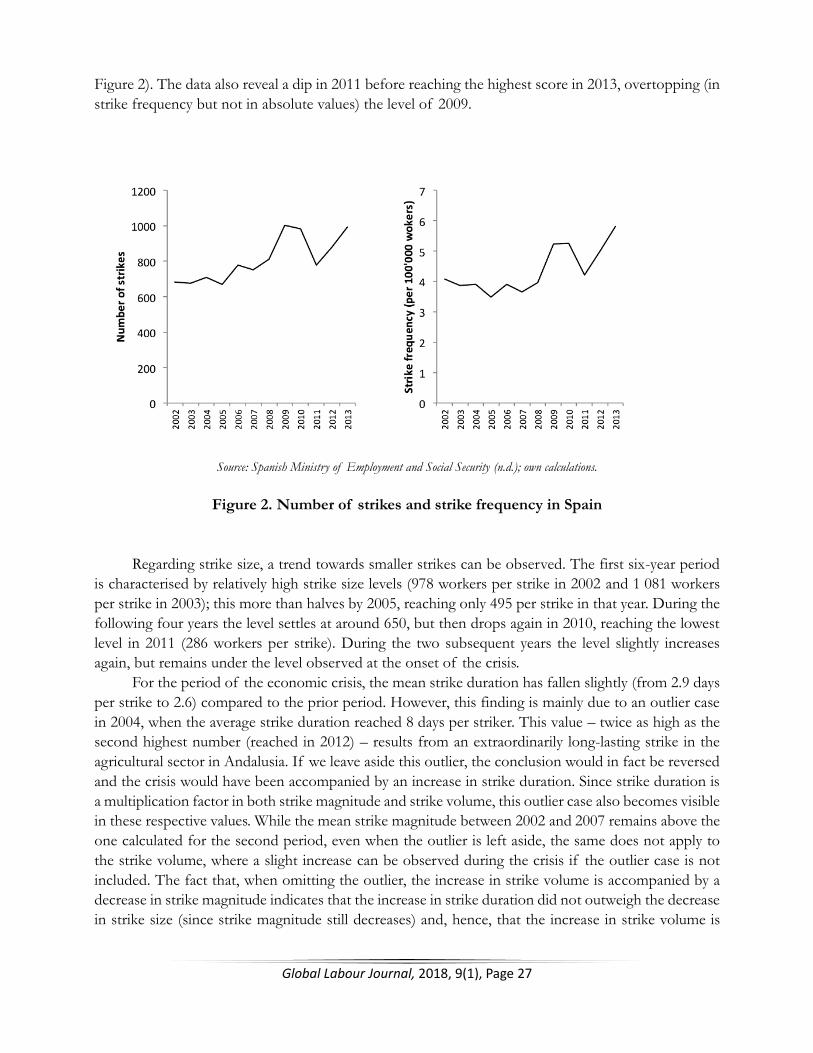
For the period of the economic crisis, the mean strike duration has fallen slightly (from 2.9 days per strike to 2.6) compared to the prior period. However, this finding is mainly due to an outlier case in 2004, when the average strike duration reached 8 days per striker. This value – twice as high as the second highest number (reached in 2012) – results from an extraordinarily long-lasting strike in the agricultural sector in Andalusia. If we leave aside this outlier, the conclusion would in fact be reversed and the crisis would have been accompanied by an increase in strike duration. Since strike duration is a multiplication factor in both strike magnitude and strike volume, this outlier case also becomes visible in these respective values. While the mean strike magnitude between 2002 and 2007 remains above the one calculated for the second period, even when the outlier is left aside, the same does not apply to the strike volume, where a slight increase can be observed during the crisis if the outlier case is not included. The fact that, when omitting the outlier, the increase in strike volume is accompanied by a decrease in strike magnitude indicates that the increase in strike duration did not outweigh the decrease in strike size (since strike magnitude still decreases) and, hence, that the increase in strike volume is
Global Labour Journal, 2018, 9(1), Page 28
mainly due to the increased strike frequency. Regarding the course of their evolution, strike magnitude and strike volume (including the outlier
case) show a similar evolution. Both reflect the outlier peak in 2004, an upwards trend between 2005 and 2008, a subsequent dip after the onset of the crisis, and again higher values for the last two years under study (see Figure 3).
Source: Spanish Ministry of Employment and Social Security; own calculations.
Figure 3. Strike magnitude and strike volume The aspects most affected by the inclusion of the four general strikes (in 2002, 2010, and two in
2012) are strike size and, to a lesser extent, strike duration. Not surprisingly, the mean strike size significantly increases. The fact that three out of four general strikes occurred during the second period under study also inverts the above-described tendency towards smaller strikes (with 2 043 workers per strike for the latter period compared to 1 713 for the prior period). Strike duration decreases since all general strikes lasted only one day (i.e. less than the average strike duration when omitting general strikes). Here again, the effect is greater in the second period where three general strikes occurred and the drop in strike duration is more substantial (from 2.8 days per strike during the first period to 1.9 during the second) than if general strikes are omitted (from 2.9 to 2.6 days per strike).
As a consequence of the above described changes in strike size and strike duration, strike magnitude and strike volume also increase and, by including three new peak years (2012, 2002 and to a lesser extent 2010), depict more accurately the actual dimensions of strike magnitudes and strike volumes between 2002 and 2013 (see Figure 3). Compared to the numbers omitting general strikes, mean strike magnitude increases by 76 per cent (reaching 2 928 working days lost per strike compared to 1 667 when omitting the general strikes). Furthermore, the gap between the periods under study becomes smaller (with 3 103 working days lost per strike during the first period and 2 752 during the second) and is actually reversed if the outlier case in 2004 is left aside. Regarding strike volume, the mean of the second period (137 working days lost per 1 000 employees) exceeds the pre-crisis period (122 working days lost per 1 000 employees) even when the 2004 outlier case is included. This points to the impact of the increase in strike size during the second period, which is mainly due to the two general strikes in 2012.
Global Labour Journal, 2018, 9(1), Page 29
First insights: lack of alignment between the theoretical models and the observed strike activity The picture presented above provides strong arguments against the Business Cycle Model. Contrary to the expected downward trend in strike activity, strike frequency significantly increased during the economic crisis. The other aspects of strikes do not show as clear-cut trends. However, if the general strikes are taken into account, both strike size and strike volume also increase, which also goes against the expectations of the model. When looking at the general picture, economic factors as specified in the Business Cycle Model do not seem to account for the observed strike activity during the recent economic crisis. One could even argue that the findings are rather in line with the theoretical counterpart – the relative deprivation hypothesis – which considers that “both short-term and persistent deprivation are significant causes of the various forms of civil strife” (Gurr, 1969: 603).
Compared with the Business Cycle Model, the Political Exchange Model seems to fit much better. The timeframe under study begins with a general strike in 2002, which represents a rupture in the “third way conservatism” (Hamann, 2005), leading to a negative turn in the political exchange between the conservative government and the unions. A period of enhanced social dialogue follows the coming into power of the social democratic party in 2004 – that is, a period of positive political exchange – which is reflected in rather low and stable strike frequency. Yet, the Great Recession changes the parameters of the social dialogue, and in 2010 the social democratic government is forced to implement cuts in public spending as well as labour market reform. These announcements are followed, in the same year, first by a general strike in the public sector and soon after by a cross-sectoral general strike. The year after, tripartite negotiations are resumed, which is accompanied by an important dip in strike magnitude and strike volume. Furthermore, these lowest levels of strike magnitude and strike volume reached in 2011 also coincide with national elections, which could indicate that the unions intentionally tempered their use of contentious tactics in support of the social democratic president seeking re-election. If general strikes are included, the highest values of strike volume are measured for 2012, the year in which the newly elected conservative government decrees labour market reform going far beyond the one implemented by the social democratic government two years earlier. As a reaction, and for the first time since the so-called transition to democracy, two nationwide general strikes are called during a single year. The political exchange having clearly turned negative again, it remains negative also in 2013, when the highest values of strike frequency can be observed.
While the Political Exchange Model is able to account for periods of relatively stable strike activity but also for sudden massive strikes, there are also evolutions which are more difficult to explain. For instance, how should one interpret the steep increase in strike frequency in 2009, which happened prior to the rupture in the positive political exchange between unions and the social democratic government? And what about the tendency towards smaller strikes (if general strikes are not included)? If strikes are directed towards the government, why should strikes become smaller in size? Since neither of the two models have yielded satisfactory explanations for the general evolutions in the shape of strikes, I will further disentangle the issue by comparing the shape of strikes among different economic sectors.
Global Labour Journal, 2018, 9(1), Page 30
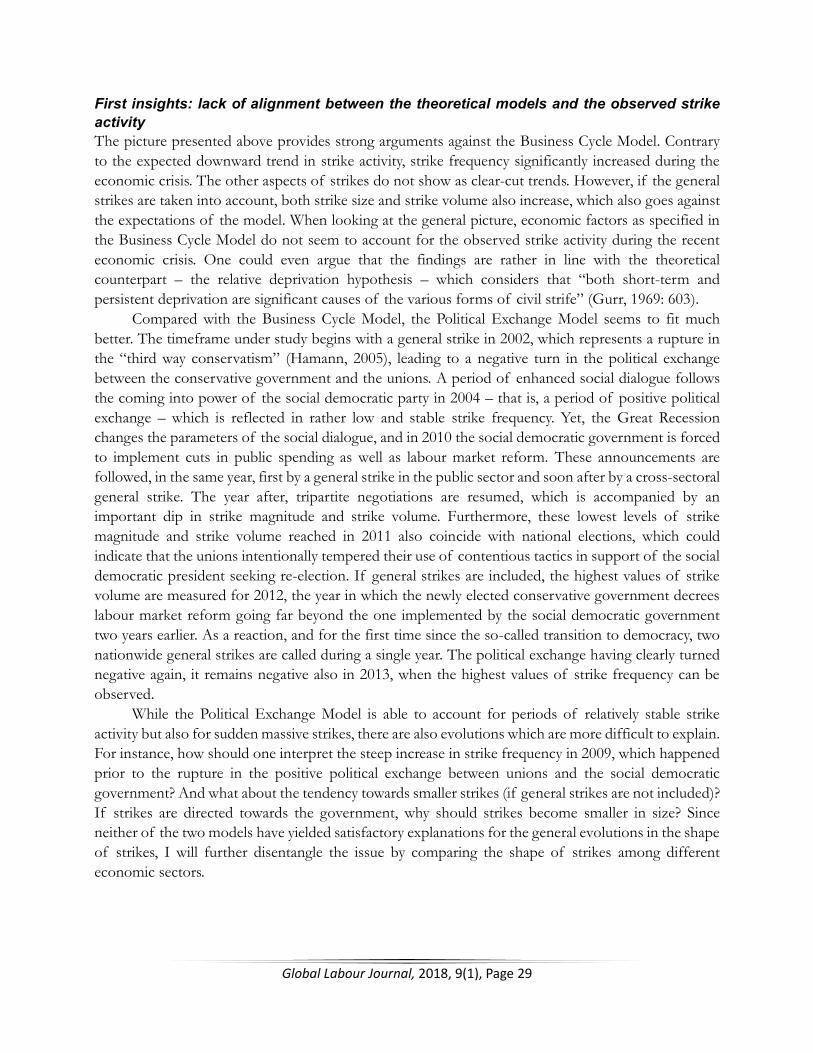
Similarities and disparities between different economic sectors A comparison of the shape of strikes in different economic sectors exhibits differences independentof the economic crisis. In line with other studies on industrial action (see Salamon, 2000), the industrial sector exhibits by far the highest strike frequency for the whole period under study (see Figure 4). In addition, a sharp increase in strike frequency can be observed since the outbreak of the crisis. The second highest values (but at a considerably lower level) are reached by the service sector. These values show a slight downward trend prior to the crisis and a slight upward trend during the crisis. The construction sector has experienced the sharpest increase in strike frequency in the aftermath of the crisis. While there was a mean strike frequency of 0.54 per 100 000 workers for the period between 2002 and 2007, this value more than quintupled in the second period under study (2.87 strikes per 100 000 workers) and has, at times, even equalled the strike frequency of the service sector. In the case of the construction sector, the sharp increase in strike frequency is the combined result of an increase in the absolute number of strikes and the aforementioned sharp decrease in employment levels. The agricultural sector exhibits an unsteady evolution at a rather low level, showing the lowest rates of strike activity of the four sectors in 2006 and 2007 and again from 2009 onwards.
Source: Spanish Ministry of Employment and Social Security (n.d.); own calculations.
Figure 4. Strike frequency in various economic sectors
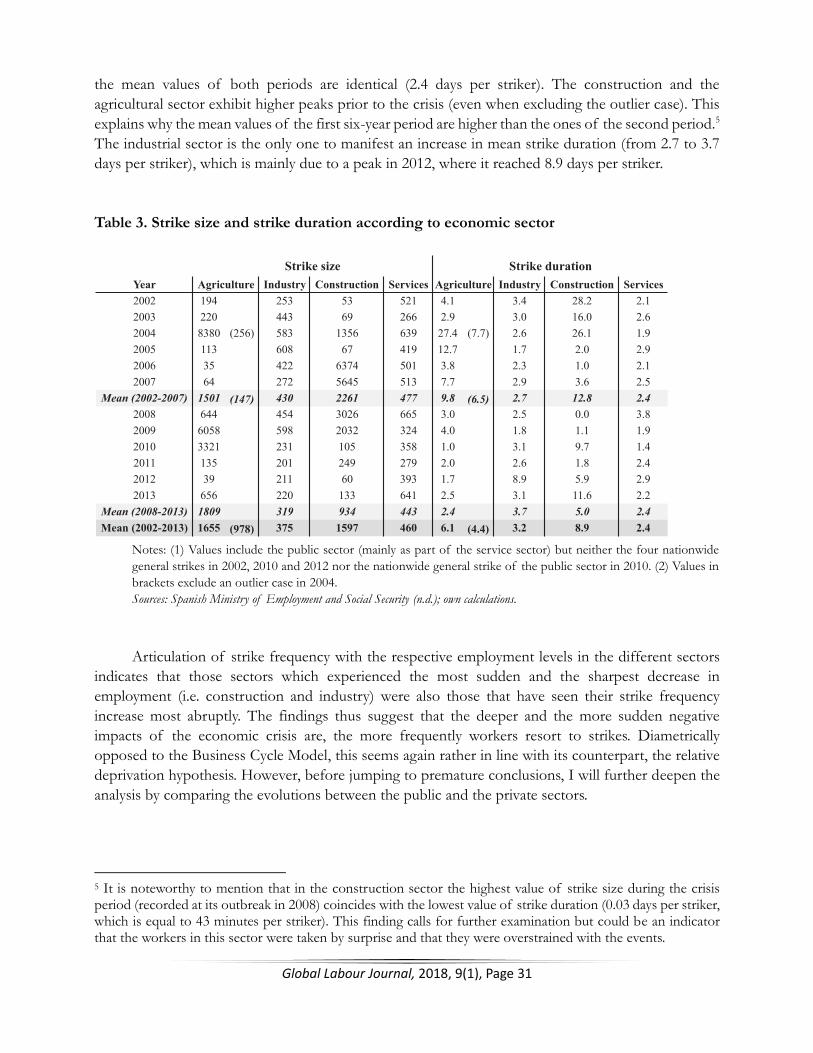
Overall, the mean strike size decreased between the two periods under study in three out of four sectors (industry, construction and services; see Table 3) – rather slightly (by 7.1 per cent) in the service sector, more substantially in the industrial sector (by 25.8 per cent), and the most in the construction sector (by 58.7 per cent). The agricultural sector is the only one to exhibit an increase in the mean strike size (by 20.5 per cent, and even more than twelve-fold if we leave aside the outlier case in 2004).
Similarly to the general figures, strike duration also exhibits an unsteady course when subdivided into economic sectors. The only sector with a relatively constant strike duration level is the service sector. Seen over the whole period of observation it varies between 1.4 and 3.8 days per striker, and
Global Labour Journal, 2018, 9(1), Page 31
the mean values of both periods are identical (2.4 days per striker). The construction and the agricultural sector exhibit higher peaks prior to the crisis (even when excluding the outlier case). This explains why the mean values of the first six-year period are higher than the ones of the second period.5 The industrial sector is the only one to manifest an increase in mean strike duration (from 2.7 to 3.7 days per striker), which is mainly due to a peak in 2012, where it reached 8.9 days per striker.
Table 3. Strike size and strike duration according to economic sector
Notes: (1) Values include the public sector (mainly as part of the service sector) but neither the four nationwide general strikes in 2002, 2010 and 2012 nor the nationwide general strike of the public sector in 2010. (2) Values in brackets exclude an outlier case in 2004. Sources: Spanish Ministry of Employment and Social Security (n.d.); own calculations. Articulation of strike frequency with the respective employment levels in the different sectors
indicates that those sectors which experienced the most sudden and the sharpest decrease in employment (i.e. construction and industry) were also those that have seen their strike frequency increase most abruptly. The findings thus suggest that the deeper and the more sudden negative impacts of the economic crisis are, the more frequently workers resort to strikes. Diametrically opposed to the Business Cycle Model, this seems again rather in line with its counterpart, the relative deprivation hypothesis. However, before jumping to premature conclusions, I will further deepen the analysis by comparing the evolutions between the public and the private sectors.
5 It is noteworthy to mention that in the construction sector the highest value of strike size during the crisis period (recorded at its outbreak in 2008) coincides with the lowest value of strike duration (0.03 days per striker, which is equal to 43 minutes per striker). This finding calls for further examination but could be an indicator that the workers in this sector were taken by surprise and that they were overstrained with the events.
Year Industry Construction Services Industry Construction Services2002 194 253 53 521 4.1 3.4 28.2 2.12003 220 443 69 266 2.9 3.0 16.0 2.62004 8380 (256) 583 1356 639 27.4 (7.7) 2.6 26.1 1.92005 113 608 67 419 12.7 1.7 2.0 2.92006 35 422 6374 501 3.8 2.3 1.0 2.12007 64 272 5645 513 7.7 2.9 3.6 2.5
Mean (2002-2007) 1501 (147) 430 2261 477 9.8 (6.5) 2.7 12.8 2.42008 644 454 3026 665 3.0 2.5 0.0 3.82009 6058 598 2032 324 4.0 1.8 1.1 1.92010 3321 231 105 358 1.0 3.1 9.7 1.42011 135 201 249 279 2.0 2.6 1.8 2.42012 39 211 60 393 1.7 8.9 5.9 2.92013 656 220 133 641 2.5 3.1 11.6 2.2
Mean (2008-2013) 1809 319 934 443 2.4 3.7 5.0 2.4Mean (2002-2013) 1655 (978) 375 1597 460 6.1 (4.4) 3.2 8.9 2.4
Strike durationAgriculture
Strike sizeAgriculture
Global Labour Journal, 2018, 9(1), Page 32
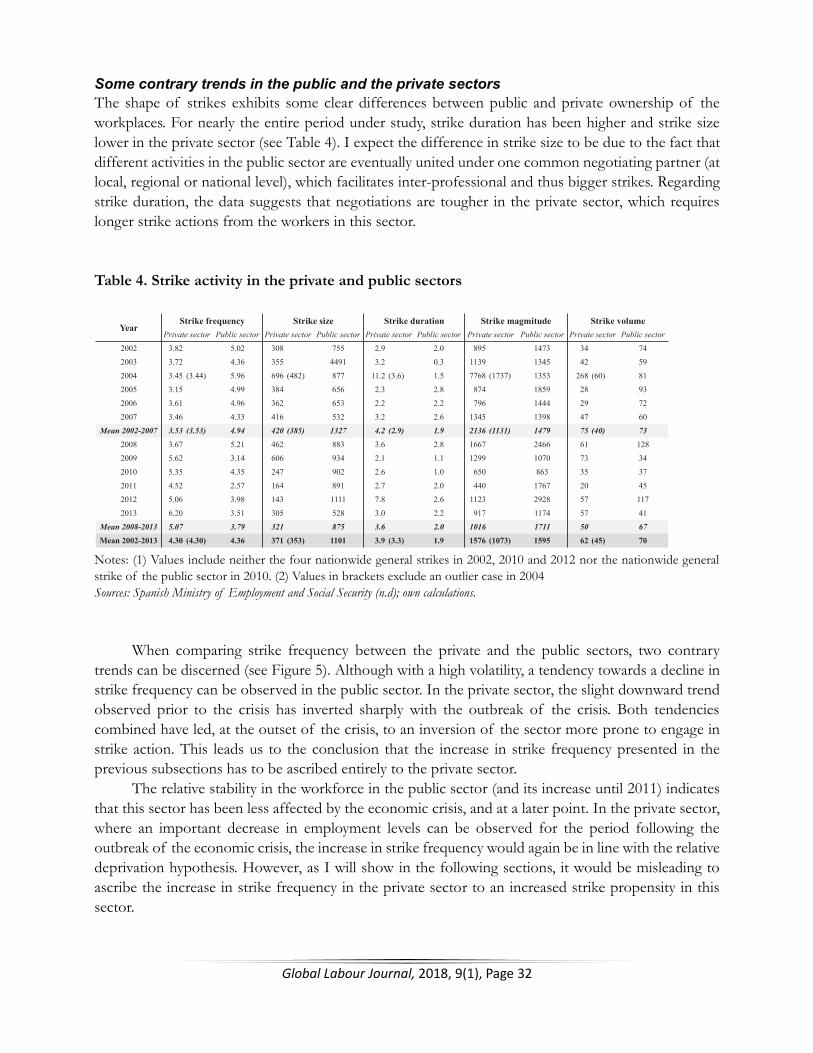
Some contrary trends in the public and the private sectors The shape of strikes exhibits some clear differences between public and private ownership of the workplaces. For nearly the entire period under study, strike duration has been higher and strike size lower in the private sector (see Table 4). I expect the difference in strike size to be due to the fact that different activities in the public sector are eventually united under one common negotiating partner (at local, regional or national level), which facilitates inter-professional and thus bigger strikes. Regarding strike duration, the data suggests that negotiations are tougher in the private sector, which requires longer strike actions from the workers in this sector. Table 4. Strike activity in the private and public sectors
Notes: (1) Values include neither the four nationwide general strikes in 2002, 2010 and 2012 nor the nationwide general strike of the public sector in 2010. (2) Values in brackets exclude an outlier case in 2004 Sources: Spanish Ministry of Employment and Social Security (n.d); own calculations.
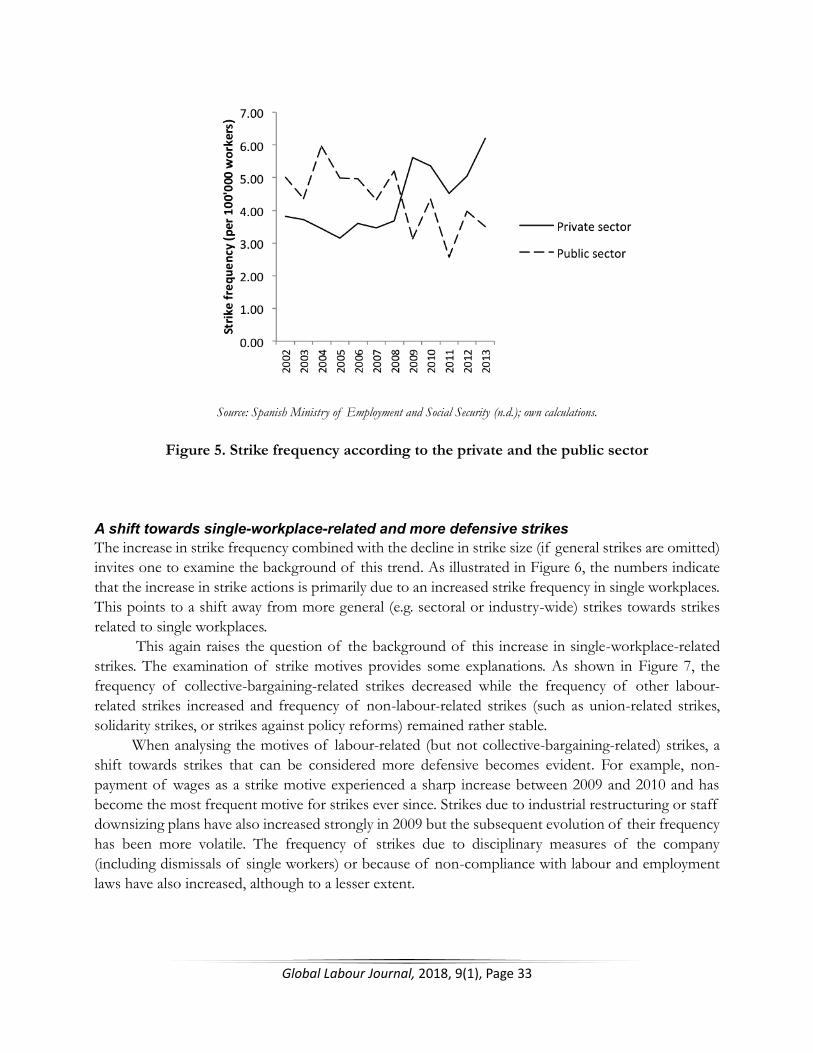
When comparing strike frequency between the private and the public sectors, two contrary
trends can be discerned (see Figure 5). Although with a high volatility, a tendency towards a decline in strike frequency can be observed in the public sector. In the private sector, the slight downward trend observed prior to the crisis has inverted sharply with the outbreak of the crisis. Both tendencies combined have led, at the outset of the crisis, to an inversion of the sector more prone to engage in strike action. This leads us to the conclusion that the increase in strike frequency presented in the previous subsections has to be ascribed entirely to the private sector.
The relative stability in the workforce in the public sector (and its increase until 2011) indicates that this sector has been less affected by the economic crisis, and at a later point. In the private sector, where an important decrease in employment levels can be observed for the period following the outbreak of the economic crisis, the increase in strike frequency would again be in line with the relative deprivation hypothesis. However, as I will show in the following sections, it would be misleading to ascribe the increase in strike frequency in the private sector to an increased strike propensity in this sector.
Public sector Public sector Public sector Public sector Public sector
2002 3.82 5.02 308 755 2.9 2.0 895 1473 34 742003 3.72 4.36 355 4491 3.2 0.3 1139 1345 42 592004 3.45 (3.44) 5.96 696 (482) 877 11.2 (3.6) 1.5 7768 (1737) 1353 268 (60) 812005 3.15 4.99 384 656 2.3 2.8 874 1859 28 932006 3.61 4.96 362 653 2.2 2.2 796 1444 29 722007 3.46 4.33 416 532 3.2 2.6 1345 1398 47 60
Mean 2002-2007 3.53 (3.53) 4.94 420 (385) 1327 4.2 (2.9) 1.9 2136 (1131) 1479 75 (40) 732008 3.67 5.21 462 883 3.6 2.8 1667 2466 61 1282009 5.62 3.14 606 934 2.1 1.1 1299 1070 73 342010 5.35 4.35 247 902 2.6 1.0 650 863 35 372011 4.52 2.57 164 891 2.7 2.0 440 1767 20 452012 5.06 3.98 143 1111 7.8 2.6 1123 2928 57 1172013 6.20 3.51 305 528 3.0 2.2 917 1174 57 41
Mean 2008-2013 5.07 3.79 321 875 3.6 2.0 1016 1711 50 67Mean 2002-2013 4.30 (4.30) 4.36 371 (353) 1101 3.9 (3.3) 1.9 1576 (1073) 1595 62 (45) 70
Private sectorYear
Private sector Private sector Private sector Private sectorStrike frequency Strike size Strike duration Strike magmitude Strike volume
Global Labour Journal, 2018, 9(1), Page 33
Source: Spanish Ministry of Employment and Social Security (n.d.); own calculations.
Figure 5. Strike frequency according to the private and the public sector
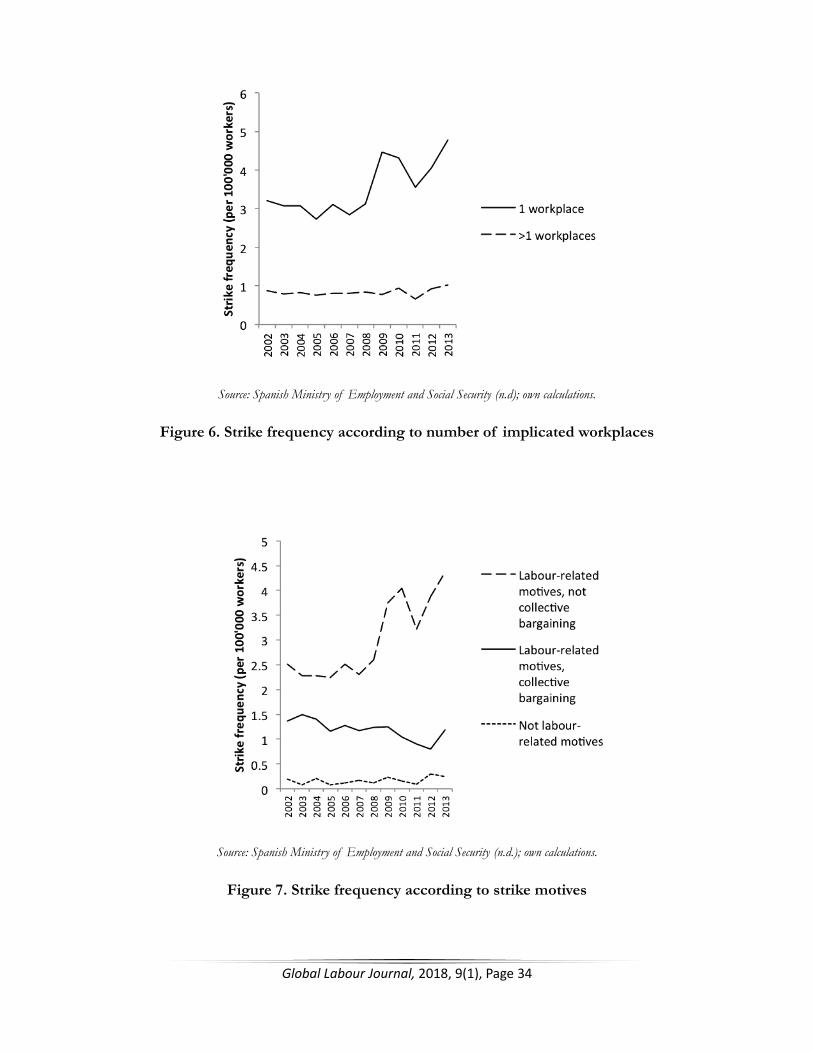
A shift towards single-workplace-related and more defensive strikes The increase in strike frequency combined with the decline in strike size (if general strikes are omitted) invites one to examine the background of this trend. As illustrated in Figure 6, the numbers indicate that the increase in strike actions is primarily due to an increased strike frequency in single workplaces. This points to a shift away from more general (e.g. sectoral or industry-wide) strikes towards strikes related to single workplaces.
This again raises the question of the background of this increase in single-workplace-related strikes. The examination of strike motives provides some explanations. As shown in Figure 7, the frequency of collective-bargaining-related strikes decreased while the frequency of other labour-related strikes increased and frequency of non-labour-related strikes (such as union-related strikes, solidarity strikes, or strikes against policy reforms) remained rather stable.
When analysing the motives of labour-related (but not collective-bargaining-related) strikes, a shift towards strikes that can be considered more defensive becomes evident. For example, non-payment of wages as a strike motive experienced a sharp increase between 2009 and 2010 and has become the most frequent motive for strikes ever since. Strikes due to industrial restructuring or staff downsizing plans have also increased strongly in 2009 but the subsequent evolution of their frequency has been more volatile. The frequency of strikes due to disciplinary measures of the company (including dismissals of single workers) or because of non-compliance with labour and employment laws have also increased, although to a lesser extent.
Global Labour Journal, 2018, 9(1), Page 34
Source: Spanish Ministry of Employment and Social Security (n.d); own calculations.
Figure 6. Strike frequency according to number of implicated workplaces
Source: Spanish Ministry of Employment and Social Security (n.d.); own calculations.
Figure 7. Strike frequency according to strike motives
Global Labour Journal, 2018, 9(1), Page 35
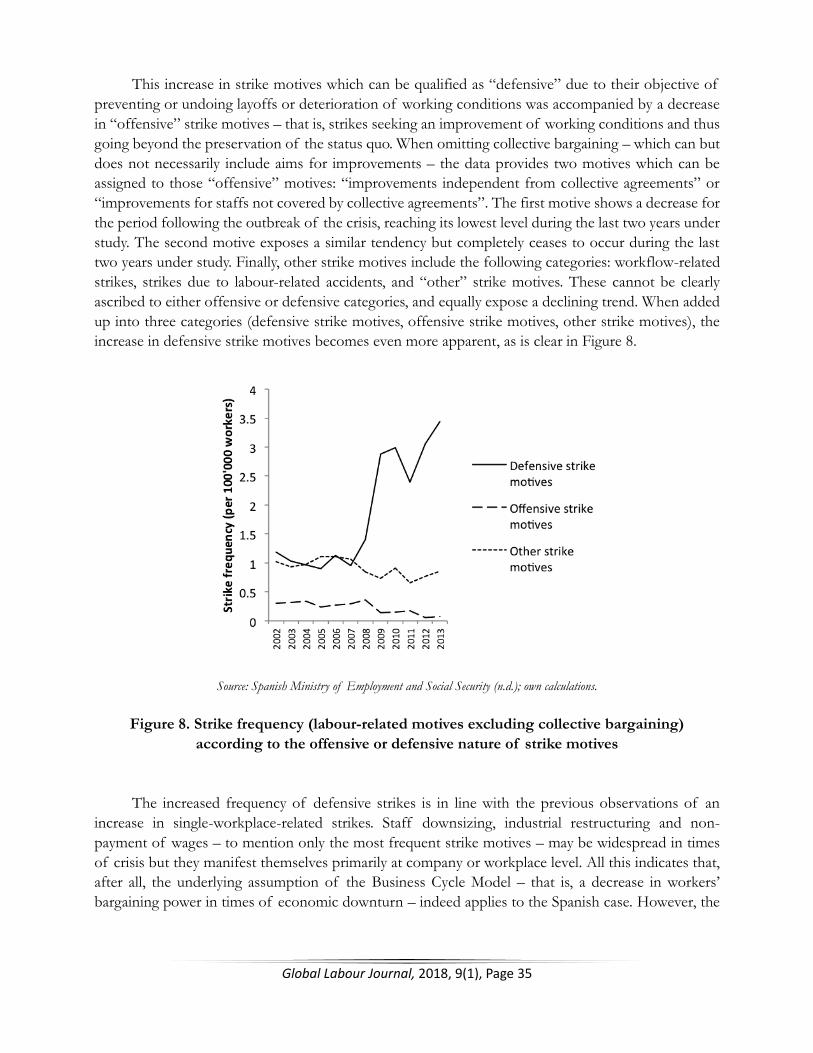
This increase in strike motives which can be qualified as “defensive” due to their objective of preventing or undoing layoffs or deterioration of working conditions was accompanied by a decrease in “offensive” strike motives – that is, strikes seeking an improvement of working conditions and thus going beyond the preservation of the status quo. When omitting collective bargaining – which can but does not necessarily include aims for improvements – the data provides two motives which can be assigned to those “offensive” motives: “improvements independent from collective agreements” or “improvements for staffs not covered by collective agreements”. The first motive shows a decrease for the period following the outbreak of the crisis, reaching its lowest level during the last two years under study. The second motive exposes a similar tendency but completely ceases to occur during the last two years under study. Finally, other strike motives include the following categories: workflow-related strikes, strikes due to labour-related accidents, and “other” strike motives. These cannot be clearly ascribed to either offensive or defensive categories, and equally expose a declining trend. When added up into three categories (defensive strike motives, offensive strike motives, other strike motives), the increase in defensive strike motives becomes even more apparent, as is clear in Figure 8.
Source: Spanish Ministry of Employment and Social Security (n.d.); own calculations.
Figure 8. Strike frequency (labour-related motives excluding collective bargaining) according to the offensive or defensive nature of strike motives
The increased frequency of defensive strikes is in line with the previous observations of an increase in single-workplace-related strikes. Staff downsizing, industrial restructuring and non-payment of wages – to mention only the most frequent strike motives – may be widespread in times of crisis but they manifest themselves primarily at company or workplace level. All this indicates that, after all, the underlying assumption of the Business Cycle Model – that is, a decrease in workers’ bargaining power in times of economic downturn – indeed applies to the Spanish case. However, the
Global Labour Journal, 2018, 9(1), Page 36
decreasing propensity of the workers to go on strike was overcompensated by an increasing number of circumstances in which defensive strike actions became a means of last resort. Conclusion This article has aimed to provide a better understanding of the evolution of strike activity in Spain between 2002 and 2013. The presented analysis is based on a descriptive evaluation of data provided by the Spanish Ministry of Employment and Social Security, which served as a basis in order to calculate variables able to reflect the “shape of strikes” (Shorter and Tilly, 1974). This made possible an analysis of different aspects of strikes, which would not have become visible through the examination of the absolute numbers provided by the Spanish Ministry of Employment and Social Security.
As shown in the descriptive part of the paper, the crisis was accompanied by a manifest increase in strike frequency and by three nationwide general strikes in 2010 and 2012. However, if the general strikes are excluded, the crisis is accompanied by a (less distinct) decrease in strike size after 2009. The sectoral analysis equally presents an increase in mean strike frequency with the outbreak of the economic crisis in all four economic sectors (agriculture, industry, construction and services). The fact that the sharpest increases in strike frequency were recorded in the sectors most hit by the economic crisis (i.e. construction and industry) suggests a positive correlation between the intensity of job destruction and strike frequency. This hypothesis is supported by a similar but much weaker tendency observed in the service sector, where the decrease in employment levels was considerably lower. Regarding strike size, a similar pattern could be discerned for these three sectors: all show a decrease in strike size during the second period under study, more pronounced in the construction and in the industrial sectors and less so in the service sector. This suggests that the increased number of mass layoffs, non-payment of wages and other deterioration of working conditions provided an increased number of motives for strikes, although on a smaller scale. This finding is supported by the identified increase in strikes in single workplaces. Whereas employment levels negatively correlate with strike frequency and strike size in the three above-mentioned sectors, other variables are needed in order to explain the evolution in the agricultural sector, where no particular crisis-related pattern could be observed.
As the shift towards single-workplace-related strikes already indicates, it would be erroneous to conclude that the increased strike frequency results from an increased propensity for strike action. In fact, the inversion that occurred between the private and public sectors regarding their respective strike frequency suggests rather the opposite: in the public sector where, during the timeframe under study, the impact of the economic crisis has been considerably weaker than in the private sector, a decreasing strike frequency could be observed. It can be assumed that the economic crisis caused uncertainty among the workers in the public sector, which led them to moderate their claims. The opposite trend was observed in the private sector; rather than accounting for an increasing propensity to go on strikes, this suggests that an actual decrease in workers’ bargaining power was overcompensated by a growing number of cases in which the recourse to strike action appeared as a means of last resort (e.g. mass layoffs or non-payment of wages).
The analysis presented here shows that, alone, neither the Business Cycle Model nor the Political Exchange Model is able to account for the evolution in strike activity between 2002 and 2013 in Spain.

Global Labour Journal, 2018, 9(1), Page 37
As became clear, the Political Exchange Model proves to be useful for understanding rather stable periods such as the one preceding the economic crisis, the peaks (i.e. the occurrence of large-scale, nationwide general strikes), but also of dips, such as the one observed in both strike frequency and strike volume in 2011. It seems probable that the unions indeed limited their strikes to the minimum in order to relieve pressure on the social democratic party in power, whose prime minister was running for re-election. Yet, that same model proves less suitable for explaining the evolutions at a smaller scale. The Business Cycle Model, for its part, is unable to explain the peaks (i.e. the general strikes) but also sudden dips. What’s more, the increased strike frequency during the crisis manifestly contradicts the model, which expects periods of economic downturn to weaken workers’ bargaining power and thus to lead a decreasing number of strikes. However, while my work contradicts the expected result of the model, the shift towards single-workplace-related and so-called “defensive” strikes strongly suggests that the shape but also the character of strikes were much affected by the weakened bargaining position of the workers.
The usefulness of combining the two theoretical models points at the weaknesses of previous works on the Spanish case, which are mainly descriptive (Gil and Hernández, 2014; Lacalle, 2015;) or focus primarily on political aspects of strikes (Luque, 2012b), thereby underestimating economic factors which have proven to affect strike activity in times of economic crisis. Yet, the analysis also has its weaknesses. First, the dichotomic division into a period preceding the crisis (2002–2007) and another beginning at its outbreak (2008–2013) might be oversimplified and would need more specification. A more precise image of the evolution of the crisis would surely facilitate a better understanding of the relationship between the course of the crisis and strike activity. Likewise, state interventions, policy changes or their respective announcement (Edelman, 1985) should be given greater attention, since particularly (announcements of) policy changes affecting the bargaining framework are likely to affect strike activity. Second, other theoretical approaches (e.g. Marxist, institutional theories, or the resource mobilisation approach) might have provided further pieces of the “puzzle of strikes” (Franzosi, 1995).
Finally, an argument should be made for adopting a broader perspective on industrial conflict. Relating strikes to other forms of resistance (e.g. demonstrations, petitions, sit-ins, etc.) would provide a better understanding of the interconnectedness of these different political phenomena. In fact, recent research indicates that scholars working on industrial conflict would be well advised to enlarge their scope to forms of resistance other than strikes (Béroud et al., 2008; Groux and Pernot, 2008; Giraud, 2009). These scholars have found that industrial conflict can actually increase even in periods of declining strike activity, when tactics other than strikes are taken into account. While posing many methodological challenges, such perspective would take us a good way towards a more complex consideration of social contention – notably in times of economic crisis.
REFERENCES
Adam, G. and J.-D. Reynaud (1978) Conflits du travail et changement social. Paris: PUF.
Ancelovici, M., P. Dufour and H. Nez (eds.) (2016) Street Politics in the Age of Austerity: From the Indignados to Occupy. Amsterdam: Amsterdam University Press.
Bartels, L. and N. Bermeo (eds.) (2014) Mass Politics in Tough Times: Opinions, Votes and Protest in the Great Recession. Oxford: Oxford University Press.
Global Labour Journal, 2018, 9(1), Page 38
Béroud, S., J.-M. Denis, G. Desage, B. Giraud and J. Pélisse (2008) La lutte continue? Les conflits du travail dans la France contemporaine. Bellecombe-en-Bauges: Éditions le Croquant.
Della Porta, D., M. Andretta, T. Fernandes, E. Romanos, F.P. O’Connor and M. Vogiatzoglou (2017) Late Neoliberalism and its Discontents in the Economic Crisis: Comparing Social Movements in the European Periphery. Cham: Springer.
Della Porta, D. and A. Mattoni (2014) Spreading Protest: Social Movements in Times of Crisis. Colchester: ECPR Press.
Edelman, M. (1985) The Symbolic Uses of Politics. Champaign: University of Illinois Press.
Eurostat (n.d.) Labour Force Survey. Available at http://ec.europa.eu/eurostat/web/lfs/data/database [accessed 16 January 2017].
Franzosi, R. (1995) The Puzzle of Strikes. Cambridge: Cambridge University Press.
Gallas, A. and J. Nowak (2016) Mass Strikes in the Global Crisis. Workers of the World, 1(8): 6–15.
Gallas, A., J. Nowak and F. Wilde (eds.) (2012) Politische Streiks im Europa der Krise. Hamburg: VSA.
Gil, J. and R. Hernández (2014) La conflictividad laboral en tiempos de crisis económica. Un análisis comparado de las huelgas en el estado Español durante los sexenios 2002–2007 y 2008–2013. Estudios, 4: 49–68.
Giraud, B. (2009) Des conflits du travail à la sociologie des mobilisations: Les apports d’un décloisonnement empirique et théorique. Politix, 22: 13–29.
González, S. and D. Luque (2014) ¿Adiós al corporatismo en España? Pactos sociales en la crisis económica. Revista Española de Investigaciones Sociológicas, 148: 79–101.
Graeber, D. (2012) Inside Occupy. Frankfurt am Main and New York: Campus Verlag.
Groux, G. and J.-M. Pernot (2008) La grêve. Paris: Presses de Sciences Po.
Gurr, T.R. (1969) A Comparative Study of Civil Strife. In Violence in America: Historical and Comparative Perspectives, edited by D. Graham and T.R. Gurr. New York: FA Praeger.
Hamann, K. (2005) Third Way Conservatism? The Popular Party and Labour Relations in Spain. International Journal of Iberian Studies, 18(2): 67–82.
Hernández, E. and H. Kriesi (2016) The Electoral Consequences of the Financial and Economic Crisis in Europe. European Journal of Political Research, 55(2): 203–224.
Hibbs, D.A. (1978) On the Political Economy of Long-Run Trends in Strike Activity. British Journal of Political Science, 8(2): 153–175.
Hyman, R. (1975) Industrial Relations. A Marxist Introduction. London: Macmillan.
International Labour Organization (ILO) (1993) Resolution concerning Statistics of Strikes, Lockouts and Other Action due to Labour Disputes. Available at http://www.ilo.org/global/statistics-and-databases/standards-and-guidelines/resolutions-adopted-by-international-conferences-of-labour-statisticians/WCMS_087544/lang--en/index.htm [accessed 16 January 2017].
International Labour Organization (ILO) (n.d.) ILOSTAT – Public Sector Employment. Available at http://www.ilo.org/ilostat [accessed 6 December 2016].
International Labour Organization (ILO) (n.d.) LABORSTA – Public Sector Employment. Available at http://laborsta.ilo.org [accessed 6 December 2016].
Global Labour Journal, 2018, 9(1), Page 39
Jackson, D., H.A. Turner and F. Wilkinson (1972) Do Trade Unions Cause Inflation? Two Studies, with a Theoretical Introduction and Policy Conclusion. Cambridge: Cambridge University Press.
Korpi, W. and M. Shalev (1979) Strikes, Industrial Relations and Class Conflict in Capitalist Societies. British Journal of Sociology, 30(2): 164–187.
Lacalle, J.D. (2015) Conflictividad y Crisis: España 2008–2013. Barcelona: El Viejo Topo.
Luque, D. (2012a) Huelgas e intercambio político en España. Revista Internacional de Sociología, 70(3): 561–585.
Luque, D. (2012b) Huelgas y crisis económica (y del intercambio politico). Inguruak – Revista vasxa de sociología y de ciencia política. 51: 95–113.
Luque, D. (2013) La forma de las huelgas en España, 1905–2010. Política y Sociedad, 50(1): 235–268.
Luque, D., B. Cueto and F. Mato (2008) Un análisis regional de la actividad huelgística en España. Revista Española de Investigaciones Sociológicas, 124: 107–140.
Luque, D. and S. González (2016) El ciclo de protestas anti-austeridad en España (2010–2014): Sindicatos, coaliciones y estrategias. Paper presented at the XII Spanish Congress of Sociology, Gijón, June 30 – July 2.
Nowak, J. and A. Gallas (2014) Mass Strikes against Austerity in Western Europe – A Strategic Assessment, Global Labour Journal, 5(3): 306–321.
Organisation for Economic Cooperation and Development (OECD) (n.d.) Short-term Labour Market Statistics. Available at https://stats.oecd.org [accessed 16 January 2017].
Pizzorno, A. (1978) Political Exchange and Collective Identity in Industrial Conflict. In The Resurgence of Class Conflict in Western Europe Since 1968, Volume 2: Comparative Analyses, edited by C. Crouch and A. Pizzorno. New York: Holmes & Meier.
Rees, A. (1952) Industrial Conflict and Business Fluctuations. Journal of Political Economy, 60(5): 371–382.
Rist, C. (1907) La progression des grèves en France et sa valeur symptomatique. Revue d'Economie politique, 21: 161–193.
Romanos, E. (2016) From Tahrir to Puerta del Sol to Wall Street: The Transnational Diffusion of Social Movements in Comparative Perspective. Revista Española de Investigaciones Sociológicas, 154: 103–118.
Salamon, M. (2000) Industrial Relations: Theory and Practice. Essex: Pearson Education Limited.
Shorter, E. and C. Tilly (1971) The Shape of Strikes in France, 1830–1960. Comparative Studies in Society and History, 13(1): 60–86.
Shorter, E. and C. Tilly (1974) Strikes in France 1830–1968. Cambridge: Cambridge University Press.
Silver, B. (2003) Forces of Labor: Workers’ Movements and Globalization since 1870. Cambridge and New York: Cambridge University Press.
Skeels, J. (1971) Measures of United States Strike Activity. Industrial and Labor Relations Review, 24(4): 515–525.
Soskice, D. (1978) Strike Waves and Wage Explosions, 1968–1970: An Economic Interpretation. In The Resurgence of Class Conflict in Western Europe Since 1968, Volume 2: Comparative Analyses, edited by C. Crouch and A. Pizzorno. New York: Holmes & Meier.
Spanish Ministry of Employment and Social Security (n.d.) Estadística de huelgas y cierres patronales. Available at http://www.empleo.gob.es/estadisticas/hue/welcome.htm [accessed 16 January 2017].
Global Labour Journal, 2018, 9(1), Page 40
Tixier, P.-E. (2007) Les mutations de la négotiation collective. Le cas de la France. Négotiations, 8: 103–119.
Whiteley, P. (2016) What Explains Electoral Responses to the “Great Recession” in Europe? Asian Journal of Comparative Politics, 1(1): 62–76.
BIOGRAPHICAL NOTE
NICHOLAS POHL is a PhD candidate in political sociology at the University of Lausanne (IEPHI-CRAPUL). His thesis deals with industrial conflict during the Great Recession in Spain, and aims at bringing labour back into social movement studies. He is co-supervised by Professor Olivier Fillieule, University of Lausanne, and Professor Christine Walley, MIT Anthropology. [Email: [email protected]]