Embed Size (px)
DESCRIPTION
Materials and the Environmen t Part 1 – Major Contributors to Increasing Consumption: Population and Economic Growth (Most recent update April 1, 2013). Population Growth. World Population 1850-1950. Billions. Source: U.S. Census Bureau, International Programs Center, 2013. - PowerPoint PPT Presentation
Citation preview
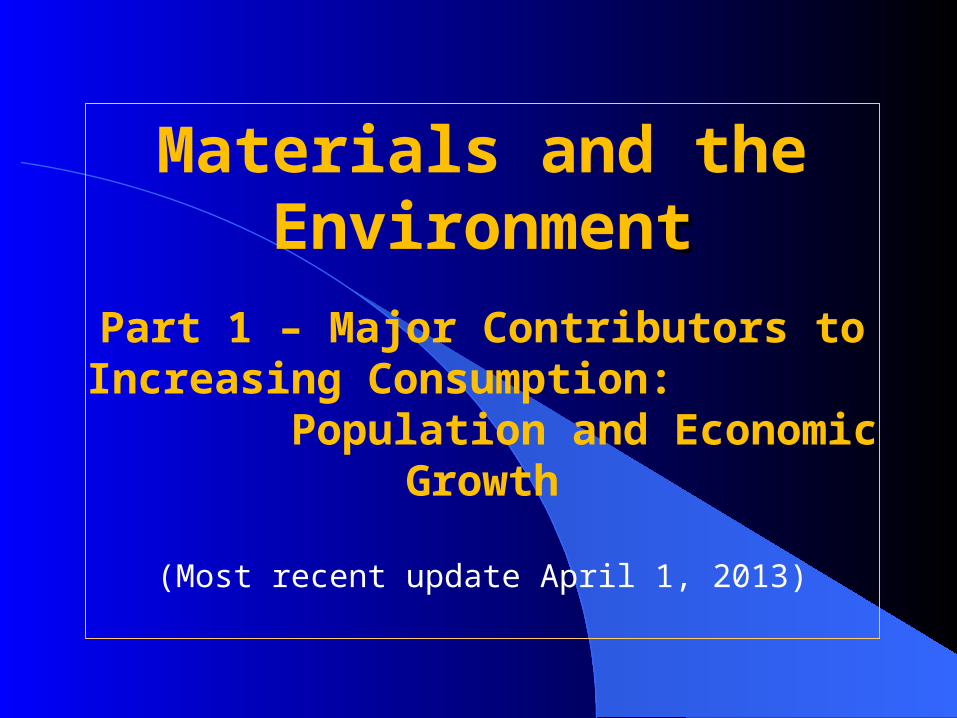
Materials and the Environmentt
Part 1 – Major Contributors to Increasing Consumption:
Population and Economic Growth
(Most recent update April 1, 2013)
Population Growth
Population Growth
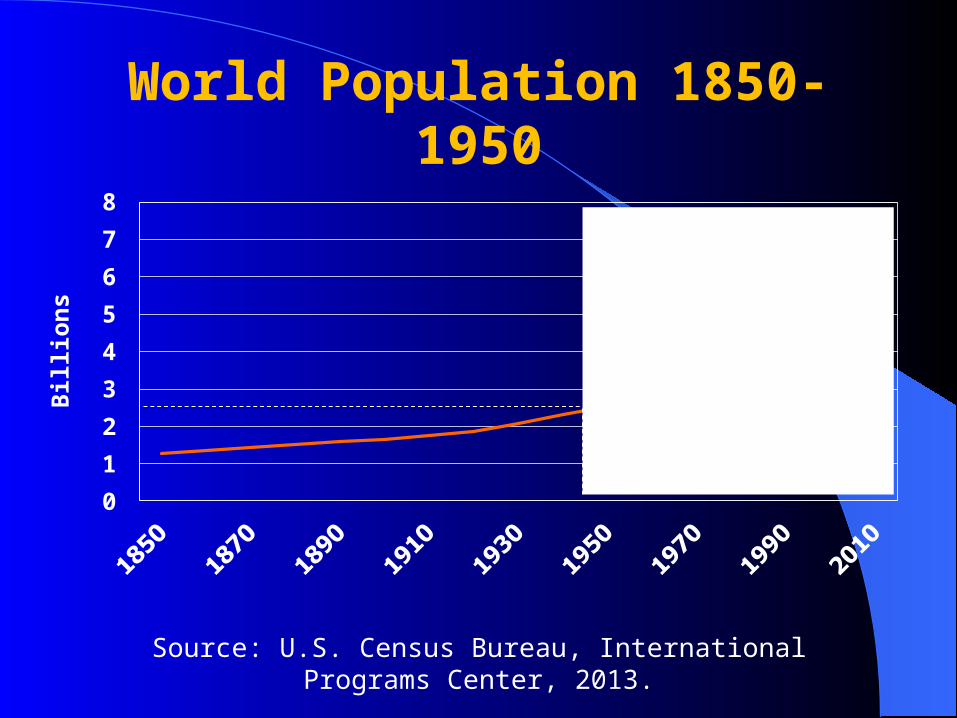
World Population 1850-1950
0
1
2
3
4
5
6
7
8
Source: U.S. Census Bureau, International Programs Center, 2013.
Billion
s
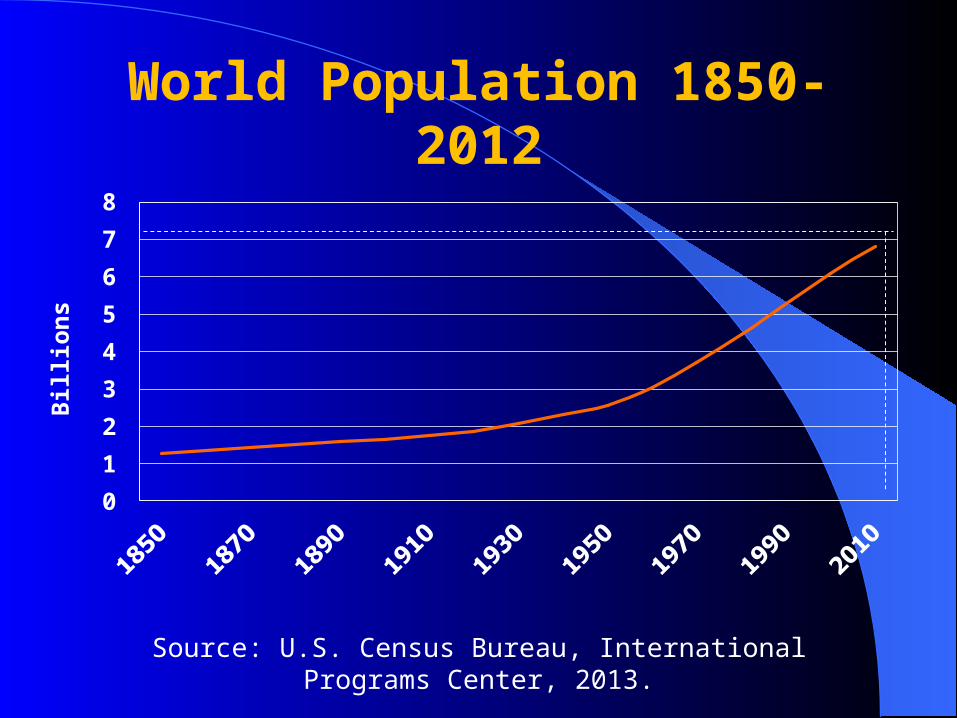
World Population 1850-2012
0
1
2
3
4
5
6
7
8
Source: U.S. Census Bureau, International Programs Center, 2013.
Billion
s
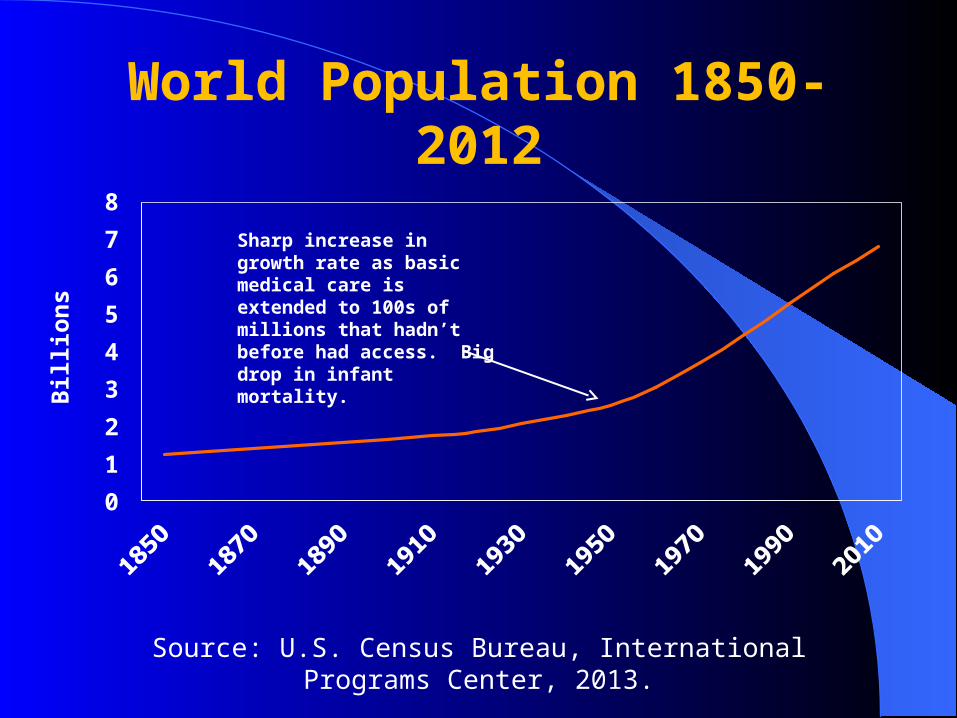
World Population 1850-2012
0
1
2
3
4
5
6
7
8
Source: U.S. Census Bureau, International Programs Center, 2013.
Billion
s
Sharp increase in growth rate as basic medical care is extended to 100s of millions that hadn’t before had access. Big drop in infant mortality.
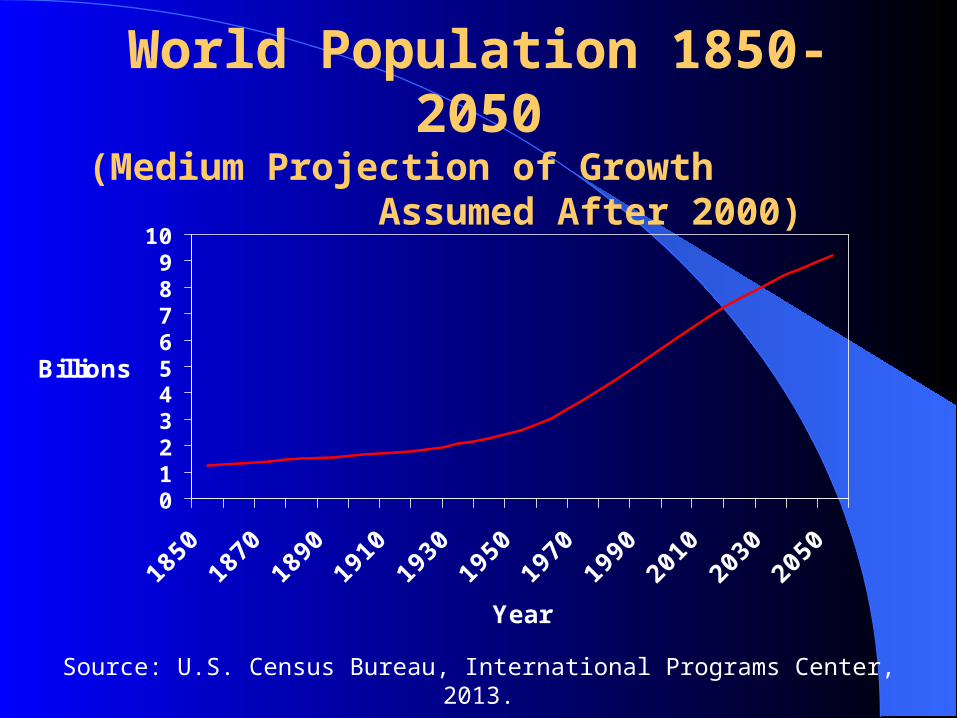
World Population 1850-2050
(Medium Projection of Growth Assumed After 2000)
0123456789
10
Year
Billions
Source: U.S. Census Bureau, International Programs Center, 2013.
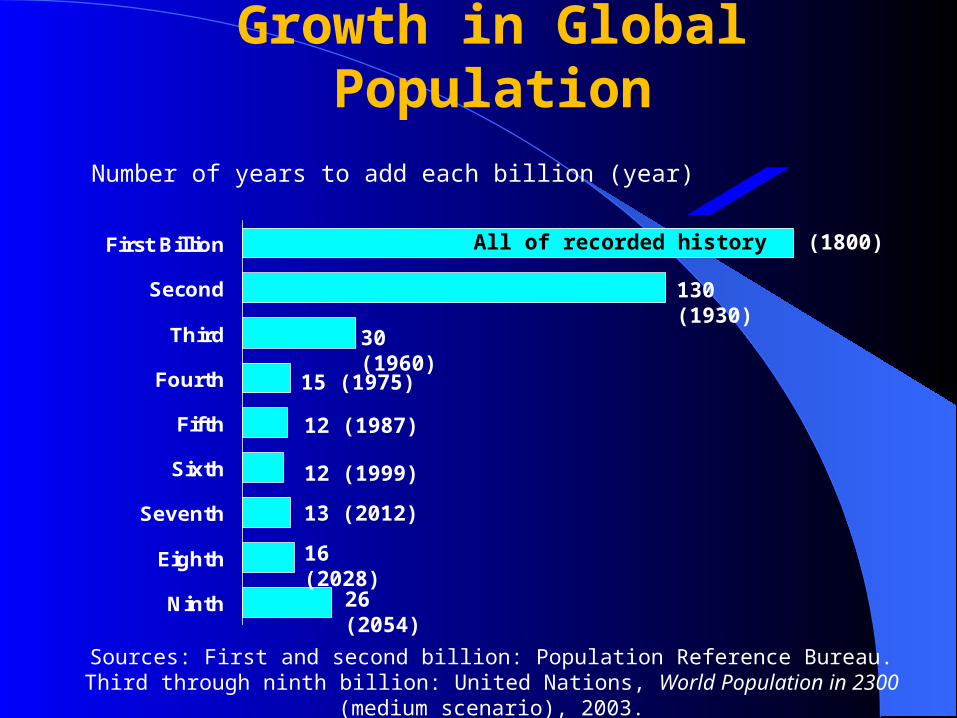
Number of years to add each billion (year)
Ninth
Eighth
Seventh
Sixth
Fifth
Fourth
Third
Second
First Billion (1800)
130 (1930)
30 (1960)
15 (1975)
12 (1987)
12 (1999)
13 (2012)
16 (2028)
26 (2054)
Growth in Global Population
Sources: First and second billion: Population Reference Bureau. Third through ninth billion: United Nations, World Population in 2300 (medium scenario),
2003.
All of recorded history
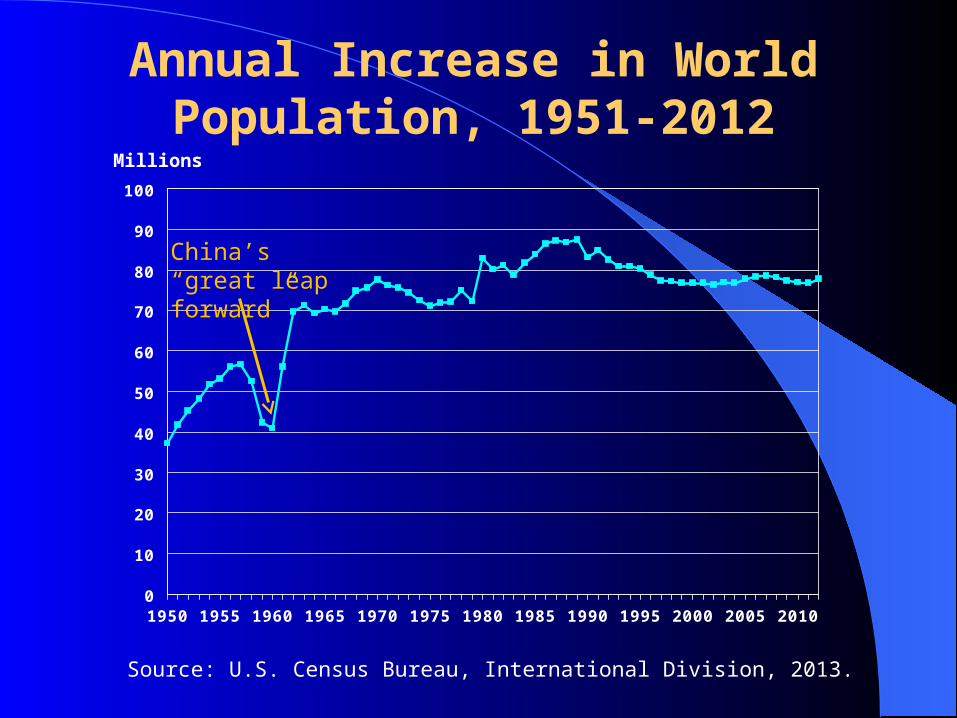
Millions
Annual Increase in World Population, 1951-2012
0
10
20
30
40
50
60
70
80
90
100
1950 1955 1960 1965 1970 1975 1980 1985 1990 1995 2000 2005 2010
Source: U.S. Census Bureau, International Division, 2013.
China’s “great leap forward”
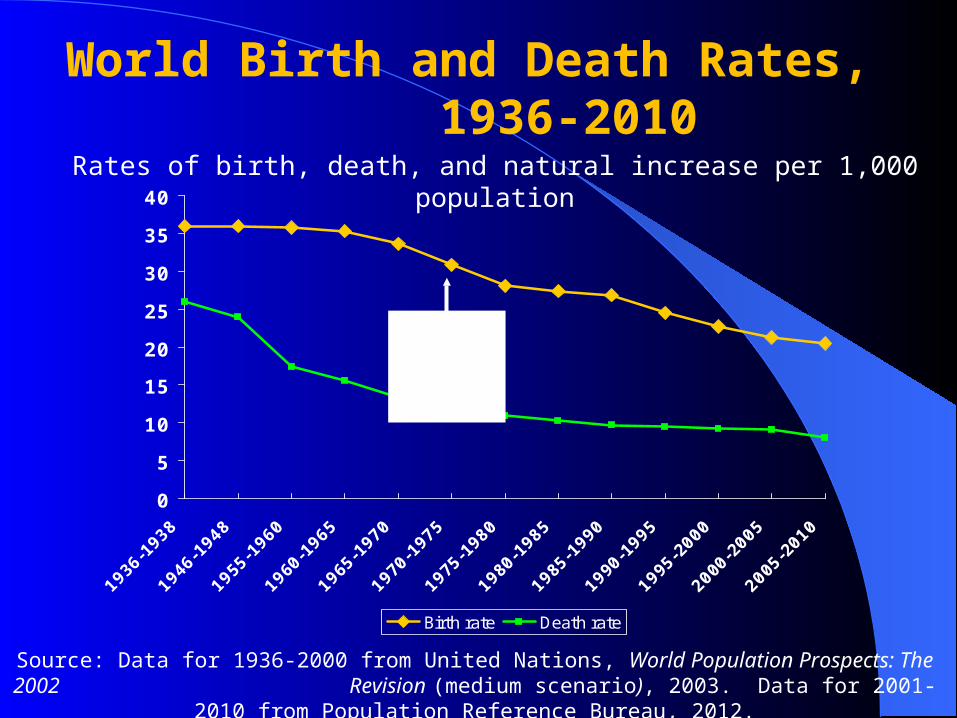
Rates of birth, death, and natural increase per 1,000 population
0
5
10
15
20
25
30
35
40
Birth rate Death rate
Natural Increas
e
World Birth and Death Rates, 1936-2010
Source: Data for 1936-2000 from United Nations, World Population Prospects: The 2002 Revision (medium scenario), 2003. Data for
2001-2010 from Population Reference Bureau, 2012.
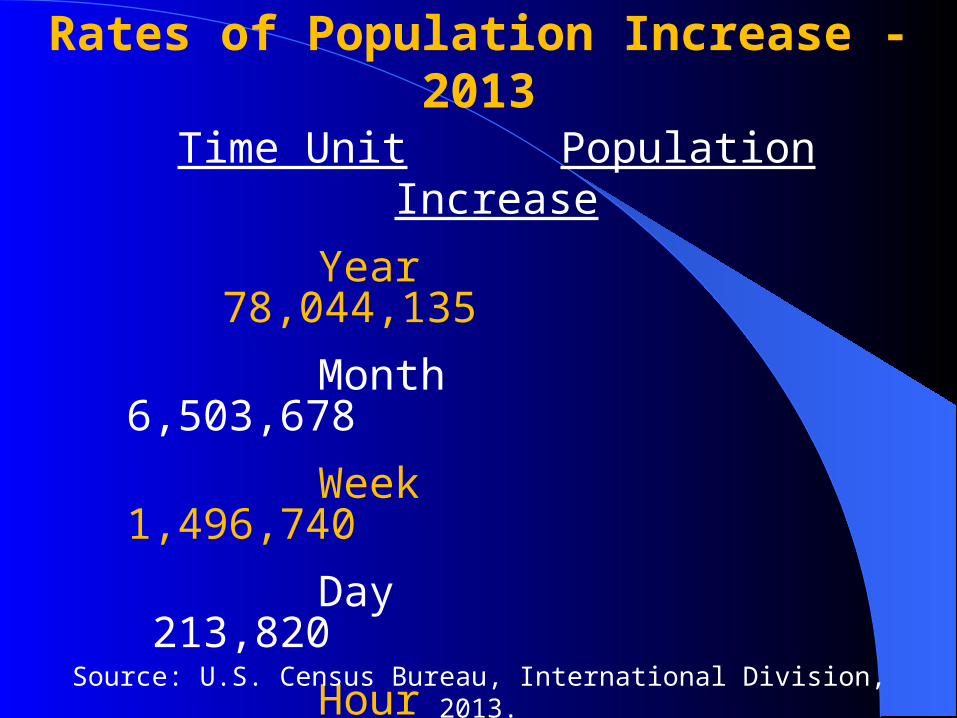
Rates of Population Increase - 2013
Time Unit Population Increase
Year 78,044,135
Month 6,503,678
Week 1,496,740
Day 213,820
Hour 8,880
Minute 148
Second 2.5
Source: U.S. Census Bureau, International Division, 2013.
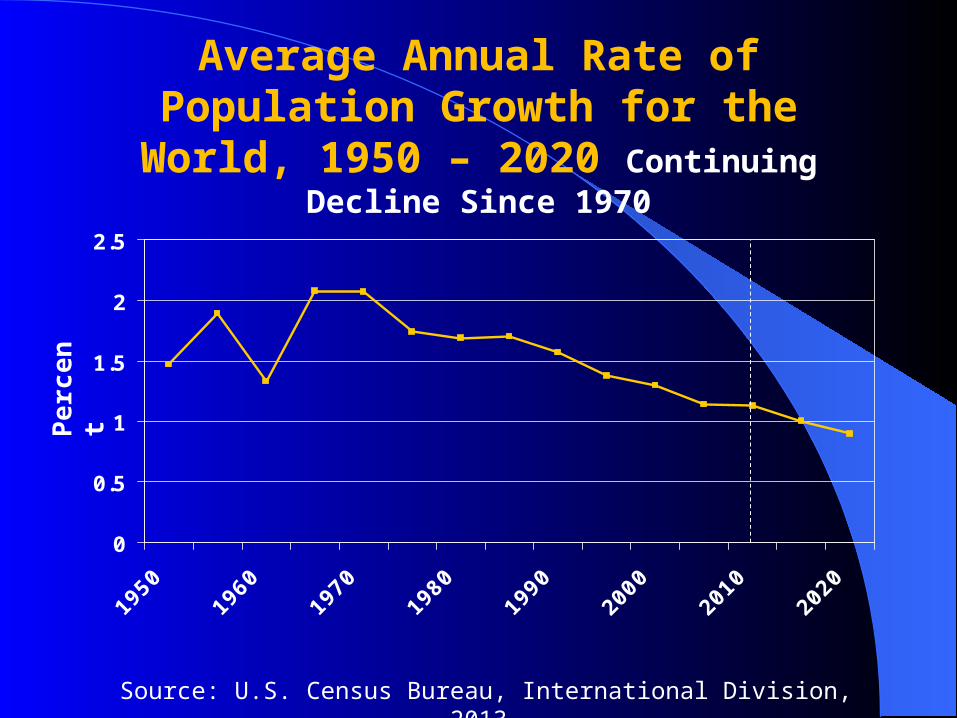
Average Annual Rate of Population Growth for the
World, 1950 – 2020 Continuing Decline Since 1970
0
0.5
1
1.5
2
2.5
Perc
en
t
Source: U.S. Census Bureau, International Division, 2013.
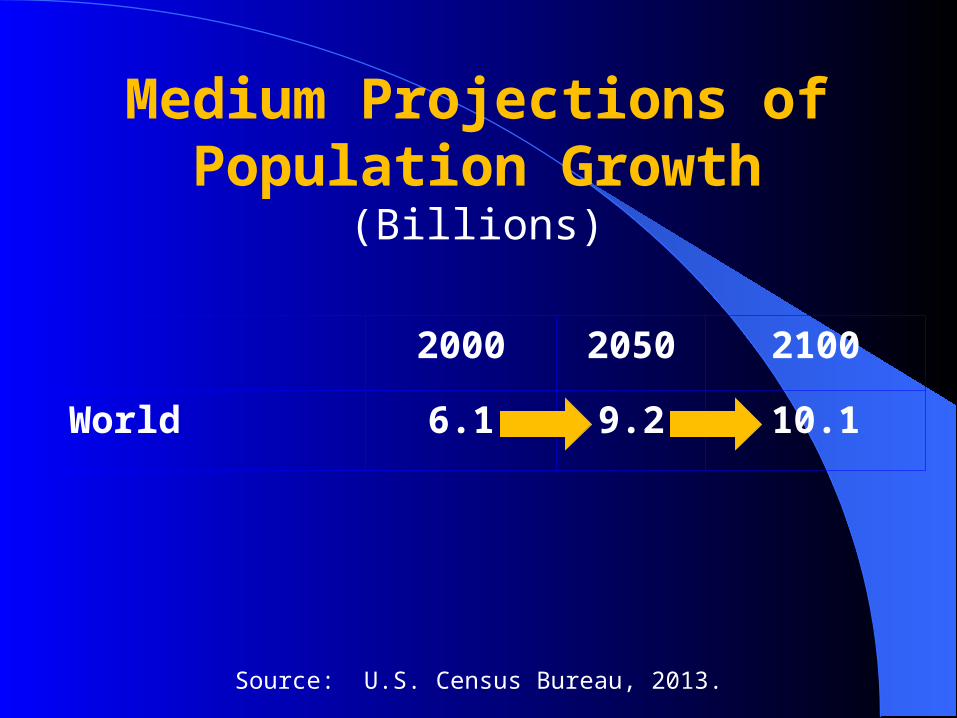
Medium Projections of Population Growth
(Billions)
2000 2050 2100
World 6.1 9.2 10.1
Source: U.S. Census Bureau, 2013.
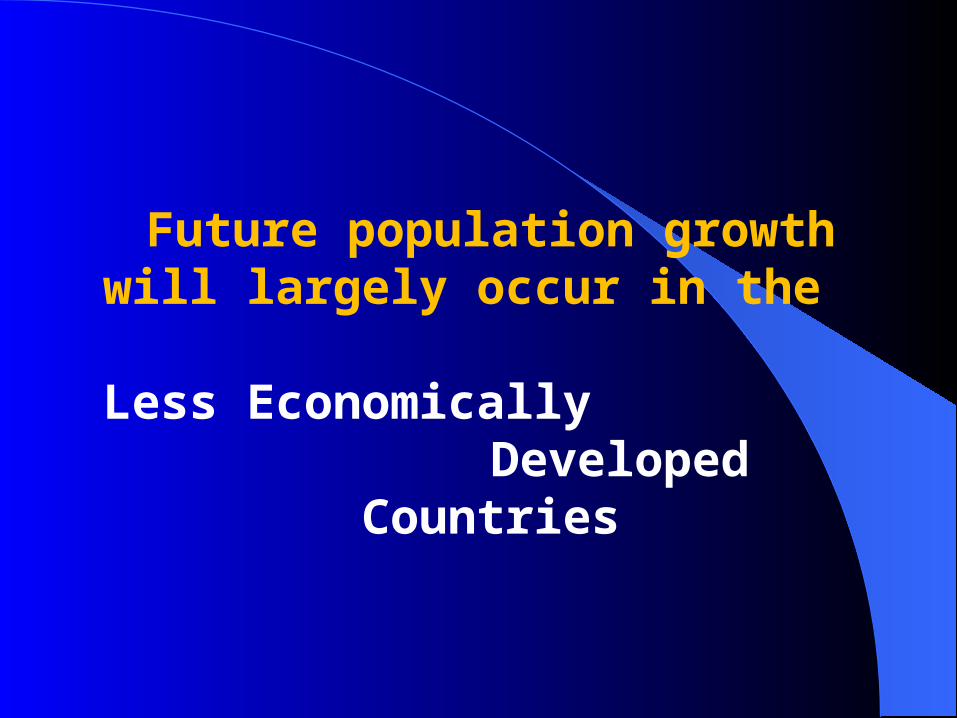
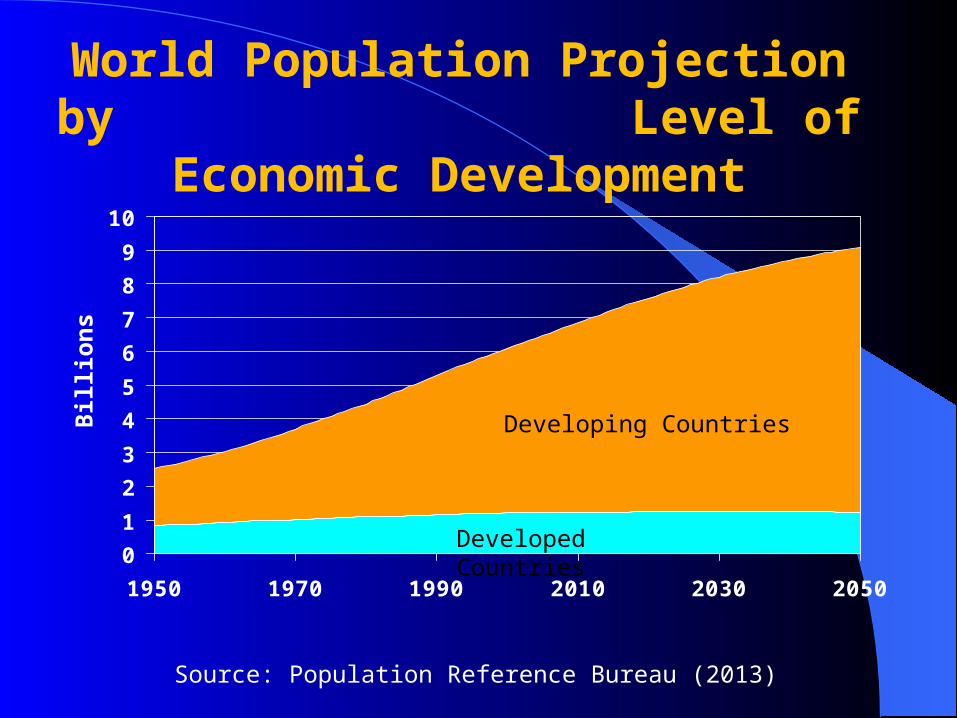
Future population growth will largely occur in the Less Economically
Developed Countries
0
1
2
3
4
5
6
7
8
9
10
1950 1970 1990 2010 2030 2050
World Population Projection by Level of
Economic Development
Source: Population Reference Bureau (2013)
Billion
s
Developing Countries
Developed Countries
But significant growth of the U.S. population is
expected as well
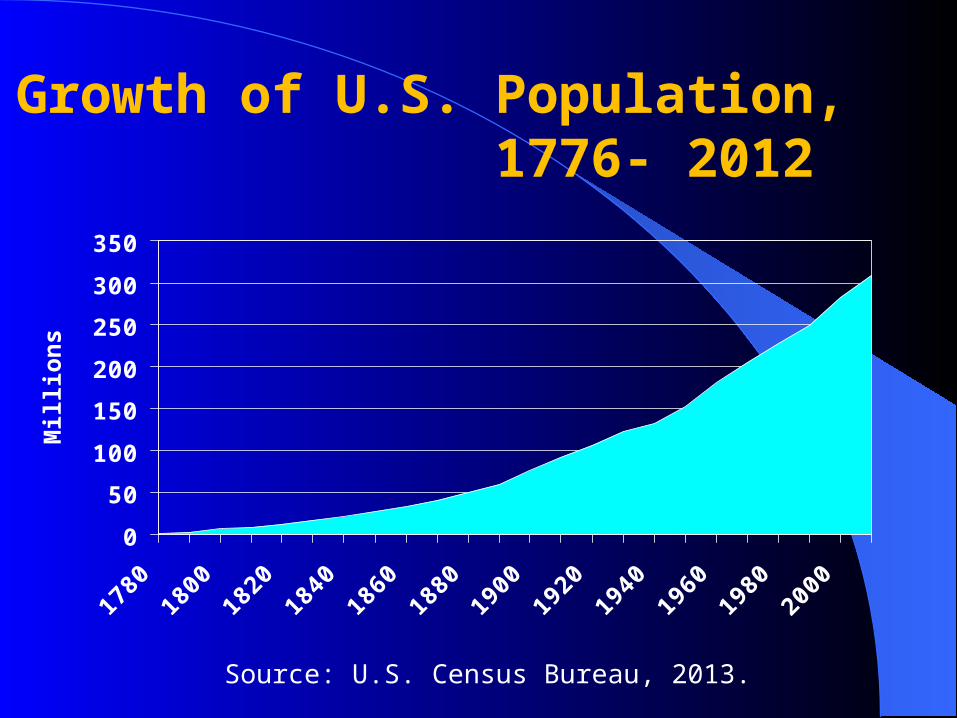
Growth of U.S. Population, 1776- 2012
0
50
100
150
200
250
300
350
Source: U.S. Census Bureau, 2013.
Million
s
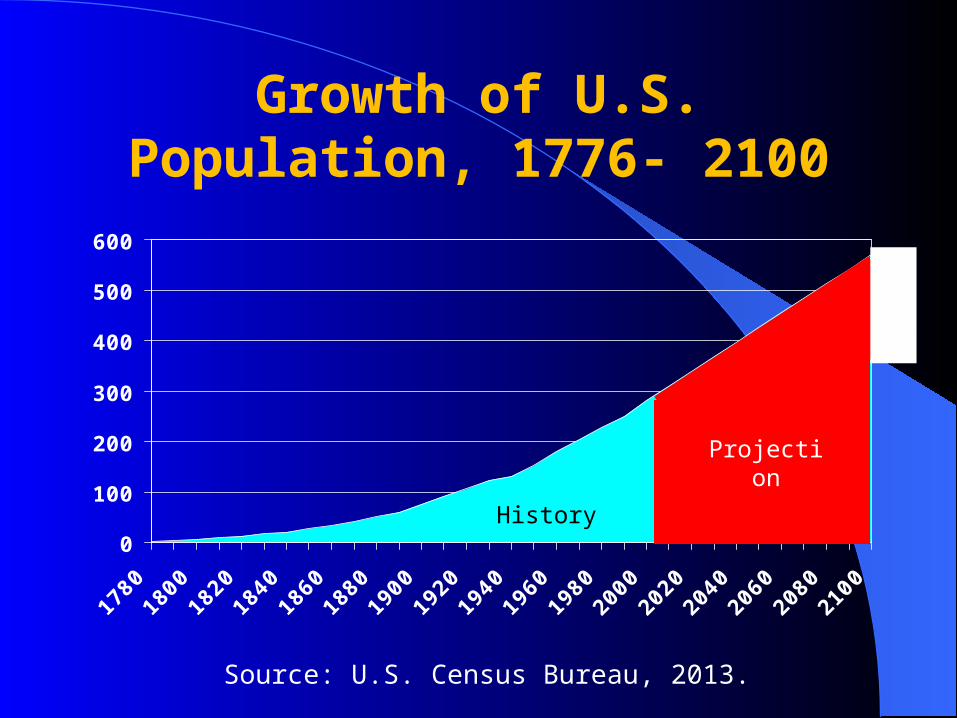
Growth of U.S. Population, 1776- 2100
0
100
200
300
400
500
600
History
Projection
Source: U.S. Census Bureau, 2013.
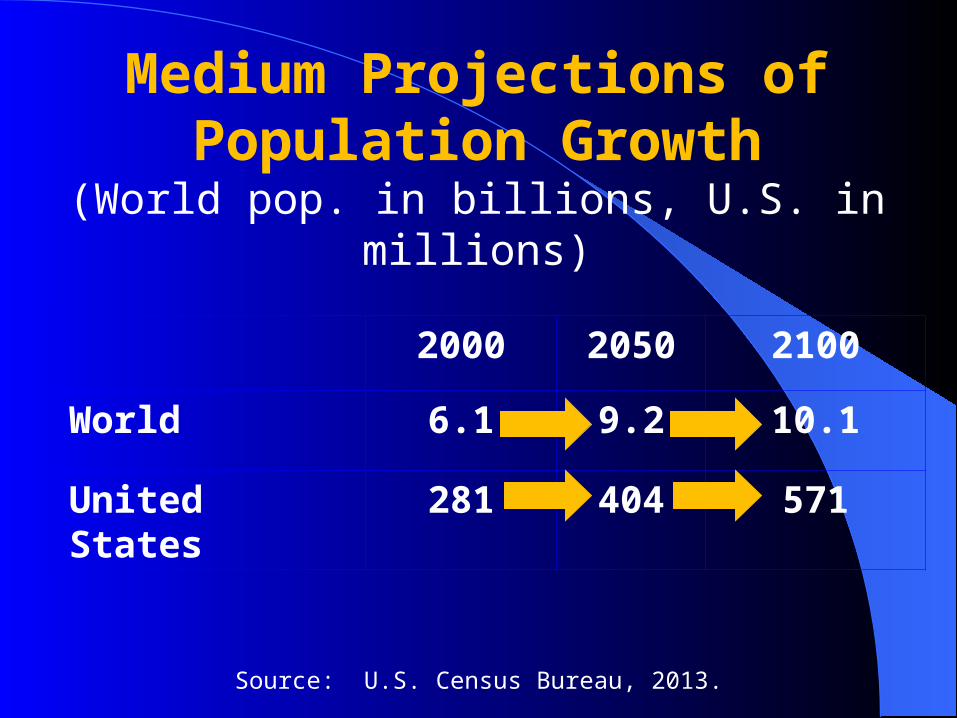
Medium Projections of Population Growth
(World pop. in billions, U.S. in millions)
2000 2050 2100
World 6.1 9.2 10.1
United States 281 404 571
Source: U.S. Census Bureau, 2013.
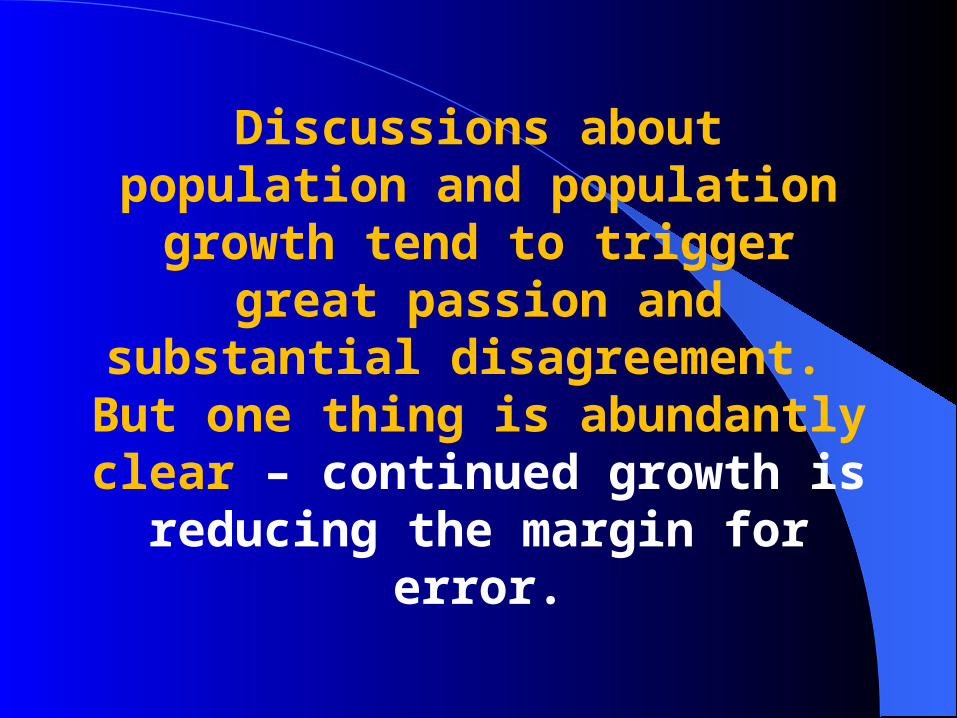
Discussions about population and population
growth tend to trigger great passion and substantial
disagreement. But one thing is abundantly clear –
continued growth is reducing the margin for error.
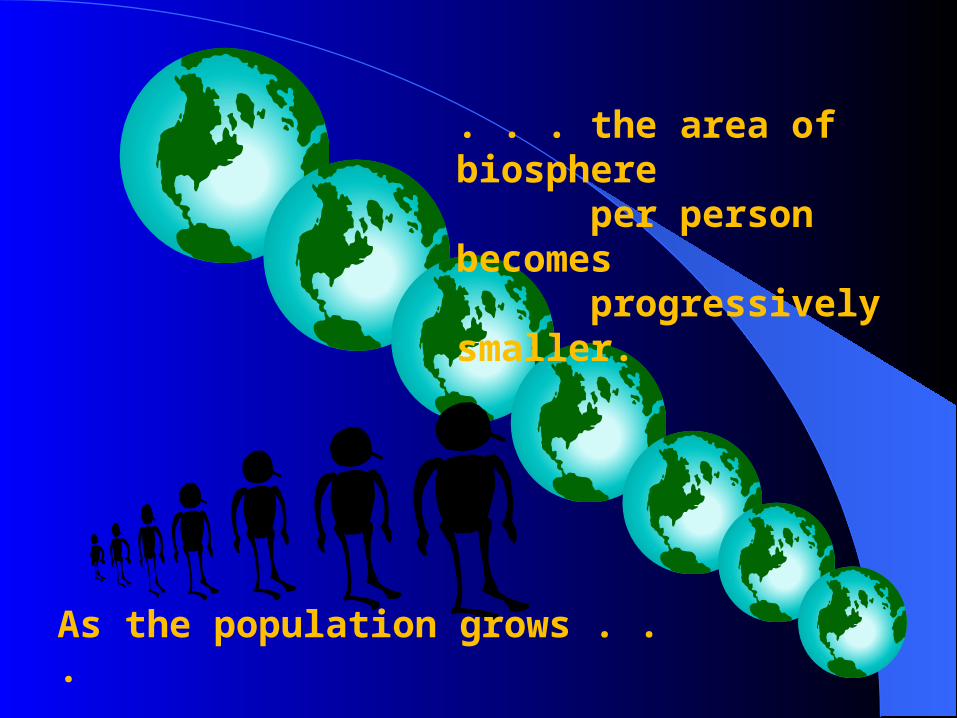
As the population grows . . .
. . . the area of biosphere per person becomes progressively smaller.
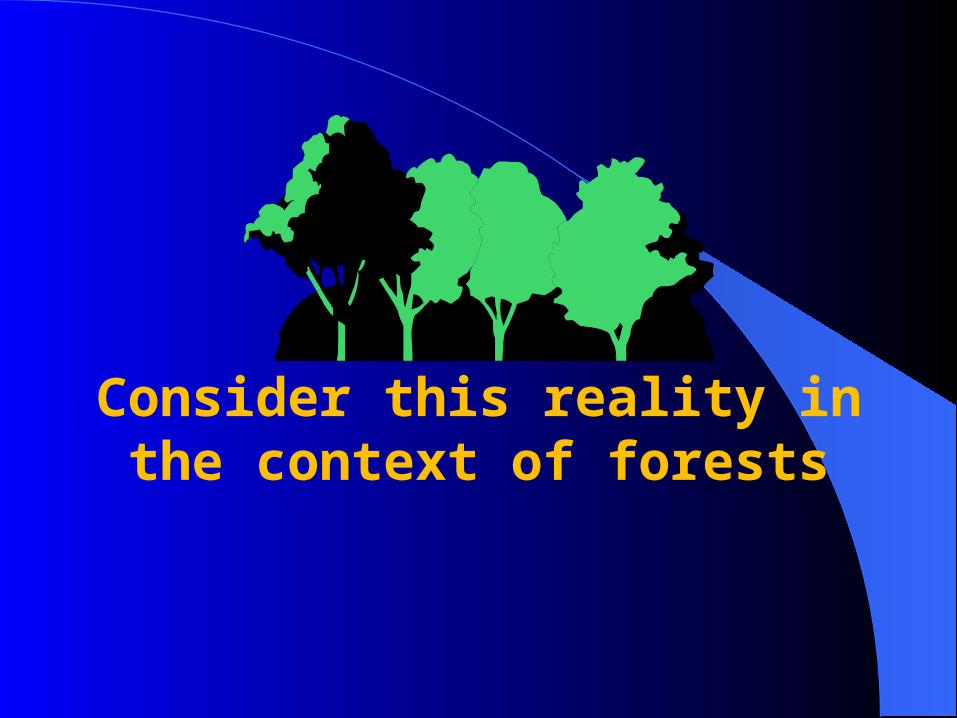
Consider this reality in the context of forests
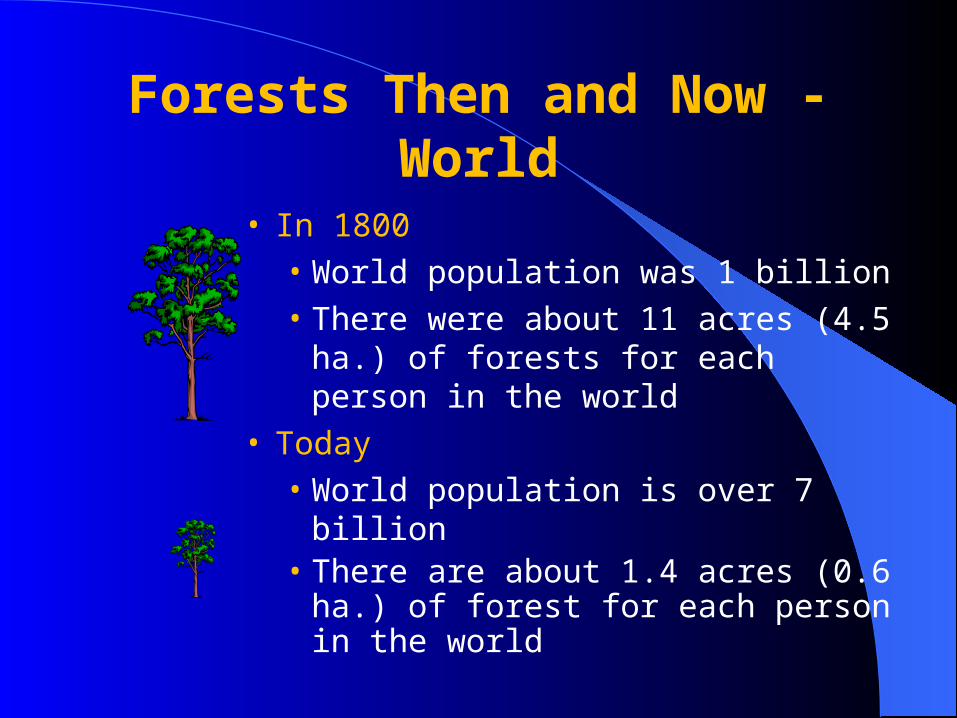
Forests Then and Now - World
• In 1800• World population was 1 billion• There were about 11 acres (4.5
ha.) of forests for each person in the world
• Today• World population is over 7 billion• There are about 1.4 acres (0.6
ha.) of forest for each person in the world
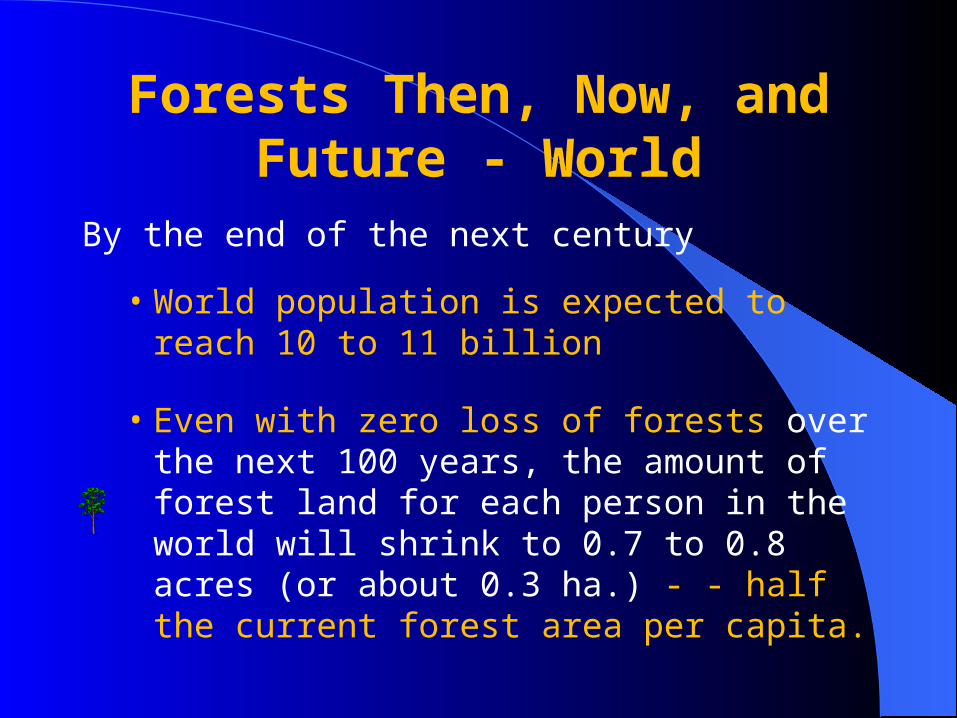
Forests Then, Now, and Future - World
By the end of the next century
• World population is expected to reach 10 to 11 billion
• Even with zero loss of forests over the next 100 years, the amount of forest land for each person in the world will shrink to 0.7 to 0.8 acres (or about 0.3 ha.) - - half the current forest area per capita.
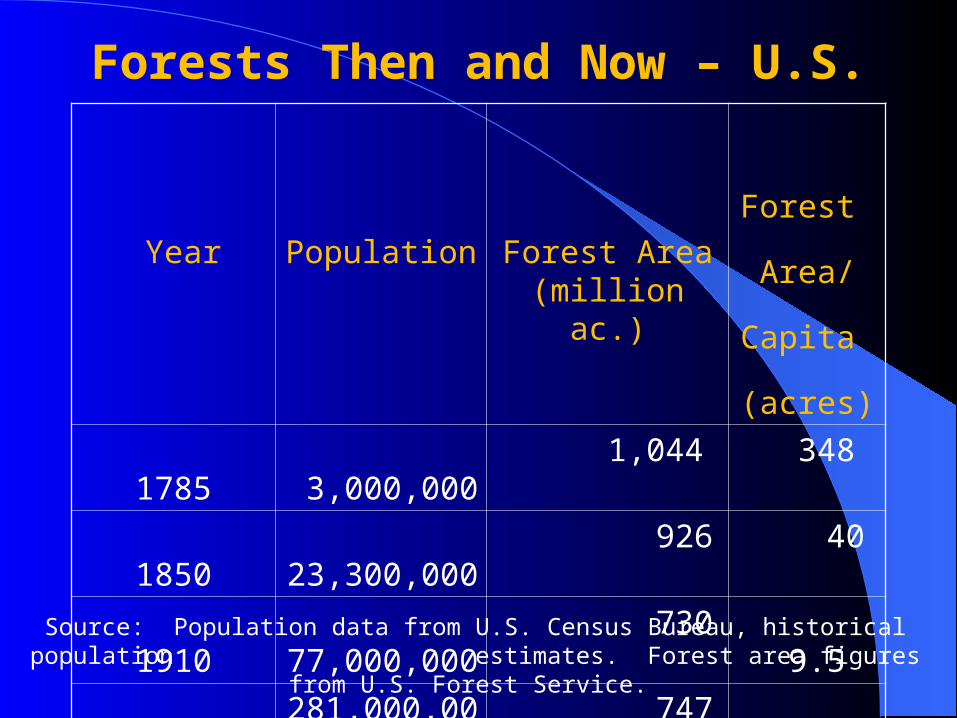
Forests Then and Now – U.S.
Year
Population
Forest Area (million ac.)
Forest Area/ Capita (acres)
1785 3,000,000
1,044 348
1850 23,300,000
926 40
1910 77,000,000
730 9.5
2000 281,000,000
747 2.7
2010 309,330,000
751 2.4
Source: Population data from U.S. Census Bureau, historical population estimates. Forest area figures from U.S. Forest Service.
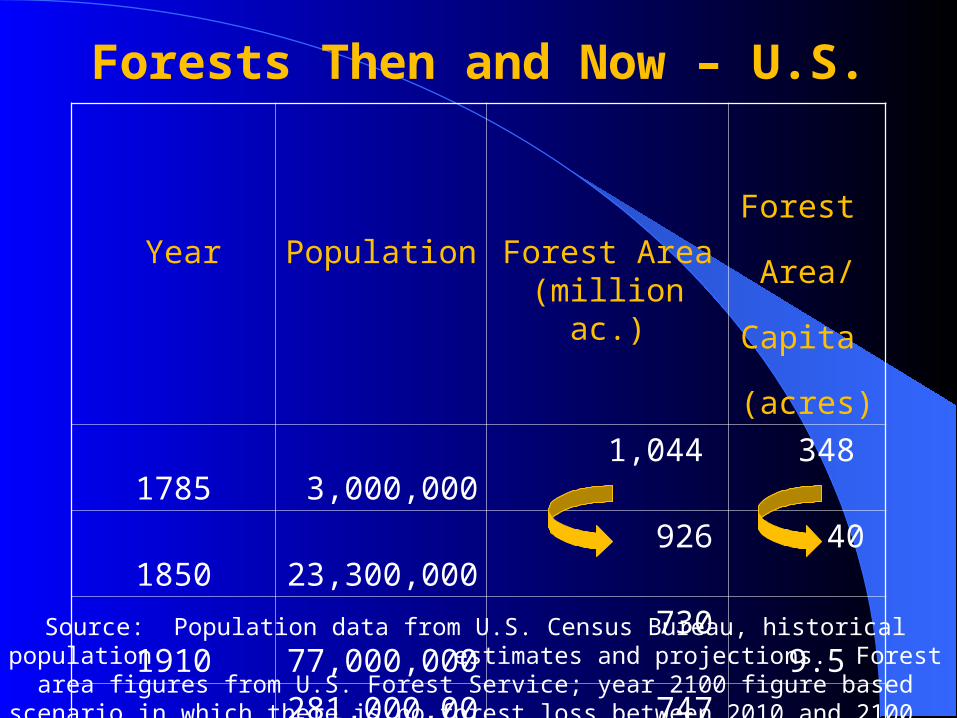
Forests Then and Now – U.S.
Year
Population
Forest Area (million ac.)
Forest Area/ Capita (acres)
1785 3,000,000
1,044 348
1850 23,300,000
926 40
1910 77,000,000
730 9.5
2000 281,000,000
747 2.7
2010 309,330,000
751 2.4
2100 571,000,00
0
751 1.3
Source: Population data from U.S. Census Bureau, historical population estimates and projections. Forest area figures from U.S. Forest
Service; year 2100 figure based scenario in which there is no forest loss between 2010 and 2100.
Reductions in forest land/capita virtually ensure
escalating conflict over forest use, and raise the
question of where needed wood supplies will come
from in the future.
The same is true of minerals, energy resources, food,
agricultural fiber, and more.
No less significant, the world will be faced in the 21st
century with the challenge of providing food, fuel,
shelter, and clothing for a much larger population.
Economic Economic GrowthGrowth
Economic Economic GrowthGrowth

EconomyEconomy
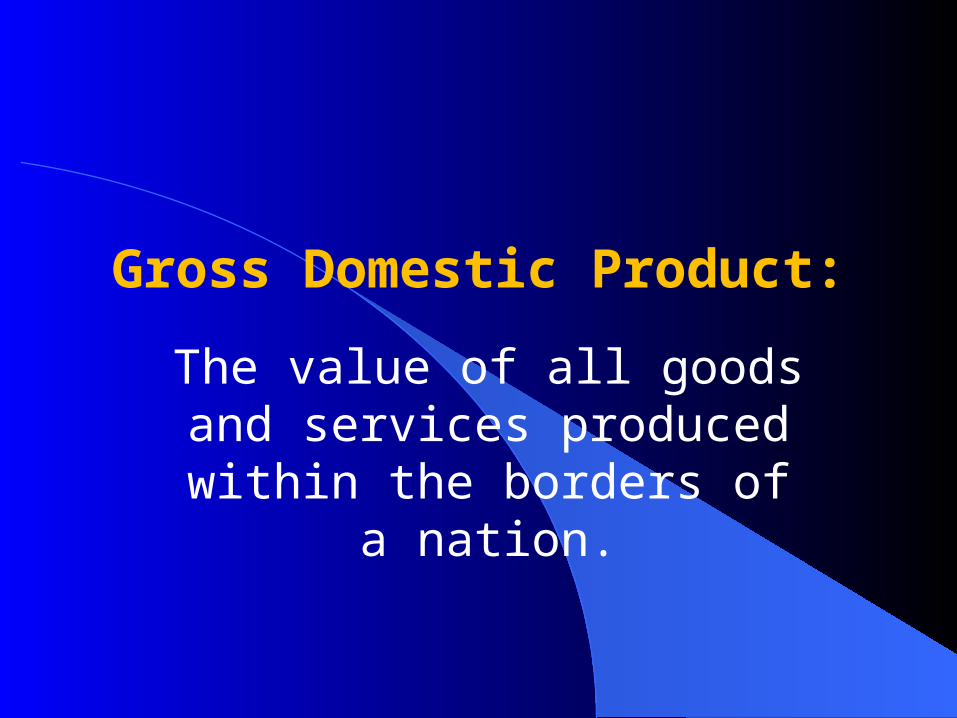
Gross Domestic Product:
The value of all goods and services produced within the borders of a nation.
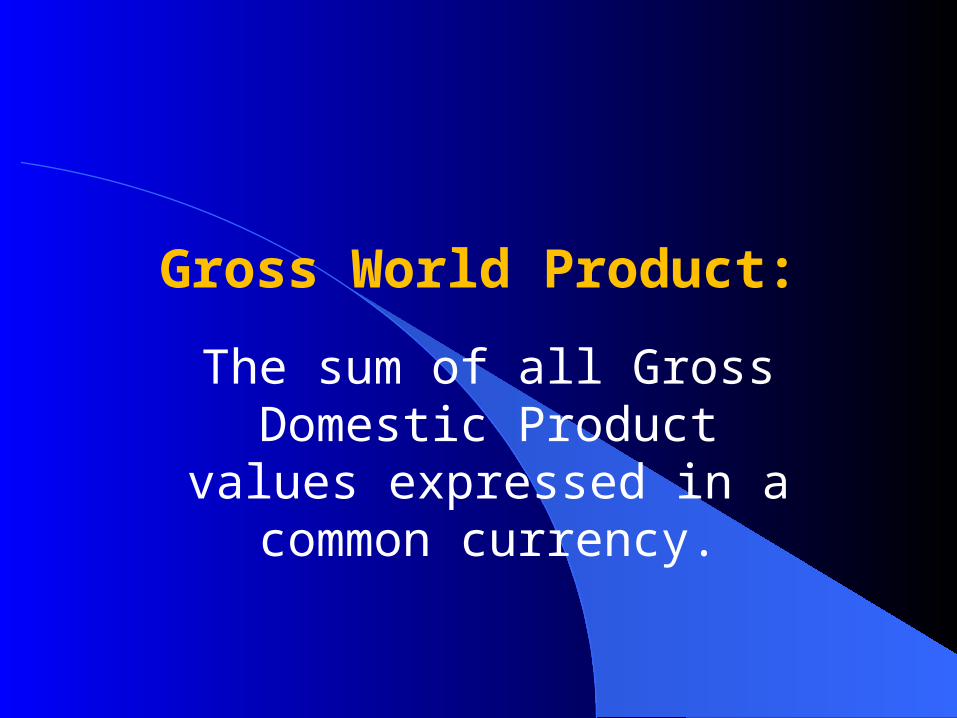
Gross World Product:
The sum of all Gross Domestic Product values expressed in a common
currency.
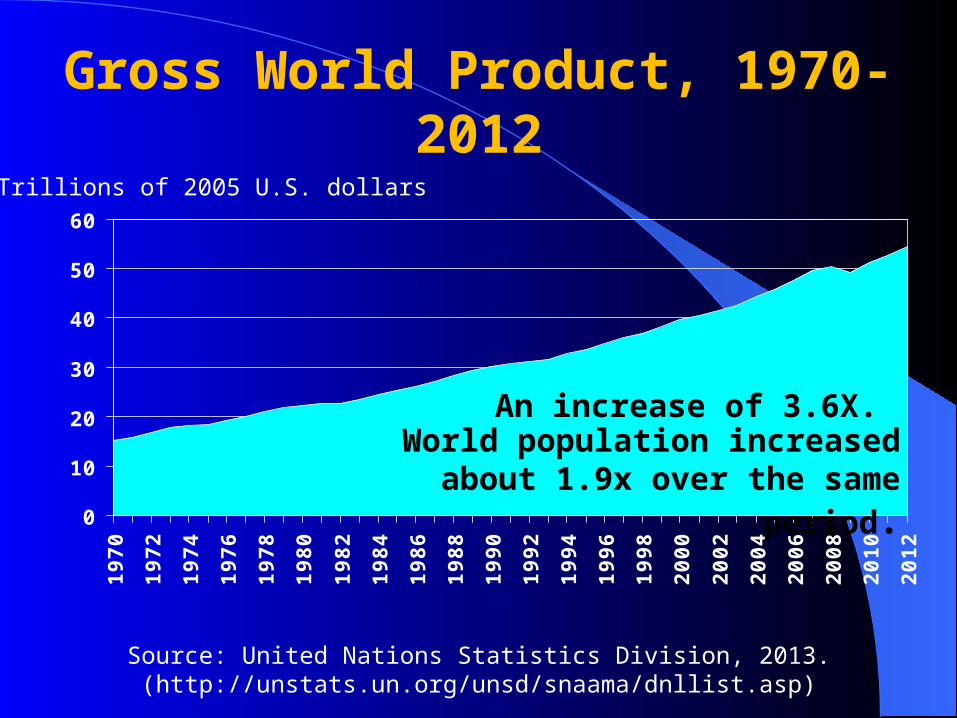
Gross World Product, 1970-2012
0
10
20
30
40
50
60
1970
1972
1974
1976
1978
1980
1982
1984
1986
1988
1990
1992
1994
1996
1998
2000
2002
2004
2006
2008
2010
2012
Trillions of 2005 U.S. dollars
Source: United Nations Statistics Division, 2013.(http://unstats.un.org/unsd/snaama/dnllist.asp)
An increase of 3.6X. World population increased
about 1.9x over the same period.
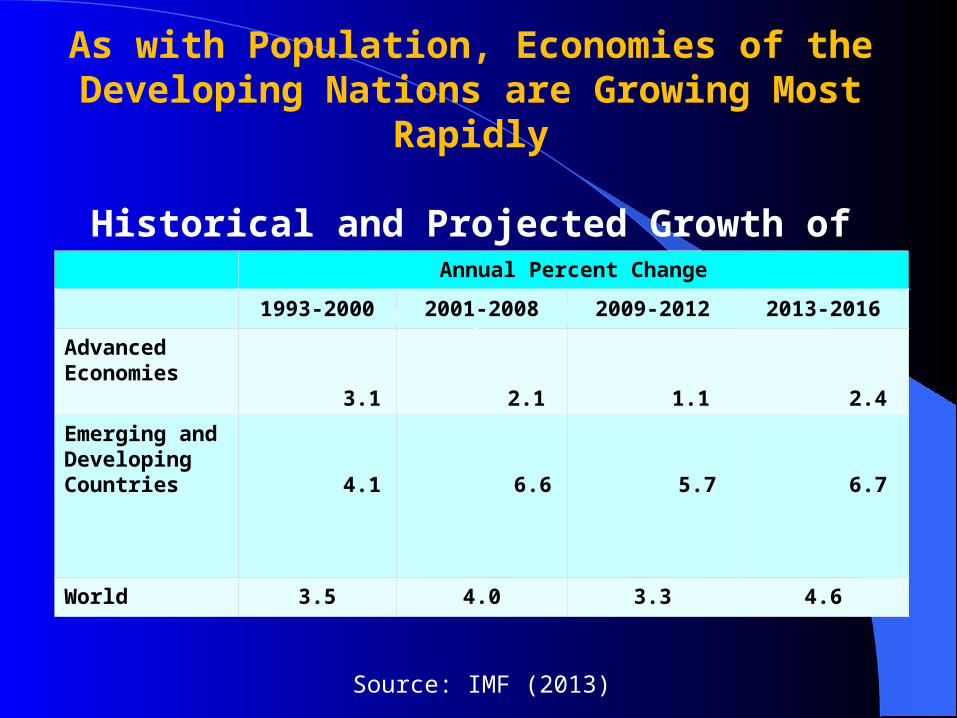
Source: IMF (2013)
As with Population, Economies of the Developing Nations are Growing Most
Rapidly
Historical and Projected Growth of World GDP by Level of Economic Development Annual Percent Change
1993-2000 2001-2008 2009-2012 2013-2016
Advanced Economies
3.1
2.1
1.1
2.4
Emerging and Developing Countries
4.1
6.6
5.7
6.7
World 3.5 4.0 3.3 4.6
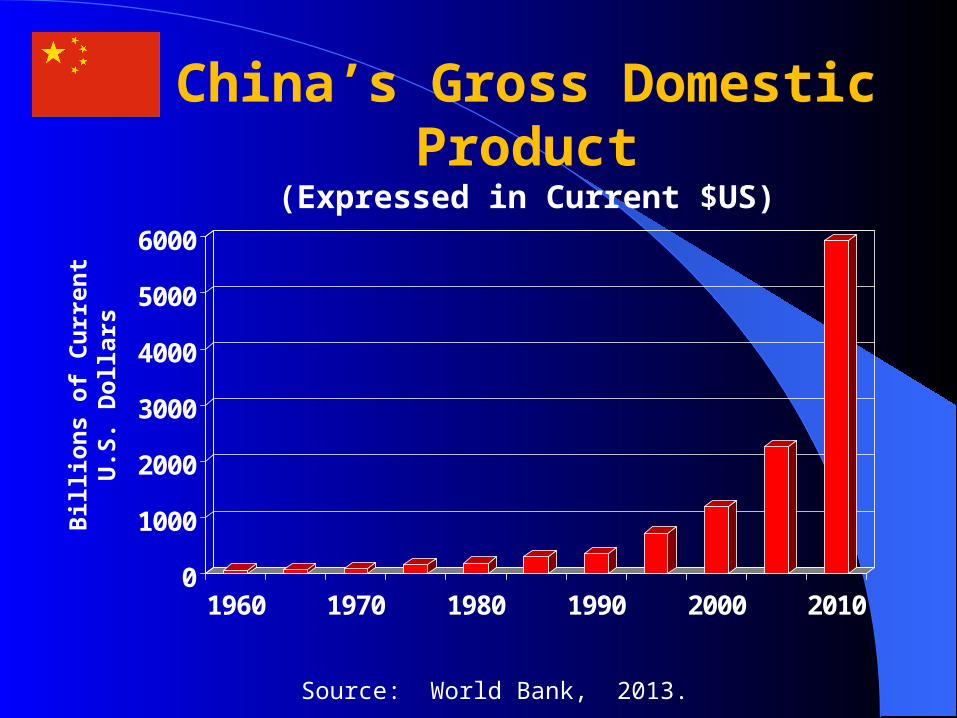
China’s Gross Domestic Product
(Expressed in Current $US)
0
1000
2000
3000
4000
5000
6000
1960 1970 1980 1990 2000 2010
Bil
lio
ns
of
Cu
rren
t U
.S.
Do
llar
s
Source: World Bank, 2013.
Coincidentally, those nations with the most
rapidly rising populations, are also those with the most rapidly expanding
economies.
This translates to rapidly rising consumption.
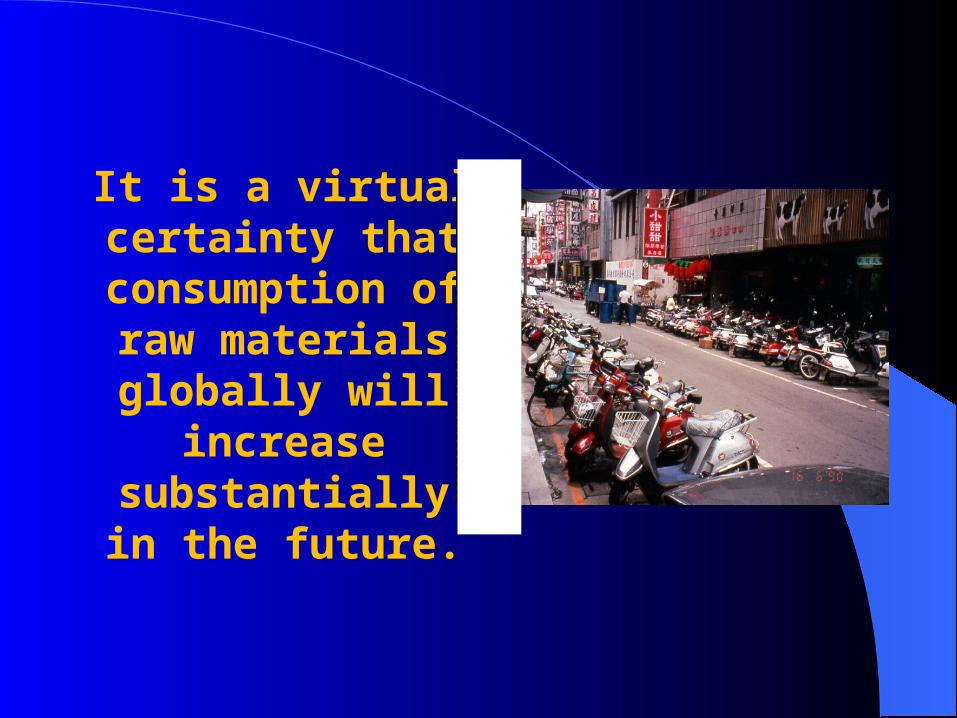
It is a virtual certainty that
consumption of raw materials globally will
increase substantially in
the future.
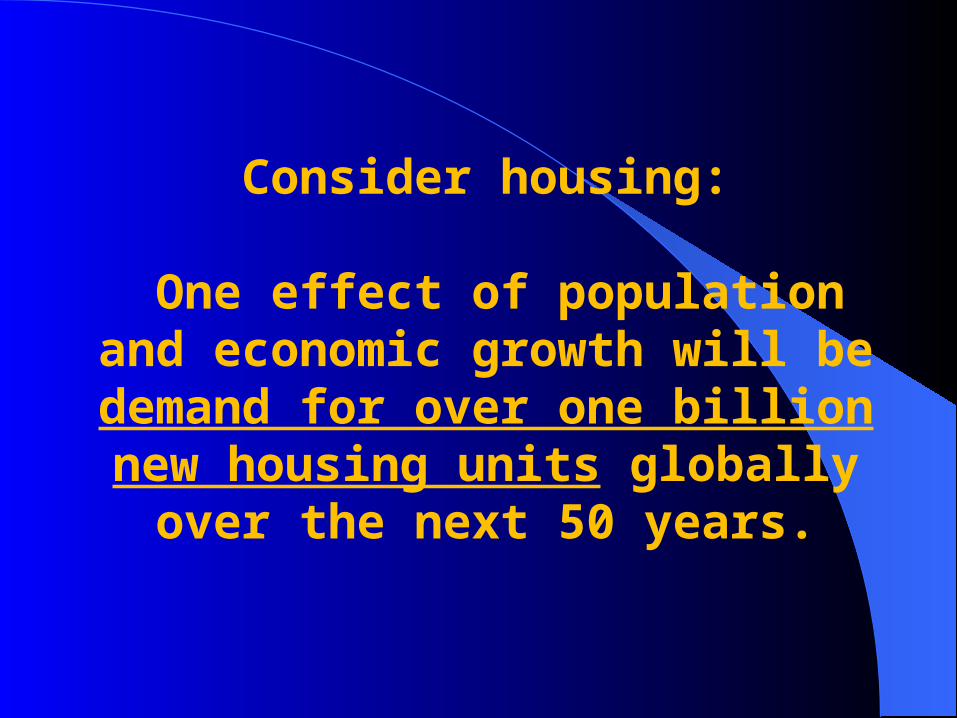
Consider housing:
One effect of population and economic growth will be
demand for over one billion new housing units globally
over the next 50 years..

How will society achieve this while at the same time maintaining an environment that most of us would agree is acceptablechildren?for our children and grand-
Summary
• World and U.S. populations are growing.
• The rate of population growth is slowing, though significant and ongoing increase in numbers continues.
• Populations are growing most rapidly in the developing nations.
• World economic growth is much more rapid than the rate of population growth.
– as a result, per capita consumption of goods of all kinds is rising globally.
Summary
• The combined effect is a number of challenges for the global society.
A key challenge is how to maintain environmental quality for future generations, while at the same time providing for the needs of current generations.