Embed Size (px)
Citation preview

Copyright © 2012 Pearson Addison-Wesley. All rights reserved.
Chapter 5
Poverty, Inequality, and Development
Copyright © 2012 Pearson Addison-Wesley. All rights reserved. 5-2
Distribution and Development: Seven Critical Questions
• What is the extent of relative inequality, and how is this related to the extent of poverty?
• Who are the poor?
• Who benefits from economic growth?
• Does rapid growth necessarily cause greater income inequality?
• Do the poor benefit from growth?
Copyright © 2012 Pearson Addison-Wesley. All rights reserved. 5-3
Distribution and Development: Seven Critical Questions
• Are high levels of inequality always bad?
• What policies can reduce poverty?
Copyright © 2012 Pearson Addison-Wesley. All rights reserved. 5-4
5.1 Measuring Inequality and Poverty
• Measuring Inequality
– Size distributions (quintiles, deciles)
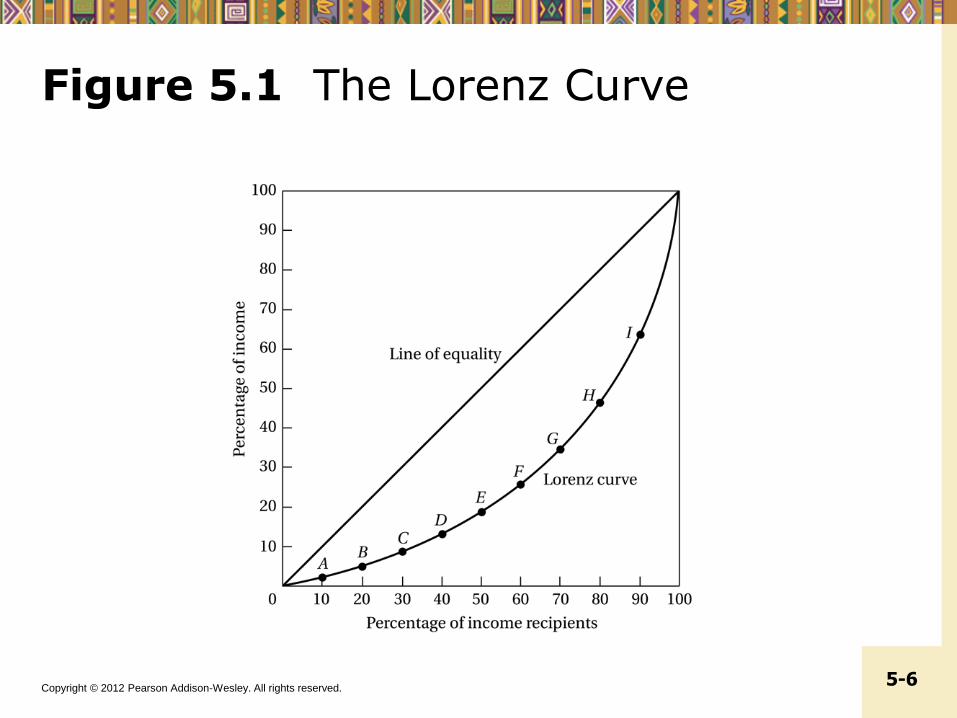
– Lorenz curves
– Gini coefficients and aggregate measures of inequality
– Functional distributions
Copyright © 2012 Pearson Addison-Wesley. All rights reserved. 5-5
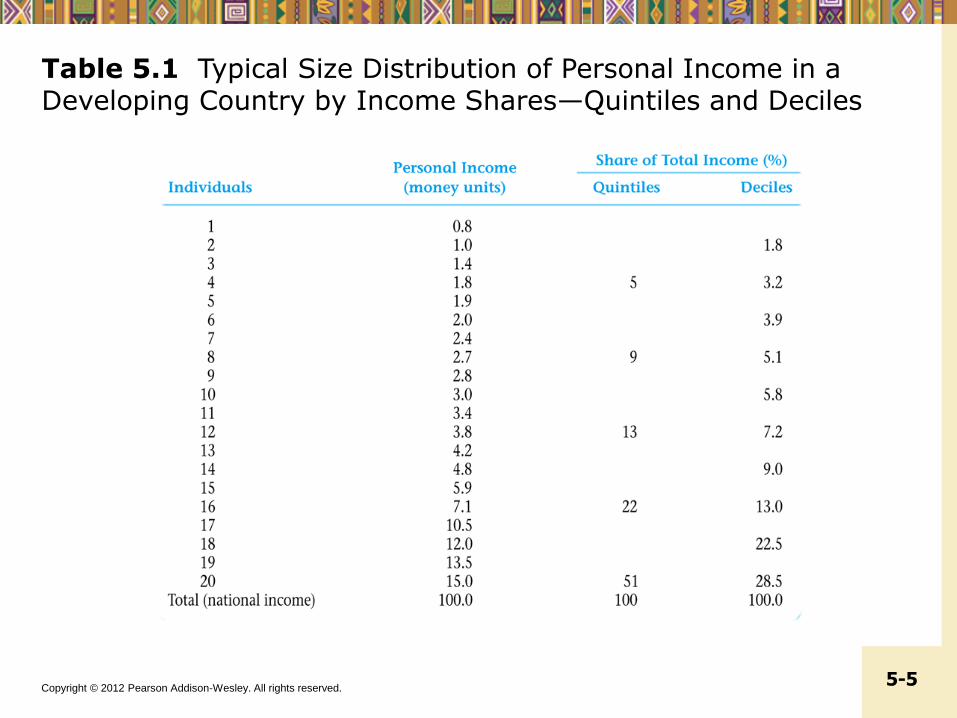
Table 5.1 Typical Size Distribution of Personal Income in a Developing Country by Income Shares—Quintiles and Deciles
Copyright © 2012 Pearson Addison-Wesley. All rights reserved. 5-6
Figure 5.1 The Lorenz Curve

Copyright © 2012 Pearson Addison-Wesley. All rights reserved. 5-7
Figure 5.2 The Greater the Curvature of the Lorenz Line, the Greater the Relative Degree of Inequality

Copyright © 2012 Pearson Addison-Wesley. All rights reserved. 5-8
Figure 5.3 Estimating the Gini Coefficient
Copyright © 2012 Pearson Addison-Wesley. All rights reserved. 5-9
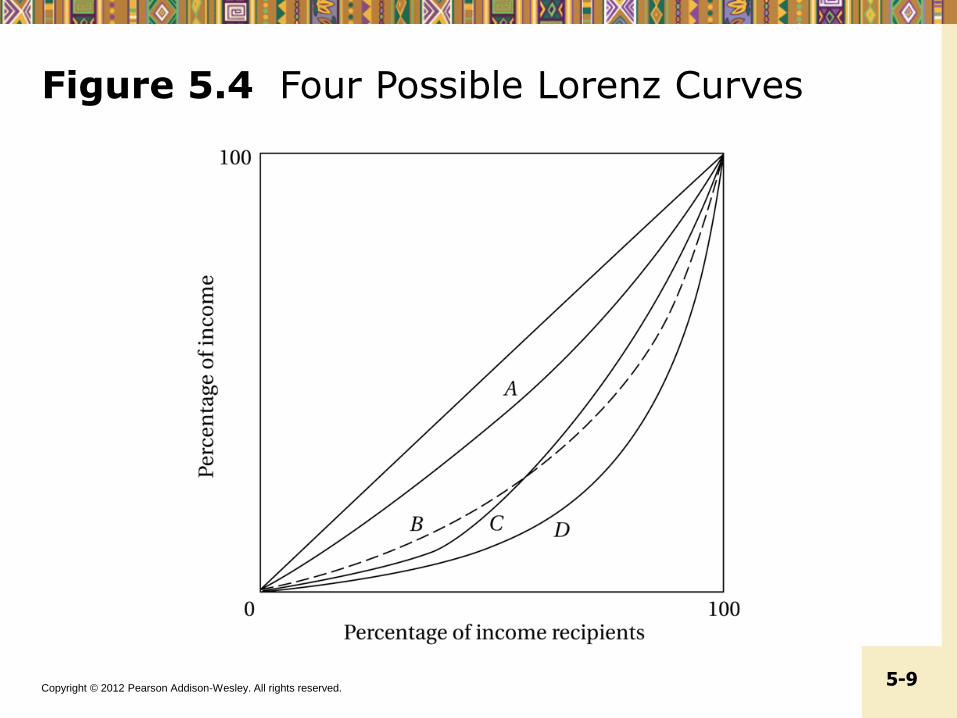
Figure 5.4 Four Possible Lorenz Curves

Copyright © 2012 Pearson Addison-Wesley. All rights reserved. 5-10
Figure 5.5 Functional Income Distribution in a Market Economy: An Illustration
Copyright © 2012 Pearson Addison-Wesley. All rights reserved. 5-11
5.1 Measuring Inequality and Poverty
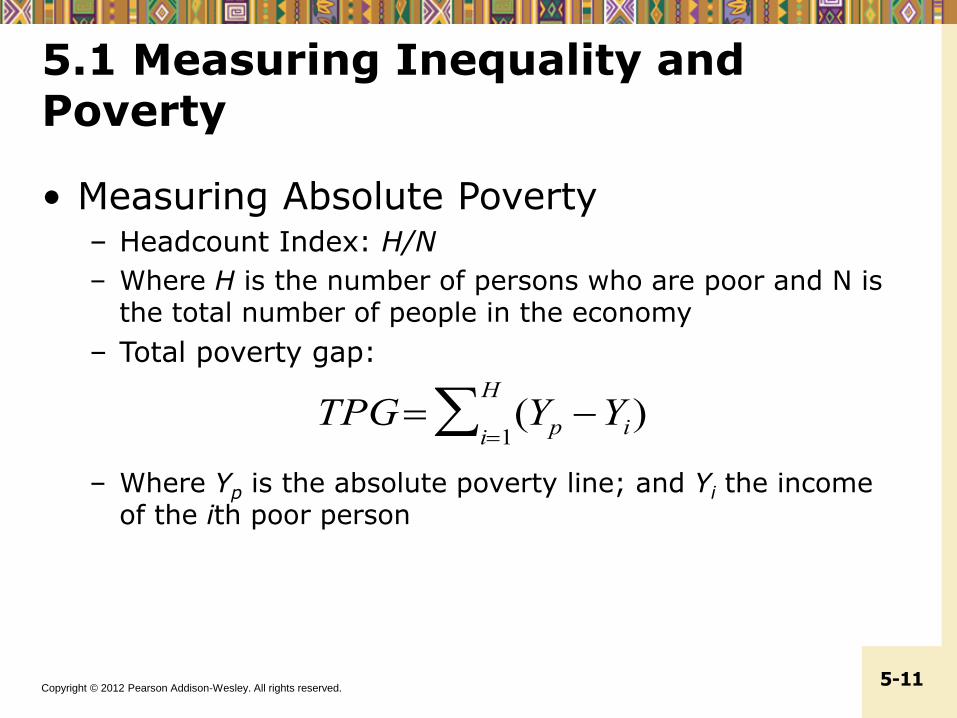
• Measuring Absolute Poverty– Headcount Index: H/N
– Where H is the number of persons who are poor and N is the total number of people in the economy
– Total poverty gap:
– Where Yp is the absolute poverty line; and Yi the income of the ith poor person
TPG (Yp Yi)i1
H

Copyright © 2012 Pearson Addison-Wesley. All rights reserved. 5-12
Figure 5.6 Measuring the Total Poverty Gap
Copyright © 2012 Pearson Addison-Wesley. All rights reserved. 5-13
5.1 Measuring Inequality and Poverty
• Measuring Absolute Poverty
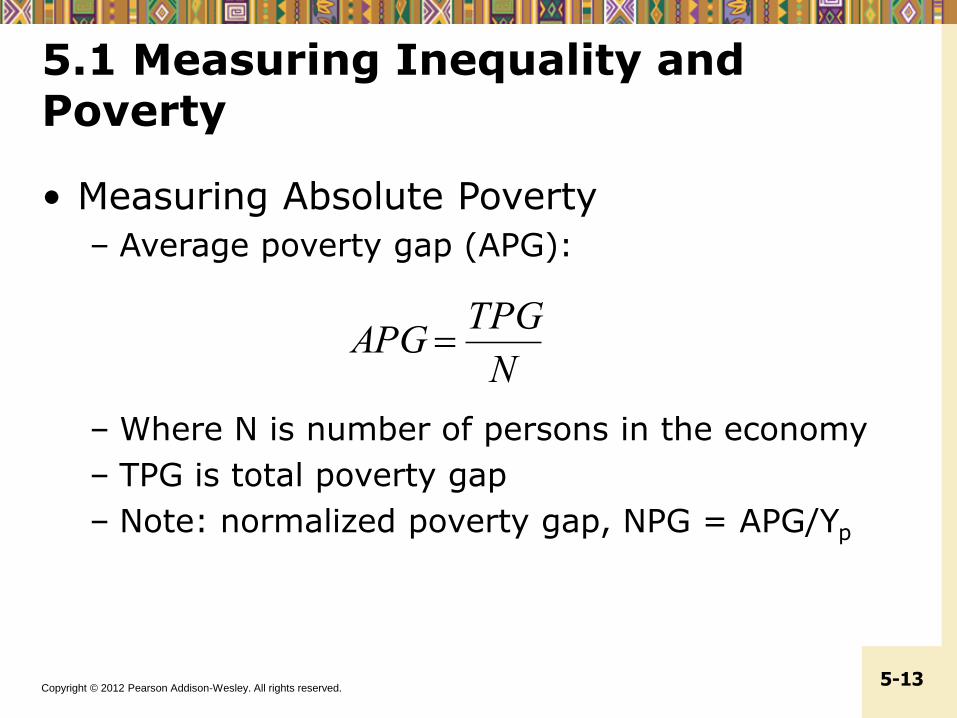
– Average poverty gap (APG):
– Where N is number of persons in the economy
– TPG is total poverty gap
– Note: normalized poverty gap, NPG = APG/Yp
APG TPG
N
Copyright © 2012 Pearson Addison-Wesley. All rights reserved. 5-14
5.1 Measuring Inequality and Poverty
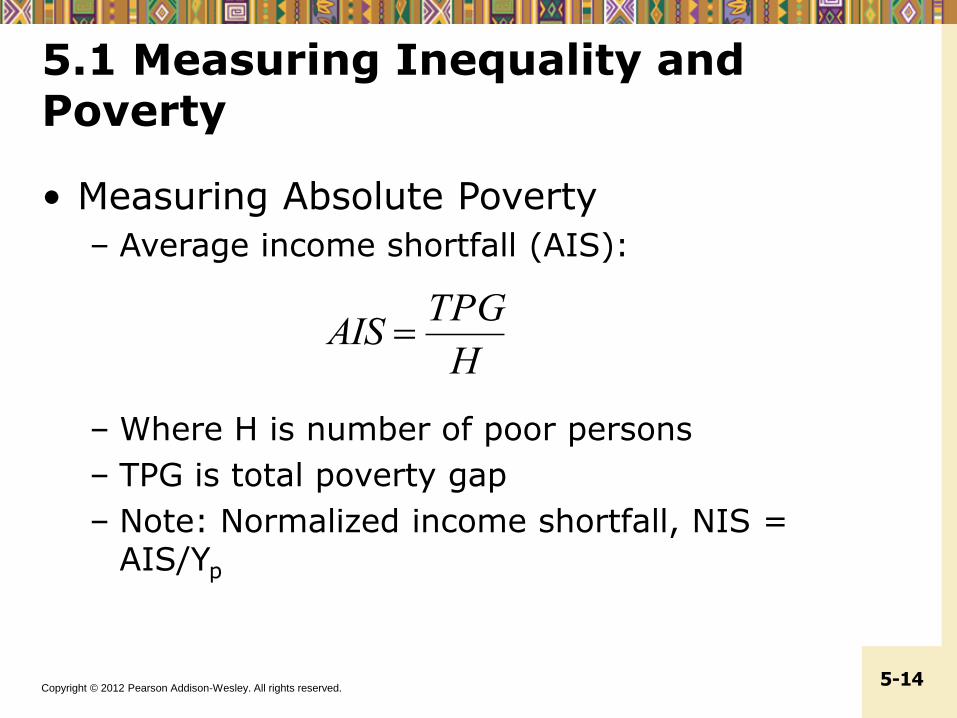
• Measuring Absolute Poverty
– Average income shortfall (AIS):
– Where H is number of poor persons
– TPG is total poverty gap
– Note: Normalized income shortfall, NIS = AIS/Yp
AIS TPG
H
Copyright © 2012 Pearson Addison-Wesley. All rights reserved. 5-15
5.1 Measuring Inequality and Poverty
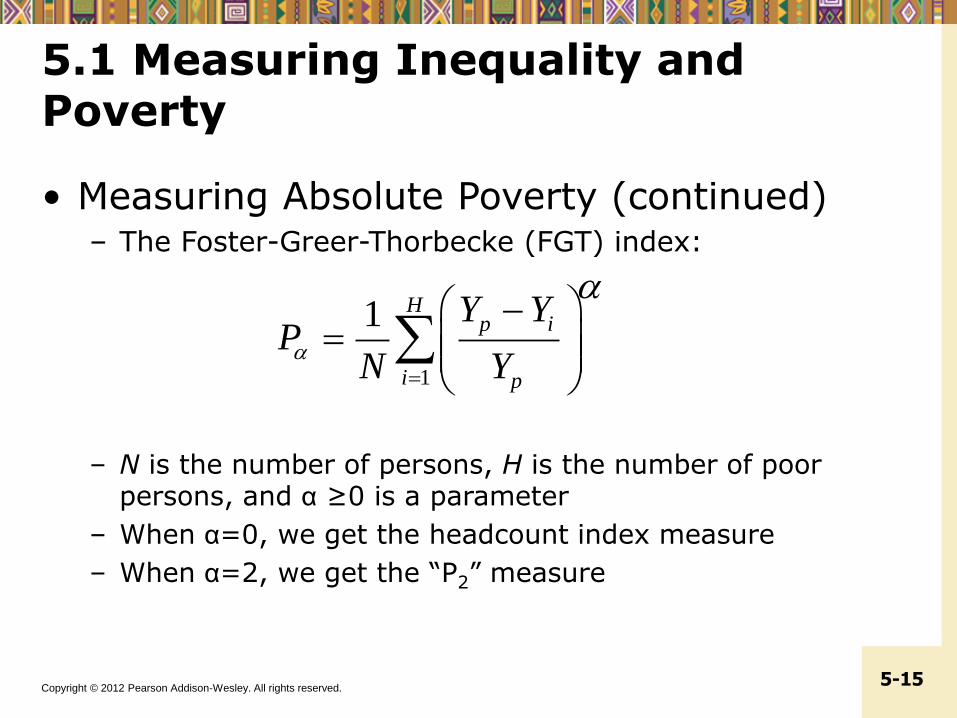
• Measuring Absolute Poverty (continued)– The Foster-Greer-Thorbecke (FGT) index:
– N is the number of persons, H is the number of poor persons, and α ≥0 is a parameter
– When α=0, we get the headcount index measure
– When α=2, we get the “P2” measure
1
1 Hp i
i p
Y YP
N Y
Copyright © 2012 Pearson Addison-Wesley. All rights reserved. 5-16
5.1 Measuring Inequality and Poverty
• Measuring Absolute Poverty
– The Newly Introduced Multidimensional Poverty Index
Copyright © 2012 Pearson Addison-Wesley. All rights reserved. 5-17
The Multidimensional Poverty Index (MPI)
• Identification of poverty status through a dual cutoff:
• First, cutoff levels within each dimension (analogous to falling below a poverty line for example $1.25 per day for income poverty);
• Second, cutoff in the number of dimensions in which a person must be deprived (below a line) to be deemed multidimensionally poor.
• MPI focuses on deprivations in health, education, and standard of living; and each receives equal (that is one-third of the overall total) weight.
Copyright © 2012 Pearson Addison-Wesley. All rights reserved. 5-18
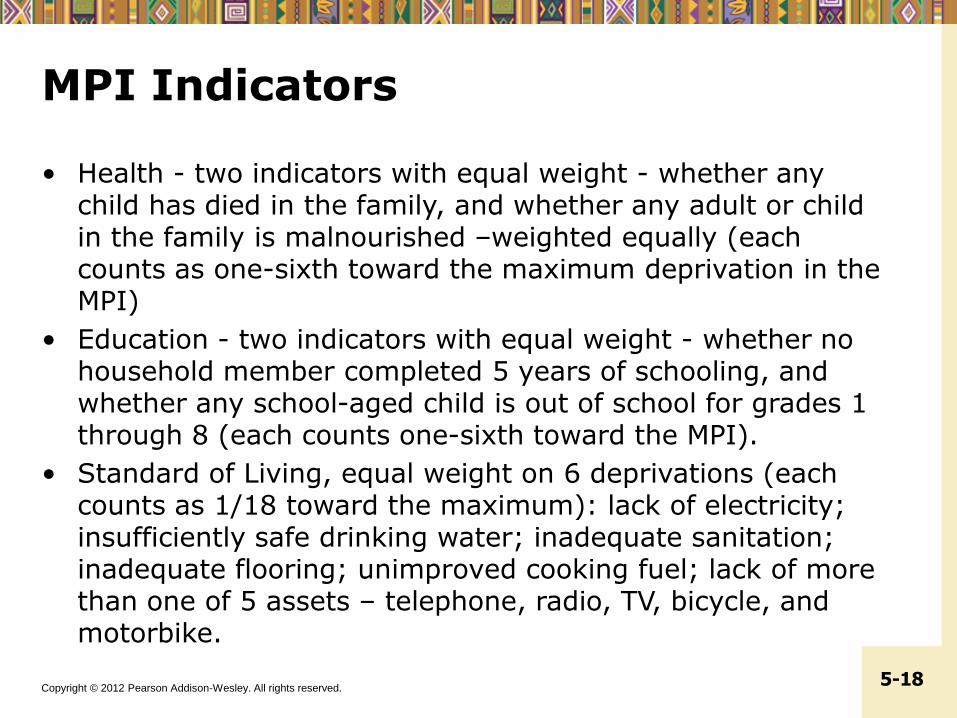
MPI Indicators
• Health - two indicators with equal weight - whether any child has died in the family, and whether any adult or child in the family is malnourished –weighted equally (each counts as one-sixth toward the maximum deprivation in the MPI)
• Education - two indicators with equal weight - whether no household member completed 5 years of schooling, and whether any school-aged child is out of school for grades 1 through 8 (each counts one-sixth toward the MPI).
• Standard of Living, equal weight on 6 deprivations (each counts as 1/18 toward the maximum): lack of electricity; insufficiently safe drinking water; inadequate sanitation; inadequate flooring; unimproved cooking fuel; lack of more than one of 5 assets – telephone, radio, TV, bicycle, and motorbike.

Copyright © 2012 Pearson Addison-Wesley. All rights reserved. 5-19
Interaction of the deprivations?
• Building the index from household measures up to the aggregate measure (rather than using already-aggregated statistics), MPI approach takes account of multiplied or interactive harm (complementarity) done when multiple deprivations are experienced by the same individual or family
• The MPI approach assumes an individual’s lack of capability in one area can only to a degree be made up by other capabilities – capabilities are treated as substitutes up to a point but then as complements.
Copyright © 2012 Pearson Addison-Wesley. All rights reserved. 5-20
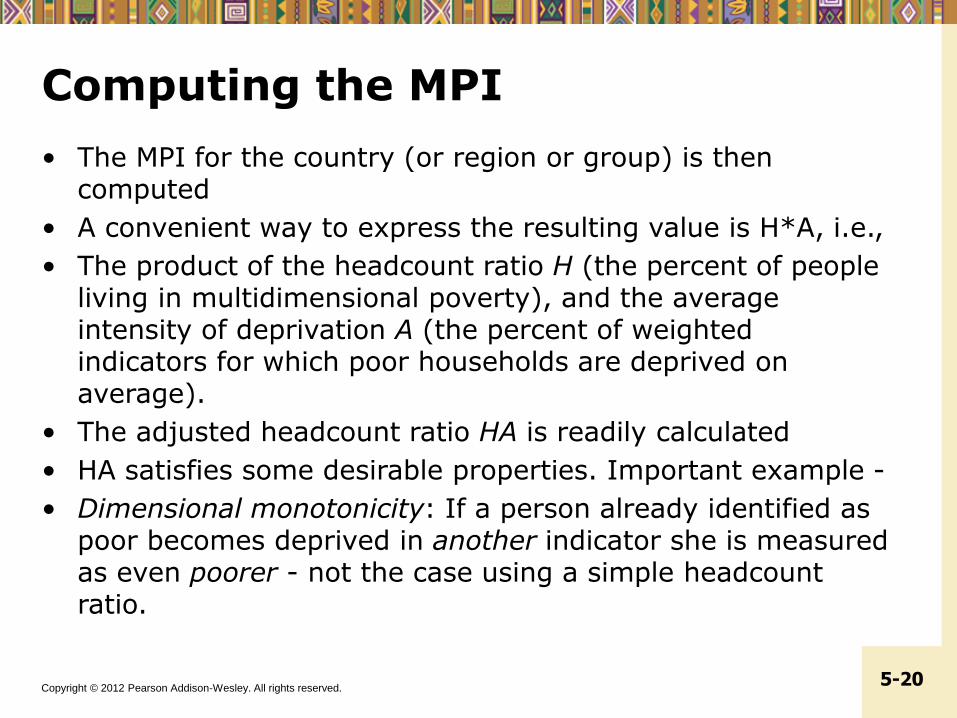
Computing the MPI
• The MPI for the country (or region or group) is then computed
• A convenient way to express the resulting value is H*A, i.e.,
• The product of the headcount ratio H (the percent of people living in multidimensional poverty), and the average intensity of deprivation A (the percent of weighted indicators for which poor households are deprived on average).
• The adjusted headcount ratio HA is readily calculated
• HA satisfies some desirable properties. Important example -
• Dimensional monotonicity: If a person already identified as poor becomes deprived in another indicator she is measured as even poorer - not the case using a simple headcount ratio.

Copyright © 2012 Pearson Addison-Wesley. All rights reserved. 5-21
Table 5.2 MPI Rankings and Poverty Headcounts for Selected Countries
Copyright © 2012 Pearson Addison-Wesley. All rights reserved. 5-22
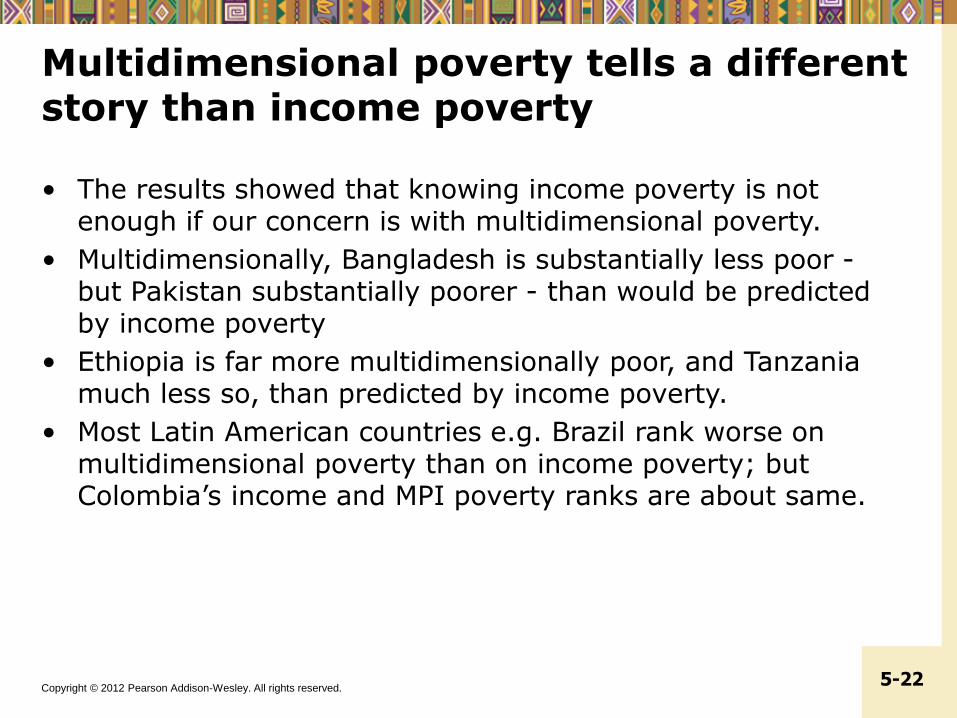
Multidimensional poverty tells a different story than income poverty
• The results showed that knowing income poverty is not enough if our concern is with multidimensional poverty.
• Multidimensionally, Bangladesh is substantially less poor -but Pakistan substantially poorer - than would be predicted by income poverty
• Ethiopia is far more multidimensionally poor, and Tanzania much less so, than predicted by income poverty.
• Most Latin American countries e.g. Brazil rank worse on multidimensional poverty than on income poverty; but Colombia’s income and MPI poverty ranks are about same.
Copyright © 2012 Pearson Addison-Wesley. All rights reserved. 5-23
5.2 Poverty, Inequality, and Social Welfare
• What’s So Bad about Extreme Inequality?
• Dualistic Development and Shifting Lorenz Curves: Some Stylized Typologies
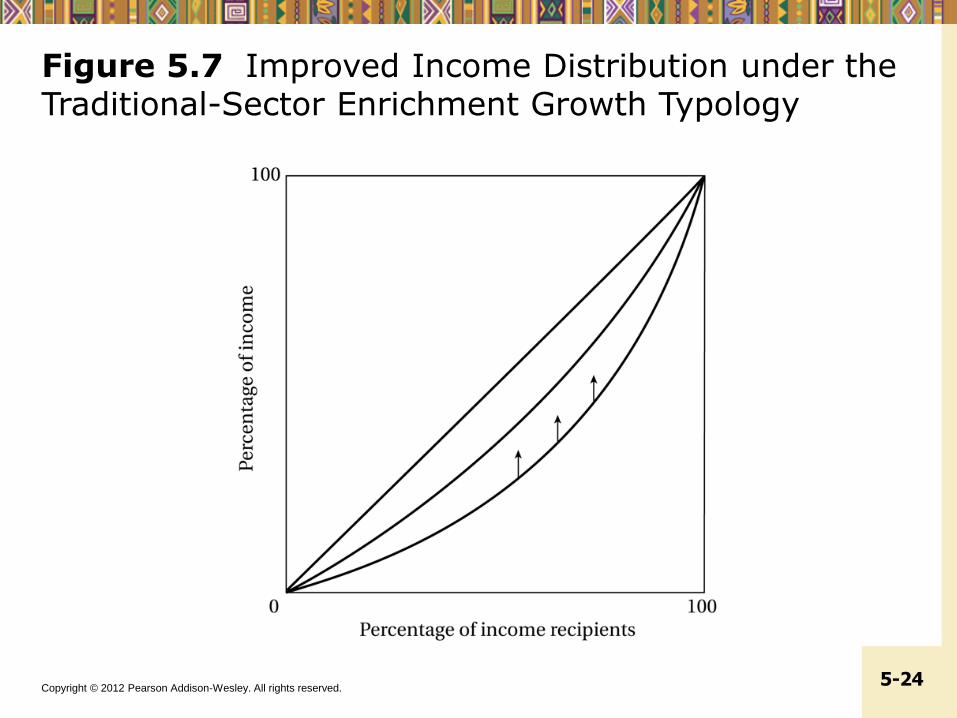
– Traditional sector enrichment (see Figure 5.7)
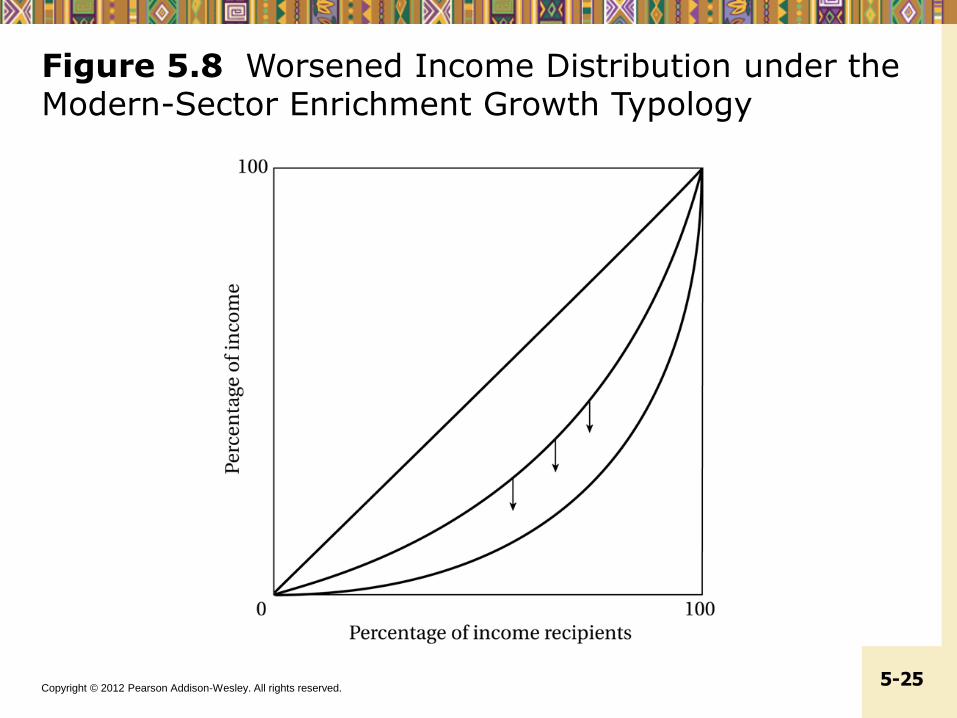
– Modern sector enrichment (see Figure 5.8)
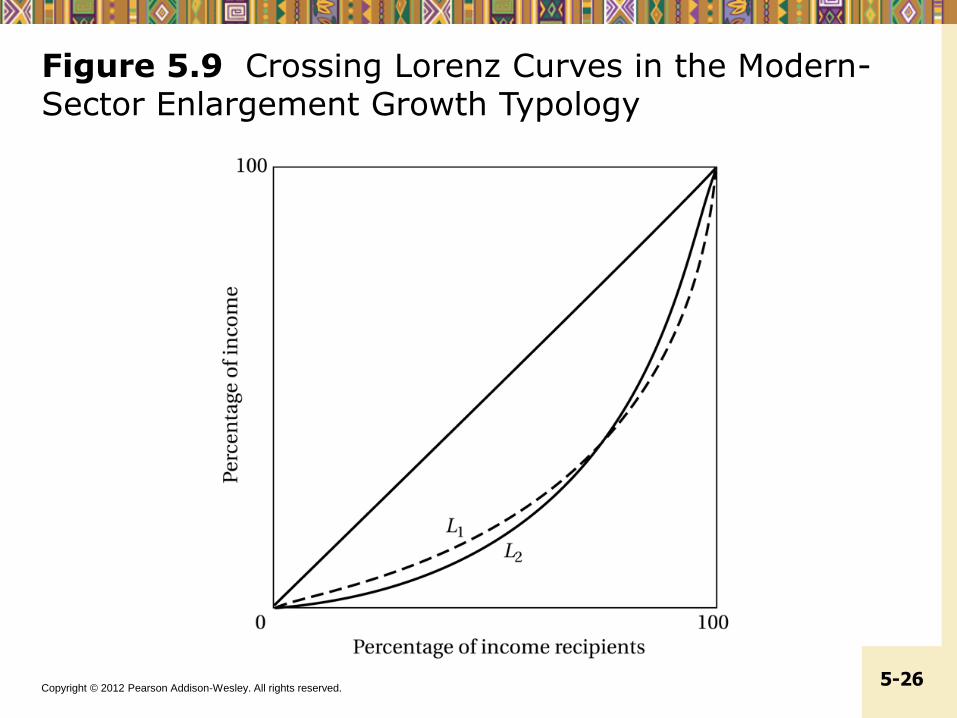
– Modern sector enlargement (see Figure 5.9)
Copyright © 2012 Pearson Addison-Wesley. All rights reserved. 5-24
Figure 5.7 Improved Income Distribution under the Traditional-Sector Enrichment Growth Typology
Copyright © 2012 Pearson Addison-Wesley. All rights reserved. 5-25
Figure 5.8 Worsened Income Distribution under the Modern-Sector Enrichment Growth Typology
Copyright © 2012 Pearson Addison-Wesley. All rights reserved. 5-26
Figure 5.9 Crossing Lorenz Curves in the Modern-Sector Enlargement Growth Typology

Copyright © 2012 Pearson Addison-Wesley. All rights reserved. 5-27
5.2 Poverty, Inequality, and Social Welfare
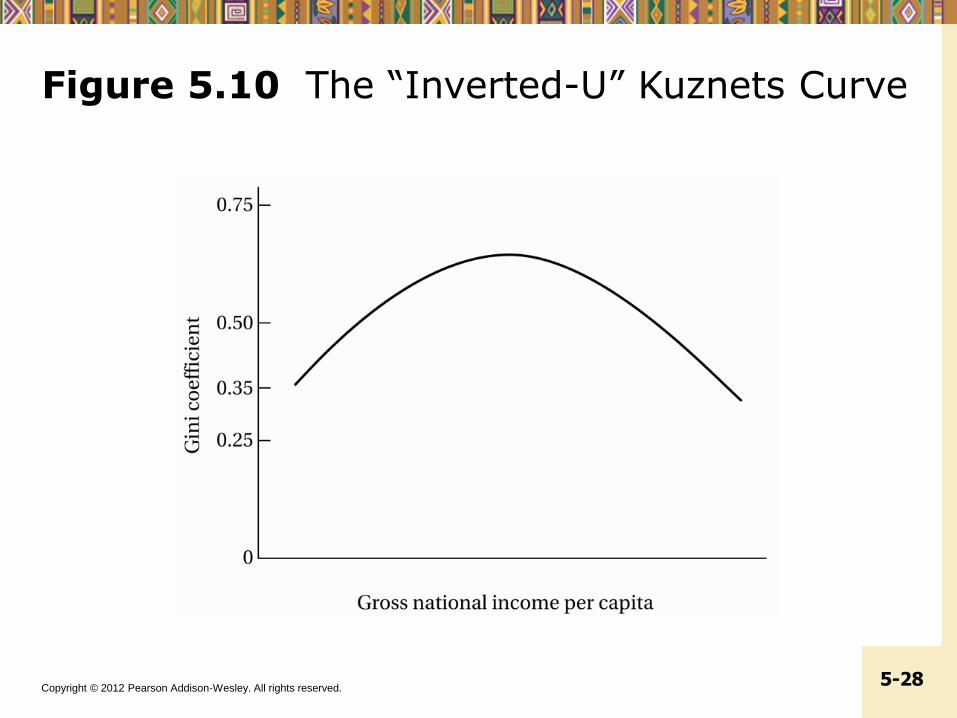
• Kuznets’ Inverted-U Hypothesis
Copyright © 2012 Pearson Addison-Wesley. All rights reserved. 5-28
Figure 5.10 The “Inverted-U” Kuznets Curve
Copyright © 2012 Pearson Addison-Wesley. All rights reserved. 5-29
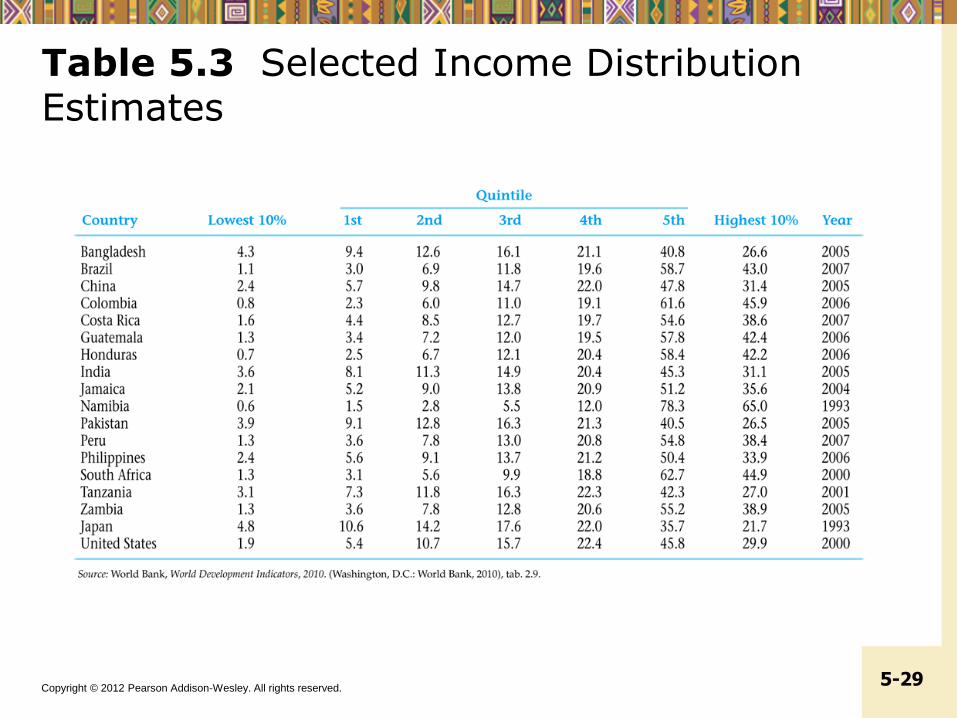
Table 5.3 Selected Income Distribution Estimates
Copyright © 2012 Pearson Addison-Wesley. All rights reserved. 5-30
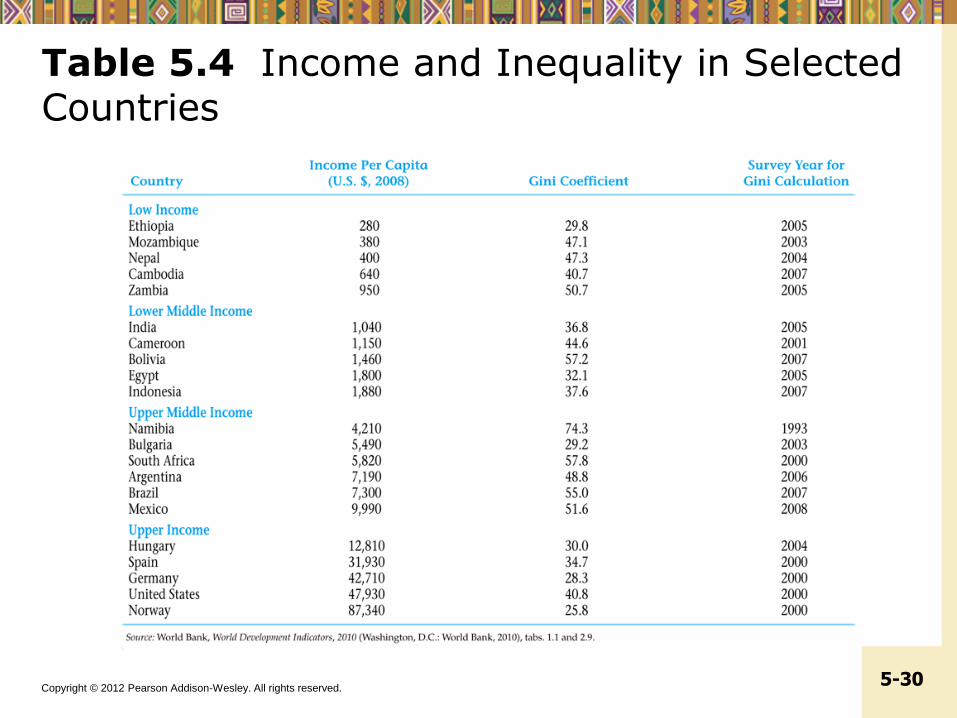
Table 5.4 Income and Inequality in Selected Countries
Copyright © 2012 Pearson Addison-Wesley. All rights reserved. 5-31
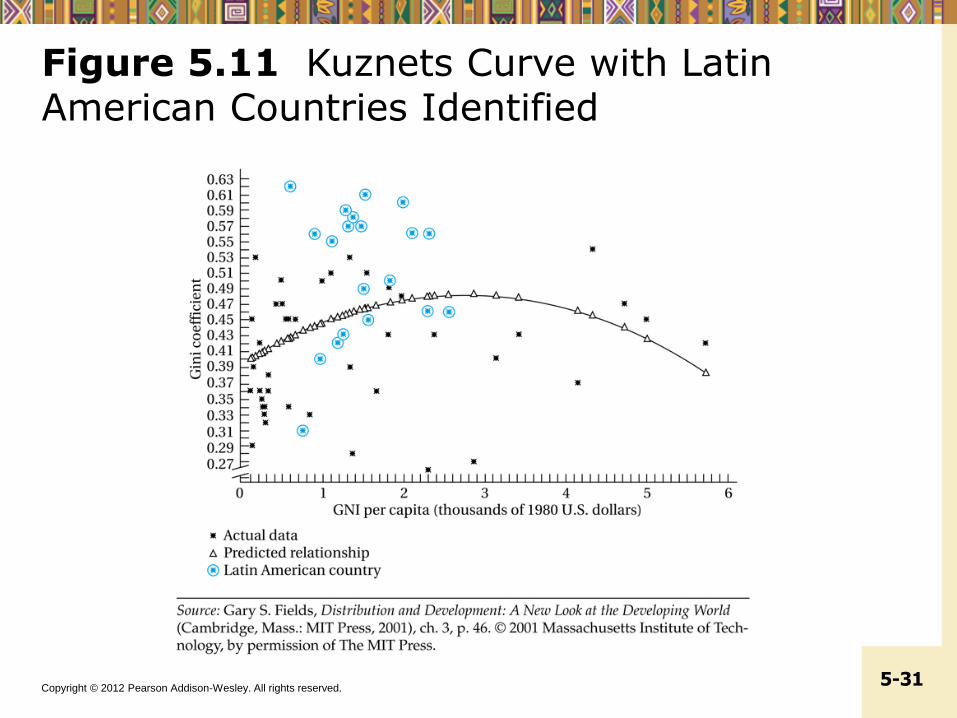
Figure 5.11 Kuznets Curve with Latin American Countries Identified
Copyright © 2012 Pearson Addison-Wesley. All rights reserved. 5-32
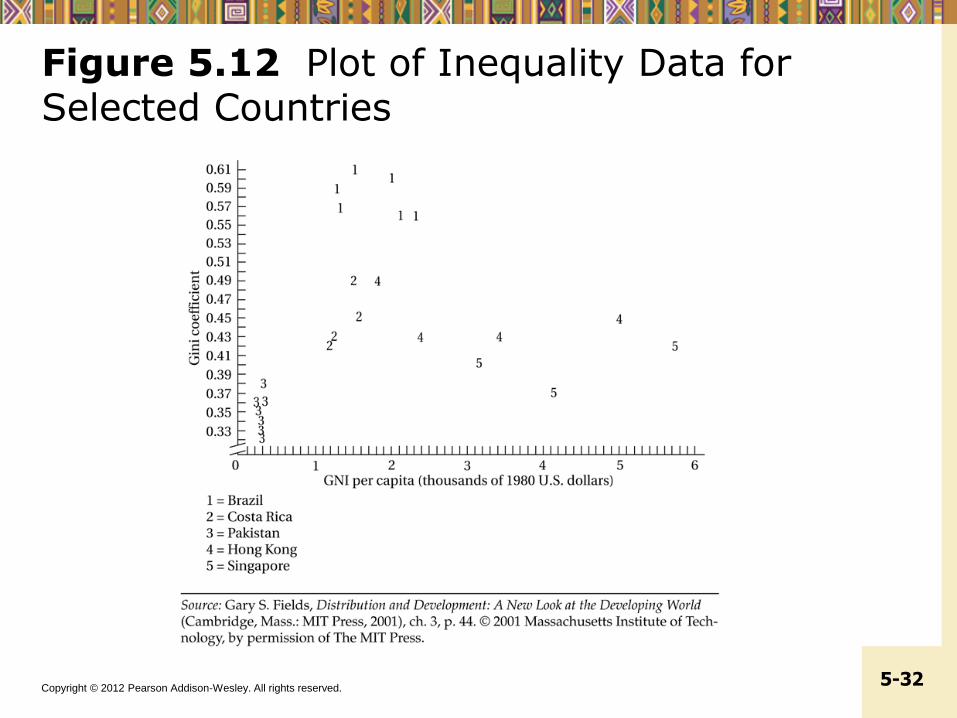
Figure 5.12 Plot of Inequality Data for Selected Countries

Copyright © 2012 Pearson Addison-Wesley. All rights reserved. 5-33
5.2 Poverty, Inequality, and Social Welfare
• Growth and Inequality
Copyright © 2012 Pearson Addison-Wesley. All rights reserved. 5-34
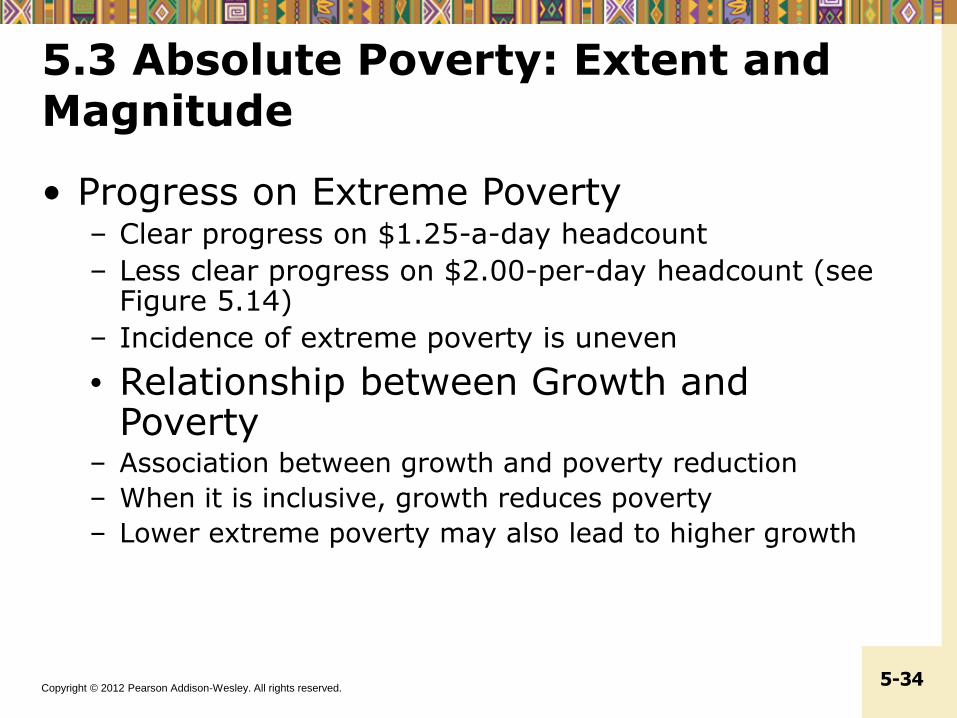
5.3 Absolute Poverty: Extent and Magnitude
• Progress on Extreme Poverty– Clear progress on $1.25-a-day headcount
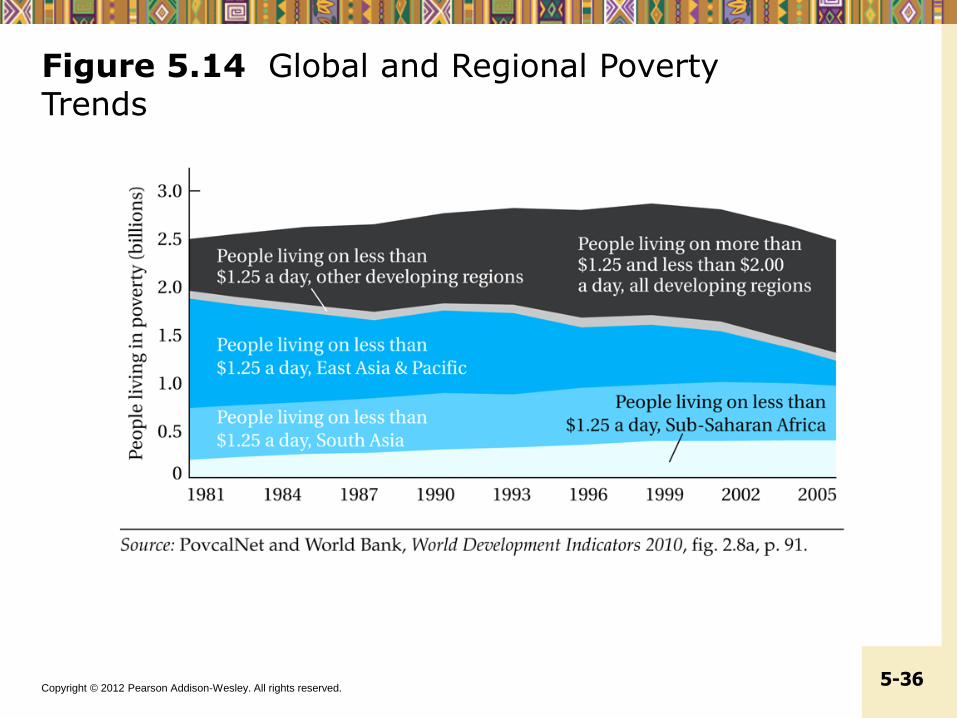
– Less clear progress on $2.00-per-day headcount (see Figure 5.14)
– Incidence of extreme poverty is uneven
• Relationship between Growth and Poverty
– Association between growth and poverty reduction
– When it is inclusive, growth reduces poverty
– Lower extreme poverty may also lead to higher growth
Copyright © 2012 Pearson Addison-Wesley. All rights reserved. 5-35
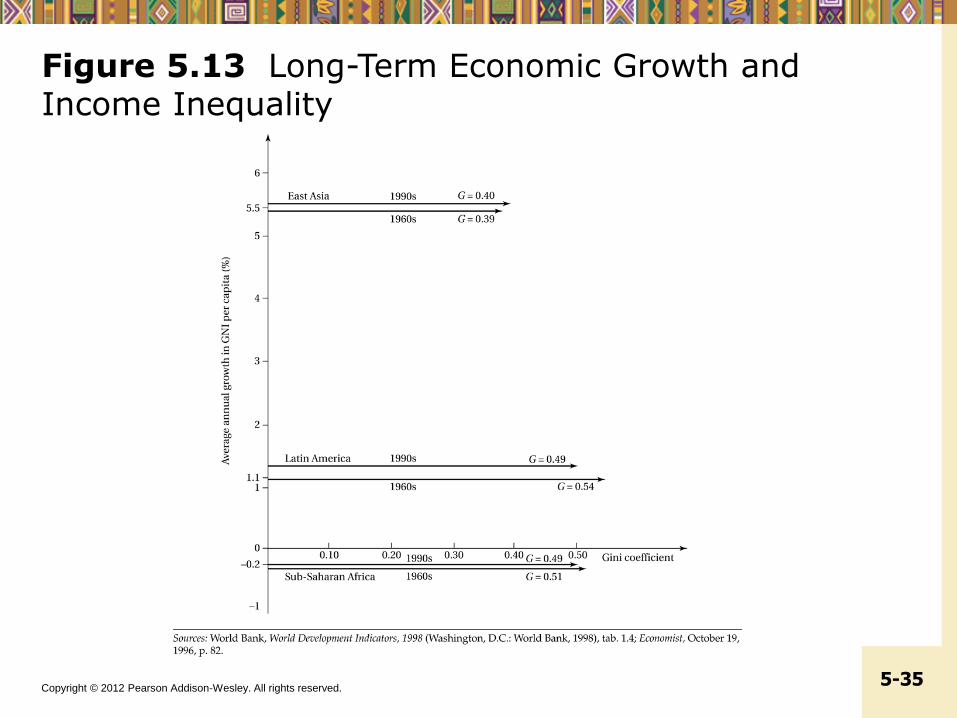
Figure 5.13 Long-Term Economic Growth and Income Inequality
Copyright © 2012 Pearson Addison-Wesley. All rights reserved. 5-36
Figure 5.14 Global and Regional PovertyTrends
Copyright © 2012 Pearson Addison-Wesley. All rights reserved. 5-37
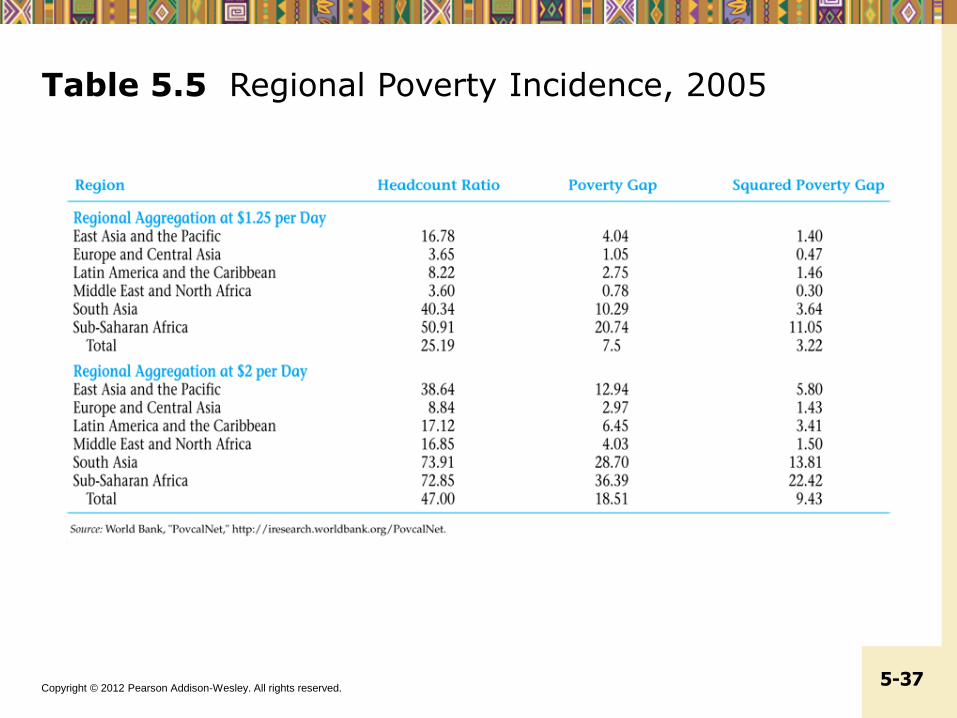
Table 5.5 Regional Poverty Incidence, 2005
Copyright © 2012 Pearson Addison-Wesley. All rights reserved. 5-38
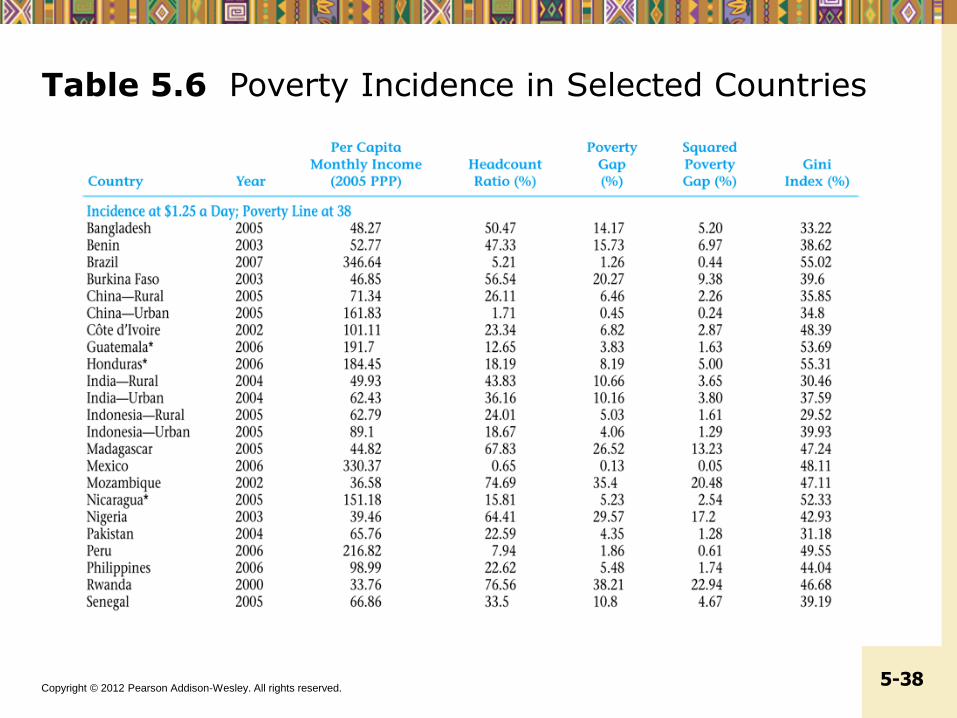
Table 5.6 Poverty Incidence in Selected Countries

Copyright © 2012 Pearson Addison-Wesley. All rights reserved. 5-39
Table 5.6 Poverty Incidence in Selected Countries (continued)
Copyright © 2012 Pearson Addison-Wesley. All rights reserved. 5-40
5.4 Economic Characteristics of High-Poverty Groups
• Rural poverty
• Women and poverty
• Ethnic minorities, indigenous populations, and poverty

Copyright © 2012 Pearson Addison-Wesley. All rights reserved. 5-41
Table 5.7 Poverty: Rural versus Urban
Copyright © 2012 Pearson Addison-Wesley. All rights reserved. 5-42
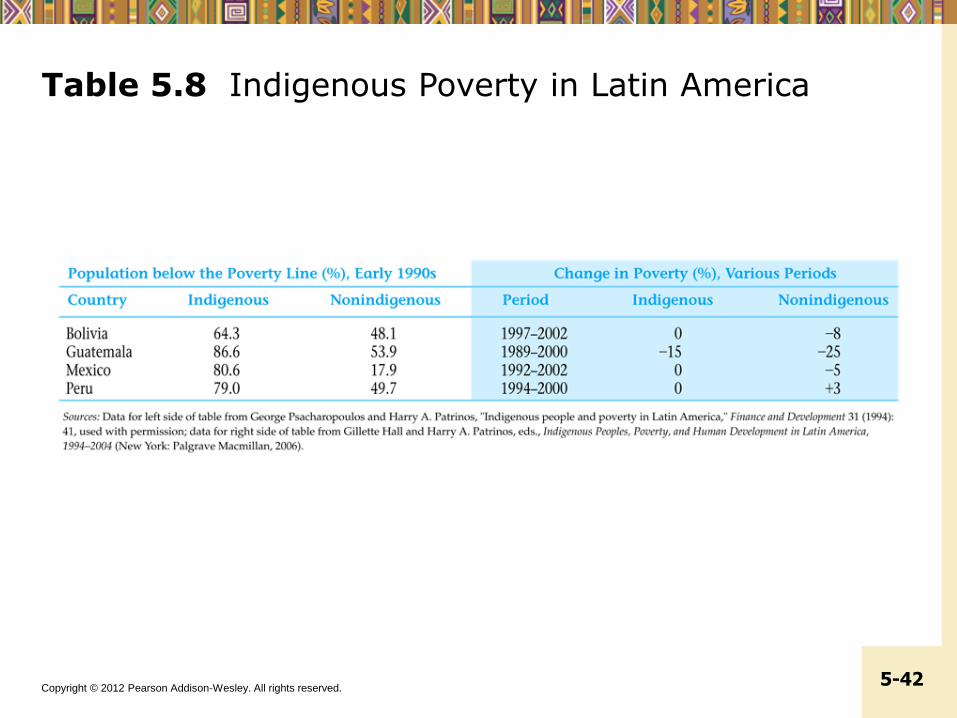
Table 5.8 Indigenous Poverty in Latin America
Copyright © 2012 Pearson Addison-Wesley. All rights reserved. 5-43
5.5 Policy Options on Income Inequality and Poverty: Some Basic Considerations
• Areas of Intervention
– Altering the functional distribution
– Mitigating the size distribution
– Moderating (reducing) the size distribution at upper levels
– Moderating (increasing) the size distribution at lower levels
Copyright © 2012 Pearson Addison-Wesley. All rights reserved. 5-44
5.5 Policy Options on Income Inequality and Poverty: Some Basic Considerations
• Policy options
– Changing relative factor prices
– Progressive redistribution of asset ownership
– Progressive taxation
– Transfer payments and public provision of goods and services
Copyright © 2012 Pearson Addison-Wesley. All rights reserved. 5-45
5.6 Summary and Conclusions: The Need for a Package of Policies
• Policies to correct factor price distortions
• Policies to change the distribution of assets, power, and access to education and associated employment opportunities
• Policies of progressive taxation and directed transfer payments
• Policies designed to build capabilities and human and social capital of the poor
Copyright © 2012 Pearson Addison-Wesley. All rights reserved. 5-46
Concepts for Review
• Absolute poverty
• Asset ownership
• Character of economic growth
• Decile
• Disposable income
• Factor share distribution of income
• Factors of production
• Foster-Greer-Thorbecke (FGT) index
• Functional distribution of income
• Gini coefficient
• Headcount index
• Income inequality
• Indirect taxes
• Kuznets curve
• Land reform
Copyright © 2012 Pearson Addison-Wesley. All rights reserved. 5-47
Concepts for Review (cont’d)
• Lorenz curve
• Multidimensional poverty index (MPI)
• Personal distribution of income
• Progressive income tax
• Public consumption
• Quintiles
• Redistribution policies
• Regressive tax
• Size distribution of income
• Subsidy
• Total poverty gap (TPG)
• Workfare programs
Copyright © 2012 Pearson Addison-Wesley. All rights reserved. 5-48
Appendix 5.1: Appropriate Technology and Employment Generation: The Price Incentive Model
• Choice of techniques
• Factor Price distortions and appropriate technology
• Possibilities of Labor-Capital substitution

Copyright © 2012 Pearson Addison-Wesley. All rights reserved. 5-49
Figure A5.1.1 Choice of Techniques: The Price Incentive Model
Copyright © 2012 Pearson Addison-Wesley. All rights reserved. 5-50
Appendix 5.2: The Ahluwalia-Chenery Welfare Index
• Constructing poverty-weighted index of social welfare
Copyright © 2012 Pearson Addison-Wesley. All rights reserved. 5-51
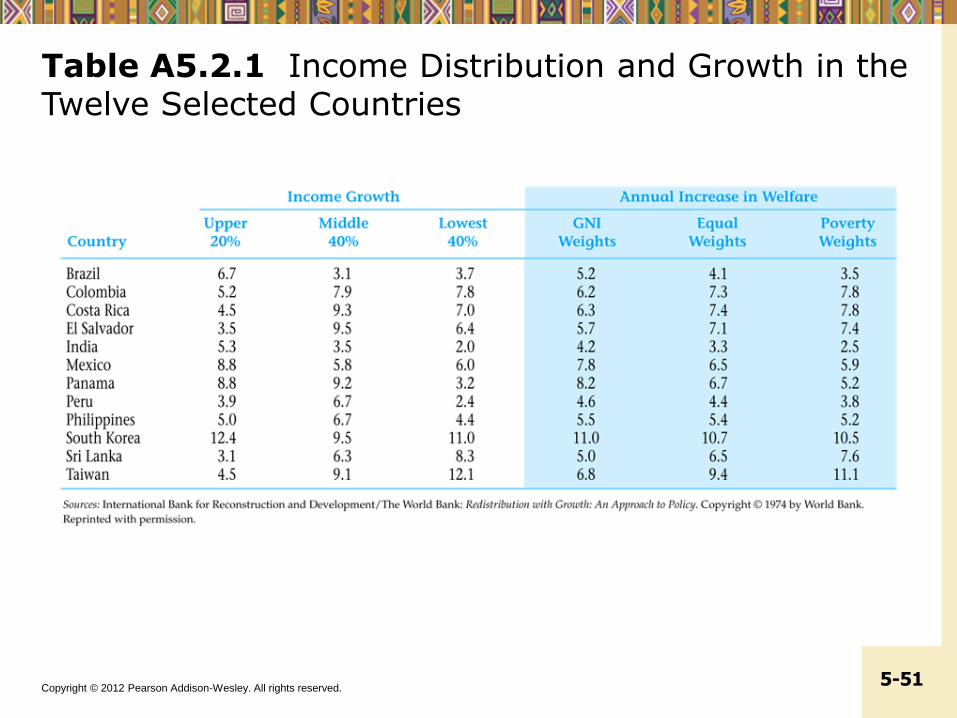
Table A5.2.1 Income Distribution and Growth in the Twelve Selected Countries