Embed Size (px)
Citation preview
Pt
Aa
b
a
ARRAA
KFPSPC
1
riitsgTf
fisar
0d
Journal of Membrane Science 343 (2009) 42–52
Contents lists available at ScienceDirect
Journal of Membrane Science
journa l homepage: www.e lsev ier .com/ locate /memsci
ower generation with pressure retarded osmosis: An experimental andheoretical investigation
ndrea Achilli a, Tzahi Y. Cath b, Amy E. Childress a,∗
Department of Civil and Environmental Engineering, University of Nevada Reno, Mail Stop 258, Reno, NV 89557, USADivision of Environmental Science and Engineering, Colorado School of Mines, Golden, CO 80401, USA
r t i c l e i n f o
rticle history:eceived 22 November 2008eceived in revised form 3 July 2009ccepted 7 July 2009vailable online 14 July 2009
eywords:orward osmosisressure retarded osmosisalinity powerower densityoncentration polarization
a b s t r a c t
Pressure retarded osmosis (PRO) was investigated as a viable source of renewable energy. In PRO, waterfrom a low salinity feed solution permeates through a membrane into a pressurized, high salinity drawsolution; power is obtained by depressurizing the permeate through a hydroturbine. A PRO model wasdeveloped to predict water flux and power density under specific experimental conditions. The modelrelies on experimental determination of the membrane water permeability coefficient (A), the membranesalt permeability coefficient (B), and the solute resistivity (K). A and B were determined under reverseosmosis conditions, while K was determined under forward osmosis (FO) conditions. The model wastested using experimental results from a bench-scale PRO system. Previous investigations of PRO wereunable to verify model predictions due to the lack of suitable membranes and membrane modules. Inthis investigation, the use of a custom-made laboratory-scale membrane module enabled the collectionof experimental PRO data. Results obtained with a flat-sheet cellulose triacetate (CTA) FO membrane
and NaCl feed and draw solutions closely matched model predictions. Maximum power densities of 2.7and 5.1 W/m2 were observed for 35 and 60 g/L NaCl draw solutions, respectively, at 970 kPa of hydraulicpressure. Power density was substantially reduced due to internal concentration polarization in the asym-metric CTA membranes and, to a lesser degree, to salt passage. External concentration polarization wasfound to exhibit a relatively small effect on reducing the osmotic pressure driving force. Using the pre-dictive PRO model, optimal membrane characteristics and module configuration can be determined inspeci
order to design a system. Introduction
Pressure retarded osmosis (PRO) could be a viable source ofenewable energy [1,2]. In a PRO system, water from a low salin-ty feed solution (e.g., fresh water) permeates through a membranento a pressurized, high salinity brine/draw solution (e.g., seawa-er); power is obtained by depressurizing a portion of the dilutedeawater through a hydroturbine (Fig. 1) [3]. It is estimated that thelobal energy production potential of PRO is on the order of 2000Wh per year [4], while the estimated global energy production
rom all renewable sources is approaching 10,000 TWh per year [5].The concept of harvesting energy generated during mixing of
resh and salt water was developed in the mid-1950s [6]. Follow-
ng the 1973 oil crisis, the interest in PRO for power generationpiked and led to several investigations of the technical [2,7,8]nd economic feasibility [1,2] of PRO. Loeb et al. began publishingesults from PRO experiments in 1976 [9]. They utilized hollow-fiber∗ Corresponding author. Tel.: +1 775 784 6942.E-mail address: [email protected] (A.E. Childress).
376-7388/$ – see front matter © 2009 Elsevier B.V. All rights reserved.oi:10.1016/j.memsci.2009.07.006
fically tailored for PRO processes.© 2009 Elsevier B.V. All rights reserved.
seawater reverse osmosis (RO) membranes enclosed in a “miniper-meator” (Permasep B-10). A pressurized brine flowed on the shellside of the bundle of hollow-fiber membranes and the fresh waterflowed through the bore. Further investigations of Loeb and Mehta[10], Mehta and Loeb [11,12], and Jellinek and Masuda [13] revealedpower outputs far below the expected outputs, likely due to theuse of RO membranes and membrane modules that were designedfor seawater desalination. It was determined that seawater ROmembranes were not suitable for forward osmosis (FO) and PROapplications due to their hydrophobicity and thick support layer[14]. Furthermore, it was found that existing membrane modulesdid not allow for high cross-flow velocity on the membrane surface[15]. Thus, the lack of suitable membranes and modules hinderedthe efforts to establish this technology [16]. Also, during this time,a few models were proposed to predict flux and pressure behaviorin PRO [10,12,17]; however, it was difficult to validate these models
because of the lack of suitable membranes and membrane modules.For example, Lee et al. [17] were only able to validate their modelunder FO and RO conditions.In the current investigation, for the first time, experimentalPRO results were compared with model predictions. The objective

A. Achilli et al. / Journal of Membrane Science 343 (2009) 42–52 43
sis (PR
obsstifPtfltudu
dawu
2
2
a(psophp�frcimtt
Fig. 1. Schematic of a pressure-retarded osmo
f this investigation was to evaluate the contributions of mem-rane characteristics and operating conditions to water flux andubsequently, to power density. Concentration polarization mayeverely reduce water flux and power density in PRO; however,he causes and effects of concentration polarization have not beennvestigated nearly as much for FO and PRO processes [15,18] asor RO processes [19,20]. In the current investigation, a predictiveRO model that includes the influence of draw solution, feed solu-ion, concentration polarization, and hydraulic pressure on waterux and subsequent power output was developed. The model was
ested using experimental results. Experiments were conductedsing current-generation FO membranes and a well-establishedraw solution (NaCl). Water flux and power density were evaluatednder different operating conditions.
With the availability of a PRO model, power density can be pre-icted for variable membrane characteristics, membrane structure,nd module configuration. The optimization of these parametersould contribute to the design of membranes and membrane mod-les specifically tailored for PRO processes.
. Theory
.1. Osmotic processes
Osmosis is the transport of water across a selectively perme-ble membrane from a solution of higher water chemical potentiallower osmotic pressure) to a solution of lower water chemicalotential (higher osmotic pressure). It is driven by a difference inolute molar concentrations across a membrane that allows passagef water, but rejects most solute molecules and ions. The osmoticressure differential (��) is the pressure which, if applied as aydraulic pressure (�P) to the more concentrated solution, wouldrevent net transport of water across the membrane. FO uses the� across the membrane, rather than a �P (as in RO), as the driving
orce for transport of water through the membrane. The FO processesults in concentration of a feed stream and dilution of a highly
oncentrated stream (referred to as the draw solution). Flux in FOs in the opposite direction of RO. PRO can be viewed as an inter-ediate process between FO and RO, hydraulic pressure is appliedo the draw solution (similar to RO) but the net water flux is still inhe direction of the concentrated draw solution (similar to FO). The
O) power plant. Figure adapted from Ref. [3].
general equation describing water transport in FO, RO, and PRO is
Jw = A(�� − �P) (1)
where Jw is the water flux and A is the water permeability coefficientof the membrane. For FO, �P is zero; for RO, �P > ��; and for PRO,�P < ��. The flux directions of the permeating water in FO, PRO,and RO are illustrated in Fig. 2. Also in Fig. 2, the orientation of anasymmetric membrane is indicated; in FO, the dense layer of themembrane faces the feed solution and in RO and PRO, the denselayer faces the draw solution.
In PRO, the power that can be generated per unit membrane area(i.e., the power density) is equal to the product of the water flux andthe hydraulic pressure differential across the membrane:
W = Jw �P = A(�� − �P)�P (2)
By differentiating Eq. (2) with respect to �P, it can be shown thatW reaches a maximum when �P = ��/2 (Fig. 3). Substituting thisvalue for �P in Eq. (2) yields:
Wmax = A��2
4(3)
Jw as a function of �P is illustrated in Fig. 3 for both real and idealconditions. The FO point (at �P = 0), the PRO zone (where �P < ��),and the RO zone (where �P > ��) are indicated. The flux reversalpoint occurs where �P = ��. Fig. 3 also illustrates W and Wmax inthe PRO zone.
2.2. Salt permeability
Membranes for osmotically-driven processes are susceptible toreverse salt diffusion, where a small amount of salt permeates themembrane from the draw solution to the feed solution due to theconcentration gradient across the membrane [21]. Reverse salt dif-fusion reduces the effective osmotic pressure difference across themembrane. The salt permeability coefficient of a semi-permeable
membrane can be obtained from RO experiments [17] and is givenby:B = A(1 − R)(�P − ��)R
(4)

44 A. Achilli et al. / Journal of Membrane Science 343 (2009) 42–52
F indica
wi
R
wi
2
ecaofo
ioelbfspc
FP
dilutive (�D,m < �D,b). The mass transfer coefficient (k) in the drawsolution is calculated using:
k = Sh D
dh(7)
ig. 2. Representation of solvent flow in FO, PRO, and RO. Membrane orientation is
here B is the salt permeability coefficient and R is salt rejection. Rs defined as:
= 1 − CP
CF(5)
here CP is the salt concentration in the permeate solution and CF
s the salt concentration in the feed solution.
.3. Concentration polarization
Another, more severe phenomenon, which also reduces theffective osmotic pressure difference across the membrane, isoncentration polarization [15]. Concentration polarization is theccumulation or depletion of solutes near an interface. As a resultf water crossing the membrane, the solute is concentrated on theeed side of the membrane surface and diluted on the permeate sidef the membrane surface.
Because the membranes used for osmotic processes are typ-cally asymmetric [22] (comprised of a thin dense layer on topf a porous support layer), concentration polarization occursxternally on the dense layer side and internally in the supportayer side. In PRO applications, the dense layer of the mem-
rane faces the draw solution and the porous support layeraces the feed solution (Fig. 2). This configuration is neces-ary to ensure that the membrane can sustain the hydraulicressure induced on the draw solution side [12,17,23]. In thisonfiguration, both dilutive external concentration polariza-
ig. 3. Magnitude and direction of Jw for FO, PRO, and RO and magnitude of W forRO is shown. Figure adapted from Ref. [17].
ted in each system by the thick black line representing the membrane dense layer.
tion and concentrative internal concentration polarization occur(Fig. 4).
2.4. External concentration polarization in PRO
Dilutive external concentration polarization is concentrationpolarization that results in the solute being diluted on the drawsolution side of the membrane. Dilutive external concentrationpolarization can be calculated from film theory [19,24]. The externalconcentration polarization modulus (�D,m/�D,b) is calculated using:
�D,m
�D,b= exp
(− Jw
k
)(6)
where �D,m is the osmotic pressure at the membrane surface and�D,b is the bulk osmotic pressure of the draw solution. Jw is negativein this equation because the water flux is in the direction of the moreconcentrated solution and the concentration polarization effect is
Fig. 4. Illustration of osmotic driving force profiles for an asymmetric membranewith the dense layer facing the draw solution (PRO mode). Internal and externalconcentration polarization are also shown.
mbran
wtslUu
S
w
2
ttsP
J
wCbs
K
wspc
2
cmiwt
J
wmp
(luaoa
K
2
fla
and 2.5 mm deep; it had an effective membrane area of 18.75 cm .Mesh spacers placed in the feed channel supported the membraneand enhanced the turbulence in the feed stream. The feed solutionwas contained in a 2-L reservoir. A high-pressure positive displace-ment pump (Wanner Engineering Inc., Minneapolis, MN) was used
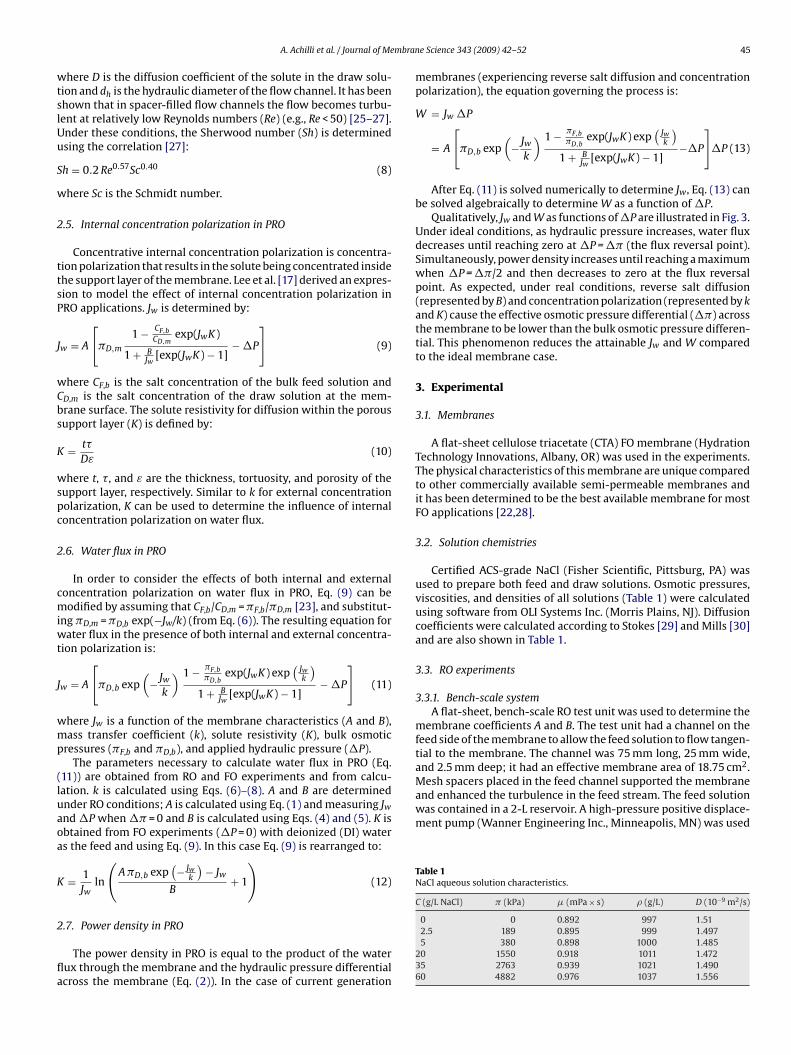
Table 1NaCl aqueous solution characteristics.
C (g/L NaCl) � (kPa) � (mPa × s) � (g/L) D (10−9 m2/s)
0 0 0.892 997 1.51
A. Achilli et al. / Journal of Me
here D is the diffusion coefficient of the solute in the draw solu-ion and dh is the hydraulic diameter of the flow channel. It has beenhown that in spacer-filled flow channels the flow becomes turbu-ent at relatively low Reynolds numbers (Re) (e.g., Re < 50) [25–27].nder these conditions, the Sherwood number (Sh) is determinedsing the correlation [27]:
h = 0.2 Re0.57Sc0.40 (8)
here Sc is the Schmidt number.
.5. Internal concentration polarization in PRO
Concentrative internal concentration polarization is concentra-ion polarization that results in the solute being concentrated insidehe support layer of the membrane. Lee et al. [17] derived an expres-ion to model the effect of internal concentration polarization inRO applications. Jw is determined by:
w = A
[�D,m
1 − CF,bCD,m
exp(JwK)
1 + BJw
[exp(JwK) − 1]− �P
](9)
here CF,b is the salt concentration of the bulk feed solution andD,m is the salt concentration of the draw solution at the mem-rane surface. The solute resistivity for diffusion within the porousupport layer (K) is defined by:
= t�
Dε(10)
here t, �, and ε are the thickness, tortuosity, and porosity of theupport layer, respectively. Similar to k for external concentrationolarization, K can be used to determine the influence of internaloncentration polarization on water flux.
.6. Water flux in PRO
In order to consider the effects of both internal and externaloncentration polarization on water flux in PRO, Eq. (9) can beodified by assuming that CF,b/CD,m = �F,b/�D,m [23], and substitut-
ng �D,m = �D,b exp(−Jw/k) (from Eq. (6)). The resulting equation forater flux in the presence of both internal and external concentra-
ion polarization is:
w = A
[�D,b exp
(− Jw
k
) 1 − �F,b�D,b
exp(JwK) exp(
Jwk
)1 + B
Jw[exp(JwK) − 1]
− �P
](11)
here Jw is a function of the membrane characteristics (A and B),ass transfer coefficient (k), solute resistivity (K), bulk osmotic
ressures (�F,b and �D,b), and applied hydraulic pressure (�P).The parameters necessary to calculate water flux in PRO (Eq.
11)) are obtained from RO and FO experiments and from calcu-ation. k is calculated using Eqs. (6)–(8). A and B are determinednder RO conditions; A is calculated using Eq. (1) and measuring Jw
nd �P when �� = 0 and B is calculated using Eqs. (4) and (5). K isbtained from FO experiments (�P = 0) with deionized (DI) waters the feed and using Eq. (9). In this case Eq. (9) is rearranged to:
= 1Jw
ln
(A �D,b exp
(− Jw
k
)− Jw
B+ 1
)(12)
.7. Power density in PRO
The power density in PRO is equal to the product of the waterux through the membrane and the hydraulic pressure differentialcross the membrane (Eq. (2)). In the case of current generation
e Science 343 (2009) 42–52 45
membranes (experiencing reverse salt diffusion and concentrationpolarization), the equation governing the process is:
W = Jw �P
= A
[�D,b exp
(− Jw
k
) 1 − �F,b�D,b
exp(JwK) exp(
Jwk
)1 + B
Jw[exp(JwK) − 1]
−�P
]�P (13)
After Eq. (11) is solved numerically to determine Jw, Eq. (13) canbe solved algebraically to determine W as a function of �P.
Qualitatively, Jw and W as functions of �P are illustrated in Fig. 3.Under ideal conditions, as hydraulic pressure increases, water fluxdecreases until reaching zero at �P = �� (the flux reversal point).Simultaneously, power density increases until reaching a maximumwhen �P = ��/2 and then decreases to zero at the flux reversalpoint. As expected, under real conditions, reverse salt diffusion(represented by B) and concentration polarization (represented by kand K) cause the effective osmotic pressure differential (��) acrossthe membrane to be lower than the bulk osmotic pressure differen-tial. This phenomenon reduces the attainable Jw and W comparedto the ideal membrane case.
3. Experimental
3.1. Membranes
A flat-sheet cellulose triacetate (CTA) FO membrane (HydrationTechnology Innovations, Albany, OR) was used in the experiments.The physical characteristics of this membrane are unique comparedto other commercially available semi-permeable membranes andit has been determined to be the best available membrane for mostFO applications [22,28].
3.2. Solution chemistries
Certified ACS-grade NaCl (Fisher Scientific, Pittsburg, PA) wasused to prepare both feed and draw solutions. Osmotic pressures,viscosities, and densities of all solutions (Table 1) were calculatedusing software from OLI Systems Inc. (Morris Plains, NJ). Diffusioncoefficients were calculated according to Stokes [29] and Mills [30]and are also shown in Table 1.
3.3. RO experiments
3.3.1. Bench-scale systemA flat-sheet, bench-scale RO test unit was used to determine the
membrane coefficients A and B. The test unit had a channel on thefeed side of the membrane to allow the feed solution to flow tangen-tial to the membrane. The channel was 75 mm long, 25 mm wide,
2
2.5 189 0.895 999 1.4975 380 0.898 1000 1.485
20 1550 0.918 1011 1.47235 2763 0.939 1021 1.49060 4882 0.976 1037 1.556
46 A. Achilli et al. / Journal of Membrane Science 343 (2009) 42–52
bench
tllbTF
3
ftt3e(aot
3
3
imbbdRvtiMsurrtcrmt
3.7. PRO performance tests
PRO performance tests were conducted with the dense layer ofthe membrane facing the draw solution. A matrix of experimentswas performed (Table 2). Three feed solution concentrations (0,
Table 2PRO experiment conditions.
CFeed (g/L NaCl) CDS (g/L NaCl) �P (kPa)
0 35 00 35 3100 35 6500 35 9702.5 35 02.5 35 3102.5 35 6502.5 35 9705.0 35 05.0 35 3105.0 35 6505.0 35 9700 60 00 60 3100 60 6500 60 9702.5 60 02.5 60 3102.5 60 650
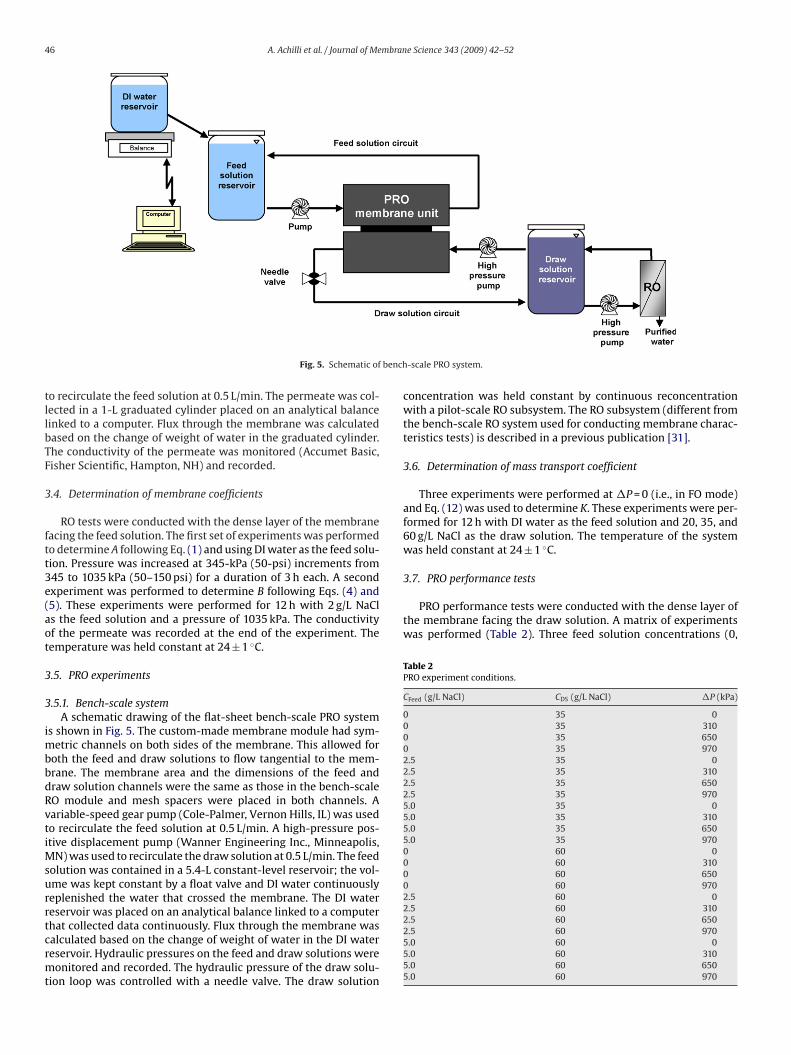
Fig. 5. Schematic of
o recirculate the feed solution at 0.5 L/min. The permeate was col-ected in a 1-L graduated cylinder placed on an analytical balanceinked to a computer. Flux through the membrane was calculatedased on the change of weight of water in the graduated cylinder.he conductivity of the permeate was monitored (Accumet Basic,isher Scientific, Hampton, NH) and recorded.
.4. Determination of membrane coefficients
RO tests were conducted with the dense layer of the membraneacing the feed solution. The first set of experiments was performedo determine A following Eq. (1) and using DI water as the feed solu-ion. Pressure was increased at 345-kPa (50-psi) increments from45 to 1035 kPa (50–150 psi) for a duration of 3 h each. A secondxperiment was performed to determine B following Eqs. (4) and5). These experiments were performed for 12 h with 2 g/L NaCls the feed solution and a pressure of 1035 kPa. The conductivityf the permeate was recorded at the end of the experiment. Theemperature was held constant at 24 ± 1 ◦C.
.5. PRO experiments
.5.1. Bench-scale systemA schematic drawing of the flat-sheet bench-scale PRO system
s shown in Fig. 5. The custom-made membrane module had sym-etric channels on both sides of the membrane. This allowed for
oth the feed and draw solutions to flow tangential to the mem-rane. The membrane area and the dimensions of the feed andraw solution channels were the same as those in the bench-scaleO module and mesh spacers were placed in both channels. Aariable-speed gear pump (Cole-Palmer, Vernon Hills, IL) was usedo recirculate the feed solution at 0.5 L/min. A high-pressure pos-tive displacement pump (Wanner Engineering Inc., Minneapolis,
N) was used to recirculate the draw solution at 0.5 L/min. The feedolution was contained in a 5.4-L constant-level reservoir; the vol-me was kept constant by a float valve and DI water continuouslyeplenished the water that crossed the membrane. The DI watereservoir was placed on an analytical balance linked to a computer
hat collected data continuously. Flux through the membrane wasalculated based on the change of weight of water in the DI watereservoir. Hydraulic pressures on the feed and draw solutions wereonitored and recorded. The hydraulic pressure of the draw solu-ion loop was controlled with a needle valve. The draw solution
-scale PRO system.
concentration was held constant by continuous reconcentrationwith a pilot-scale RO subsystem. The RO subsystem (different fromthe bench-scale RO system used for conducting membrane charac-teristics tests) is described in a previous publication [31].
3.6. Determination of mass transport coefficient
Three experiments were performed at �P = 0 (i.e., in FO mode)and Eq. (12) was used to determine K. These experiments were per-formed for 12 h with DI water as the feed solution and 20, 35, and60 g/L NaCl as the draw solution. The temperature of the systemwas held constant at 24 ± 1 ◦C.
2.5 60 9705.0 60 05.0 60 3105.0 60 6505.0 60 970
A. Achilli et al. / Journal of Membrane Science 343 (2009) 42–52 47
Few
26t6afpp
4
4
ipTma
Fp1
Table 3Mass transfer coefficient (k) at various draw solution concentrations.
CDS (g/L NaCl) Sh D (10−9 m2/s) dh (10−4 m) k (10−5 m/s)
20 52.2 1.472 9.46 8.4335 53.8 1.490 9.46 8.4860 52.7 1.556 9.46 8.66
Table 4Solute resistivity (K) at various draw solution concentrations with DI water as feedsolution.
CDS (g/L) K (105 s/m) t�/ε (10−4 m)
20 4.68 7.07
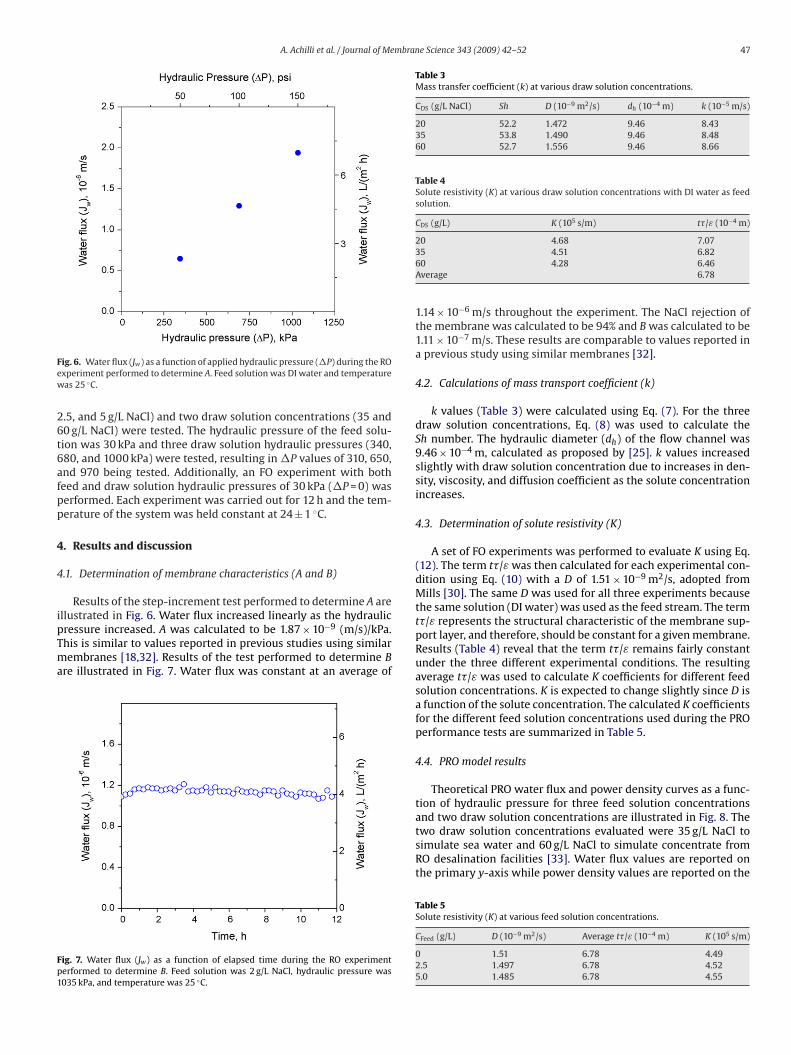
ig. 6. Water flux (Jw) as a function of applied hydraulic pressure (�P) during the ROxperiment performed to determine A. Feed solution was DI water and temperatureas 25 ◦C.
.5, and 5 g/L NaCl) and two draw solution concentrations (35 and0 g/L NaCl) were tested. The hydraulic pressure of the feed solu-ion was 30 kPa and three draw solution hydraulic pressures (340,80, and 1000 kPa) were tested, resulting in �P values of 310, 650,nd 970 being tested. Additionally, an FO experiment with botheed and draw solution hydraulic pressures of 30 kPa (�P = 0) waserformed. Each experiment was carried out for 12 h and the tem-erature of the system was held constant at 24 ± 1 ◦C.
. Results and discussion
.1. Determination of membrane characteristics (A and B)
Results of the step-increment test performed to determine A arellustrated in Fig. 6. Water flux increased linearly as the hydraulic
ressure increased. A was calculated to be 1.87 × 10⁻⁹ (m/s)/kPa.his is similar to values reported in previous studies using similarembranes [18,32]. Results of the test performed to determine Bre illustrated in Fig. 7. Water flux was constant at an average of
ig. 7. Water flux (Jw) as a function of elapsed time during the RO experimenterformed to determine B. Feed solution was 2 g/L NaCl, hydraulic pressure was035 kPa, and temperature was 25 ◦C.
35 4.51 6.8260 4.28 6.46Average 6.78
1.14 × 10⁻⁶ m/s throughout the experiment. The NaCl rejection ofthe membrane was calculated to be 94% and B was calculated to be1.11 × 10−7 m/s. These results are comparable to values reported ina previous study using similar membranes [32].
4.2. Calculations of mass transport coefficient (k)
k values (Table 3) were calculated using Eq. (7). For the threedraw solution concentrations, Eq. (8) was used to calculate theSh number. The hydraulic diameter (dh) of the flow channel was9.46 × 10−4 m, calculated as proposed by [25]. k values increasedslightly with draw solution concentration due to increases in den-sity, viscosity, and diffusion coefficient as the solute concentrationincreases.
4.3. Determination of solute resistivity (K)
A set of FO experiments was performed to evaluate K using Eq.(12). The term t�/ε was then calculated for each experimental con-dition using Eq. (10) with a D of 1.51 × 10⁻⁹ m2/s, adopted fromMills [30]. The same D was used for all three experiments becausethe same solution (DI water) was used as the feed stream. The termt�/ε represents the structural characteristic of the membrane sup-port layer, and therefore, should be constant for a given membrane.Results (Table 4) reveal that the term t�/ε remains fairly constantunder the three different experimental conditions. The resultingaverage t�/ε was used to calculate K coefficients for different feedsolution concentrations. K is expected to change slightly since D isa function of the solute concentration. The calculated K coefficientsfor the different feed solution concentrations used during the PROperformance tests are summarized in Table 5.
4.4. PRO model results
Theoretical PRO water flux and power density curves as a func-tion of hydraulic pressure for three feed solution concentrationsand two draw solution concentrations are illustrated in Fig. 8. The
two draw solution concentrations evaluated were 35 g/L NaCl tosimulate sea water and 60 g/L NaCl to simulate concentrate fromRO desalination facilities [33]. Water flux values are reported onthe primary y-axis while power density values are reported on theTable 5Solute resistivity (K) at various feed solution concentrations.
CFeed (g/L) D (10−9 m2/s) Average t�/ε (10−4 m) K (105 s/m)
0 1.51 6.78 4.492.5 1.497 6.78 4.525.0 1.485 6.78 4.55
48 A. Achilli et al. / Journal of Membrane Science 343 (2009) 42–52
F lied hya
swPis(aAdcpsdfm
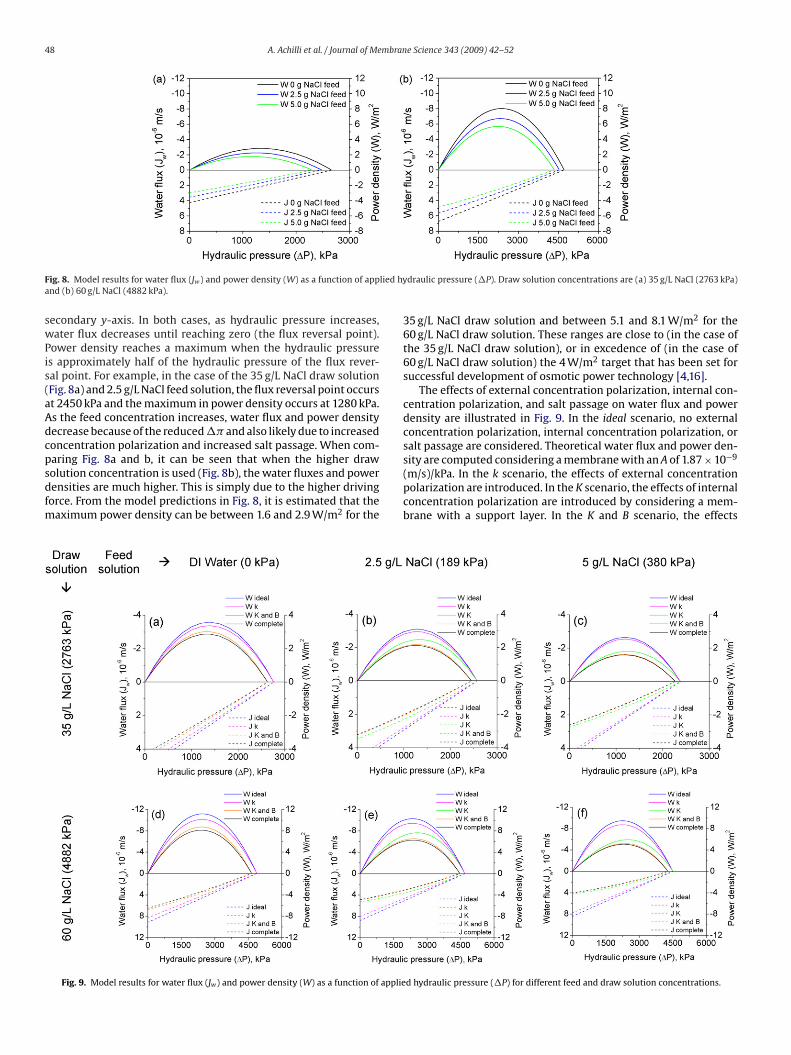
ig. 8. Model results for water flux (Jw) and power density (W) as a function of appnd (b) 60 g/L NaCl (4882 kPa).
econdary y-axis. In both cases, as hydraulic pressure increases,ater flux decreases until reaching zero (the flux reversal point).
ower density reaches a maximum when the hydraulic pressures approximately half of the hydraulic pressure of the flux rever-al point. For example, in the case of the 35 g/L NaCl draw solutionFig. 8a) and 2.5 g/L NaCl feed solution, the flux reversal point occurst 2450 kPa and the maximum in power density occurs at 1280 kPa.s the feed concentration increases, water flux and power densityecrease because of the reduced �� and also likely due to increasedoncentration polarization and increased salt passage. When com-
aring Fig. 8a and b, it can be seen that when the higher drawolution concentration is used (Fig. 8b), the water fluxes and powerensities are much higher. This is simply due to the higher drivingorce. From the model predictions in Fig. 8, it is estimated that theaximum power density can be between 1.6 and 2.9 W/m2 for the
Fig. 9. Model results for water flux (Jw) and power density (W) as a function of applie
draulic pressure (�P). Draw solution concentrations are (a) 35 g/L NaCl (2763 kPa)
35 g/L NaCl draw solution and between 5.1 and 8.1 W/m2 for the60 g/L NaCl draw solution. These ranges are close to (in the case ofthe 35 g/L NaCl draw solution), or in excedence of (in the case of60 g/L NaCl draw solution) the 4 W/m2 target that has been set forsuccessful development of osmotic power technology [4,16].
The effects of external concentration polarization, internal con-centration polarization, and salt passage on water flux and powerdensity are illustrated in Fig. 9. In the ideal scenario, no externalconcentration polarization, internal concentration polarization, orsalt passage are considered. Theoretical water flux and power den-
−9
sity are computed considering a membrane with an A of 1.87 × 10(m/s)/kPa. In the k scenario, the effects of external concentrationpolarization are introduced. In the K scenario, the effects of internalconcentration polarization are introduced by considering a mem-brane with a support layer. In the K and B scenario, the effectsd hydraulic pressure (�P) for different feed and draw solution concentrations.

mbran
ocnieuiotepohc
vpmd
a((minwoiig
o
Fd
A. Achilli et al. / Journal of Me
f both internal concentration polarization and salt passage areonsidered (a B of 1.11 × 10⁻⁷ m/s was used). In the complete sce-ario, the combined effects of external concentration polarization,
nternal concentration polarization, and salt passage are consid-red. In Fig. 9a and d, a K scenario does not exist; when DI water issed as the feed solution and no salt passage is considered, there
s no internal concentration polarization because there is no saltn the feed side of the membrane. It is also worth noting thathe effect of salt passage alone (i.e., a B scenario) is not consid-red. Salt passage cannot be isolated from internal concentrationolarization because salt passage affects process performancenly if the membrane has a support layer, and if the membraneas a support layer, internal concentration polarization must beonsidered.
As expected, in all six figures, water flux and power densityalues decrease as the model gets more complex. Concentrationolarization and salt passage reduce the driving force across theembrane; however, their effects vary depending on the feed and
raw solution concentrations.The effects of internal concentration polarization (K scenario)
re greater than the effects of external concentration polarizationk scenario). Also, the effects of internal concentration polarizationK scenario) are enhanced by salt passage (K and B scenario). The
agnitudes of internal concentration polarization (K scenario) andnternal concentration polarization plus salt passage (K and B sce-ario) increase with increasing feed solution concentrations andith increasing draw solution concentrations while the magnitude
f external concentration polarization (k scenario) decreases with
ncreasing feed solution concentrations and increases with increas-ng draw solution concentrations. Explanations for these trends areiven below.The external concentration polarization modulus is dependentn flux (Eq. (6)) and decreases as water flux decreases. Increasing
ig. 10. Experimental results for water flux (Jw) and power density (W) as a function of aifferent feed and draw solution concentrations. Temperature was 25 ◦C.
e Science 343 (2009) 42–52 49
feed solution concentration (0 to 2.5 to 5 g/L) decreases the driv-ing force and subsequently, the attainable water flux. This causes adecrease in the effects of external concentration polarization. Thiscan be seen in Fig. 9 by comparing the difference between the idealand k scenarios either for Fig. 9a–c or d–f. Similarly, increasing drawsolution concentration (35 to 60 g/L) increases the driving force andflux. This causes an increase in the effect of external concentra-tion polarization, which can be seen by comparing the differencebetween the ideal and k scenarios either for Fig. 9a and d or b ande or c and f.
The analysis of internal concentration polarization is more com-plex. Its modulus, implicitly contained in Eq. (9), depends onboth water flux and feed concentration; it decreases as water fluxdecreases and increases as feed concentration increases. Resultsshow that internal concentration polarization becomes more severeas feed concentration increases (and water flux decreases) (0 to 2.5to 5 g/L), thus, it appears that internal concentration polarizationmay be more dependent on feed concentration than on water flux.This can be seen by comparing the difference between the idealand K scenarios for Fig. 9b and c or e and f. The effect of waterflux alone on internal concentration polarization can be isolatedby comparing the difference between the ideal and K scenariosbetween Fig. 9b and e or c and f. When the feed solution is con-stant, the increased draw solution concentration results in higherwater fluxes and increased internal concentration polarization.
It has been shown that internal and external concentra-tion polarization in PRO depend on water flux; when waterflux approaches zero (i.e., the hydraulic draw solution pressure
approaches the osmotic pressure differential across the mem-brane), the contributions of internal and external concentrationpolarization to water flux reduction also approach zero and fluxesfor the k and K scenarios approach that for the ideal scenario. How-ever, the K and B and complete scenarios do not follow this behavior.pplied hydraulic pressure (�P) (points) compared with model results (lines) under
50 A. Achilli et al. / Journal of Membrane Science 343 (2009) 42–52
Table 6Comparison between power density results from the literature and from the current study.
Reference �� (kPa) �P (kPa) Jw (10−6 m/s) W (W/m2) W/(�� − �P) (10−3 W/m2 × kPa)
[9] 2533 1216 0.29 0.35 0.27[10] 10132 1925 0.81 1.56 0.19[ 1[ 7T 1T 1
Totbpssp
4
thetel
bsNTtaeubpw
FW
11] 8106 4053 0.812] 7802 4053 0.7his study 2763 972 2.8his study 4882 972 5.2
he salt that crosses the membrane increases the salt concentrationf the feed solution at the membrane surface (CF,m), which reduceshe osmotic pressure differential across the dense layer of the mem-rane, and therefore, reduces the pressure at which the flux reversaloint occurs. Reverse salt diffusion is not flux-dependent and isolely responsible for the reduction of the flux reversal point pres-ure. If reverse salt diffusion could be eliminated, the flux reversaloint, and hence Wmax, would be greater.
.5. PRO experimental results
Fig. 10 compares water flux and power density experimen-al results (symbols) with model results (lines). The maximumydraulic pressure differential that could be achieved during thexperiments was 970 kPa. Larger pressures caused perforation ofhe membrane because the spacers placed in the feed channelsssentially tore the membrane. The experimental data closely fol-ow the model results.
At a pressure of 970 kPa, the water fluxes achieved wereetween 1.8 × 10⁻⁶ and 2.8 × 10⁻⁶ m/s for the 35 g/L NaCl drawolution and between 3.6 × 10⁻⁶ and 5.2 × 10⁻⁶ m/s for the 60 g/LaCl draw solution, depending on feed solution concentrations.hese flux values are well above results previously reported inhe literature (Table 6), likely due to the improved membranend membrane module used in the current investigation. Loeb
t al. [9], Loeb and Mehta [10], and Mehta and Loeb [11,12]sed hydrophobic polymeric membranes and hollow-fiber mem-rane modules not particularly suited for PRO applications. Theower densities achieved in the current investigation (Fig. 10)ere up to 2.7 W/m2 for a 35 g/L NaCl (2763 kPa) draw solu-ig. 11. Model results for maximum power density (Wmax) as a function of water permemax achievable with DI water feed solution and 35 g/L NaCl draw solution concentration
3.27 0.813.12 0.832.73 1.525.06 1.30
tion and up to 5.1 W/m2 for a 60 g/L NaCl (4882 kPa) drawsolution. In order to compare these values with those previ-ously reported in the literature, a normalized power densityvalue which takes into account the draw solution concentrationsand hydraulic pressures used in previous investigations, was cal-culated (W/(�� − �P)). From Table 6 (last column) it can beseen that the normalized power density values from the currentinvestigation are well above results previously reported in the lit-erature.
The proposed model provides guidance on how to increasepower density in PRO operations. Changing operating conditions(e.g., increasing cross-flow on the membrane) can marginallyimprove power density by decreasing the effect of external con-centration polarization. Greater improvement could be achievedby modifying the membrane structure. For example, a substan-tial improvement in the power density output could be made byoptimization of the membrane support layer to reduce the inter-nal concentration polarization that occurs. Specifically, the powerdensity could be increased by up to 70% by reducing internal con-centration polarization (seen by comparing the complete scenarioswith the k scenarios in Fig. 10). Thus, development of new mem-branes with thinner, less tortuous, and more porous support layersmay be a key factor in successful osmotic power development.
Furthermore, in the current study, the pressure drop along themembrane module was directly measured and found negligible due
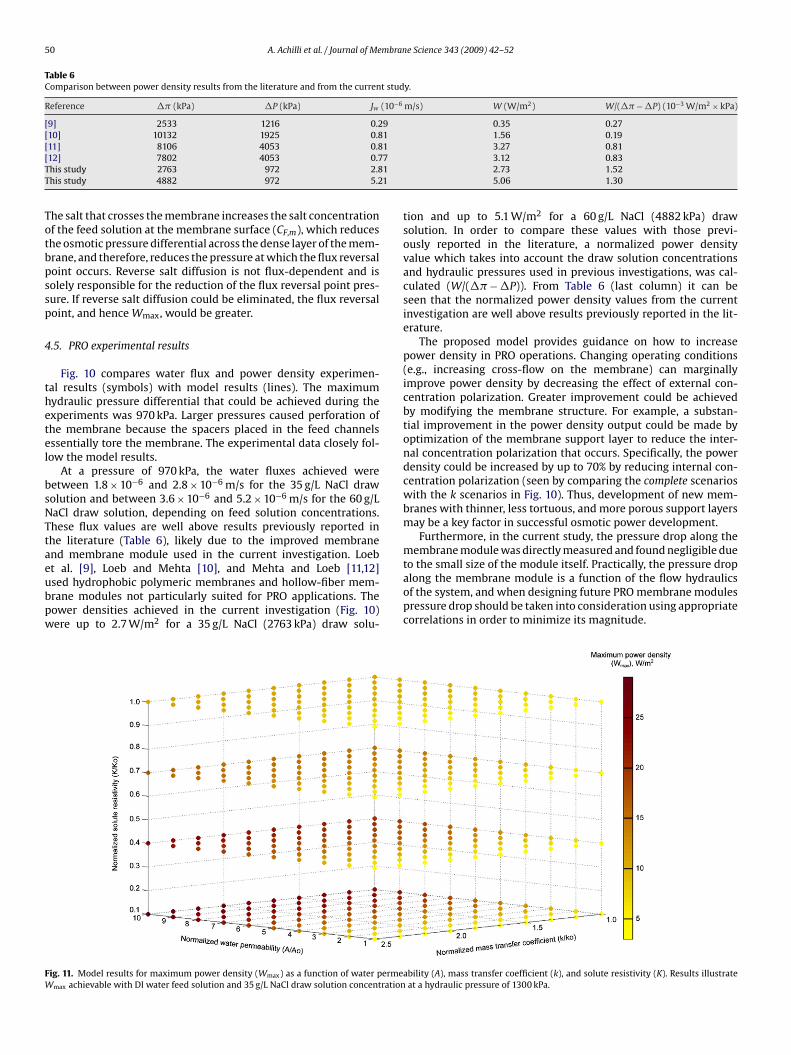
to the small size of the module itself. Practically, the pressure dropalong the membrane module is a function of the flow hydraulicsof the system, and when designing future PRO membrane modulespressure drop should be taken into consideration using appropriatecorrelations in order to minimize its magnitude.ability (A), mass transfer coefficient (k), and solute resistivity (K). Results illustrateat a hydraulic pressure of 1300 kPa.
mbrane Science 343 (2009) 42–52 51
c3autmdecmladpatstod
5
wdcuflcotfestfd
baic
A
EI
B salt permeability coefficient (m/s)CD,b salt concentration of the bulk draw solution (g/L)CD,m salt concentration of the draw solution at the mem-
brane surface (g/L)CF,b salt concentration of the bulk feed solution (g/L)CF,m salt concentration of the feed solution at the mem-
brane surface (g/L)CF salt concentration in the feed solution (g/L)CP salt concentration in the permeate solution (g/L)D salt diffusion coefficient (m2/s)dh hydraulic diameter (m)Jw water flux (m/s)k external concentration polarization mass transfer
coefficient (m/s)K internal concentration polarization mass transfer
coefficient (s/m)L length of channel (m)R salt rejectionRe Reynolds numberSc Schmidt numberSh Sherwood numbert thickness (m)
[
[
[
[
[
[
A. Achilli et al. / Journal of Me
Fig. 11 illustrates how the maximum power density wouldhange by varying A, k, and K. This example was constructed using5 g/L NaCl as the draw solution, DI water as the feed solution, and�P of approximately 1300 kPa. In this example, A was increasedp to 10 times from the values determined earlier in this inves-igation to represent the typical permeability of a nanofiltration
embrane. k was increased up to 2.5 times compared to the valuesetermined earlier to represent a mass transfer coefficient with Requal to 1000, which is the typical upper limit for spacer-filled flowhannels [25,27]. K was reduced up to a tenth of the value deter-ined earlier to simulate a very thin membrane support layer with
ow tortuosity and high porosity. These values are extreme and notchievable with current membrane technologies but are used toemonstrate the relative contribution of the three parameters toower density. Results show that combining the improvements ofll three parameters could lead to a power density of over 28 W/m2;his is a ten-fold increase from the earlier experimental PRO resultshown in this study. The results also show that A is the parameterhat influences Wmax the most, closely followed by K. The influencef both K and k on Wmax is greater when A is high, due to theirependency on Jw, as explained in the model results section.
. Conclusions
In this investigation, for the first time, experimental PRO resultsere compared with model predictions. The PRO model waseveloped to predict water flux and power density under spe-ific experimental conditions. PRO experiments were performedsing a bench-scale PRO system utilizing a custom-made cross-ow membrane module. Data collected from the PRO experimentslosely matched model predictions. At 970 kPa hydraulic pressuren the draw solution side, the power densities achieved were upo 2.8 W/m2 for the 35 g/L NaCl draw solution and up to 5.1 W/m2
or the 60 g/L NaCl draw solution. For the asymmetric membranemployed, the power density was substantially reduced due toevere internal concentration polarization and, to a lesser degree,o reverse salt diffusion. External concentration polarization wasound to exhibit a relatively small effect on reducing the osmoticriving force.
Using the predictive model, the PRO process can be improvedy optimizing operating conditions and system configuration tochieve maximum power density. Output from the model can assistn determining membrane characteristics needed to design andraft new-generation PRO membranes.
cknowledgments
The authors acknowledge the support of the Department ofnergy, Grant No. DE-FG02-05ER64143 and Hydration Technology
nnovations (Albany, OR) for donating the FO membrane.
Nomenclature
�P hydraulic pressure differential (kPa)�� osmotic pressure differential (kPa)ε porosity�D,b osmotic pressure of the bulk draw solution (kPa)�D,m osmotic pressure of the draw solution at the mem-
brane surface (kPa)�F,b osmotic pressure of the bulk feed solution (kPa)
˘F,m osmotic pressure of the feed solution at the mem-brane surface (kPa)� tortuosityA water permeability coefficient ((m/s)/kPa)
[
W power density (W/m2)
References
[1] S. Loeb, R.S. Norman, Osmotic power plants, Science 189 (1975) 654–655.[2] S. Loeb, Production of energy from concentrated brines by pressure-retarded
osmosis. I. Preliminary technical and economic correlations, Journal of Mem-brane Science 1 (1976) 49–63.
[3] S. Loeb, Large-scale power production by pressure-retarded osmosis, using riverwater and sea water passing through spiral modules, Desalination 143 (2002)115–122.
[4] R.J. Aaberg, Osmotic power. A new and powerful renewable energy source?Refocus 4 (2003) 48–50.
[5] The Energy Information Administration, http://www.eia.doe.gov/.[6] R.E. Pattle, Production of electric power by mixing fresh and salt water in the
hydroelectric pile, Nature 174 (1954) 660.[7] R.S. Norman, Water salination: a source of energy, Science 186 (1974) 350–352.[8] O. Levenspiel, N. de Nevers, The osmotic pump, Science 183 (1974) 157–160.[9] S. Loeb, F. Van Hessen, D. Shahaf, Production of energy from concentrated brines
by pressure-retarded osmosis. II. Experimental results and projected energycosts, Journal of Membrane Science 1 (1976) 249–269.
10] S. Loeb, G.D. Mehta, A Two coefficient water transport equation for pressure-retarded osmosis, Journal of Membrane Science 4 (1979) 351–362.
[11] G.D. Mehta, S. Loeb, Performance of permasep B-9 and B-10 membranes invarious osmotic regions and at high osmotic pressures, Journal of MembraneScience 4 (1979) 335–349.
12] G.D. Mehta, S. Loeb, Internal polarization in the porous substructure of asemipermeable membrane under pressure-retarded osmosis, Journal of Mem-brane Science 4 (1978) 261–265.
13] H.H. Jellinek, H. Masuda, Osmo-power. Theory and performance of an osmo-power pilot plant, Ocean Engineering 8 (1981) 103–128.
14] J.R. McCutcheon, M. Elimelech, Influence of membrane support layer hydropho-bicity on water flux in osmotically driven membrane processes, Journal ofMembrane Science 318 (2008) 458–466.
15] J.R. McCutcheon, M. Elimelech, Influence of concentrative and dilutive inter-nal concentration polarization on flux behavior in forward osmosis, Journal ofMembrane Science 284 (2006) 237–247.
16] K. Gerstandt, K.-V. Peinemann, S.E. Skilhagen, T. Thorsen, T. Holt, Membraneprocesses in energy supply for an osmotic power plant, Desalination 224 (2008)64–70.
[17] K.L. Lee, R.W. Baker, H.K. Lonsdale, Membrane for power generation bypressure retarded osmosis, Journal of Membrane Science 8 (1981) 141–171.
[18] J.R. McCutcheon, R.L. McGinnis, M. Elimelech, Desalination by ammonia–carbon dioxide forward osmosis: Influence of draw and feed solution con-centrations on process performance, Journal of Membrane Science 278 (2006)
114–123.19] M. Elimelech, S. Bhattacharjee, A novel approach for modeling concentrationpolarization in crossflow membrane filtration based on the equivalence ofosmotic pressure model and filtration theory, Journal of Membrane Science145 (1998) 223–241.

5 mbran
[
[
[
[
[
[
[
[
[
[
[
[
concentration as pretreatment for reverse osmosis, Journal of Membrane Sci-
2 A. Achilli et al. / Journal of Me
20] S.S. Sablani, M.F.A. Goosen, R. Al-Belushi, M. Wilf, Concentration polarizationin ultrafiltration and reverse osmosis: a critical review, Desalination 141 (2001)269–289.
21] A. Achilli, T.Y. Cath, E.A. Marchand, A.E. Childress, The forward osmosis mem-brane bioreactor: a low fouling alternative to MBR processes, Desalination 239(2009) 10–21.
22] T.Y. Cath, A.E. Childress, M. Elimelech, Forward osmosis: principles, applica-tions, and recent developments, Journal of Membrane Science 281 (2006)70–87.
23] S. Loeb, L. Titelman, E. Korngold, J. Freiman, Effect of porous support fabricon osmosis through a Loeb–Sourirajan type asymmetric membrane, Journal ofMembrane Science 129 (1997).
24] V. Gekas, B. Hallstrom, Mass transfer in the membrane concentration polariza-tion layer under turbulent cross flow. I. Critical literature review and adaptationof existing Sherwood correlations to membrane operations, Journal of Mem-
brane Science 30 (1987) 153–170.25] G. Schock, A. Miguel, Mass transfer and pressure loss in spiral wound modules,Desalination 64 (1987) 339–352.
26] C.P. Koutsou, S.G. Yiantsios, A.J. Karabelas, Direct numerical simulation of flowin spacer-filled channels: Effect of spacer geometrical characteristics, Journalof Membrane Science 291 (2007) 53–69.
[
[
e Science 343 (2009) 42–52
27] C.P. Koutsou, S.G. Yiantsios, A.J. Karabelas, A numerical and experimental studyof mass transfer in spacer-filled channels: effects of spacer geometrical char-acteristics and Schmidt number, Journal of Membrane Science 326 (2009)234–251.
28] R.W. Holloway, A.E. Childress, K.E. Dennett, T.Y. Cath, Forward osmosis for con-centration of anaerobic digester centrate, Water Research 41 (2007) 4005–4014.
29] R.H. Stokes, The diffusion coefficients of eight uni-equivalent electrolytes inaqueous solution at 25◦ , Journal of the American Chemical Society 72 (1950)2243–2247.
30] R. Mills, The effect of the ionization of water on diffusional behavior in diluteaqueous electrolytes, Journal of Physical Chemistry 66 (1962) 2716–2718.
31] T.Y. Cath, S. Gormly, E.G. Beaudry, M.T. Flynn, V.D. Adams, A.E. Childress, Mem-brane contactor processes for wastewater reclamation in space. I. Direct osmotic
ence 257 (2005) 85–98.32] G.T. Gray, J.R. McCutcheon, M. Elimelech, Internal concentration polarization in
forward osmosis: role of membrane orientation, Desalination 197 (2006) 1–8.33] C. Fritzmann, J. Lowenberg, T. Wintgens, T. Melin, State-of-the-art of reverse
osmosis desalination, Desalination 216 (2007) 1–76.