Embed Size (px)
Citation preview
Pratt Institute: Sustainable Environmental Systems
Calculating Gowanus Measuring the Storm and Wastewater Impacts of Rezoning
Stewart Fisken
5-14-2017
Professors: Alec Applebaum and Jaime Stein
1
Contents
Definitions/Abbreviations ................................................................................................. 2
List of tables .................................................................................................................... 3
List of Graphs .................................................................................................................. 3
List of figures ................................................................................................................... 3
Introduction ................................................................................................................... 4
Thesis Statement and the Combined Sewer Problem ................................................. 4
A Brief History of the Gowanus .................................................................................... 4
Time to Act ................................................................................................................... 6
Gowanus Canal Conservancy: The Environmental Stewards .................................... 11
Project Scope .............................................................................................................. 14
Wastewater and Stormwater in the Combined Sewer System ................................... 14
The Gowanus Watershed .......................................................................................... 15
Site Area: Boundaries of Analysis .............................................................................. 23
Wastewater .................................................................................................................. 27
Baseline Sewer System Theory ................................................................................. 27
Creating the Residential Zoning District Wastewater Generation Model .................... 28
Outputs: The results of the Wastewater Generation Model ....................................... 36
Stormwater .................................................................................................................. 40
RH-035 and Site Area Stormwater Runoff ................................................................. 40
How Development Will Improve Stormwater Management ........................................ 42
The Combined Impact ................................................................................................. 44
Recommendations ...................................................................................................... 46
Wastewater Reduction ............................................................................................... 46
Stormwater Reduction ............................................................................................... 48
Conclusion ................................................................................................................... 53
Appendix ....................................................................................................................... 54
2
Definitions/Abbreviations
CEQR: City Environmental Quality Review
CSO: Combined Sewer Overflow CWA: Clean Water Act, 1972 DCP: Department of City Planning (New York City) DEP: Department of Environmental Protection (New York City) DEC: Department of Environmental Conservation (New York State) EIS: Environmental Impact Statement (New York City) EPA: Environmental Protection Agency (United States) GCC: Gowanus Canal Conservancy
Lot area: The area designated by property lines and NYC Tax lots LTCP: Long Term Control Plan, from NYC DEP PLACES: Planning for Livability, Affordability, Community, Economic Opportunity and Sustainability. DCP neighborhood planning study process Rezoning area: Area undergoing study for rezoning, as designated by NYC DCP PLACES Study
Site area: Area of drainage shed RH-035 being analyzed in this paper Stormwater: Water generated over land from a rain event Street area: The area of space taken up by the streets within the project area. Calculated by subtracting the total lot area from the total project area. Wastewater: black and grey water generated from a building, wastewater. WWTP: Wastewater Treatment Plant ULURP: Uniform Land Use Review Procedure
3
List of tables
Table 1. RH-035 Land Use ............................................................................................ 26
Table 2. Model Assumptions and Given Data ............................................................... 31
Table 3. Median Building Characteristics of NYC Buildings Built after 2013 ................. 32
Table 4. Maximum Density Scenario ............................................................................. 34
Table 5. Zero Residential Development Wastewater Generation Scenario ................... 36
Table 6. Lowest Density Wastewater Generation Scenario .......................................... 37
Table 7. Equally Mixed Density Wastewater Generation Scenario ............................... 37
Table 8. Primarily Lower Density Wastewater Generation Scenario ............................. 38
Table 9. Primarily Higher Density Wastewater Generation Scenario ............................ 38
Table 10. Maximum Density Wastewater Generation Scenario .................................... 39
Table 11. 1.2" Rain Event Stormwater Generation of Site Area .................................... 42
Table 12. Pre Development 1.2” Rain Event Stormwater Generation of Lot Area ......... 43
Table 13. Post Development 1.2" Rain Event SW Generation Table ............................ 43
Table 14. Median vs Average Value Comparison for unit/sfLA Values ......................... 55
List of Graphs
Graph 1. Impacts on CSO of Increasing Baseline Flow in Sewer System ..................... 28
Graph 2. Development Impacts on Stormwater Generation .......................................... 41
Graph 3. Impacts on CSO Threshold from Residential Rezoning ................................. 45
List of figures
Figure 1. Owls Head and Red Hook Sewersheds ......................................................... 16
Figure 2. Gowanus Canal Drainage Shed ..................................................................... 17
Figure 3. Gowanus Canal Drainage Area Split between Two WWTPs ......................... 18
Figure 4. Gowanus drainage sheds .............................................................................. 20
Figure 5. Urban Stormwater Management Systems...................................................... 21
Figure 6. Combined Sewer Overflow (CSO) ................................................................. 22
Figure 7. NYC DCP PLACES Study Area ..................................................................... 24
Figure 8. Site Area ........................................................................................................ 25
Figure 9. The Model System ......................................................................................... 29
Figure 10. R9 Example Calculation ............................................................................... 34
Figure 11. Predevelopment Stormwater Flow ............................................................... 50
Figure 12. Post Development Stormwater Flow ............................................................ 51
4
Introduction
Thesis Statement and the Combined Sewer Problem
The Gowanus is under consideration for a rezoning process that could drastically
change the environment of the neighborhood and impact the existing combined sewer
system. This project examines the components that cause combined sewer overflow
(CSO) discharges as well as how rezoning the Gowanus might impact the combined
sewer system, and provides recommendations to address each component with the
goal of reducing CSO discharges into the Gowanus Canal. The development of a
metrics based model is used to quantify possible increases in wastewater entering the
combined sewer system. Land cover and current stormwater management
requirements are analyzed to calculate the potential impacts on stormwater generated
and flows into the combined sewer system. The wastewater and stormwater impacts
are combined to assess the total impact on the combined sewer system and
recommendations are made to reduce the impacts of both wastewater and stormwater
generation from new residential development within the anticipated Gowanus rezoning
boundaries.
A Brief History of the Gowanus
The history of the Gowanus, the neighborhood and the canal, was expertly described in
the book Gowanus: Brooklyn's Curious Canal written by Joseph Alexiou and published
5
in October 20151. The neighborhood of Gowanus is nestled between Park Slope and
Carroll Gardens and cut through by the Gowanus Canal. Alexiou starts by going back to
the 1600s when the area around the modern-day canal was a saltwater marsh
surrounding the Gowanus Creek that quickly became famous for its giant oysters and
agriculture as the dominate land use of early Brooklyn. As settlers began to flood into
modern day Brooklyn the town needed a massive infrastructure makeover. The digging
of the Gowanus Canal was authorized in 1848 by the State of New York to drain the salt
marshes and create a pathway for wastewater and stormwater to flow away from the
population2.The canal was finished in 1874 and is 100 feet wide and 1.8 miles long3.
Transportation and energy became the major industries along the canal both by
receiving massive shipments of coal and supplying power from pollution spewing
manufactured gas plants built along the banks. During the rise of the canal, industries
that include paper mills, tanneries, and chemical plants dumped Polyaromatic
hydrocarbons (PAHs), polychlorinated biphenyl (PCB), mercury, lead, and other heavy
metals into the canal which are harmful to humans and the natural environment4. The
rising of the shipping container industry in the 1930s was the eventual downfall of the
canal as it could not support the new preferred method for transporting goods and by
the 1950s the canal was primarily used as a dumping ground5. The environmental
1 Alexiou, J. (2015). Gowanus: Brooklyn's curious canal. New York: New York University Press. 2
Alexiou, J. 3 Alexiou, J. 4 Gowanus Canal 5 Alexiou, J
6
degradation of the Canal ultimately led to the Gowanus Canal being added to the
CERCLA National Priorities List in March 2010 designating it a Superfund Site6,7. Real
estate speculators have been attracted to the area in recent years buying up water front
properties housing abandoned factories in hope of a residential rezoning8. Since the
beginning of the city, the canal has been a spillover site for the combined sewer system,
a dumping ground for pollution, but is now possibly the new “it” neighborhood to live in
despite its massive environmental issues.
Time to Act
The current rezoning study is not the first time Gowanus has been under consideration
for a makeover. The neighborhood has been the center of many rezoning and
environmental studies in recent decades making the time to act increasingly more
important as the neighborhood faces inevitable change. There are many community
groups, developers, and city agencies with varying priorities involved in the rezoning
process making the possibilities of rezoning almost endless and unpredictable.
New York City Department of City Planning first conducted public outreach meetings in
January 2007 to inform the public of a potential rezoning project within Gowanus and
6 Federal Register. Rules and Regulations, Vol. 75, No. 42 (Thursday, March 4, 2010. https://www.gpo.gov/fdsys/pkg/FR-2010-03-04/pdf/2010-
4325.pdf 7 Gowanus Canal. (n.d.). Retrieved April 22, 2017, from http://www.nyc.gov/html/dep/html/harborwater/gowanus_canal_superfund.shtml 8 Albrecht, L. (2017, May 12). MAP: Who Owns All the Property Along the Gowanus Canal. Retrieved May 14, 2017, from
https://www.dnainfo.com/new-york/20170512/gowanus/gowanus-canal-real-estate-property-markets-group-kushner-forest-city-alloy-rezoning
7
presented a draft zoning proposal at a public meeting on May 29th, 20089. This was the
beginning of the Gowanus Canal Corridor Rezoning Project that would attempt to
rezone an approximately 70 acre manufacturing district into a mixed use special
district10. However, the Superfund designation coming in 2010, the Gowanus Canal
Corridor Rezoning Project was put on hold.
As a result of non-attainment of the Clean Water Act, a CSO Order on Consent dated
March 8th, 2012 updated a 2005 CSO Order on Consent from the New York State
Department of Environmental Conservation (NYS DEC) that requires NYC Department
of Environmental Protection (DEP) to submit a Long Term Control Plan (LTCP).
“The goal of each LTCP is to identify, with public input, appropriate CSO
controls necessary to achieve waterbody-specific water quality standards
(WQS), consistent with the Federal CSO Control Policy and related
guidance.”11
The LTCP includes an analysis and recommendations to bring the Gowanus Canal into
compliance with the Federal Combined Sewer Overflow (CSO) Policy and the Clean
Water Act12.
9 Gowanus Canal Corridor Framework, NYC DCP Project & Proposals. Retrieved April 22, 2017.
http://www1.nyc.gov/assets/planning/download/pdf/plans/gowanus/gowanus.pdf 10 Gowanus Canal Corridor Framework 11 Gowanus Canal LTCP (Rep.). (2015, June). Retrieved February 2, 2017, from NYC Department of Environmental Protection website:
http://www.nyc.gov/html/dep/pdf/cso_long_term_control_plan/gowanus-canal-ltcp-201506.pdf 12 Gowanus Canal LTCP
8
2013 began a community involved planning process lead by Pratt Center that would
result in the Bridging Gowanus report13. The report was constructed using small and
large community meetings to establish a list of neighborhood issues and then allowed
the community to vote on prioritizing the recommendations14. Bridging Gowanus’s top
issue was Environmental Infrastructure, broken down into 6 recommendations listed
below15.
1. Guarantee investments in sustainable infrastructure upfront, with real sources
identified to pay for them, and a timetable that is synchronized with other
planning measures.
2. Ensure that the Gowanus Canal Cleanup is comprehensive.
3. Minimize street flooding and end sewer back-ups by tackling their root causes.
4. Address extreme weather vulnerability in the long-term and align with other
community goals
5. Study, monitor, and improve air quality
6. Create a “Model Green Neighborhood” with heightened local sustainability
standards
13 BridgingGowanus.org. (n.d.). Retrieved April 22, 2017, from http://bridginggowanus.org/ 14 BridgingGowanus.org. (n.d.). Retrieved April 22, 2017, from http://bridginggowanus.org/ 15 Bridging Gowanus (Rep.). (2016). Retrieved http://report.bridginggowanus.org/
9
With many the community’s priorities being directly impacted by CSO, Gowanus Blue is
mobilizing at a perfect time to continue and increase community involvement and
planning in CSO reduction.
The 2015 LTCP recommendations include infrastructure upgrades to the sewer system
and will directly overlap with the superfund cleanup, meaning collaboration is vital to
maximize the positive impacts of neighborhood and environmental improvements.
Agencies working together and partnered with community groups can pool resources,
whether it be financial power, neighborhood knowledge, or technical expertise, to
identify and address current problems and minimize the risk of overlapping efforts or
creating problems in the future.
Continuing on from Bridging Gowanus the NYC Department of City Planning (DCP)
began it’s PLACES Study (Planning for Livability, Affordability, Community, Economic
Opportunity and Sustainability) and held the first Gowanus community planning kick off
meeting in October 201616. This process is ongoing and has seen hundreds of
community members turnout to express their thoughts and concerns about the evolution
of the neighborhood. Many of the PLACES study goals including “Coordinate necessary
improvements to support cleanup of the Canal and accommodate existing & future
needs”17 were developed based on the Bridging Gowanus priorities.
16 Gowanus Neighborhood Planning Study. (n.d.). Retrieved April 22, 2017, from http://www1.nyc.gov/site/planning/plans/gowanus/gowanus-
updates.page 17 Gowanus Neighborhood Planning Study
10
Bridging Gowanus best sums up the importance of collaboration the passage below:
“It is important to note that the timeline for new development will need to be
synchronized with the Gowanus Canal Superfund cleanup, which will take place
over the next decade. Dredging the length of the Canal and installing two new
CSO detention tanks will have significant impacts at all sites along the canal, and
potentially many nearby. In addition, especially for sites along
the Canal, the specific requirements of the cleanup itself (e.g. consent decree
payments, site remediation, bulkhead replacement) will directly impact the
economics and design of any future efforts. As the details of the cleanup emerge
over the next year, they will need to inform plans for development.”
The next couple of years are vital from collaboration between the community, the City,
and developers as the overlapping timelines of rezoning, development, and
environmental cleanup provide an unequivocal opportunity to improve the Gowanus,
missed opportunities could be costly in the future, both economically and
environmentally.
There various expectations of rezoning include preserving manufacturing, increase
residential density, a desire for more public space, infrastructure improvements, and
mixed use buildings all based on previous studies and conversations with community
members. There are multiple opportunities for the community to voice their opinion on
what needs to be studied during the rezoning process as well as rezoning requirements
such as more street trees or better access to transportation. The Environmental Impact
Statement (EIS) process is required during rezoning and provides the opportunity for my
client, the Gowanus Canal Conservancy (GCC), to comment on the draft scope of the
11
review, the draft EIS, and any negative declaration18. The City’s Uniform Land Use
Review Procedure (ULURP) is also required for rezoning and adds additional public
comment opportunities from various entities such as the City Council and Borough
President19.
Gowanus Canal Conservancy: The Environmental Stewards
“The Gowanus Canal Conservancy is a community based non-profit organization that
serves as the environmental steward of the Gowanus Canal Watershed”20. Established
in 2006 the GCC has a vision of an open and clean watershed that can unite the
diversity in ecology, business, and culture of the canal and its surrounding residents.
GCC is currently in the final planning and beginning implementation stages of it’s
newest initiative Gowanus Blue, a project that involves Gowanus students, residents,
and businesses in metric and action-based educational programs with the goal of
reducing CSO discharge into the Gowanus Canal to zero21. To meet the zero CSO goal
the current stormwater management objective is to manage all stormwater from a 1.2”
rain event. A 1.2-inch rain event was selected as the management criteria as it is the
90% 24 hour annual storm event for New York City, meaning that 90% of rainfall events
18 NYC CEQR. Retrieved April 2017 http://www.nyc.gov/html/oec/html/ceqr/ceqr.shtml 19 NYC DCP ULURP. Retried April 2017. https://www1.nyc.gov/site/planning/applicants/applicant-portal/step5-ulurp-process.page 20 GCC. About. Retrieved April 22, 2017, from http://www.gowanuscanalconservancy.org/ee/index.php/about/ 21 Gowanus Blue, GCC conversation. February 2017
12
in a year will be 1.2 inches or less over a 24 hour period, based on 2013 precipitation
data22.
This capstone project is paired with two similar metric-based efforts of Gowanus Blue
(being conducting separately) focusing on the protection and improvement of the
watershed by reducing CO discharge. The first component is a drainage shed wide
analysis of and how much green infrastructure is needed to reduce CSO discharge to
zero in each drainage area. A second initiative is a community engagement process
aimed at providing private residences with the resources they need to implement green
infrastructure on their properties. An informative pamphlet has been created to guide
homeowners to the appropriate stormwater management practices for their own homes.
These projects share the common goal of reducing CSO discharge into the Canal to
zero.
Through the combination of these initiatives the GCC hopes to target all areas of the
neighborhood to increase efforts into reducing CSO. The metrics analysis of the
required amount of green infrastructure will establish a “Green Infrastructure Target” for
each drainage shed that can be advocated for by the GCC during the previously
mentioned public comment opportunities. CSO reduction advocacy during rezoning may
not be enough to reach the goal so additional community outreach to engage residents
outside of the rezoning area is included in Gowanus Blue. Providing the required tools
22 NYS DEC Stormwater Design Manual 2015, Ch4. Unified Stormwater Sizing Criteria. Retrieved 2017
13
necessary to pursue green infrastructure on private property can increase the amount of
stormwater management and decrease CSO discharge. Community efforts in
collaboration with the City’s plans for green infrastructure in public spaces may be
enough to reach the goals of Gowanus Blue. The rezoning process provides an
additional unique opportunity to implement measures to reduce CSO discharges by
addressing both wastewater and stormwater generation that would otherwise be
unrealistic without the potential forthcoming neighborhood change.
14
Project Scope
Wastewater and Stormwater in the Combined Sewer System
The analysis in this paper is broken down into the two components of a combined sewer
system, wastewater and stormwater.
Wastewater is a combination of black and grey water generated from a building. This
includes water from sinks, toilets, other water fixtures, and cooling towers. Rezoning to
residential zoning districts will increase the number of people living in the neighborhood
resulting in an increase in wastewater generation. Increasing wastewater generation
increases the baseline flow of the combined sewer system and has a negative impact
on the CSO threshold of a drainage area. A CSO threshold is the amount of rain
required to cause a CSO discharge, a value that varies between CSO drainage areas.
Through a GCC analysis of the Gowanus LTCP data, it was calculated that the
threshold for RH-035 is a 1” rain event, meaning that a rain event greater than 1” will
trigger a CSO.
Stormwater is the water generated during a rain event caused by impervious surfaces,
the water will flow down grade toward the combined sewer system. While wastewater
provides the baseline flow of the combined sewer system, stormwater is the additional
flow that triggers a CSO discharge when the capacity of the combined system is
exceeded. Stormwater generation is impacted by rezoning by changes to land cover
and stormwater management practices required when constructing new buildings.
15
The analyses of wastewater and stormwater generation are done separately then
combined to calculate to total possible impact of rezoning on the combined sewer
system.
The Gowanus Watershed
The Site Area of this project narrows in on a specific part of Gowanus along the west
bank of the canal, understanding the Site Area and its relationship to the neighborhood
and its environmental impacts allows for a site-specific analysis and recommendations
to address wastewater and stormwater generation.
The neighborhood of Gowanus lies within two distinct wastewater treatment plant
(WWTP) service areas commonly referred to as sewersheds, geographical regions
where all wastewater flows towards a treatment plant during dry weather. Gowanus is
split between the Red Hook and the Owls Head sewershed, with the wastewater flowing
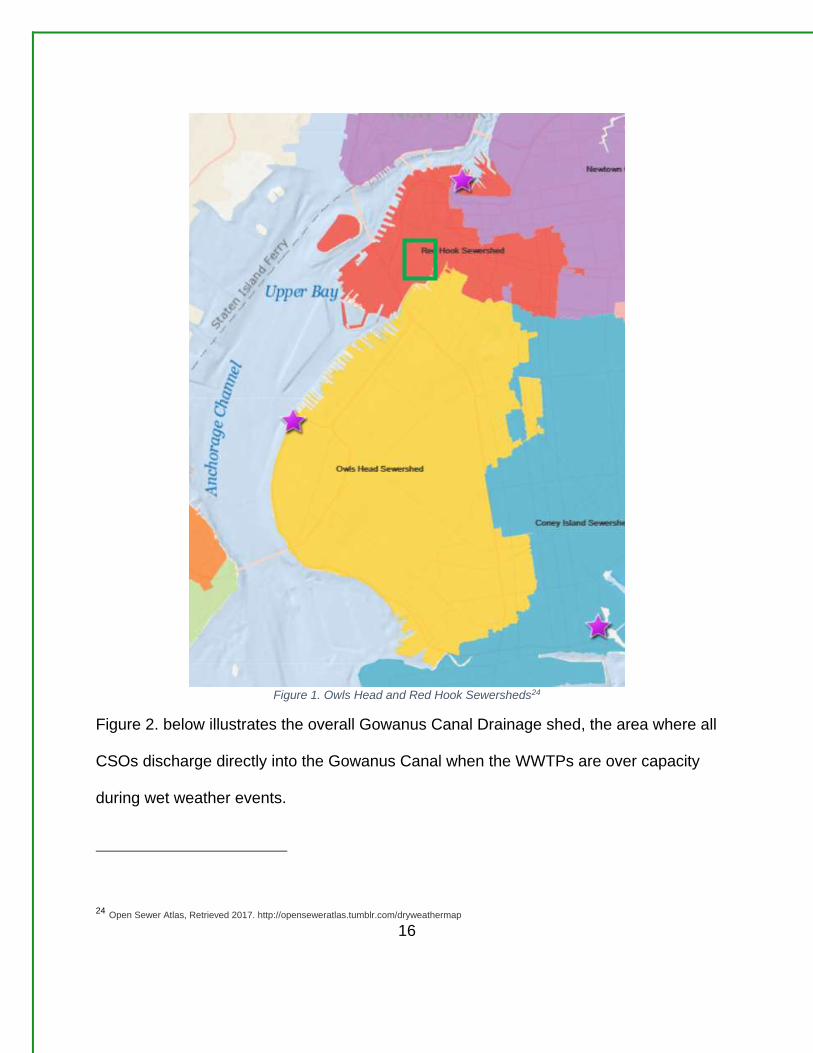
towards either the Red hook WWTP or Owls Head WWTP23 respectively. Figure 1.
shown below indicates the entire sewersheds of the Red Hook and Owls Head with the
Gowanus Canal rezoning area marked out in green. The purple stars are the WWTPs in
each sewershed.
23 Gowanus Canal LTCP
16
Figure 1. Owls Head and Red Hook Sewersheds24
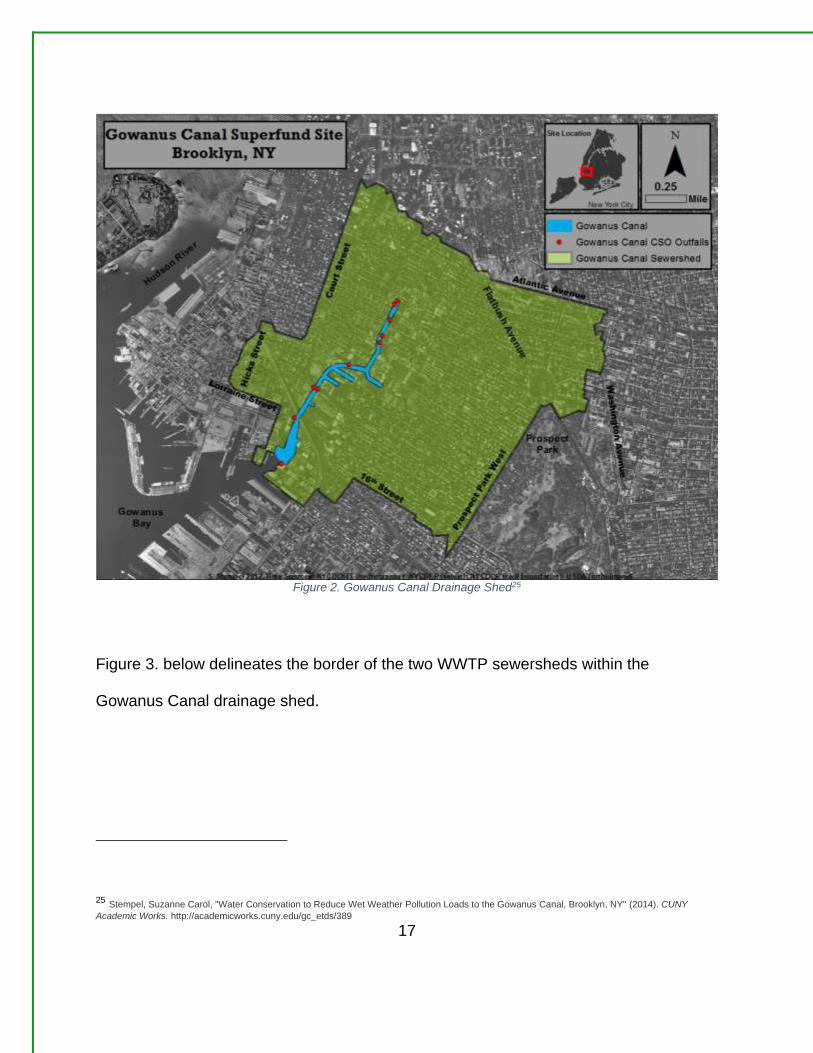
Figure 2. below illustrates the overall Gowanus Canal Drainage shed, the area where all
CSOs discharge directly into the Gowanus Canal when the WWTPs are over capacity
during wet weather events.
24 Open Sewer Atlas, Retrieved 2017. http://openseweratlas.tumblr.com/dryweathermap
17
Figure 2. Gowanus Canal Drainage Shed25
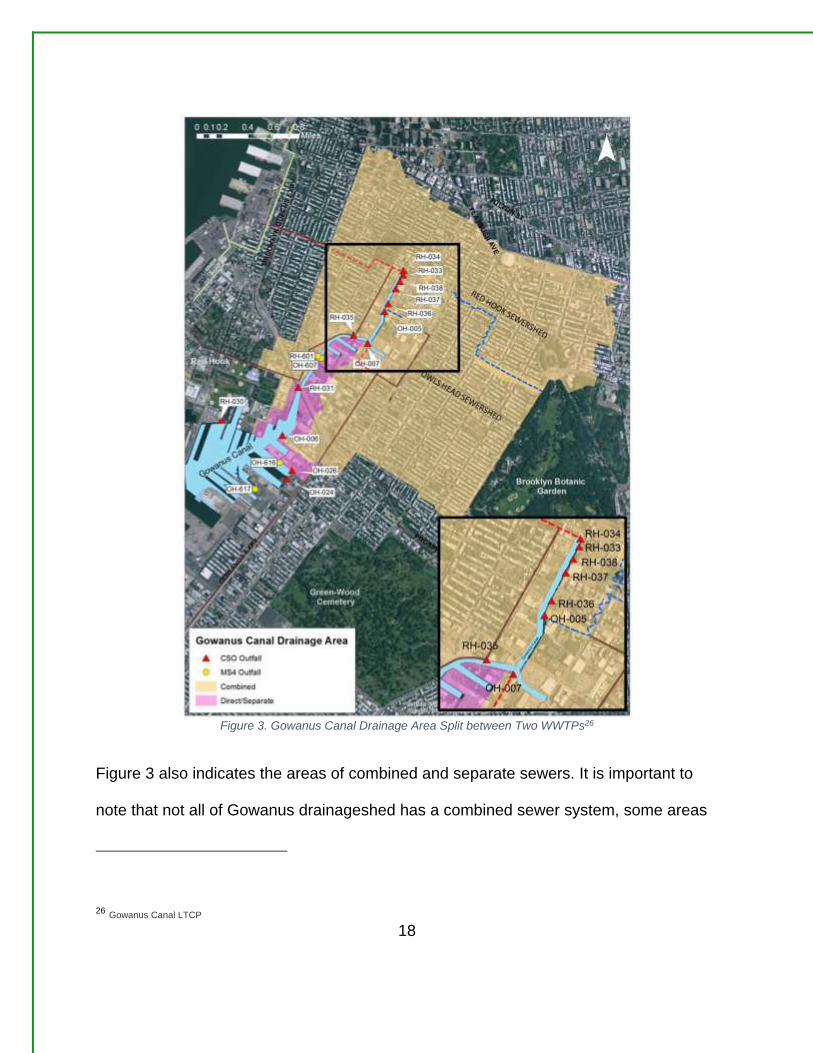
Figure 3. below delineates the border of the two WWTP sewersheds within the
Gowanus Canal drainage shed.
25 Stempel, Suzanne Carol, "Water Conservation to Reduce Wet Weather Pollution Loads to the Gowanus Canal, Brooklyn, NY" (2014). CUNY
Academic Works. http://academicworks.cuny.edu/gc_etds/389
18
Figure 3. Gowanus Canal Drainage Area Split between Two WWTPs26
Figure 3 also indicates the areas of combined and separate sewers. It is important to
note that not all of Gowanus drainageshed has a combined sewer system, some areas
26 Gowanus Canal LTCP
19
have a separate system where wastewater flows to a WWTP and stormwater runoff
flows directly into the canal. These separate systems are known as Municipal Separate
Storm Sewer Systems (MS4) and require a separate permit. There are 13 CSO outfalls
along the length of the Gowanus Canal and bay27. The CSO outfall is the physical
pathway from the combined wasetwater to overflow into the Gowanus Canal. The 13
CSO outfalls are supplied by individual CSO drainage sheds, a geographical area
where combine wastewater discharges from the outfall during wet weather events that
exceed the CSO threshold.
27 Gowanus Canal LTCP
20
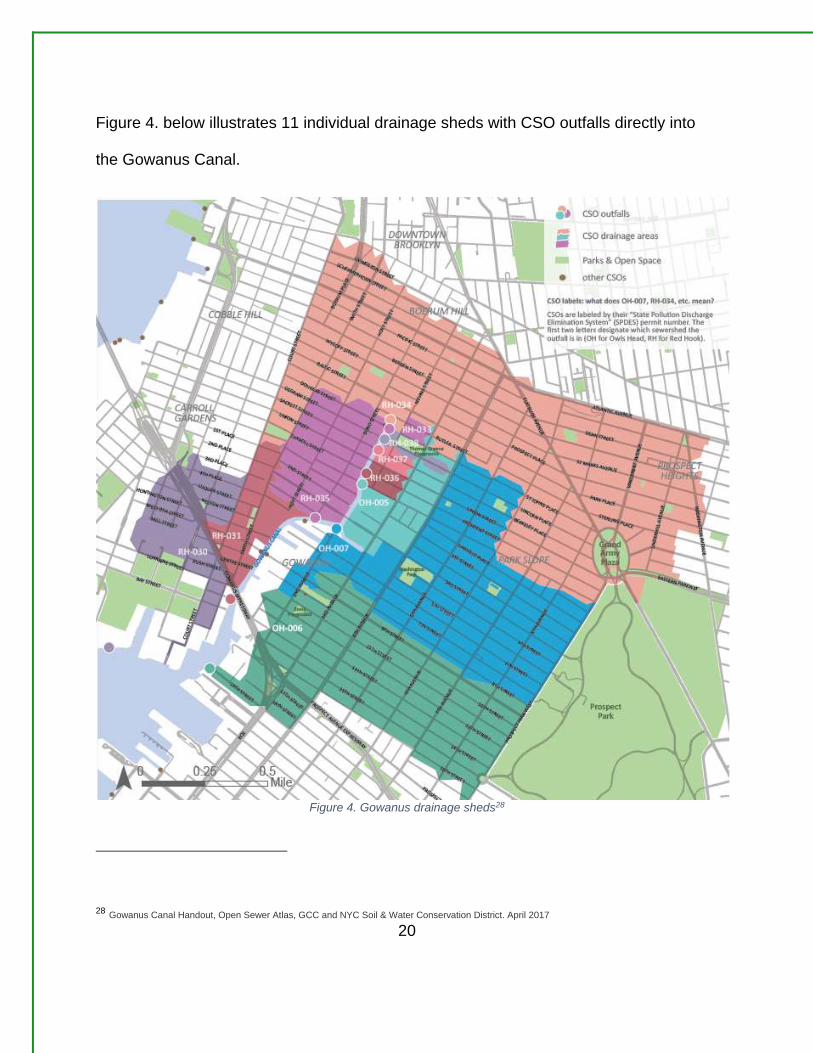
Figure 4. below illustrates 11 individual drainage sheds with CSO outfalls directly into
the Gowanus Canal.
Figure 4. Gowanus drainage sheds28
28 Gowanus Canal Handout, Open Sewer Atlas, GCC and NYC Soil & Water Conservation District. April 2017
21
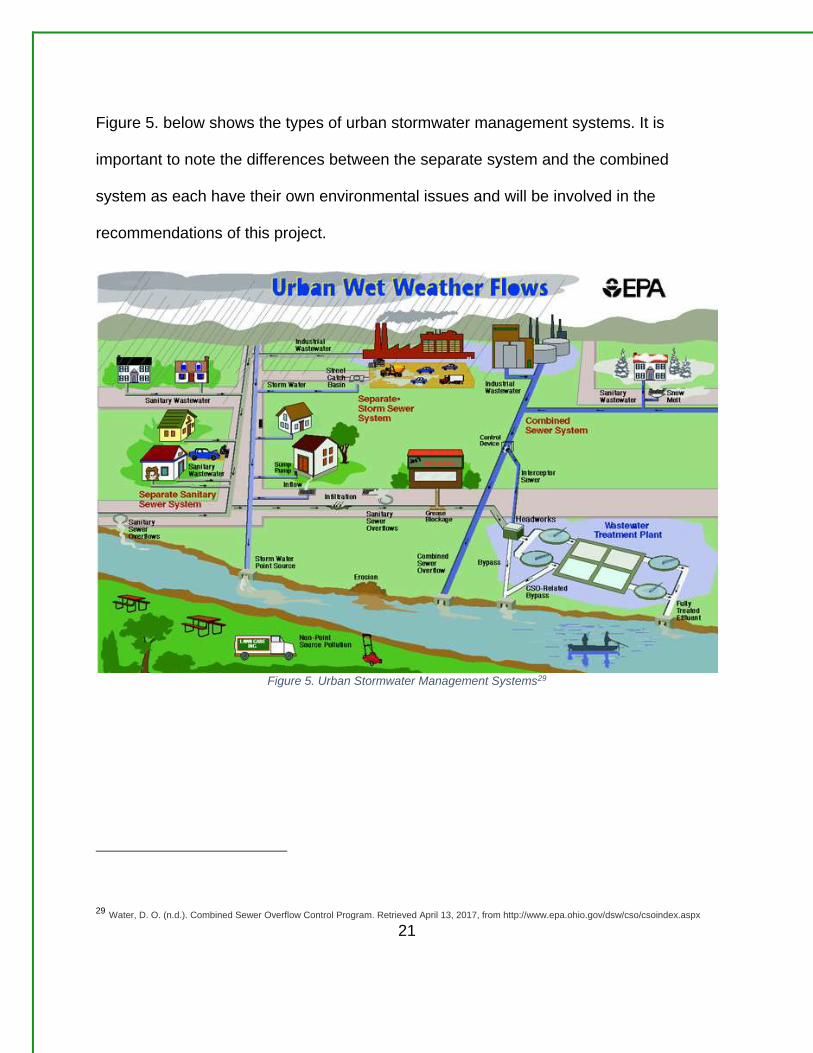
Figure 5. below shows the types of urban stormwater management systems. It is
important to note the differences between the separate system and the combined
system as each have their own environmental issues and will be involved in the
recommendations of this project.
Figure 5. Urban Stormwater Management Systems29
29 Water, D. O. (n.d.). Combined Sewer Overflow Control Program. Retrieved April 13, 2017, from http://www.epa.ohio.gov/dsw/cso/csoindex.aspx
22
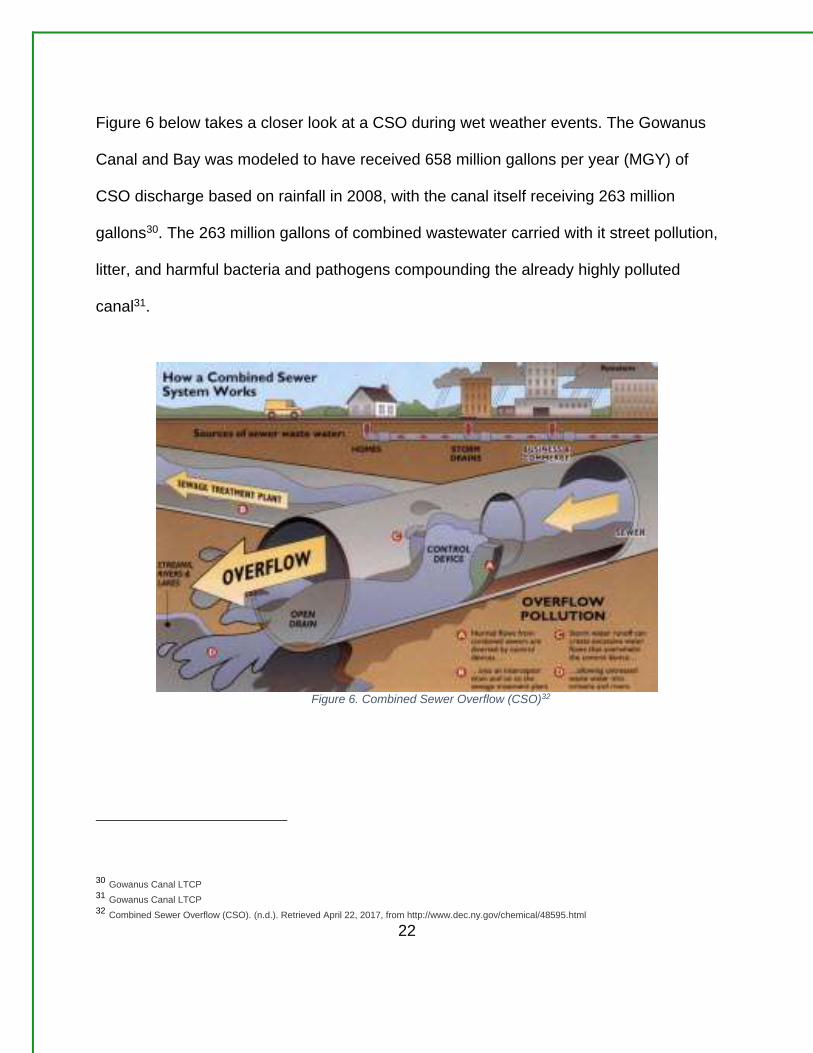
Figure 6 below takes a closer look at a CSO during wet weather events. The Gowanus
Canal and Bay was modeled to have received 658 million gallons per year (MGY) of
CSO discharge based on rainfall in 2008, with the canal itself receiving 263 million
gallons30. The 263 million gallons of combined wastewater carried with it street pollution,
litter, and harmful bacteria and pathogens compounding the already highly polluted
canal31.
Figure 6. Combined Sewer Overflow (CSO)32
30 Gowanus Canal LTCP 31 Gowanus Canal LTCP 32 Combined Sewer Overflow (CSO). (n.d.). Retrieved April 22, 2017, from http://www.dec.ny.gov/chemical/48595.html
23
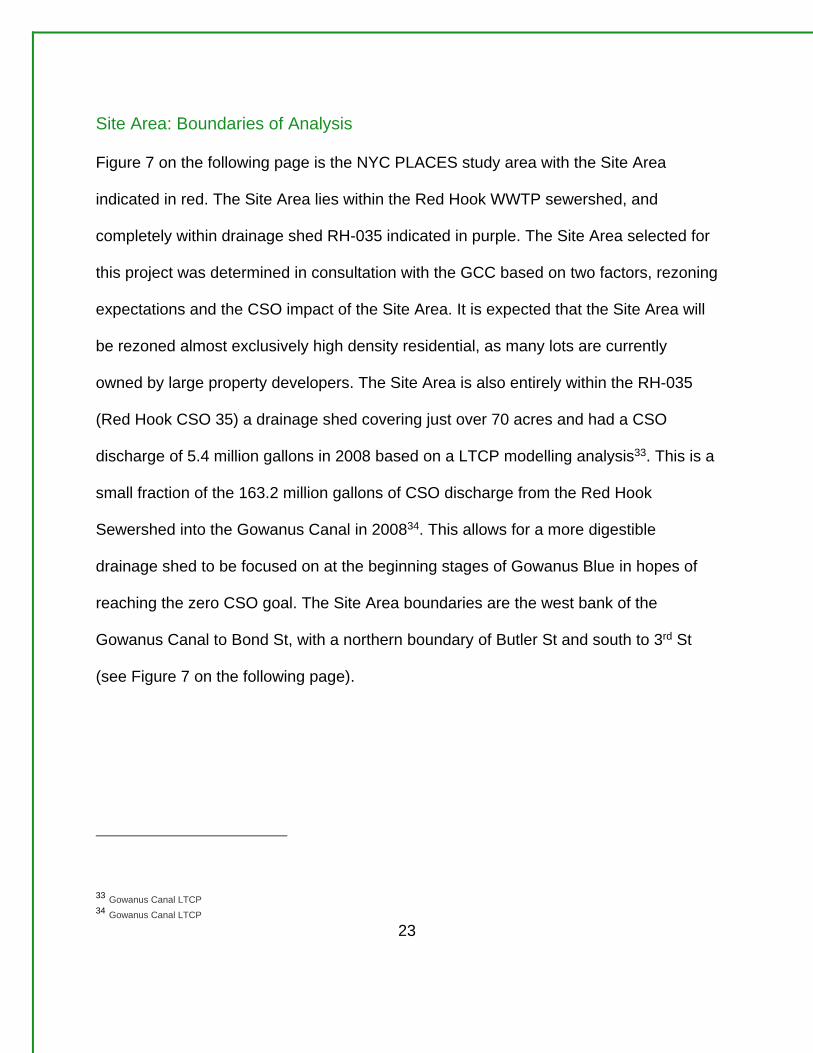
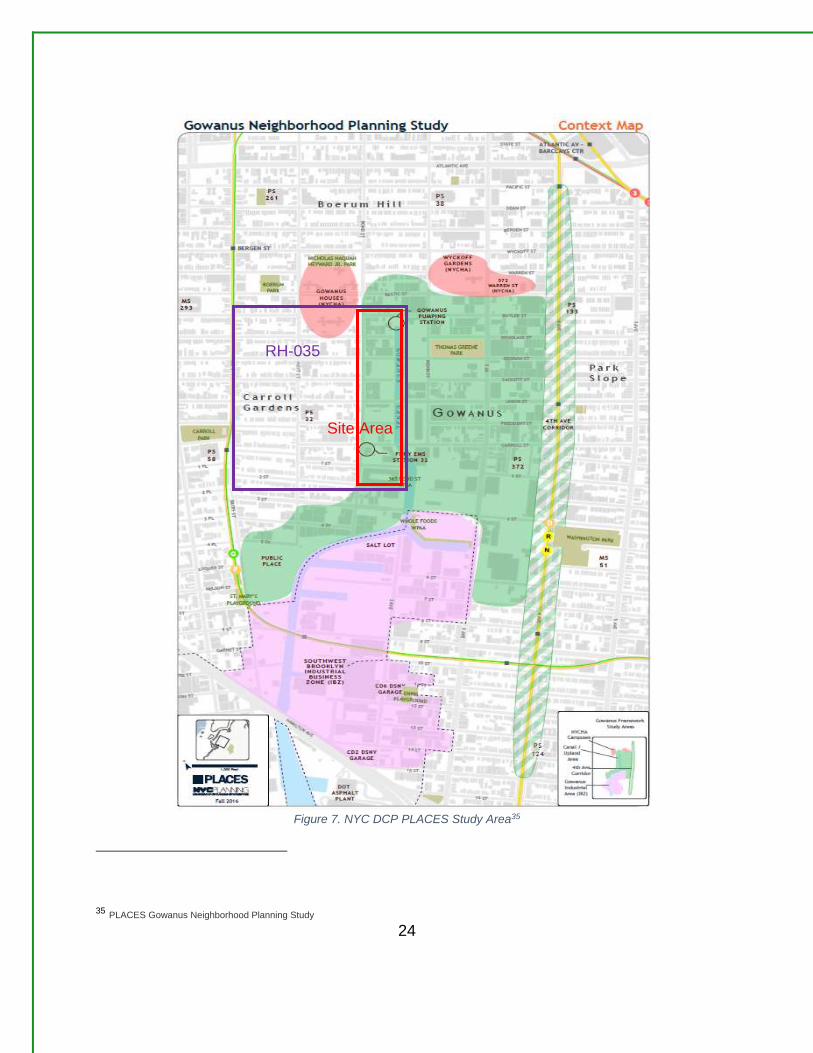
Site Area: Boundaries of Analysis
Figure 7 on the following page is the NYC PLACES study area with the Site Area
indicated in red. The Site Area lies within the Red Hook WWTP sewershed, and
completely within drainage shed RH-035 indicated in purple. The Site Area selected for
this project was determined in consultation with the GCC based on two factors, rezoning
expectations and the CSO impact of the Site Area. It is expected that the Site Area will
be rezoned almost exclusively high density residential, as many lots are currently
owned by large property developers. The Site Area is also entirely within the RH-035
(Red Hook CSO 35) a drainage shed covering just over 70 acres and had a CSO
discharge of 5.4 million gallons in 2008 based on a LTCP modelling analysis33. This is a
small fraction of the 163.2 million gallons of CSO discharge from the Red Hook
Sewershed into the Gowanus Canal in 200834. This allows for a more digestible
drainage shed to be focused on at the beginning stages of Gowanus Blue in hopes of
reaching the zero CSO goal. The Site Area boundaries are the west bank of the
Gowanus Canal to Bond St, with a northern boundary of Butler St and south to 3rd St
(see Figure 7 on the following page).
33 Gowanus Canal LTCP 34 Gowanus Canal LTCP
24
Figure 7. NYC DCP PLACES Study Area35
35 PLACES Gowanus Neighborhood Planning Study
RH-035
Site Area
Area
25
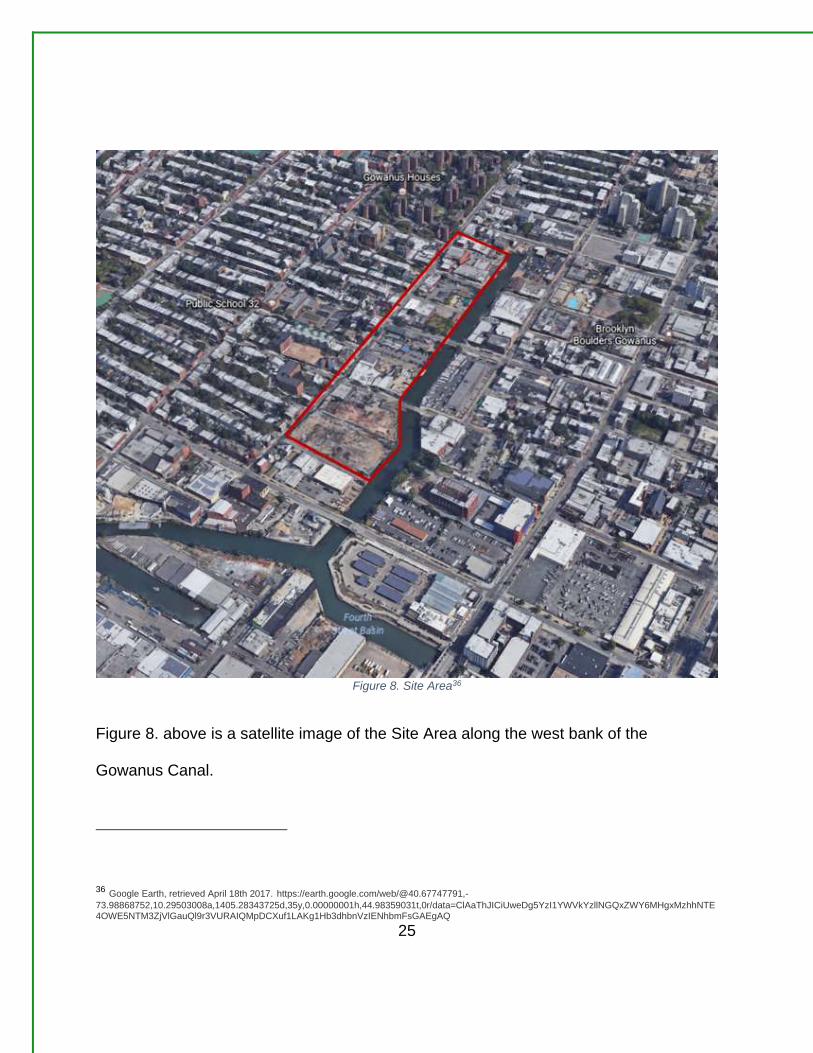
Figure 8. Site Area36
Figure 8. above is a satellite image of the Site Area along the west bank of the
Gowanus Canal.
36 Google Earth, retrieved April 18th 2017. https://earth.google.com/web/@40.67747791,-
73.98868752,10.29503008a,1405.28343725d,35y,0.00000001h,44.98359031t,0r/data=ClAaThJICiUweDg5YzI1YWVkYzllNGQxZWY6MHgxMzhhNTE4OWE5NTM3ZjVlGauQl9r3VURAIQMpDCXuf1LAKg1Hb3dhbnVzIENhbmFsGAEgAQ
26
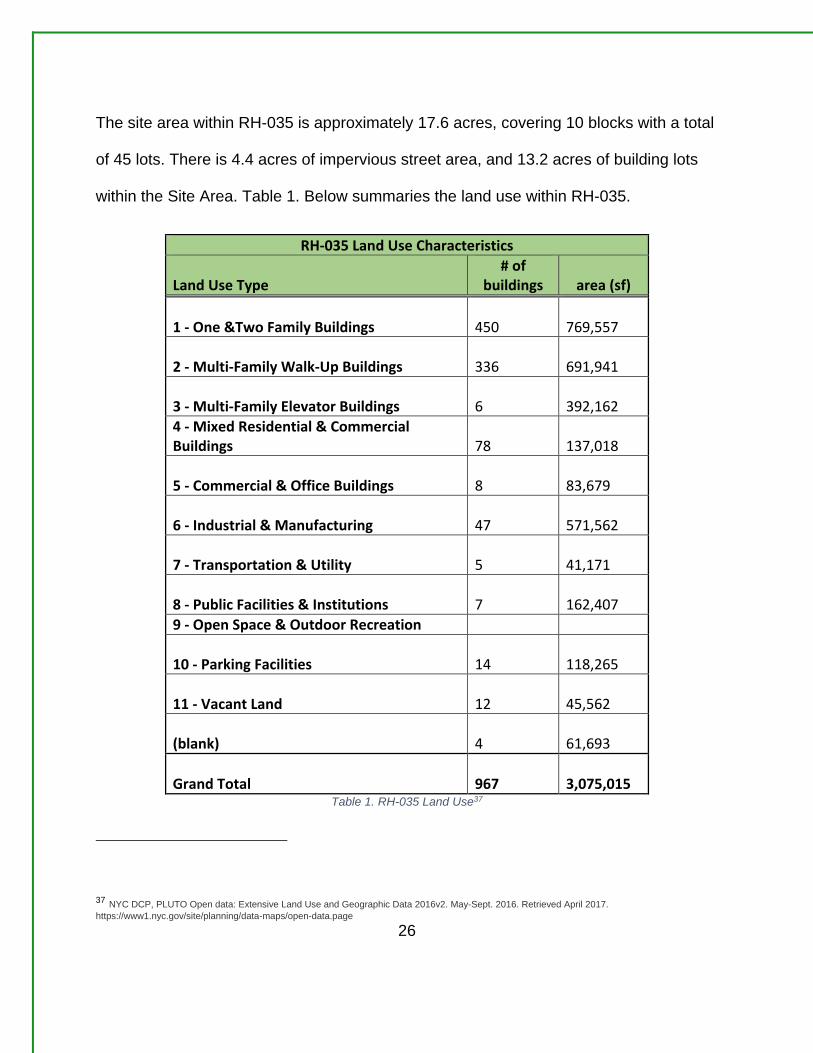
The site area within RH-035 is approximately 17.6 acres, covering 10 blocks with a total
of 45 lots. There is 4.4 acres of impervious street area, and 13.2 acres of building lots
within the Site Area. Table 1. Below summaries the land use within RH-035.
RH-035 Land Use Characteristics
Land Use Type # of
buildings area (sf)
1 - One &Two Family Buildings 450
769,557
2 - Multi-Family Walk-Up Buildings 336
691,941
3 - Multi-Family Elevator Buildings 6
392,162
4 - Mixed Residential & Commercial Buildings
78
137,018
5 - Commercial & Office Buildings 8
83,679
6 - Industrial & Manufacturing 47
571,562
7 - Transportation & Utility 5
41,171
8 - Public Facilities & Institutions 7
162,407
9 - Open Space & Outdoor Recreation
10 - Parking Facilities 14
118,265
11 - Vacant Land 12
45,562
(blank) 4
61,693
Grand Total 967
3,075,015
Table 1. RH-035 Land Use37
37 NYC DCP, PLUTO Open data: Extensive Land Use and Geographic Data 2016v2. May-Sept. 2016. Retrieved April 2017.
https://www1.nyc.gov/site/planning/data-maps/open-data.page
27
Wastewater
Baseline Sewer System Theory
An increase in residential development from rezoning along the Gowanus Canal will
increase the baseline volume of wastewater flow within the combined sewer system. To
measure the impact of rezoning in the Gowanus, the increase wastewater flow from
rezoning within the Site Area must be calculated. Graph 1 on the following page
illustrates the potential impacts that a large increase in baseline flow could have on the
CSO threshold. The CSO threshold for RH-035 is a 1” rain event. This threshold is used
as the predevelopment value to compare levels of impacts from various rezoning
scenarios. An increasing the baseline flow can causes the CSO threshold of RH-035 to
decrease resulting in a larger volume of CSO discharge from a 1” rain event. This idea
does not consider any changes in stormwater management caused from development.
The “A” on the Graph 1. represents the increased volume of CSO discharge that would
occur from a 1” rain event as a result of an increase in baseline flow. This value is
currently unknown due to unknown increase in wastewater generation that may come
with rezoning. The following analysis aims to quantify this value with a model to
calculate increases in wastewater generation based on zoning districts.
28
Graph 1. Impacts on CSO of Increasing Baseline Flow in Sewer System38
Creating the Residential Zoning District Wastewater Generation Model
The Residential Zoning District Wastewater Generation Model (Model) is a tool that can
easily run scenarios in which different residential zoning districts are applied across the
Site Lot Area. The Site Lot Area, now referred to as “Lot Area” is the total area of all the
tax lots recognized by NYC within the Site Area. Rezoning of the Gowanus may include
several different types of residential zoning districts. Residential zoning districts used in
the model are R5, R6, R7, R8, and R-9 including all subtypes (example R7-2). These
zoning districts were chosen based on the expected zoning districts of the Site Area.
With the Mayor's agenda prioritizing affordable housing and many waterfront properties
owned by large residential developers the Site Area is unlikely to be rezoned to low
38 Fisken, Stewart. Calculating Gowanus: Measure the Wastewater and Stormwater Impacts of Rezoning. May, 2017
29
density residential. Zoning districts below R5 are not considered in this model, but can
be added in the future. R9 is the highest zoning district select because no R10 buildings
have been built in NYC in the past 3 years39. The Model uses current building data from
2014 to present as these buildings are the best example of what may be built in the next
few years.
Figure 9. below illustrates the process behind creating the model based on available
data, project characteristics, and desired outcome. The “Missing Link” in the model
provides the conversion to calculate the desired outcome of wastewater generated per
day based on zoning districts.
Figure 9. The Model System40
39 NYC DCP, PLUTO Open Data 40 Calculating Gowanus. May 2017
30
The Model was created using publicly available NYC PLUTO data, the City
Environmental Quality Review (CEQR) Technical manual (tech manual), LTCP data and
Geographic Information Systems (GIS) to analyze NYC buildings, drainage shed RH-
035, and site area. To get the desired output of wastewater generated per day, the
model calculates the number of people added to the Site Area based on zoning districts.
The Model assumptions come from a variety of sources. The wastewater generation
rate per person comes from a recommended conversion from the CEQR Technical
Manual Chapter 13 that lists residential water demand and wastewater generation at
100 gallons per person per day41, this accounts for low flow fixtures required in new
developments42. The Model assumes the number of individuals per unit is 2.49 based
on the 2010 US Census that lists 2.49 as the average number of residents per rental
unit in New York City43.
The number of units added is dependent on the type of zoning that is put in place within
the site area. As mentioned above, this model includes residential zoning districts R5,
R6, R7, R8, and R-9 including all subtypes (example R7-2) to estimate the number of
units that will be added during the rezoning. Table 2 below summarizes the
assumptions and input data of the model.
41 NYC Mayor's Office of Environmental Coordination. (2014, March 14). CEQR Technical Manual, Ch. 13 Water and Sewer Infrastructure 42 NYC 2014 Construction Code, Plumbing Code, Ch 6, Table 604.4 Maximum Flow Rates and Consumption for Plumbing Fixtures and Fixture
Fittings 43
United Sates Census Bureau (2010) New York City, New York, General Population and Housing Characteristics. Retrieved from
https://factfinder.census.gov/faces/tableservices/jsf/pages/productview.xhtml?src=CF
31
Assumptions and Given Data Summary
Metric Value Unit
Site area total 767351 sf
Site Lot Area 575904 sf
Site Street Area 191447 sf
Unit Occupancy (rental, NYC) 2.49 res/unit
Sewage generation (CEQR) 100 gal/per person per day
Table 2. Model Assumptions and Given Data44
The Missing Link is a conversion of units per square foot of lot area (units/sfLA) for each
zoning district. Each zoning district has a unique units/sfLA value. To calculate the
units/sfLA an analysis on all buildings zoned R5 to R9 built since the beginning of 2014
was done.
The units/sfLA conversion is calculated by dividing the median values of residential
units and lot area for in each zoning district. For example, the median value of
residential units and lot area and Residential Units for R9 buildings built since 2014 (392
residential units, 37,948 sf lot area) is divided (392 units / 37,948 sf) with a result of
0.0103 units/sfLA. This calculation is generated for zoning districts R5 to R9 as shown
in Table 3 on the following page.
44 Calculating Gowanus. May 2017. Data compiled from PLUTO data, CEQR, US Census all cited above
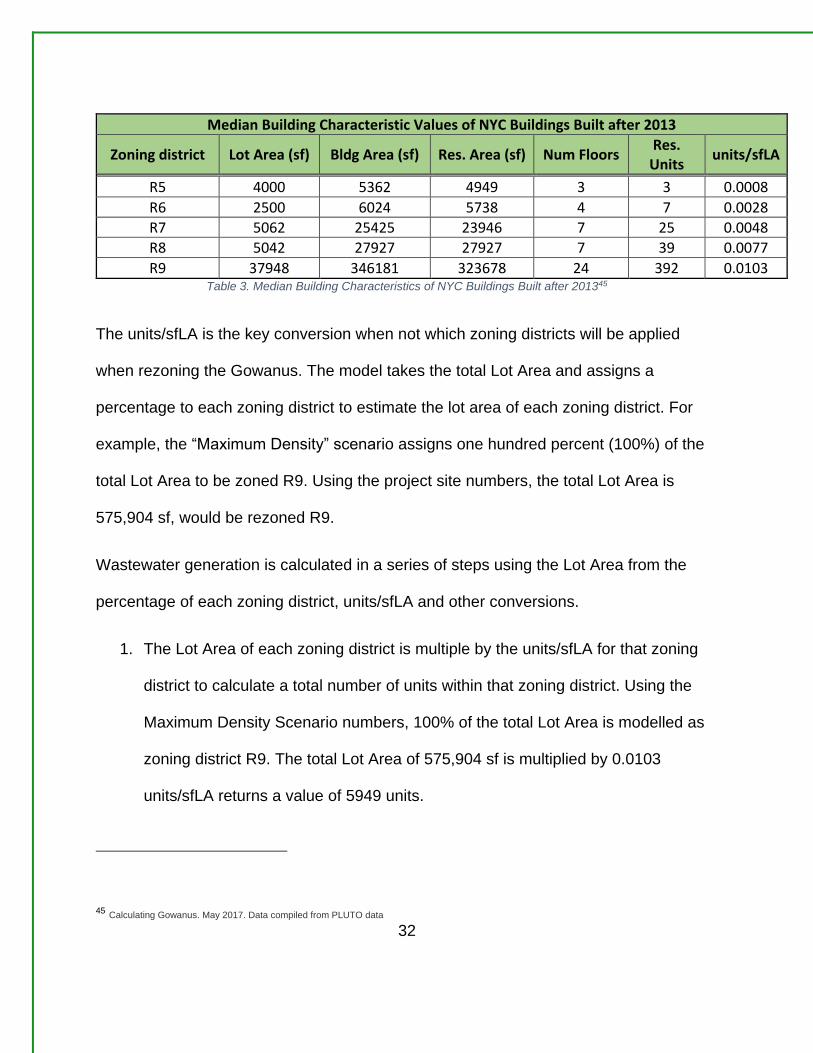
32
Median Building Characteristic Values of NYC Buildings Built after 2013
Zoning district Lot Area (sf) Bldg Area (sf) Res. Area (sf) Num Floors Res. Units
units/sfLA
R5 4000 5362 4949 3 3 0.0008
R6 2500 6024 5738 4 7 0.0028
R7 5062 25425 23946 7 25 0.0048
R8 5042 27927 27927 7 39 0.0077
R9 37948 346181 323678 24 392 0.0103 Table 3. Median Building Characteristics of NYC Buildings Built after 201345
The units/sfLA is the key conversion when not which zoning districts will be applied
when rezoning the Gowanus. The model takes the total Lot Area and assigns a
percentage to each zoning district to estimate the lot area of each zoning district. For
example, the “Maximum Density” scenario assigns one hundred percent (100%) of the
total Lot Area to be zoned R9. Using the project site numbers, the total Lot Area is
575,904 sf, would be rezoned R9.
Wastewater generation is calculated in a series of steps using the Lot Area from the
percentage of each zoning district, units/sfLA and other conversions.
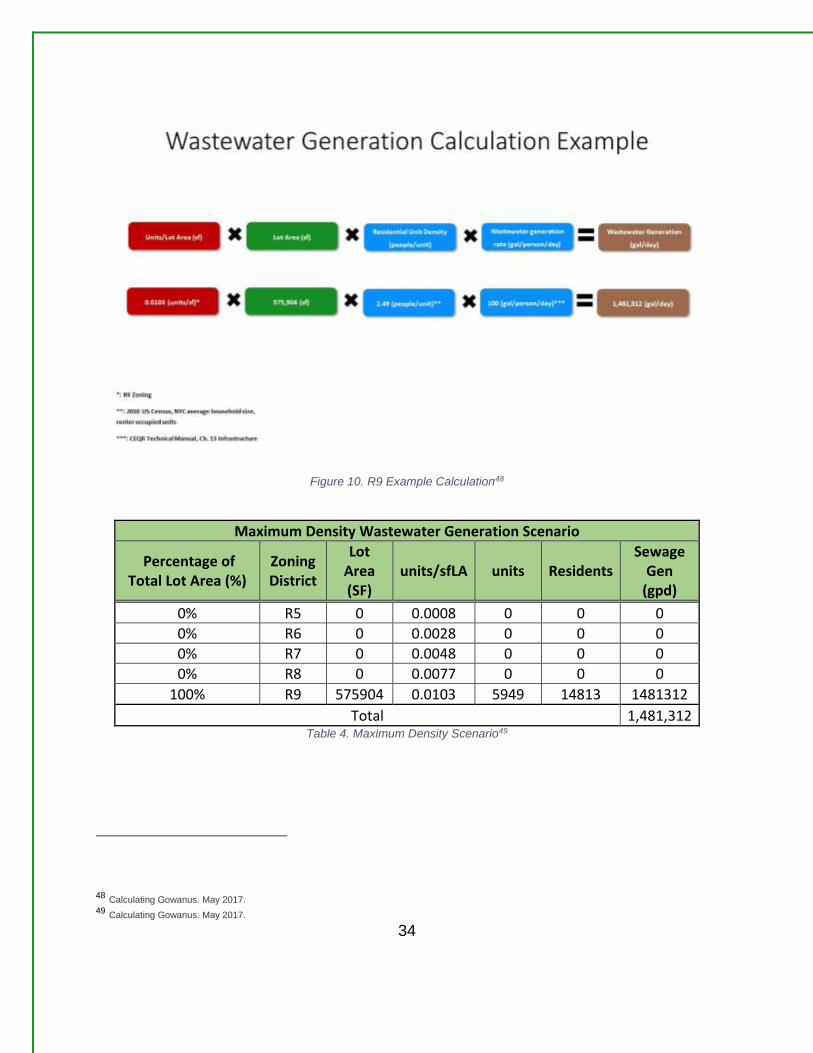
1. The Lot Area of each zoning district is multiple by the units/sfLA for that zoning
district to calculate a total number of units within that zoning district. Using the
Maximum Density Scenario numbers, 100% of the total Lot Area is modelled as
zoning district R9. The total Lot Area of 575,904 sf is multiplied by 0.0103
units/sfLA returns a value of 5949 units.
45 Calculating Gowanus. May 2017. Data compiled from PLUTO data
33
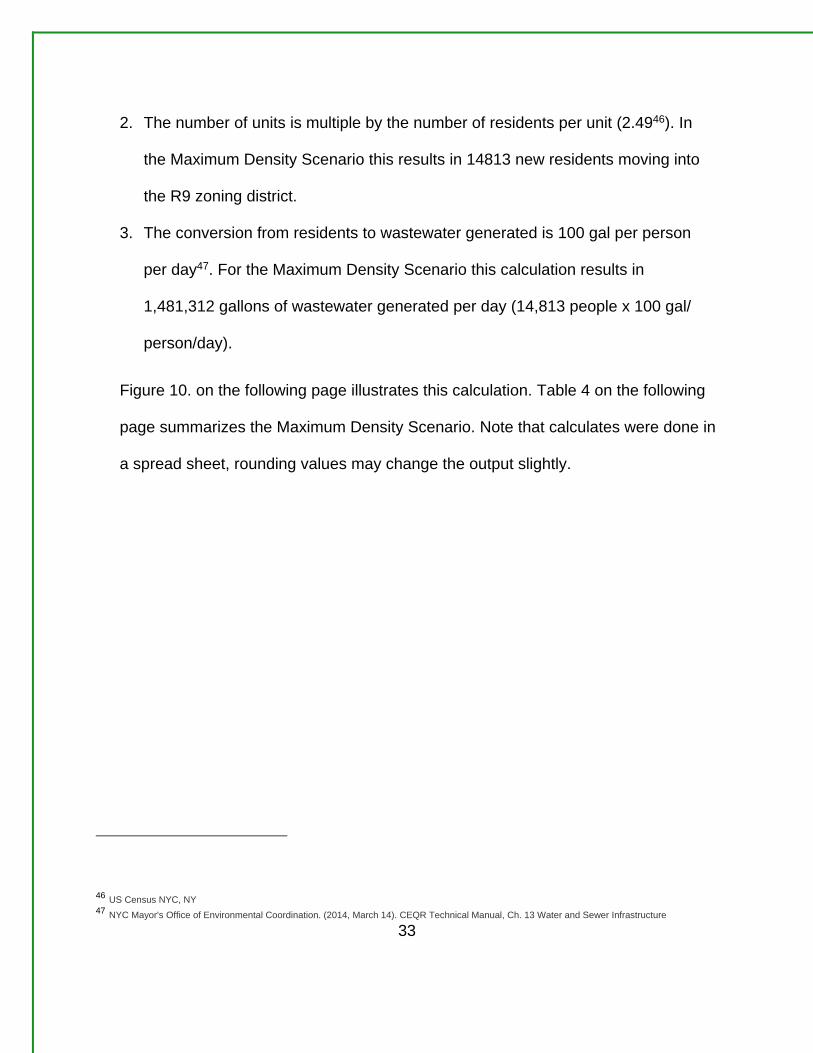
2. The number of units is multiple by the number of residents per unit (2.4946). In
the Maximum Density Scenario this results in 14813 new residents moving into
the R9 zoning district.
3. The conversion from residents to wastewater generated is 100 gal per person
per day47. For the Maximum Density Scenario this calculation results in
1,481,312 gallons of wastewater generated per day (14,813 people x 100 gal/
person/day).
Figure 10. on the following page illustrates this calculation. Table 4 on the following
page summarizes the Maximum Density Scenario. Note that calculates were done in
a spread sheet, rounding values may change the output slightly.
46 US Census NYC, NY 47 NYC Mayor's Office of Environmental Coordination. (2014, March 14). CEQR Technical Manual, Ch. 13 Water and Sewer Infrastructure
34
Figure 10. R9 Example Calculation48
Maximum Density Wastewater Generation Scenario
Percentage of Total Lot Area (%)
Zoning District
Lot Area (SF)
units/sfLA units Residents Sewage
Gen (gpd)
0% R5 0 0.0008 0 0 0
0% R6 0 0.0028 0 0 0
0% R7 0 0.0048 0 0 0
0% R8 0 0.0077 0 0 0
100% R9 575904 0.0103 5949 14813 1481312
Total 1,481,312 Table 4. Maximum Density Scenario49
48 Calculating Gowanus. May 2017. 49 Calculating Gowanus. May 2017.
35
The Model has the ability to run a variety of scenarios that represent the different
possibilities of residential rezoning in Gowanus. Running multiple scenarios is a similar
approach used in the Environmental Impact Statement (EIS) process that is required for
rezoning and projects that meet the EIS criteria. The EIS process establishes a baseline
and requires a “No action” and “With Action” scenario to quantify and qualify the impacts
rezoning projects. The EIS process is guided by the CEQR Technical Manual.
This model calculates wastewater generation based on assumptions (how much and
what type of residential rezoning will take place) and zoning district building
characteristics. It is being applied to the Site Area of this project but can be modified
and applied to any area under consideration for residential rezoning. The model can
also be expanded to include manufacturing, commercial, or mixed use zoning districts
with a further analysis of wastewater generation rates and lot sizes.
Please see Table 15 in Appendix for an additional statistical analysis of median versus
average values for units/sfLA.
36
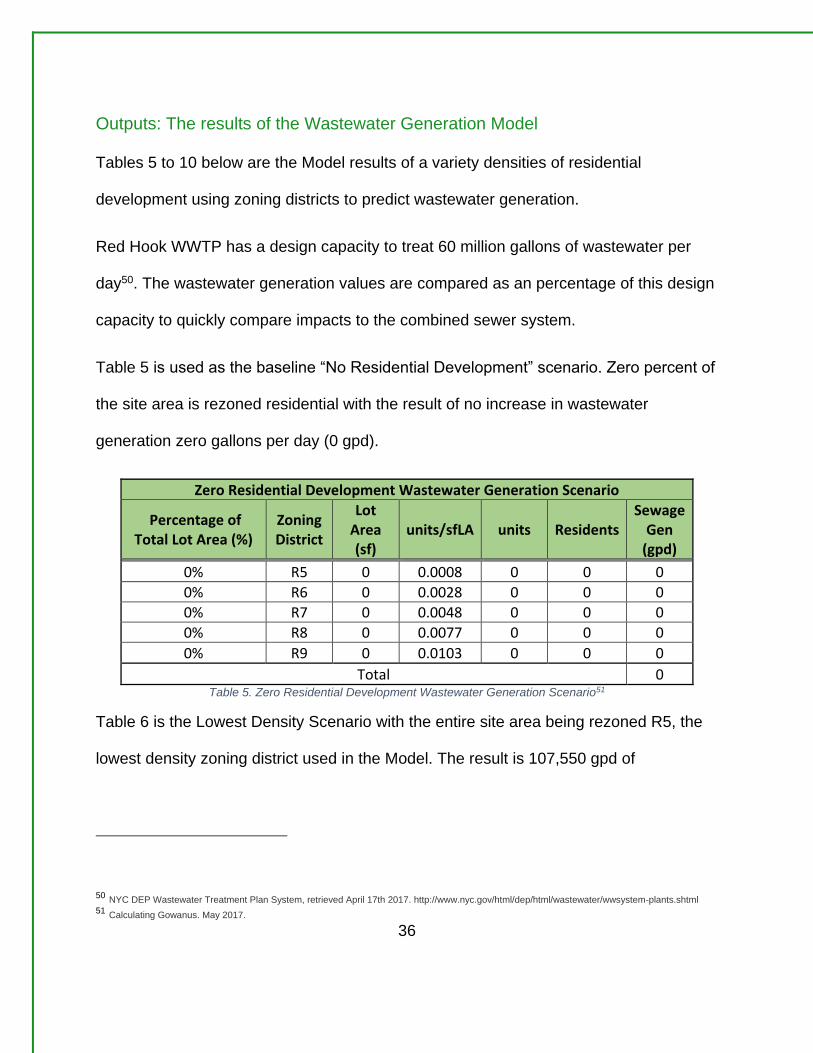
Outputs: The results of the Wastewater Generation Model
Tables 5 to 10 below are the Model results of a variety densities of residential
development using zoning districts to predict wastewater generation.
Red Hook WWTP has a design capacity to treat 60 million gallons of wastewater per
day50. The wastewater generation values are compared as an percentage of this design
capacity to quickly compare impacts to the combined sewer system.
Table 5 is used as the baseline “No Residential Development” scenario. Zero percent of
the site area is rezoned residential with the result of no increase in wastewater
generation zero gallons per day (0 gpd).
Zero Residential Development Wastewater Generation Scenario
Percentage of Total Lot Area (%)
Zoning District
Lot Area (sf)
units/sfLA units Residents Sewage
Gen (gpd)
0% R5 0 0.0008 0 0 0
0% R6 0 0.0028 0 0 0
0% R7 0 0.0048 0 0 0
0% R8 0 0.0077 0 0 0
0% R9 0 0.0103 0 0 0
Total 0 Table 5. Zero Residential Development Wastewater Generation Scenario51
Table 6 is the Lowest Density Scenario with the entire site area being rezoned R5, the
lowest density zoning district used in the Model. The result is 107,550 gpd of
50 NYC DEP Wastewater Treatment Plan System, retrieved April 17th 2017. http://www.nyc.gov/html/dep/html/wastewater/wwsystem-plants.shtml 51 Calculating Gowanus. May 2017.
37
wastewater generated. This is approximately 0.2% of the design capacity of Red Hook
WWTP.
Lowest Density Wastewater Generation Scenario
Percentage of Total Lot Area (%)
Zoning District
Lot Area (sf)
units/sfLA units Residents Sewage
Gen (gpd)
100% R5 575904 0.0008 432 1076 107550
0% R6 0 0.0028 0 0 0
0% R7 0 0.0048 0 0 0
0% R8 0 0.0077 0 0 0
0% R9 0 0.0103 0 0 0
Total 107,550 Table 6. Lowest Density Wastewater Generation Scenario52
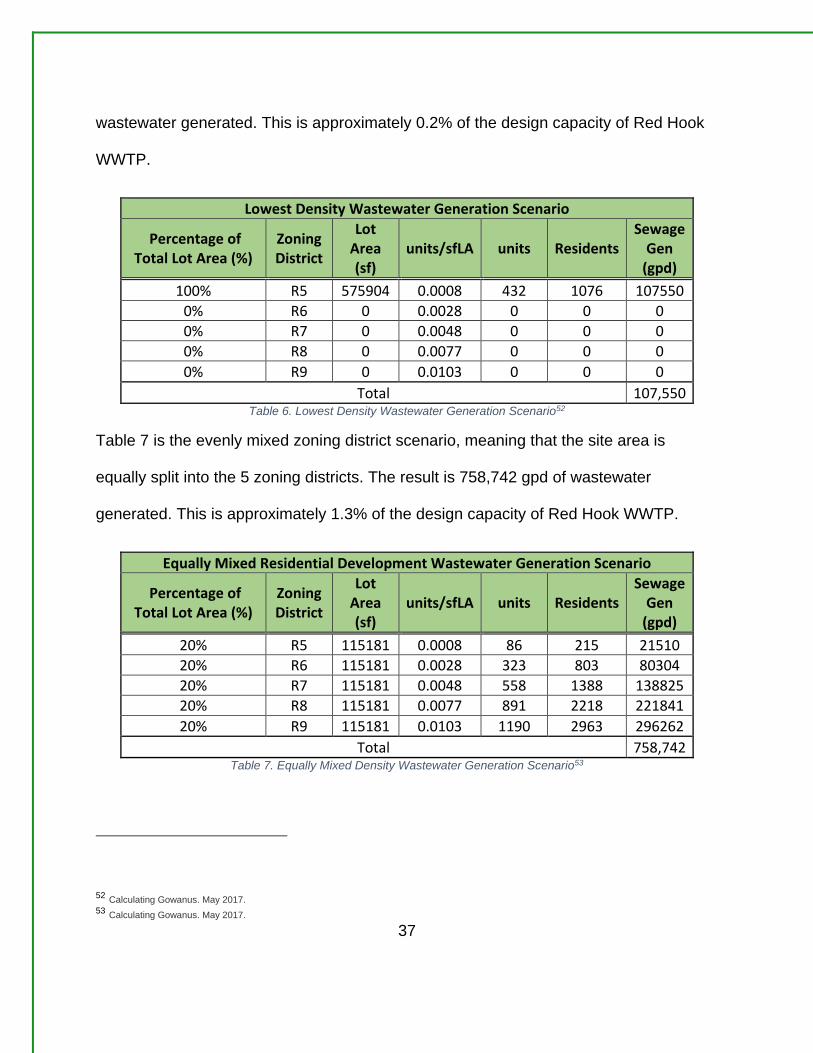
Table 7 is the evenly mixed zoning district scenario, meaning that the site area is
equally split into the 5 zoning districts. The result is 758,742 gpd of wastewater
generated. This is approximately 1.3% of the design capacity of Red Hook WWTP.
Equally Mixed Residential Development Wastewater Generation Scenario
Percentage of Total Lot Area (%)
Zoning District
Lot Area (sf)
units/sfLA units Residents Sewage
Gen (gpd)
20% R5 115181 0.0008 86 215 21510
20% R6 115181 0.0028 323 803 80304
20% R7 115181 0.0048 558 1388 138825
20% R8 115181 0.0077 891 2218 221841
20% R9 115181 0.0103 1190 2963 296262
Total 758,742 Table 7. Equally Mixed Density Wastewater Generation Scenario53
52 Calculating Gowanus. May 2017. 53 Calculating Gowanus. May 2017.
38
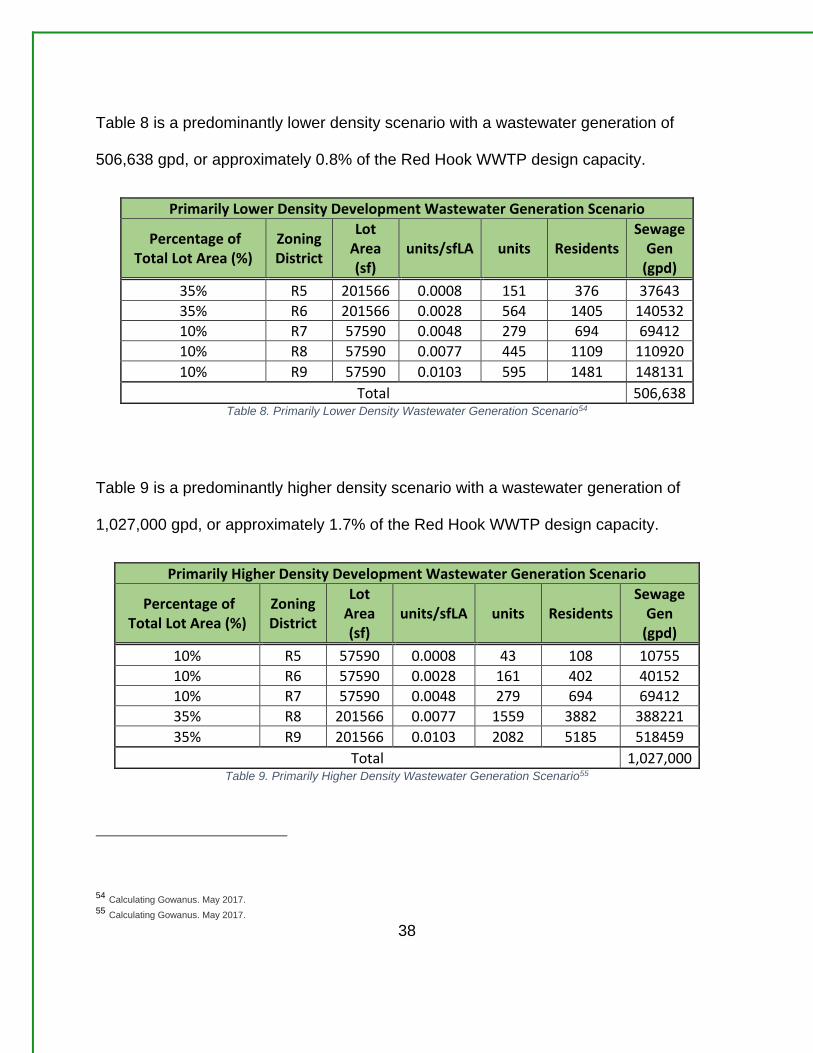
Table 8 is a predominantly lower density scenario with a wastewater generation of
506,638 gpd, or approximately 0.8% of the Red Hook WWTP design capacity.
Primarily Lower Density Development Wastewater Generation Scenario
Percentage of Total Lot Area (%)
Zoning District
Lot Area (sf)
units/sfLA units Residents Sewage
Gen (gpd)
35% R5 201566 0.0008 151 376 37643
35% R6 201566 0.0028 564 1405 140532
10% R7 57590 0.0048 279 694 69412
10% R8 57590 0.0077 445 1109 110920
10% R9 57590 0.0103 595 1481 148131
Total 506,638 Table 8. Primarily Lower Density Wastewater Generation Scenario54
Table 9 is a predominantly higher density scenario with a wastewater generation of
1,027,000 gpd, or approximately 1.7% of the Red Hook WWTP design capacity.
Primarily Higher Density Development Wastewater Generation Scenario
Percentage of Total Lot Area (%)
Zoning District
Lot Area (sf)
units/sfLA units Residents Sewage
Gen (gpd)
10% R5 57590 0.0008 43 108 10755
10% R6 57590 0.0028 161 402 40152
10% R7 57590 0.0048 279 694 69412
35% R8 201566 0.0077 1559 3882 388221
35% R9 201566 0.0103 2082 5185 518459
Total 1,027,000 Table 9. Primarily Higher Density Wastewater Generation Scenario55
54 Calculating Gowanus. May 2017. 55 Calculating Gowanus. May 2017.
39
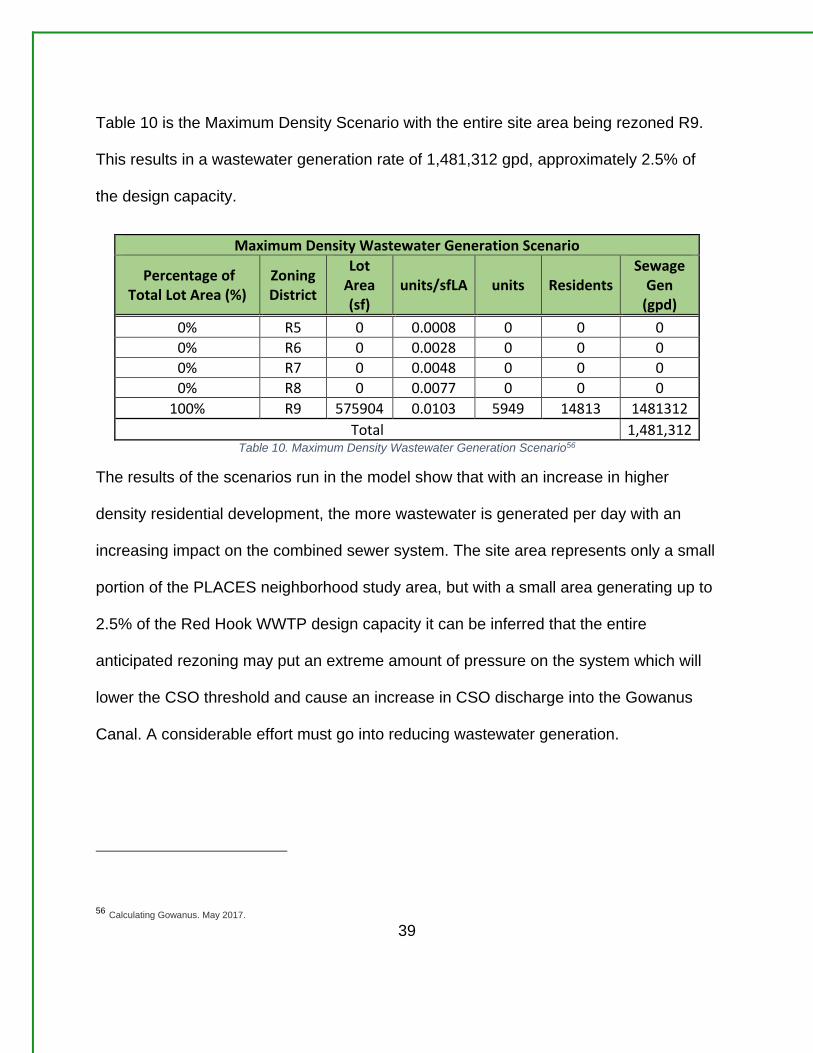
Table 10 is the Maximum Density Scenario with the entire site area being rezoned R9.
This results in a wastewater generation rate of 1,481,312 gpd, approximately 2.5% of
the design capacity.
Maximum Density Wastewater Generation Scenario
Percentage of Total Lot Area (%)
Zoning District
Lot Area (sf)
units/sfLA units Residents Sewage
Gen (gpd)
0% R5 0 0.0008 0 0 0
0% R6 0 0.0028 0 0 0
0% R7 0 0.0048 0 0 0
0% R8 0 0.0077 0 0 0
100% R9 575904 0.0103 5949 14813 1481312
Total 1,481,312 Table 10. Maximum Density Wastewater Generation Scenario56
The results of the scenarios run in the model show that with an increase in higher
density residential development, the more wastewater is generated per day with an
increasing impact on the combined sewer system. The site area represents only a small
portion of the PLACES neighborhood study area, but with a small area generating up to
2.5% of the Red Hook WWTP design capacity it can be inferred that the entire
anticipated rezoning may put an extreme amount of pressure on the system which will
lower the CSO threshold and cause an increase in CSO discharge into the Gowanus
Canal. A considerable effort must go into reducing wastewater generation.
56 Calculating Gowanus. May 2017.
40
Stormwater
RH-035 and Site Area Stormwater Runoff
Stormwater runoff is the flow generated by a rain event that flows into combined sewer
system and triggers CSO discharges. RH-035 is approximately 98 acres and 99.4%
impervious surfaces. The almost completely impervious land cover of RH-035 combined
with requirements on new developments to implement strict stormwater management
practices mean that any new development in the neighborhood would reduce
stormwater runoff in RH-035 by default.
To quantify the amount of stormwater generated from the site area in a post
development scenario the calculations must consider stormwater management
regulations and guidelines for new developments. The New York State DEC’s 2015
Stormwater Design Manual “presents a unified approach for sizing green infrastructure
for runoff reduction and SMPs to meet pollutant removal goals, reduce channel erosion,
prevent overbank flooding, and help control extreme floods.”57 The DEC uses a 90%
rule when designing green infrastructure and other stormwater management systems.
This stormwater analysis uses the 90% rule and applies it to the Lot Area to calculate
the charges in stormwater generation in RH-035 as a result of new residential
development within the Site Area. The analysis considers the Lot Area vs Street Area
57 NYS DEC Stormwater Design Manual 2015, Ch4. Unified Stormwater Sizing Criteria. Retrieved 2017
41
within the Site Area as new developments are not required stormwater generated on
streets.
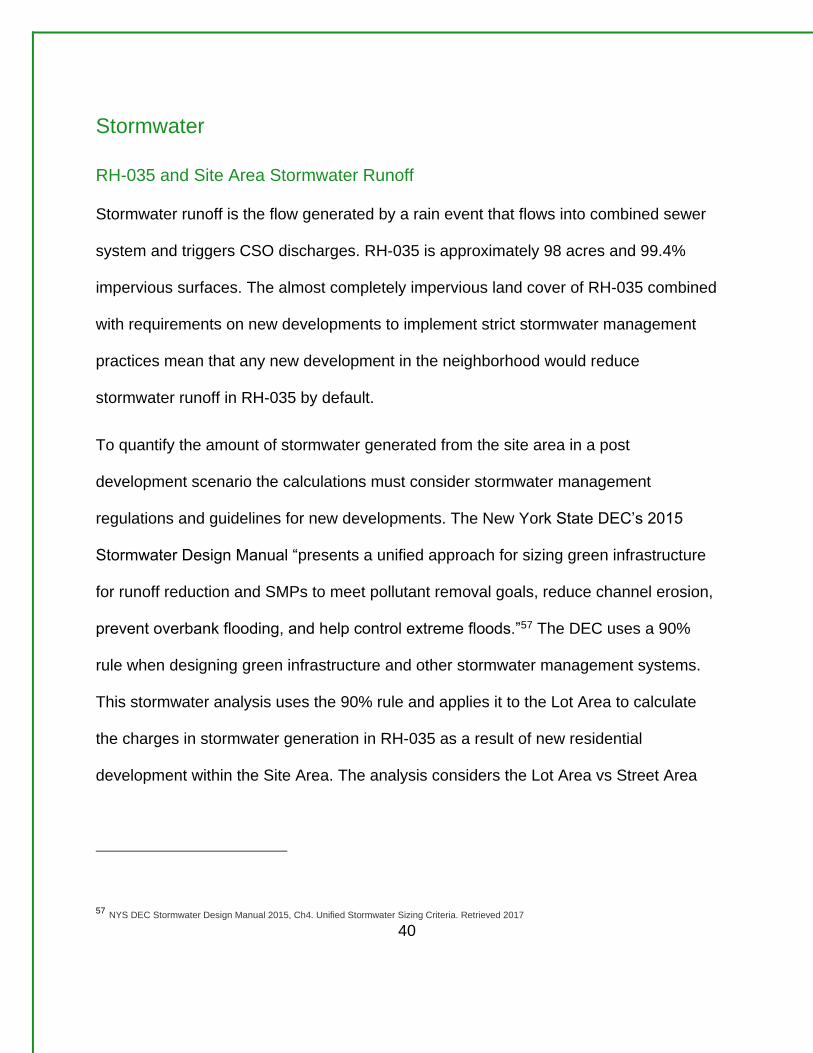
Graph 2. below illustrates the idea that new development will increase stormwater
management in RH-035. This will decrease the amount of CSO discharge from the
same size rain event compared to predevelopment. The change land cover and total
impervious surface may differ from pre to post development based on the design but the
90% rule still governs the total amount of water that must be managed. The analysis
calculates the potential decrease in stormwater runoff due to development based on the
90% rule.
Graph 2. Development Impacts on Stormwater Generation58
58 Calculating Gowanus. May 2017.
42
How Development Will Improve Stormwater Management
The current land cover of the site area is almost exclusively impermeable. A stormwater
generation analysis is conducting by calculating the amount of stormwater generated
from the site area. As the site area is entirely connected to the combine sewer system it
is assumed all runoff will enter the combined system.
A 1.2” rain event generates 3,168,776 gallons of stormwater that results in 528,101
gallons of CSO discharge at the RH-035 outfall59. The total site area is 767,351 sf or
about 24% of the total area of RH-03560. These calculations consider the impervious
surface run off coefficients and currently green infrastructure currently installed in RH-
035.
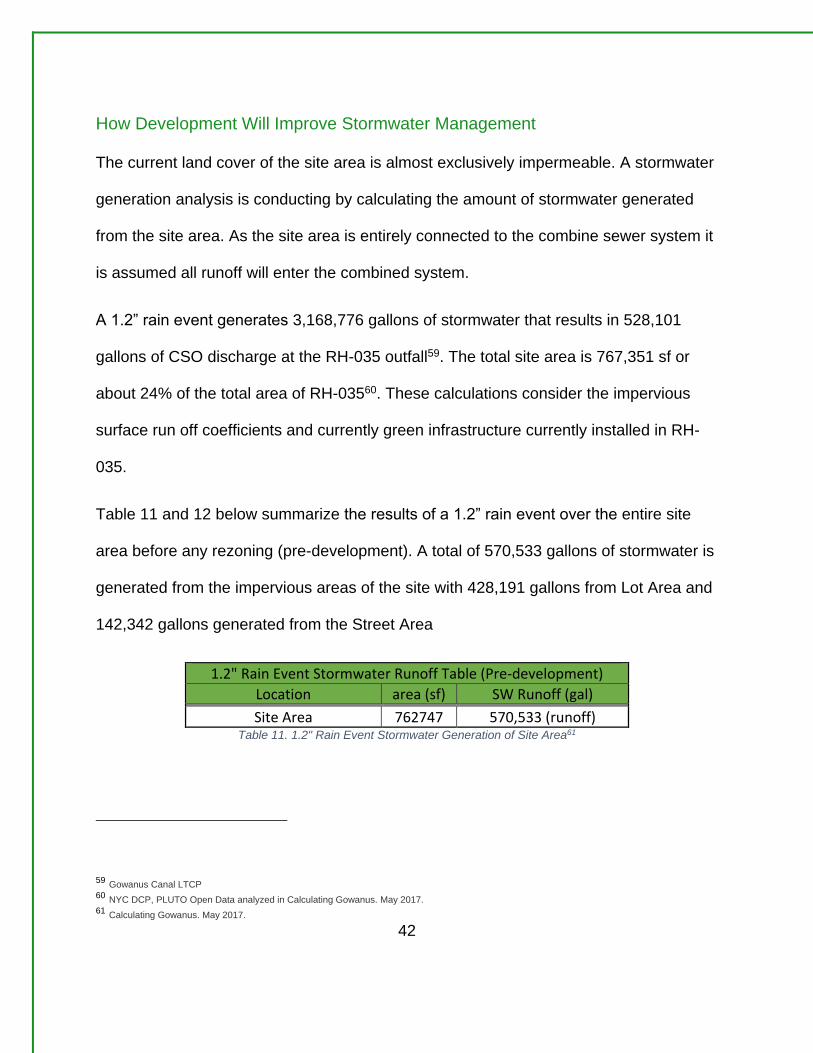
Table 11 and 12 below summarize the results of a 1.2” rain event over the entire site
area before any rezoning (pre-development). A total of 570,533 gallons of stormwater is
generated from the impervious areas of the site with 428,191 gallons from Lot Area and
142,342 gallons generated from the Street Area
1.2" Rain Event Stormwater Runoff Table (Pre-development)
Location area (sf) SW Runoff (gal)
Site Area 762747 570,533 (runoff) Table 11. 1.2" Rain Event Stormwater Generation of Site Area61
59 Gowanus Canal LTCP 60 NYC DCP, PLUTO Open Data analyzed in Calculating Gowanus. May 2017. 61 Calculating Gowanus. May 2017.
43
1.2" Rain Event Stormwater Runoff Table (Pre-development)
Location area (sf) SW Runoff (gal)
Lot Area (within Site Area) 575,904 428,191
Street Area (within Site Area) 191,447 142,342 Table 12. Pre Development 1.2” Rain Event Stormwater Generation of Lot Area62
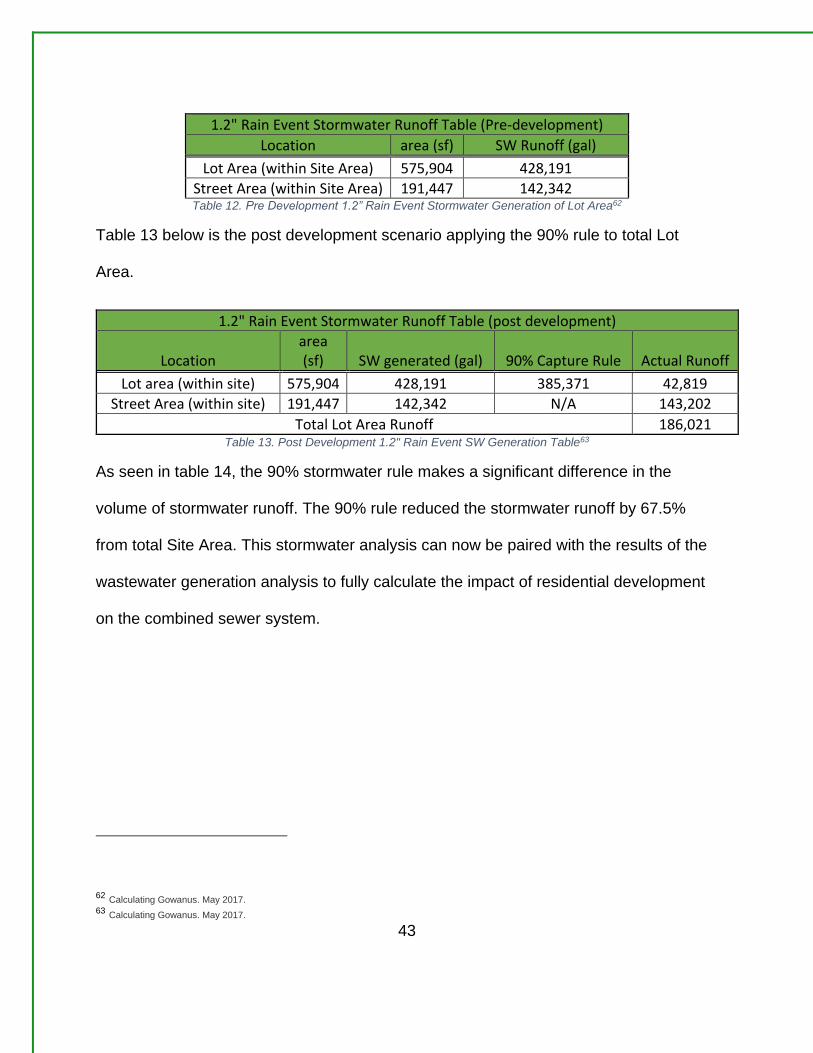
Table 13 below is the post development scenario applying the 90% rule to total Lot
Area.
1.2" Rain Event Stormwater Runoff Table (post development)
Location area (sf) SW generated (gal) 90% Capture Rule Actual Runoff
Lot area (within site) 575,904 428,191 385,371 42,819
Street Area (within site) 191,447 142,342 N/A 143,202
Total Lot Area Runoff 186,021 Table 13. Post Development 1.2" Rain Event SW Generation Table63
As seen in table 14, the 90% stormwater rule makes a significant difference in the
volume of stormwater runoff. The 90% rule reduced the stormwater runoff by 67.5%
from total Site Area. This stormwater analysis can now be paired with the results of the
wastewater generation analysis to fully calculate the impact of residential development
on the combined sewer system.
62 Calculating Gowanus. May 2017. 63 Calculating Gowanus. May 2017.
44
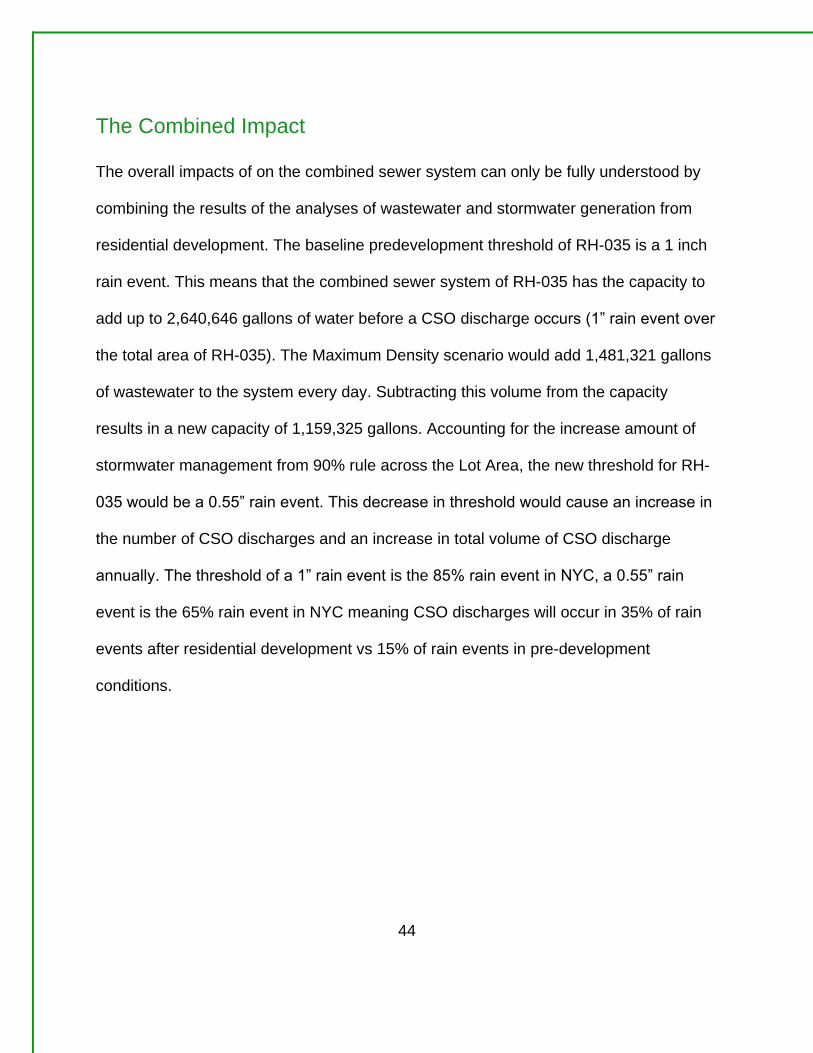
The Combined Impact
The overall impacts of on the combined sewer system can only be fully understood by
combining the results of the analyses of wastewater and stormwater generation from
residential development. The baseline predevelopment threshold of RH-035 is a 1 inch
rain event. This means that the combined sewer system of RH-035 has the capacity to
add up to 2,640,646 gallons of water before a CSO discharge occurs (1” rain event over
the total area of RH-035). The Maximum Density scenario would add 1,481,321 gallons
of wastewater to the system every day. Subtracting this volume from the capacity
results in a new capacity of 1,159,325 gallons. Accounting for the increase amount of
stormwater management from 90% rule across the Lot Area, the new threshold for RH-
035 would be a 0.55” rain event. This decrease in threshold would cause an increase in
the number of CSO discharges and an increase in total volume of CSO discharge
annually. The threshold of a 1” rain event is the 85% rain event in NYC, a 0.55” rain
event is the 65% rain event in NYC meaning CSO discharges will occur in 35% of rain
events after residential development vs 15% of rain events in pre-development
conditions.
45
Graph 3. Below illustrates the change in CSO threshold due to an increase in
wastewater generation and an increase in stormwater management from residential
rezoning in RH-035.
Graph 3. Impacts on CSO Threshold from Residential Rezoning64
64 Calculating Gowanus. May 2017.
46
Recommendations
Wastewater Reduction
“Reducing water use is a cost-effective strategy for reducing CSOs, because
lower sanitary flows create additional storage capacity in the interceptors and
treatment capacity at the WWTPs.”65
The largest impact to the combined sewer system comes from the large increase in
wastewater generation from residential development. Wastewater generation is tied
directly to water consumption. There are two ways to reducing wastewater generation,
changing social patterns of water consumption or use technology to treat and reuse
wastewater. The rezoning process will have an unknown impact on human behavior
concerning water consumption but it provides ample opportunity for a technological
intervention on water demand and wastewater generation. 65% of water use within
residential buildings is used for drinking and bathing purposes and it is estimated that
50% of New York City’s water demand is for nonpotable uses such as cooling towers.66
Building water demand can be drastically reduced through an onsite wastewater
treatment plant also known as a black water recycling system. A black water recycling
system takes all water from a building (toilets, showers, sinks, etc) and treats the water
to water quality standards to be reused throughout the building. There are at least two
65 NYC DEP Green Infrastructure Plan 2010. Retrieved April 2017 66 Black Water Treatment Plant Brings Clarity to a Gray Area. (2015, June 16). Retrieved April 13, 2017, from
https://dagherengineering.wordpress.com/2015/06/15/black-water-treatment-plant-brings-clarity-to-a-gray-area/
47
current residential buildings in New York City with such systems installed resulting in a
largely reduced wastewater generation rate.
The Helena located in midtown Manhattan is a 597-unit luxury apartment building with
an onsite black water recycling system that reduces potable water demand by 50,000
gallons per day67. The black water recycling system treats water to potable water
standards for reuse in toilets, a cooling tower, and irrigation68.
The Helena has 597 units and using the 2.49 people per units used in the Model and
100 gallons per person per day, the buildings water demand/wastewater generation
would be approximately 148,653 gallons of water. 50,000 gallons per day reduction is a
one third reduction is wastewater generation. Using the Maximum Density Scenario with
would decrease wastewater generation by approximately 444,000 gallons. This
reduction would increase the CSO threshold from the modelled 0.55” rain event to a
0.77” rain event, equivalent to the 79% rain event for NYC.
The Solaire Building in Battery Park City is a 293-unit 27 story residential tower with a
similar black water recycling system that reduces potable water demand by 50%69.
Using a 50% reduction in wastewater generation in the Maximum Density Scenario,
67 Black Water Treatment. Dagher Engineering 68 Black Water Treatment. Dagher Engineering 69 NRDC. Case Study: The Solaire. Retrieved April, 2017, from https://www.nrdc.org/sites/default/files/solaire.pdf
48
there would be a reduction of 740,000 gallons which would increase the CSO threshold
of RH-035 to 0.91” rain event, or the 82% rain event for NYC.
“Currently water reuse projects in New York account for less than one tenth of
one percent of the natural water flow in the state. They are regulated on a case-
by-case basis by several different state and local entities, depending on the
nature of the project, its health and environmental implications, and the
jurisdiction of a given project. For example, the New York State Department of
Environmental Conservation (DEC) regulates reclaimed wastewater from
WWTPs through State Pollutant Discharge Elimination System (SPDES) permits.
The New York Department of State (DOS) regulates greywater reuse within
buildings through the state’s plumbing code, which may, in turn, be enforced by
local building inspectors.”70
Water reuse is an underutilized tool for CSO reduction and the permitting process is
slowed by multiple agencies having regulations on various parts of the wastewater
recycling process71. The rezoning process should require onsite wastewater recycling
and is an opportunity to bring agencies together to coordinated and streamline the
permitting process.
Stormwater Reduction
The second part of meeting the zero CSO goal is to reduce the amount of stormwater
entering the combined sewer system which can be accomplished in several ways. The
70 Potential Reuses of Greywater and Reclaimed Wastewater in New York State. NYC DEC, November 23rd 2010.
http://www.dec.ny.gov/docs/water_pdf/waterresue.pdf 71 Potential Reuses of Greywater and Reclaimed Wastewater in New York State
49
90% rule for stormwater management does address a significant portion of stormwater
runoff, but still allows for water to enter the combined system. Improving on the 90%
rule to 100% stormwater management over an entire Site Area would be a significant
step towards zero CSO discharge. The Site Area bordering the Gowanus Canal
provides a unique opportunity to manage all stormwater falling within the Site Area
boundaries.
A recent residential development along the Gowanus Canal, the Lightstone
development at 363/365 Bond Street provides a great example of using the canal as a
resource to reduce stormwater impacts on the combined sewer system. The Lightstone
development fell under the NYC stormwater rule just as many future new developments
will. A common industry practice is to install a stormwater holding tank with the capacity
to detain the required volume of stormwater onsite until it can be discharged into the
combined sewer. The Lightstone development went in a different direction by splitting
the stormwater system from the wastewater plumbing and redirecting the stormwater
towards the canal. Figures 11. and 12. show the flow of stormwater before and after
development. The flow from the entire lot and street area bordering the development is
redirected towards the canal via a separate sewer system. This stormwater undergoes
pretreatment before being discharged into the Gowanus Canal. The pretreatment
system is based on Best Management Practices (BMPs) including hydrodynamic
50
Devices to separate oils, greases, and suspend particles along with infiltration through
naturally landscaped areas72.
Figure 11. Predevelopment Stormwater Flow73
72 363-365 Bond Street Final Environmental Impact Statement. Feb 6th 2009. Retrieved March 2017.
https://www1.nyc.gov/site/planning/applicants/env-review/363-365-bond-street.page 73 363-365 Bond Street Final Environmental Impact Statement.

51
Figure 12. Post Development Stormwater Flow74
74 363-365 Bond Street Final Environmental Impact Statement.
52
The combined sewer system would receive a small benefit from an increase in
stormwater management from 90% to 100% through diverting stormwater into the
Gowanus Canal. Combining the stormwater impacts with the recommended 50% black
water recycling system would increase the CSO threshold from 0.91” to a 0.93” rain
event. The small increase in management results in a small but important increase in
threshold as it gets the threshold closer to predevelopment levels and reaching the zero
CSO discharge goal.
Increasing stormwater management rules on developments along the canal is a
scalable and efficient way of decreasing stormwater runoff in the Site Area. The
Lightstone development sets precedence that separating the stormwater system and
directly draining pretreated water into the Canal is the best stormwater management
option given the Site Area location.
53
Conclusion
Residential rezoning in the Gowanus will have a profound impact on the combine sewer
system and substantially increase the amount of pollutants flowing into the Gowanus
Canal through increased frequency of CSO discharges as a result of a lower CSO
threshold. The timing of the rezoning provides opportunity for multiple agencies, the
community, and the GCC to plan together for a more sustainable and environmentally
friendly future for the neighborhood. The Superfund cleanup process will last for
decades as developments sprout up along the banks of the canal increasing the amount
of wastewater added to the combined sewer system but also improving stormwater
management as required by the city.
Recommendations made to install black water recycling systems in all new residential
developments can reduce wastewater generation by up to 50%, pairing this with
separate stormwater sewers that pretreat and discharge directly into the canal can bring
the CSO threshold of RH-035 close to predevelopment levels. Although there are
additional steps in permitting these implementations, the GCC should advocate for the
city to study and streamline the process of technological interventions to reduce CSO
discharge.
The ongoing DCP PLACES study, and the future Environmental Impact Statement and
ULURP processes provide The GCC the opportunity to advocate for the Gowanus Blue
goal of reducing CSO discharge into the canal to zero.
54
Appendix
An alternative to using median values to calculating units per lot area is to use average
values of units and lot area for each rezoning district, the median was selected to avoid
outliers in the data. A comparison of median versus average values for units/sfLA
results show that about half of zoning districts median values and higher than the
average and half are lower. See Table 14 below for a full median versus average value
comparison.
A second alternative is using a single target building (making the analysis based solely
on one existing development). For example, the Lightstone Development at 365 Bond
Street along the Gowanus Canal is zoned R7-2/M1-4. The units per lot area for this
building is noticeably lower than the median value for the zoning district (0.0048 vs
0.0112)75. This type of analysis in the model will give a more precise value if the
development was copied exactly across every lot in the site area.
Median vs Average Value Comparison for unit/sfLA Values
Zoning district Median unit/sfLA Avg unit/sfLA Difference
R5 0.00075 0.001099718 -0.00035
R6 0.00280 0.003223922 -0.00042
R7 0.00484 0.004689431 0.00015
R8 0.00774 0.004382517 0.00335
R9 0.01033 0.010329925 0.00000
Full break down
R5 0.00076 0.000962021 -0.00020
R5B 0.00130 0.001424583 -0.00012
75 NYC DCP, PLUTO Open Data
55
R5D 0.00194 0.001523133 0.00041
R6 0.00320 0.003729716 -0.00053
R6A 0.00250 0.003046127 -0.00055
R6B 0.00240 0.002032572 0.00037
R7-1 0.00467 0.0047523 -0.00009
R7-2 0.01115 0.00574506 0.00541
R7A 0.00472 0.00442269 0.00029
R7B 0.00234 0.002781705 -0.00044
R7D 0.00945 0.009447365 0.00000
R7X 0.00657 0.00593534 0.00064
R8 0.00207 0.00368814 -0.00161
R8A 0.00600 0.006877592 -0.00088
R8B 0.00298 0.00271855 0.00026
R8X 0.00708 0.004949023 0.00213
R9 0.01033 0.010329925 0.00000
Note: If the value in the difference column is negative, the average unit/sfLA value is greater than the median value for the zoning district
Table 14. Median vs Average Value Comparison for unit/sfLA Values76
76 Calculating Gowanus. May 2017.