Embed Size (px)
Citation preview
International Journal of Environmental Monitoring and Analysis 2018; 6(1): 1-12
http://www.sciencepublishinggroup.com/j/ijema
doi: 10.11648/j.ijema.20180601.11
ISSN: 2328-7659 (Print); ISSN: 2328-7667 (Online)
Predicting the Capacity of Receiving Wastewater of Thuong River in Vietnam and Propose Policies for Water Resources Protection
Trinh Thi Thu Van1, *
, Bui Cong Quang2, Nguyen Duc Viet
3, Nguyen Tung Phong
4
1Department of Water Resources Management, Ministry of Natural Resources and Environment, Hanoi, Vietnam
2Faculty of Hydrology and Water Resources, Thuyloi University, Hanoi, Vietnam
3Directorate of Water Resources, Ministry of Agriculture and Rural Development, Hanoi, Vietnam 4Vietnam Academy for Water Resources, Ministry of Agriculture and Rural Development, Hanoi, Vietnam
Email address:
*Corresponding author
To cite this article: Trinh Thi Thu Van, Bui Cong Quang, Nguyen Duc Viet, Nguyen Tung Phong. Predicting the Capacity of Receiving Wastewater of Thuong
River in Vietnam and Propose Policies for Water Resources Protection. International Journal of Environmental Monitoring and Analysis.
Vol. 6, No. 1, 2018, pp. 1-12. doi: 10.11648/j.ijema.20180601.11
Received: January 19, 2018; Accepted: January 31, 2018; Published: March 5, 2018
Abstract: Thuong river - a tributary of the Red River in Vietnam, is currently facing the degradation in both water quality
and quantity. One of the major causes of water pollution is wastewater discharge into the river from industrial plants,
agricultural and residential areas where wastewater is untreated or treated but does not meet the Vietnamese standards. This
report presents the results of predicting the capacity of receiving wastewater of Thuong river from the Cau Son hydrological
station to Pha Lai hydrological station in 2020 and 2030 with 3 scenarios: (i) The amount of waste water increases according to
plan, but not treated, (ii) 30% waste water is treated, (iii) 70% waste water is treated. The method is the application of the
MIKE 11 model combined with the waste load calculation formula. The results showed that, in many river stretches, especially
the stretches run through Bac Giang city and industrial areas, the river pollution is increasingly serious, and has no signs of
stop. Therefore, it is necessary to propose the water policies to control the wastewater discharge into the Thuong River in
particular and the Red River system in general in order to protect water resource.
Keywords: Receiving Wastewater, Water Quality, Model MIKE 11, Water Policy, Thuong River
1. Introduction
The Law on Water resources 2012 [1] of Vietnam
regulates some new provisions on water resources
management and protection, especially the field of
wastewater discharge management. The Article 37 of the
Law states: “The organizations and individuals who
discharge waste water into water sources must have a
permit issued by the State competent agencies (excluding
the small scale and waste water without a harmful chemical
or radiative matter). One of the basis to grant a permit is
capacity of receiving wastewater according to the Decree
No. 201/2013/ND-CP, 2013 [2].
Capacity of receiving wastewater of river is the loading
capacity to receive a number of pollutants while still
maintains the concentration of pollutants in the water sources
which does not exceed the allowable values specified in the
national water quality standards in the Circular 09/2009/TT-
BTNMT, MONRE Vietnam [3]. The assessment of capacity
of receiving wastewater requires not only have a good long -
term investigation of hydrology, hydraulic and wastewater
discharge activities, but also to assess and predict water
quality in the future. Therefore, a technical approach should
be applied.
2 Trinh Thi Thu Van et al.: Predicting the Capacity of Receiving Wastewater of Thuong River in Vietnam and Propose Policies for Water Resources Protection
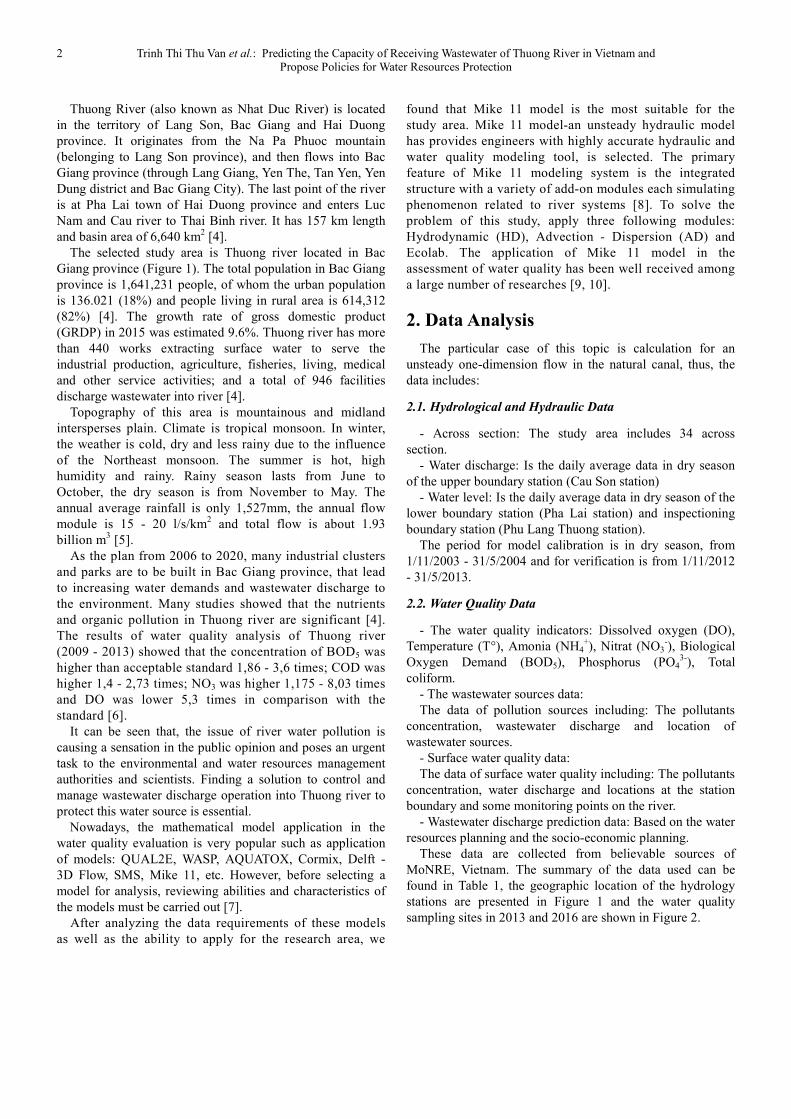
Thuong River (also known as Nhat Duc River) is located
in the territory of Lang Son, Bac Giang and Hai Duong
province. It originates from the Na Pa Phuoc mountain
(belonging to Lang Son province), and then flows into Bac
Giang province (through Lang Giang, Yen The, Tan Yen, Yen
Dung district and Bac Giang City). The last point of the river
is at Pha Lai town of Hai Duong province and enters Luc
Nam and Cau river to Thai Binh river. It has 157 km length
and basin area of 6,640 km2 [4].
The selected study area is Thuong river located in Bac
Giang province (Figure 1). The total population in Bac Giang
province is 1,641,231 people, of whom the urban population
is 136.021 (18%) and people living in rural area is 614,312
(82%) [4]. The growth rate of gross domestic product
(GRDP) in 2015 was estimated 9.6%. Thuong river has more
than 440 works extracting surface water to serve the
industrial production, agriculture, fisheries, living, medical
and other service activities; and a total of 946 facilities
discharge wastewater into river [4].
Topography of this area is mountainous and midland
intersperses plain. Climate is tropical monsoon. In winter,
the weather is cold, dry and less rainy due to the influence
of the Northeast monsoon. The summer is hot, high
humidity and rainy. Rainy season lasts from June to
October, the dry season is from November to May. The
annual average rainfall is only 1,527mm, the annual flow
module is 15 - 20 l/s/km2 and total flow is about 1.93
billion m3 [5].
As the plan from 2006 to 2020, many industrial clusters
and parks are to be built in Bac Giang province, that lead
to increasing water demands and wastewater discharge to
the environment. Many studies showed that the nutrients
and organic pollution in Thuong river are significant [4].
The results of water quality analysis of Thuong river
(2009 - 2013) showed that the concentration of BOD5 was
higher than acceptable standard 1,86 - 3,6 times; COD was
higher 1,4 - 2,73 times; NO3 was higher 1,175 - 8,03 times
and DO was lower 5,3 times in comparison with the
standard [6].
It can be seen that, the issue of river water pollution is
causing a sensation in the public opinion and poses an urgent
task to the environmental and water resources management
authorities and scientists. Finding a solution to control and
manage wastewater discharge operation into Thuong river to
protect this water source is essential.
Nowadays, the mathematical model application in the
water quality evaluation is very popular such as application
of models: QUAL2E, WASP, AQUATOX, Cormix, Delft -
3D Flow, SMS, Mike 11, etc. However, before selecting a
model for analysis, reviewing abilities and characteristics of
the models must be carried out [7].
After analyzing the data requirements of these models
as well as the ability to apply for the research area, we
found that Mike 11 model is the most suitable for the
study area. Mike 11 model-an unsteady hydraulic model
has provides engineers with highly accurate hydraulic and
water quality modeling tool, is selected. The primary
feature of Mike 11 modeling system is the integrated
structure with a variety of add-on modules each simulating
phenomenon related to river systems [8]. To solve the
problem of this study, apply three following modules:
Hydrodynamic (HD), Advection - Dispersion (AD) and
Ecolab. The application of Mike 11 model in the
assessment of water quality has been well received among
a large number of researches [9, 10].
2. Data Analysis
The particular case of this topic is calculation for an
unsteady one-dimension flow in the natural canal, thus, the
data includes:
2.1. Hydrological and Hydraulic Data
- Across section: The study area includes 34 across
section.
- Water discharge: Is the daily average data in dry season
of the upper boundary station (Cau Son station)
- Water level: Is the daily average data in dry season of the
lower boundary station (Pha Lai station) and inspectioning
boundary station (Phu Lang Thuong station).
The period for model calibration is in dry season, from
1/11/2003 - 31/5/2004 and for verification is from 1/11/2012
- 31/5/2013.
2.2. Water Quality Data
- The water quality indicators: Dissolved oxygen (DO),
Temperature (T°), Amonia (NH4+), Nitrat (NO3
-), Biological
Oxygen Demand (BOD5), Phosphorus (PO43-
), Total
coliform.
- The wastewater sources data:
The data of pollution sources including: The pollutants
concentration, wastewater discharge and location of
wastewater sources.
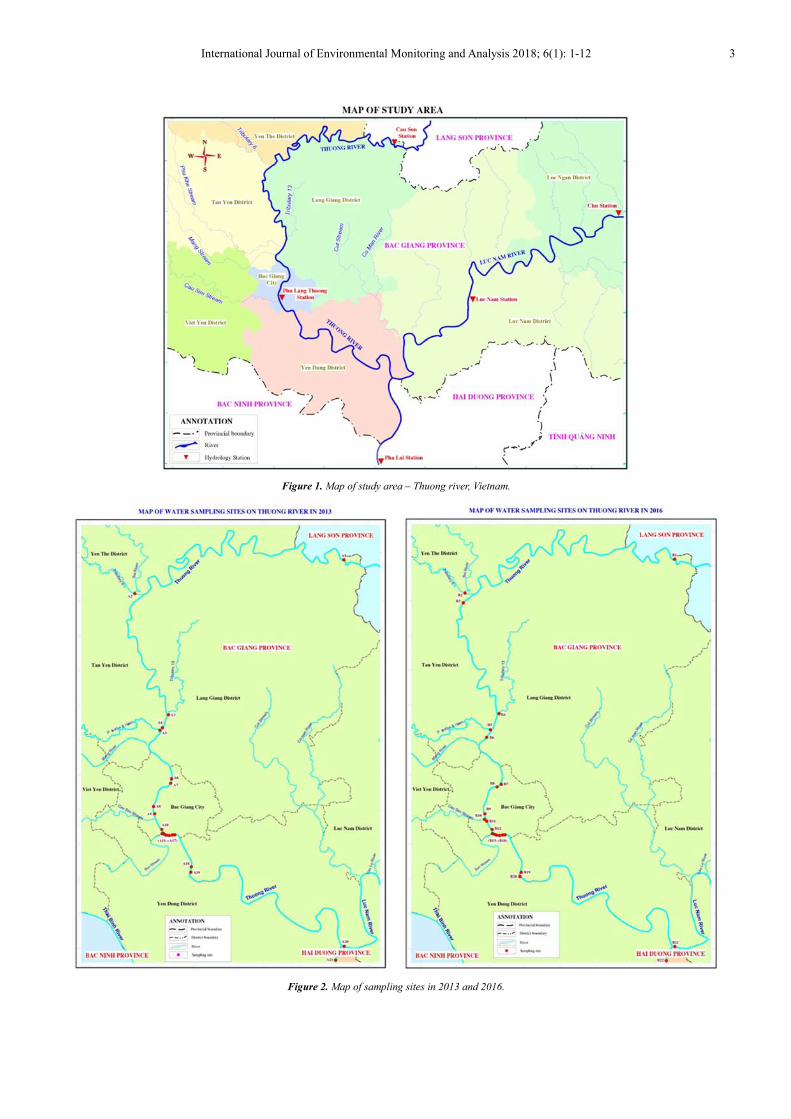
- Surface water quality data:
The data of surface water quality including: The pollutants
concentration, water discharge and locations at the station
boundary and some monitoring points on the river.
- Wastewater discharge prediction data: Based on the water
resources planning and the socio-economic planning.
These data are collected from believable sources of
MoNRE, Vietnam. The summary of the data used can be
found in Table 1, the geographic location of the hydrology
stations are presented in Figure 1 and the water quality
sampling sites in 2013 and 2016 are shown in Figure 2.
International Journal of Environmental Monitoring and Analysis 2018; 6(1): 1-12 3
Figure 1. Map of study area – Thuong river, Vietnam.
Figure 2. Map of sampling sites in 2013 and 2016.
4 Trinh Thi Thu Van et al.: Predicting the Capacity of Receiving Wastewater of Thuong River in Vietnam and Propose Policies for Water Resources Protection
Table 1. Summary of the data used in the study.
Data type Date Remark Purpose
Across sections 2000 Thuong river: 32 Modelling
Water level 1/11/2003 - 31/5/2004 Phu Lang Thuong, Pha Lai station Hydrodynamic calibration
1/11/2012 - 31/5/2013 Hydrodynamic verification
Water discharge 1/11/2003 - 31/5/2004 Cau Son station Hydrodynamic calibration
1/11/2012 - 31/5/2013 Hydrodynamic verification
08/3/2013 - 10/3/2013 Water quality calibration
08/3/2016 - 10/3/2016 Water quality verification
Water quality parameters - DO, Temperature, NH4+, NO3-, BOD5, PO43-, Total
coliform (Coliform) Data for running water quality model
Surface water quality 08/3/2013 - 12/3/2013 Pollutant concentration at: Cau Sơn and Pha Lai
station, and some monitoring sites on Thuong river Data for running water quality model
Wastewater sources 08/3/2016 - 12/3/2016 Pollutants concentration, discharge and wastewater
source location Data for running water quality model
Map Thuong river Mapping
Socio-economic 2020, 2030 Status and forecast of population, water demand,
wastewater discharge Assessing and predictwater quality
3. Methodology
The assessment is undertaken in four different steps.
(i) The first step simulates hydraulic and hydrological
status to identify the hydraulic parameters using
Hydrodynamic module (HD) of Mike 11 model.
(ii) The second step identifies water quality parameters of
Advection - Dispersion module (AD) and Ecobal module
including physical parameters and biological parameter as
coefficient of diffusion, respiratory, photosynthesis, etc.
(iii) The third step includes assessment of water quality in
the future based on scenarios and identifying water quality
objectives in each river sections.
(iv) The last step involves assessment of the capacity of
receiving wastewater of Thuong river based on the
contamination of pollutants along the river (the results of step
3) and using some equations to assess capacity of receiving
wastewater.
3.1. Hydrodynamic Module (HD)
The purpose of hydraulic calculation is to find the
hydraulic parameters in order to assess water quality in the
study areas. The hydraulic parameter is Manning roughness
coefficient.
Hydrodynamic module built from the equations of
continuity and momentum (the ‘Saint Venant’ equations).
The equation of continuity:
���� + ��
�� = �
The equation of momentum:
���� = �( ��
��� + �� �ℎ
�� + ������� = 0
Where:
- Q: Discharge (m3/s)
- A: Flow area (m2)
- q: Lateral inflow (m2/s)
- C: Chezy resistance coefficient (m1/2
/s)
- α: Momentum distribution coefficient.
- R: Hydraulic or resistance radius (m).
3.2. Advection - Dispersion (AD) and Ecolab Module
The purpose of running AD and Ecolab module is to
determine the most suitable water quality parameters for the
study. Then, using these parameters to predict water quality
changes based on the scenarios, thereby assess the capacity
of receiving wastewater.
The basic equation of these modules is Advection -
Dispersion equation:
����� + ���
�� − ��� ��� ��
��)� = −��� + ���
Where:
- A: Flow area (m2)
- C: Concentration (kg/m3)
- D: Dispersion coefficient
- q: Lateral inflow (m2/s)
- K: biodegradable coefficient, K is only used when the
phenomenon related to biochemical reactions.
ECOlab is accompanied by the water quality template,
which is divided into six levels. This study use “level 4 +
Photphorus + Coliform”.
3.3. Formula to Assess Capacity of Receiving Wastewater
Assessing the capacity of receiving wastewater of Thuong
river is conducted by the following steps: (i) Zoning river
sections; (ii) Calculating the maximum pollution load of
pollutants (Ltđ); (iii) Calculating background pollutant load
(Ln); (iv) Calculating of pollution load of waste source (Lt);
(v) Calculating the capacity to receive wastewater (Ltn);
These formula based on the Circular 09/2009/TT-BTNMT,
MONRE Vietnam [3].
��đ = (�� + ��) × ��� × 86.4 �" = �� × �� × 86.4
International Journal of Environmental Monitoring and Analysis 2018; 6(1): 1-12 5
�� = �� × �� × 86.4
��" � ��đ � �" � ��� � #�
Where:
- Ltđ (kg/day) is the maximum pollution load of the water
sources for contaminants under review;
- Ln (kg/day): pollution load which are available in the
receiving water sources
- Lt (kg/day): the pollution load in the waste source;
- Ltn (kg/day): capacity of receiving the pollution load of
water source.
- Qs (m3/s) is the instantaneous minimum flow measured at
water quality monitoring sites.
- Qt (m3/s) is the maximum wastewater discharge of waste
sources;
- Ctc (mg/l) is the concentration limit values of pollutants
under consideration specified in water quality standards to
ensure the use of water resources.
- Cs (mg/l): the maximum concentration value of the of
pollutants in the water sources before receiving wastewater;
- Ct (mg/l): the maximum concentration values of
pollutants in wastewater.
- 86.4 is dimensional conversion coefficient from (m3/s) x
(mg/l) to (kg/day).
- Fs: safety coefficient (0,3 < Fs <0,7).
If Ltn is greater than (>) 0, the water can still receive
pollutants. If Ltn is less than or equal (≤) 0, it means that the
water is no longer able to receive pollutants.
4. Research Results
4.1. The Result of Hydrodynamic Simulation
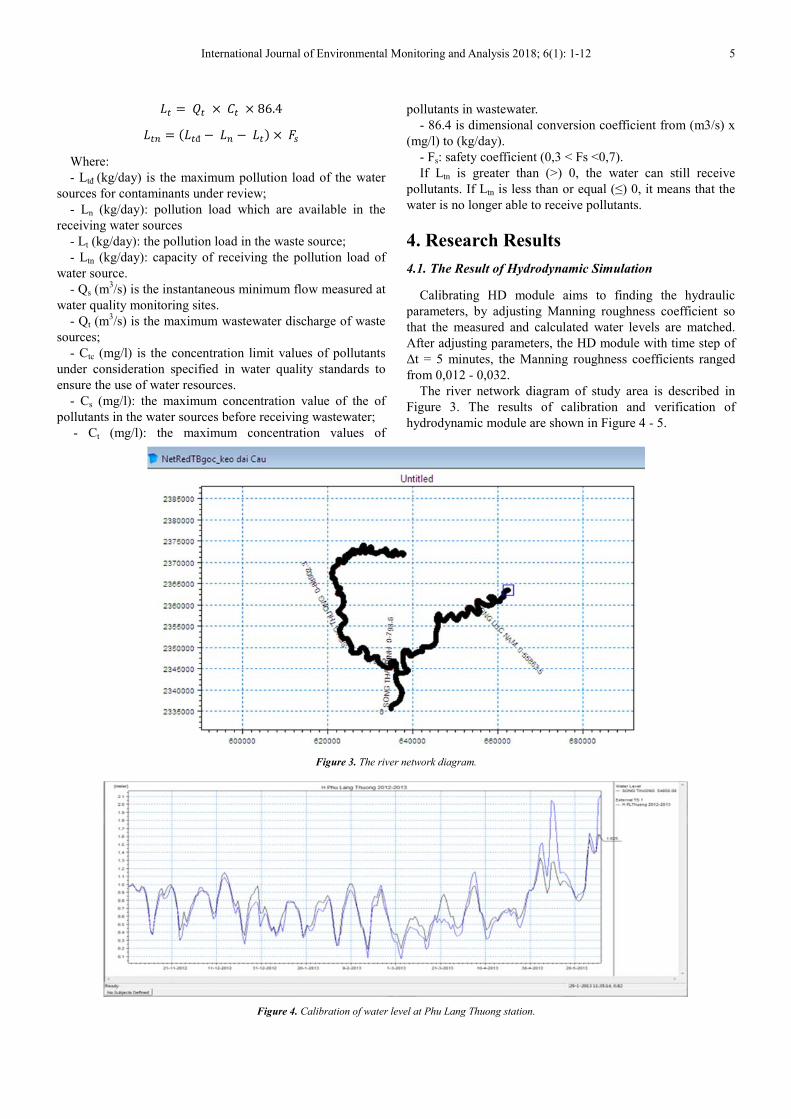
Calibrating HD module aims to finding the hydraulic
parameters, by adjusting Manning roughness coefficient so
that the measured and calculated water levels are matched.
After adjusting parameters, the HD module with time step of
∆t = 5 minutes, the Manning roughness coefficients ranged
from 0,012 - 0,032.
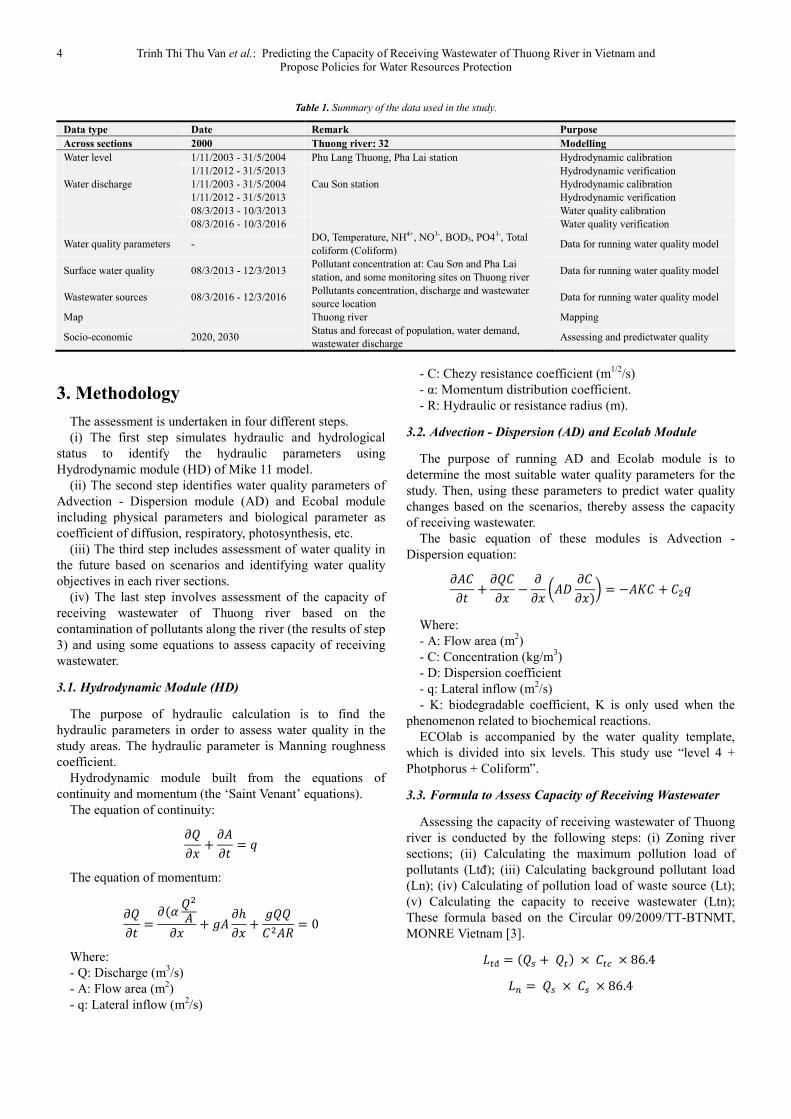
The river network diagram of study area is described in
Figure 3. The results of calibration and verification of
hydrodynamic module are shown in Figure 4 - 5.
Figure 3. The river network diagram.
Figure 4. Calibration of water level at Phu Lang Thuong station.
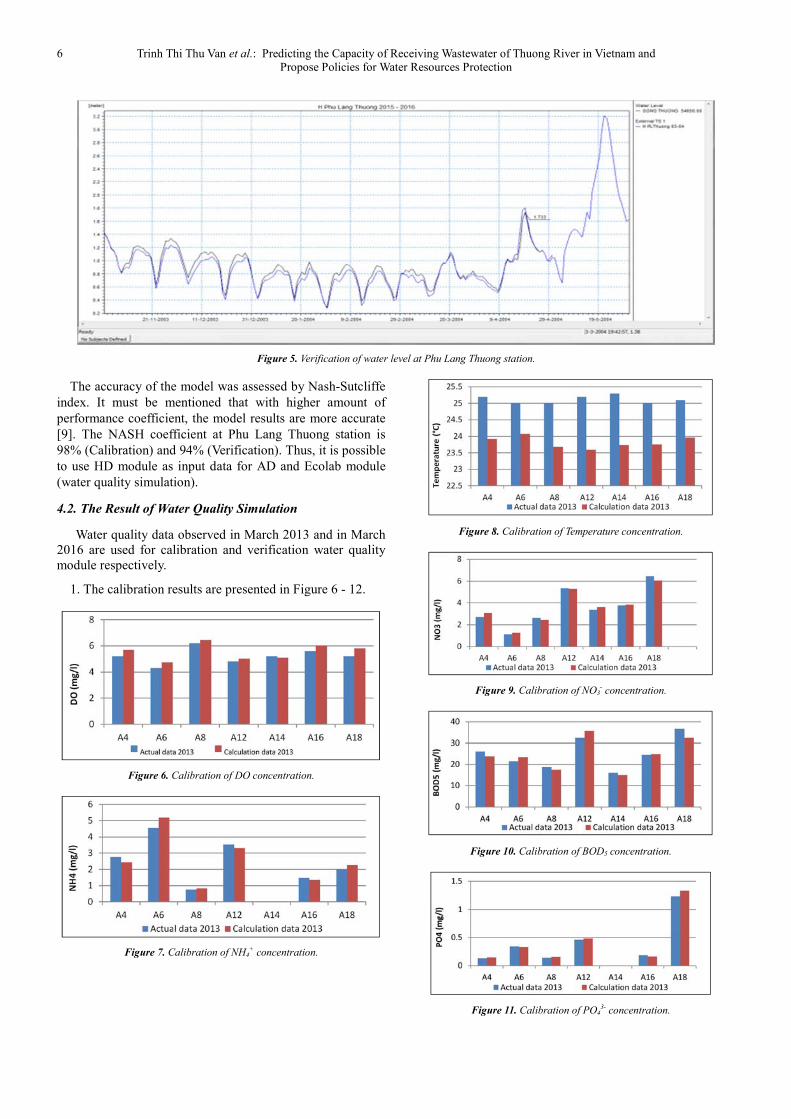
6 Trinh Thi Thu Van et al.: Predicting the Capacity of Receiving Wastewater of Thuong River in Vietnam and Propose Policies for Water Resources Protection
Figure 5. Verification of water level at Phu Lang Thuong station.
The accuracy of the model was assessed by Nash-Sutcliffe
index. It must be mentioned that with higher amount of
performance coefficient, the model results are more accurate
[9]. The NASH coefficient at Phu Lang Thuong station is
98% (Calibration) and 94% (Verification). Thus, it is possible
to use HD module as input data for AD and Ecolab module
(water quality simulation).
4.2. The Result of Water Quality Simulation
Water quality data observed in March 2013 and in March
2016 are used for calibration and verification water quality
module respectively.
1. The calibration results are presented in Figure 6 - 12.
Figure 6. Calibration of DO concentration.
Figure 7. Calibration of NH4+ concentration.
Figure 8. Calibration of Temperature concentration.
Figure 9. Calibration of NO3- concentration.
Figure 10. Calibration of BOD5 concentration.
Figure 11. Calibration of PO43- concentration.
International Journal of Environmental Monitoring and Analysis 2018; 6(1): 1-12 7
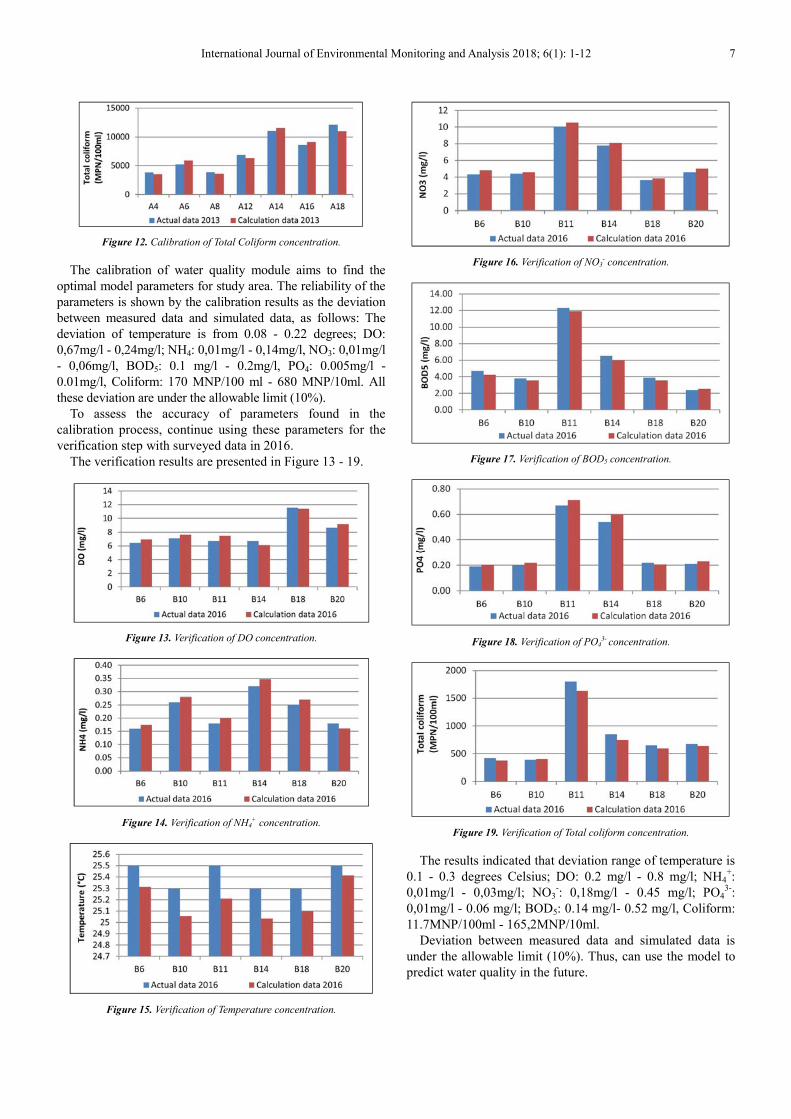
Figure 12. Calibration of Total Coliform concentration.
The calibration of water quality module aims to find the
optimal model parameters for study area. The reliability of the
parameters is shown by the calibration results as the deviation
between measured data and simulated data, as follows: The
deviation of temperature is from 0.08 - 0.22 degrees; DO:
0,67mg/l - 0,24mg/l; NH4: 0,01mg/l - 0,14mg/l, NO3: 0,01mg/l
- 0,06mg/l, BOD5: 0.1 mg/l - 0.2mg/l, PO4: 0.005mg/l -
0.01mg/l, Coliform: 170 MNP/100 ml - 680 MNP/10ml. All
these deviation are under the allowable limit (10%).
To assess the accuracy of parameters found in the
calibration process, continue using these parameters for the
verification step with surveyed data in 2016.
The verification results are presented in Figure 13 - 19.
Figure 13. Verification of DO concentration.
Figure 14. Verification of NH4+ concentration.
Figure 15. Verification of Temperature concentration.
Figure 16. Verification of NO3- concentration.
Figure 17. Verification of BOD5 concentration.
Figure 18. Verification of PO43- concentration.
Figure 19. Verification of Total coliform concentration.
The results indicated that deviation range of temperature is
0.1 - 0.3 degrees Celsius; DO: 0.2 mg/l - 0.8 mg/l; NH4+:
0,01mg/l - 0,03mg/l; NO3-: 0,18mg/l - 0.45 mg/l; PO4
3-:
0,01mg/l - 0.06 mg/l; BOD5: 0.14 mg/l- 0.52 mg/l, Coliform:
11.7MNP/100ml - 165,2MNP/10ml.
Deviation between measured data and simulated data is
under the allowable limit (10%). Thus, can use the model to
predict water quality in the future.
8 Trinh Thi Thu Van et al.: Predicting the Capacity of Receiving Wastewater of Thuong River in Vietnam and Propose Policies for Water Resources Protection
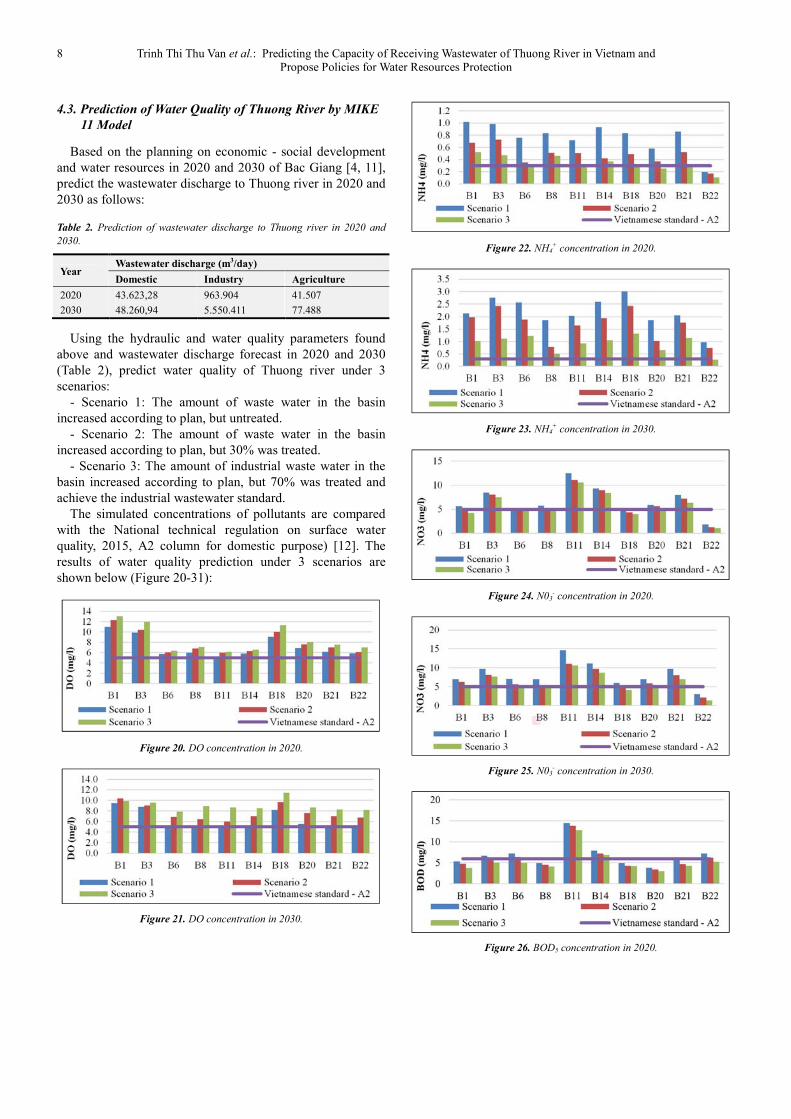
4.3. Prediction of Water Quality of Thuong River by MIKE
11 Model
Based on the planning on economic - social development
and water resources in 2020 and 2030 of Bac Giang [4, 11],
predict the wastewater discharge to Thuong river in 2020 and
2030 as follows:
Table 2. Prediction of wastewater discharge to Thuong river in 2020 and
2030.
Year Wastewater discharge (m3/day)
Domestic Industry Agriculture
2020 43.623,28 963.904 41.507
2030 48.260,94 5.550.411 77.488
Using the hydraulic and water quality parameters found
above and wastewater discharge forecast in 2020 and 2030
(Table 2), predict water quality of Thuong river under 3
scenarios:
- Scenario 1: The amount of waste water in the basin
increased according to plan, but untreated.
- Scenario 2: The amount of waste water in the basin
increased according to plan, but 30% was treated.
- Scenario 3: The amount of industrial waste water in the
basin increased according to plan, but 70% was treated and
achieve the industrial wastewater standard.
The simulated concentrations of pollutants are compared
with the National technical regulation on surface water
quality, 2015, A2 column for domestic purpose) [12]. The
results of water quality prediction under 3 scenarios are
shown below (Figure 20-31):
Figure 20. DO concentration in 2020.
Figure 21. DO concentration in 2030.
Figure 22. NH4+ concentration in 2020.
Figure 23. NH4+ concentration in 2030.
Figure 24. N03- concentration in 2020.
Figure 25. N03- concentration in 2030.
Figure 26. BOD5 concentration in 2020.
International Journal of Environmental Monitoring and Analysis 2018; 6(1): 1-12 9
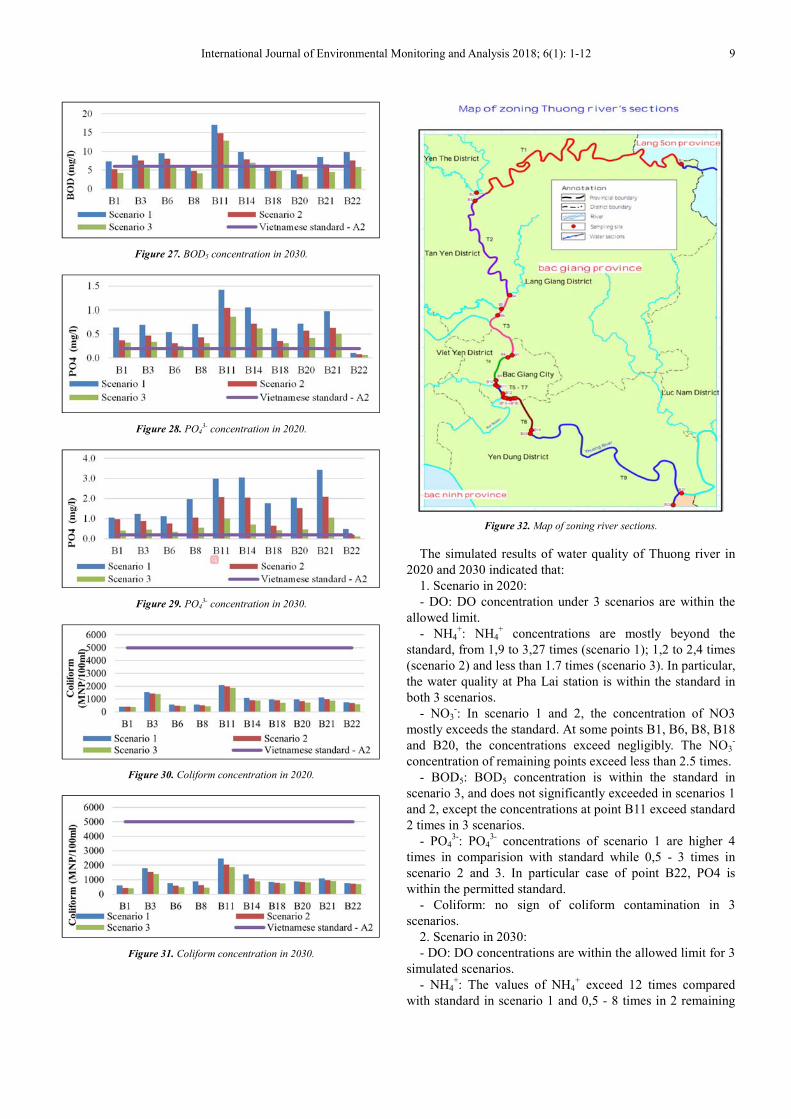
Figure 27. BOD5 concentration in 2030.
Figure 28. PO43- concentration in 2020.
Figure 29. PO43- concentration in 2030.
Figure 30. Coliform concentration in 2020.
Figure 31. Coliform concentration in 2030.
Figure 32. Map of zoning river sections.
The simulated results of water quality of Thuong river in
2020 and 2030 indicated that:
1. Scenario in 2020:
- DO: DO concentration under 3 scenarios are within the
allowed limit.
- NH4+: NH4
+ concentrations are mostly beyond the
standard, from 1,9 to 3,27 times (scenario 1); 1,2 to 2,4 times
(scenario 2) and less than 1.7 times (scenario 3). In particular,
the water quality at Pha Lai station is within the standard in
both 3 scenarios.
- NO3-: In scenario 1 and 2, the concentration of NO3
mostly exceeds the standard. At some points B1, B6, B8, B18
and B20, the concentrations exceed negligibly. The NO3-
concentration of remaining points exceed less than 2.5 times.
- BOD5: BOD5 concentration is within the standard in
scenario 3, and does not significantly exceeded in scenarios 1
and 2, except the concentrations at point B11 exceed standard
2 times in 3 scenarios.
- PO43-
: PO43-
concentrations of scenario 1 are higher 4
times in comparision with standard while 0,5 - 3 times in
scenario 2 and 3. In particular case of point B22, PO4 is
within the permitted standard.
- Coliform: no sign of coliform contamination in 3
scenarios.
2. Scenario in 2030:
- DO: DO concentrations are within the allowed limit for 3
simulated scenarios.
- NH4+: The values of NH4
+ exceed 12 times compared
with standard in scenario 1 and 0,5 - 8 times in 2 remaining
10 Trinh Thi Thu Van et al.: Predicting the Capacity of Receiving Wastewater of Thuong River in Vietnam and Propose Policies for Water Resources Protection
scenarios.
- NO3-: NO3
- concentrations are higher than the standard in
3 scenarios except the point of B18 and B22.
- BOD5: BOD5 exceeded 2.8 times in scenario 1 and 2, but
within the standard in scenario 3.
- PO43-
: The value of PO43-
exceeds standard in 3
scenarios, from 2,5- 15,2 times in scenario 1; 3,8 - 10,4 times
in scenario 2 and 1,1 - 3,55 times in scenario 3.
- Coliform: no sign of coliform contamination in 3 scenarios.
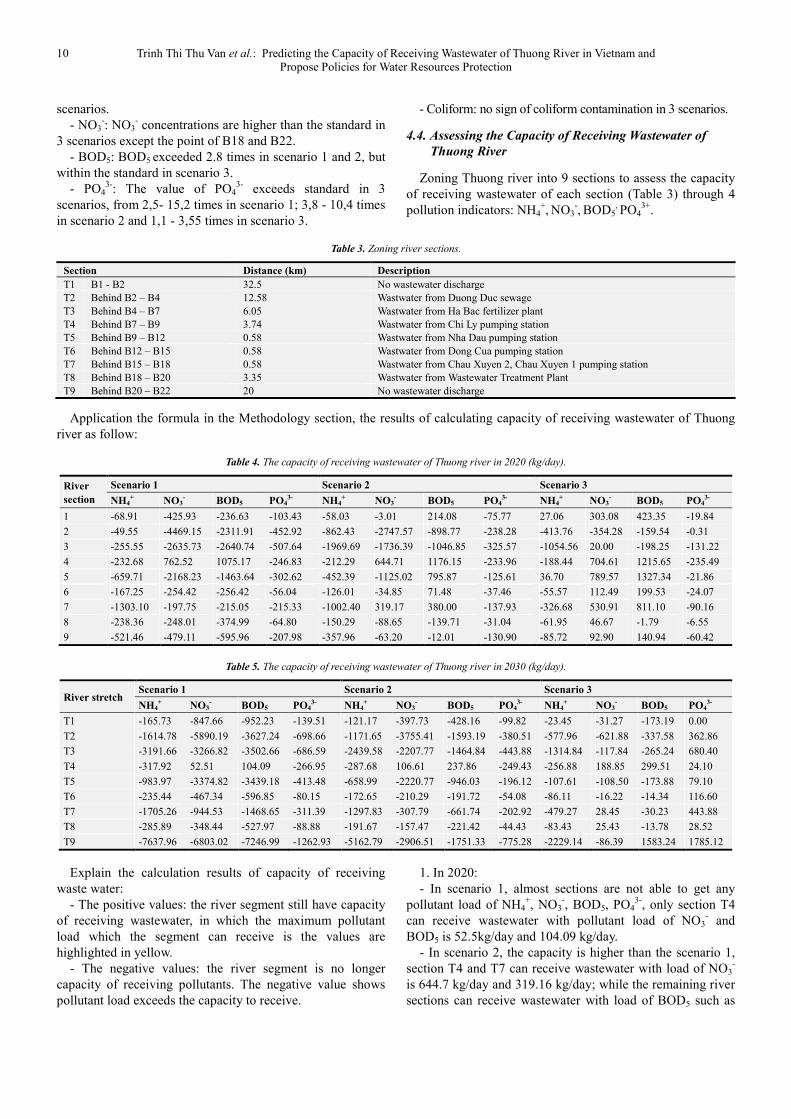
4.4. Assessing the Capacity of Receiving Wastewater of
Thuong River
Zoning Thuong river into 9 sections to assess the capacity
of receiving wastewater of each section (Table 3) through 4
pollution indicators: NH4+, NO3
-, BOD5
, PO4
3+.
Table 3. Zoning river sections.
Section Distance (km) Description
T1 B1 - B2 32.5 No wastewater discharge
T2 Behind B2 – B4 12.58 Wastwater from Duong Duc sewage
T3 Behind B4 – B7 6.05 Wastwater from Ha Bac fertilizer plant
T4 Behind B7 – B9 3.74 Wastwater from Chi Ly pumping station
T5 Behind B9 – B12 0.58 Wastwater from Nha Dau pumping station
T6 Behind B12 – B15 0.58 Wastwater from Dong Cua pumping station
T7 Behind B15 – B18 0.58 Wastwater from Chau Xuyen 2, Chau Xuyen 1 pumping station
T8 Behind B18 – B20 3.35 Wastwater from Wastewater Treatment Plant
T9 Behind B20 – B22 20 No wastewater discharge
Application the formula in the Methodology section, the results of calculating capacity of receiving wastewater of Thuong
river as follow:
Table 4. The capacity of receiving wastewater of Thuong river in 2020 (kg/day).
River
section
Scenario 1 Scenario 2 Scenario 3
NH4+ NO3
- BOD5 PO43- NH4
+ NO3- BOD5 PO4
3- NH4+ NO3
- BOD5 PO43-
1 -68.91 -425.93 -236.63 -103.43 -58.03 -3.01 214.08 -75.77 27.06 303.08 423.35 -19.84
2 -49.55 -4469.15 -2311.91 -452.92 -862.43 -2747.57 -898.77 -238.28 -413.76 -354.28 -159.54 -0.31
3 -255.55 -2635.73 -2640.74 -507.64 -1969.69 -1736.39 -1046.85 -325.57 -1054.56 20.00 -198.25 -131.22
4 -232.68 762.52 1075.17 -246.83 -212.29 644.71 1176.15 -233.96 -188.44 704.61 1215.65 -235.49
5 -659.71 -2168.23 -1463.64 -302.62 -452.39 -1125.02 795.87 -125.61 36.70 789.57 1327.34 -21.86
6 -167.25 -254.42 -256.42 -56.04 -126.01 -34.85 71.48 -37.46 -55.57 112.49 199.53 -24.07
7 -1303.10 -197.75 -215.05 -215.33 -1002.40 319.17 380.00 -137.93 -326.68 530.91 811.10 -90.16
8 -238.36 -248.01 -374.99 -64.80 -150.29 -88.65 -139.71 -31.04 -61.95 46.67 -1.79 -6.55
9 -521.46 -479.11 -595.96 -207.98 -357.96 -63.20 -12.01 -130.90 -85.72 92.90 140.94 -60.42
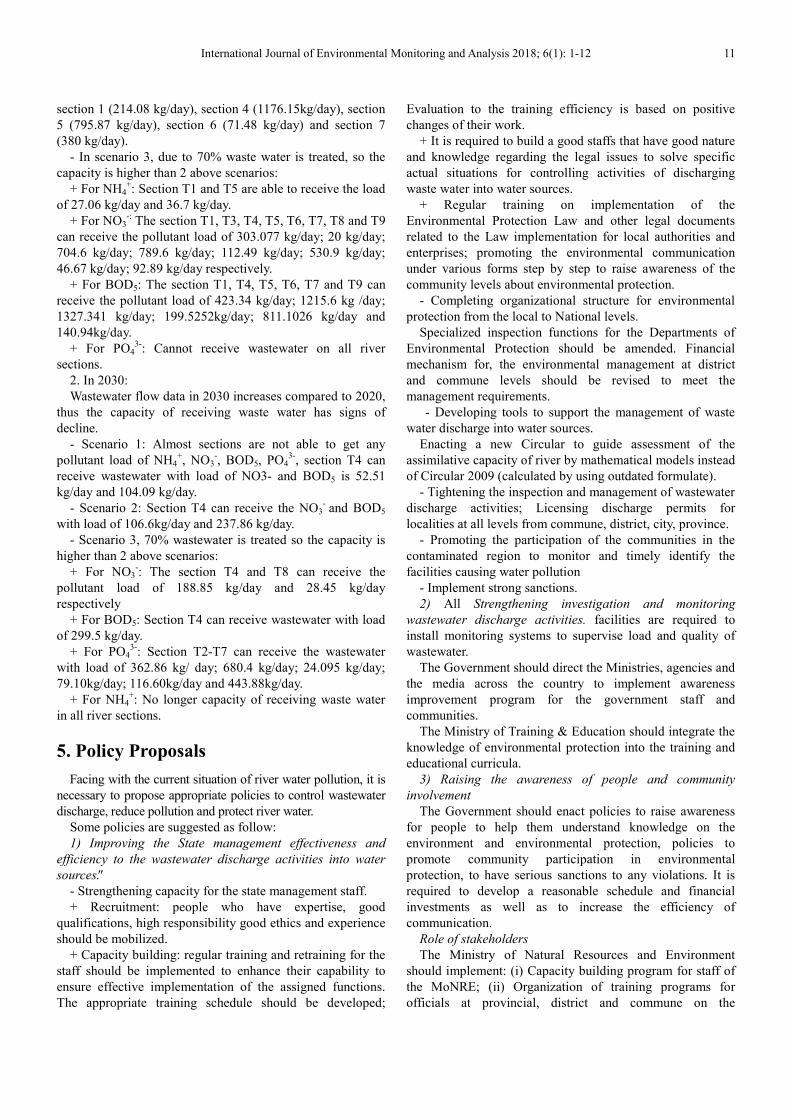
Table 5. The capacity of receiving wastewater of Thuong river in 2030 (kg/day).
River stretch Scenario 1 Scenario 2 Scenario 3
NH4+ NO3
- BOD5 PO43- NH4
+ NO3- BOD5 PO4
3- NH4+ NO3
- BOD5 PO43-
T1 -165.73 -847.66 -952.23 -139.51 -121.17 -397.73 -428.16 -99.82 -23.45 -31.27 -173.19 0.00
T2 -1614.78 -5890.19 -3627.24 -698.66 -1171.65 -3755.41 -1593.19 -380.51 -577.96 -621.88 -337.58 362.86
T3 -3191.66 -3266.82 -3502.66 -686.59 -2439.58 -2207.77 -1464.84 -443.88 -1314.84 -117.84 -265.24 680.40
T4 -317.92 52.51 104.09 -266.95 -287.68 106.61 237.86 -249.43 -256.88 188.85 299.51 24.10
T5 -983.97 -3374.82 -3439.18 -413.48 -658.99 -2220.77 -946.03 -196.12 -107.61 -108.50 -173.88 79.10
T6 -235.44 -467.34 -596.85 -80.15 -172.65 -210.29 -191.72 -54.08 -86.11 -16.22 -14.34 116.60
T7 -1705.26 -944.53 -1468.65 -311.39 -1297.83 -307.79 -661.74 -202.92 -479.27 28.45 -30.23 443.88
T8 -285.89 -348.44 -527.97 -88.88 -191.67 -157.47 -221.42 -44.43 -83.43 25.43 -13.78 28.52
T9 -7637.96 -6803.02 -7246.99 -1262.93 -5162.79 -2906.51 -1751.33 -775.28 -2229.14 -86.39 1583.24 1785.12
Explain the calculation results of capacity of receiving
waste water:
- The positive values: the river segment still have capacity
of receiving wastewater, in which the maximum pollutant
load which the segment can receive is the values are
highlighted in yellow.
- The negative values: the river segment is no longer
capacity of receiving pollutants. The negative value shows
pollutant load exceeds the capacity to receive.
1. In 2020:
- In scenario 1, almost sections are not able to get any
pollutant load of NH4+, NO3
-, BOD5, PO4
3-, only section T4
can receive wastewater with pollutant load of NO3- and
BOD5 is 52.5kg/day and 104.09 kg/day.
- In scenario 2, the capacity is higher than the scenario 1,
section T4 and T7 can receive wastewater with load of NO3-
is 644.7 kg/day and 319.16 kg/day; while the remaining river
sections can receive wastewater with load of BOD5 such as
International Journal of Environmental Monitoring and Analysis 2018; 6(1): 1-12 11
section 1 (214.08 kg/day), section 4 (1176.15kg/day), section
5 (795.87 kg/day), section 6 (71.48 kg/day) and section 7
(380 kg/day).
- In scenario 3, due to 70% waste water is treated, so the
capacity is higher than 2 above scenarios:
+ For NH4+: Section T1 and T5 are able to receive the load
of 27.06 kg/day and 36.7 kg/day.
+ For NO3-: The section T1, T3, T4, T5, T6, T7, T8 and T9
can receive the pollutant load of 303.077 kg/day; 20 kg/day;
704.6 kg/day; 789.6 kg/day; 112.49 kg/day; 530.9 kg/day;
46.67 kg/day; 92.89 kg/day respectively.
+ For BOD5: The section T1, T4, T5, T6, T7 and T9 can
receive the pollutant load of 423.34 kg/day; 1215.6 kg /day;
1327.341 kg/day; 199.5252kg/day; 811.1026 kg/day and
140.94kg/day.
+ For PO43-
: Cannot receive wastewater on all river
sections.
2. In 2030:
Wastewater flow data in 2030 increases compared to 2020,
thus the capacity of receiving waste water has signs of
decline.
- Scenario 1: Almost sections are not able to get any
pollutant load of NH4+, NO3
-, BOD5, PO4
3-, section T4 can
receive wastewater with load of NO3- and BOD5 is 52.51
kg/day and 104.09 kg/day.
- Scenario 2: Section T4 can receive the NO3- and BOD5
with load of 106.6kg/day and 237.86 kg/day.
- Scenario 3, 70% wastewater is treated so the capacity is
higher than 2 above scenarios:
+ For NO3-: The section T4 and T8 can receive the
pollutant load of 188.85 kg/day and 28.45 kg/day
respectively
+ For BOD5: Section T4 can receive wastewater with load
of 299.5 kg/day.
+ For PO43-
: Section T2-T7 can receive the wastewater
with load of 362.86 kg/ day; 680.4 kg/day; 24.095 kg/day;
79.10kg/day; 116.60kg/day and 443.88kg/day.
+ For NH4+: No longer capacity of receiving waste water
in all river sections.
5. Policy Proposals
Facing with the current situation of river water pollution, it is
necessary to propose appropriate policies to control wastewater
discharge, reduce pollution and protect river water.
Some policies are suggested as follow:
1) Improving the State management effectiveness and
efficiency to the wastewater discharge activities into water
sources".
- Strengthening capacity for the state management staff.
+ Recruitment: people who have expertise, good
qualifications, high responsibility good ethics and experience
should be mobilized.
+ Capacity building: regular training and retraining for the
staff should be implemented to enhance their capability to
ensure effective implementation of the assigned functions.
The appropriate training schedule should be developed;
Evaluation to the training efficiency is based on positive
changes of their work.
+ It is required to build a good staffs that have good nature
and knowledge regarding the legal issues to solve specific
actual situations for controlling activities of discharging
waste water into water sources.
+ Regular training on implementation of the
Environmental Protection Law and other legal documents
related to the Law implementation for local authorities and
enterprises; promoting the environmental communication
under various forms step by step to raise awareness of the
community levels about environmental protection.
- Completing organizational structure for environmental
protection from the local to National levels.
Specialized inspection functions for the Departments of
Environmental Protection should be amended. Financial
mechanism for, the environmental management at district
and commune levels should be revised to meet the
management requirements.
- Developing tools to support the management of waste
water discharge into water sources.
Enacting a new Circular to guide assessment of the
assimilative capacity of river by mathematical models instead
of Circular 2009 (calculated by using outdated formulate).
- Tightening the inspection and management of wastewater
discharge activities; Licensing discharge permits for
localities at all levels from commune, district, city, province.
- Promoting the participation of the communities in the
contaminated region to monitor and timely identify the
facilities causing water pollution
- Implement strong sanctions.
2) All Strengthening investigation and monitoring
wastewater discharge activities. facilities are required to
install monitoring systems to supervise load and quality of
wastewater.
The Government should direct the Ministries, agencies and
the media across the country to implement awareness
improvement program for the government staff and
communities.
The Ministry of Training & Education should integrate the
knowledge of environmental protection into the training and
educational curricula.
3) Raising the awareness of people and community
involvement
The Government should enact policies to raise awareness
for people to help them understand knowledge on the
environment and environmental protection, policies to
promote community participation in environmental
protection, to have serious sanctions to any violations. It is
required to develop a reasonable schedule and financial
investments as well as to increase the efficiency of
communication.
Role of stakeholders
The Ministry of Natural Resources and Environment
should implement: (i) Capacity building program for staff of
the MoNRE; (ii) Organization of training programs for
officials at provincial, district and commune on the
12 Trinh Thi Thu Van et al.: Predicting the Capacity of Receiving Wastewater of Thuong River in Vietnam and Propose Policies for Water Resources Protection
enforcement of legal documents as well as technical
knowledge; (iii) Provision of technical tools to support
decision making on environment management and
protection; (iv) Inspection of the law enforcement to
wastewater discharge facilities.
6. Conclusions
Thuong River plays an important role in water supply and
waste water receiving for Bac Giang province. Currently, due
to the urbanization, investment and improper operation of
treatment works on environment, the increase in the pollution
load of discharge into the river, the pollution load has
exceeded the receiving capacity of the river.
The calculated results of the study show that the river
pollution situation is increasingly serious and has no signs of
stop, even when the wastewater is treated 30% and 70%
before discharge into the river and the pollution is exceeded
the permissible standards of Vietnam.
Therefore, we proposed some policies in order to control
discharge wastewater, reduce pollution and protect river
water including: (i) Improving the State management
effectiveness and efficiency to the wastewater discharge
activities into water sources; (ii) Strengthening investigation
and monitoring wastewater discharge activities; (iii) Raising
the awareness of people and community involvement.
References
[1] National Assembly of Vietnam. Law on Water Resources No. 17/2012/QH13, 2012. Available at: Law on Environmental Protection.
[2] Government of Vietnam. Decree No. 201/2013/ND-CP. “Regulate in Detail the implementation of some articles of the Law on Water Resources”, 2013.
[3] MonRE. Circular 02/2009/TT/BTNMT. “Regulate principles of assessing the capacity of receiving waste water of rivers and streams”.
[4] Department of Natural Resources and Environment of Bac Giang province. “Water resources planning in Bac Giang province in 2013”. Bac Giang, Vietnam, 2013.
[5] Bac Giang Statistical Office. “Bac Giang Statistical Yearbook”. Bac Giang, Vietnam: Statistical publisher, 2015.
[6] MoNRE. “Vietnam Environmental status Report”. Hanoi, Vietnam, 2012.
[7] Scott A. Socolofsky, Gerhard H. Jirka. "Mass Transfer and Diffusion." Institute for Hydromechanic, 2002.
[8] DHI. “Mike 11 - a modelling System for Rivers and Channels”. Denmark, 2003.
[9] B. Razdara., K. Mohammadib., J. M. V. Samanic., B. Piroozd. “Determining the best water quality model for the rivers in north of Iran (Case study: Pasikhan River)”, 2011.
[10] Thai. H. Tran. “Application of MIKE 11 model to forecast water quality of Cau river basin”, Hanoi, Vietnam, 2003.
[11] Government of Vietnam. Decision No. 269/QĐ-TTg. “Approve the master plan for socio-economic development of Bac Giang province up to 2020 with a vision to 2030”, 2015.
[12] MoNRE. “Vietnam National technical regulation on surface water quality, QCVN 08-MT: 2015/BTNMT”, 2015.